
Burn Them Right! Determining the Optimal Temperature for the Purification of Carbon Materials by Combustion

 , ,
, ,  and
and 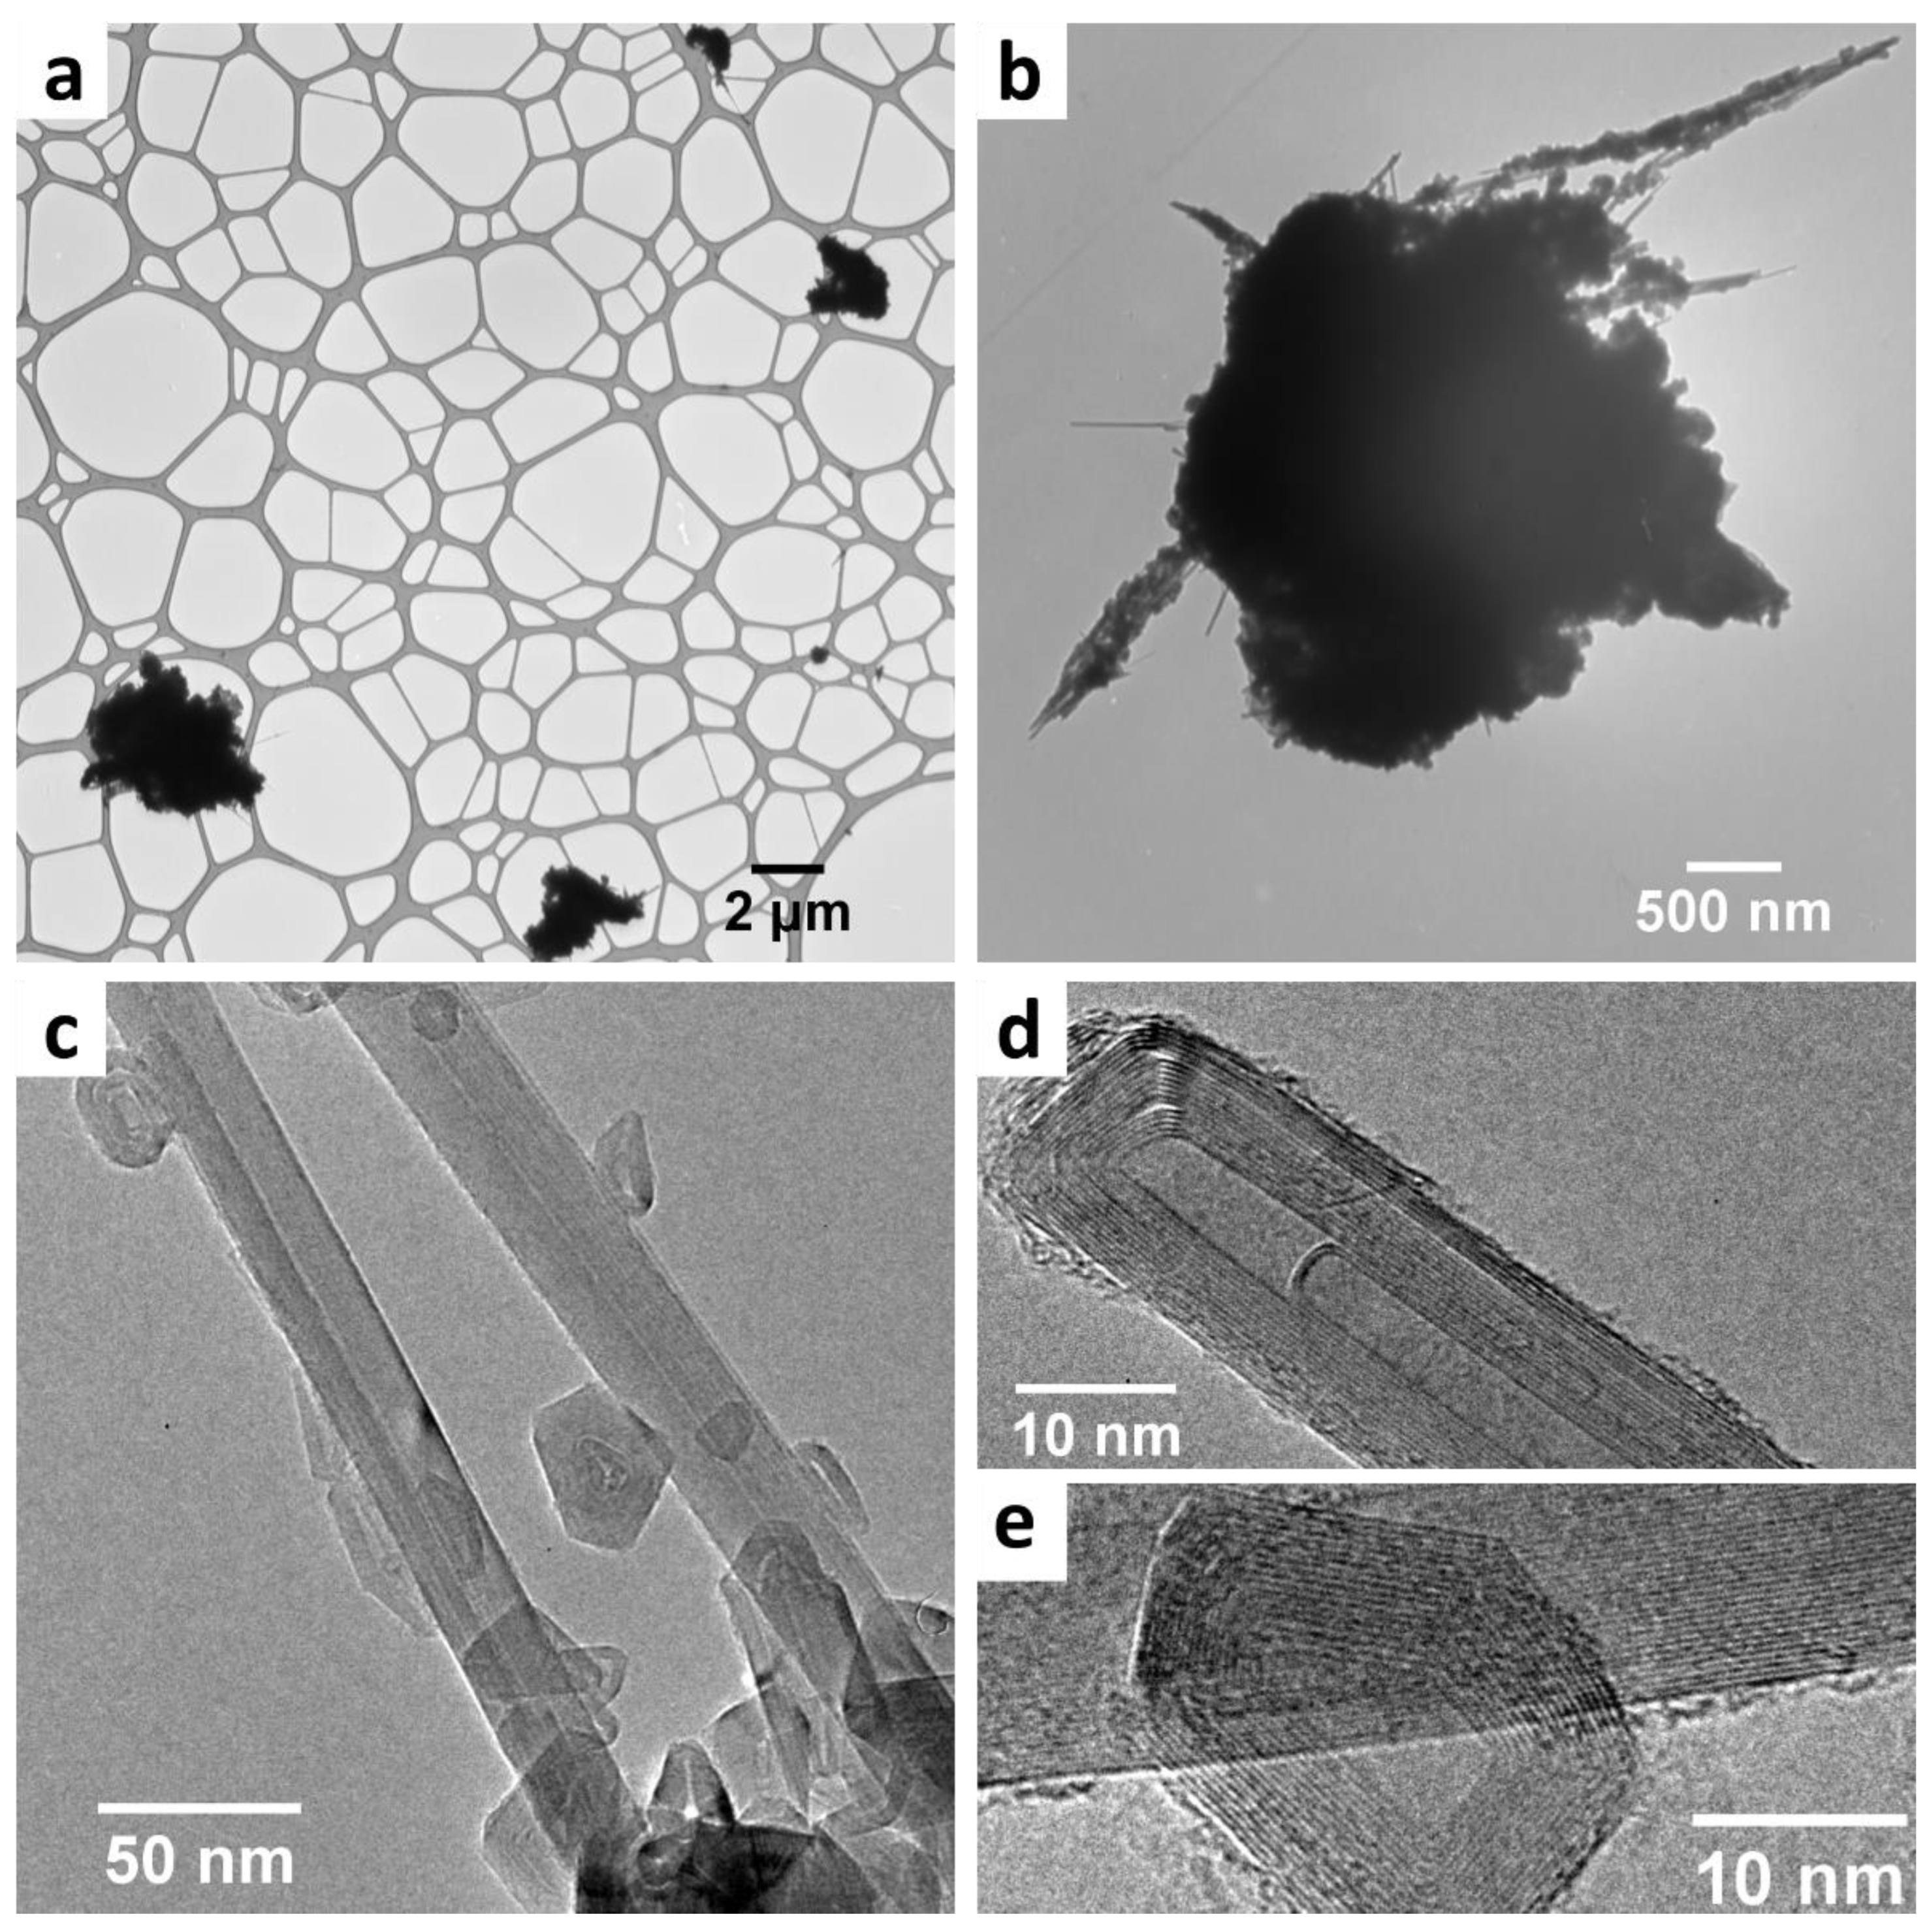
Abstract
1. Introduction
2. Materials and Methods
2.1. Raw MWCNTs
2.2. CRTA Measurement
- Ramp 50 °C/min to 250 °C;
- Abort next segment if %/min > 0.20 (“%/min” corresponds to the weight-loss rate);
- Ramp 2.5 °C/min to 700 °C;
- Abort next seg if %/min < 0.05;
- Isothermal for 1000 min;
- Repeat segment 2 until 700 °C
2.3. Isothermal Treatment
2.4. TEM/Raman Acquisition and Analysis
3. Results
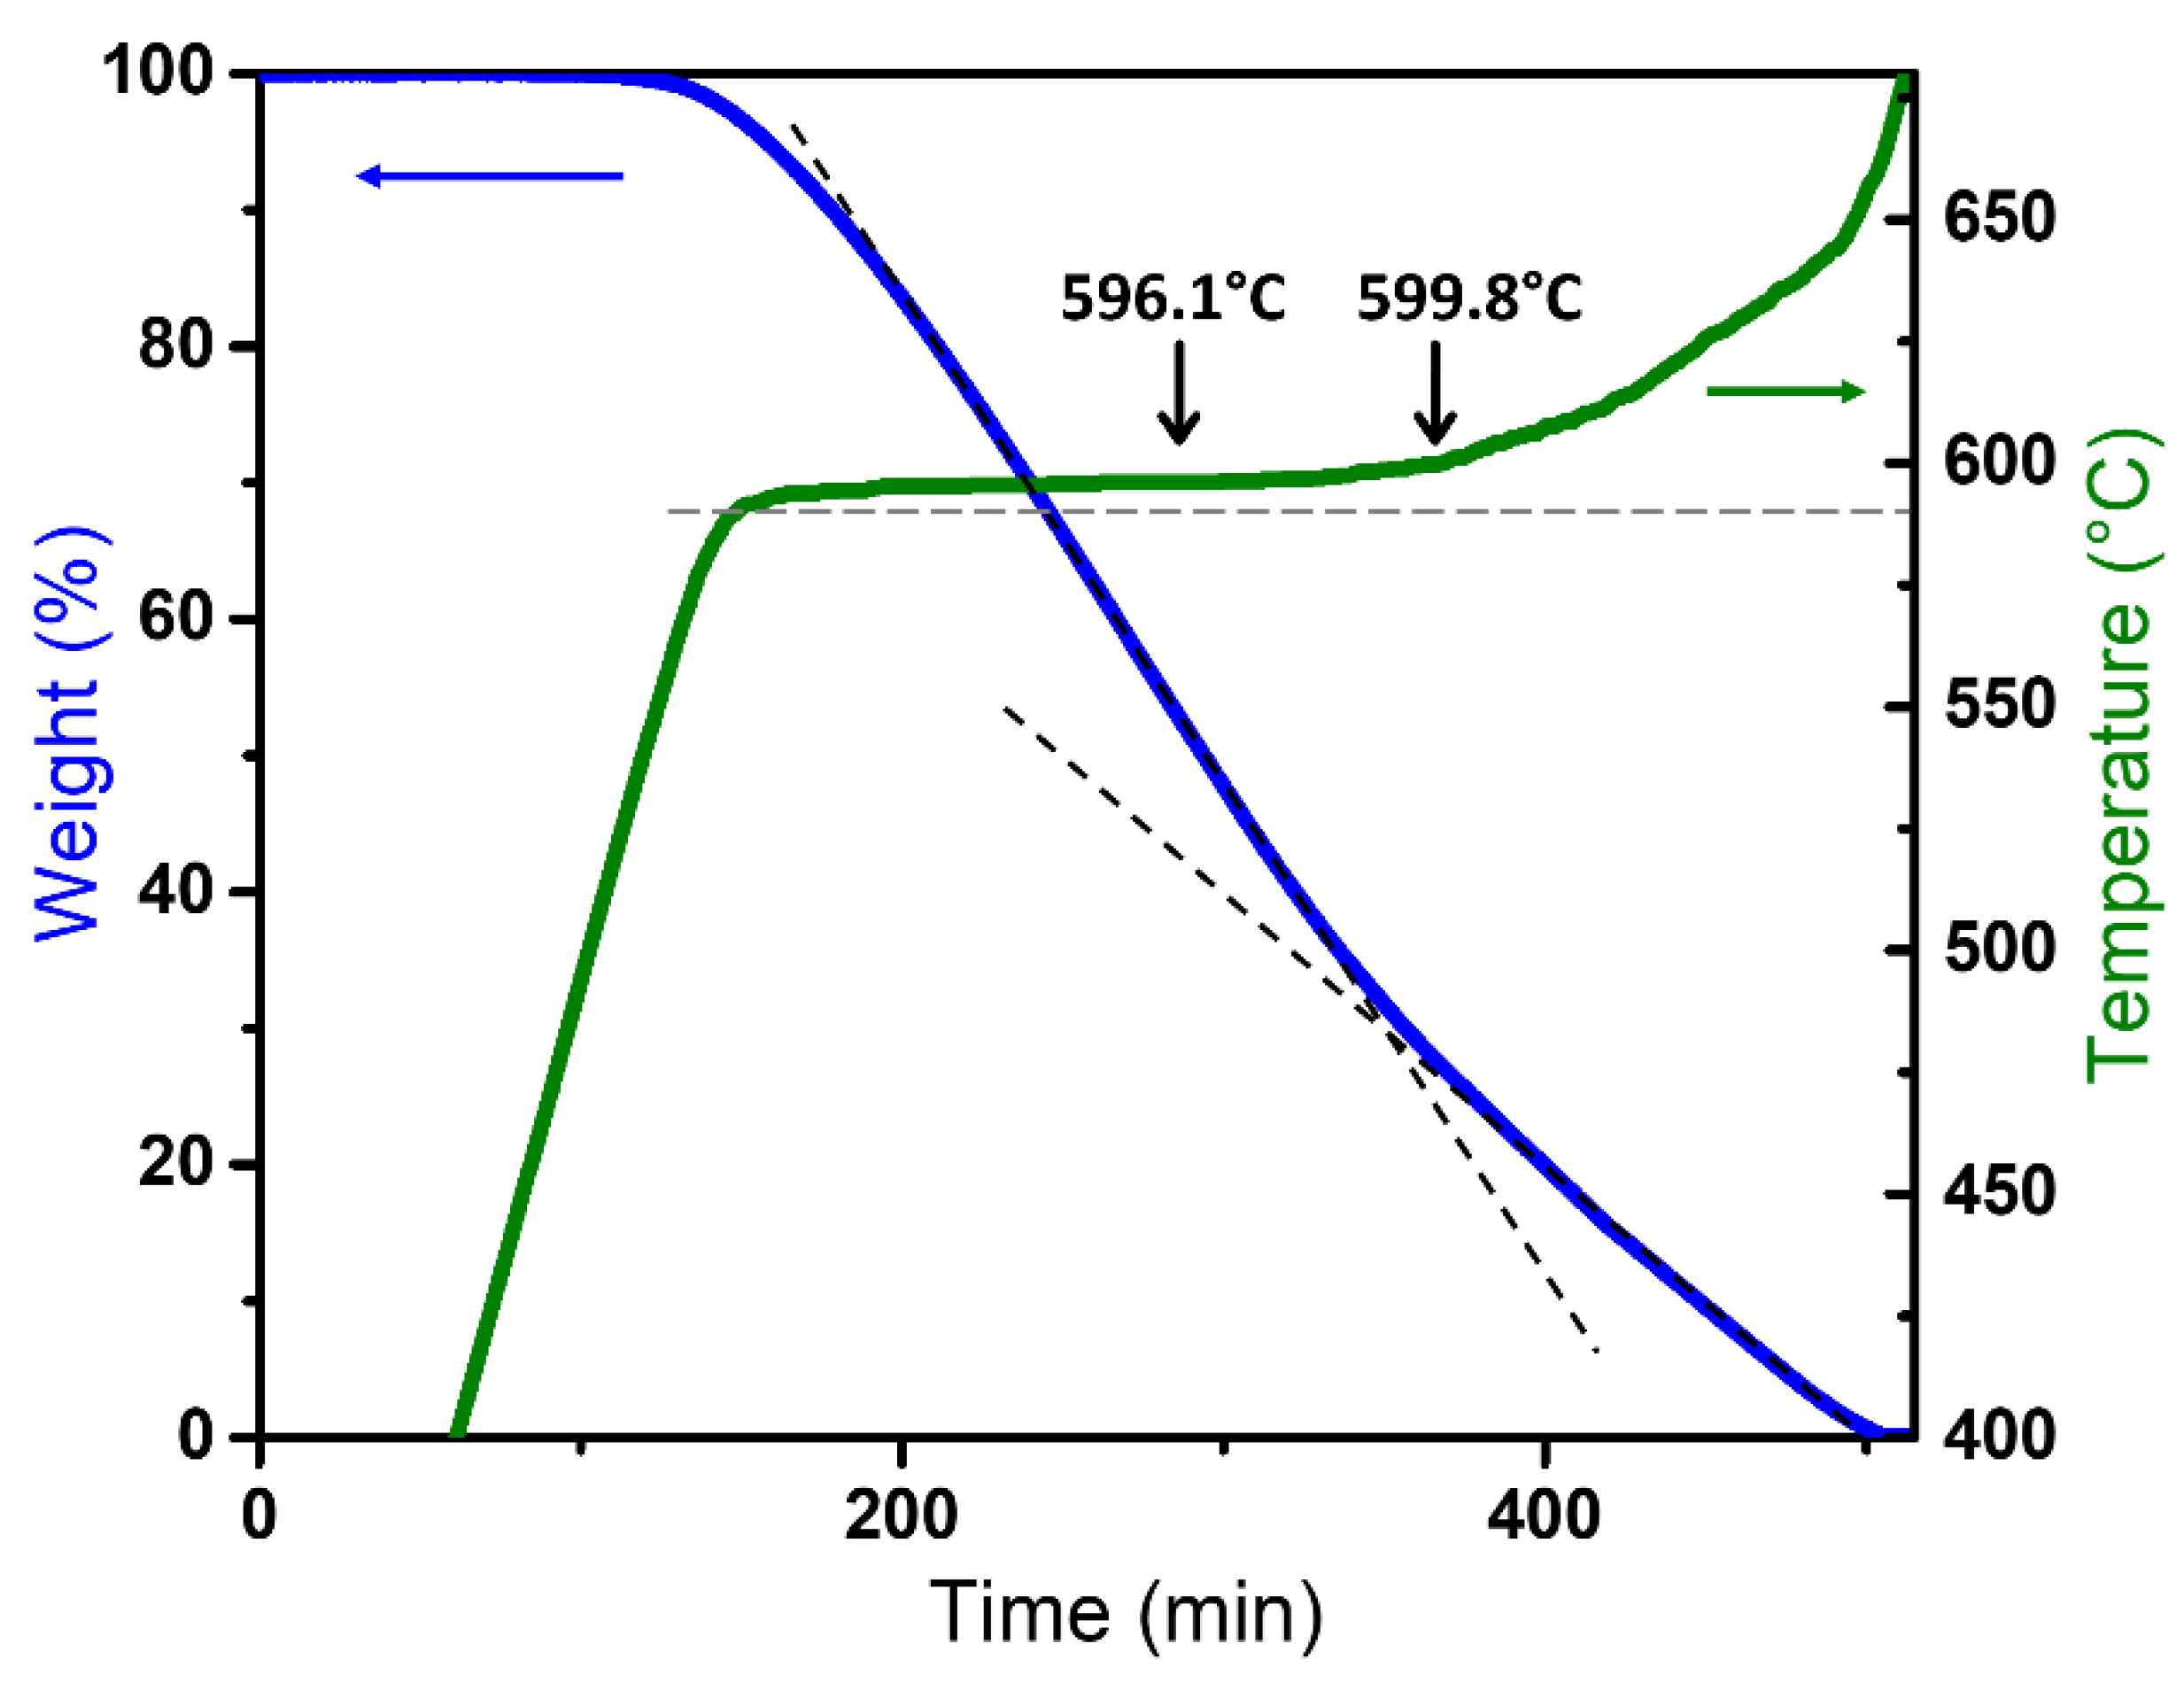
3.1. CRTA Analysis

3.2. Treated Material
3.2.1. TEM

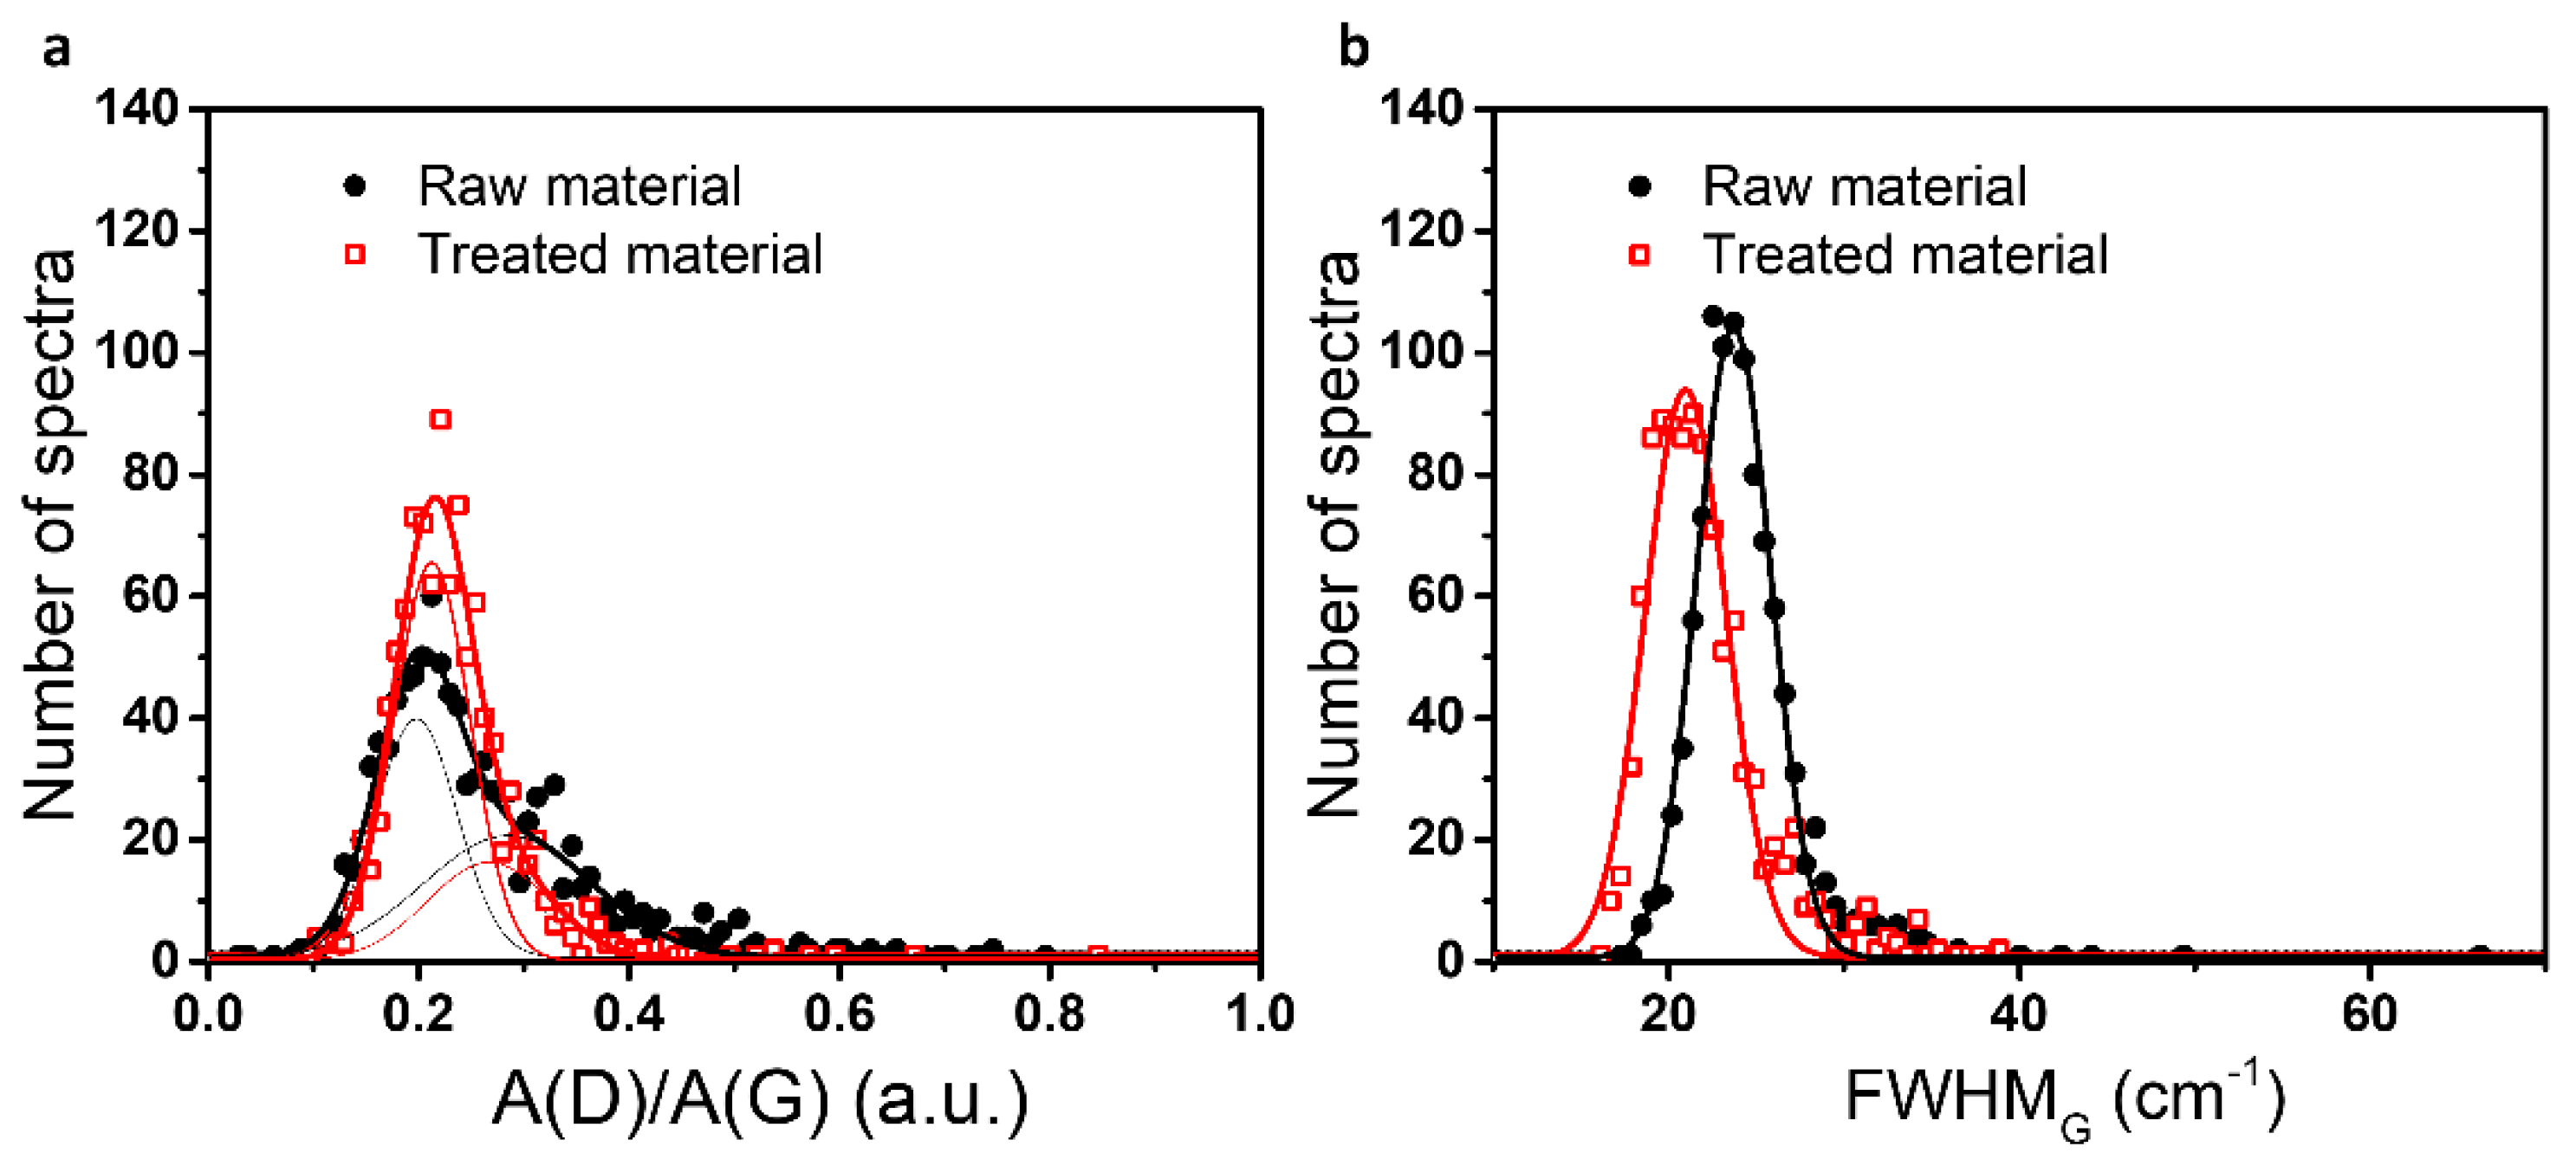
3.2.2. Raman Analysis
4. Discussion
4.1. A Defect Based Selectivity
4.2. Importance of the Temperature and Use of CRTA
4.3. Role of Diffusion
5. Conclusions
Supplementary Materials
Author Contributions
Funding
Institutional Review Board Statement
Informed Consent Statement
Data Availability Statement
Conflicts of Interest
References
- Iijima, S. Helical microtubules of graphitic carbon. Nature 1991, 354, 56–58. [Google Scholar] [CrossRef]
- Krätschmer, W.; Lamb, L.D.; Fostiropoulos, K.; Huffman, D.R. Solid C60: A new form of carbon. Nature 1990, 347, 354–358. [Google Scholar] [CrossRef]
- Chen, Y.K.; Green, M.L.H.; Griffin, J.L.; Hammer, J.; Lago, R.M.; Tsang, S.C. Purification and opening of carbon nanotubes via bromination. Adv. Mater. 1996, 8, 1012–1015. [Google Scholar] [CrossRef]
- Malathi, Y.; Padya, B.; Prabhakar, K.V.P.; Jain, P.K. Purification of Multi Walled Carbon Nanotubes (Mwcnts) Synthesized by Arc Discharge Set Up. Carbon Lett. 2010, 11, 184–191. [Google Scholar] [CrossRef][Green Version]
- Tsang, S.C.; Harris, P.J.F.; Green, M.L.H. Thinning and opening of carbon nanotubes by oxidation using carbon dioxide. Nature 1993, 362, 520–522. [Google Scholar] [CrossRef]
- Ajayan, P.M.; Ebbesen, T.W.; Ichihashi, T.; Iijima, S.; Tanigaki, K.; Hiura, H. Opening carbon nanotubes with oxygen and implications for filling. Nature 1993, 362, 522–525. [Google Scholar] [CrossRef]
- Ebbesen, T.W.; Ajayan, P.M.; Hiura, H.; Tanigaki, K. Purification of nanotubes. Nature 1994, 367, 519. [Google Scholar] [CrossRef]
- Tsang, S.C.; Chen, Y.K.; Harris, P.J.F.; Green, M.L.H. A simple chemical method of opening and filling carbon nanotubes. Nature 1994, 372, 159–162. [Google Scholar] [CrossRef]
- Ikazaki, F.; Ohshima, S.; Uchida, K.; Kuriki, Y.; Hayakawa, H.; Yumura, M.; Takahashi, K.; Tojima, K. Chemical purification of carbon nanotubes by use of graphite intercalation compounds. Carbon 1994, 32, 1539–1542. [Google Scholar] [CrossRef]
- Ajayan, P.M.; Iijima, S. Capillarity-induced filling of carbon nanotubes. Nature 1993, 361, 333–334. [Google Scholar] [CrossRef]
- Sloan, J.; Monthioux, M. Carbon Meta-Nanotubes; Wiley-Blackwell: Chichester, UK, 2011. [Google Scholar] [CrossRef]
- Hou, P.X.; Liu, C.; Cheng, H.M. Purification of carbon nanotubes. Carbon 2008, 46, 2003–2025. [Google Scholar] [CrossRef]
- Walker, P.L.; Rusinko, F.; Austin, L.G. Gas Reactions of Carbon. In Advances in Catalysis; Academic Press: Cambridge, MA, USA, 1959; pp. 133–221. [Google Scholar] [CrossRef]
- Picheau, E.; Hof, F.; Derré, A.; Daffos, B.; Pénicaud, A. Thermal Oxidation of Carbonaceous Nanomaterials Revisited: Evidence of Mechanism Changes. Angew. Chem. Int. Ed. 2019, 58, 16013–16017. [Google Scholar] [CrossRef] [PubMed]
- Rouquerol, J. Controlled transformation rate thermal analysis: The hidden face of thermal analysis. Thermochim. Acta 1989, 144, 209–224. [Google Scholar] [CrossRef]
- Paulik, F.; Paulik, J. “Quasi-isothermal” and “quasi-isobaric” thermogravimetry. Anal. Chim. Acta 1972, 60, 127–130. [Google Scholar] [CrossRef]
- Paulik, F.; Paulik, J.; Erdey, L. Derivatography A complex method in thermal analysis. Talanta 1966, 13, 1405–1430. [Google Scholar] [CrossRef]
- Rouquérol, J. L’analyse thermique a vitesse de decomposition constante. J. Therm. Anal. 1970, 2, 123–140. [Google Scholar] [CrossRef]
- Fesenko, E.A.; Parkes, G.M.B.; Barnes, P.A.; Charsley, E.L.; Criado, J.M.; Perez-Maqueda, L.A.; Llewellyn, P.; Rouquerol, F.; Rouquerol, J.; Sorensen, O.T.; et al. Sample Controlled Thermal Analysis; Springer: New York, NY, USA, 2003. [Google Scholar] [CrossRef]
- Monthioux, M.; Charlier, J.-C. Giving credit where credit is due: The Stone–(Thrower)–Wales designation revisited. Carbon 2014, 75, 1–4. [Google Scholar] [CrossRef]
- Ferrari, A.C.; Basko, D.M. Raman spectroscopy as a versatile tool for studying the properties of graphene. Nat. Nanotechnol. 2013, 8, 235–246. [Google Scholar] [CrossRef]
- Saito, R.; Hofmann, M.; Dresselhaus, G.; Jorio, A.; Dresselhaus, M.S. Raman spectroscopy of graphene and carbon nanotubes. Adv. Phys. 2011, 60, 413–550. [Google Scholar] [CrossRef]
- Cançado, L.G.; da Silva, M.G.; Ferreira, E.H.M.; Hof, F.; Kampioti, K.; Huang, K.; Pénicaud, A.; Achete, C.A.; Capaz, R.B.; Jorio, A. Disentangling contributions of point and line defects in the Raman spectra of graphene-related materials. 2D Mater. 2017, 4, 025039. [Google Scholar] [CrossRef]
- Eckmann, A.; Felten, A.; Mishchenko, A.; Britnell, L.; Krupke, R.; Novoselov, K.S.; Casiraghi, C. Probing the Nature of Defects in Graphene by Raman Spectroscopy. Nano Lett. 2012, 12, 3925–3930. [Google Scholar] [CrossRef] [PubMed]
- Puech, P.; Kandara, M.; Paredes, G.; Moulin, L.; Weiss-Hortala, E.; Kundu, A.; Ratel-Ramond, N.; Plewa, J.-M.; Pellenq, R.; Monthioux, M. Analyzing the Raman Spectra of Graphenic Carbon Materials from Kerogens to Nanotubes: What Type of Information Can Be Extracted from Defect Bands? C—J. Carbon Res. 2019, 5, 69. [Google Scholar] [CrossRef]
- Picheau, E.; Impellizzeri, A.; Rybkovskiy, D.; Bayle, M.; Mevellec, J.; Hof, F.; Saadaoui, H.; Noé, L.; Dias, A.C.T.; Duvail, J.; et al. Intense Raman D Band without Disorder in Flattened Carbon Nanotubes. ACS Nano 2021, 15, 596–603. [Google Scholar] [CrossRef] [PubMed]
- Hof, F.; Bosch, S.; Englert, J.M.; Hauke, F.; Hirsch, A. Statistical Raman Spectroscopy: A Method for the Characterization of Covalently Functionalized Single-Walled Carbon Nanotubes. Angew. Chem. Int. Ed. 2012, 51, 11727–11730. [Google Scholar] [CrossRef] [PubMed]
- Walker, P.L.; Taylor, R.L.; Ranish, J.M. An update on the carbon-oxygen reaction. Carbon 1991, 29, 411–421. [Google Scholar] [CrossRef]
- Park, Y.S.; Choi, Y.C.; Kim, K.S.; Chung, D.-C.; Bae, D.J.; An, K.H.; Lim, S.C.; Zhu, X.Y.; Lee, Y.H. High yield purification of multiwalled carbon nanotubes by selective oxidation during thermal annealing. Pergamon Carbon 2001, 39, 655–661. [Google Scholar] [CrossRef]
- Picheau, E. Étude Sur le Carbone: De la Combustion au Remplissage des Cavités Latérales de Nanotubes Aplatis. 2020. Available online: https://tel.archives-ouvertes.fr/tel-03198788 (accessed on 20 March 2022).
- Picheau, E.; Amar, S.; Derré, A.; Penicaud, A.; Hof, F. An Introduction to the Combustion of Carbon Materials. Chem. Eur. J. 2022; accepted. [Google Scholar]


Publisher’s Note: MDPI stays neutral with regard to jurisdictional claims in published maps and institutional affiliations. |
© 2022 by the authors. Licensee MDPI, Basel, Switzerland. This article is an open access article distributed under the terms and conditions of the Creative Commons Attribution (CC BY) license (https://creativecommons.org/licenses/by/4.0/).
Share and Cite
Picheau, E.; Hof, F.; Derré, A.; Amar, S.; Noé, L.; Monthioux, M.; Pénicaud, A. Burn Them Right! Determining the Optimal Temperature for the Purification of Carbon Materials by Combustion. C 2022, 8, 31. https://doi.org/10.3390/c8020031
Picheau E, Hof F, Derré A, Amar S, Noé L, Monthioux M, Pénicaud A. Burn Them Right! Determining the Optimal Temperature for the Purification of Carbon Materials by Combustion. C. 2022; 8(2):31. https://doi.org/10.3390/c8020031
Chicago/Turabian StylePicheau, Emmanuel, Ferdinand Hof, Alain Derré, Sara Amar, Laure Noé, Marc Monthioux, and Alain Pénicaud. 2022. "Burn Them Right! Determining the Optimal Temperature for the Purification of Carbon Materials by Combustion" C 8, no. 2: 31. https://doi.org/10.3390/c8020031
APA StylePicheau, E., Hof, F., Derré, A., Amar, S., Noé, L., Monthioux, M., & Pénicaud, A. (2022). Burn Them Right! Determining the Optimal Temperature for the Purification of Carbon Materials by Combustion. C, 8(2), 31. https://doi.org/10.3390/c8020031