Article

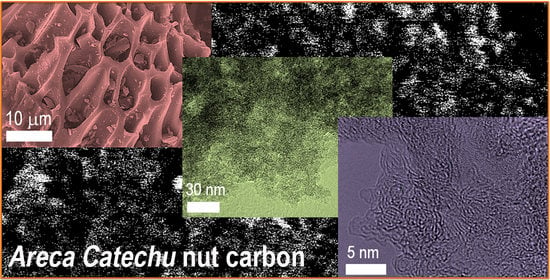
High Surface Area Nanoporous Activated Carbons Materials from Areca catechu Nut with Excellent Iodine and Methylene Blue Adsorption

by
Sahira Joshi
1,2,
Rekha Goswami Shrestha
2,
Raja Ram Pradhananga
3,
Katsuhiko Ariga
2,4 and
Lok Kumar Shrestha
2,*
1
Materials Science and Engineering Program, Pulchowk Campus, Institute of Engineering (IOE), Tribhuvan University (TU), Lalitpur 44700, Nepal
2
International Center for Materials Nanoarchitectonics (WPI-MANA), National Institute for Materials Science (NIMS), 1-1 Namiki, Ibaraki, Tsukuba 305-0044, Japan
3
Amrit Campus, Tribhuvan University (TU), Kathmandu 44613, Nepal
4
Department of Advanced Materials Science, Graduate School of Frontier Sciences, The University of Tokyo, 5-1-5 Kashiwanoha, Chiba 277-8561, Japan
*
Author to whom correspondence should be addressed.
Submission received: 7 December 2021 / Revised: 16 December 2021 / Accepted: 19 December 2021 / Published: 27 December 2021
(This article belongs to the Collection Feature Papers in the Science and Engineering of Carbons)

Abstract

:
Nanoporous carbon materials from biomass exhibit a high surface area due to well-defined pore structures. Therefore, they have been extensively used in separation and purification technologies as efficient adsorbents. Here, we report the iodine and methylene blue adsorption properties of the hierarchically porous carbon materials prepared from Areca catechu nut. The preparation method involves the phosphoric acid (H3PO4) activation of the Areca catechu nut powder. The effects of carbonization conditions (mixing ratio with H3PO4, carbonization time, and carbonization temperature) on the textural properties and surface functional groups were studied. The optimum textural properties were obtained at a mixing ratio of 1:1, carbonized for 3 h at 400 °C, and the sample achieved a high specific surface area of 2132.1 m2 g−1 and a large pore volume of 3.426 cm3 g−1, respectively. The prepared materials have amorphous carbon structures and contain oxygenated surface functional groups. Due to the well-defined micro-and mesopore structures with the high surface area and large pore volume, the optimal sample showed excellent iodine and methylene blue adsorption. The iodine number and methylene blue values were ca. 888 mg g−1 and 369 mg g−1, respectively. The batch adsorption studies of methylene dye were affected by pH, adsorbent dose, contact time, and initial concentration. The optimum parameters for the methylene blue adsorption were in alkaline pH, adsorbent dose of 2.8 g L−1, and contact time of 180 min. Equilibrium data could be best represented by the Langmuir isotherm model with a monolayer adsorption capacity of 333.3 mg g−1. Thus, our results demonstrate that the Areca catechu nut has considerable potential as the novel precursor material for the scalable production of high surface area hierarchically porous carbon materials that are essential in removing organic dyes from water.

Graphical Abstract

1. Introduction

Synthetic dyes represent complex aromatic compounds and are extensively used in textile, leather, cosmetics, paper, printing, plastic, rubber, and pharmaceutical industries to color their products [1]. However, a massive discharge of dye effluents generated from these industries into the water sources or the ecosystem adversely affects aquatic life and human beings. The persistence of dyes even in small concentrations (<1 mg L−1) in water reduces light penetration, thus affecting the photosynthetic activities and plant growth and thus destroying marine ecosystems [2] and making the water unfit for human consumption. The data show that approximately 100 tons/year of dyes are discharged directly into water streams by the fabric industry [3].
Methylene blue (MB), a thiazine cationic dye with a complex molecular structure, is highly demanded in textile industries. It is extensively used for biological staining and coloring paper, hair, cotton, wool, and silk [4,5]. Long-term exposure to MB dye can cause difficulties in breathing, vomiting, eye burns, diarrhea, nausea, anemia, and hypertension [5,6]. Its degradation products such as toluidine, benzidine, and other aromatic components are potentially carcinogenic and mutagenic. Furthermore, plant growth can also be interrupted when MB dye combines with phosphate and lipid molecules in cell membranes [7]. Hence, the treatment of water and wastewater containing MB dye is necessary. Different separation methods are applied to reduce MB dye from water and wastewater, such as membrane filtration [8], coagulation–flocculation [9], advanced oxidation [10], adsorption [11], and electrochemical methods [12]. Among these methods, adsorption has offered the most efficient, facile, and economical alternative for removing MB dye from aqueous solutions [13]. Some of the common adsorbents used for MB dye removal include carbon-based materials (e.g., activated carbon), polymeric materials (e.g., polystyrene), minerals (e.g., zeolite), and metal-organic framework (MOF), etc. [10,14,15,16]. Carbon materials have attracted increasing research attention in recent years because of their unique internal structures, excellent performance, and extensive application prospects. Carbon materials with different structural characteristics such as activated carbon [10,11], mesoporous carbon [17], and carbon nanotubes (CNTs) [18] have been used as efficient adsorbents to remove MB dyes from water.
Among carbon materials, nanoporous activated carbons (ACs) are considered as the most concerning adsorbents for dye removal due to their higher specific surface area, hierarchal porous texture composed of ultrafine micropores (0.5–1 nm), micropores (1–2 nm), mesopores (2–50 nm) and macropores (50–100 nm), and extended functionalities on the outward. The micropore and mesopores volume is the critical index of any AC for the adsorption process of molecular species. Activated carbons with abundant micropores are relevant to gas-phase adsorption systems [19]. Conversely, the ACs with abundant mesopores are relevant to liquid-phase adsorption processes because of the larger size of liquid molecules [20]. In the past few years, nanoporous carbon materials have become a promising adsorbent for dye removal [21,22,23]. ACs can be prepared from the carbonaceous materials by the chemical activation method, a single-step method in which the precursors are carbonized in the presence of chemical activating agents at relatively lower temperatures 400–600 °C [24]. The activating agent helps develop porosity in the AC by pyrolytic decomposition of the carbonaceous materials through dehydration and degradation reactions. This more flexible method requires lower activation temperatures and shorter activation times. In addition, it helps in producing AC with a large surface area and tunable porosity [25]. The commonly used activating agents are H3PO4, zinc chloride (ZnCl2), and potassium hydroxide (KOH). Among these, H3PO4 and ZnCl2 are used for the activation of lignocellulosic materials that have not been pre-carbonized previously [26]. The use of H3PO4 as activating agent is preferable to ZnCl2 because of its non-polluting character than ZnCl2, its ease of elimination by leaching with water, and the recovered phosphoric acid being recycled for further use. Moreover, H3PO allows developing micropores and mesopores in resulting AC, which enhances mass transfer rates of pollutants [27].
The adsorption capacity of AC depends on the accessibility of the adsorbate molecules to its micro and mesopores; thus, it becomes necessary for the AC to present a well-structured network of interconnected micro, meso, and macropores. Furthermore, the surface chemistry of the carbon or carbon hybrid materials plays an essential role in the dye adsorption process [28]. The AC with properly balanced micro/mesoporosity can be achieved by a well-controlled chemical activation procedure established by specifying the preparation condition such as activating reagent/precursor ratio, carbonization temperature, and carbonization time for a specific precursor [29].
Commercial ACs are more often synthesized from fuel-based precursors such as coal, petroleum coke, peat, and lignite. However, the utilization of coal-based precursors raised its cost, which limits its widespread applications. The high cost of coal-based AC has attracted remarkable attention to the production of AC from low-cost, renewable, and eco-friendly raw materials. Recently, extensive efforts have been given to agricultural waste or biomass to prepare AC due to their abundant availability at no or little cost [30]. For example, activated carbons prepared from Teak Sawdust hydrochars [31] and spent coffee [32] have shown excellent MB adsorption properties. Accordingly, various agricultural waste such as almond shell, walnut shell, apricot kernel shell [33], coconut shell [34], apricot stone [35], cashew nutshell [36], soapnut shell, pineapple waste [37] was used as potential precursors of ACs for MB dye removal. Among various agricultural bio-resources, Areca catechu represents the potential to be a precursor for carbon production due to its peculiar structure, composition (67% of carbon from cellulose, amino acids, tannins, and lignin), and easy availability [38]. It is the edible fruit of the Areca palm tree and is native to South-East Asia and the Pacific islands. Investigations have shown that fragments of the Areca fruit such as betel nut husk [39,40], Areca nutshell [41], and Areca nut pod [42] had been used for the preparation of AC for dye removal.
In this contribution, we report the iodine and MB adsorption properties of the AC prepared from Areca catechu nut by the H3PO4 activation method. The effects of preparation conditions on the textural properties and iodine and MB adsorption characteristics were systematically studied. We have found that, under the optimized condition, the Areca catechu Nut-derived AC has an amorphous structure containing oxygen functionality and exhibits a high specific surface area of ca. 2132.1 m2 g−1 and a large pore volume of ca. 3.426 cm3 g−1, respectively. Furthermore, due to well-defined micro-and mesopore structures, the optimal sample displayed excellent iodine and methylene blue adsorption properties achieving a high iodine number of 888 mg g−1 and methylene blue value of ca. 369 mg g−1, respectively. Furthermore, the Langmuir isotherm model could describe MB adsorption with a monolayer adsorption capacity of 333.3 mg g−1. These results reveal that the porous carbon materials prepared from the novel Areca catechu Nut precursor have considerable potential as the adsorbents for water purification, removing organic dyes from water.

2. Materials and Methods

2.1. Materials

Areca catechu Nut (ACN) was purchased from the local market. Orthophosphoric acid (H3PO4: 88% w/w) and hydrochloric acid (HCl) solution (2M) were purchased from Nacalai Tesque Inc. Kyoto, Japan. Methylene blue (MB) and iodine were the products of Tokyo Chemical Industry, Tokyo, Japan. Millipore filter water was used to prepare solutions.

2.2. Preparation of Nanoporous Activated Carbon Materials

ACs were prepared via the chemical activation method using H3PO4 as the activating agent. First, ACN was washed with Millipore water to remove the impurities, and it was dried at 100 °C for 12 h. Then, the dried ACN was crushed to powder in a mechanical crusher and sieved through a mesh size of <250 µm. Next, ACN powder was chemically activated with H3PO4 and the effects of impregnation ratio (H3PO4: ACN powder = 0.25:1, 0.5:1, 1:1, and 1.5:1), carbonization time (2, 3, and 4 h) and carbonization temperature (300, 400, and 500 °C) on the structure and properties were studied. Next, carbonization was carried out in a tube furnace (KOYO, Tokyo, Japan) under nitrogen gas flow (120 cc min−1), and the temperature ramp was 5 °C min−1. After cooling, the carbonized products were washed with Millipore filter water several times until the supernatant liquid attained pH 7 and dried at 120 °C in a vacuum oven. The obtained products are designated as ANCx_y_z, where x, y, and z, respectively, represent the ratio of H3PO4, carbonization temperature, and carbonization time.

2.3. Yield of the Prepared Carbon

The yield of prepared ANC was calculated on a chemical-free basis. The yield is regarded as an indicator of the process efficiency for the chemical activation process. The yield of ANC was calculated by using the following equation.
Y i e l d   ( % ) = W e i g h t   o f   a c t i v a t e d   c a r b o n W e i g h t   o f   A r e c a   C a t e c h u   N u t   p o w d e r × 100

2.4. Characterizations

The surface and textural properties of the raw precursor and the ANCs were investigated. Thermogravimetric analysis (TGA) of ANP powder was performed on an SII Instrument (Model Exstar 600) from 25 to 1000 °C at a temperature ramp of 10 °C min–1 under nitrogen gas atmosphere. The ANCs were characterized by powder X-ray diffraction (XRD: Rigaku X-ray diffractometer RINT, Japan, Cu-Kα radiation, ran at 40 kV and 40 mA at 25 °C in the diffraction angles range from 10 to 50°), Raman spectroscopy (NRS-3100, JASCO, Tokyo, Japan), Fourier-transform infrared (FTIR) spectroscopy (Nicolet 4700, Thermo Electron Corporation, Waltham, MA, USA), scanning electron microscopy (SEM: S-4800, Hitachi Co., Ltd. Tokyo, Japan operated at 10 kV), transmission electron microscopy (TEM: JEOL Model JEM2100F, Tokyo, Japan operated at 200 kV), and nitrogen adsorption/desorption isotherms (Quantachrome Autosorb-iQ2, Boynton Beach, FL, USA). Nitrogen adsorption/desorption isotherm analysis estimated specific surface area, total pore volume, and pore size distribution were estimated from nitrogen adsorption/desorption isotherm analysis. Pore dimensions and pore volumes were calculated by using the density functional theory (DFT) and Barrett–Joyner–Halenda (BJH) methods. About 35 mg of sample was placed in a glass cell and degassed at 120 °C for 24 h before recording the nitrogen adsorption isotherm.

2.5. Iodine and Methylene Blue Number

Iodine number (IN) indicates the micro-porosity of ACs. It is defined as the milligram of iodine adsorbed per g of carbon [43]. Following the standard method [44] iodine number was. In determining the iodine number, HCl solution (5 wt%: 5 mL) was added to ANC (1 g) and was allowed to boil. After cooling the solution, iodine solution (10 mL: 0.1N) was added and shaken vigorously for 1 min, filtered, and washed with distilled water. The whole of the filtrate was titrated against 0.1 N sodium thiosulphate using starch as an indicator. The iodine number was calculated as:
I N = W e i g h t   o f   i o d i n e   a d s o r b e d   o n   c a r b o n   ( m g ) W e i g h t   o f   c a r b o n   ( g )
Methylene blue number (MBN) indicates the mesoporosity of ACs. It is defined as the maximum amount of dye in mg adsorbed per g of adsorbent. MBN of the ANs was determined by single point adsorption isotherm studies [45]. In this single-point adsorption isotherm method, 0.1 g of AC was mixed with 75 mL MB solution of concentrations 1000 mg L−1 each separately. The suspension was stirred intermittently in an electric shaker at 200 rpm for 3 h at room temperature (25 °C). After that, the solution was filtered, and the remaining concentration of methylene blue was analyzed using a UV/Vis spectrophotometer (CECIL-CE-100) at absorbance 664 nm. The MBN was calculated as:
M B N = C o C e × V M
where Co = concentration of the MB solution (mg L−1), Ce = concentration of the MB solution at equilibrium time (mg L−1), V = volume of solution (L), and M = mass of activated carbon added (g).

2.6. Adsorption of MB Dye

MB dye adsorption on the prepared ANC was performed by batch experiments at 25 °C. The effects of adsorption parameters such as contact time, adsorbent dose, pH, and initial dye concentration have been studied. The experiments were carried out in 100 mL stoppered conical flasks by mixing a definite ANC with 25 mL of dye solution. The suspensions were agitated on an electric shaker (Digital VDRL Rotator) at a rotation speed of 160 rpm. After equilibrium, the suspensions were filtered, and the residual dye concentration of the filtrates was analyzed by a UV-visible. The absorbance was measured at the maximum absorption wavelength of 664 nm.

2.6.1. Effect of Contact Time

The effect of contact time on the percentage of MB dye adsorption by the ANC was investigated at different time intervals in the range of 15 to 280 min. Other parameters were kept constant (adsorbent dose 1 g L−1, initial MB concentration 350 mg L−1, and pH 6.5).
Percentage adsorption of MB dye adsorbed was calculated by using the following equation.
R e m o v a l   ( % ) = ( C o C e ) × 100 C o
where Co = initial concentration of MB dye (mg L−1); Ce = equilibrium concentration of MB dye solution (mg L−1).

2.6.2. Effect of Dose

Effect of adsorbent dose on the percentage of MB dye adsorption by the ANC was studied by varying the adsorbent dose from 0.04 g L−1 to 4.8 g L−1, keeping other parameters constant (initial MB concentration 850 mg L−1, contact time 180 min and pH 6.5).

2.6.3. Effect of pH

Effect of pH on the percentage of MB dye adsorption by the ANC was studied in the pH range of 2 to 12 while maintaining all other variables constant (adsorbent dose 1 g L−1, initial MB concentration 450 mg L−1 and contact time 180 min). The pH of solutions was maintained using either 0.1 M HCl or 0.1 M NaOH.

2.6.4. Effect of Initial Concentration of MB

The effect of initial MB concentration on the adsorption phenomenon was studied by changing the initial concentration from 300 to 650 mg mL−1 dye concentration at 25 °C. The adsorbent dose, pH, and contact time were set to 1 g L−1, 6.5, and 180 min, respectively.

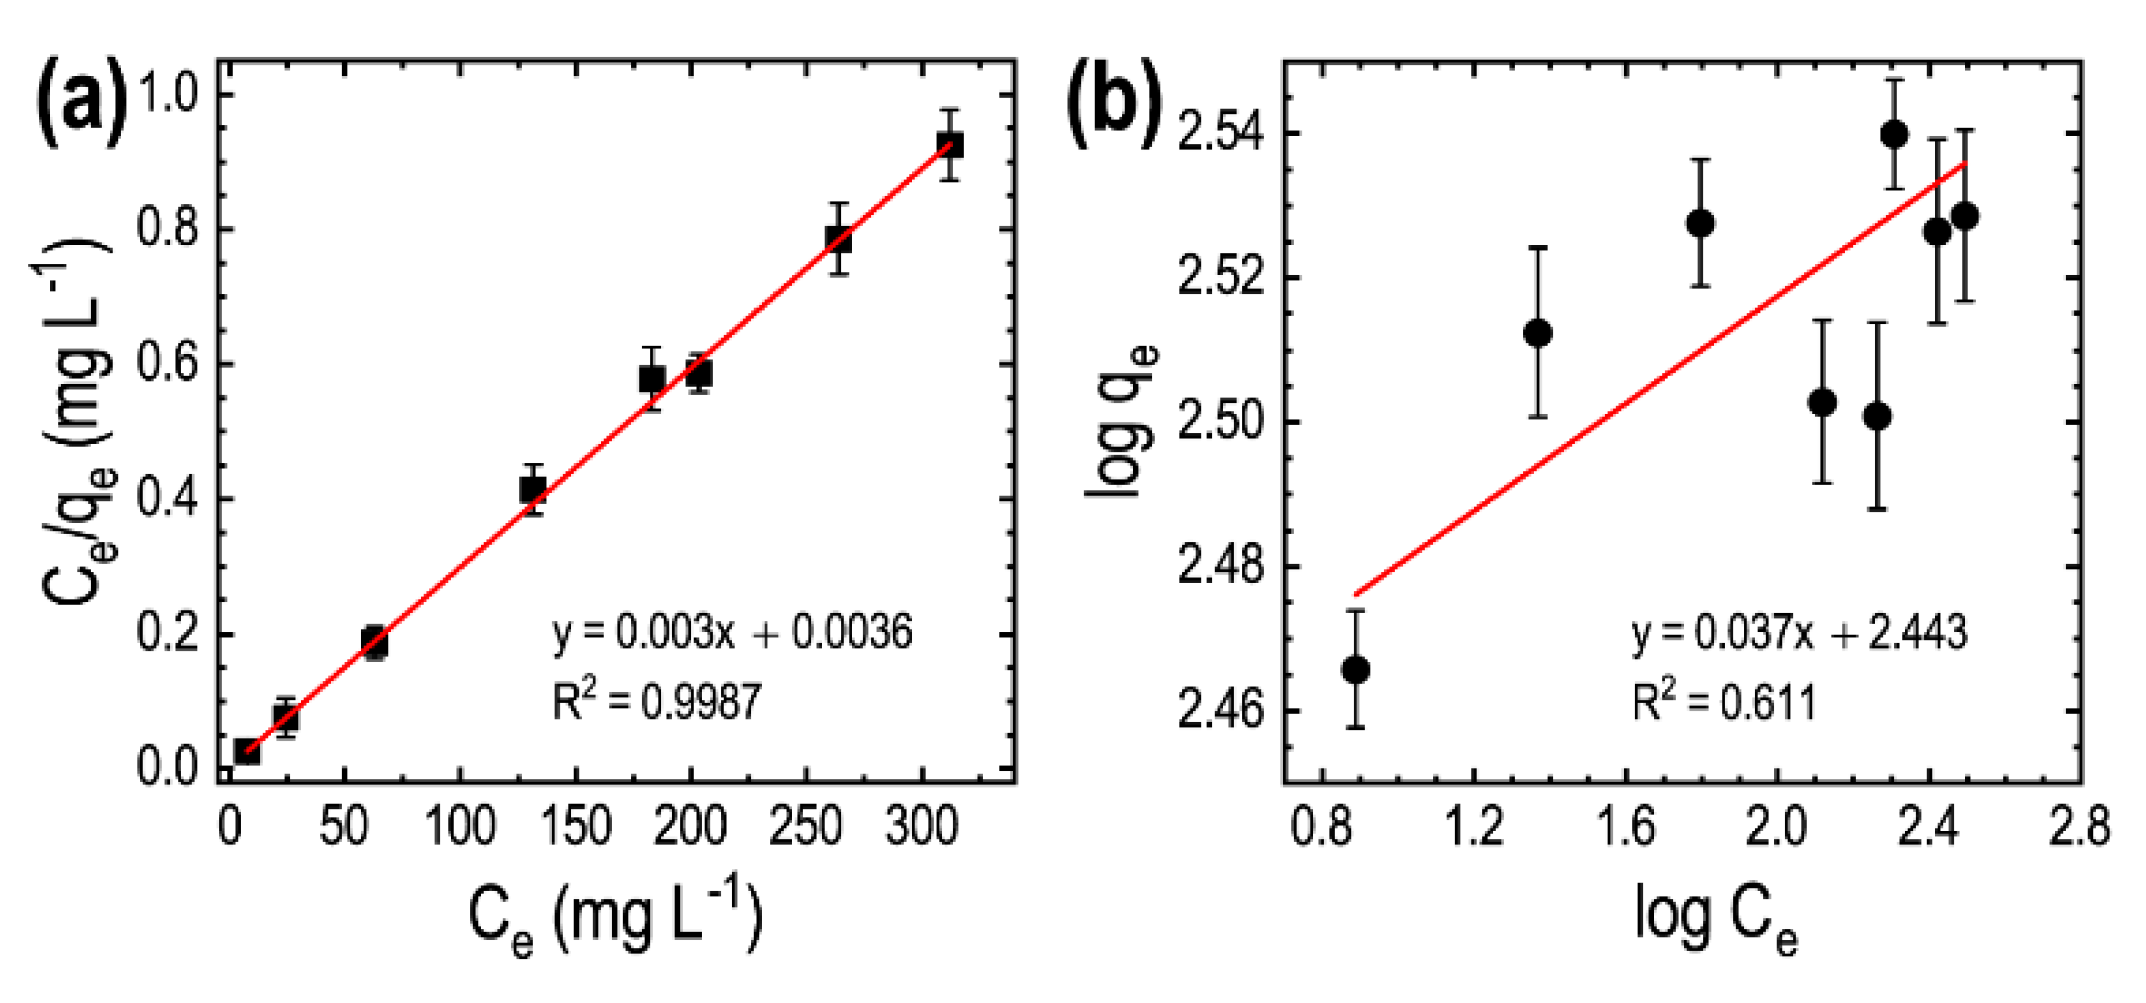
2.6.5. Adsorption Isotherms

The adsorption isotherm experiments were carried out by agitating 25 mL of dye solutions of various initial dye concentrations varying from 350 to 650 mg L−1. Other parameters were kept constant, such as adsorbent dose 1 g L−1, contact time 180 min, and pH 6.5. The amount of dye adsorbed in milligram per gram (qe) was determined by:
q e = ( C o C e ) × V M
where V = volume of MB dye solution (L); M = mass of the ANC (g). Thus, obtained experimental data were analyzed using Langmuir and Freundlich models. The linearized form of Langmuir adsorption isotherm can be described as
C e q e = 1 q m K L + ( 1 q m ) C e
where Ce, qe, qm, and KL represents equilibrium concentration of solution (mg L–1), amount of adsorbate adsorbed (by 1 g of adsorbent) maximum amount of adsorbate (mg g−1), and the Langmuir adsorption constant (L mg–1), respectively.
Freundlich isotherm assumes the non-ideal systems, including multi-molecular adsorption on a heterogeneous surface. The linearized form of Freundlich adsorption isotherm can be expressed as:
log q e = log K F + ( 1 n ) log C e
where KF represents the Freundlich constant and n indicates the adsorption intensity.

3. Results and Discussion

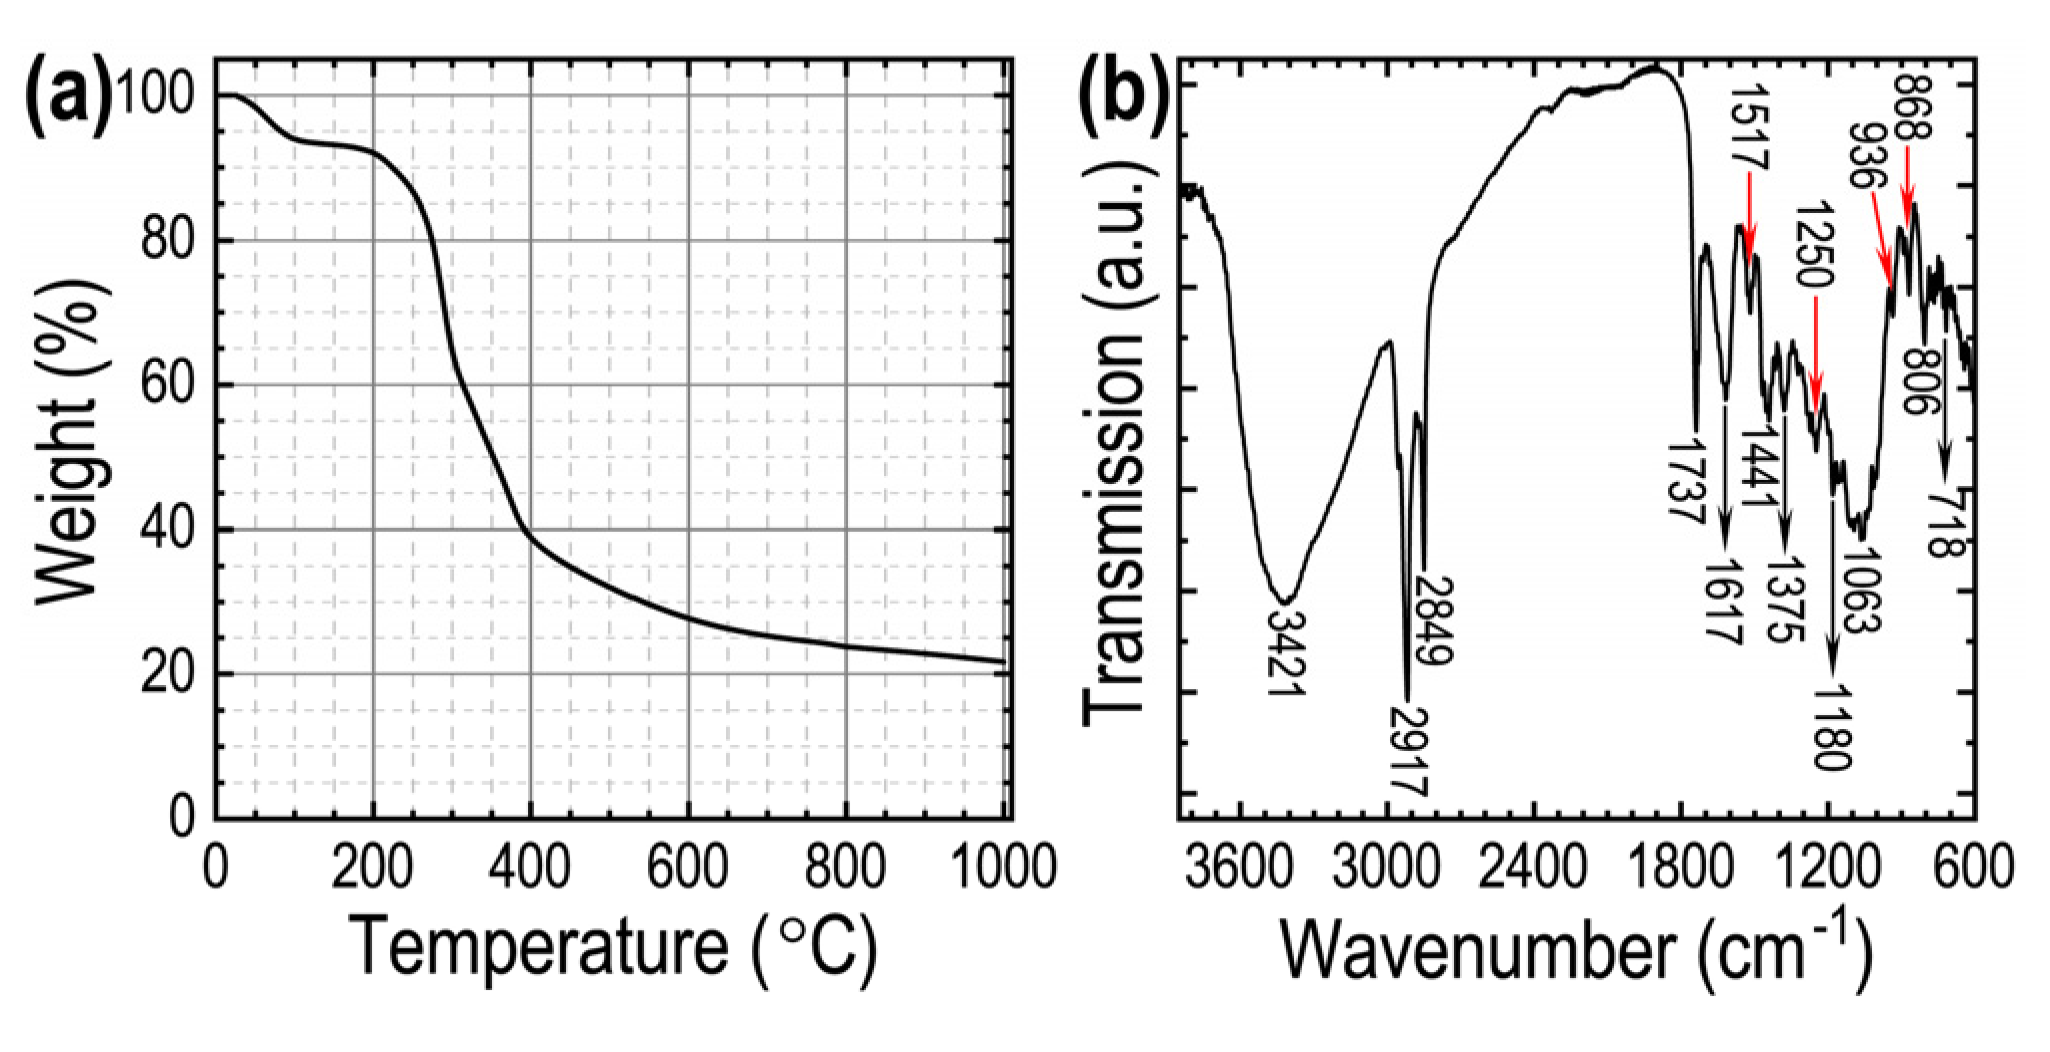
3.1. TGA and FTIR Analysis of Areca catechu Nut Powder
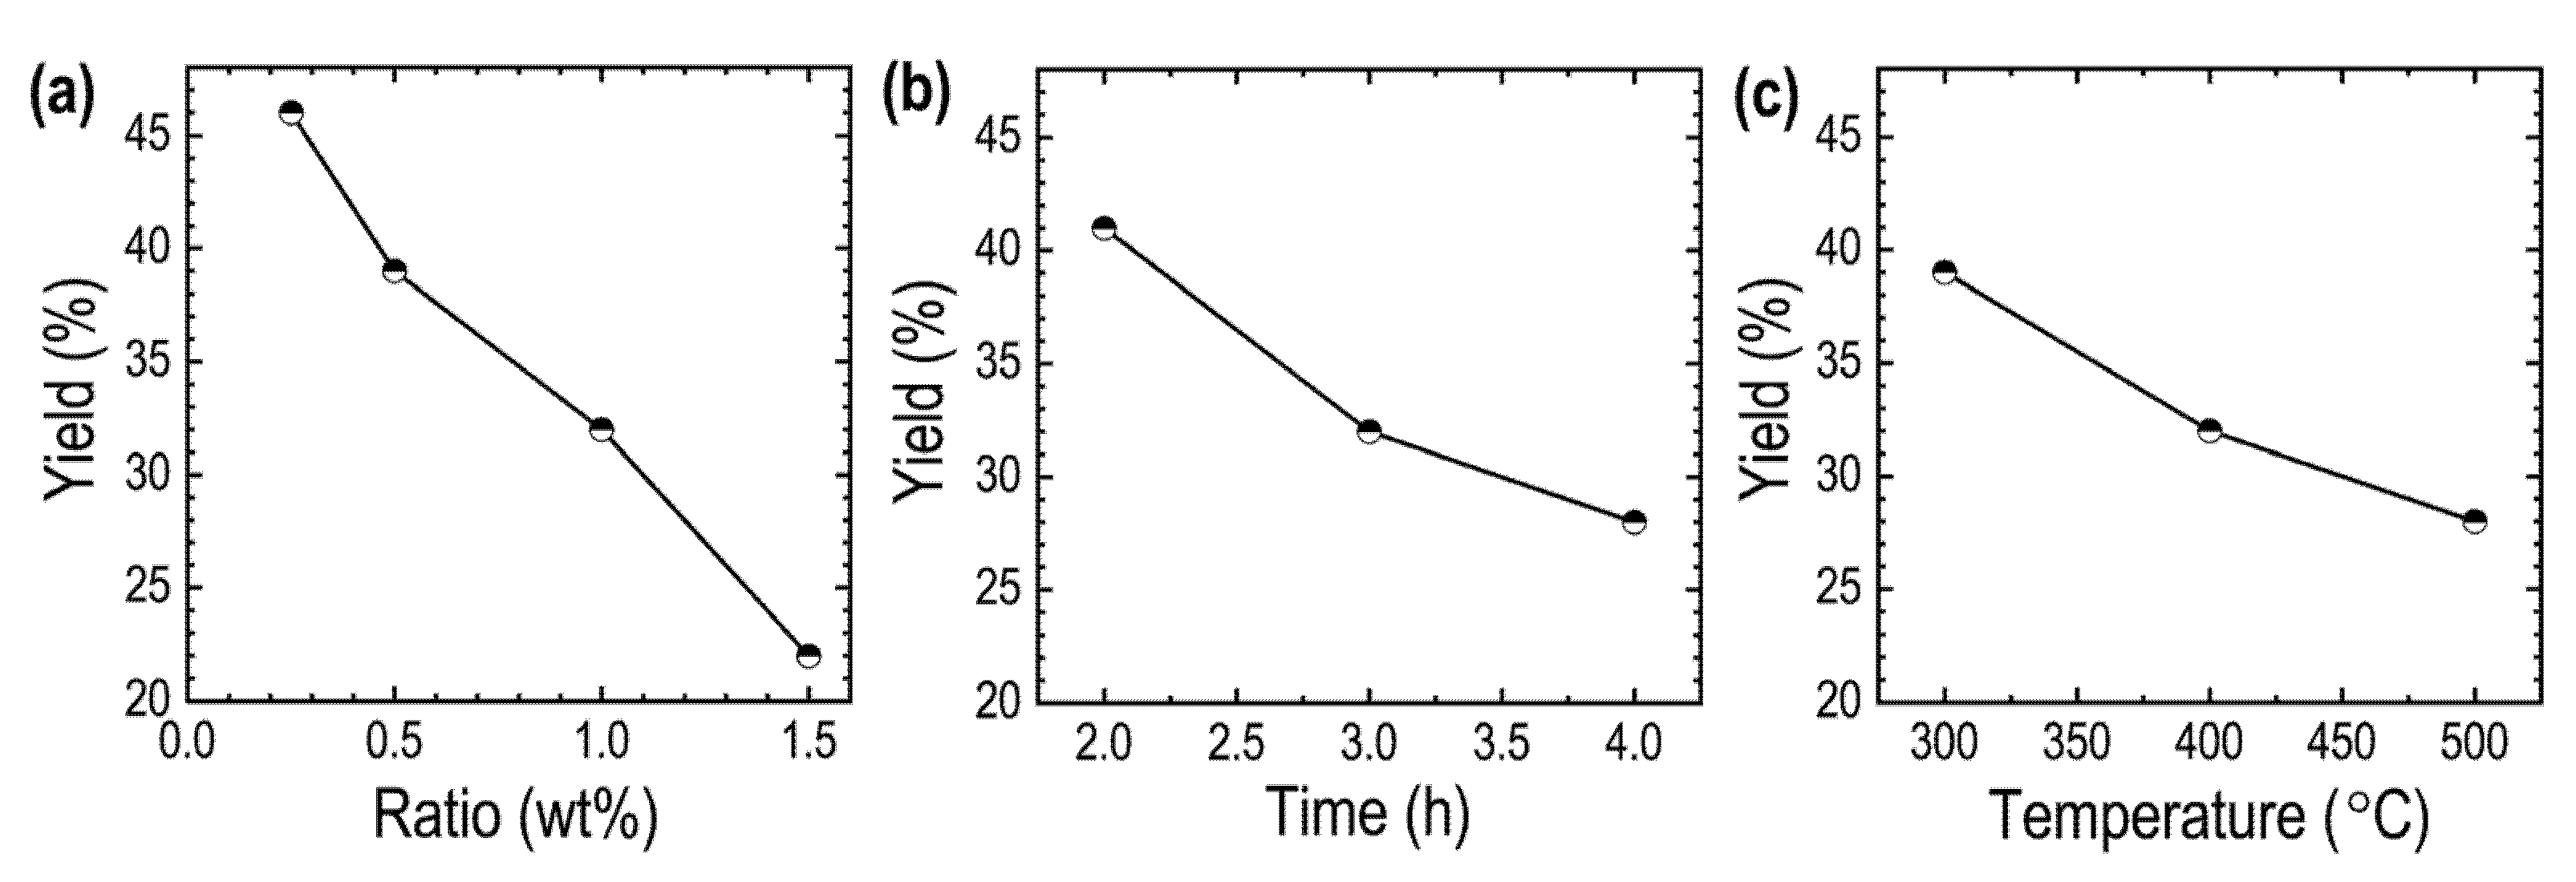
TGA analysis was performed to analyze the pyrolysis properties, and ANP precursor material’s mass-temperature relationship. Figure 1a shows the TGA curve recorded from 25 to 1000 °C under the nitrogen gas atmosphere. The curve shows that the pyrolysis process of the ANP follows in three stages: evaporation of crystal water or moisture (around at 100 °C), polymerization of cellulosic materials and degradation of carbohydrates or lipids (in the range of 200 to 400 °C), and release of volatile gaseous or tar formed during the pyrolysis (above 400 °C). Above 600 °C, there is no noticeable mass loss, suggesting the successful transformation of ANP into carbon materials. Therefore, we performed the carbonization in a low-temperature region (300 to 500 °C) in the present study.
As seen in Figure 1b, ANP precursor materials contain several oxygenated surface functional groups. The broad peak located at 3421 cm−1 reflects the O–H stretching vibration of hydroxyl groups, while the bands at 2917 and 2849 cm−1 correspond to the C–H stretching vibration of CH3 and CH2 groups of cellulose. The band at 1737 cm−1 can be assigned to the C=O stretching vibration of acetyl groups in lignin and ester groups in hemicelluloses. The band around 1617 cm−1 may be assigned to the bending vibration of O–H groups bound to the cellulose structure [42]. In addition, the absorption band at 1550 and 1250 cm−1 arise from the aromatic C=C stretching and the C–O stretching of guaiacyl unit in lignin, respectively. The band around 1441 cm−1 can be assigned to the C-H deformation in methoxyl, and aromatic skeletal vibrations in lignin and the band at 1370 cm−1 can be associated with the C-H symmetric deformation that is typical in cellulose and hemicelluloses [46,47]. The bands in the regions 1000–1180 and 900–650 cm−1 represent the stretching and asymmetric vibrations of C-O, C-C, and C-O-C and C-H bending vibration related to cellulose hemicellulose the aromatic ring. Thus, the FTIR spectrum of the biomass-based ANP precursor confirms the presence of cellulose, hemicelluloses, as expected for lignocellulosic materials [48].

3.2. Yield

Yield is an essential parameter in the preparation of nanoporous activated carbon materials related to the industrial production cost. Therefore, we have studied the yield (%) of the ANC by altering the carbonization conditions of impregnation ratio, carbonization time, and carbonization temperature. Figure 2 shows the yield vs. carbonization conditions.
As shown in Figure 2a, the yield decreases gradually with the impregnation ratio of activating agent (H3PO4). Note that in H3PO4 activation of lignocellulosic materials, the acid first attacks hemicellulose and lignin because the cellulose is more resistant to acid hydrolysis. The acid hydrolyzes glycosidic linkages in the lignocellulose, promotes the rupture of aryl ether bond in lignin, and forms crosslinks via cyclization, dehydration, degradation, and condensation processes. Furthermore, it combines with organic polymer to form phosphate and polyphosphate bridges that connect and crosslink polymer fragments. The process is followed by the evolution of volatile matter such as CO2, CO, and CH4, increasing aromaticity. The high acid concentration could react with the carbon and volatile matter and diffuse out of the surface of the particles faster during the activation process. It increases the gasification of surface carbon atoms, thus leading to an increase in weight loss and a decrease in carbon yield. The mangrove-based AC showed a similar trend [49].
In Figure 2b,c, the yield of ANC follows the decreasing trend with an increase in the carbonization time and carbonization temperature. Increasing carbonization time enhances the burn-off and tar volatilization by losing phosphate compounds from the carbonized product, leading to decreased carbon yield. Similarly, the decreases in the carbon yield with increasing carbonization temperature could be due to aromatic condensation reactions among the small polyaromatic units, increasing the evolution of gaseous products and loss of phosphate compounds from the hydroaromatic structure of carbonized char. It resulted in an increased release of volatile matters to further decrease the yield [50]. Similar trends in the yields with carbonizing temperature and carbonization time have been reported for the AC from pre-leached cassava peels [51] and sugarcane bagasse [47], respectively.

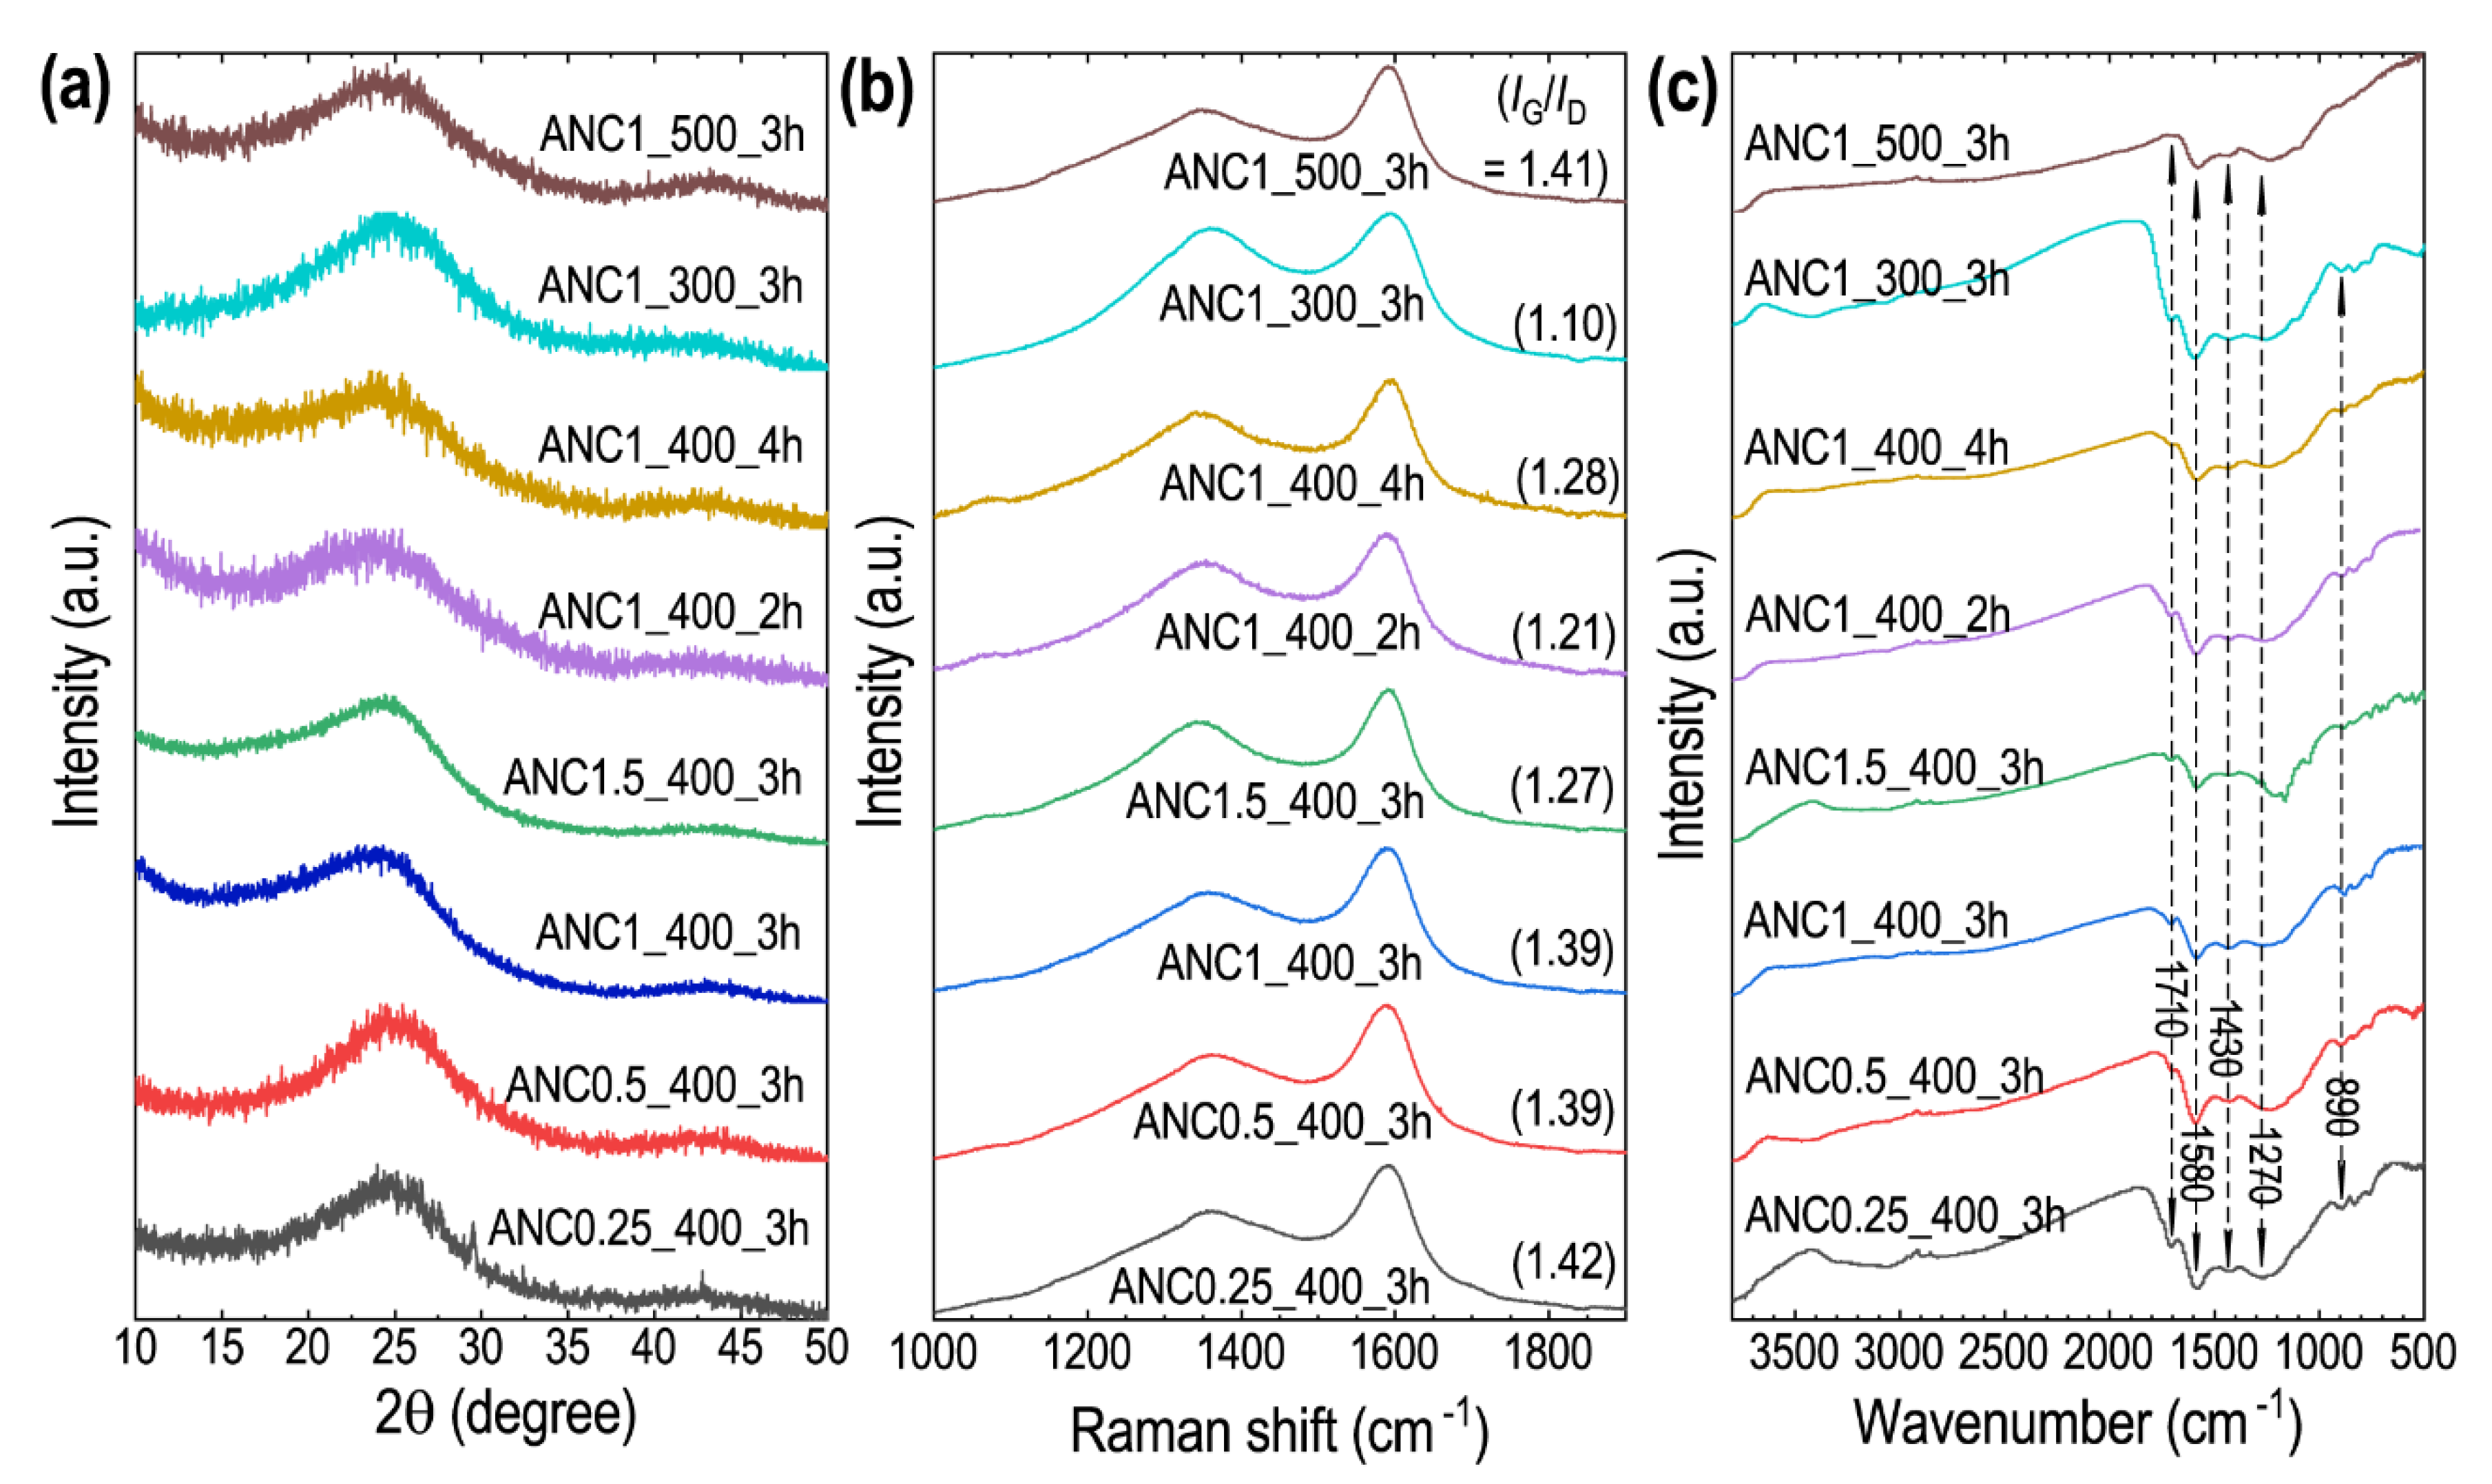
3.3. Characterizations: XRD, Raman Scattering and FTIR

Figure 3 shows the XRD patterns, Raman scattering spectra, and FTIR spectra of the prepared carbon samples. All the carbon samples exhibit two broad X-ray diffraction peaks: a distinct peak at 24° and a less intense peak at 43.5° in the XRD patterns (Figure 3a). These diffraction peaks correspond to the (002) and (100) lattice planes of graphitic structure, which are characteristic of ACs [52]. The relatively intense peak at 24° represents the amorphous carbon structure and disorderly stack-up of carbon rings. Similarly, the weak peak at 43° indicates a graphitic carbon structure. However, there is a slight difference in the graphite crystallinity and intensity of the (002) and (100) peaks in which different preparation conditions may cause.
Raman scattering spectra exhibit two broad Raman bands: the first peak detected in the range of 1339 and 1348 cm−1 can be assigned to the defect or disordered phase (D-band), and the second peak at 1593 cm−1 can be attributed to the graphitic phase (G-band) of carbon (Figure 3b). The D-band represents the vibrations of carbon atoms having a dangling bond in the terminations of the disordered graphite structure, whereas the G-band represents the stretching vibration mode of the sp2 hybridized carbon atoms in the graphite layer [53]. Furthermore, the ratio of the intensities of D-band and G-band (IG/ID) measures disorder in carbon materials with the graphitic structure. The IG/ID increases with the decrease in crystallinity. The carbon samples exhibited IG/ID ratios in the range of 1.10 to 1.42, indicating the formation of amorphous graphitic carbon with a minimal degree of defects. Careful observations reveal that the IG/ID ratio decreases from 1.42 to 1.27 upon the increase in the H3PO4 impregnation ratio from 0.25 to 1.5, indicating more and more defects in the carbon framework. An increase in carbonization temperature from 300 to 500 °C decreases the IG/ID ratio from 1.10 to 1.41, demonstrating an increase in the graphitic carbon. An increase in the hold time during carbonization at a fixed temperature of 400 °C does not cause any significant effect on carbon microstructure. The IG/ID ratio remains apparently unchanged. Note that the Areca catechu nut-derived amorphous carbon materials with a partial graphitic structure are similar to bimetallic ZIF carbon [54,55]. The degree of graphitic structure strongly affects electrical conductivity, specific area, pore size, and wettability and thus influences the carbon materials’ performance in sensing, separation, and energy storage.
Notably, FTIR spectra of all the ANC samples possess almost similar vibrational bands (Figure 3c) with slight differences in their intensities. The weak broad peak at 3410 cm−1 corresponds to the O–H symmetric stretching vibration of the H2O molecules. However, in some cases, -OH functional groups almost disappeared during the high-temperature carbonization/activation process. The small peak at 1710 cm−1 can be assigned to the C=O stretching vibrations of carboxylic acids. The strong peak centered at 1580 cm−1 may be assigned to the stretched vibrations of the aromatic C=C bond, a typical characteristic of carbonaceous materials. It could form by decomposition of C–H bonds to form more stable aromatic C=C bonds at the higher carbonization/activation temperatures. The small peaks at 1430 and 1270 cm−1 can be ascribed to the C-C stretching vibration of CH2 or CH3 groups and the C–O stretching in carboxylic groups or the C–O–C stretching vibration. Furthermore, a weak peak at 890 cm−1 can be assigned to the C-H bending vibrations of aromatic rings. The result agrees with the surface chemistry of the nano-porous prepared from Lapsi seed stone [52]. Thus, FT-IR analysis results of ANCs confirm the existence of oxygenated surface functional groups such as –OH, –CO, COOH, and lactones that could be potential adsorption sites for interaction with the cationic MB dye.

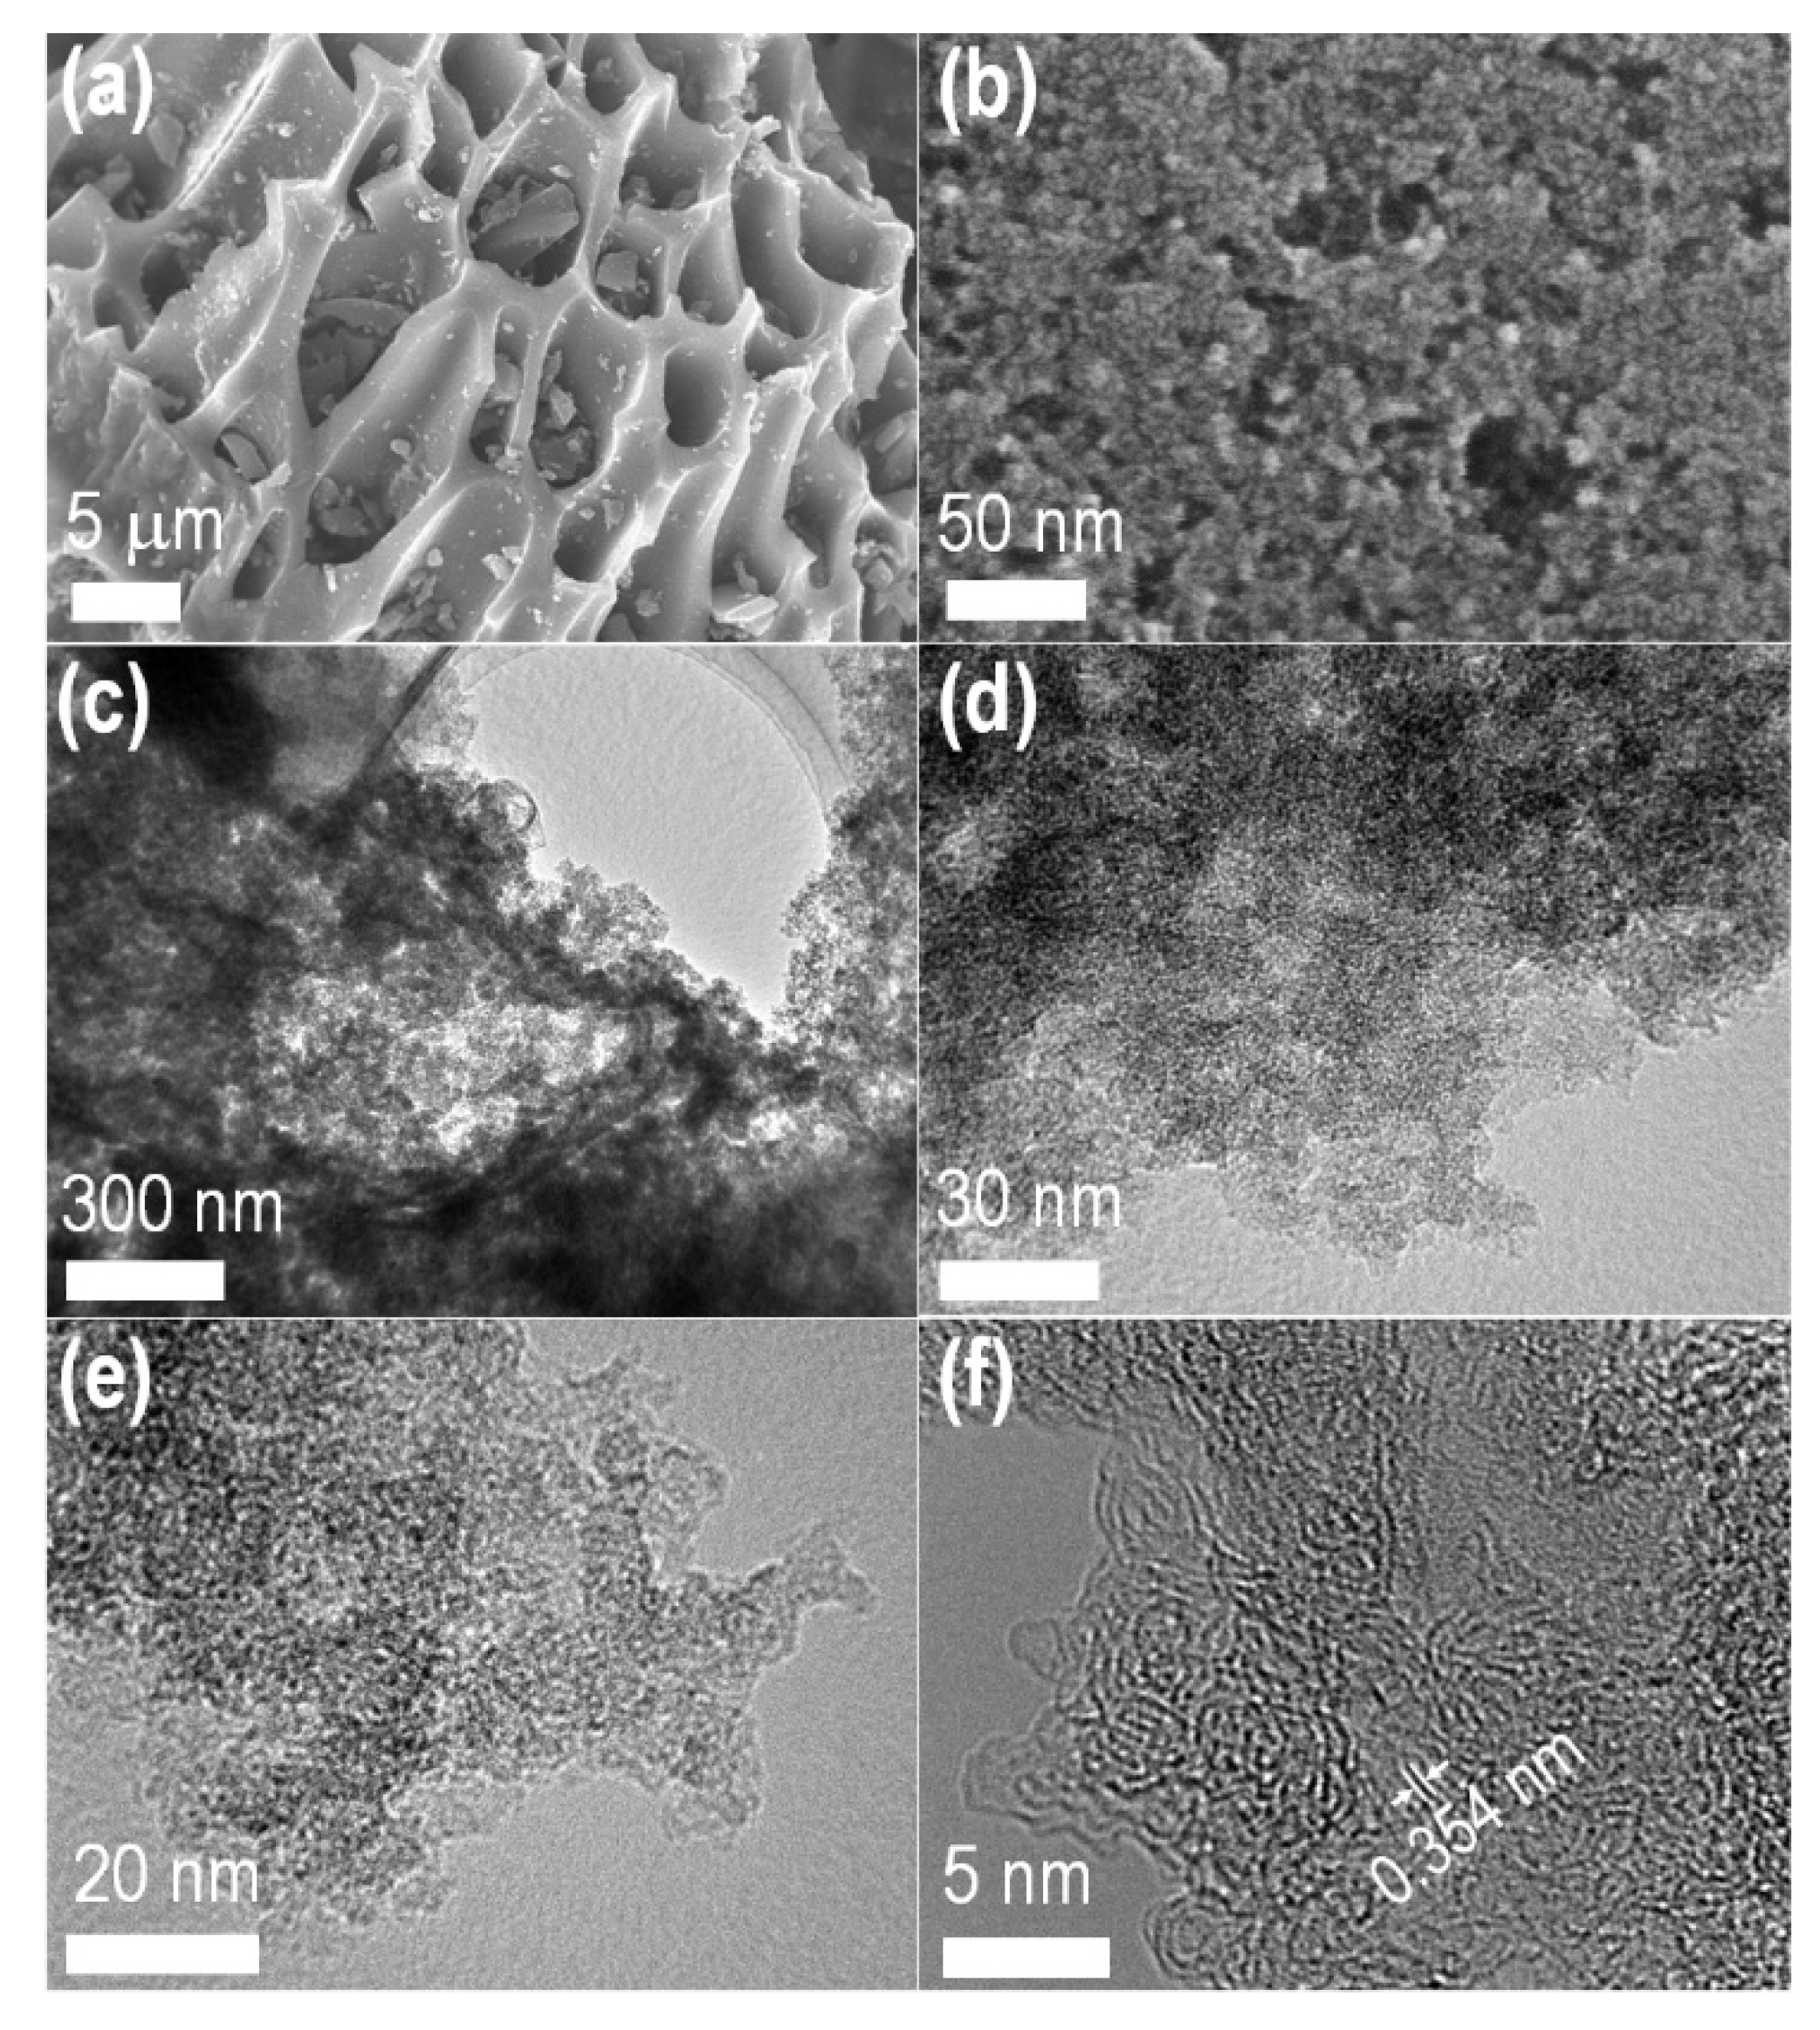
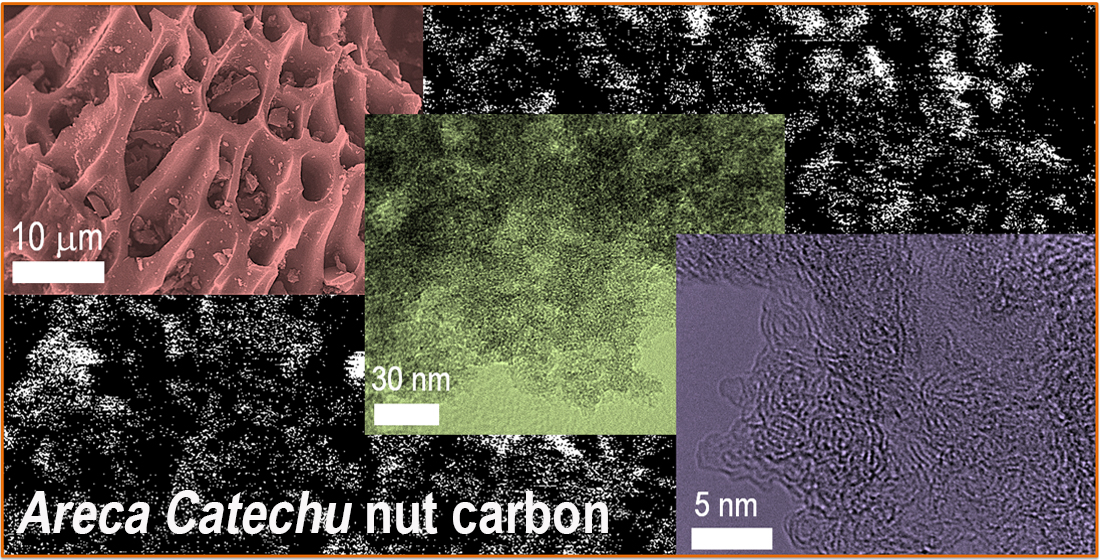
3.4. Electron Microscopy: SEM and TEM Observations

Figure 4 shows SEM, TEM, and HR-TEM images of the optimal sample, ANC1_400_3h.
A low-resolution SEM image (Figure 4a) reveals the regular pores or cavities with macroporous channels. Macroporous surface structures are common in biomass-derived AC. The high-resolution SEM image (Figure 4b) shows abundant mesopores distributed randomly over the surface of carbon particles. The TEM images can show more detailed internal microstructures (Figure 4c–e). The disordered hierarchically porous structures consist of both micro and mesoporous architectures. HR-TEM image reveals the microporous carbon with the randomly grown graphitic carbon layers with the interlayer distance of 0.355 nm (Figure 4f), similar to bimetallic ZIF carbon [54,55]. Formation of micro-mesopores in the ANCs results from the gasification and release of volatile organic compounds during carbonization/activation of carbonaceous ANP precursor material. This nanoporous structure should contribute to the adsorption of large molecules, such as dye, thus enhancing the removal rate of dye from water [56].

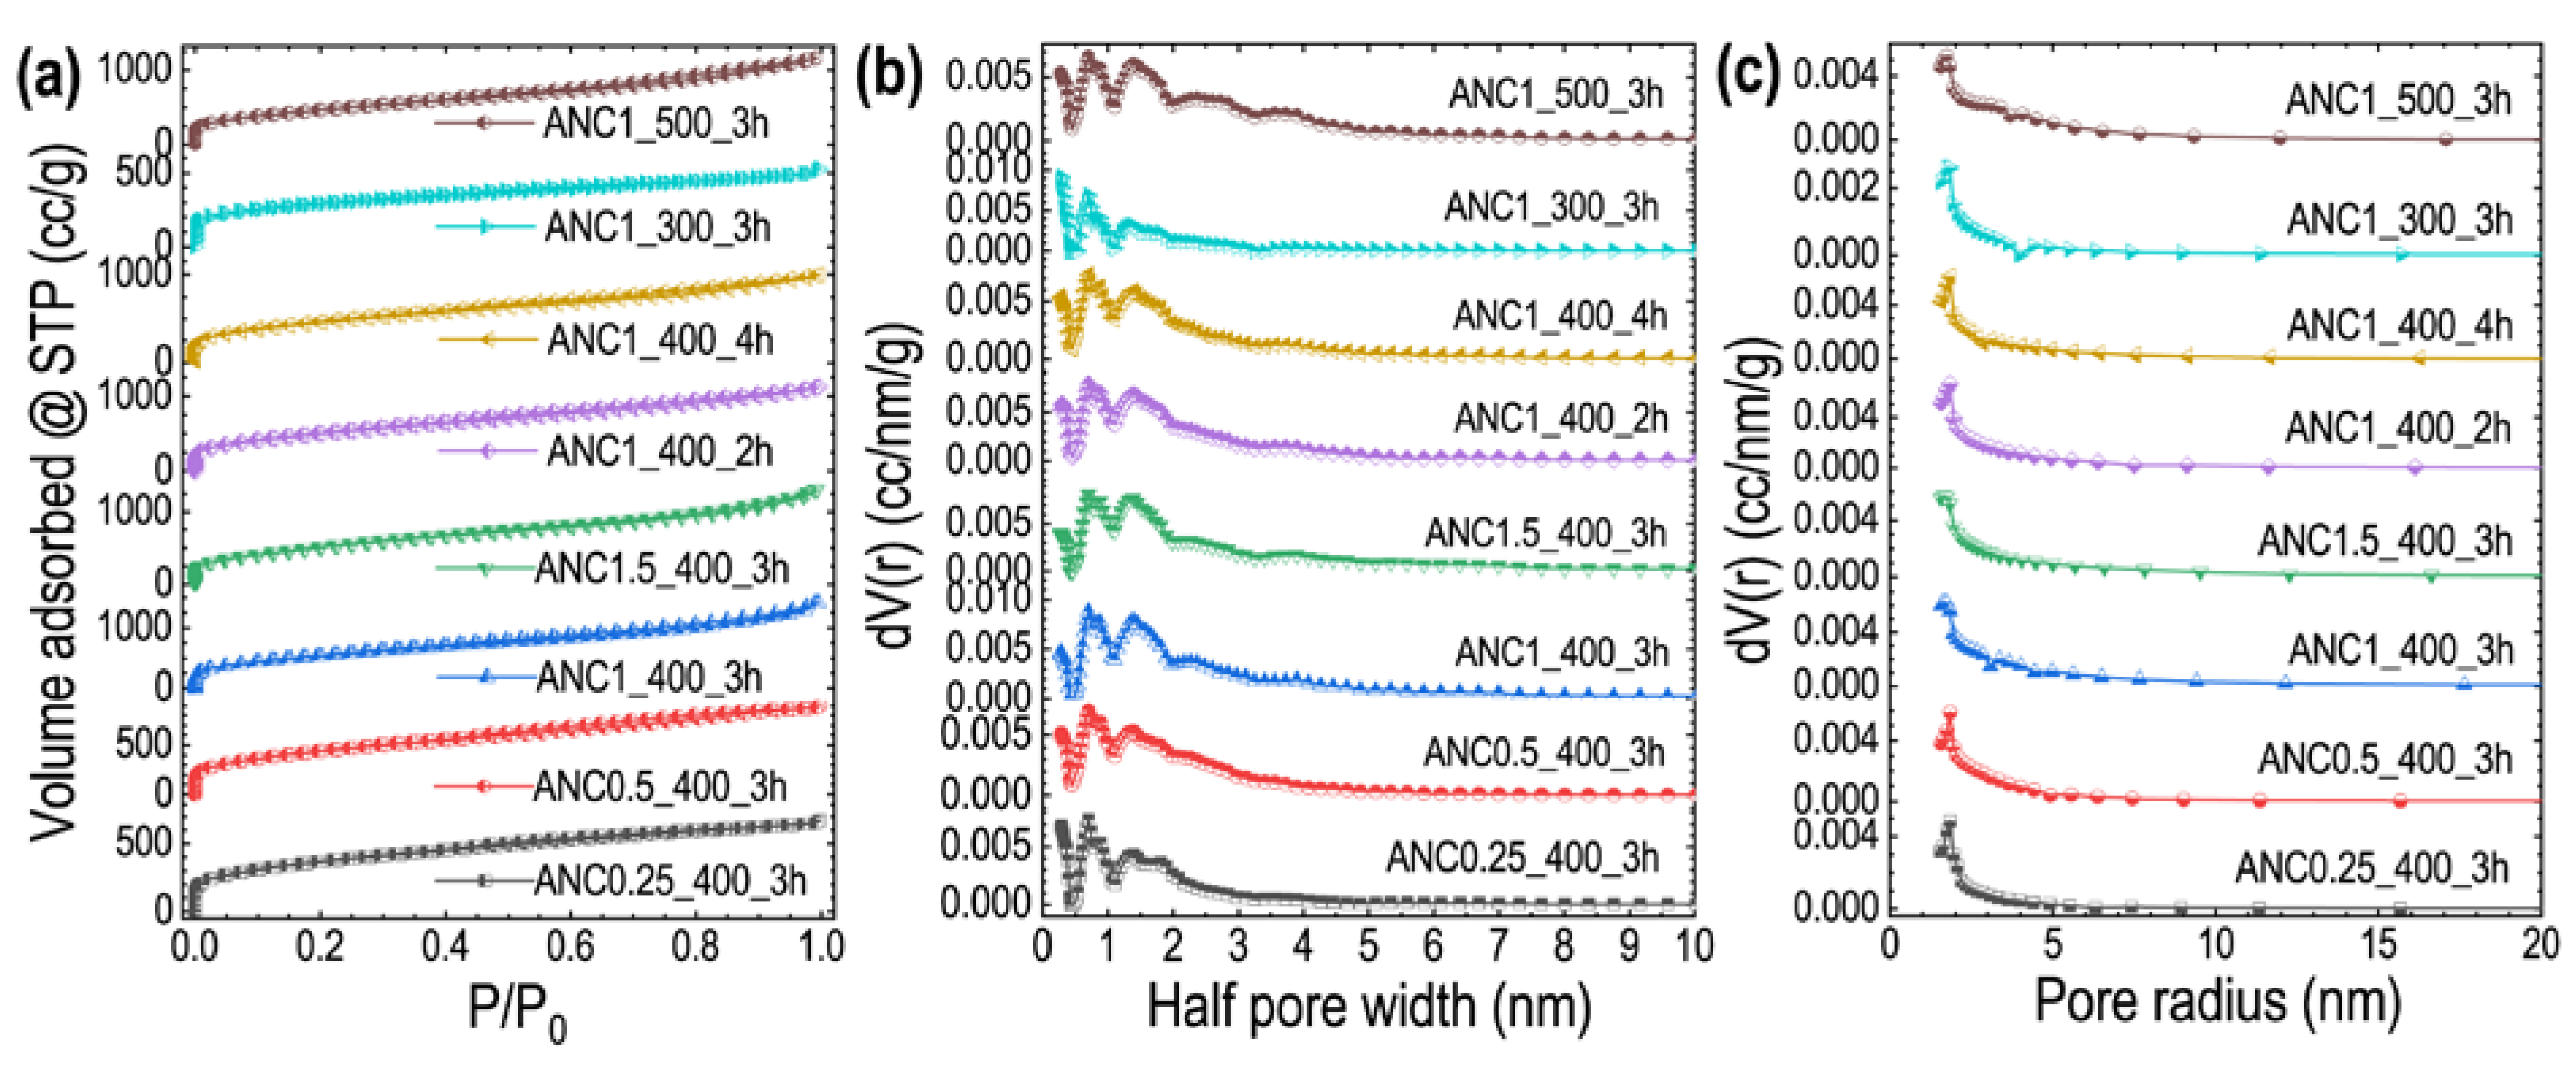
3.5. Surface Textural Properties: Nitrogen Adsorption/Desorption

The textural properties of the prepared carbon materials were studied by nitrogen sorption measurements. Figure 5 shows the nitrogen adsorption/desorption isotherms and the pore size distributions obtained from the density functional theory (DFT) and Barrett-Joyner-Halenda (BJH) models. The nitrogen adsorption–desorption isotherms of the prepared ANCs belong to the combination of type I and type IV isotherms suggesting hierarchical micro-and mesopore structures.
Nitrogen adsorption is significant at lower relative pressure. It increases steadily at the higher relative pressure with the hysteresis loop in all the samples (Figure 5a). High nitrogen uptake at lower relative pressure is a well-known phenomenon of micropore filling, while the hysteresis loop is caused by capillary condensation occurring in the mesopores. It demonstrates the coexistence of both micro and mesopore structures in the ANCs. These micro-and mesopores provide a sufficiently large surface area, facilitating the penetration and diffusion of dye molecules in the carbon surface during adsorption [57]. The pore size distribution obtained from the DFT method (Figure 5b) shows well-defined micropores with half-pore peaks centered at 0.7 and 0.87 nm (see inset of Figure 5b).
Furthermore, peaks corresponding to mesopores can also be seen. The pore size distribution profiles obtained from the BJH methods further confirm the mesopore structure (Figure 5c), giving an average pore diameter of about 3.6 nm. Table 1 summarizes the textural properties of the ANCs obtained from the analyses of the nitrogen sorption measurements. Due to the large hierarchically micro-and mesopore structure, the ANCs show a high specific surface area. The total specific surface areas are found in the range of 1399.9 to 2132.1 m2 g−1. At the same time, the total pore volumes are found in the range of 1.112 to 3.426 cm3 g−1. The surface analysis results show that the preparation conditions, including the ratio of the activating reagent with precursor material, carbonization temperature, and carbonization time, play an essential role in the structure and properties of the final product. For example, an increase in the mixing ratio of H3PO4 with the precursor increases the surface area, reaching the maximum at 1:1 and then decreasing. Similar effects were observed with temperature and carbonization time, giving the optimum conditions for carbonization is 1:1 mixing ratio at 400 °C for 3 h.

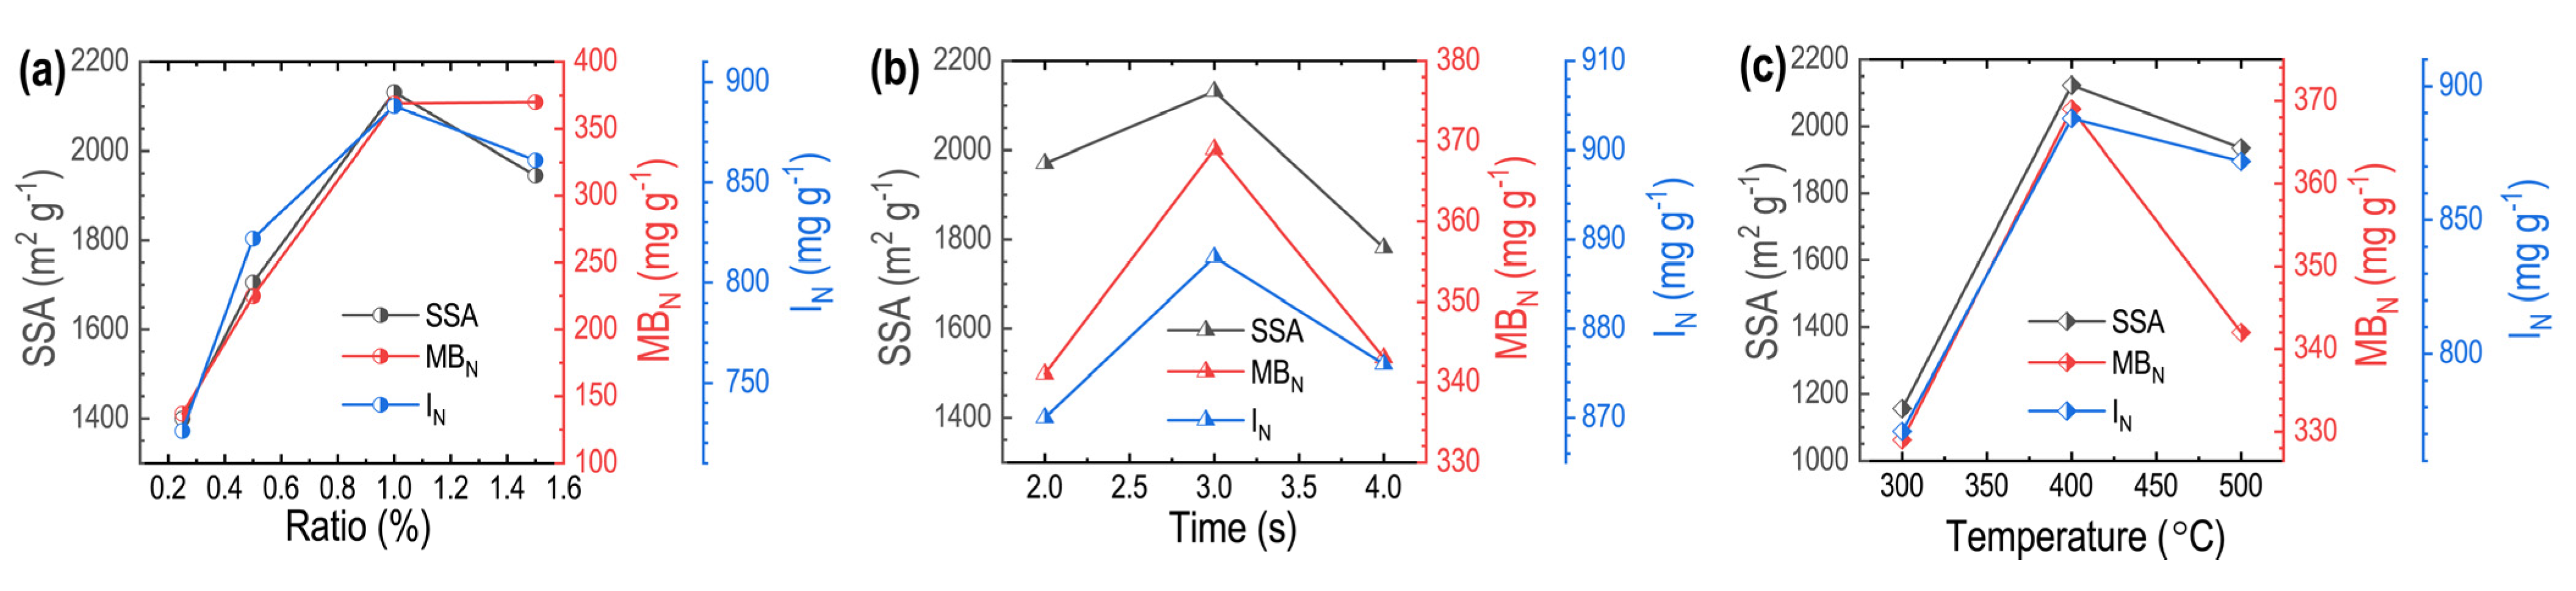
3.6. Iodine and Methylene Blue Numbers

Figure 6 shows the results of iodine and methylene blue adsorption at different carbonization conditions vs. specific surface areas of the carbon materials. IN increases significantly with an increase in the mixing ratio of H3PO4 from 0.25 to 1 and then decreases (Figure 6a), which agrees with the micropore surface area (Table 1). The highest IN ca. 888 mg g−1 is observed for the optimal sample. Conversely, MBN increases with the ratio of H3PO4 and remains unchanged above the mixing ratio of 1. The decrease in IN at a high mixing ratio indicates micropore coalescence leading to the formation of mesopores; as a result, the MBN remains unchanged or minor increase. This result agrees with the previous findings [58]. Similarly, IN and MBN increase with the carbonization time up to 3 h and then decrease (Figure 6b). It suggests that carbonizing for a prolonged period probably destroys the micropores and mesopores forming macropores. It may be due to the contraction in the material to some extent and breaking polyphosphate linkage. Increasing the carbonization temperature from 300 to 400 °C increases both IN and MBN, at which point it decreases (Figure 6c). As carbonization temperature increases, the porosity also increases due to the release of tars from the cross-linked framework generated by phosphoric acid treatment. Above 400 °C, the phosphate and polyphosphate bridges become thermally unstable and break up. It results in the contraction in the carbon structure that destructs micropores and mesopores hence decreasing IN, MBN, and surface area.

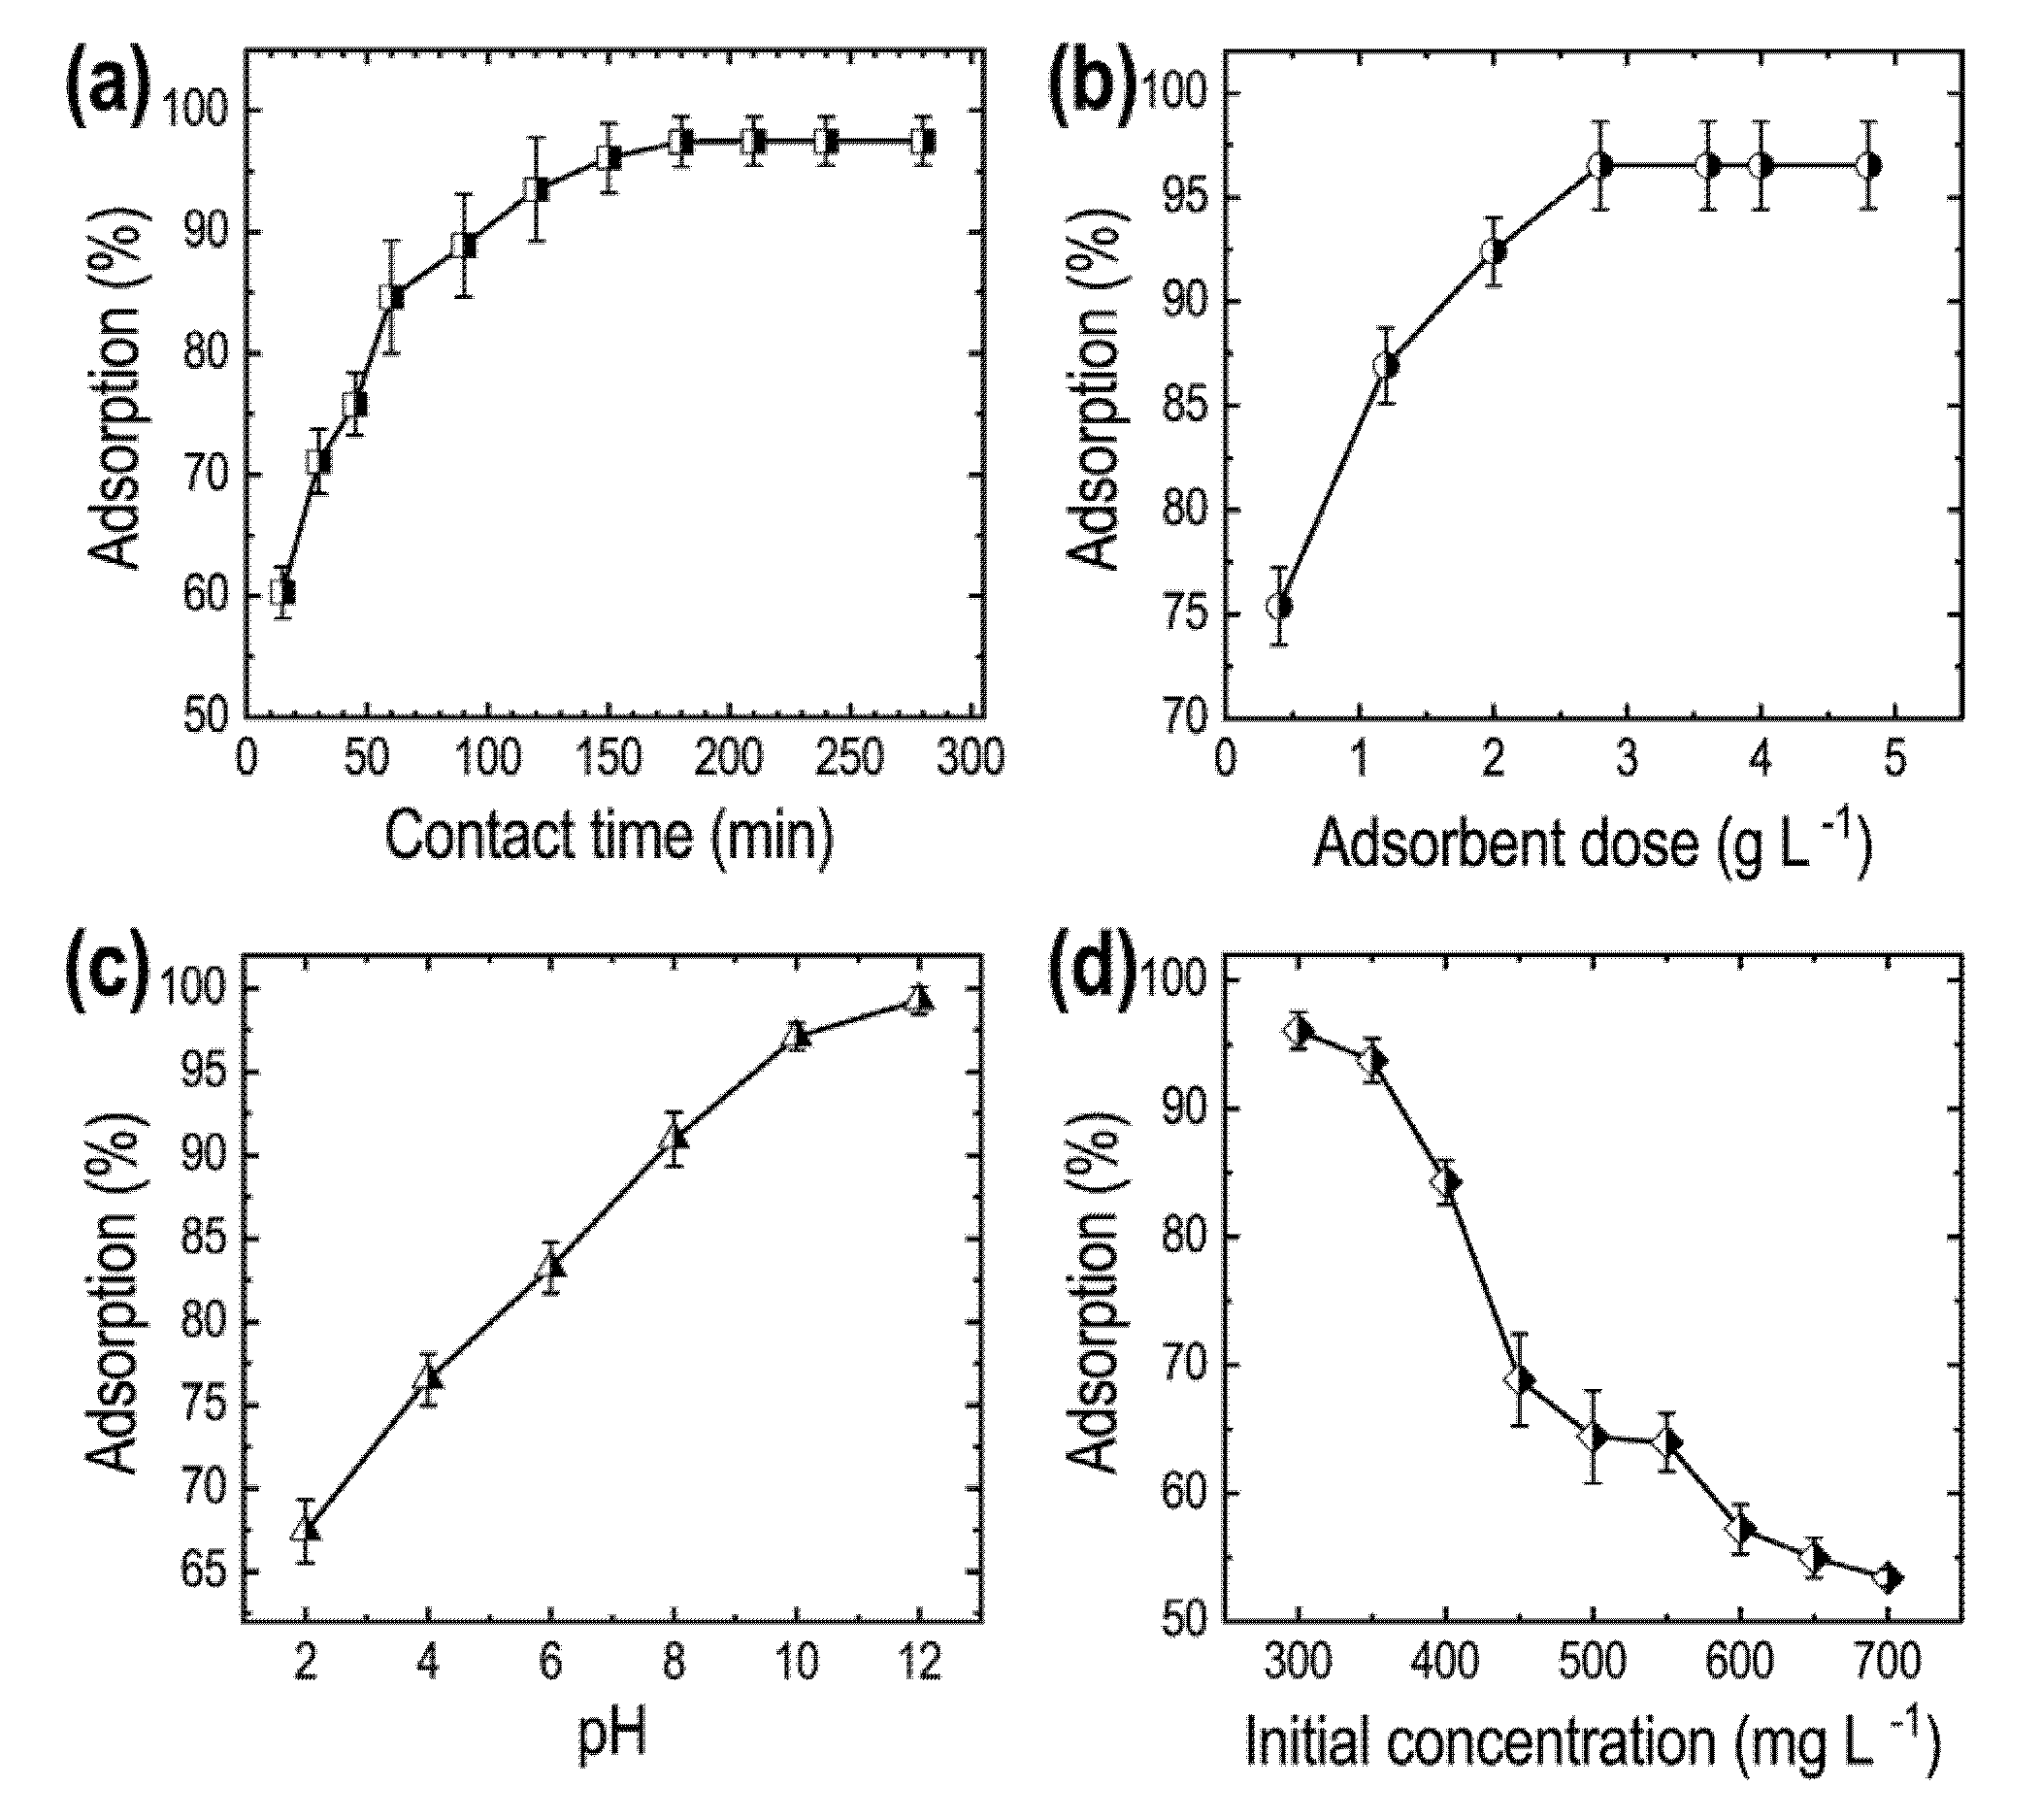
3.7. Adsorption Studies

The batch adsorption experiments were carried out to optimize the physical parameters on the MB dye adsorption efficiency using the optimal sample, ANC1_400_3h. Figure 7 shows the effect of different parameters (contact time, adsorbent dose, pH, and initial concentration of dye) on the adsorption properties of MB. Contact time can influence the economic efficiency of the process and the adsorption kinetics. As shown in Figure 7a, the adsorption (%) increases rapidly with the contact time and attains equilibrium within 180 min. The initial rapid uptake of the dye is due to the availability of many adsorption sites on the ANC surface. As a result, the mass transfer of the adsorbate from the bulk phase towards the adsorbent surface is rapid. With time, available active sites on the adsorbent decrease. Thus, the adsorption rate decreases, eventually reaching an equilibrium state of MB concentration on the adsorbent and the solution [59]. Figure 7b shows the effect of adsorbent dose on MB adsorption. An increase in adsorbent dose from 0.04 to 2.8 g L−1 increases the MB adsorption, and an equilibrium is reached. A further increase in adsorbent dosage (>2.8 g L−1) does not cause any significant change in dye adsorption.
The pH of the solution is one of the critical parameters in the adsorption process, which affects surface charge by causing the adsorbent to ionize [60]. Figure 7c shows the effect of pH on the adsorption of MB dye. Increasing pH monotonously increases the adsorption of MB dye with maximum adsorption of ~99% at pH 12. MB is a cationic dye; therefore, when the dye solution is at pH 2 (acidic medium), the surface of the ANC adsorbent is positively charged. Therefore, it does not favor the adsorption of cationic MB dye. Conversely, when the pH of the dye solution increases (alkaline medium), the ANC surface becomes negatively charged. As a result, the adsorption of MB dye increases due to increasing electrostatic attraction [61,62].
The initial dye concentration also affects adsorption phenomena, either increasing or decreasing the availability of binding sites on the adsorbent. Figure 7d shows the adsorption of MB vs. initial dye concentration. The adsorption decreases with the initial dye concentration and eventually reaches equilibrium. The higher adsorption of dye at lower concentrations may be caused due to the availability of abundant active sites on the carbon surface. However, at higher concentrations, dye adsorption decreases due to the saturation of the binding sites [63]. In addition, the electrostatic repulsion between negative charges of adsorbate ions results in the decrease of the adsorption percentage. Therefore, it results in a decrease in the efficiency of the adsorption of dye [37]. Thus, the adsorption results show that the optimum conditions for adsorption of MB dye on the Areca catechu nut-derived nanoporous activated carbon are: contact time of 180 min, alkaline pH, and adsorbent dose of 2.8 g L−1 with an initial dye concentration of 300 mg mL−1.
The adsorption isotherm describes the distribution of MB dye between the solid and the liquid phase in equilibrium and reflects the relationship between MB dye adsorbed and its concentration at a constant temperature. Langmuir and Freundlich isotherms are widely used models in water and wastewater treatment [64]. Figure 8a shows the linearized Langmuir isotherm model: plot of Ce/qe vs. Ce for the adsorption MB on the optimal sample (ANC1_400_3h). A good correlation coefficient suggests a homogeneous monolayer exposure of the MB dye on the surface of the adsorbent without interaction between adsorbed species. From the slope, the maximum amount of MB adsorbed on the carbon materials is ca. 333.3 mg g−1, and from the intercept, the Langmuir constant is ca. 0.833 L mg−1. The high MB adsorption capacity can be attributed to the high surface area of the Areca catechu nut carbon.
Figure 8b shows the Freundlich isotherm model. The correlation coefficient of the Freundlich isotherm model is ca. 0.611, which is poorer than the Langmuir model, suggesting that the Langmuir model better explains the MB adsorption. Table 2 compares the maximum MB adsorption capacity of similar adsorbents described by the Langmuir model.

4. Conclusions

In conclusion, we successfully synthesized nanoporous activated carbon materials from a novel carbon source, Areca catechu nut powder, by the phosphoric acid activation method and studied their adsorption performance for the iodine and methylene blue adsorption from aqueous solution. In addition, the effects of carbonization conditions on the surface textural properties were systematically studied. Depending on the carbonization condition, the Areca catechu nut-derived amorphous carbon materials with partial graphitic carbon structure display high surface areas and large pore volumes from 1156.1 to 2132.1 m2 g−1 and from 1.112 to 3.426 cm3 g−1, respectively. Due to the excellent textural properties (surface area and pore volume) and hierarchically porous structures consisting of micro-and mesopores, the optimal sample displays the outstanding iodine and methylene blue adsorption properties. The material achieved a high iodine number and methylene blue values of ca. 888 and 369 mg g−1, respectively.
The batch adsorption of MB dye from the water was found to be affected by pH, adsorbent dose, contact time, and initial concentration. The optimum parameters for adsorption of MB dye were found to be the contact time of 180 min, alkaline pH (~12), and adsorbent dose of 2.8 g L−1, with an initial dye concentration of 300 mg mL−1. The adsorption equilibrium data follow the Langmuir isotherm model with a maximum value of monolayer adsorption capacity of 333.3 mg g−1. Our results demonstrate that Areca catechu nut would be a suitable carbon source for synthesizing activated carbon materials with a high surface area desired in the high-performance adsorbent for water purification, especially for removing organic dyes. Therefore, we will explore the energy-related applications of the materials such as supercapacitors in the future. Furthermore, we will produce novel carbon materials using Areca catechu nut powder by activating with ZnCl2 and KOH at different temperatures. Since the pore architectures and surface chemistry depend on the activating agents, it is worth having a complete phase diagram of the surface textural properties and functions of the Areca catechu nut-derived nanoporous carbon materials, particularly in water purification and energy storage applications.

Author Contributions

Conceptualization, S.J. and L.K.S.; methodology, R.G.S., R.R.P., and S.J.; validation, L.K.S., K.A., S.J., and R.G.S.; formal analysis, S.J., R.R.P., and L.K.S.; investigation, S.J. and R.G.S.; data curation, S.J., R.G.S., and L.K.S.; writing—original draft preparation, S.J. and R.G.S.; writing—review and editing, L.K.S. and K.A.; supervision, L.K.S.; project administration, L.K.S.; funding acquisition, L.K.S. and K.A. All authors have read and agreed to the published version of the manuscript.

Funding

This work was partially supported by JSPS KAKENHI Grant Number JP20H00392, JP20H00316, JP20K05590, and JP21H04685.

Data Availability Statement

The data presented in this study are available on request from the corresponding author.

Acknowledgments

S.J. acknowledges the Materials Science and Engineering Program, Pulchowk Campus, Institute of Engineering, Tribhuvan University, Nepal for the technical support.

Conflicts of Interest

The authors declare no conflict of interest.

References

  1. Vital, R.K.; Saibaba, K.V.N.; Shaik, K.B. Dye Removal by Adsorption: A Review. J. Bioremediat. Biodegrad. 2016, 7, 371. [Google Scholar]
  2. El-Naggar, N.E.; Rabei, N.H.; El-Malkey, S.E. Eco-Friendly Approach for Biosorption of Pb2+ and Carcinogenic Congo Red Dye from Binary Solution onto Sustainable Ulva Lactuca Biomass. Sci. Rep. 2020, 10, 16021. [Google Scholar] [CrossRef] [PubMed]
  3. Verma, R.K.; Singh, M.; Singh, S.M.; Rathod, S.N.; Rathod, N.; Singh, G.S. Eradication of Fatal Textile Industrial Dyes by Wastewater Treatment. Biointerface Res. Appl. Chem. 2020, 12, 567–587. [Google Scholar]
  4. Sintakindi, A.; Ankamwar, B. Uptake of Methylene Blue from Aqueous Solution by Naturally Grown Daedalea Africana and Phellinus Adamantinus Fungi. ACS Omega 2020, 5, 12905–12914. [Google Scholar] [CrossRef]
  5. Bayomie, O.S.; Kandeel, H.; Shoeib, T.; Yang, H.; Youssef, N.; El-Sayed, M.M.H. Novel Approach for Effective removal of methylene blue dye from water using fava bean peel waste. Sci. Rep. 2020, 10, 7824. [Google Scholar] [CrossRef]
  6. Vutskits, L.; Briner, A.; Klauser, P.; Gascon, E.; Dayer, A.G.; Kiss, J.Z.; Muller, D.; Licker, M.J.; Morel, D.R. Adverse Effects of Methylene Blue on the Central Nervous System. Anesthesiology 2008, 108, 684–692. [Google Scholar] [CrossRef] [Green Version]
  7. Chen, L.F.; Wang, H.H.; Lin, K.Y.; Kuo, J.Y.; Wang, M.K.; Liu, C.C. Removal of Methylene Blue from Aqueous Solution using Sediment Obtained from a Canal in an Industrial Park. Water Sci. Technol. 2018, 78, 556–570. [Google Scholar] [CrossRef] [Green Version]
  8. Cheng, J.; Zhan, C.; Wu, J.; Cui, Z.; Si, J.; Wang, Q.; Peng, X.; Turng, L.T. Highly Efficient Removal of Methylene Blue Dye from an Aqueous Solution using Cellulose Acetate Nanofibrous Membranes Modified by Polydopamine. ACS Omega 2020, 5, 5389–5400. [Google Scholar] [CrossRef]
  9. Noor, N.H.M.N.; Zaini, M.A.A.; Yunus, M.A.C. Isotherm and Kinetics of Methylene Blue Removal by Musa acuminata Peel Adsorbents. Acta Chemica Malaysia 2021, 5, 63–88. [Google Scholar] [CrossRef]
  10. Shrestha, P.; Jha, M.K.; Ghimire, J.; Koirala, A.R.; Shrestha, R.M.; Sharma, R.K.; Pant, B.; Park, M.; Pant, H.R. Decoration of Zinc Oxide Nanorods into the Surface of Activated Carbon Obtained from Agricultural Waste for Effective Removal of Methylene Blue Dye. Materials 2020, 13, 5667. [Google Scholar] [CrossRef]
  11. Avom, J.; Mbadcam, J.K.; Noubactep, C.; Germain, P. Adsorption of Methylene Blue from an Aqueous Solution on to Activated Carbons from Palm-Tree Cobs. Carbon 1997, 35, 365–369. [Google Scholar] [CrossRef]
  12. Nwanebu, E.O.; Liu, X.; Pajootan, E.; Yargeau, V.; Omanovic, S. Electrochemical Degradation of Methylene Blue using a Ni-Co-Oxide Anode. Catalysts 2021, 11, 793. [Google Scholar] [CrossRef]
  13. Kuang, Y.; Zhang, X.; Zhou, S. Adsorption of Methylene Blue in Water onto Activated Carbon by Surfactant Modification. Water 2020, 12, 587. [Google Scholar] [CrossRef] [Green Version]
  14. Cervantes, M.A.Y.; Aguilar-Vega, M.; Santiago-Garcia, J.L.; Pizarro, G.C.; Godoy, M.; Sánchez, J. Methylene Blue Removal from Aqueous Solutions by Sulfonated Polymeric Porous Sorbents. Desalin. Water Treat. 2020, 184, 367–374. [Google Scholar] [CrossRef]
  15. Mulushewa, Z.; Dinbore, W.T.; Yihunie Ayele, Y. Removal of methylene blue from textile waste water using kaolin and zeolite-x synthesized from Ethiopian kaolin. Environ. Anal. Health Toxicol. 2021, 36, e2021007. [Google Scholar] [CrossRef] [PubMed]
  16. Zhang, G.; Wo, R.; Sun, Z.; Hao, G.; Liu, G.; Zhang, Y.; Guo, H.; Jiang, W. Effective Magnetic MOFs Adsorbent for the Removal of Bisphenol A, Tetracycline, Congo Red and Methylene Blue Pollutions. Nanomaterials 2021, 11, 1917. [Google Scholar] [CrossRef]
  17. Shrestha, R.G.; Shrestha, L.K.; Ariga, K. Carbon Nanoarchitectonics for Energy and Related Applications. C J. Carbon Res. 2021, 7, 73. [Google Scholar] [CrossRef]
  18. Abualnaja, K.M.; Alprol, A.E.; Ashour, M.; Mansour, A.T. Influencing Multi-Walled Carbon Nanotubes for the Removal of Ismate Violet 2R Dye from Wastewater: Isotherm, Kinetics, and Thermodynamic Studies. Appl. Sci. 2021, 11, 4786. [Google Scholar] [CrossRef]
  19. Soumi Dutta, S.; Gupta, B.; Srivastava, S.K.; Gupta, A.K. Recent Advances on the Removal of Dyes from Wastewater using Various Adsorbents: A Critical Review. Mater. Adv. 2021, 2, 4497–4531. [Google Scholar] [CrossRef]
  20. Trukawka, M.; Cendrowski, K.; Peruzynska, M.; Augustyniak, A.; Nawrotek, D.M.; Mijowska, E. Carbonized Metal–Organic Frameworks with Trapped Cobalt Nanoparticles as Biocompatible and Efficient Azo-Dye Adsorbent. Environ. Sci. Eur. 2019, 31, 56. [Google Scholar] [CrossRef]
  21. Han, X.; Wang, H.; Zhang, L. Efficient Removal of Methyl Blue using Nanoporous Carbon from the Waste Biomass. Water Air Soil Pollut. 2018, 229, 26. [Google Scholar] [CrossRef]
  22. Koyuncu, F.; Güzel, F. Use of New Nanoporous Carbon Produced from Mandarin (Citrus reticulata) Industrial Processing Waste to Remove Anionic and Cationic Dyes. Sep. Sci. Technol. 2020, 56, 1–13. [Google Scholar] [CrossRef]
  23. Shi, X.; Zhang, S.; Chen, X.; Mijowska, E. Evaluation of Nanoporous Carbon Synthesized from Direct Carbonization of a Metal–Organic Complex as a Highly Effective Dye Adsorbent and Supercapacitor. Nanomaterials 2019, 9, 601. [Google Scholar] [CrossRef] [Green Version]
  24. Adhikari, M.P.; Adhikari, R.; Goswami, R.G.; Rajendran, R.; Adhikari, L.; Bairi, P.; Pradhananga, R.R.; Shrestha, L.K.; Ariga, K. Nanoporous Activated Carbons Derived from Agro-Waste Corncob for Enhanced Electrochemical and Sensing Performance. Bull. Chem. Soc. Jpn. 2015, 88, 1108–1115. [Google Scholar] [CrossRef]
  25. Singh, J.; Mishra, V. Synthesis and Characterization of Activated Carbon derived from Tectona grandis Sawdust via Green Route. Environ. Prog. Sustain. Energy 2020, 40, 13525. [Google Scholar] [CrossRef]
  26. Yakout, S.M.; Sharaf El-Deen, G. Characterization of Activated Carbon Prepared by Phosphoric Acid Activation of Olive Stones. Arab. J. Chem. 2016, 9, S1155–S1162. [Google Scholar] [CrossRef] [Green Version]
  27. Shrestha, L.K.; Shrestha, R.G.; Joshi, S.; Rajbhandari, R.; Shrestha, N.; Adhikari, M.P.; Pradhananga, R.R.; Ariga, K. Nanoarchitectonics of Nanoporous Carbon Materials from Natural Resource for Supercapacitor Applications. J. Inorg. Organomet. Polym. 2017, 27, S48–S56. [Google Scholar] [CrossRef]
  28. Kamedulski, P.; Gauden, P.A.; Lukaszewicz, J.P. Effective Synthesis of Carbon Hybrid Materials Containing Oligothiophene Dyes. Materials 2019, 12, 3354. [Google Scholar] [CrossRef] [PubMed] [Green Version]
  29. Oliveira, L.S.; Franca, A.S. Conventional and Non-Conventional Thermal of Activated Carbons from Agro-Industrial Wastes. In Activated Carbon: Classifications, Properties and Applications Processing for the Production; Kwiatkowski, J.F., Ed.; Nova Publishers: New York, NY, USA, 2011; pp. 205–238. [Google Scholar]
  30. Ahmad, A.A.; Al-Raggad, M.; Shareef, N. Production of Activated Carbon Derived from Agricultural By-Products via Microwave-Induced Chemical Activation: A Review. Carbon Lett. 2021, 31, 957–971. [Google Scholar] [CrossRef]
  31. Nguyen, H.D.; Tran, H.N.; Chao, H.-P.; Lin, C.-C. Activated Carbons Derived from teak Sawdust-Hydrochars for Efficient Removal of Methylene Blue, Copper, and Cadmium from Aqueous Solution. Water 2019, 11, 2581. [Google Scholar] [CrossRef] [Green Version]
  32. Block, I.; Günter, C.; Rodrigues, A.D.; Paasch, S.; Hesemann, P.; Taubert, A. Carbon Adsorbents from Spent Coffee for Removal of Methylene Blue and Methyl Orange from Water. Materials 2021, 14, 3996. [Google Scholar] [CrossRef]
  33. Kocaman, S. Removal of Methylene Blue Dye from Aqueous Solutions by Adsorption on Levulinic Acid-Modified Natural Shells. Int. J. Phytoremediat. 2020, 22, 885–895. [Google Scholar] [CrossRef] [PubMed]
  34. Oribayo, O.; Olaleye, O.O.; Akinyanju, A.S.; Omoloja, K.O.; Williams, S.O. Coconut Shell-Based Activated Carbon as Adsorbent for the Removal of Dye from Aqueous Solution: Equilibrium, Kinetics, and Thermodynamic Studies. Niger. J. Technol. 2020, 39, 1076–1084. [Google Scholar] [CrossRef]
  35. Abbas, M.; Trari, M. Removal of Methylene Blue in Aqueous Solution by Economic Adsorbent Derived from Apricot Stone Activated Carbon. Fibers Polym. 2020, 21, 810–820. [Google Scholar] [CrossRef]
  36. Thang, N.H.; Khang, D.K.; Hai, T.D.; Nga, D.T.; Tuan, P.D. Methylene blue adsorption mechanism of activated carbon synthesised from cashew nut shells. RSC Adv. 2021, 11, 26563–26570. [Google Scholar] [CrossRef]
  37. Patel, R.K.; Prasad, R.; Shankar, R.; Khare, P.; Yadav, M. Adsorptive Removal of Methylene Blue Dye from Soapnut Shell & Pineapple Waste Derived Activated Carbon. Int. J. Eng. Sci. Technol. 2021, 13, 81–87. [Google Scholar]
  38. Yallappa, S.; Shivakumar, M.; Nagashree, K.L.; Dharmaprakash, M.S.; Vinu, A.; Hegde, G. Electrochemical Determination of Nitrite Using Catalyst Free Mesoporous Carbon Nanoparticles from Bio Renewable Areca nut seeds. J. Electrochem. Soc. 2018, 165, 614–619. [Google Scholar] [CrossRef]
  39. Tabassum, M.; Bardhan, M.; Novera, T.M.; Islam, M.A.; Jawad, A.H.; Islam, M.A. NaOH-Activated Betel Nut Husk Hydrochar for Efficient Adsorption of Methylene Blue Dye. Water Air Soil Pollut. 2020, 231, 398. [Google Scholar] [CrossRef]
  40. Bardhan, M.; Novera, T.M.; Tabassum, M.; Islam, M.A.; Jawad, A.H.; Islam, M.A. Adsorption of Methylene Blue onto Betel Nut Husk-Based Activated Carbon Prepared by Sodium Hydroxide Activation Process. Water Sci. Technol. 2020, 82, 1932–1949. [Google Scholar] [CrossRef] [PubMed]
  41. Sundaram, M.M.; Sivakumar, S. Effective Role of Areca Nut Shell Carbon and Cashew Nut Shell Carbon in the Removal of Congo Red Dye for The Application Towards Effluent Treatment. Indian J. Environ. Prot. 2013, 33, 546–553. [Google Scholar]
  42. Gopalswami, P.; Sivakumar, N.; Ponnuswamy, S.; Venkateswaren, V.; Kavitha, G. Adsorption of Direct Dye Onto Activated Carbon Prepared From Areca Nut Pod-An Agricultural Waste. J. Environ. Sci. Eng. 2010, 52, 367–372. [Google Scholar] [PubMed]
  43. Cleiton, N.A.; Guerreiro, M.C. Estimation of Surface Area and Pore Volume of Activated Carbons by Methylene Blue and Iodine Numbers. Quim. Nova 2011, 34, 472–476. [Google Scholar]
  44. ASTM International. Annual Book of ASTM Standards, Standard Test Method for Determination of Iodine Number of Activated Carbon, ASTM D4607-94; ASTM International: Philadelphia, PA, USA, 2006. [Google Scholar]
  45. Raposo, F.; Rubia, M.A.D.L.; Borja, R. Methylene Blue Number as Useful Indicator to Evaluate the Adsorptive Capacity of Granular Activated Carbon in Batch Mode: Influence of Adsorbate/Adsorbent Mass Ratio and Particle Size. J. Hazard. Mater. 2009, 165, 291–299. [Google Scholar] [CrossRef] [PubMed]
  46. Bamgbola, A.A.; Adeyemi, O.O.; Olubomehin, O.O.; Akinlabi, A.K.; Sojinu, O.S.; Iwuchukwu, P.O. Isolation and Characterization of Cellulose From Cashew (Anacardium occidentale L.) Nut Shells. Curr. Res. Green Sustain. Chem. 2020, 3, 100032. [Google Scholar] [CrossRef]
  47. Maji, S.; Chaudhary, R.; Shrestha, R.G.; Shrestha, R.L.; Demir, B.; Searles, D.J.; Hill, J.P.; Yamauchi, Y.; Ariga, K.; Shrestha, L.K. High-Performance Supercapacitor Materials based on Hierarchically Porous Carbons derived from Artocarpus Heterophyllus Seed. ACS Appl. Energy Mater. 2021, 4, 12257–12266. [Google Scholar] [CrossRef]
  48. Salim, R.M.; Asik, J.; Sarjadi, M.S. Chemical Functional Groups of Extractives, Cellulose and Lignin Extracted from Native Leucaena leucocephala Bark. Wood Sci. Technol. 2021, 55, 295–313. [Google Scholar] [CrossRef]
  49. Zakaria, R.; Jamalluddin, N.A.; Bakar, M.Z.A. Effect of Impregnation Ratio and Activation Temperature on the Yield and Adsorption Performance of Mangrove Based Activated Carbon for Methylene Blue Removal. Results Mater. 2021, 10, 100183. [Google Scholar] [CrossRef]
  50. Zhou, J.; Luo, A.; Zhao, Y. Preparation and Characterization of Activated Carbon from Waste Tea by Physical Activation Using Steam. J. Air Waste Manag. Assoc. 2018, 68, 12. [Google Scholar] [CrossRef]
  51. Kayiwa, R.; Kasedde, H.; Lubwama, M.; Kirabira, J.B. Mesoporous Activated Carbon Yielded from Pre-Leached Cassava Peels. Bioresour. Bioprocess. 2021, 8, 53. [Google Scholar] [CrossRef]
  52. Joshi, S.; Shrestha, L.K.; Kamachi, Y.; Yamauchi, Y.; Pradhananga, M.A.; Pokharel, B.P.; Ariga, K.; Pradhananga, R.R. Sodium Hydroxide Activated Nanoporous Carbon Based on Lapsi Seed Stone. J. Nanosci. Nanotechnol. 2015, 15, 1465–1472. [Google Scholar] [CrossRef]
  53. Ma, X.; Li, S.; Hessel, V.; Lin, L.; Meskers, S.; Fausto Gallucci, F. Synthesis of Luminescent Carbon Quantum Dots by Microplasma Process. Chem. Eng. Process. Process Intensif. 2019, 140, 29–35. [Google Scholar] [CrossRef]
  54. Han, S.A.; Lee, J.; Shim, K.; Lin, J.; Shahabuddin, M.; Lee, J.-W.; Kim, S.-W.; Park, M.-S.; Kim, J.H. Strategically Designed Zeolitic Imidazolate Frameworks for Controlling the Degree of Graphitization. Bull. Chem. Soc. Jpn. 2018, 91, 1474–1480. [Google Scholar] [CrossRef] [Green Version]
  55. Qutaish, H.; Lee, J.; Hyeon, Y.; Han, S.A.; Lee, I.-H.; Heo, Y.-U.; Whang, D.; Moon, J.; Park, M.-S.; Kim, J.H. Design of Cobalt Catalysed Carbon Nanotubes in Bimetallic Zeolitic Imidazolate Frameworks. Appl. Surface Sci. 2021, 547, 149134. [Google Scholar] [CrossRef]
  56. Shrestha, L.K.; Adhikari, L.; Shrestha, R.G.; Adhikari, M.P.; Ahikari, R.; Hill, J.P.; Pradhananga, R.R.; Ariga, K. Nanoporous Carbon Materials with Enhanced Supercapacitance Performance and Non-Aromatic Chemical Sensing With C1/C2 Alcohol Discrimination. Sci. Technol. Adv. Mater. 2016, 17, 483–492. [Google Scholar] [CrossRef] [PubMed] [Green Version]
  57. Shrestha, L.K.; Thapa, M.; Shrestha, R.G.; Maji, S.; Pradhananga, R.R.; Ariga, K. Rice-Husk-Derived High Surface Area Nanoporous Carbon Materials with Excellent Iodine and Methylene Blue Adsorption. C J. Carbon Res. 2019, 5, 10. [Google Scholar] [CrossRef] [Green Version]
  58. Joshi, S.; Bishnu, K.C. Synthesis and Characterization of Sugarcane Bagasse Based Activated Carbon: Effect of Impregnation Ratio of ZnCl2. J. Nepal Chem. Soc. 2020, 41, 74–79. [Google Scholar] [CrossRef]
  59. Mashkoor, F.; Khan, M.A.; Nasar, A. Fast and Effective Confiscation of Methylene Blue Dye from Aqueous Medium by Luffa Aegyptiaca Peel. Curr. Anal. Chem. 2021, 17, 947–956. [Google Scholar] [CrossRef]
  60. Wong, S.; Ghafar, N.A.; Ngadi, N.; Razmi, F.A.; Inuwa, I.M.; Mat, R.; Amin, N.A.S. Effective Removal of Anionic Textile Dyes Using Adsorbent Synthesized from Coffee Waste. Sci. Rep. 2020, 10, 2928. [Google Scholar] [CrossRef] [PubMed] [Green Version]
  61. Yusop, M.F.M.; Ahmad, M.A.; Rosli, N.A.; Manaf, M.E.A. Adsorption of Cationic Methylene Blue Dye Using Microwave-Assisted Activated Carbon Derived from Acacia Wood: Optimization and Batch Studies. Arab. J. Chem. 2021, 14, 1878–5352. [Google Scholar] [CrossRef]
  62. Wang, Y.; Pan, J.; Lia, Y.; Zhang, P.; Li, M.; Zheng, H.; Zhang, X.; Li, H.; Du, Q. Methylene Blue Adsorption by Activated Carbon, Nickel Alginate/Activated Carbon Aerogel, and Nickel Alginate/Graphene Oxide Aerogel: A Comparison Study. J. Mater. Res. Technol. 2020, 9, 12443–12460. [Google Scholar] [CrossRef]
  63. Baloo, L.; Isa, M.H.; Sapari, N.B.; Jagaba, A.H.; Wei, L.J.; Yavari, S.; Razali, R.; Vasu, R.; Vasu; R. Adsorptive Removal of Methylene Blue and Acid Orange 10 Dyes from Aqueous Solutions Using Oil Palm Wastes-Derived Activated Carbons. Alex. Eng. J. 2021, 60, 5611–5629. [Google Scholar] [CrossRef]
  64. Abdel-Gawad, S.A.; Abd El-Aziz, H.M. Removal of Pharmaceuticals from Aqueous Medium Using Entrapped Activated Carbon in Alginate. Air Soil Water Res. 2020, 12, 1–7. [Google Scholar] [CrossRef]
  65. Utsev, J.T.; Iwar, R.T.; Ifyalem, K.J. Adsorption of Methylene Blue from Aqueous Solution Onto Delonix Regia Pod Activated Carbon: Batch Equilibrium Isotherm, Kinetic and Thermodynamic Studies. J. Mater. Environ. Sci. 2020, 11, 1058–1078. [Google Scholar]
  66. Gao, J.-J.; Qin, Y.-B.; Zhou, T.; Cao, D.-D.; Xu, P.; Hochstetter, D.; Wang, Y.-F. Adsorption of Methylene Blue onto Activated Carbon Produced from Tea (Camellia Sinensis L.) Seed Shells: Kinetics, Equilibrium, and Thermodynamics Studies. J. Zhejiang Univ. Sci. B 2013, 14, 650–658. [Google Scholar] [CrossRef] [PubMed] [Green Version]
  67. Patawat, C.; Silakate, K.; Chuan-Udom, S.; Supanchaiyamat, N.; Hunt, A.J.; Yuvarat Ngernyene, Y. Preparation of Activated Carbon from Dipterocarpus Alatus Fruit And its Application for Methylene Blue Adsorption. RSC Adv. 2020, 10, 21082–22109. [Google Scholar] [CrossRef]
  68. Jawad, A.H.; Abdulhameed, A.S. Statistical Modeling of Methylene Blue Dye Adsorption by High Surface Area Mesoporous Activated Carbon from Bamboo Chip Using KOH-Assisted Thermal Activation. Energy Ecol. Environ. 2020, 5, 456–469. [Google Scholar] [CrossRef]
  69. Ahsaine, H.A.; Anfar, Z.; Zbair, M.; Ezahri, M.; Alem, N.E. Adsorptive Removal of Methylene Blue and Crystal Violet onto Micro-Mesoporous Zr3O/Activated Carbon Composite: A Joint Experimental and Statistical Modeling Considerations. J. Chem. 2018, 2018, 6982014. [Google Scholar] [CrossRef] [Green Version]
Figure 1. (a) TGA curve of ANP. (b) Corresponding FTIR spectrum.
Carbon 08 00002 g001
Figure 2. The effects of carbonization conditions on the yield (%) of ANC: (a) yield vs. H3PO4 impregnation ratio; (b) yield vs. carbonization time; (c) yield vs. carbonization temperature.
Carbon 08 00002 g002
Figure 3. (a) XRD patterns; (b) Raman scattering; (c) FTIR spectra of ANP derived nanoporous carbon materials.
Carbon 08 00002 g003
Figure 4. Electron microscopy observation of the ANCs. (a) SEM image; (b) high-resolution SEM image, (ce) TEM images at different magnifications, and (f) HR-TEM image.
Carbon 08 00002 g004
Figure 5. (a) Nitrogen sorption isotherms of ANP-derived ANCs (ANC0.25_400_3h, ANC0.5_400_3h, ANC1_400_3h, ANC1.5_400_3h, ANC1_400_2h, ANC1_400_4h, ANC1_300_3h, and ANC1_500_3h). (b) Pore size distribution profiles (DFT method). (c) Corresponding pore size distribution curves obtained from the BJH method.
Carbon 08 00002 g005
Figure 6. The effect of carbonization conditions on the specific surface area, iodine, and methylene blue adsorptions. (a) Results of mixing ratio of H3PO4; (b) carbonization time; (c) carbonization temperature.
Carbon 08 00002 g006
Figure 7. Effects of adsorption parameters on the MB adsorption on ANC1_400-3h: (a) contact time; (b) adsorbent dose; (c) pH; and (d) initial concentration.
Carbon 08 00002 g007
Figure 8. The adsorption isotherms. (a) Langmuir adsorption and (b) Freundlich adsorption model for the MB adsorption on the ANC1_400-3h at 25 °C.
Carbon 08 00002 g008
Table 1. Surface textural properties of ANCs obtained from nitrogen sorption analysis.
SampleSSA (m2 g−1)Smic (m2 g−1)Vp (cm3 g−1)Vmic (cm3 g−1)Vmeso/Vp × 100 (%)Wp (nm)Dp (nm)
ANC0.25_400_3h1399.91008.81.4640.92536.810.7043.67
ANC0.5_400_3h1705.01124.72.0881.25739.790.7053.68
ANC1_400_3h2132.11320.83.4261.92043.950.7053.29
ANC1.5_400_3h1945.21219.33.1521.79143.170.7053.30
ANC1_400_2h1970.41278.12.6431.56340.860.7043.67
ANC1_400_4h1781.31187.52.3331.39340.290.7053.68
ANC1_300_3h1156.1903.41.1120.70936.240.2863.66
ANC1_500_3h1934.81217.42.8781.63543.180.7053.49
SSA, specific surface area; Smic, micropore surface area; Vp, total pore volume; Vmic, micropore volume; Vmeso, mesopore volume; Wp, average half pore width; and Dp, average mesopore diameter.
Table 2. Comparison of maximum adsorption capacity of Areca catechu Nut carbon with activated carbon materials prepared from other carbon sources.
Carbon Sourceqm (mg g−1)Ref.
Delonix regia Pod175.4[65]
Coconut shell320.5[34]
Tea seed shells324.7[66]
Dipterocarpus alatus fruit269.3[67]
Bamboo305.3[68]
Almond shell/Zr3O Composites208.3[69]
Areca catechu Nut333.3This work
Publisher’s Note: MDPI stays neutral with regard to jurisdictional claims in published maps and institutional affiliations.

