Article

The Performance of Fibrous CDC Electrodes in Aqueous and Non-Aqueous Electrolytes

1
Department of Materials and Environmental Technology, Tallinn University of Technology, Ehitajate tee 5, 19086 Tallinn, Estonia
2
Skeleton Technologies OÜ, Valukoja 8, 11415 Tallinn, Estonia
3
Institute of Chemistry, University of Tartu, Ravila 14a, 50411 Tartu, Estonia
*
Author to whom correspondence should be addressed.
Submission received: 19 April 2021 / Revised: 11 May 2021 / Accepted: 12 May 2021 / Published: 14 May 2021
(This article belongs to the Special Issue Carbon Based Electrochemical Devices)

Abstract

:
The aim of this study was to investigate the electrochemical behaviour of aqueous electrolytes on thin-layer (20 µm) nanoporous carbide-derived carbon (CDC) composite fibrous directly electrospun electrodes without further carbonisation. There have been previously investigated fibrous electrodes, which are produced by applying different post-treatment processes, however this makes the production of fibrous electrodes more expensive, complex and time consuming. Furthermore, in the present study high specific capacitance was achieved with directly electrospun nanoporous CDC-based fibrous electrodes in different neutral aqueous electrolytes. The benefit of fibrous electrodes is the advanced mechanical properties compared to the existing commercial electrode technologies based on pressure-rolled or slurry-cast powder mix electrodes. Such improved mechanical properties are preferred in more demanding applications, such as in the space industry. Electrospinning technology also allows for larger electrode production capacities without increased production costs. In addition to the influence of aqueous electrolyte chemical composition, the salt concentration effects and cycle stability with respect to organic electrolytes are investigated. Cyclic voltammetry (CV) measurements on electrospun electrodes showed the highest capacitance for asymmetrical cells with an aqueous 1 M NaNO3-H2O electrolyte. High CV capacitance was correlated with constant current charge–discharge (CC) data, for which a specific capacitance of 191 F g−1 for the positively charged electrode and 311 F g−1 for the negatively charged electrode was achieved. The investigation of electrolyte salt concentration on fibrous electrodes revealed the typical capacitance dependence on ionic conductivity with a peak capacitance at medium concentration levels. The cycle-life measurements of selected two-electrode test cells with aqueous and non-aqueous electrolytes revealed good stability of the electrospun electrodes.

1. Introduction

With the need to decrease CO2 emissions, enormous effort has been put into the development of electrochemical energy storage devices such as batteries, fuel cells, and supercapacitors, supporting the shift to more extensive incorporation of renewable energy sources. Supercapacitors, also called electrical double layer capacitors (EDLCs), are energy storage devices with high power density and long cycle stability [1,2,3]. From the application requirements perspective, supercapacitors bridge the gap between lithium-ion batteries and electrolytic capacitors [4]. EDLCs are mostly attractive for further development due to their possible use as load levelling devices in renewable energy technology [5] and to further enhance electrical vehicle performance [6,7,8].
The energy storage mechanism of supercapacitors relies on the electrochemical double layer (EDL), which forms between the electrode material and the electrolyte [9,10,11]. Liquid electrolytes can typically be classified as non-aqueous, aqueous and ionic liquids (ILs) [12]. In general, the requirements for an ideal electrolyte are high ionic conductivity, chemical and electrochemical stability (wide potential window), wide operating temperature range, low volatility and flammability, environmental friendliness, and feasible cost at scale [13]. However, in real applications, few of the parameters often need to be compromised. The specific performance of an EDL depends on the interactions between the carbon with a high surface area and the electrolyte ions [4,14,15,16]. Therefore, it is important that the properties of the electrolyte meet the demands from the pore structure of the carbon.
The effect of various aqueous electrolytes has been extensively studied with various carbon powder composite electrodes [17,18,19]. A few studies have been performed with fibrous electrodes [20] or electrospun carbon-containing electrodes [21] in aqueous electrolytes but, to our knowledge, no studies have directly electrospun fibrous electrodes of CDCs. The most fundamental studies have been performed with H2SO4-H2O and KOH-H2O electrolytes, but these electrolytes are corrosive and have a working voltage range up to 1.0 V [22,23,24]. Therefore, neutral aqueous solutions such as Li2SO4-H2O, Na2SO4-H2O and K2SO4-H2O are preferred to avoid the harmful effects of acidic and alkaline environments [22]. Furthermore, the activated carbons were tested for operating voltages up to 1.6 V in symmetrical cells of aqueous Na2SO4-H2O and long-term stability (<10,000 cycles) [22,25].
To achieve high EDL capacitance, the size of the electrolyte ions must correspond to the pore size of carbon [26]. Cai et al. showed the effects of anions and cations with graphene-based nanocomposite electrodes, where 0.5 M aqueous solutions of sodium salts displayed a specific capacity of the SO42− anion that was 21% higher than that of the NO3 anions [27]. In monovalent cation electrolytes, the specific capacitance increases under the influence of the corresponding cationic radius. In common aqueous electrolyte solutions, the ionic radii of cations decrease as follows: Li+ > Na+ > K+ (0.69, 1.2 and 1.5 Å, respectively) [27,28,29].
Electrospinning is a versatile fibre forming process for generating ultra-fine fibres from different materials, such as polymers, ceramics and composites [30]. Electrospun fibres can be used in many applications, such as filtering materials [31,32], sensors [33] or energy storage [34]. In the case of energy storage, electrospun fibrous electrodes have been mainly used with a combination of post-treatment processes [35,36] or with a multi-step electrospinning method [37]. The benefit of directly electrospun nanofibres is the simplicity of the process, as it does not include any post-treatment methods, such as pyrolysis and thermal treatment. Such post-treatments have been proven to be effective in eliminating the negative performance impacts of the relatively high content of non-capacitive polymer in the spun layer matrix, which is necessary for efficient fibre formation [37,38]. However, the carbonisation process itself is destructive to the fibrous structure, which in turn decreases the mechanical durability and certainly has a relatively high cost impact from a large-scale production point of view.
Our research group has previously shown that the advanced mechanical durability and flexibility of electrospun electrodes is related to their fibrous structure [38]. Furthermore, despite the relatively high polymer content, the capacitance per carbon contained remains almost constant compared to tape-casted and rolled pressed (PTFE) technologies [39].
In our previous work, electrospun carbide-derived carbon (CDC) nanofibre electrodes were studied with a focus on non-aqueous electrolytes, out of which the best performance was achieved in combination with 1.5 M spiro-(1,1′)-bipyrrolidinium tetrafluoroborate in acetonitrile (SBP-BF4-ACN), with a potential window of 3.0 V and gravimetric capacitance of 95.3 F g−1 and 78.5 F g−1 for positively and negatively charged electrodes, respectively [39,40]. The advantages of applying non-aqueous electrolytes are a wider operative temperature range and wide potential stability range, leading to a higher energy density than aqueous electrolytes [4,12,26,41,42]. Thus, the major drawback of aqueous electrolytes is the lower operative voltage, which is limited by the water decomposition voltage of 1.23 V [4,12,43,44,45]. However, the benefit of using aqueous electrolytes comes from low cost [45,46], environmental friendliness, [13,41] and higher ionic conductivity [13], leading to low resistance and superior power performance [3,41,44].
Therefore, goal of this study is to investigate the effect of aqueous electrolytes on the EDL capacitance, resistance and cyclability of electrospun fibrous CDC-based electrodes. The specific effects of cations and anions in aqueous solutions are evaluated in a three-electrode system configuration, and the cycle-life performance of both aqueous and non-aqueous electrolytes is studied in two-electrode systems.
The stability during charge–discharge cycling of post-treated fibrous electrodes in aqueous media has been tested by Stojanovska et al., where stable performance was achieved for more than 1000 cycles [47]. Furthermore, T. He et al. showed good cycle stability and a high capacitance retention of ~99.3% after 1000 cycles of polyacrylonitrile/polyvinyl-pyrrolidone electrospun composite fibres in an IL-based electrolyte in 1-butyl-3-methylimidazolium hexafluorophosphate [36]. Compared to fibrous electrodes, activated carbon-based cast electrodes have also shown long and stable cycle stability in aqueous and non-aqueous electrolytes [25,48,49]. In addition, L. Demarconnay et al. showed stable cycle stability up to 10,000 cycles at different voltage limits with cast electrodes in a 0.5 M aqueous Na2SO4-H2O system [25]. However, the effect of different electrolytes on the cycle-life performance of directly electrospun electrodes has not been studied to our knowledge.

2. Experimental Section

2.1. Materials and Processes

The electrodes for electrochemical analysis of cation and anion influence on EDL performance in aqueous electrolytes were prepared by the electrospinning method, according to a similar electrode process and recipe from our previous studies [39,40]. The carbide-derived carbon active material was purchased from Skeleton Technologies OÜ (Tallinn, Estonia). Titanium carbide was converted to porous CDC carbon by applying Cl2 treatment at 900 °C. A hydrogen gas purification step at 800 °C was applied to remove residues of chlorine in the converted CDC. The CDC material initial particle size was 1–5 µm, which was further milled to reduce the size of particles to ~100 nanometres. The detailed milling procedure is described in our previous work [40] and more detailed carbon surface chemistry is discussed by M. Käärik et al. [15] The resulting milled CDC particles were mixed with a carbon conductive additive (Super C, Timcal, Deutschland GmbH, Düsseldorf, Germany) at a ratio of 80/20 (wt %). The carbon mixture was sonicated in dimethylformamide (DMF, Sigma Aldrich, Tartu, Estonia) for 2 h. After sonication, mechanical stirring was applied for another 24 h at 40 °C, after which polyacrylonitrile (PAN, Sigma Aldrich, Tartu, Estonia Mw = 150,000 g mol−1) was added to the solution at 7% weight, and the solution was stirred for an additional 24 h at 40 °C. The weight ratio of polymer to total mass of carbon was 50/50 in the solution. Finally, 15% by weight of 1-ethyl-3-methylimidazolium tetrafluoroborate (EMIm-BF4, Sigma Aldrich, Tartu, Estonia, purity ≥ 99.9%) ionic liquid (IL) was added to the electrospinning solution and stirred for 0.5 h before the electrospinning process was initiated. The addition of IL is necessary to increase the conductivity of the solution for a stable electrospinning process. The electrospinning parameters were set as constant: solution pumping rate of 0.5 mL h−1, applied DC voltage of 15 kV, and a distance between spinneret and rotating drum of 8 cm. After electrospinning, the fibrous electrodes were mechanically compressed by a hydraulic static press (Scamia) to achieve better electrical contacts between the fibres. The morphology of the CDC-based fibrous electrode was evaluated by scanning electron microscopy (SEM, Gemini Zeiss Ultra 55, Graz, Austria), as shown in Figure 1.
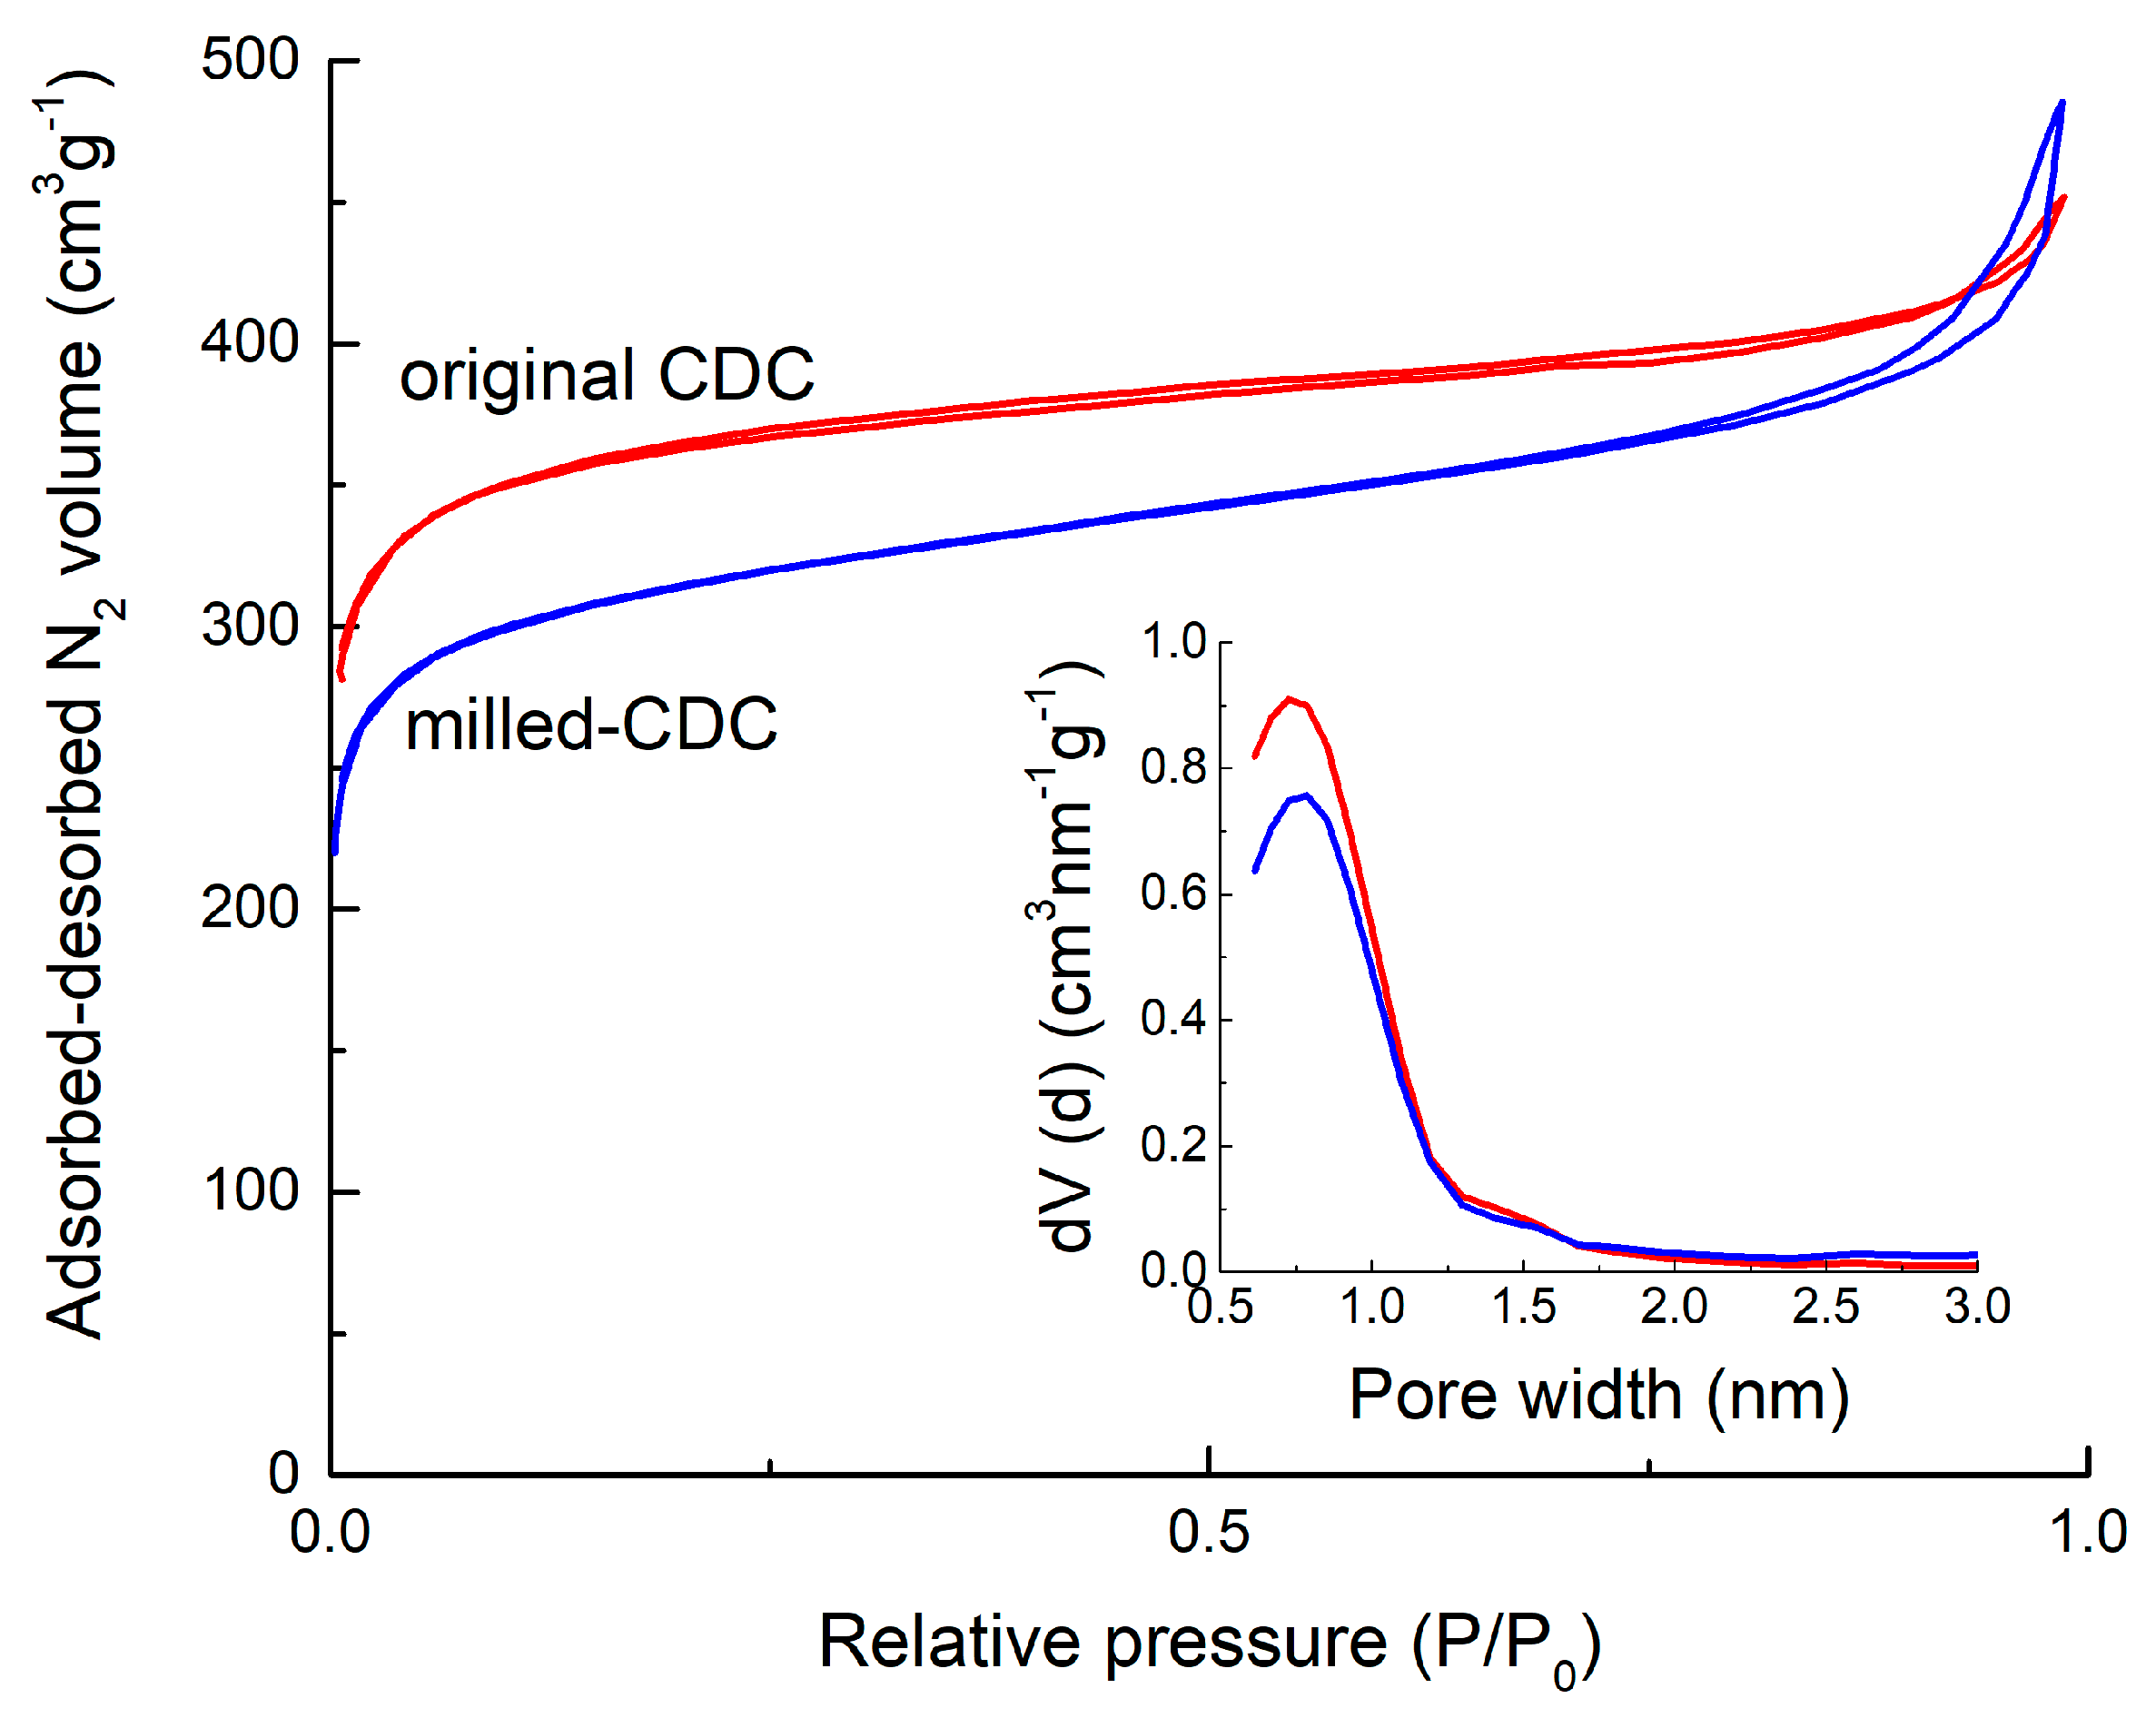
The porosity characteristics of the CDC powder before and after milling and of the electrospun electrode were determined from the N2 adsorption method at −196 °C using the NOVA touch LX2 (Quantachrome Instruments, Boynton Beach, FL, USA). Before gas adsorption measurement, the carbon samples were dried for 12 h under a vacuum at 300 °C, and the electrode sample was dried at 100 °C to avoid strongly exceeding the glass transition temperature of PAN. The Brunauer–Emmmet–Teller surface area (SBET) was calculated from N2 adsorption data according to BET theory [50] at a pressure interval P/P0 of 0.02–0.2, and the total pore volume (Vtot) was calculated at a P/P0 of 0.97. Calculations of the pore size distribution (PSD), micropore volume (Vµ) and specific surface area (Sdft) were performed by using the quenched solid density functional theory (QSDFT) equilibria model for slit-type pores. The N2 adsorption–desorption isotherms are shown in Figure 2, and the porosity characteristics are presented in Table 1. The isotherms of CDCs appear as Type I, corresponding to microporous materials [51]. One can see from the porosity analysis that both the specific surface area of carbon and the amount of micropores slightly decreased during the milling process.
The thermal stability of the electrode was evaluated by thermal gravimetric analysis (Labsys EVO TG DTA 1600 °C, Ankara, Turkey). The temperature increase rate was set to 5 °C min−1, and the sample was heated to 600 °C. The start of degradation of the electrode was observed at ~250 °C.
The mechanical properties of the electrospun CDC-based fibrous electrodes were evaluated by an Instron 5866 (Norwood, MA, USA) tensile testing machine. For optimal mechanical properties, morphology, and capacitance (tested after the stress test), a specific stress of 2.32 × 10⁻⁴ N TEX−1 was determined. More detailed porosity analysis, TGA and mechanical strength analysis can be found in our previous works [38,39,40].
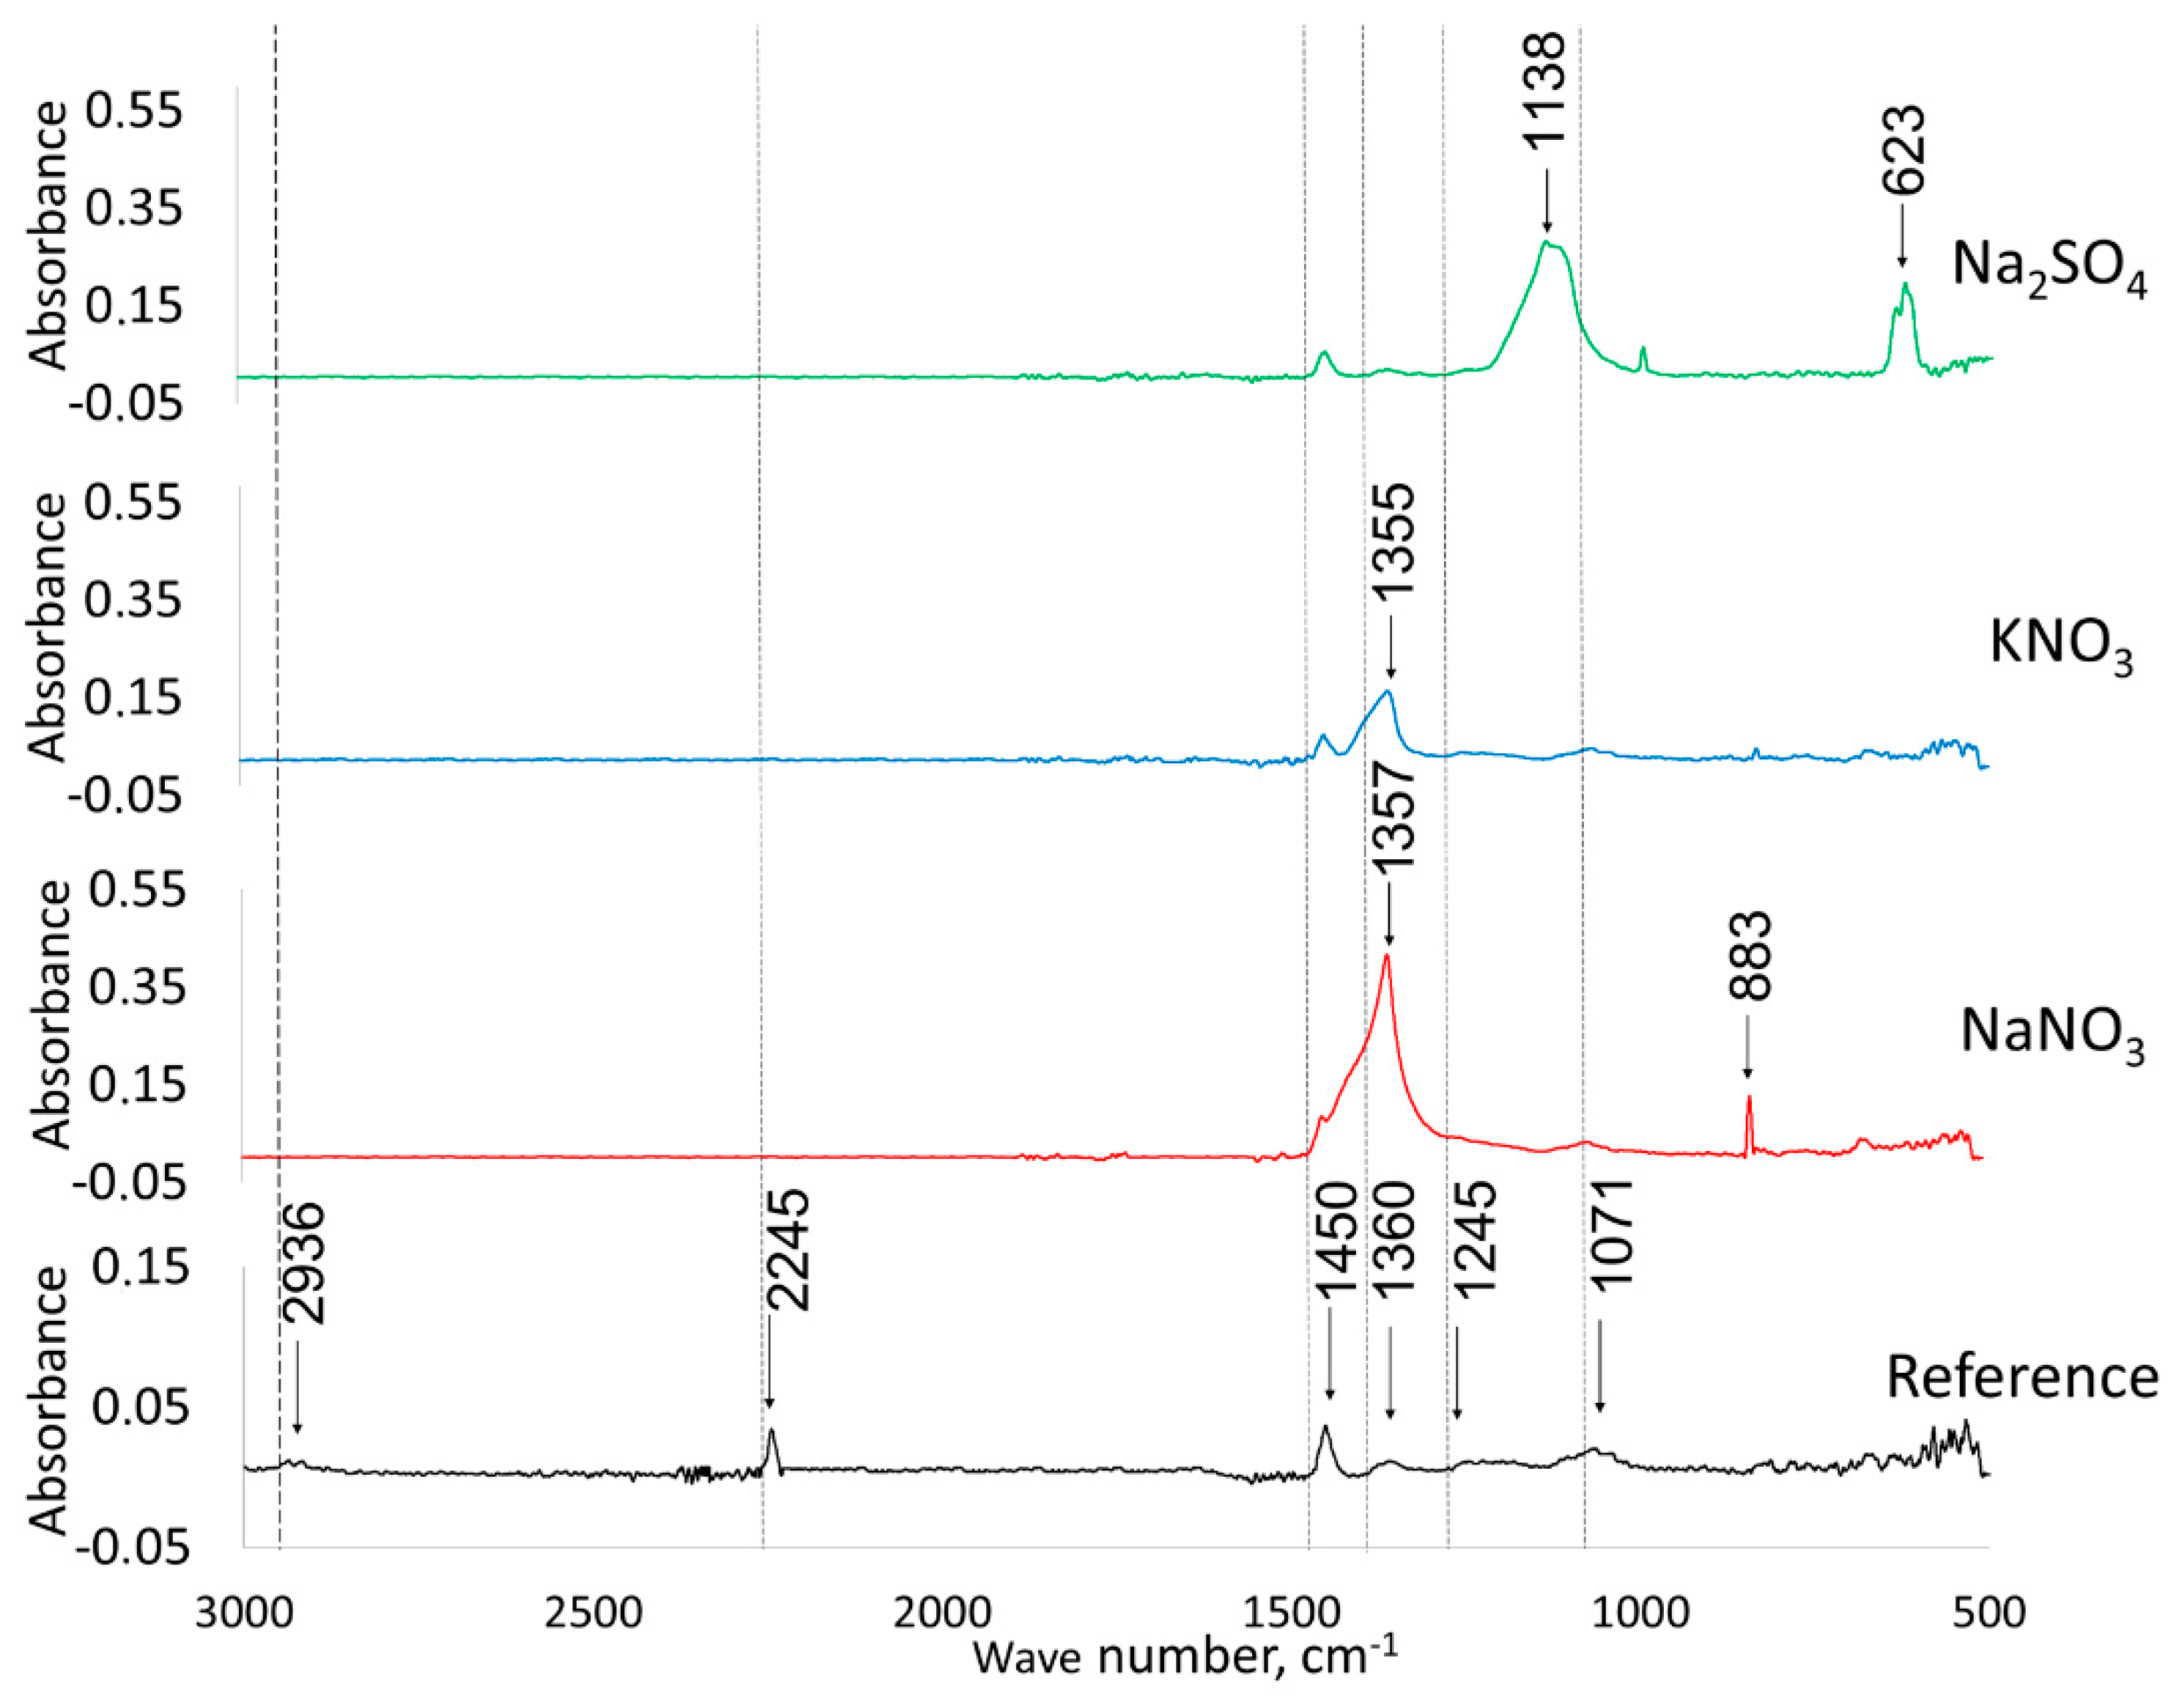
The intermolecular interactions within the nanofibrous mats treated with Na2SO4-H2O, NaNO3-H2O and KNO3-H2O aqueous electrolytes were analysed by Fourier transform infrared spectroscopy (FTIR). FTIR spectra obtained by means of Interspec 200-X (Tartu, Estonia) instrument with attenuated total reflection (ATR) unit. A wavenumber range a 400–4000 cm−1 with a 0.5 cm−1 resolution was used. IR absorption spectra show significant stability of electrospun PAN fibres in electrolytes and strong absorption of anions on the fibre surface. The measured FTIR spectra are presented in Figure 3. To analyse the influence of electrolytes on the intermolecular interactions of PAN/DMF fibres, electrospun samples were kept in the electrolytes for 48 h and thereafter washed with distilled water to remove the salt residues. Afterwards, the samples were dried under a vacuum at 95 °C for 24 h. The reference data in Figure 3 show the peaks of pure electrospun PAN fibre. Bands attributed to main chain groups, C-C stretching vibrations (1245 cm−1), C-H symmetric vibrations (2936 cm−1 and 1360 cm−1), and in- and out-of-plane bending vibrations (1450 cm−1 and 1071 cm−1, respectively), demonstrate neither polymer decomposition nor macromolecular structure changes after exposure to the electrolyte [52,53,54,55]. The most common PAN undergoes hydrolysis and thermal oxidation in the dissolved state. However, no corresponding peaks were observed. Furthermore, the absorption band of the nitrile side group (C≡N, 2245 cm−1) shows no significant change in intensity or peak area, which means no hydrogen bond formation between the nitrogen atom of the nitrile group and anions, NO3 or SO42−, was observed. At the same time, peaks corresponding to the above-mentioned anions were present in the spectra of PAN electrodes exposed to the electrolyte. For nitrate-based electrolytes, a strong peak at 1356 cm−1 and a small peak at 835 cm−1 were observed, corresponding to asymmetric and symmetric stretching of the NO3 group, respectively [53]. For the sulphate-based electrolyte, the peaks were located at 1123 cm−1 and 615 cm−1, indicating asymmetric stretching of SO42− groups [54]. This can be explained by the absorption of salt anions via electrostatic interactions with dipoles formed on the fibre surface by the -C≡N group of PAN [56]. Thus, one could conclude the chemical stability of electrospun fibres in the studied electrolytes together with the ability to absorb anions on the fibre surface.
Two- and three-electrode test cells were used for electrochemical testing. Electrospun fibrous mats with a coating weight of 1.86 g m−2 were used in all experimental cells. A working electrode (WE) with a diameter of 6 mm was cut for the 3-electrode cells, and identical electrodes of 15 mm diameter were cut for the 2-electrode set-up. For 3-electrode systems, a 15 mm diameter counter electrode (CE) and Ag|AgCl (3.5 M KCl) reference electrode (RE) were used. Prior to cell assembly, the cut electrodes were dried in a vacuum oven at 100 °C for 24 h. The electrodes were then contacted with gold current collectors in electrochemical test cells. The WE and CE were interleaved by a 1 mm thick glass fibre separator membrane (purchased from VWR, Dresden, Germany). The 2-electrode test cells applied a cellulosic separator (purchased Nippon Kodoshi, Kochi, Japan).
Three aqueous electrolyte solutions from different salts—NaNO3-H2O (Lach-Ner, Neratovice, Czech Republic), KNO3-H2O (Sigma-Aldrich, Tartu, Estonia) and Na2SO4-H2O (Sigma-Aldrich, Tartu, Estonia)—were prepared to study the EDLC of CDC-based electrospun fibrous electrodes. For the analysis of the electrolyte ionic composition effect, the concentration of the electrolyte solutions was kept constant at 1.0 M. To additionally investigate the effect of electrolyte concentration on the capacitance and resistance, the NaNO3-based electrolyte concentration was altered from 0.2 M to 5.0 M. The electrolyte conductivity was measured at room temperature with a Benchtop conductivity metre (SevenCompactTM S230, Columbus, OH, USA). Electrolyte pH was measured by a standard Ag|AgCl double junction pH combination electrode (Sigma-Aldrich, Tartu, Estonia). The physical parameters of the selected salts and electrolyte solutions are presented in Table 2.
The 3-electrode studies were conducted with all electrolyte alternatives, while 2-electrode stability studies were performed with two aqueous and two organic electrolytes: 1 M NaNO3-H2O, 1 M KNO3-H2O, and 1.5 M 1-ethyl-3-methylimidazolium-bis (trifluoromethyl sulfonyl) imide in acetonitrile (EMIm-TFSI-ACN) and SBP-BF4-ACN. The selection of aqueous electrolytes for cycle life analysis was based on the results of 3-electrode cells. The choice of organic electrolytes was made based on the results of our previous work, where the maximum potential window of dU ≤ 3.5 V was determined in 1.5 M EMIm-TFSI-ACN, showing an identical gravimetric capacitance of 89.8 F g−1 for positively and negatively charged electrodes. Second, the largest potential window of 3.0 V was reached in 1.5 M SBP-BF4-ACN-type quaternary ammonium salt-based electrolytes, with a gravimetric capacitance of 95.3 F g−1 and 78.5 F g−1 for positively and negatively charged electrodes, respectively [16].

2.2. Electrochemical Evaluation Methods

Cyclic voltammetry (CV), constant current cycling (CC) and electrochemical impedance spectroscopy (EIS) tests were performed to electrochemically evaluate the electrospun fibrous electrodes. All electrochemical measurements were performed at room temperature with Gamry Interface 1010 E equipment (Warminster, PA, USA).
CV plots were obtained from 3-electrode measurements in the potential range of +0.6 V to −0.7 V (vs. AgIAgCl RE) at potential scan rates of 200 to 5 mV s−1. The capacitance was calculated by dividing the measured current i by the applied potential scan rate v, according to Equation (1):
C = i v
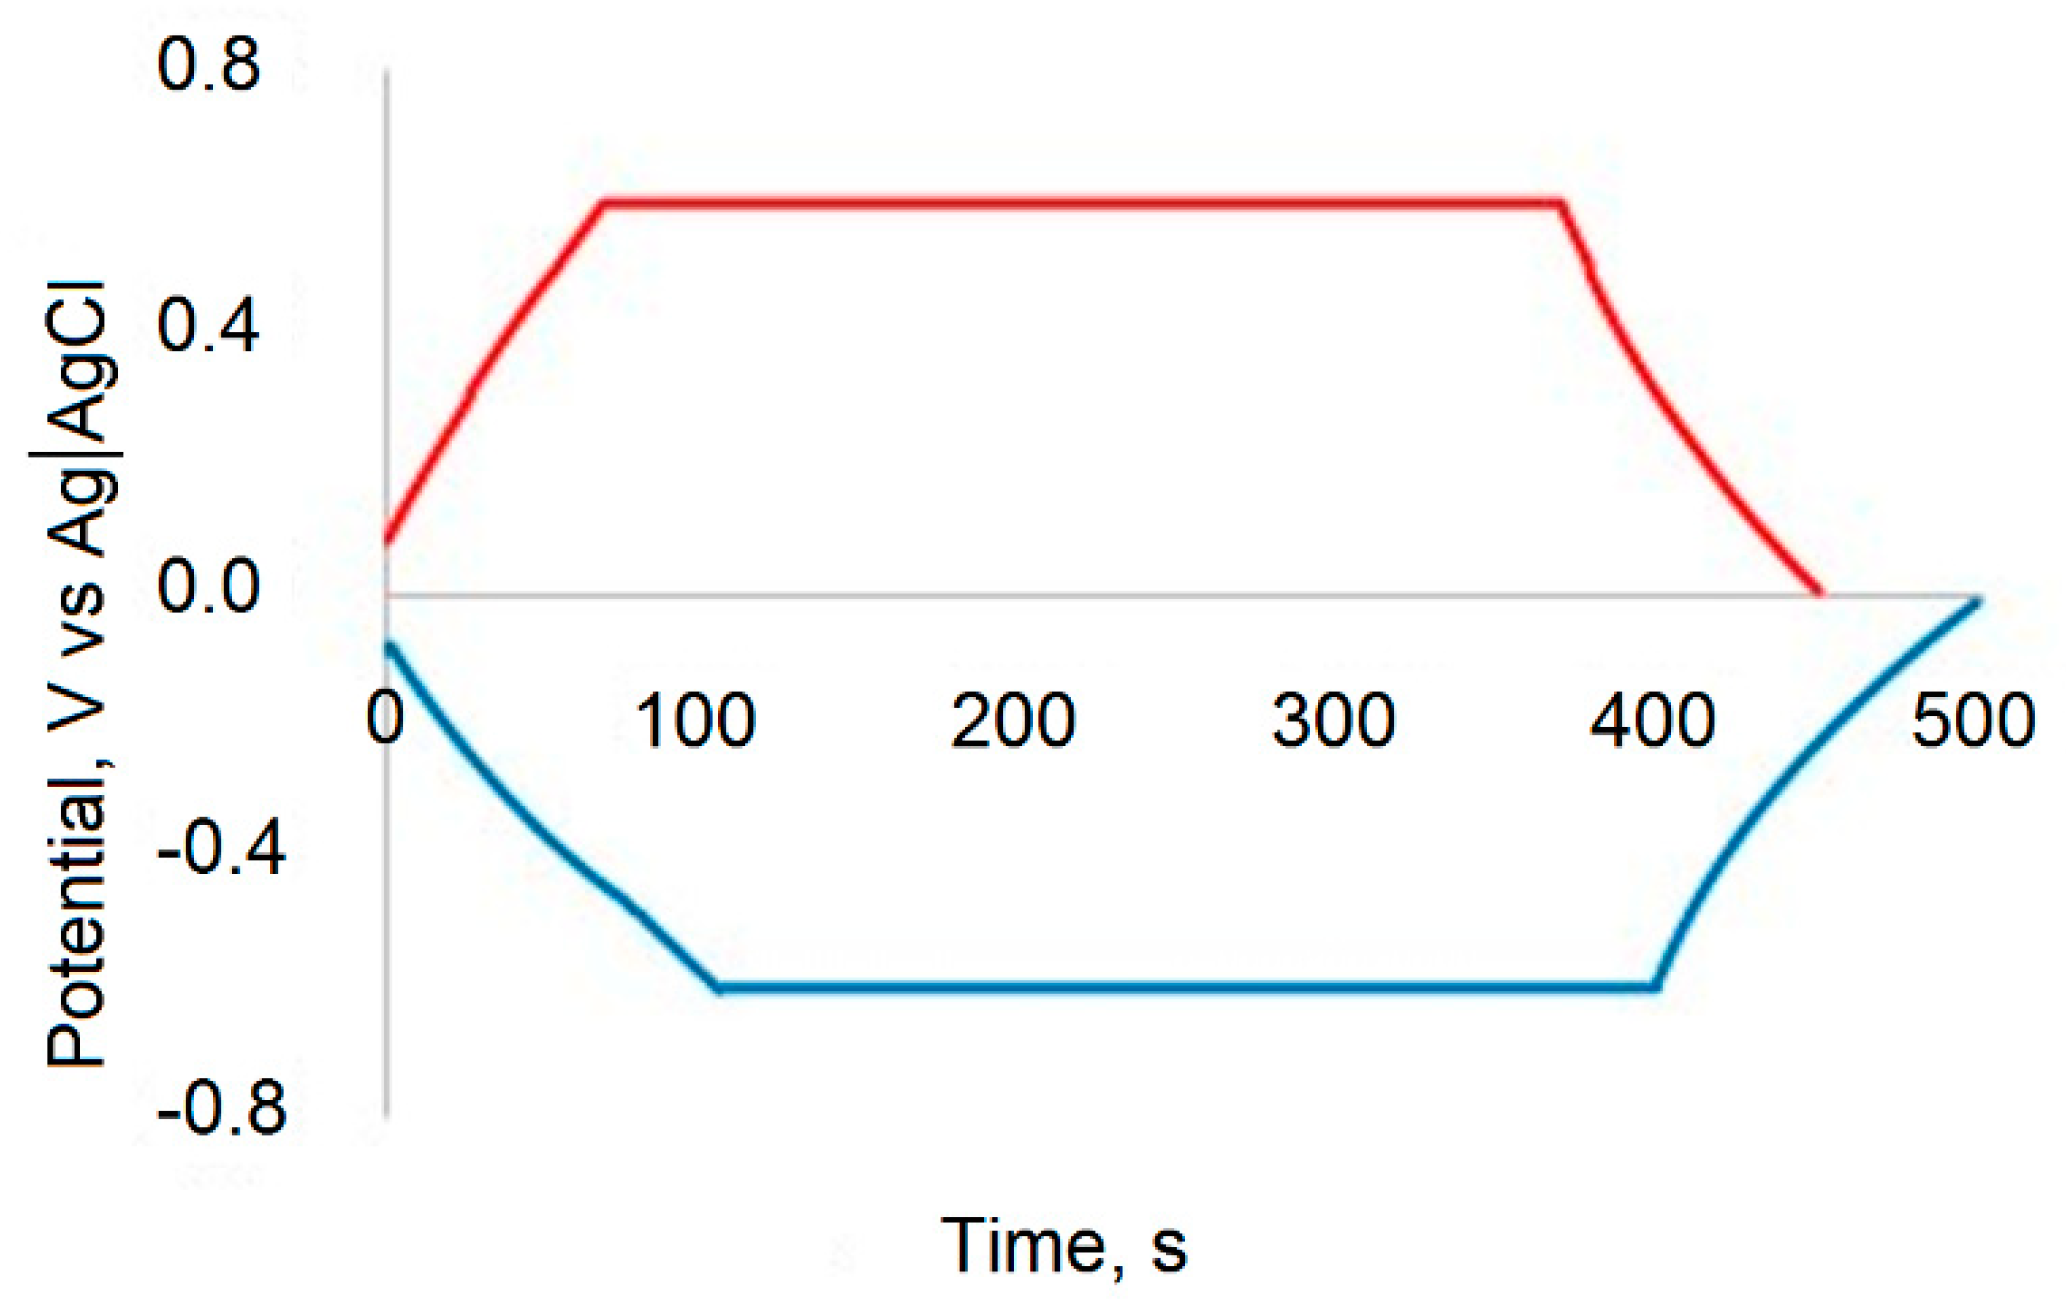
A constant current charge–discharge study was performed between the potential limits of +0.6 V to 0 V and −0.6 V to 0 V for positively and negatively charged electrodes, respectively, (vs. AgIAgCl RE). The experiments were performed with different polarisation potentials to determine the DL- properties of the cation and anion of different electrolytes. To achieve the maximum capacitance limits for positively and negatively charged electrodes, the cells were held at fixed potential for 5 min and then discharged; thereafter, the next cycle was started as shown in Figure 4.
Similar charge–discharge profiles were repeated five times in both positive and negative potential regions. EDL capacitance values were counted from the last three cycles. The current density was varied between 0.1 and 2 mA cm−2. The capacitance values for positively (C+) and negatively (C) charged electrodes were calculated by integrating the discharge curves according to Equation (2):
C + = 0.6 0   | I | d t Δ E C = 0.6 0   | I | d t Δ E
where I is the current density, dt is the discharge time, and ΔE is the potential range of the positively or negatively charged electrodes (0.6 V) [42].
The EIS spectra were measured in the AC frequency range from 1 MHz to 50 mHz at an amplitude of the sinusoidal voltage of 5 mV. The total impedance (Z) of RC circuits was described by Equation (3):
Z   =   Z   +   Z   =   R   +   1 j ω C s
where Z′ is described as the real impedance, Z″ is the imaginary impedance, j is the imaginary number 1 , ω is the angular frequency ω = 2πf, and Cs is the series capacitance.
Rs values were determined by frequency response analysis and are equal to real impedance, Rs = Z′.
The series capacitance CS values of the EIS were calculated from Equation (4) [57,58]:
C s = 1 ω Z
The specific capacitance values were obtained by dividing the capacitance value from different methods by the mass of carbon in the working electrode.
The CV method was used to evaluate the cycle stability of electrospun electrodes in various organic and aqueous electrolytes in a two-electrode test cell configuration. The cycling test was performed at a potential scan rate of v = 20 mV s−1 for <3000 cycles. The applied voltage range for organic electrolytes was 0 to 2.3 V and, for the aqueous electrolytes, the voltage limit was reduced to 1.0 V to prevent water decomposition. The capacitance decrease was monitored via the CV method, while the resistance (Rs) increase was evaluated by the EIS method at 0 V (DC), at f = 1 kHz.

3. Results and Discussion

3.1. Electrochemical Evaluation of Fibrous Electrodes in Aqueous Electrolytes

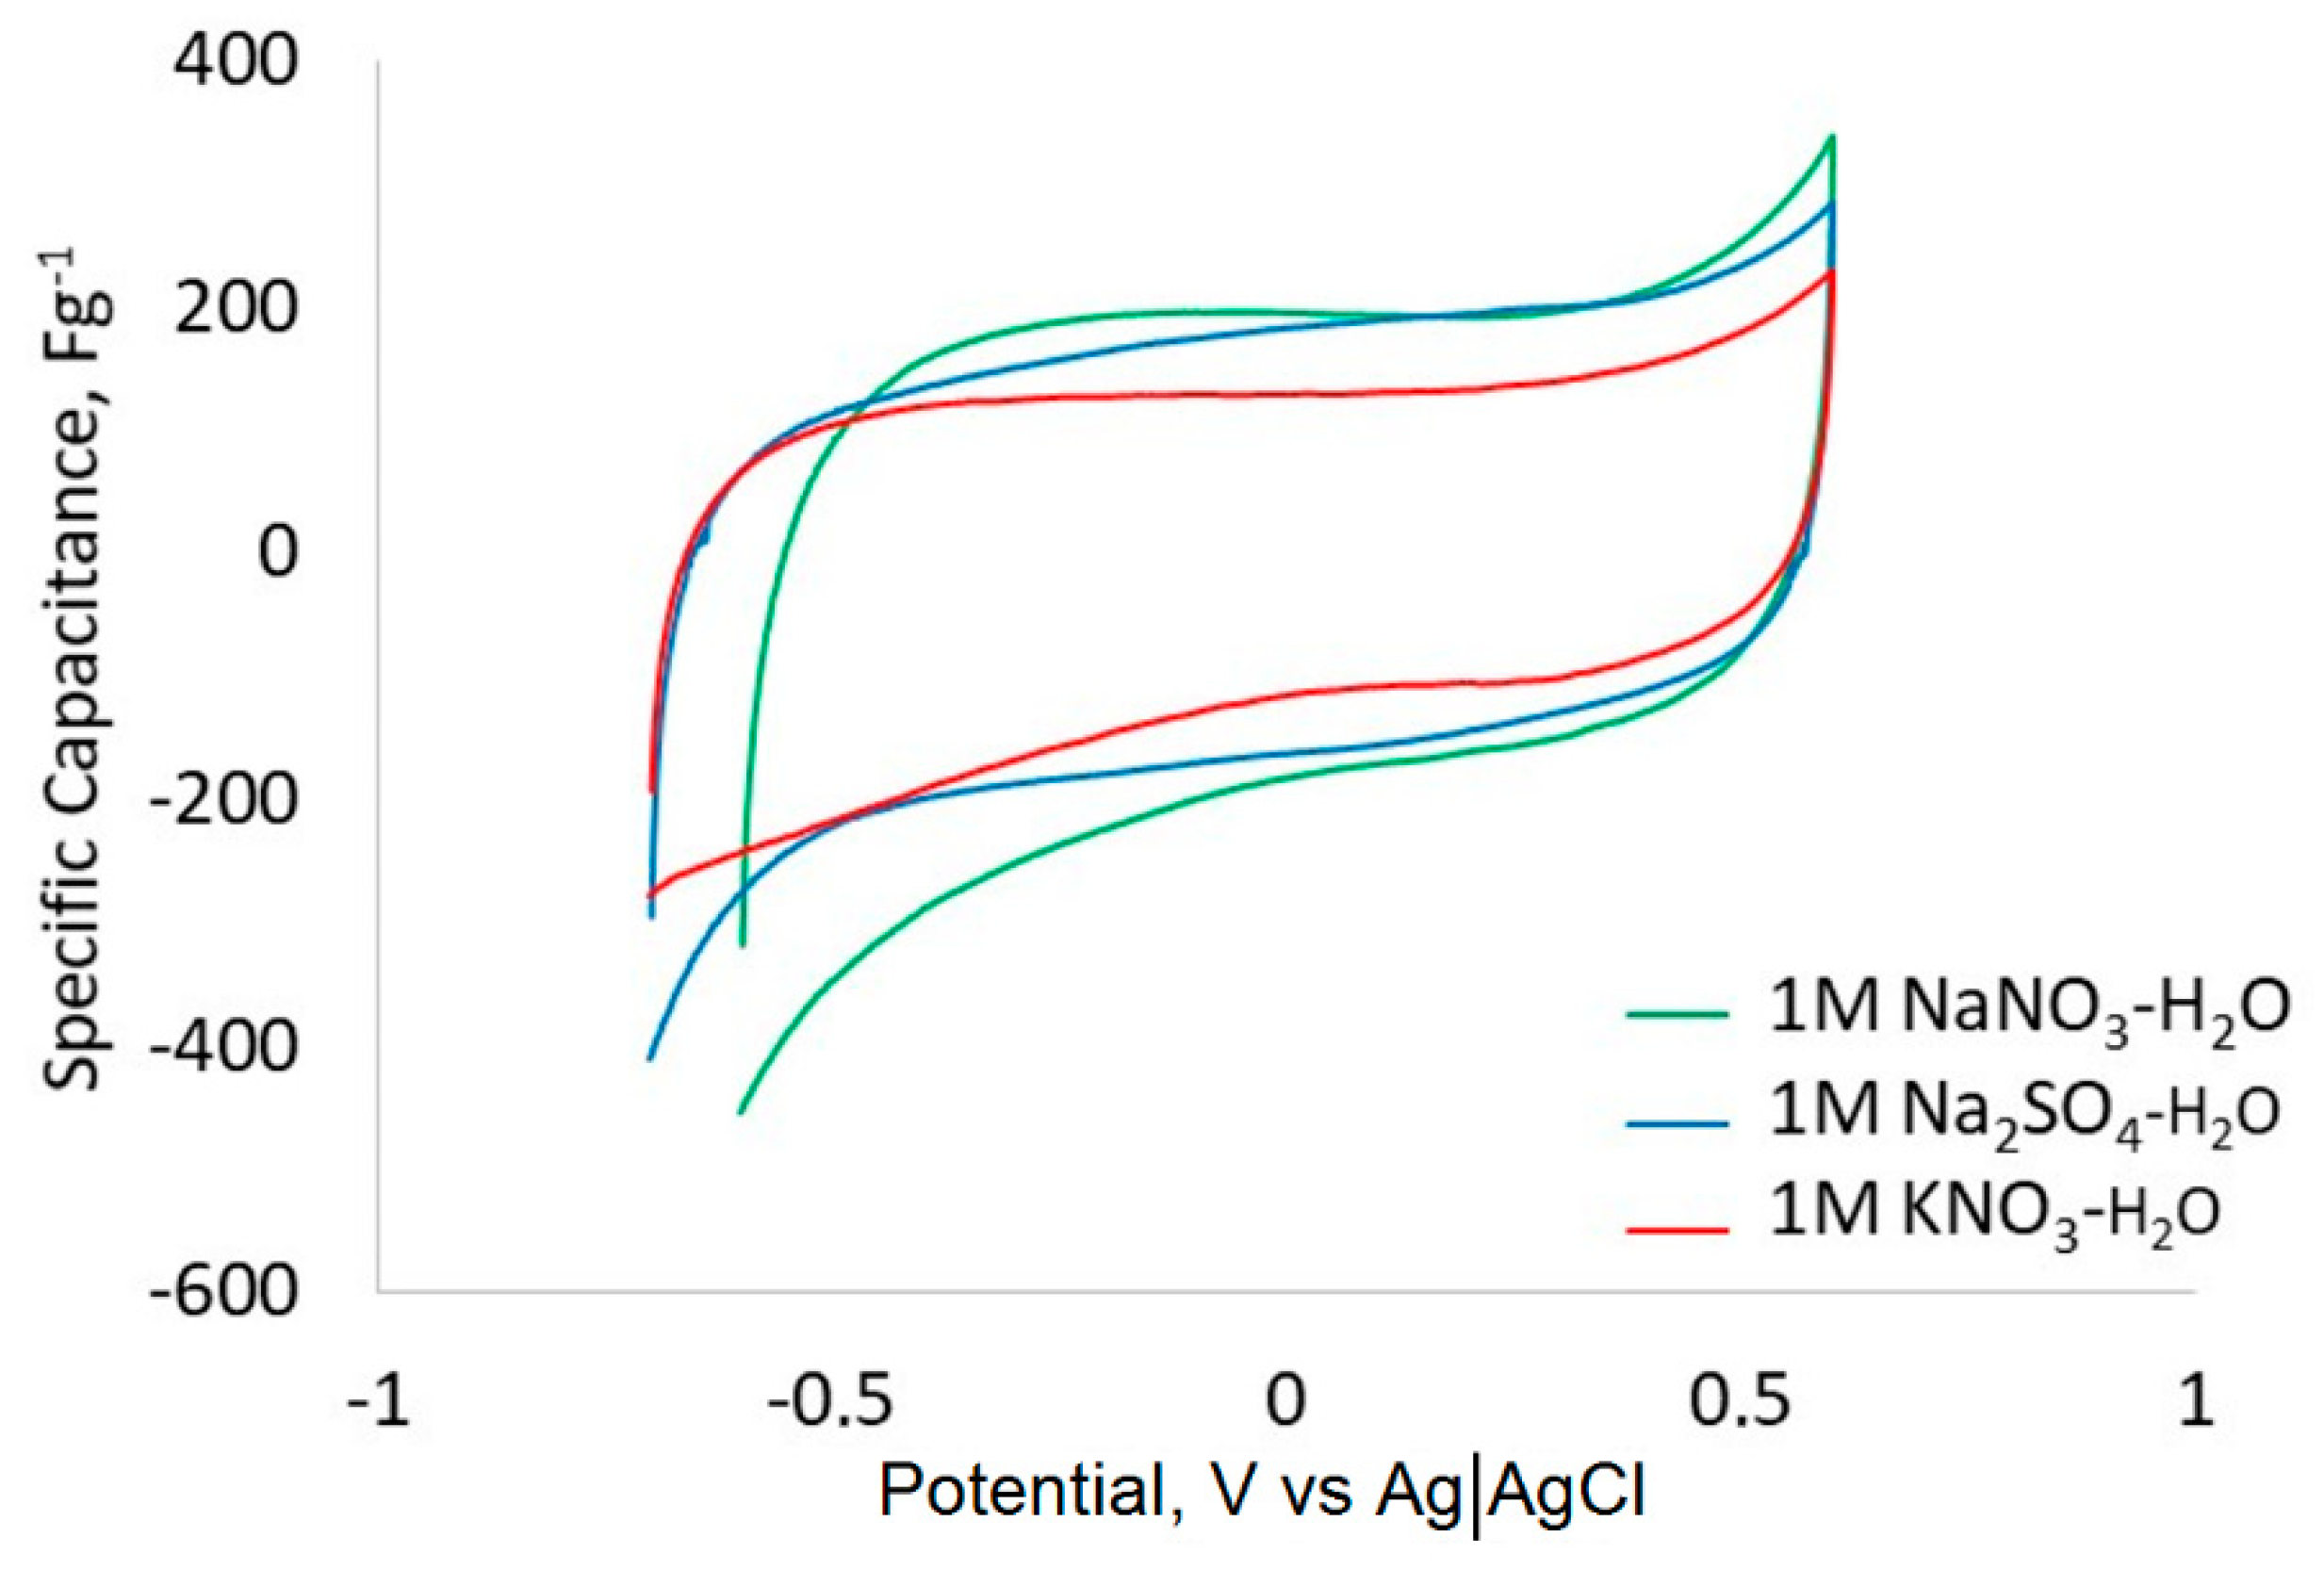
The stability and ideal polarisation region of fibrous CDC-based electrodes in the selected aqueous electrolytes was evaluated by cyclic voltammetry [59], for which three-electrode cell curves are as shown in Figure 5.
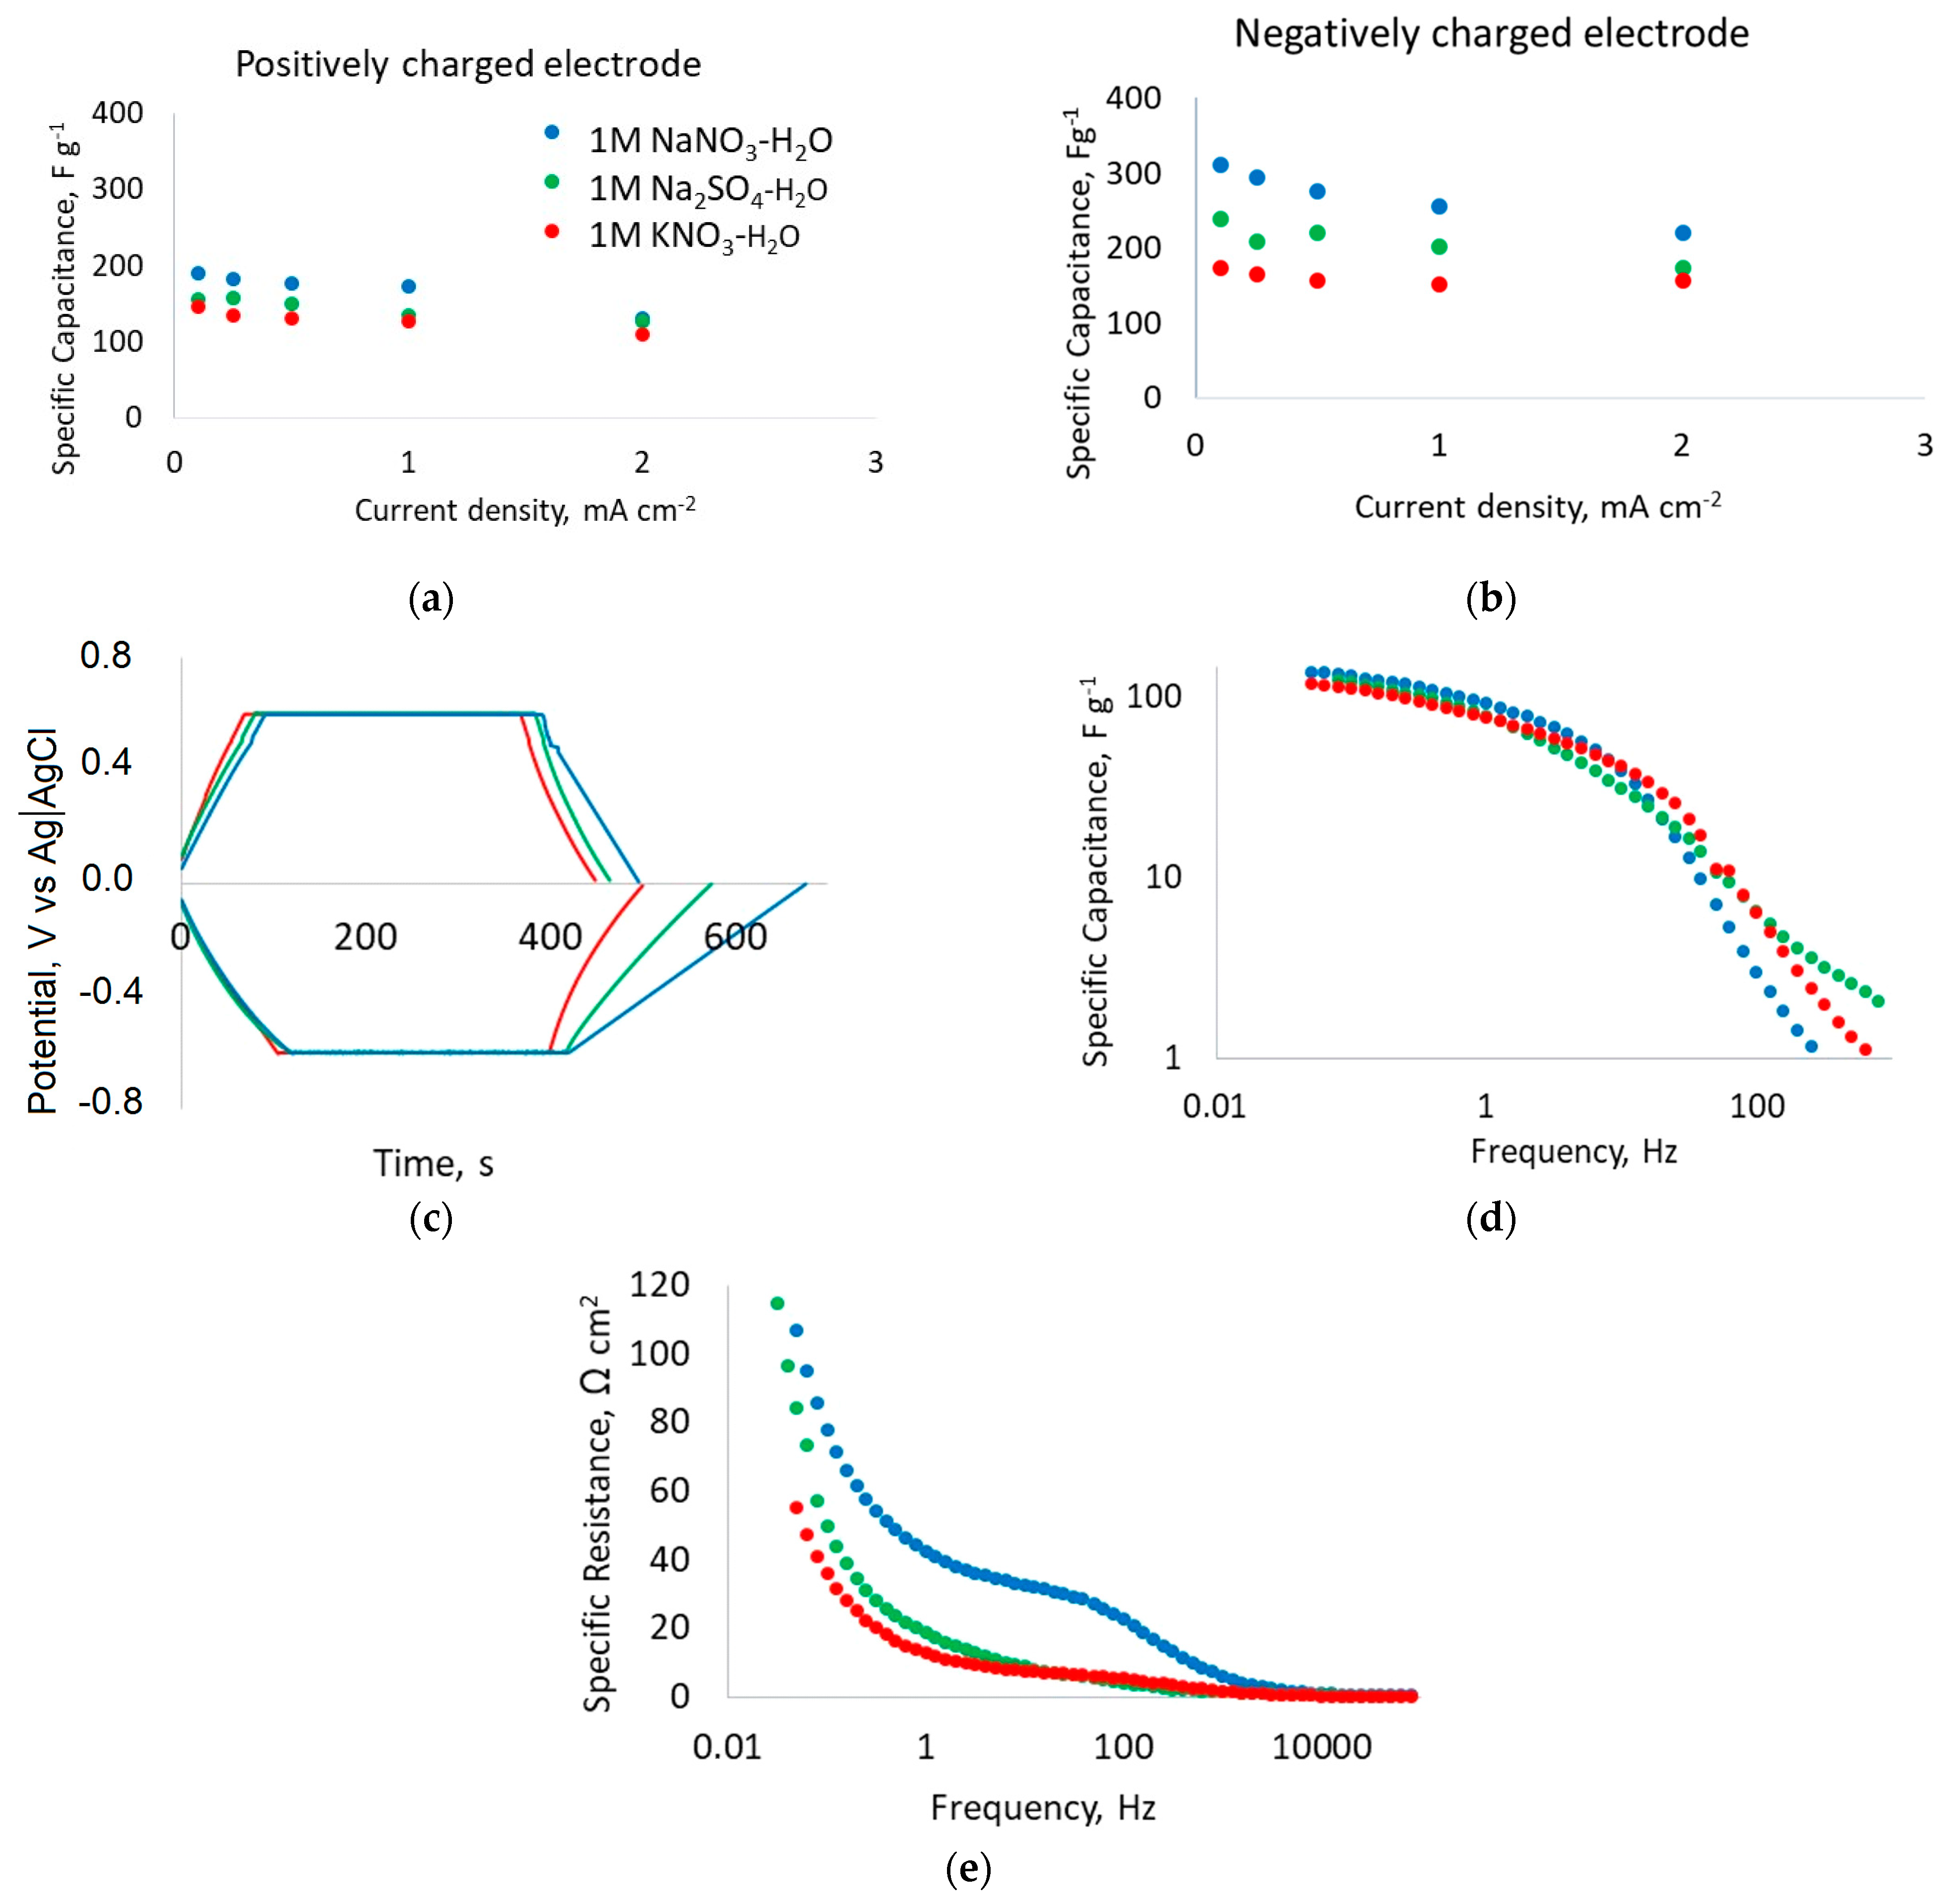
Aqueous electrolyte solutions are known to cause reduction reactions at higher negative electrode potentials, leading to the formation of hydrogen gas and water oxidation reactions at the positive electrode potential limits, resulting in the formation of oxygen. In the case of the KNO3-H2O electrolyte, the oxidation and reduction processes are somewhat less evident in Figure 5, as the potential limits have not yet been reached or exceeded significantly. When the cation is replaced from K+ to Na+, an exponential increase in current at potentials close to −0.5 V was observed, indicating the possible competing hydrogen ion adsorption and reduction on the carbon surface in parallel with adsorption of Na+, being more pronounced compared to the K+ based electrolyte. Furthermore, differences in the capacitance of nitrate-based electrolytes were observed for both positive and negative electrode potential regions, being lower for the KNO3 electrolyte. This can be explained by the different cation sizes of Na+/K+, and during such measurements, cation and anion adsorption are still slightly affected by the reduction and oxidation processes. According to the CV curves presented in Figure 5, no difference in capacitance was observed in the positively charged region by the exchange of anions from NO3 to SO42−, although the nitrate ion was much smaller than the sulphate ion. To further study the ion-related capacitance effects, the CC method was applied at current densities between 0.1 and 2 mA cm−2, with the results presented in Figure 6a–c and in Table 3.
The capacitance dependence of the negatively charged electrode (Figure 6b) shows that Na+, with an ion size 20% smaller than the K+ ion, increases the specific capacitance up to 30% at a current density of 2 mA cm−2. By reducing the applied current density, the ions have a longer time to migrate and adsorb onto the carbon surface and, thus, the specific capacitance increases even more. When the NO3 anion was replaced by SO42−, the specific capacitance at 2 mA cm−2 was practically equal, although the ion radius of the SO42− anions was significantly larger than that of NO3 (Figure 6a). This result is in line with the previously described CV measurements. However, by reducing the applied current density, the specific capacitance in NaNO3-H2O increased compared to SO42−, as expected according to the ion size comparison.
The effect of the aqueous electrolytes on the capacitance and resistance of fibrous CDC-based electrodes was further evaluated by electrochemical impedance spectroscopy measurements recorded at DC = 0 V (vs. ref) to characterise the uncharged surface properties. Based on these measurements, the series capacitance values were calculated using Equation (4), and the results are shown in Figure 6d. In all three studied electrolyte solutions, the adsorption of ions into carbon pores begins at frequencies f < 100 Hz, with a steep increase in capacitance. At f < 1 Hz, a capacitance plateau begins to form when most ions are adsorbed to carbon micropores (Figure 6d). The capacitance in different 1.0 M solutions did not differ significantly, which can be explained by the uncharged (EDC = 0 V) electrode surface. In the frequency range of 10–100 kHz, much lower Rs values were obtained compared to the low-frequency ranges (Figure 6e) due to electrolyte ion migration and adsorption/desorption rate effects, i.e., At high frequency, ions do not have enough time to migrate to the carbon pores, and the electrode behaves like a smooth surface. Ion adsorption reaches maximum levels only at low frequencies, which is reflected by the significant increase in capacitance and resistance [2,40]. Surprisingly, the highest resistance was observed in the low frequency region of the NaNO3-H2O solution, although it has the smallest anion/cation size and slightly higher conductivity compared to other electrolytes.

3.2. Effect of Electrolyte Concentration on Fibrous Electrode Performance

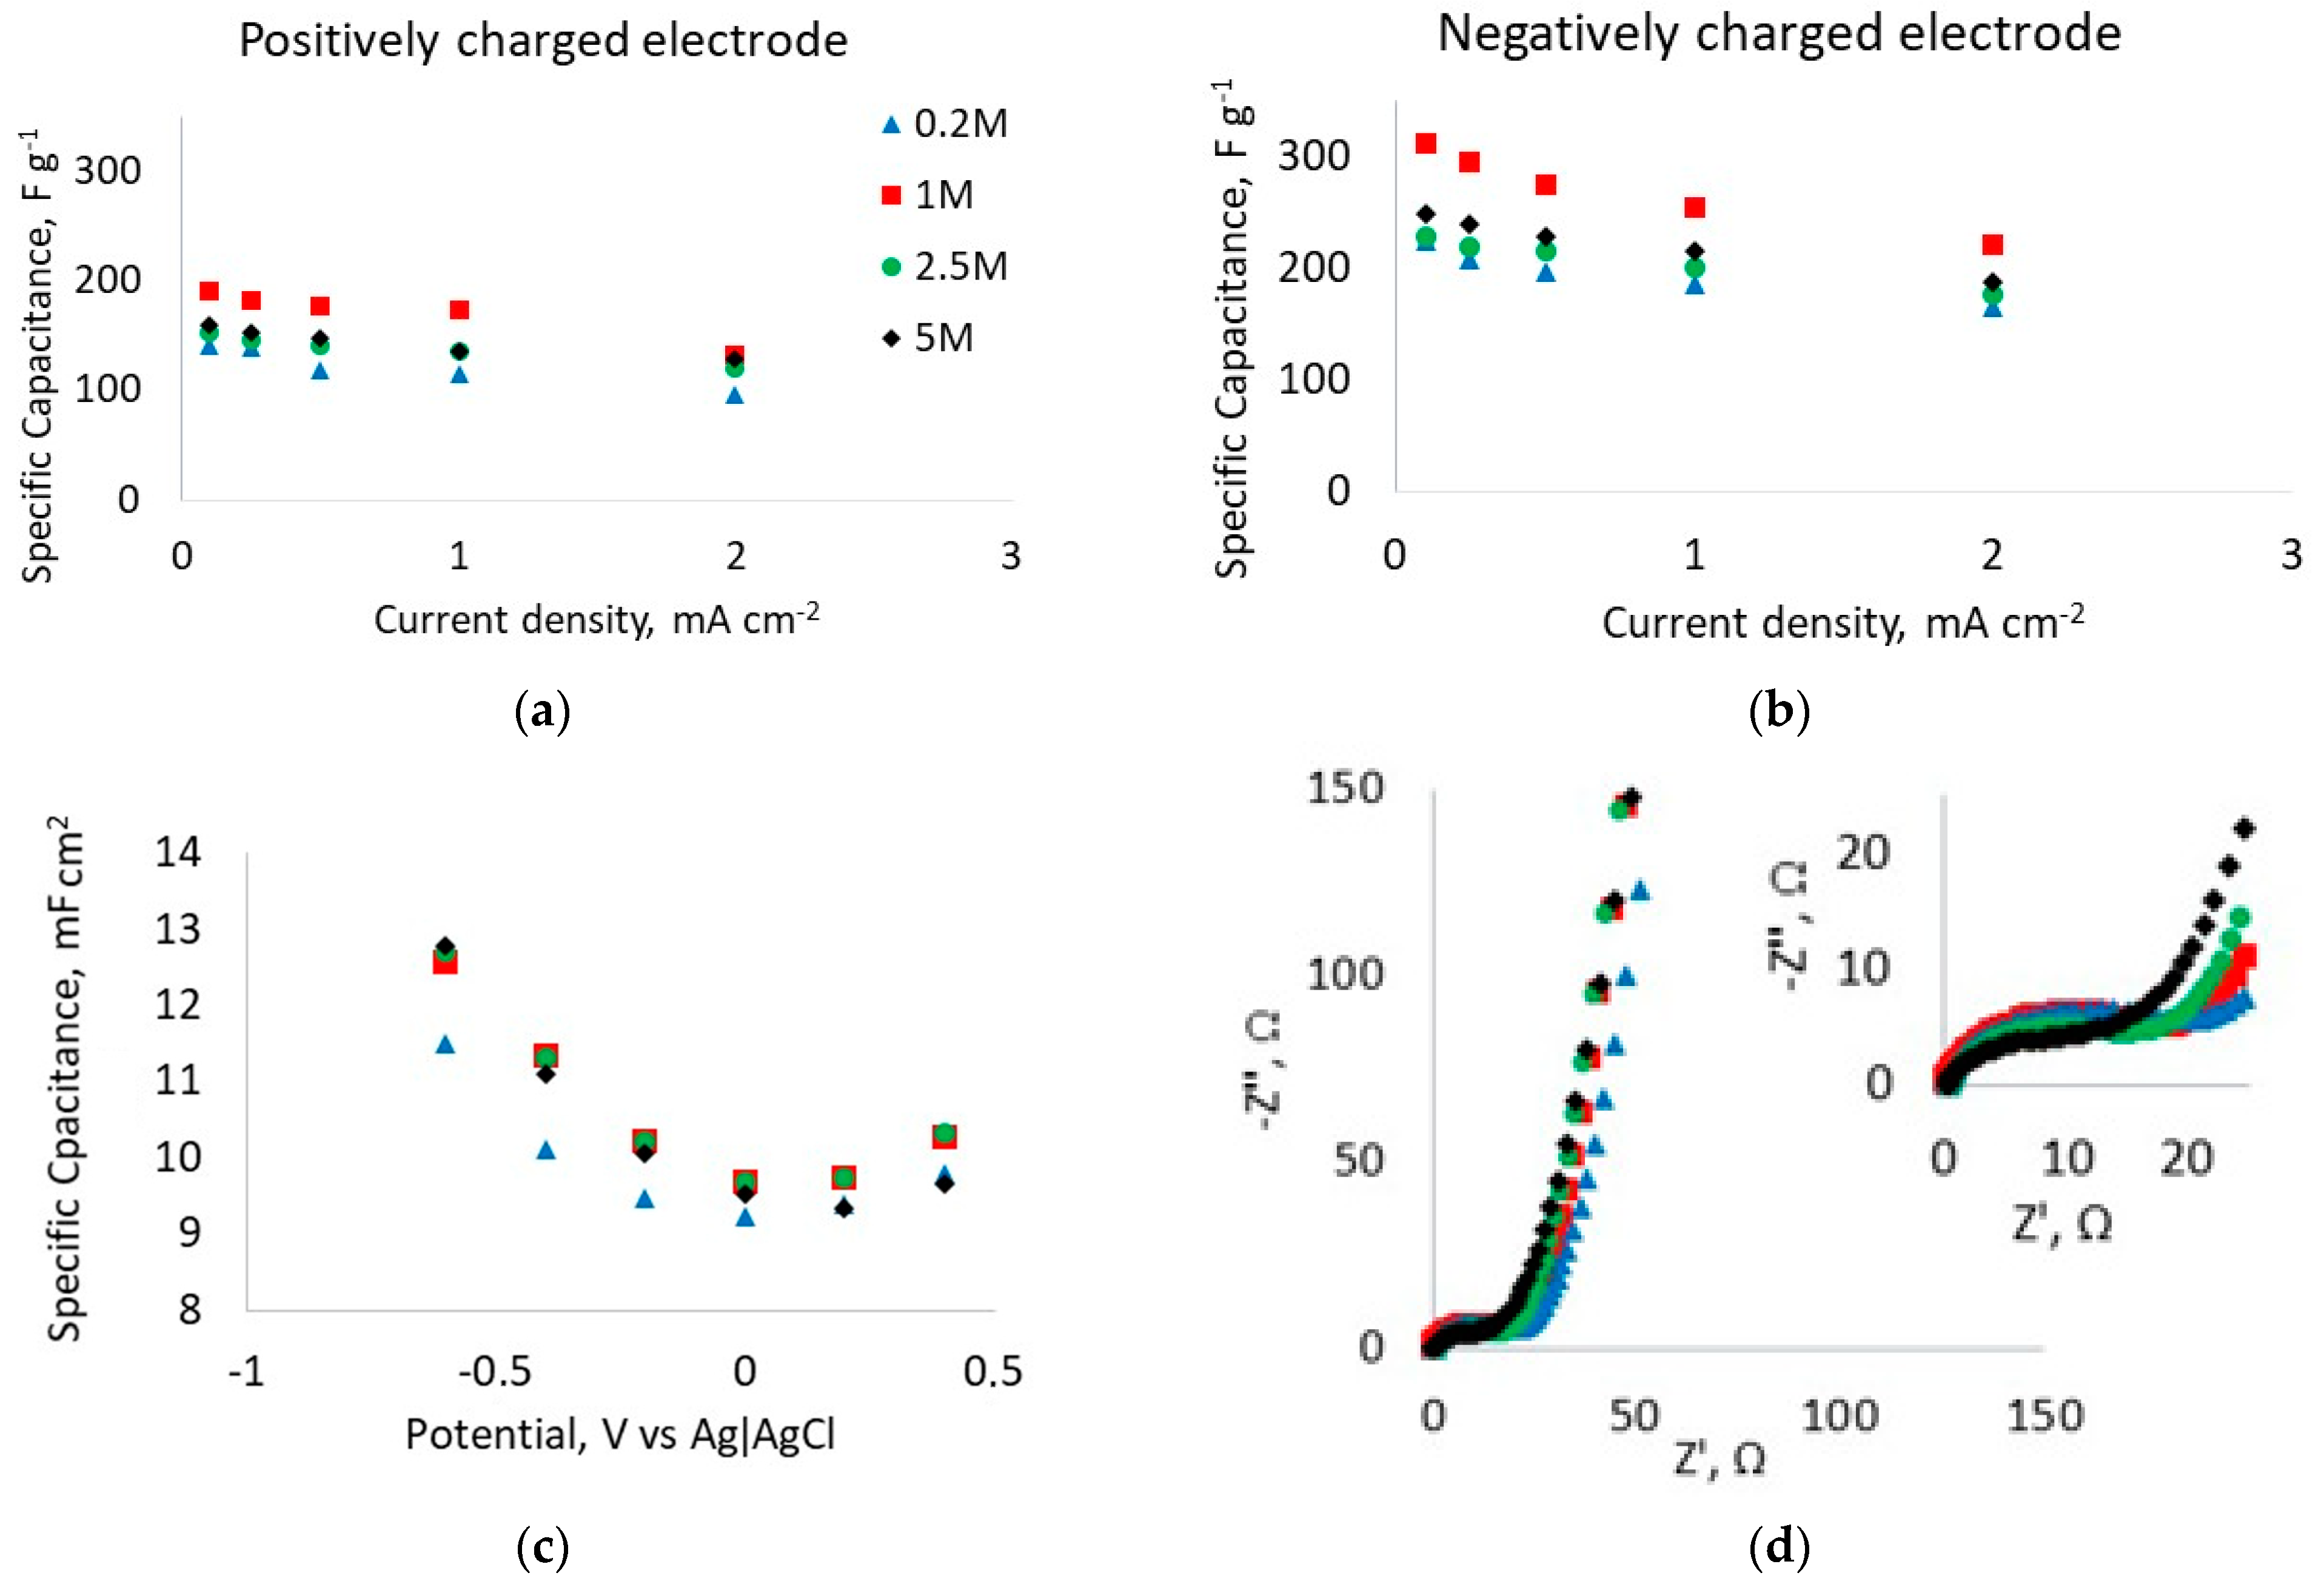
The effect of electrolyte salt concentration on the electrochemical performance of fibrous CDC-based electrodes was evaluated in NaNO3-H2O solutions of 0.2 M, 1.0 M, 2.5 M, and 5.0 M molarity. The conductivity and pH values of the prepared electrolytes are shown in Table 1. The specific capacitance of positively and negatively charged electrodes was determined at different current densities of CC, presented in Figure 7a,b. The areal capacitance as a function of frequency and Nyquist plots are presented in Figure 7c,d, respectively.
The rate capability analysis (C vs. I in Figure 7a,b) gave the highest capacitance at a concentration of 1.0 M of NaNO3. However, it is generally known that by increasing the concentration of electrolyte salt, the charge-transfer resistance of EDLC cells is decreased while the capacitance and rate capability are increased [60,61]. However, there are no major differences in the obtained capacitance values, as higher salt concentrations also increase the viscosity of the electrolyte and promote the saturation of active ions on the carbon surface [60,61].
The capacitance-potential dependency was additionally analysed with the EIS method at different fixed electrode potentials (Figure 7c). It was confirmed that negatively charged electrodes have higher capacitance over the electrode area, as also observed by the CC measurements. The change in capacitance as a function of the electrode potential is precisely defined, where it has a clear minimum for all solution concentrations close to zero charge potential of 0 V vs. Ag|AgCl, with marginal effects from the concentration. Some differences in the absolute capacitance values from CC and EIS measurements are mainly due to the differences in the measurement methodology. The capacitance from the EIS technique is calculated at relatively high frequencies (~50 mHz) at which the boundary diffusion of different electrolyte ions has not yet been reached, while constant current measurements at very low current densities of 0.1 mA cm−2 allow for the finite ion diffusion to occur.
The Nyquist plots (Figure 7d) show the highest impedance for the cells with the lowest ionic conductivity electrolyte of 0.2 M concentration. Figure 7d also shows a small decrease in charge-transfer resistance (semi-circle) for uncharged electrodes by increasing the salt concentration. Additionally, the differences in capacitance and resistance decreased at higher concentrations because enough electrolyte ions were adsorbed on the carbon electrode. However, due to the increase in viscosity at higher concentrations, the expected increase in capacitance and decrease in resistance were less evident. Such results are well in accordance with the CC measurement data.

3.3. Cycle-Stability Analysis for Full Cells

Two-electrode systems were applied to analyse the long-term cycle stability of fibrous CDC-based electrode materials. Cycle-life tests in selected aqueous and non-aqueous electrolytes were performed using the CV method (v = 20 mVs−1) in voltage ranges of 0–1.0 V and 0–2.3 V, respectively, where the change in capacitance was assessed during CV discharge cycles, and the change in resistance was evaluated by EIS at f = 1 kHz. The capacitance and resistance change over the cycles is shown in Figure 8a,b. Stable results over ~1000 cycles were observed for both aqueous electrolytes and the organic 1.5 M SBP-BF4-ACN electrolyte. An exponential decrease in capacitance and increase in resistance during cycling was observed in the 1.5 M EMIm-TFSI-ACN electrolyte. Such unstable behaviour can be caused by the relatively high viscosity of the electrolyte and possibly an excessively high voltage scanning rate, which does not support efficient ion transfer and adsorption on the electrodes [40]. For the SBP-BF4-ACN and KNO3-H2O electrolytes, no significant change in capacitance was observed over the cycles. The increase in SBP-BF4-ACN cell resistance was typical of EDL capacitors and increased by only 21% over 3000 cycles, while the resistance of the KNO3 capacitor was almost constant.

4. Conclusions

The present study investigated the influence of aqueous NaNO3-H2O, KNO3-H2O and Na2SO4-H2O electrolyte ionic composition and concentration on the electrochemical behaviour of directly electrospun carbide-derived carbon electrodes. The highest gravimetric capacitances of 191 F g−1 and 311 F g−1 for positively and negatively charged electrodes, respectively, were achieved in 1 M NaNO3-H2O at 0.1 mA cm−2. The capacitance values in 1 M Na2SO4-H2O and 1 M KNO3-H2O electrolyte solutions were 23% and 30% lower than that of NaNO3-H2O, respectively. The results correlate well with the electrolyte ion sizes.
A salt concentration effect study on the fibrous electrodes showed that a NaNO3-H2O concentration of 1.0 M is optimum for capacitive performance. On the other hand, a higher salt concentration (>1 M) slightly improved the cell resistance at the expense of increased electrolyte conductivity.
Based on the analysis of the two-electrode cells, a stable cycle life was achieved with both non-aqueous SBP-BF4-ACN and aqueous NaNO3-H2O and Na2SO4-H2O electrolytes. In the case of aqueous electrolyte solutions, some further ion absorption effects were observed in the first few hundred cycles of the cycle-life test, leading to an increase in capacitance, followed by a generally expected declining trend.

Author Contributions

Data curation, S.M., K.L., M.K.; investigation, S.M., K.L., M.K. and E.T.; methodology, S.M. and M.A.; resources, V.V.; supervision, M.A. and A.K.; validation, S.M., K.L., M.K. and I.K.; writing—original draft, S.M.; writing—review and editing, A.K., M.A. and A.L. All authors have read and agreed to the published version of the manuscript.

Funding

This work was financially supported by the European Space Agency, ESA contract number 4000119258/16/NL/CBi “Fully electrospun durable electrode and electrochemical double-layer capacitor for high frequency applications” and the European Union European Regional Development Fund through Foundation Archimedes (TK143).

Institutional Review Board Statement

Not applicable.

Acknowledgments

We thank senior researcher Valdek Mikli for SEM analyses and Can Rüstü Yörük for TGA analyses.

Conflicts of Interest

The authors declare no conflict of interest.

References

  1. Yu, A.; Chabot, V.; Zhang, J. Electrochemical Supercapacitors for Energy Storage and Delivery: Fundamentals and Applications; CRC Press: Boca Raton, FL, USA, 2017. [Google Scholar]
  2. Beguin, F.; Frackowiak, E. Supercapacitors: Materials, Systems, and Applications; John Wiley & Sons: Hoboken, NJ, USA, 2013. [Google Scholar]
  3. Zhong, C.; Deng, Y.; Hu, W.; Qiao, J.; Zhang, L.; Zhang, J. A review of electrolyte materials and compositions for electrochemical supercapacitors. Chem. Soc. Rev. 2015, 44, 7484–7539. [Google Scholar] [CrossRef]
  4. Menzel, J.; Fic, K.; Frackowiak, E. Hybrid aqueous capacitors with improved energy/power performance. Prog. Nat. Sci. Mater. Int. 2015, 25, 642–649. [Google Scholar] [CrossRef] [Green Version]
  5. Guerrero-Martínez, M.Á.; Romero-Cadaval, E.; Minambres-Marcos, V.; Milanés-Montero, M.I. Supercapacitor Energy Storage System for Improving the Power flow in Photovoltaic Plants. Electron. Compon. Mater. 2014, 44, 3. [Google Scholar] [CrossRef]
  6. Zhao, C.; Zheng, W. A Review for Aqueous Electrochemical Supercapacitors. Front. Energy Res. 2015, 3, 1–5. [Google Scholar] [CrossRef] [Green Version]
  7. Horn, M.; MacLeod, J.; Liu, M.; Webb, J.; Motta, N. Supercapacitors: A new source of power for electric cars? Econ. Anal. Policy 2019, 61, 93–103. [Google Scholar] [CrossRef] [Green Version]
  8. Burke, A.; Zhao, H. Applications of Supercapacitors in Electric and Hybrid Vehicles; 5th European Symposium on Supercapacitor and Hybrid Solutions (ESSCAP): Brasov, Romania, 2015; p. 15. [Google Scholar]
  9. Weingarth, D.; Noh, H.; Foelske-Schmitz, A.; Wokaun, A.; Kötz, R. A reliable determination method of stability limits for electrochemical double layer capacitors. Electrochim. Acta 2013, 103, 119–124. [Google Scholar] [CrossRef]
  10. Käärik, M.; Arulepp, M.; Käärik, M.; Maran, U.; Leis, J. Characterization and prediction of double-layer capacitance of nanoporous carbon materials using the Quantitative nano-Structure-Property Relationship approach based on experimentally determined porosity descriptors. Carbon 2020, 158, 494–504. [Google Scholar] [CrossRef]
  11. Arulepp, M.; Leis, J.; Lätt, M.; Miller, F.; Rumma, K.; Lust, E.; Burke, A. The advanced carbide-derived carbon based supercapacitor. J. Power Sources 2006, 162, 1460–1466. [Google Scholar] [CrossRef]
  12. Ramachandran, R.; Wang, F. Electrochemical Capacitor Performance: Influence of Aqueous Electrolytes. Supercapacitors Theor. Pract. Solut. 2017. [Google Scholar] [CrossRef] [Green Version]
  13. Pal, B.; Yang, S.; Ramesh, S.; Thangadurai, V.; Jose, R. Electrolyte selection for supercapacitive devices: A critical review. Nanoscale Adv. 2019, 1, 3807–3835. [Google Scholar] [CrossRef] [Green Version]
  14. Dyatkin, B.; Mamontov, E.; Cook, K.M.; Gogotsi, Y. Capacitance, charge dynamics, and electrolyte-surface interactions in functionalized carbide-derived carbon electrodes. Prog. Nat. Sci. 2015, 25, 631–641. [Google Scholar] [CrossRef] [Green Version]
  15. Käärik, M.; Arulepp, M.; Kook, M.; Mäeorg, U.; Kozlova, J.; Sammelselg, V.; Perkson, A.; Leis, J. Characterisation of steam-treated nanoporous carbide-derived carbon of TiC origin: Structure and enhanced electrochemical performance. J. Porous Mater. 2017, 25, 1057–1070. [Google Scholar] [CrossRef]
  16. Käärik, M.; Arulepp, M.; Kook, M.; Kozlova, J.; Ritslaid, P.; Aruväli, J.; Mäeorg, U.; Sammelselg, V.; Leis, J. High-performance microporous carbon from deciduous wood-origin metal carbide. Microporous Mesoporous Mater. 2019, 278, 14–22. [Google Scholar] [CrossRef]
  17. Lota, K.; Sierczynska, A.; Acznik, I. Effect of aqueous electrolytes on electrochemical capacitor capacitance. Chemik 2013, 67, 1138–1145. [Google Scholar]
  18. Barzegar, F.; Momodu, D.Y.; Fashedemi, O.O.; Bello, A.; Dangbegnon, J.K.; Manyala, N. Investigation of different aqueous electrolytes on the electrochemical performance of activated carbon-based supercapacitors. RSC Adv. 2015, 5, 107482–107487. [Google Scholar] [CrossRef] [Green Version]
  19. Ibukun, O.; Jeong, H.K. Effects of Aqueous Electrolytes in Supercapacitors. New Phys. Sae Mulli 2019, 69, 154–158. [Google Scholar] [CrossRef]
  20. Lang, A.W.; Ponder, J.F.; Österholm, A.M.; Kennard, N.J.; Bulloch, R.H.; Reynolds, J.R. Flexible, aqueous-electrolyte supercapacitors based on water-processable dioxythiophene polymer/carbon nanotube textile electrodes. J. Mater. Chem. A 2017, 5, 23887–23897. [Google Scholar] [CrossRef]
  21. Mao, X.; Hatton, T.A.; Rutledge, G.C. A Review of Electrospun Carbon Fibers as Electrode Materials for Energy Storage. Curr. Org. Chem. 2013, 17, 1390–1401. [Google Scholar] [CrossRef] [Green Version]
  22. Frackowiak, E.; Abbas, Q.; Béguin, F. Carbon/carbon supercapacitors. J. Energy Chem. 2013, 22, 226–240. [Google Scholar] [CrossRef]
  23. Ruiz, V.; Santamaría, R.; Granda, M.; Blanco, C. Long-term cycling of carbon-based supercapacitors in aqueous media. Electrochim. Acta 2009, 54, 4481–4486. [Google Scholar] [CrossRef] [Green Version]
  24. Khomenko, V.; Raymundo-Piñero, E.; Béguin, F. A new type of high energy asymmetric capacitor with nanoporous carbon electrodes in aqueous electrolyte. J. Power Sources 2010, 195, 4234–4241. [Google Scholar] [CrossRef]
  25. Demarconnay, L.; Raymundo-Piñero, E.; Béguin, F. A symmetric carbon/carbon supercapacitor operating at 1.6V by using a neutral aqueous solution. Electrochem. Commun. 2010, 12, 1275–1278. [Google Scholar] [CrossRef]
  26. Béguin, F.; Presser, V.; Balducci, A.; Frackowiak, E. Carbons and Electrolytes for Advanced Supercapacitors. Adv. Mater. 2014, 26, 2219–2251. [Google Scholar] [CrossRef] [PubMed]
  27. Cai, Y.-M.; Qin, Z.-Y.; Chen, L. Effect of electrolytes on electrochemical properties of graphene sheet covered with polypyrrole thin layer. Prog. Nat. Sci. 2011, 21, 460–466. [Google Scholar] [CrossRef] [Green Version]
  28. Xu, C.; Wei, C.; Li, B.; Kang, F.; Guan, Z. Charge storage mechanism of manganese dioxide for capacitor application: Effect of the mild electrolytes containing alkaline and alkaline-earth metal cations. J. Power Sources 2011, 196, 7854–7859. [Google Scholar] [CrossRef]
  29. Jenkins, H.D.B.; Thakur, K.P. Reappraisal of thermochemical radii for complex ions. J. Chem. Educ. 1979, 56, 576. [Google Scholar] [CrossRef]
  30. Park, J.-S. Electrospinning and its applications. Adv. Nat. Sci. Nanosci. Nanotechnol. 2010, 1, 043002. [Google Scholar] [CrossRef] [Green Version]
  31. Sundarrajan, S.; Tan, K.L.; Lim, S.H.; Ramakrishna, S. Electrospun Nanofibers for Air Filtration Applications. Procedia Eng. 2014, 75, 159–163. [Google Scholar] [CrossRef] [Green Version]
  32. Rahman, M.M.; Tahkar, A.I. Use of Nano Fibers in Filtration—A review. IJSRD-Int. J. Sci. Res. Dev. 2016, 4, 7. [Google Scholar]
  33. Ding, B.; Wang, M.; Wang, X.; Yu, J.; Sun, G. Electrospun nanomaterials for ultrasensitive sensors. Mater. Today 2010, 13, 16–27. [Google Scholar] [CrossRef]
  34. Sun, G.; Sun, L.; Xie, H.; Liu, J. Electrospinning of Nanofibers for Energy Applications. Nanomaterials 2016, 6, 129. [Google Scholar] [CrossRef] [PubMed] [Green Version]
  35. Li, X.; Zhao, Y.; Bai, Y.; Zhao, X.; Wang, R.; Huang, Y.; Liang, Q.; Huang, Z. A Non-Woven Network of Porous Nitrogen-doping Carbon Nanofibers as a Binder-free Electrode for Supercapacitors. Electrochim. Acta 2017, 230, 445–453. [Google Scholar] [CrossRef]
  36. He, T.; Fu, Y.; Meng, X.; Yu, X.; Wang, X. A novel strategy for the high performance supercapacitor based on polyacrylonitrile-derived porous nanofibers as electrode and separator in ionic liquid electrolyte. Electrochim. Acta 2018, 282, 97–104. [Google Scholar] [CrossRef]
  37. Tõnurist, K.; Vaas, I.; Thomberg, T.; Jänes, A.; Kurig, H.; Romann, T.; Lust, E. Application of multistep electrospinning method for preparation of electrical double-layer capacitor half-cells. Electrochim. Acta 2014, 119, 72–77. [Google Scholar] [CrossRef]
  38. Malmberg, S.; Tarasova, E.; Vassiljeva, V.; Krasnou, I.; Arulepp, M.; Krumme, A. Fully Elecrospun Durable Electrode and Electrochemical Double-Layer Capacitor for High Frequency Applications; ESA SPCD: Lanskroun, Czech Republic, 2018; p. 10. [Google Scholar]
  39. Malmberg, S.; Arulepp, M.; Savest, N.; Tarasova, E.; Vassiljeva, V.; Krasnou, I.; Käärik, M.; Mikli, V.; Krumme, A.; Malmberg, S. Directly electrospun electrodes for electrical double-layer capacitors from carbide-derived carbon. J. Electrost. 2020, 103, 103396. [Google Scholar] [CrossRef]
  40. Malmberg, S.; Arulepp, M.; Tarasova, E.; Vassiljeva, V.; Krasnou, I.; Krumme, A. Electrochemical Evaluation of Directly Electrospun Carbide-Derived Carbon-Based Electrodes in Different Nonaqueous Electrolytes for Energy Storage Applications. C J. Carbon Res. 2020, 6, 59. [Google Scholar] [CrossRef]
  41. Balbuena, P.B. Electrolyte Materials-Issues and Challenges. In Proceedings of the AIP Conference Proceedings, Freiberg, Germany, 17 February 2014; pp. 82–97. [Google Scholar] [CrossRef]
  42. Conway, B.E. Behavior of the Double Layer in Nonaqueous Electrolytes and Nonaqueous Electrolyte Capacitors. In Electrochemical Supercapacitors; Springer: Boston, MA, USA, 1999; pp. 169–181. [Google Scholar]
  43. Balducci, A. Electrolytes for high voltage electrochemical double layer capacitors: A perspective article. J. Power Sources 2016, 326, 534–554. [Google Scholar] [CrossRef]
  44. Tomiyasu, H.; Shikata, H.; Takao, K.; Asanuma, N.; Taruta, S.; Park, Y.-Y. An aqueous electrolyte of the widest potential window and its superior capability for capacitors. Sci. Rep. 2017, 7, srep45048. [Google Scholar] [CrossRef]
  45. Bu, X.; Su, L.; Dou, Q.; Lei, S.; Yan, X. A low-cost “water-in-salt” electrolyte for a 2.3 V high-rate carbon-based supercapacitor. J. Mater. Chem. A 2019, 7, 7541–7547. [Google Scholar] [CrossRef]
  46. Lee, M.H.; Kim, S.J.; Chang, D.; Kim, J.; Moon, S.; Oh, K.; Park, K.-Y.; Seong, W.M.; Park, H.; Kwon, G.; et al. Toward a low-cost high-voltage sodium aqueous rechargeable battery. Mater. Today 2019, 29, 26–36. [Google Scholar] [CrossRef]
  47. Stojanovska, E.; Pampal, E.S.; Kilic, A.; Quddus, M.; Candan, Z. Developing and characterization of lignin-based fibrous nanocarbon electrodes for energy storage devices. Compos. Part B Eng. 2019, 158, 239–248. [Google Scholar] [CrossRef]
  48. Khosrozadeh, A.; Singh, G.; Wang, Q.; Luo, G.; Xing, M. Supercapacitor with extraordinary cycling stability and high rate from nano-architectured polyaniline/graphene on Janus nanofibrous film with shape memory. J. Mater. Chem. A 2018, 6, 21064–21077. [Google Scholar] [CrossRef]
  49. Jia, Z.; Liu, D.Q.; Yang, S.Y. Electrochemical Insight into Cycle Stability of Organic Electrolyte Supercapacitors. Adv. Mater. Res. 2011, 347–353, 467–471. [Google Scholar] [CrossRef]
  50. Brunauer, S.; Emmett, P.H.; Teller, E. Adsorption of Gases in Multimolecular Layers. J. Am. Chem. Soc. 1938, 60, 309–319. [Google Scholar] [CrossRef]
  51. Thommes, M.; Kaneko, K.; Neimark, A.V.; Olivier, J.P.; Rodriguez-Reinoso, F.; Rouquerol, J.; Sing, K.S. Physisorption of gases, with special reference to the evaluation of surface area and pore size distribution (IUPAC Technical Report). Pure Appl. Chem. 2015, 87, 1051–1069. [Google Scholar] [CrossRef] [Green Version]
  52. Lee, S.; Kim, J.; Ku, B.-C.; Kim, J.; Joh, H.-I. Structural Evolution of Polyacrylonitrile Fibers in Stabilization and Carbonization. Adv. Chem. Eng. Sci. 2012, 2, 275–282. [Google Scholar] [CrossRef] [Green Version]
  53. Li, J.; Su, S.; Zhou, L.; Kundrát, V.; Abbot, A.M.; Mushtaq, F.; Ouyang, D.; James, D.; Roberts, D.; Ye, H. Carbon nanowalls grown by microwave plasma enhanced chemical vapor deposition during the carbonization of polyacrylonitrile fibers. J. Appl. Phys. 2013, 113, 024313. [Google Scholar] [CrossRef] [Green Version]
  54. Surianarayanan, M.; Vijayaraghavan, R.; Raghavan, K.V. Spectroscopic investigations of polyacrylonitrile thermal degradation. J. Polym. Sci. Part Polym. Chem. 1998, 36, 2503–2512. [Google Scholar] [CrossRef]
  55. Conley, R.T.; Bieron, J.F. Examination of the oxidative degradation of polyacrylonitrile using infrared spectroscopy. J. Appl. Polym. Sci. 1963, 7, 1757–1773. [Google Scholar] [CrossRef]
  56. Henrici-Olivé, G.; Olivé, S. Molecular interactions and macroscopic properties of polyacrylonitrile and model substances. In Chemistry; Springer: Berlin/Heidelberg, Gemany, 1979; Volume 32, pp. 123–152. [Google Scholar] [CrossRef]
  57. Torop, J.; Palmre, V.; Arulepp, M.; Sugino, T.; Asaka, K.; Aabloo, A. Flexible supercapacitor-like actuator with carbide-derived carbon electrodes. Carbon 2011, 49, 3113–3119. [Google Scholar] [CrossRef]
  58. Barsoukov, E.; Macdonald, J.R. (Eds.) Impedance Spectroscopy: Theory, Experiment, and Applications, 2nd ed.; Wiley-Interscience: Hoboken, NJ, USA, 2005. [Google Scholar]
  59. Feng, X. Nanocarbons for Advanced Energy Storage, Volume 1; John Wiley & Sons: Hoboken, NJ, USA, 2015. [Google Scholar]
  60. Fic, K.; Lota, G.; Meller, M.; Frackowiak, E. Novel insight into neutral medium as electrolyte for high-voltage supercapacitors. Energy Environ. Sci. 2012, 5, 5842–5850. [Google Scholar] [CrossRef]
  61. He, M.; Fic, K.; Frąckowiak, E.; Novák, P.; Berg, E.J. Influence of aqueous electrolyte concentration on parasitic reactions in high-voltage electrochemical capacitors. Energy Storage Mater. 2016, 5, 111–115. [Google Scholar] [CrossRef]
Figure 1. (a) Electrospun electrode 3 × 4 cm2 sheet and (b) morphology of the fibres by examined SEM.
Carbon 07 00046 g001
Figure 2. N2 absorption–desorption isotherms and pore size distribution of the CDC before and after milling.
Carbon 07 00046 g002
Figure 3. FTIR spectra of PAN/DMF fibre (reference) and the fibres soaked in aqueous 1.0 M electrolytes: Na2SO4-H2O, KNO3-H2O, KNO3-H2O.
Carbon 07 00046 g003
Figure 4. Constant current discharge curve at 0.25 mA cm−2.
Carbon 07 00046 g004
Figure 5. Cyclic voltammograms expressed as capacitance per CDC weight in fibrous electrodes in 1 M aqueous electrolytes (v = 20 mV s−1).
Carbon 07 00046 g005
Figure 6. Electrochemical performance of “electropsun” CDC based fibrous electrodes in aqueous electrolytes: (a,b) specific capacitance values from CC discharge plots at I = 0.5 mA cm−2 for positively and negatively charged electrodes, (c) CC charge–discharge, curves I = 0.5 mA cm−2 (d) specific capacitance, Cs as a function of frequency and (e) resistance, Rs as a function of frequency from EIS measurements at 0 V vs. Ag|AgCl.
Carbon 07 00046 g006
Figure 7. Electrochemical performance of “electropsun” CDC-based fibrous electrodes in xM NaNO3 electrolytes: (a,b) capacitance values obtained from CC discharge plots at I = 0.5 mA cm-2 for positively and negatively charged electrodes, (c) Cs (at I = 50 mHz) as a function of potential from EIS measurements and (d) Nyquist plot at 0 V (vs. Ag|AgCl).
Carbon 07 00046 g007
Figure 8. Cycle-life performance of fibrous CDC-based electrodes of 1000 cycles (shapes) with extrapolation of 3000 cycles (lines): (a) capacitance retention by CV at 20 mV s−1 and (b) series resistance change during cycling by EIS.
Carbon 07 00046 g008
Table 1. Porosity characteristics of CDC.
MaterialSaBETSadftVtotVµ dft
m2 g−2m2 g−2cm3 g−2cm3 g−2
Non-milled128213900.670.53
Milled109811730.660.44
Table 2. Conductivity, pH values and ion sizes [30] for used aqueous electrolytes.
SaltMolarity, MConductivity, mS cm−1pHIon Radius, nm
CationAnion
Na2SO41.078.27.130.120.24
KNO31.073.27.340.150.17
NaNO30.273.06.850.120.17
NaNO31.089.27.10
NaNO32.5103.07.08
NaNO35.0117.27.02
Table 3. Gravimetric capacitance values for positively and negatively charged electrodes evaluated by CC tests at a current density of 0.5 mA cm−2 in 1 M solutions.
C+ Electrode,C+ CDC,C Electrode,C CDC,
ElectrolyteF g−1F g−1F g−1F g−1
NaNO3-H2O40.8177.563.5276.1
KNO3-H2O47.7132.057.0157.6
Na2SO4-H2O34.6150.751.0221.9
Publisher’s Note: MDPI stays neutral with regard to jurisdictional claims in published maps and institutional affiliations.