1. Introduction
Amorphous hydrogenated carbon (a–C:H) films have a number of very interesting physical and chemical properties [
1,
2], which make them possible candidates for a wide range of technical applications. Discussed applications include optical, mechanical, electronic and biomedical applications [
3]. Examples are protective coatings on devices such as hard disks [
4,
5,
6], diesel-injection systems [
7] and coronary stents [
8,
9] or other medical applications [
10]. A significant number of such technical applications is based upon the outstanding tribological properties of a–C:H films [
5,
11,
12,
13] and for many technical applications the thermal stability of a material is a topic of relevance. First systematic investigations of the thermal decomposition of a–C:H films were published by Wild and Koidl in 1987 [
14]. Later on, thermal release of hydrogen from hydrogen containing carbon films or thermal decomposition of such layers has gained some attention in the field of thermonuclear fusion [
15,
16,
17,
18,
19,
20,
21,
22] and due to this the thermally induced release of hydrogen was studied to some extend in dedicated laboratory experiments. Küppers and co-workers [
15,
23,
24,
25] investigated this topic in the early nineties. They used thin ion-beam deposited films with thicknesses ranging from one to ten monolayers and investigated them in an ultrahigh vacuum system using thermal desorption spectroscopy and high resolution electron energy loss spectroscopy. Their results will be discussed in detail in
Section 5.
Salançon et al. have published two articles regarding the thermal decomposition of plasma-deposited a–C:H films [
26,
27] which concentrated on polymer-like, hydrogen-rich, soft a–C:H films. Thermal decomposition of these films produces a vast variety of hydrocarbon species with significant contributions of C
xH
y species containing up to five carbon atoms and even traces of molecules with up to seven carbon atoms were detected. Comparing the thermal decomposition of soft, hydrogen-rich films with that of typical hard a–C:H films they found that the relative contribution of high molecular weight species is much higher for soft films compared with hard films. This is in agreement with published results for a-C:H films [
14,
28,
29,
30] and it is a consequence of the difference in microstructure of the films. While the hydrogen in hard a–C:H films is dominantly released in form of H
2, release from the soft films is dominated by hydrogen bonded in hydrocarbon species. These hydrogen-rich soft films possess not only a different spectrum of released species but release occurs also at much lower temperatures [
27].
Thermal release spectra of D from different D-containing carbon layers were also analysed by Pisarev et al. [
31]. The D release spectra of typical hard a-C:H films shown in [
31] are, in principle, nicely comparable with those by Salançon et al. A remarkably comprehensive characterisation of annealing-induced changes of the many different properties of various plasma-deposited a–C:H films was published by Peter et al. [
32,
33]. Overall, their findings regarding thermal stability are also in good agreement with the earlier studies. However, an advanced evaluation of the thermal release data (e.g., determining binding energies) was not made in both cases.
This article is focussed on the thermally induced release of hydrogen from hard a–C:H films. Previous investigations have shown a rather broad release spectrum ranging from about 600–1250 K. Questions to be addressed are: How is hydrogen bonded in a–C:H films? Is the observed peak width mainly due to the release kinetics (bond breaking, diffusion and desorption) or a consequence of a distribution of binding energies? We performed dedicated experiments to address these questions.
One remark regarding nomenclature: In the literature, different names are used for the method we apply here: thermal desorption spectroscopy (TDS), temperature-programmed desorption (TPD), and thermal effusion spectroscopy (TES). These different names emphasise different aspects of the underlying process. We do not want to argue about the pros and cons of these names here. We just state that, although we used TES in the past (and that is the reason for naming our experimental setup), we are going to use temperature-programmed desorption (TPD) throughout this article.
4. Results
Most experiments were performed for a nominal temperature ramp of 15 K/min. The calibration experiments have shown that for this ramp the sample temperature follows closely the oven temperature and that the sample temperature slope is linear over a wide range. This ramp is a good compromise between linearity of the ramp, signal intensity, and required time for one experiment.
Figure 2 shows a typical TPD spectrum for a hard a–C:H film. The data processing presented in
Figure 2a was discussed in
Section 2.4. The processed data are shown in
Figure 2b as a function of sample temperature. No significant H
2 desorption is found for temperatures lower than 600 K. With further increasing temperature the signal increases strongly and reaches a maximum at 875 K (1st peak). For higher temperature the signal decreases and shows a shoulder in the range of 1000–1100 K (2nd peak). We assign a temperature of approximately 1050 K for the second peak. For temperatures larger than 1100 K the signal decreases further. However, when the maximum oven temperature of 1275 K is reached the signal has not yet gone to zero. This is certainly an unsatisfactory situation, but higher sample temperatures were not possible in the present set of experiments. After such a TPD experiment up to an oven temperature of 1275 K about 5% of the initial amount of hydrogen remains in the sample. This was checked by ex-situ ion-beam analyses of samples after TPD experiments [
58]. This retention of a small amount of the initial hydrogen content does not influence the conclusions for the temperatures below 1170 K. We further emphasize that the TPD spectra for different individual samples show excellent reproducibility. Also presented in
Figure 2b is the TPD signal for 16 amu, which is predominantly due to methane. The methane peak occurs at approximately the same temperature as the first hydrogen peak but falls off quickly at higher temperatures reaching background level at about 1000 K. We have shown earlier [
27] that the hydrogen release is accompanied by release of various hydrocarbons. For hard a–C:H films the release of hydrogen containing volatile species is by far dominated by molecular hydrogen. Quantitative analyses of the QMS spectra have shown that about 85% of the hydrogen in the hard a–C:H film is released in form of H
2 [
58]. The contribution of C
xH
y is however not topic of this article and the interested reader is referred to Ref. [
27] for further discussion.
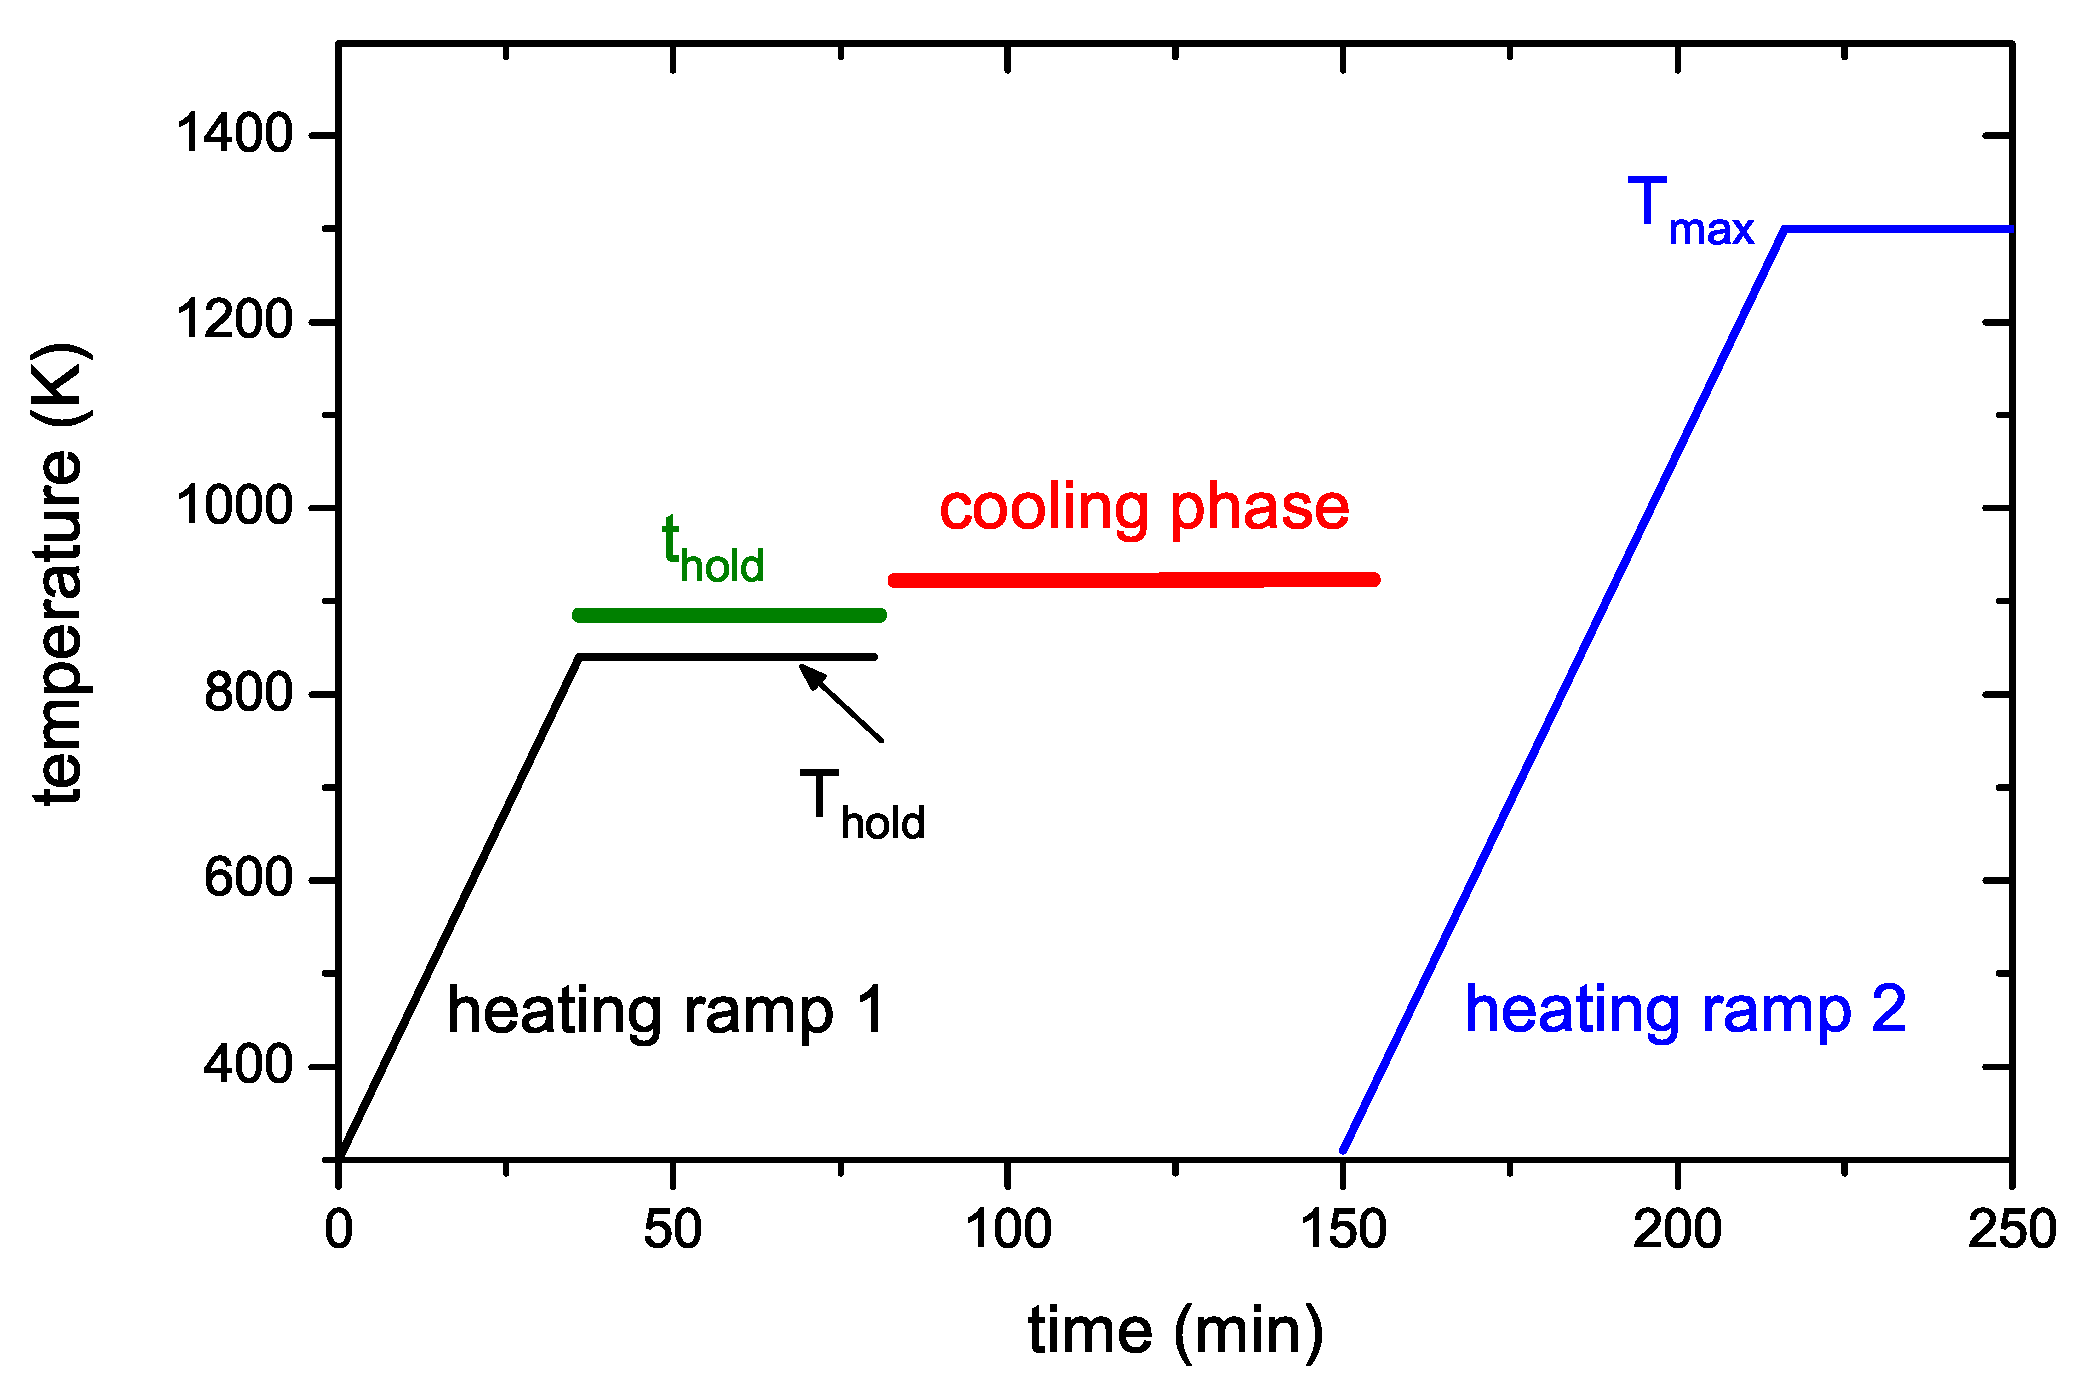
Figure 4 presents two examples of R&H experiments for T
hold = 878 K. The data in
Figure 4a are for a holding time of 0 min, i.e., the oven was immediately removed from the glass tube after reaching the oven target temperature of 917 K (this corresponds to a momentary sample temperature of 845 K).
Figure 4b presents equivalent data for a holding time of 60 min. In this experiment the oven was kept at the target temperature of 917 K for 60 min and then removed. This oven temperature of 917 K corresponds to a steady-state sample temperature of 878 K. However, due to the time lag between oven and sample temperature as was described in detail in
Section 2.2, the sample temperature increases for about another 5 min after the oven has reached the holding temperature. As a consequence, the maximum temperature for zero holding time is only 845 K. Both figures show the reference spectrum from
Figure 2 for a continuous ramp up to the maximum temperature (black open squares) and the data for the first (red solid circles) and second (green solid circles) ramp of the R&H experiments. In both cases, the signal during the first ramp up to the holding temperature is practically identical to the reference spectrum. Removing the oven after reaching the target temperature (
Figure 4a) leads to an almost instantaneous drop of the sample temperature and correspondingly to a drop of the 2 amu signal to background level. In
Figure 4b, the 2 amu signal still increases a little bit after reaching the target temperature (this is due to the discussed time lag between sample and oven temperature) and then falls off rapidly.
The QMS signals of the two second ramps differ depending on the holding time spent at T
hold. The spectrum during the second temperature ramp in
Figure 4a (t
hold = 0 min) reproduces the part of the reference signal that is released at sample temperatures higher than the maximum temperature reached during the first ramp. The spectrum during the second temperature ramp in
Figure 4b (t
hold = 60 min) shows only the second peak, but in both cases, the high temperature part of the TPD spectrum is unaffected. Holding the sample at 878 K for about 60 min is able to release some additional hydrogen compared with t
hold = 0 min, but it is not able to significantly depopulate the states at higher temperature (more than 150 K above T
hold).
The whole set of R&H experiments at 878 K with varying holding time t
hold is presented in
Figure 5.
Figure 5a shows the QMS 2 amu signal recorded during the first ramp up to the oven temperature of 917 K and the corresponding sample temperature evolution. The increasing flanks of the first peak for the four different experiments are practically indistinguishable. Only the curve for a holding time of 0 min ends abruptly and has a slightly lower maximum value than the other shown curves. This is due to the temperature lag discussed above (see discussion of
Figure 4). This temperature lag can be clearly seen from the sample temperature characteristic, which still increases for about five more minutes after the oven has reached its maximum temperature. The decaying part of the peak for the different holding times of 10, 30 and 60 min is also practically identical except for the fact that effusion stops abruptly after the different holding times. The peaks from the second ramp (
Figure 5b) exhibit a continuous transition between the two cases shown in
Figure 4. What is particularly remarkable is that the high temperature part of the different experiments is identical. Increasing holding time leads to increasing release of some additional hydrogen. States which would be released during a normal TPD run at slightly higher temperature than T
hold are depopulated faster than higher lying states, but the high temperature part of the release spectrum is practically unaffected. In addition to the data shown, some experiments with different T
hold were performed which show in principal identical behaviour. Also TPD measurements with samples exhibiting a layer thickness of 300 nm have been performed. Despite the significantly larger thickness (almost a factor of four), the TPD peak positions are not delayed.
This observation, together with the results presented in
Figure 4 are a clear proof that the width of the TPD spectrum is not due to diffusive effects but represents the binding energy distribution (BED) of hydrogen in the a–C:H film. This will be discussed in more detail in
Section 5. In the remainder of this article, we will use the phrase ‘binding energy distribution’ instead of ‘population density’, which was used in
Section 3. While the latter is more appropriate in the theoretical description of the problem, we consider the former more suitable to convey the experimental findings. To reconstruct the BED from the experimental data, the pre-exponential factor
for Equation (
1) has to be determined. As discussed in
Section 3 (see Equation (
7)),
can be determined from the shift of the TPD peak as a function of different temperature ramps.
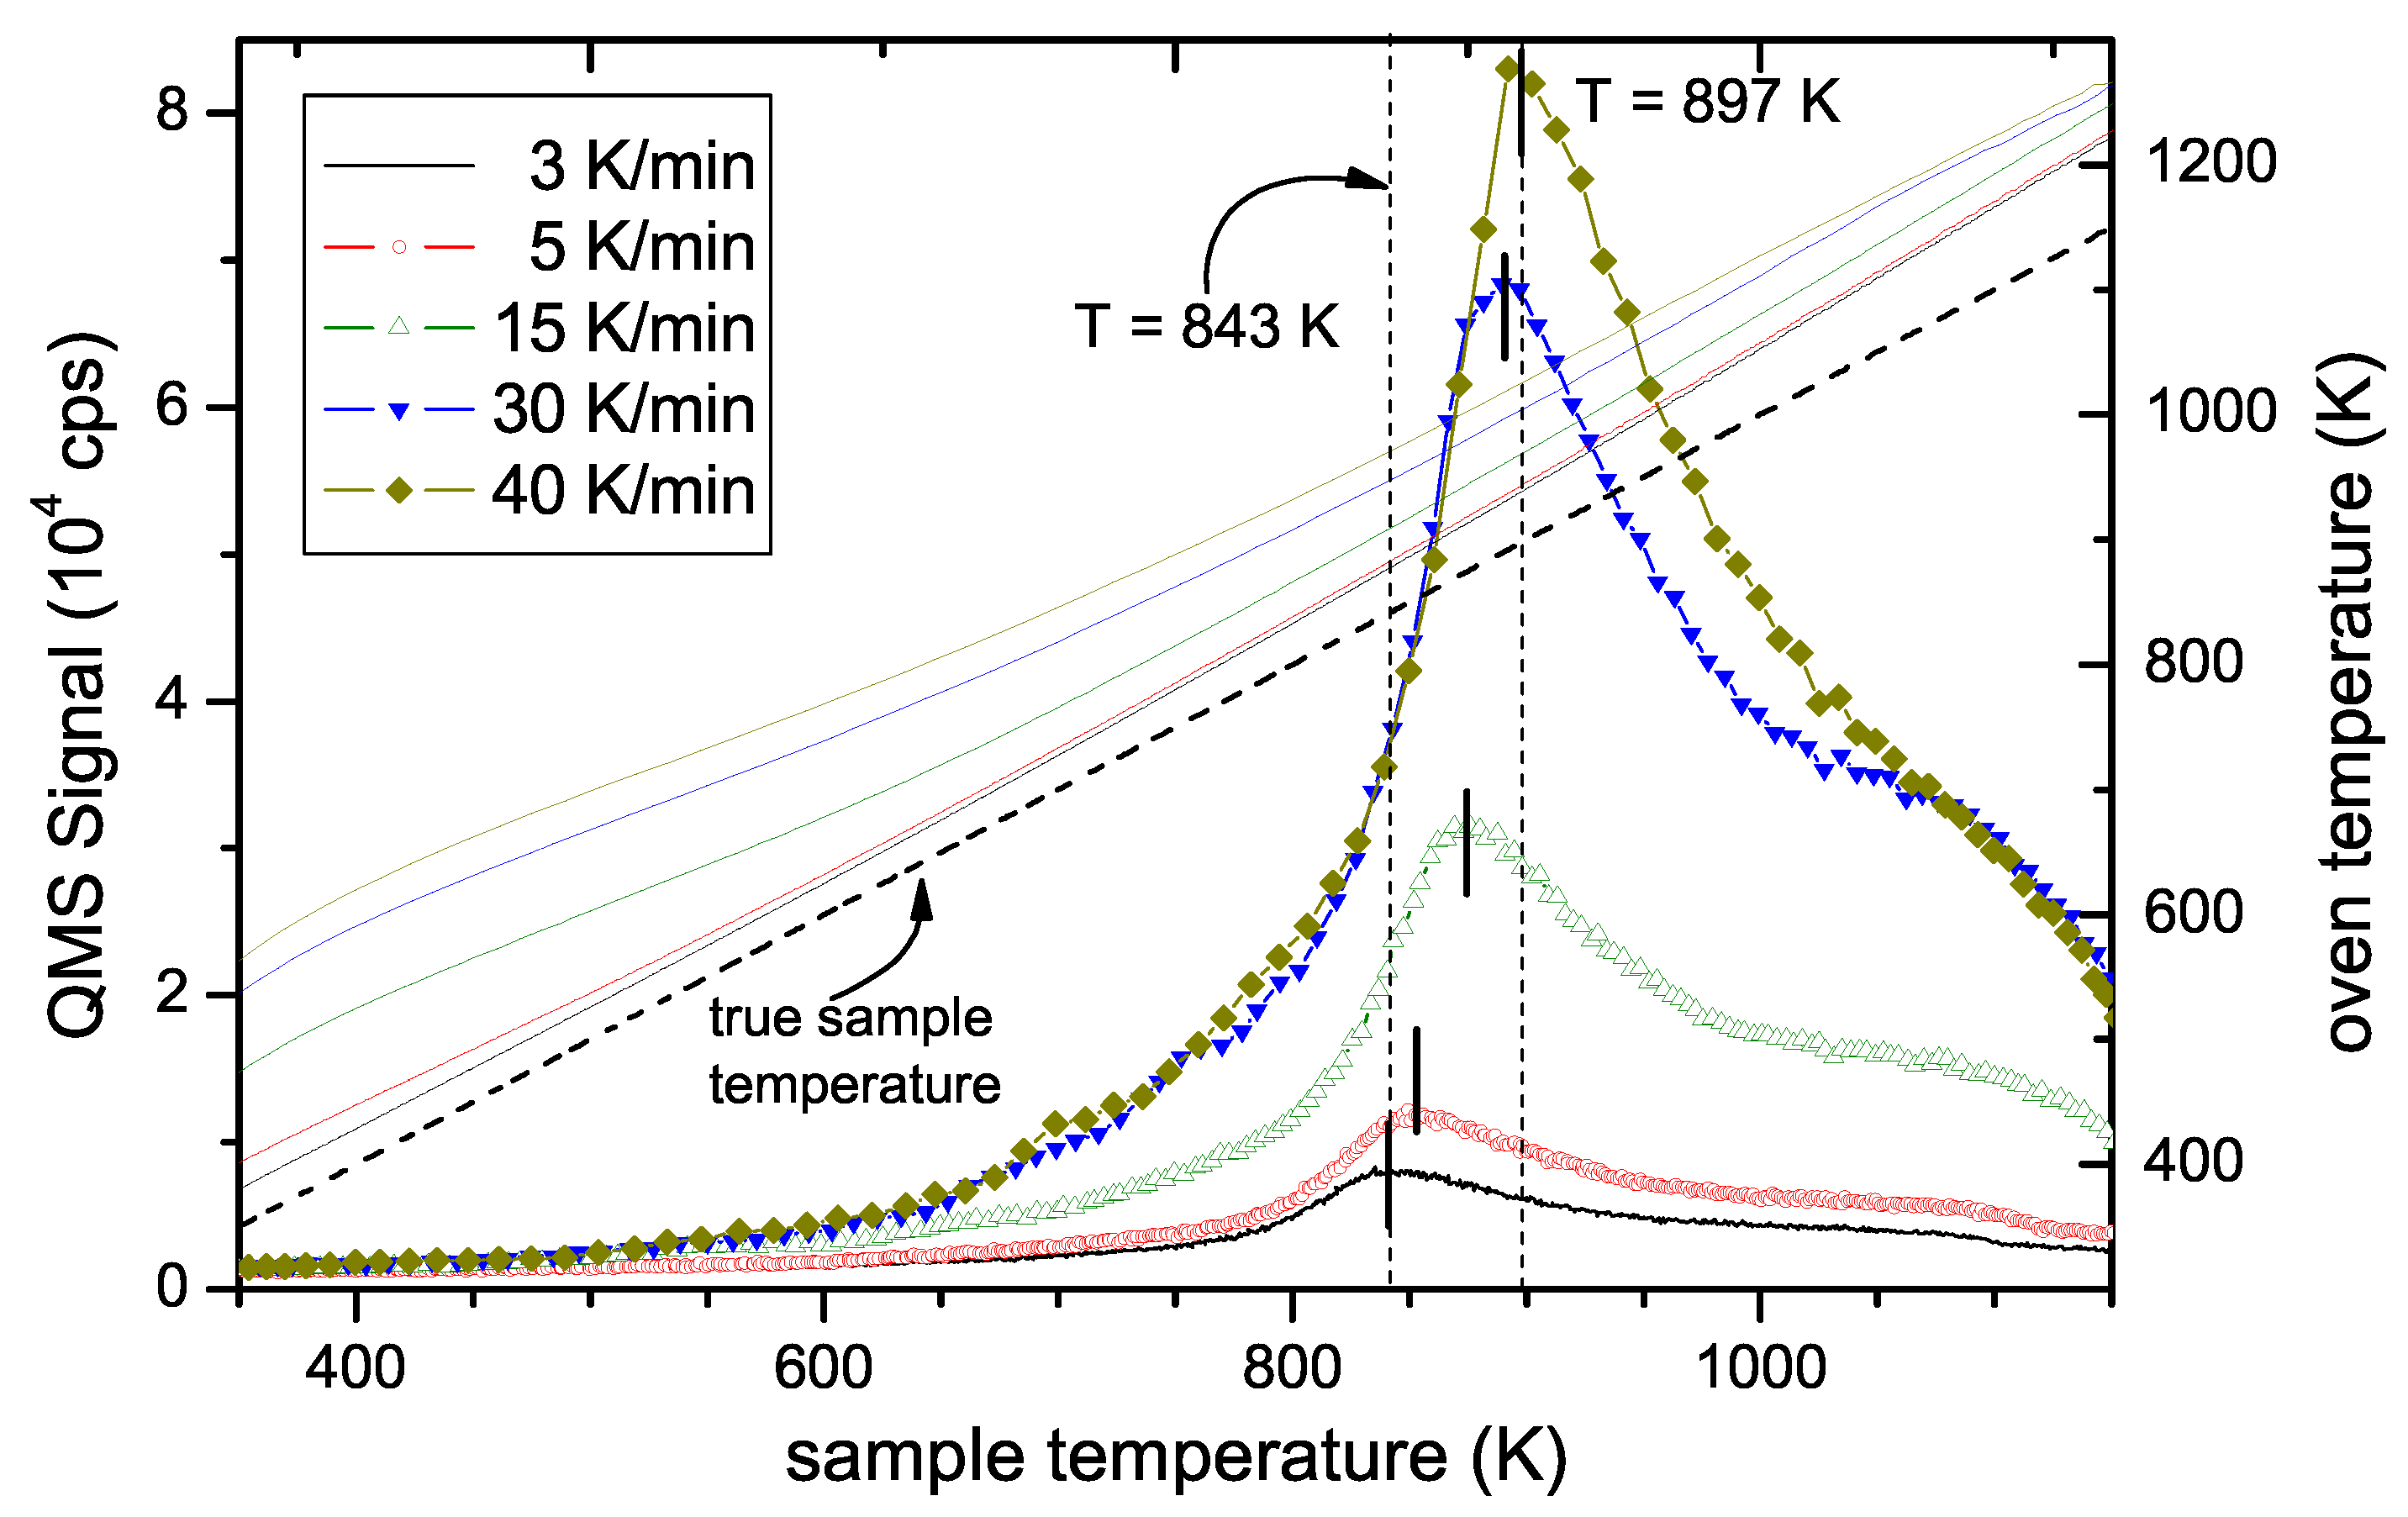
Figure 6 shows TPD spectra as a function of sample temperature measured for temperature ramps ranging from 3 to 40 K/min. Two facts are obvious: First, the height of the peak varies strongly and second, the position of the maximum shifts to higher temperatures with increasing heating rate. The shift of T
peak is the effect that allows determining
. The change in signal intensity is due to the change in release rate. Please note that for the different ramps, the different signal heights are expected because the total number of released species is constant rather than the release rate. We have checked that the time integral of the TPD spectra for the different ramps is in good agreement. In other words, the total amount of released hydrogen during these experiments with different temperature ramps is identical. The nominal oven temperature ramps, R
oven, the corresponding sample temperature ramps, R
sample, and maximum peak temperatures, T
peak, are given in
Table 1. Due to the slight deviation of the true sample temperature ramp from linear behaviour as discussed in
Section 2, the value for R
sample given in
Table 1 is the derivative of T
sample at position T
peak.
The left-hand side of Equation (
7) is plotted in
Figure 7 as a function of 1/T
peak. The data lie on a straight line from which we determine
1/s. The uncertainty of the line fit results in lower and upper limits of the confidence interval of
1/s and
1/s, respectively. This range deviates significantly from the value of
1/s, which is usually assumed if nothing else is known [
23,
24,
59]. The consequence of this much higher pre-exponential factor
for the analysis will be discussed in
Section 5.
Applying the experimentally determined pre-exponential factor
all measured TPD spectra for 2 amu can be excellently fitted by one generic binding energy distribution. The different series of TPD spectra and the corresponding experimental parameters used to derive the BED are summarized in
Table 2. The evaluation procedures were described in
Section 3. In total, we used 11 independent experiments to derive the BED.
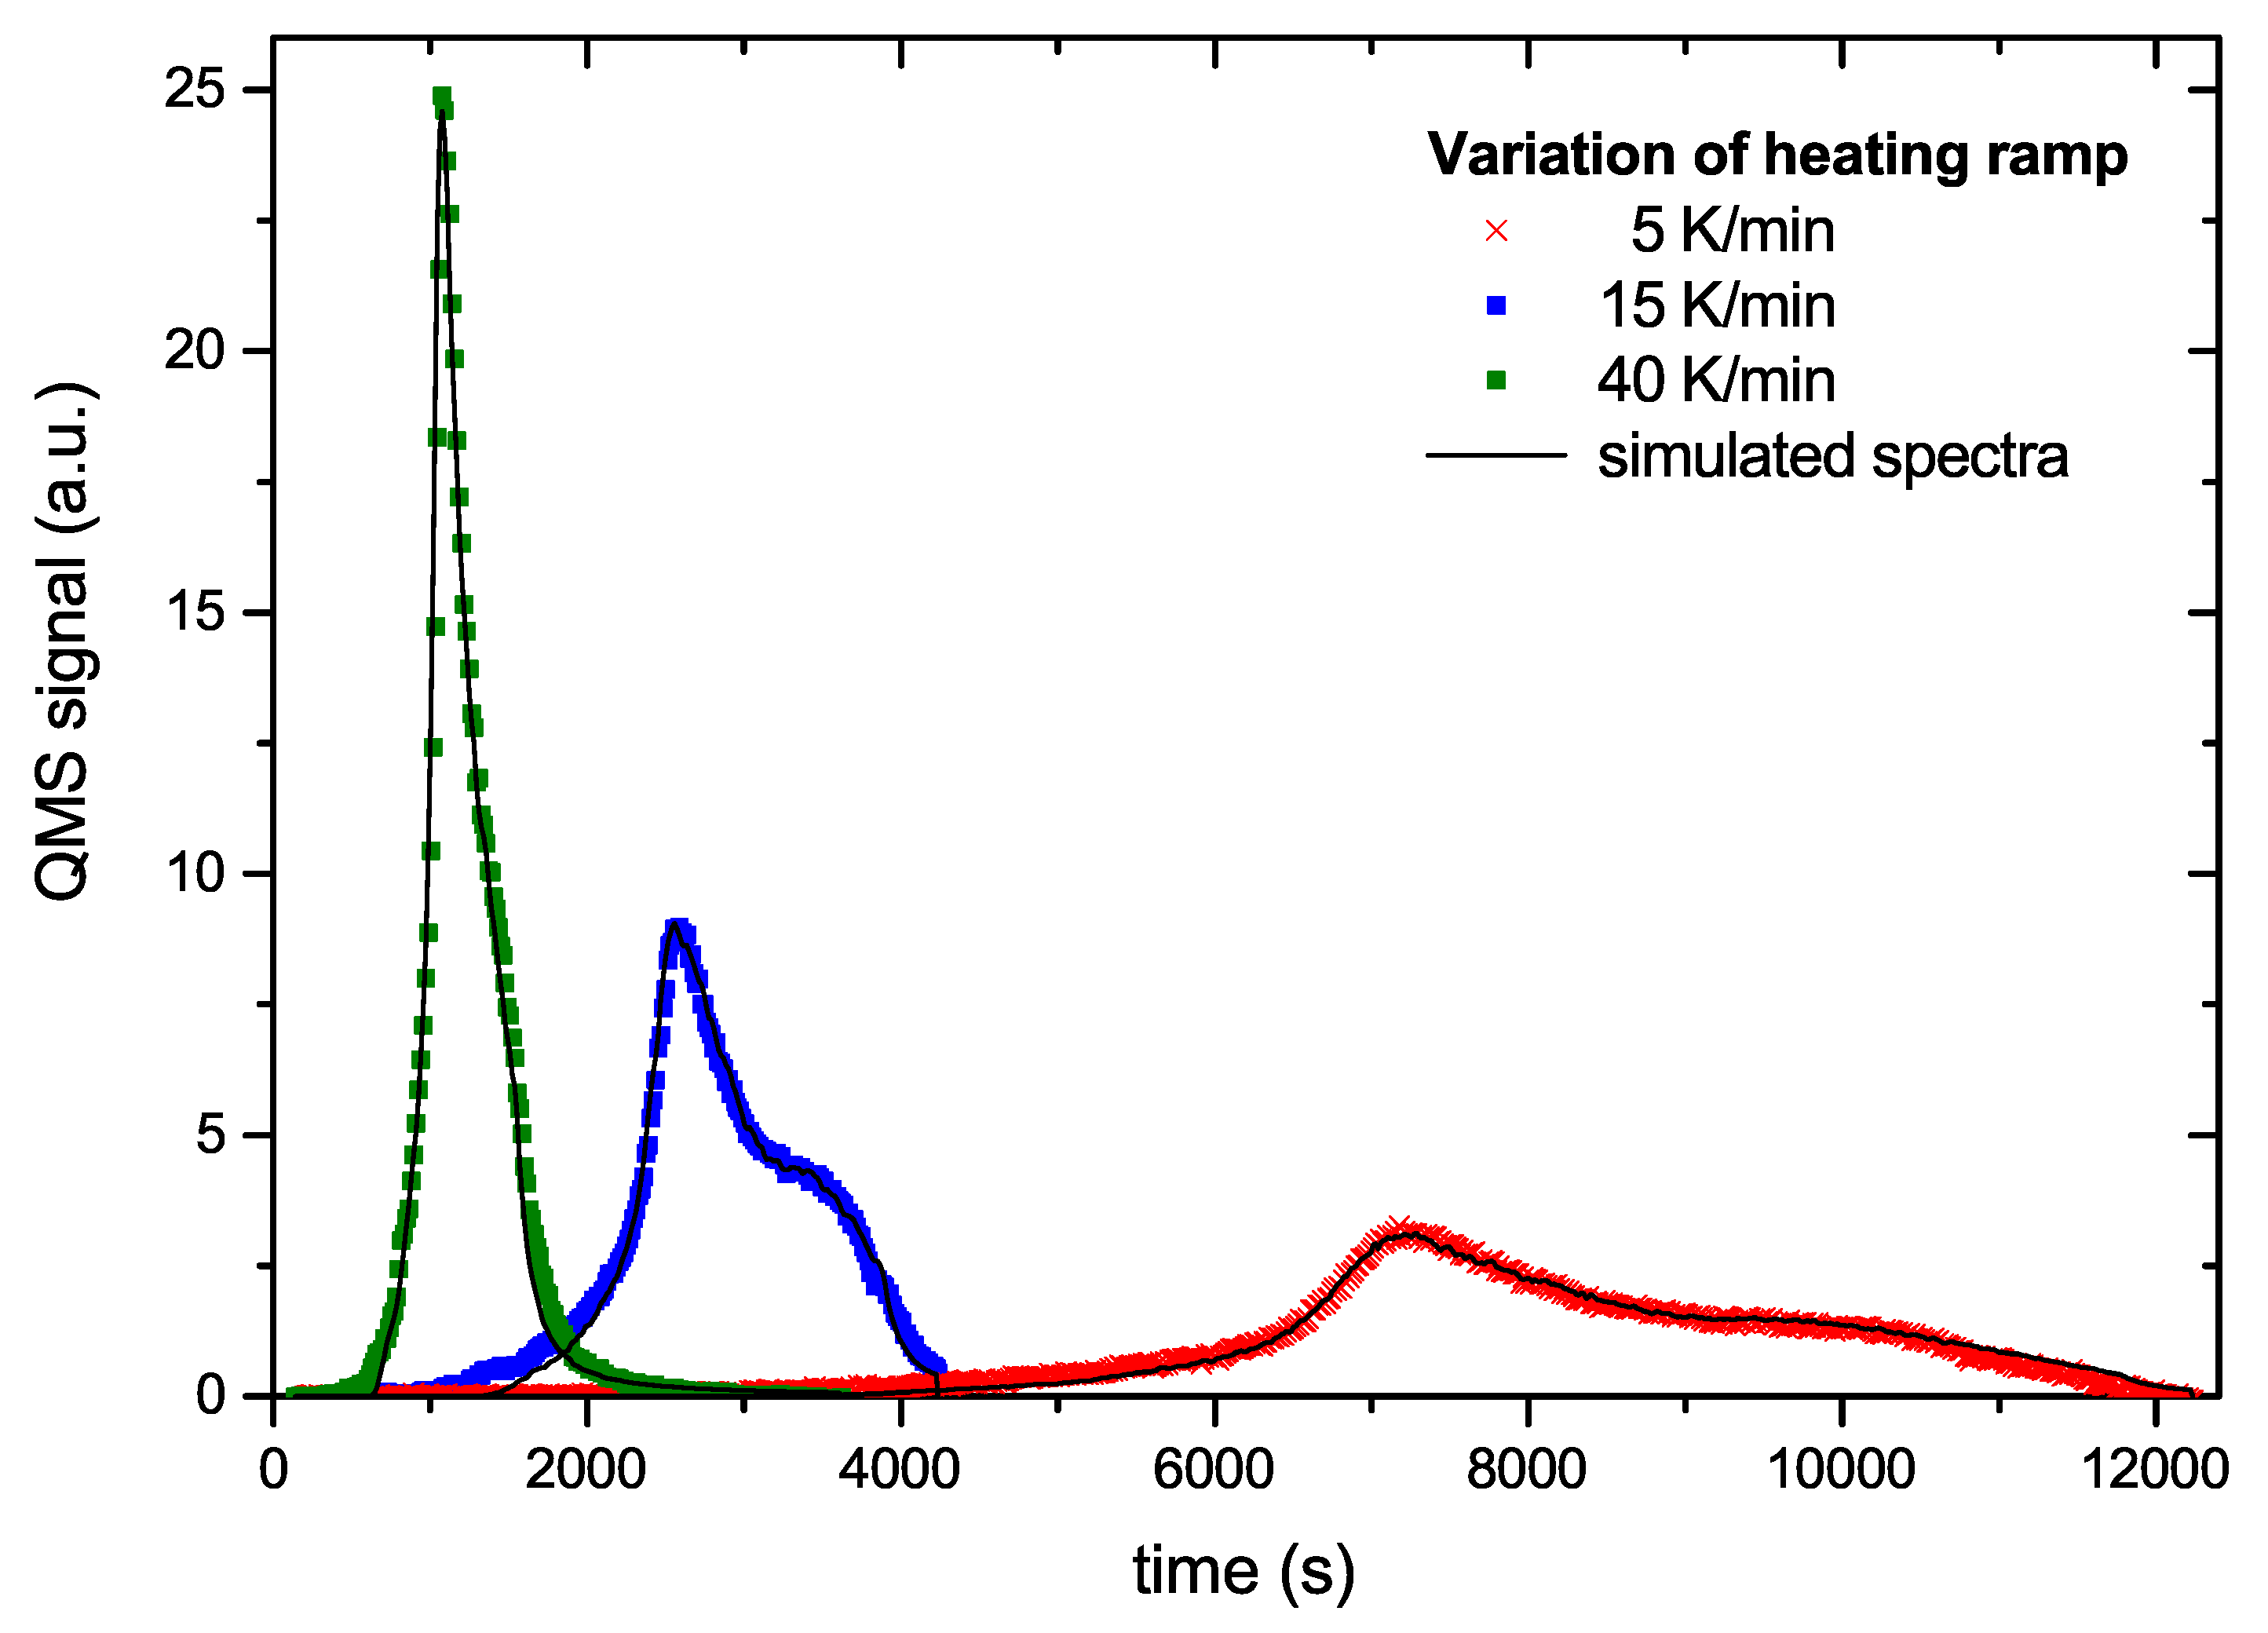
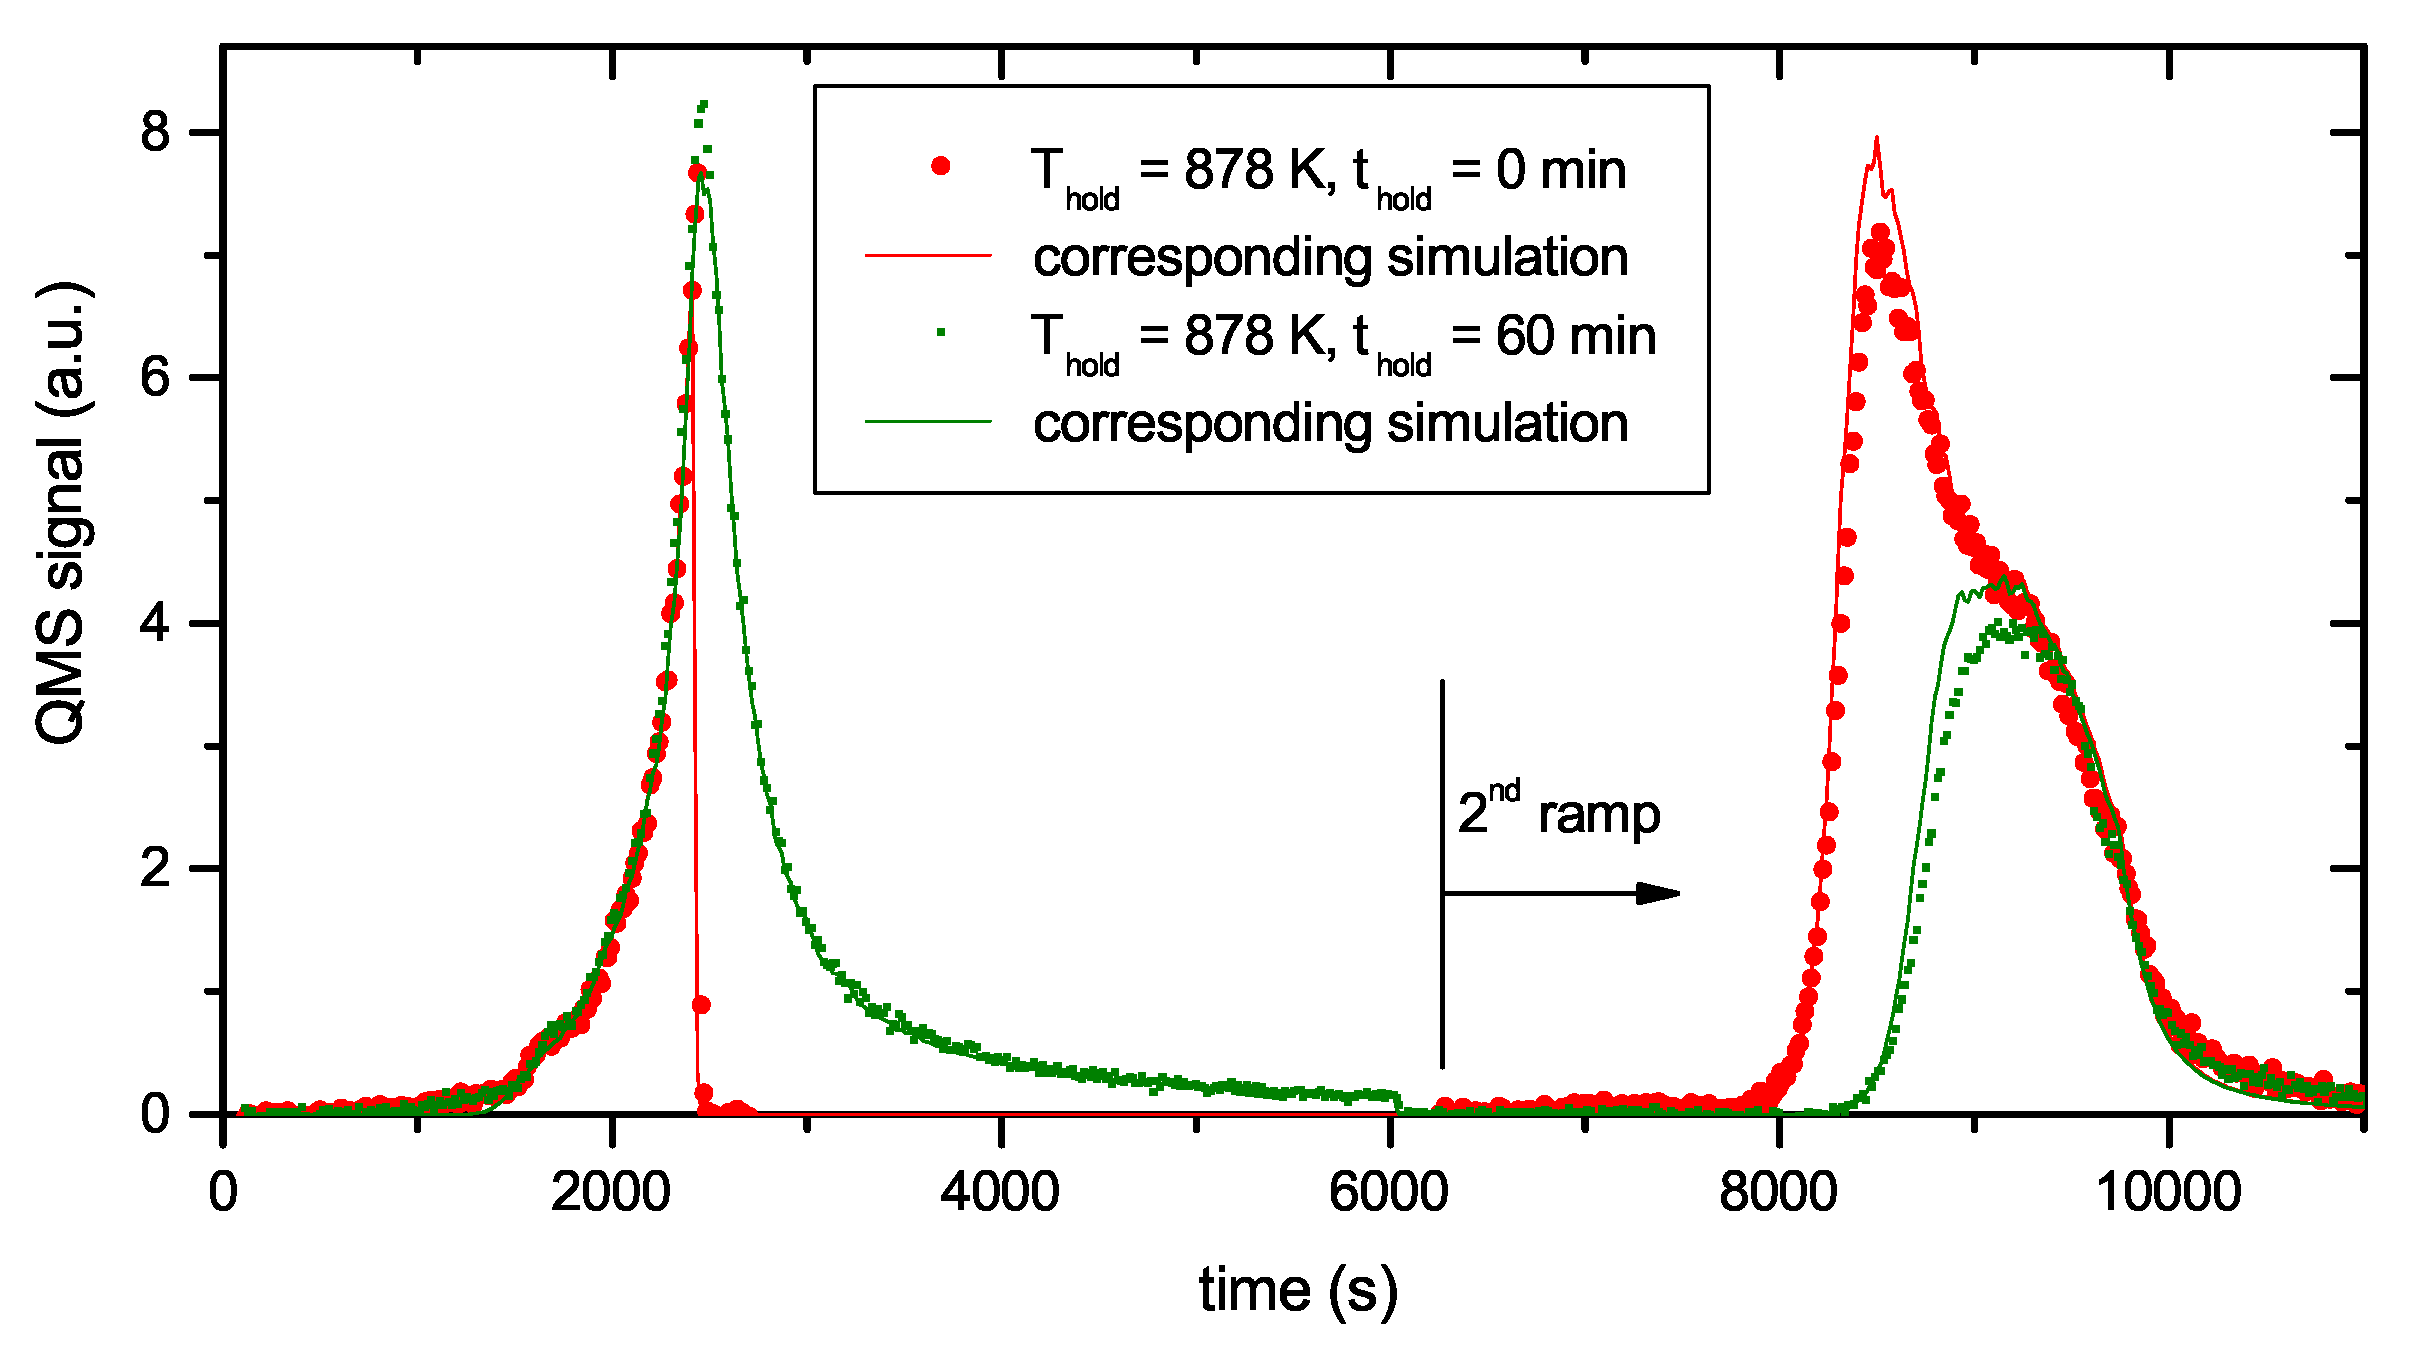
Figure 8 and
Figure 9 show examples of a comparison between the measured data and the simulated data based on the generic BED. The overall agreement is excellent.
Figure 8 shows three curves from the series with different temperature ramps. The symbols represent the data points and the solid lines the model results. The model can hardly be distinguished from the experimental data. In
Figure 9 we plot two time traces of R&H experiments. In this plot the times scales of the first and second ramp are simply concatenated. The agreement between model and experimental data again is very good. Small deviations occur only at the tip of the first peak and around the maximum of the second peak. The comparison of the other 6 data sets used for deriving the BED with the model result is of equal quality to those shown in
Figure 8 and
Figure 9.
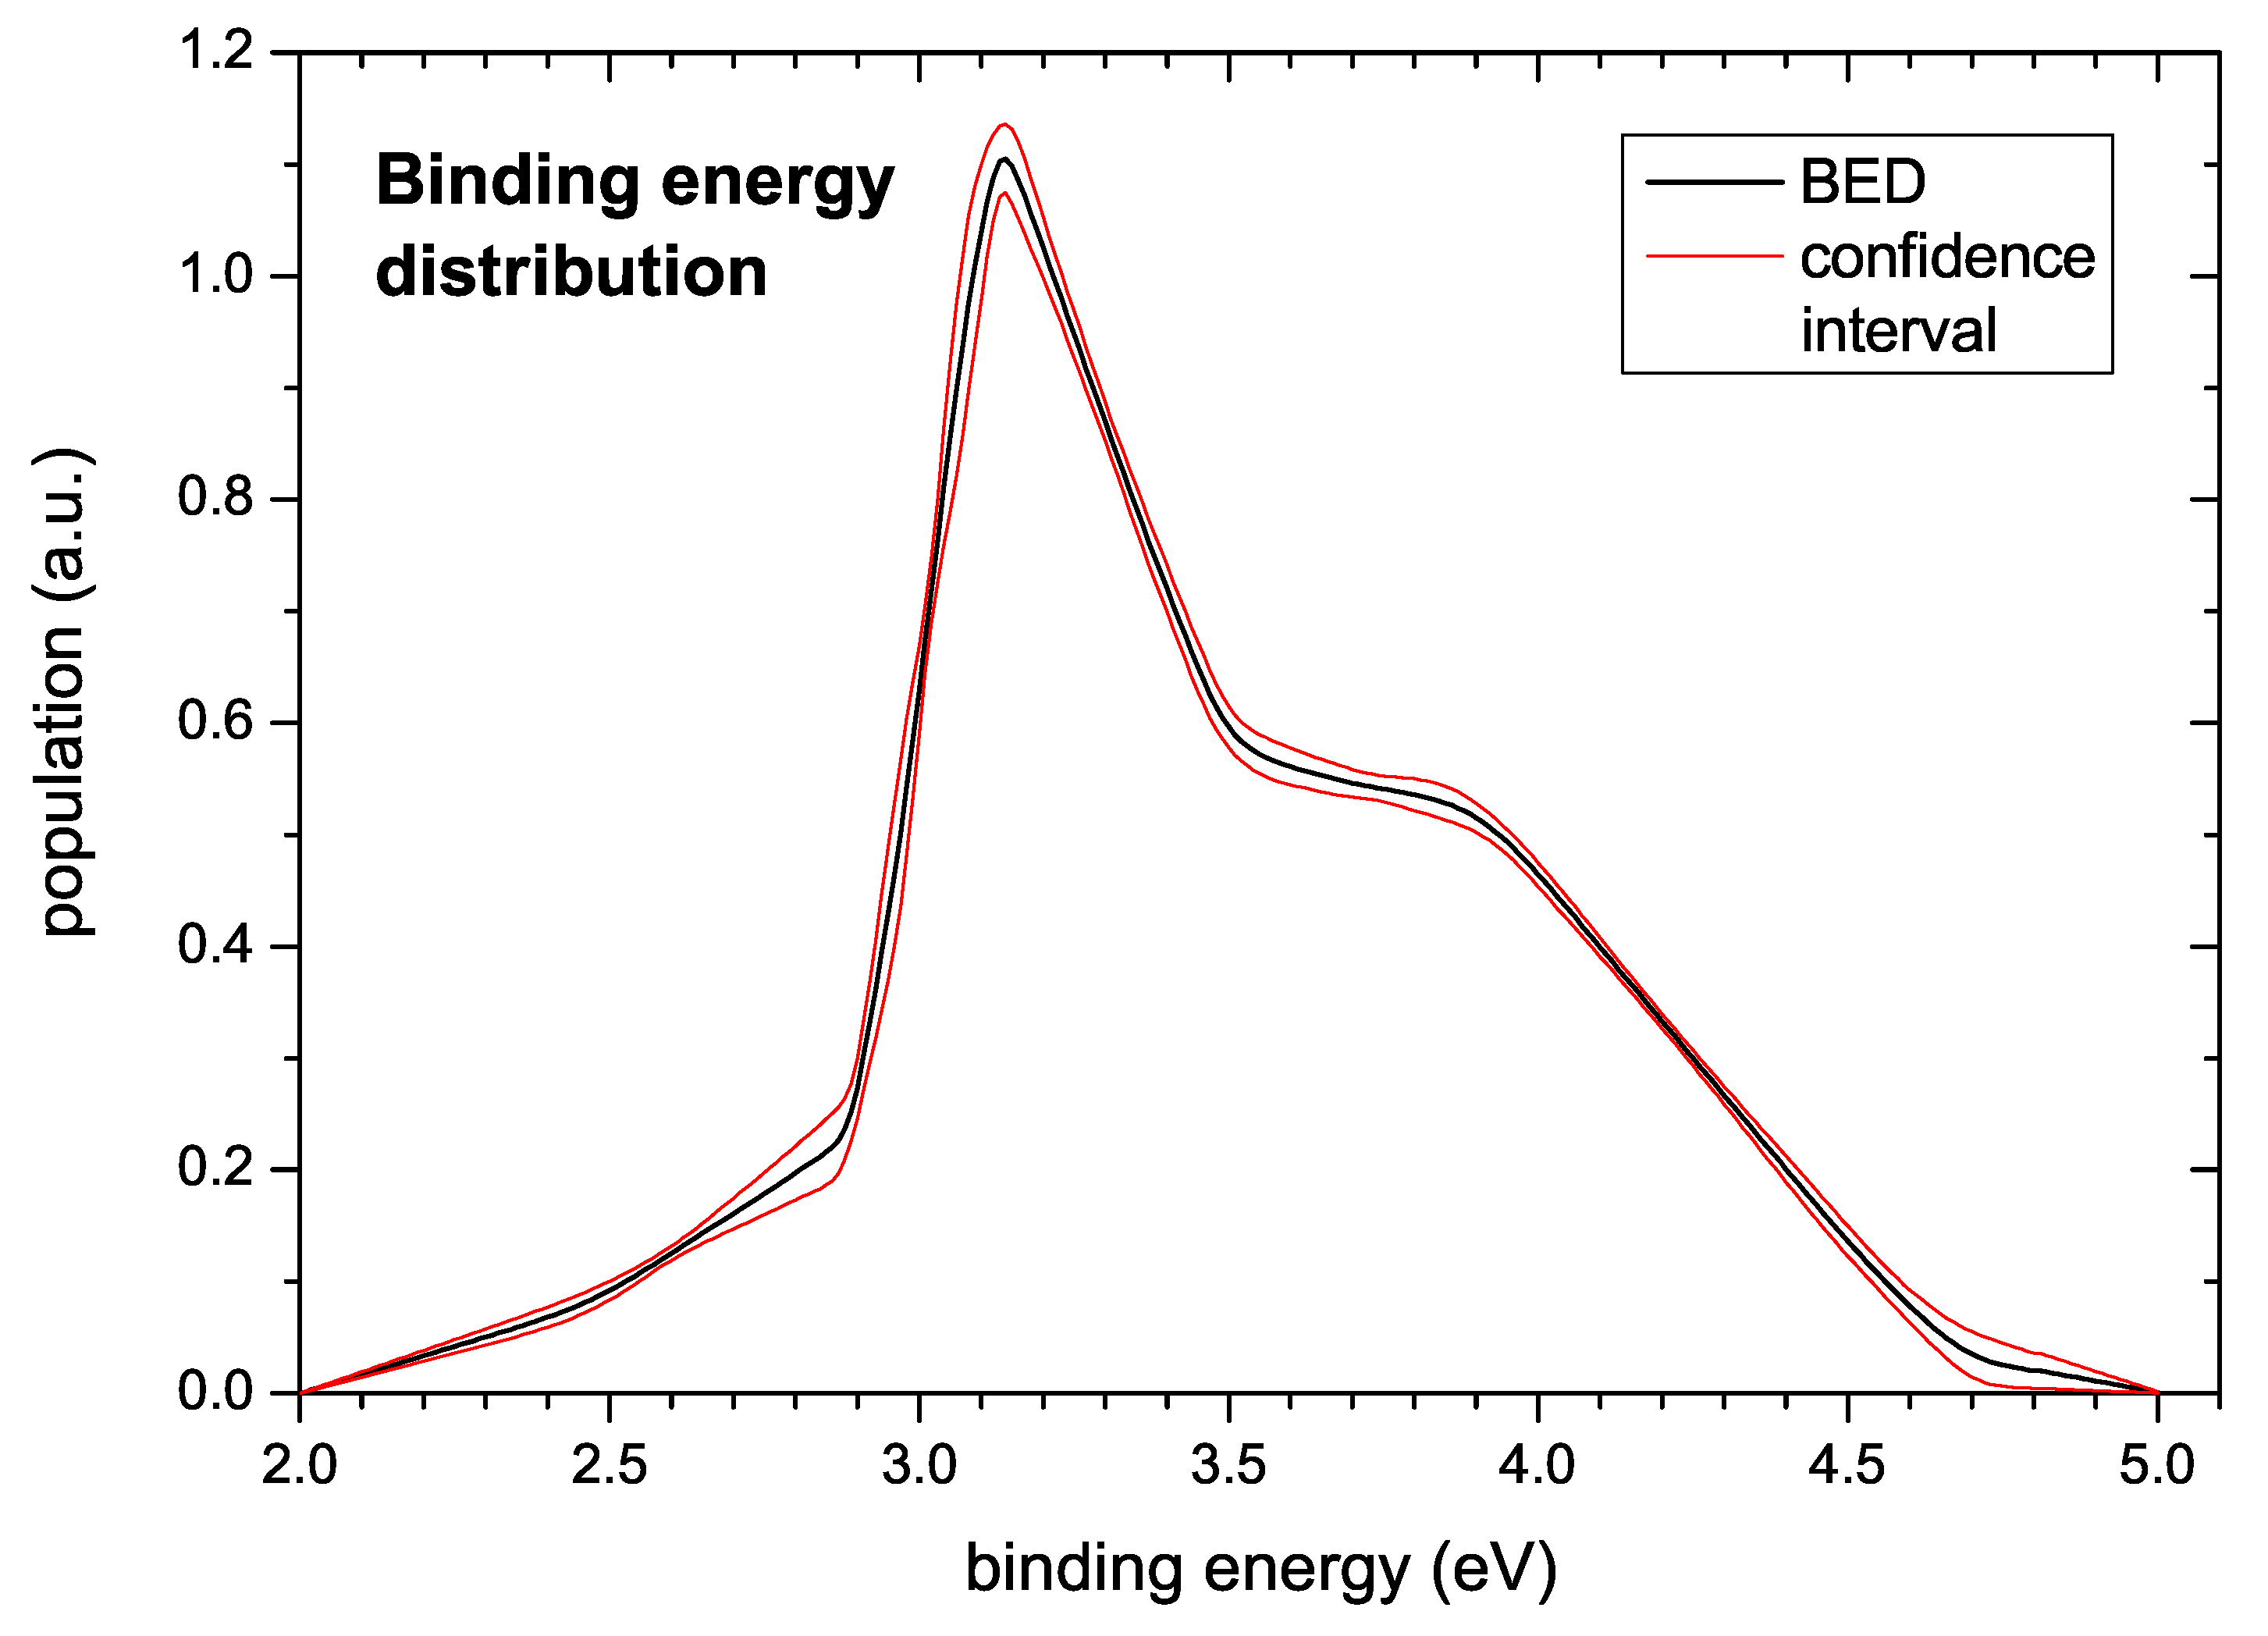
The generic binding energy distribution extracted from the data is presented in
Figure 10. Hydrogen bonded in the investigated a–C:H films gives rise to a BED starting at about 2.5 eV and extending to about 4 eV. The shape is similar to the shape of the TPD spectra with a peak at around 3.2 eV followed by a broad shoulder extending to about 4 eV. A small pre-peak extends from about 2.5 to 3.0 eV. The confidence interval also shown in
Figure 10 was derived according to the algorithm described in
Section 3.
5. Discussion
First temperature programmed desorption measurements of plasma-deposited a–C:H films were published by Wild and Koidl in 1987 [
14]. They have shown that the TPD spectra of different films change drastically with film structure. The effusion spectra for typical hard a–C:H films (in their case for deposition at bias voltages of 500 V and more) are in good agreement with our spectrum shown in
Figure 2. They applied a heating rate of 20 K/min, which lies in the range of temperature ramps applied in our experiments (3–40 K/min, see
Figure 6). In their case the first peak is located at 870 K and the second peak occurs at about 970 K. While the first peak is in very good agreement with our results of 875 K at 15 K/min and 891 K at 30 K/min, their second peak occurs at significantly lower temperature than ours (≈ 1050 K).
In the early nineties, Schenk and co-workers conducted a detailed study of the thermal decomposition of ultra thin a–C:H films [
23,
24,
59]. They produced thin—of the order of 1 to 10 monolayers—films by ion beam deposition of different hydrocarbon molecular ions in an ultrahigh vacuum system and studied the thermal decomposition of these films in situ by TDS. Their hydrogen release spectra are for temperatures above about 700 K in reasonable agreement with our data. In the temperature range between 450 and 700 K their spectra show an additional release plateau which does show up neither in our nor in Wild et al.’s [
14] spectra. This pre-peak was attributed to decomposition of CH
x groups in the Pt/film interface [
15] and is probably an artefact of the specific model system studied. Similarly to our findings [
26,
27] they also detected release of methane and heavier hydrocarbon molecules and report a similar release of methane as shown in
Figure 2b. The peak positions reported by Schenk et al. [
24] for H
2 release are 920 and 1150 K for the first and second peak, respectively. Schenk et al. used a heating rate of 5 K/s (= 300 K/min), which is substantially higher than the heating rates applied in our experiments. It is, therefore, not surprising that their peak temperatures are higher than ours (890 and ≈1050 at 30 K/min, see
Table 1 and
Figure 6). A simulation using our BED (see
Figure 10) and the temperature ramp used by Schenk et al. (i.e., 300 K/min) yields 950 K for the first peak and about 1100–1150 K for the second peak. These values are in good agreement with those of Schenk et al. and confirm the general consistency of the data and our applied analysis. Schenk et al. report the release peak for CH
4 at 880 K, which is in agreement with our peak at 891 K (30 K/min). Taking, however, into account that their faster ramp should lead to a comparable shift of about 30 K as for the first hydrogen release peak, their peak position of 880 K (at 300 K/min) should correspond to a position of about 850 K at a ramp of 30 K/min. This is slightly lower than our peak. The origin of this difference is unclear but could either be due to the much thinner films used by Schenk et al. or a slight difference in the films’ microstructure due to the different film production process. Overall, the agreement with the results of Schenk et al. is satisfactory.
The data presented in
Figure 4 and
Figure 5 together with the unchanged peak positions for layers of different thickness (89 and 300 nm) prove that the width of the thermal effusion spectra is not dominated by diffusive effects but due to a distribution of binding energies. The experimental results can only be explained by a distribution of binding energies if we assume an approximately constant pre-exponential factor.
Figure 4 and
Figure 5 clearly show that binding states depleted in the first run do not become repopulated during the cooling phase or the second heating phase such that desorption during the second run sets in only for temperatures higher than those reached in the first run. This means that in the second run states from higher binding energies are released. If the sample is held at a certain temperature, the release rate drops quickly. During the holding phase, occupied states become depopulated according to the Boltzmann factor. Accordingly, the lower lying states are depopulated faster than the higher lying states. Because the population of these states decreases with time, the release rate also decreases. With increasing holding time the population of these ‘nearby’ states decreases continuously. This can clearly be seen by the shift of the low temperature flank of the peak in the second run (
Figure 5b). Contrary to that, states at significantly higher binding energies are practically unaffected by extended holding times. This is obvious from the unchanged high temperature flank of the peak in the second run in
Figure 5b. Furthermore, if the spectra would be significantly influenced by diffusion processes, they should change with film thickness. The fact that our spectra of about 90 nm thick films are in good agreement with those of Schenk et al. [
15,
23,
24] are an additional indication that diffusion plays no role, but most importantly, Schenk et al. have revealed that the two hydrogen peaks in their TDS spectra correspond to two basically different bonding configurations of hydrogen, namely hydrogen bonded to sp
3- and sp
2-hybridised carbon atoms. This assignment was deduced from a comparison of TDS and high resolution electron energy loss spectroscopy [
15,
25]. Hydrogen bonded to sp
3-hybridised carbon atoms gives rise to the thermal release peak around 900 K and hydrogen bonded to sp
2-hybridised carbon atoms to the higher lying peak around 1100 K in the measurements reported by Schenk et al. [
24] for their heating rate of 5 K/s (= 300 K/min).
In addition, Schenk et al. [
15,
23,
24] have shown that their experimental data cannot be explained by a single activation energy. They fitted the CH
4 release peak with a binding energy distribution with a Gaussian shape and with a FWHM of 0.5 eV. This experimentally observed broadening of the CH
4 peak was attributed to a distribution of binding energies due to different bonding environments in the amorphous structure. This is in agreement with our interpretation of the width of the H
2 release peak, namely that the width is due to a distribution of binding energies. The much larger width of the BED for hydrogen compared with CH
4 means that hydrogen bonded in a–C:H films has a much broader distribution of binding energies than terminal CH
3 groups.
Schenk et al. [
23,
24] deduced binding energies from their TDS data. However, they did not determine the pre-exponential factor but made the common assumption of
1/s. The applied value for
is only explicitly mentioned in Ref. [
59]. With this
they determine a binding energy for the lower lying hydrogen peak of E
eV (
kcal/mol) and E
eV (
kcal/mol) for the CH
4 peak. The energy value for the hydrogen desorption peak is about 0.5 eV lower than our peak of 3.2 eV. This deviation is merely due to the lower pre-exponential factor used by Schenk et al.
In view of this, our determination of
and the corresponding uncertainties have to be discussed in some more detail. In general, for a reasonable accuracy of the determination of
from an analysis according to Equation (
7) as presented in
Figure 7 the temperature ramp should be varied by two orders of magnitude [
38]. In our case the temperature ramp was varied from about 2.8 to 40 K/min, which is only slightly more than one order of magnitude. As a consequence, the value determined from
Figure 7 still has a rather large uncertainty. It was already mentioned in
Section 4 that the confidence interval for the determination of
from the standard straight line fit of the data in
Figure 7 ranges from
to
1/s, but this approach is not strictly correct due to the non linear error propagation of the experimental uncertainties in the analysis based on Equation (
7). A Monte-Carlo-based algorithm for the evaluation of the error propagation of the experimental errors given in
Table 1 results in a non-symmetric distribution of
values ranging from
1/s to
1/s with a mean value of
1/s.
In any case, the measured data are not compatible with
1/s. The simulations for determination of the binding energy distribution were performed with a value of
1/s. Variation of
leads to noticeable changes of the shape of the simulated TPD spectra. On the one hand side, too low values of
impair fitting of the onset of the desorption spectra. Here, the onset is shifted to later times corresponding to higher desorption temperatures and the following initial increase of the signal is steeper than observed experimentally. On the other hand, values of
significantly higher than
1/s allow a fit of the spectra of almost equal quality as with the chosen value. Only at the high temperature side the decay exhibits a sigmoidal shape which is not seen in the experiment due to the faster depletion of the population density. Surprisingly, although the quality of the simultaneous fit of measured spectra varies considerably, the shape of the derived energy distribution changes only slightly (c.f.
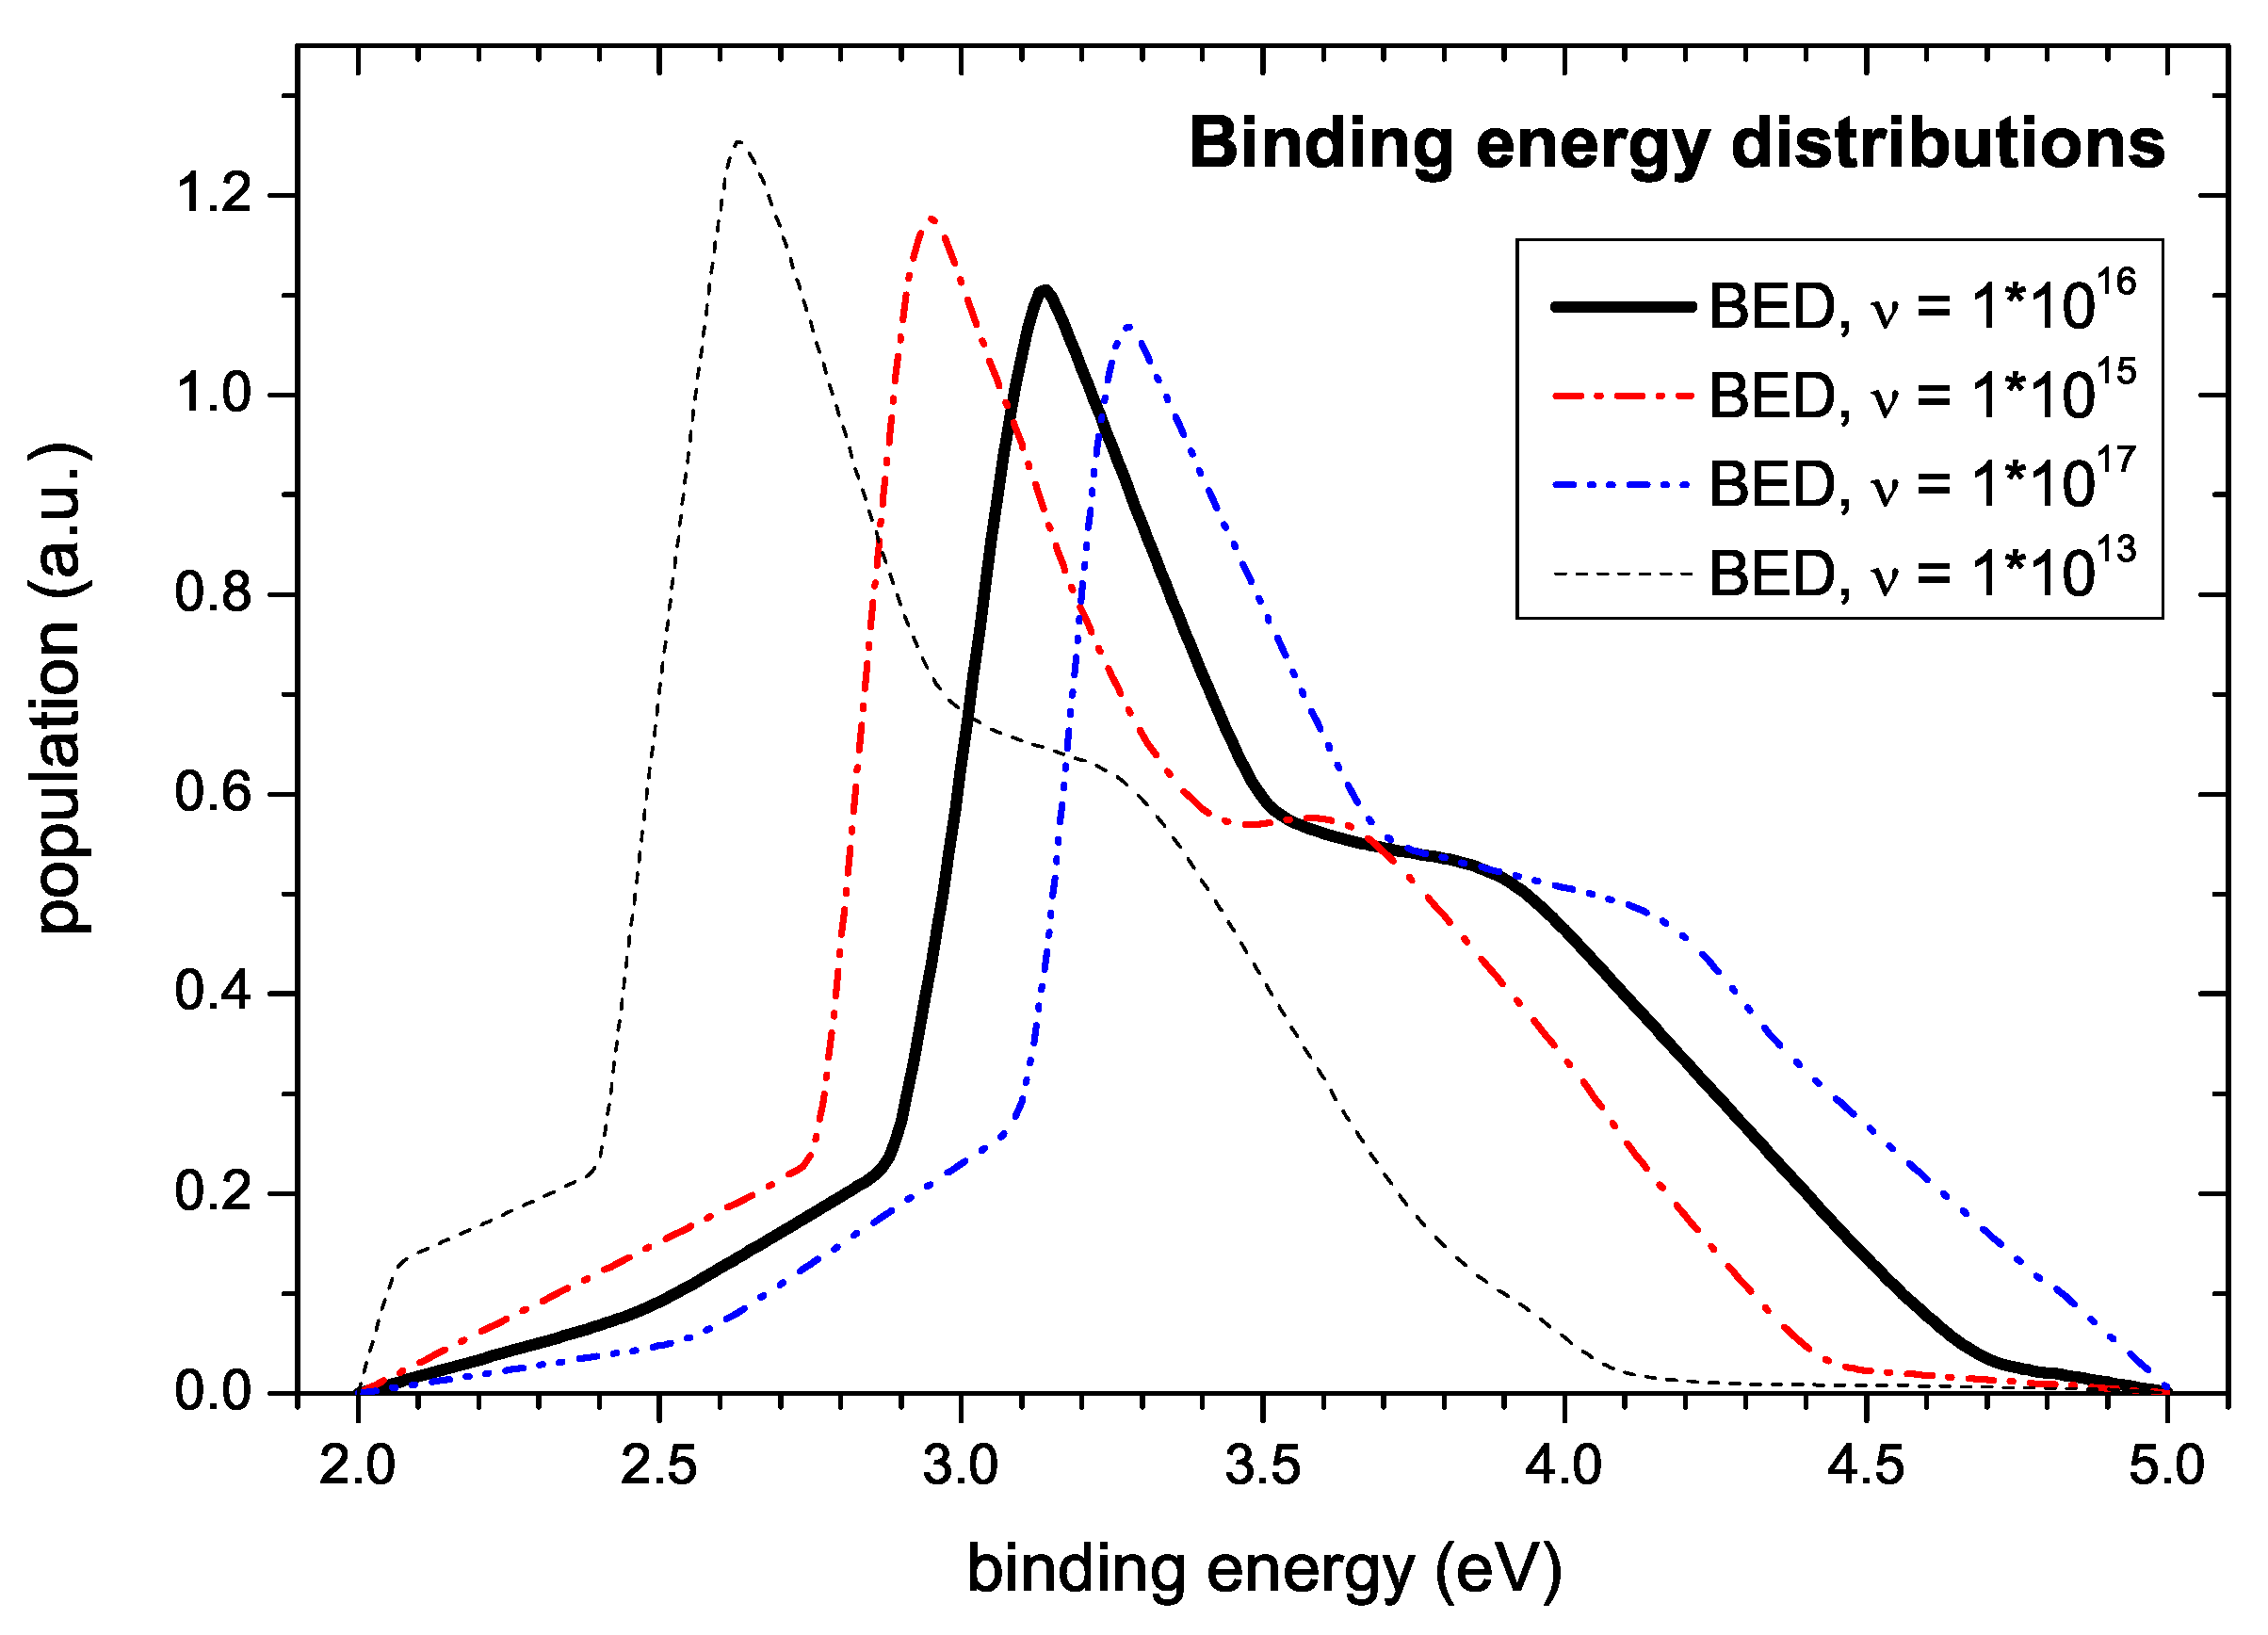
Figure 11). The main uncertainty in determining the BED results from the large uncertainty of the pre-exponential factor
. This is demonstrated in
Figure 11. It shows BEDs determined for different values of
. As discussed further above the uncertainty in determining
results in a non-symmetric distribution of
values. Reasonable estimates of a lower and upper limit representing a standard deviation are
1/s and
1/s. The corresponding BEDs are shown in
Figure 11 together with our nominal value of
1/s. This uncertainty of
leads to an uncertainty on the energy scale of about
eV. The corresponding error band due to this error in
is much larger than the uncertainty derived from the fit as shown in
Figure 10. The exact peak positions in
Figure 11 are: 2.95, 3.14, and 3.27 eV, respectively.
In addition,
Figure 11 shows the simulation result using
1/s, the value used by Schenk et al. [
23,
24,
59]. This choice leads to a shift of the BED to significantly lower energies. The corresponding binding energy of the first peak is 2.63 eV, which is in reasonable agreement with the value of E
eV determined by Schenk et al. [
23,
24,
59]. Because Schenk et al. [
23,
24,
59] have not independently determined the pre-exponential factor, their ansatz of simply assuming a value of
1/s has to be questioned. A consequence of this is that the binding energies published by them for other desorbing species have to be reconsidered. We are convinced that for such a reevaluation a value of
1/s would be more appropriate.
Our choice of
1/s allows an excellent simulation of many details of the measured TPD and R&H spectra. The simulated spectra perfectly fit the increase and decline of the release peaks, as well as the absolute intensities and shifts of the peaks for the experiments with different temperature ramps (
Figure 8). They fit the decay of the signal in the R&H experiments (
Figure 9) when the holding temperature is reached and also the subsequent onset of desorption of the second temperature ramp. This good agreement between simulated and experimental data provides additional support for our choice of
and significantly narrows down the uncertainty range which would arise from an analysis according to Equation (
7) and
Figure 7 only. We would like to point out again that in total 11 independent data sets (five of them are presented in
Figure 8 and
Figure 9) were used in the analysis.
The decay of the signal after reaching the holding temperature in R&H experiments (see
Figure 4,
Figure 5 and
Figure 9) is not a simple exponential function. This would only be the case if the binding energy were just one defined energy. Since the system is characterised by a distribution of binding energies, the resulting decay cannot be described by a simple analytical function. Nevertheless, the decay of the signal is perfectly fitted by the simulated spectra (see
Figure 9).
In
Figure 10 the computed population density
(binding energy distribution) together with the estimated uncertainty is displayed. The uncertainty shown in this figure is derived from a model of
with a given pre-exponential factor of
1/s and a given number of support points. The additional uncertainty resulting from the uncertainty of the pre-exponential factor is discussed below. With respect to the number of support points for determining the BED we note that strictly speaking the total uncertainty should also account for the lack of knowledge of the ‘correct’ (and also inaccessible) number of support points, which would slightly increase the uncertainty compared to the displayed one. However, the general trends would be unchanged: The low energy part of the population density is very tightly constrained by the measured TPD profiles, and the peak of the population density at 3.1 eV is mandatory for fitting the data. Similarly, the broad approximately constant population density between 3.6 and 3.9 eV is well supported by the data. However, the precise shape of the decline of the population density towards zero for energies higher than 4 eV is less certain, as revealed from over-fitting simulations based on a fixed grid approach (not shown). This is mostly due to the significant background contribution to
at high temperatures (see e.g.,
Figure 2a,
s) and the uncertainty contributed by the incomplete desorption of the hydrogen, the latter affecting the normalization. In this high energy region, the fixed complexity of the model favours a linear decrease of the population density over an exponential decline although the respective
values are about the same because the former shape requires fewer support points to be represented by a piecewise linear model. Here the presently available data do not allow drawing a firm conclusion.


