Article

Macroscopic Behavior and Microscopic Factors of Electron Emission from Chained Nanocarbon Coatings

Institute of Physics and Technology, Ural Federal University, Mira st. 21, 620002 Ekaterinburg, Russia
*
Author to whom correspondence should be addressed.
Submission received: 30 July 2019 / Revised: 30 August 2019 / Accepted: 30 August 2019 / Published: 9 September 2019

Abstract

:
The carbyne-containing films based on linear-chain carbon are promising materials for the manufacture of electronic equipment components. These carbyne-containing materials can be used as active elements of computational electronics and as ultra-miniature sensors of gaseous environment. The temperature studies of the electrical characteristics of carbyne-containing films by most of the scientific groups are limited to the low temperature range in which the quantum properties of nanostructures are most pronounced. We studied carbyne-containing films with a thickness of 20 and 400 nm on copper and silicon substrates using optically stimulated electron emission (OSEE) in the temperature range from room temperature (RT) to 400 °C. Theoretical modeling explains the dependence of work function on termination groups and substrate lattice. Experimental data revealed a relationship between the spectral characteristics of electron emission and temperature. The spectral contributions of both surface states and bulk interband transitions were clearly distinguishable.

Graphical Abstract

1. Introduction

Carbon materials have formed an interesting area of materials science research in recent decades. Of particular interest are the low-dimensional carbon modifications—nanodiamonds, graphene, fullerenes, and nanotubes. Their unique features and applications in various fields, from biology to nanoelectronics, have attracted the attention of researchers. Investigations of 1D-materials with chains were also performed, although they remain unappreciated, particularly carbyne [1,2,3], due to the restrictions in synthetic methods.
Microcrystalline carbyne with dimensions of about 100 nm were acquired by thermal annealing [4] in the 1960s. Although many methods have been proposed for the synthesis of carbyne, amorphous or poorly ordered films/powders with a crystallite size less than 100 nm were obtained. In order to obtain more defined films, a robust and reliable characterization technique must be selected. Widely spread optical spectroscopy techniques are complicated or not suitable for opaque samples and layered structures. As a result, the information available on the surface layer of functional materials, particularly amorphous, is incomplete and is usually obtained by numerical modeling techniques. The experimental characterization of the surface states in nanostructures, both intrinsic and defect- or adsorbate-related, is an important task [5,6].
In this article, we use optically stimulated electron spectroscopy (OSEE) in combination with ab initio modeling, which allowed us to reveal the influence of temperature, thickness, and substrate type on the band structure and low vacuum photoemission threshold of linear-chained carbon (LCC)-containing coatings. Earlier experimental results on OSEE of silicon- and copper-based chains were described in our recent paper [7]. The modeling aimed to interpret the emission properties on substrate type, while thermal issues were addressed experimentally.

2. Samples and Methods

Linear-chained carbon (LCC) films, 20 nm and 400 nm in thickness, were grown on polycrystalline copper and monocrystalline silicon substrates by ion-stimulated condensation from a carbon plasma in a narrow window of optimal parameters [8]. The custom experimental setup for LCC films deposition (Ekaterinburg, Russia) was a vacuum system that provided pulsed carbon ion beam from a carbon plasma with a density of 1013–1014 cm−3 and an ionization degree of 95%. The pulse rate varied in the range 1–30 Hz and the pulse duration was of the order of 100 microseconds. The growth of the film was stimulated by additional irradiation with Ar+ ions. The ion beam was formed by a source of low-pressure ions. The energy of the Ar+ bombarding the surface of the growing film was in the range 0–500 eV and depended on the extraction voltage and on the parameters of the carbon plasma. The working pressure in the vacuum chamber was 10−4 Pa.
The ASED electron spectrometer (Figure 1, Ekaterinburg, Russia) made it possible to measure the electron emission spectral response in the temperature interval of 20–400 °C. Contrary to stationary external photoelectron emission and internal photoinjection currents over interface barriers, the OSEE is a nonstationary photoelectron emission from localized surface-near electronic states into vacuum [9]. The spectra obtained in our experiments were normalized against the source light flux. The spectral position error for described setup was less than 0.03 eV while the intensity error did not exceed 5%. Additional error caused by OSEE nonstationarity, which was lower than registered background intensity and two–three orders below than measured signal. The obtained nonselective spectral dependences were processed using original “OSEE-fitter” software [10], implementing the models described below.
The Copper (111) slab has been optimized using CASTEP code with Perdew-Burke-Ernzerhof (PBE) pseudopotential in generalized gradient approximation (GGA), taking into account surface relaxation. The silicon (111)-√3 × √3 surface model has been taken from [11]. Consequently, the 12 atom-long carbon chains with kinks were placed on top of slabs, forming 2D hexagonal lattices. The graphical representations of the model under study can be found in our work [7]. Final geometry optimization was performed before the properties calculation. The same models and settings were applied to calculate the electric potential along the z-axis, perpendicular to the slab surface. Work functions were calculated as a difference between Fermi energy and the vacuum potential 10 nm away from the surface.

3. Results and Discussion

3.1. OSEE Measurements

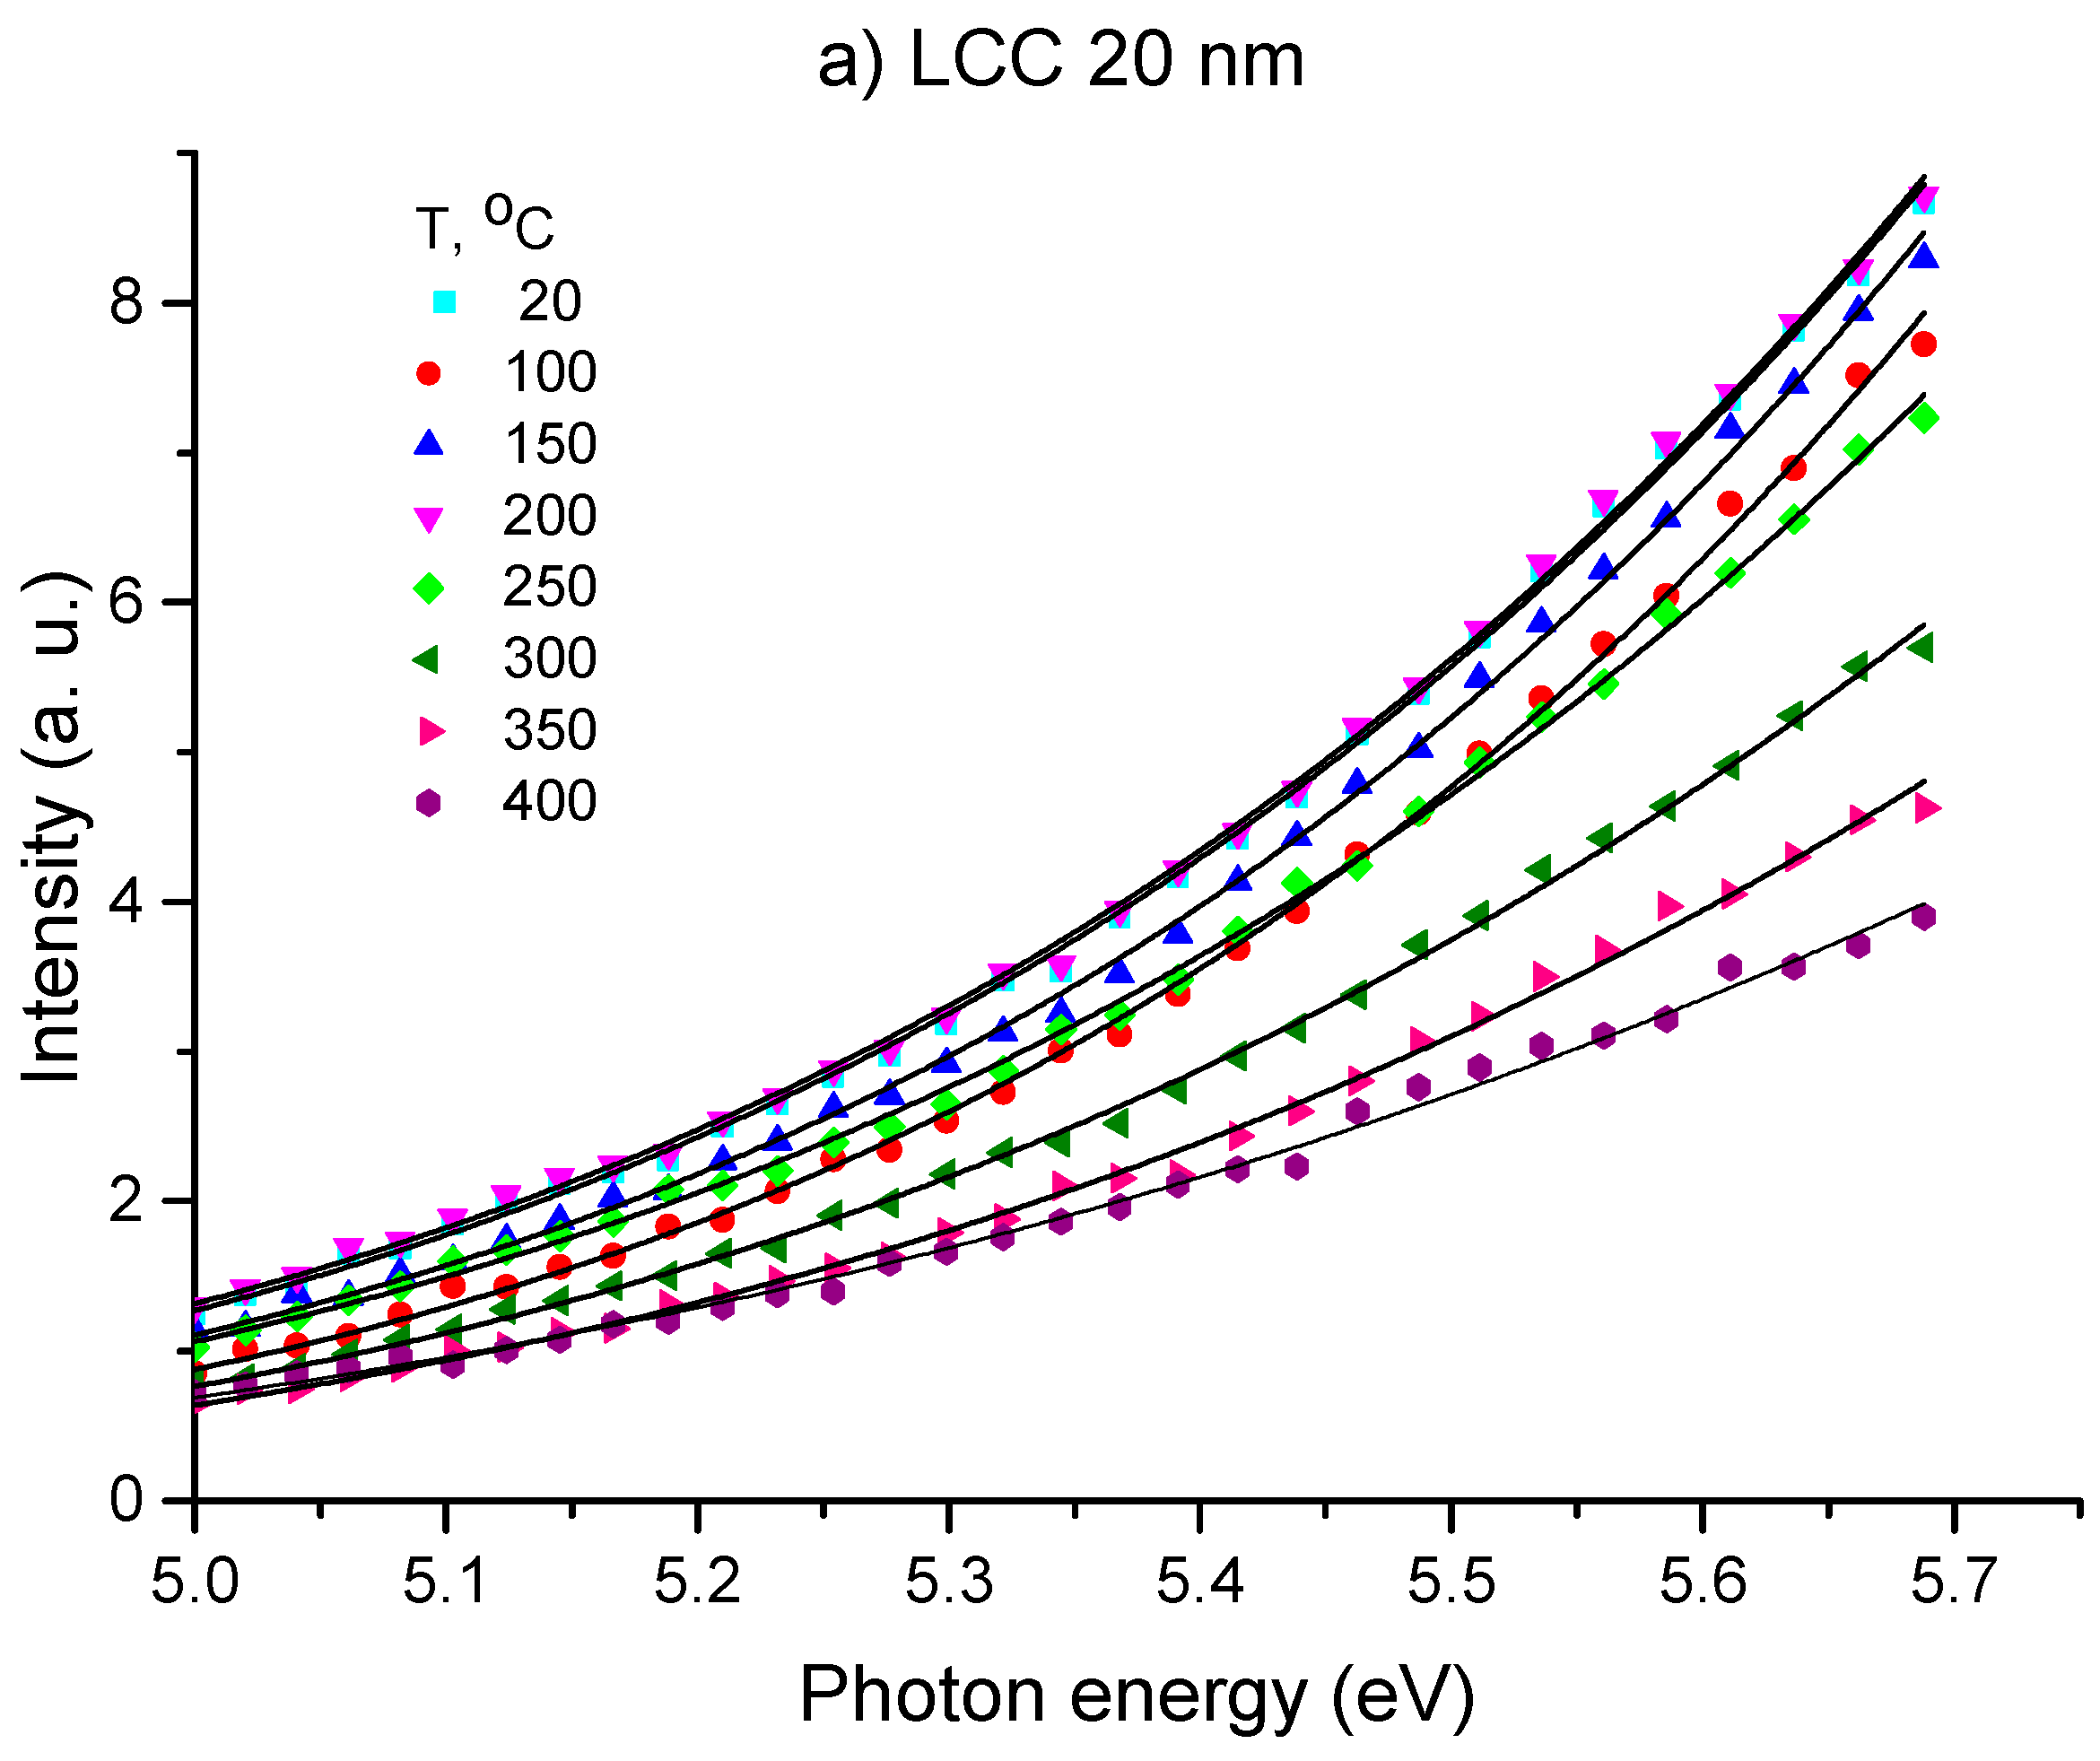
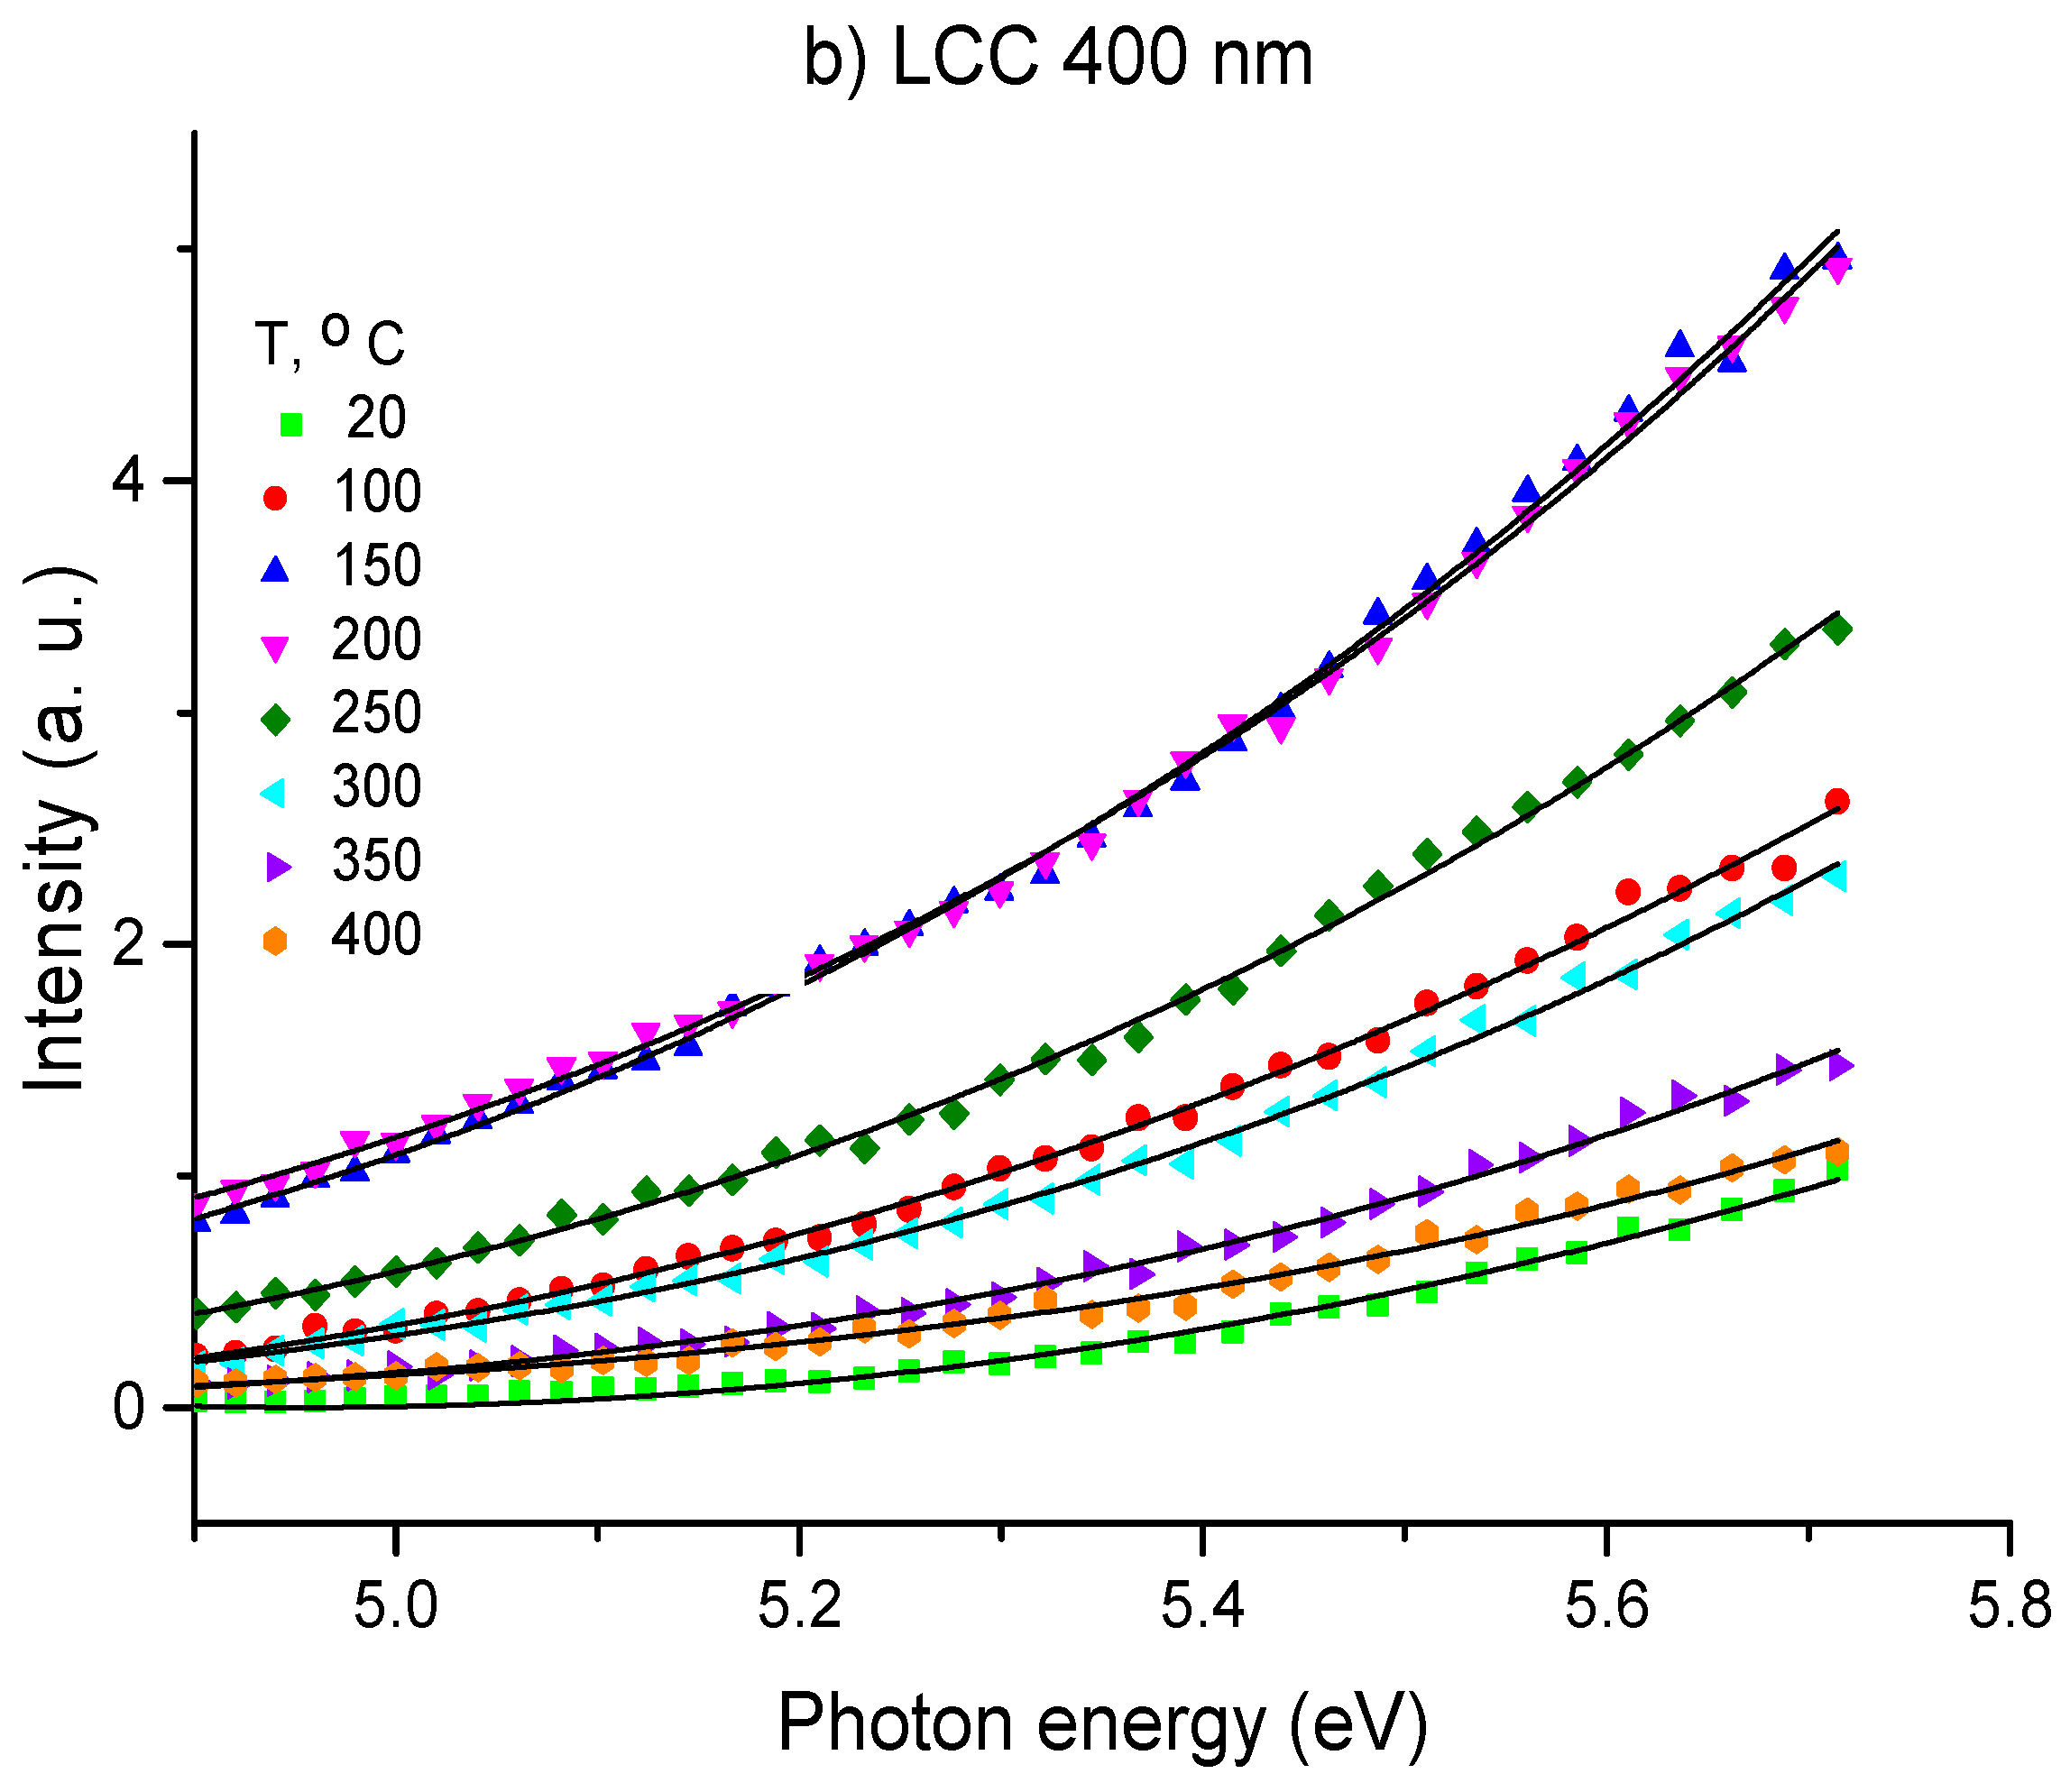
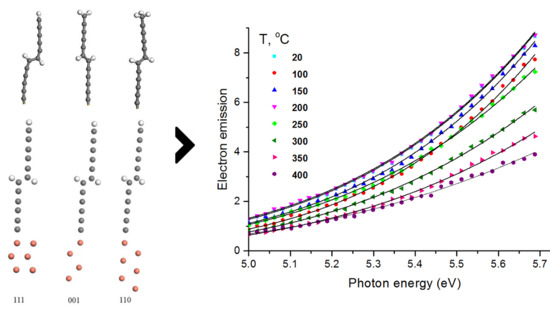
Here, we use the Kane dependence to study linear-chained carbon films on copper and silicon substrates with different thicknesses. The Kane power law [12] reflects the high-energy part of OSEE spectra (5 eV to 5.7 eV, Figure 2), which we attribute to optical transitions between surface states with subsequent thermal release to vacuum:
I = A(hvΦ)n
where A is a magnitude fitting parameter, Φ is the photoelectric work function, and n is the power factor, which indicates the governing type of interband electron transitions [13].
The parameters of OSEE curves fitted by Equation (1) are shown in Table 1. The n factor values were found between 2 and 3, showing that the electron emission was related to both direct and indirect optical transitions. Considering a significant error in parameter determination, all this experimental data may be matched to model values. Thin films of linear-chain carbon exhibited a stable value of n around 2.7 over the entire temperature range. This implies that the electron emission was mainly due to the indirect transitions between surface energy states with the participation of phonon processes. From Table 1, the value of Φ varies from 4.0 to 4.5 eV for samples of films with a thickness of 400 nm, while the value is less by 0.1–0.2 eV for films with a thickness of 20 nm.
A good fit between experiment and Equation (1) was achieved both for silicon- and copper-based samples. The quality of the carbon coating on the surface of crystalline silicon was better than on copper. Furthermore, the variation of the work function caused by the film was insignificant [7]. In other words, in this case, the electrons were emitted from the carbon layer only. In contrast, the copper plate itself had lower work function and, therefore, the electrons emitted from the holes in the inhomogeneous film dominated in the total intensity of the OSEE, so no changes were registered with increasing thickness of the carbon layer. Limited spatial resolution of ultraviolet photoelectron emission made the micron landscape of the carbon coating inaccessible.
As evidenced by the results of [7] and the current paper, the optically stimulated electron emission of the carbyne-containing films demonstrate poor dependence of the work function on the film thickness. From the Figure 2, the anomalous temperature dependence, with a maximum intensity achieved at 450–500 K, can be observed. On the one hand, the corresponding thermal energy may give rise to the low-frequency vibrations around 350 cm−1 present in the Raman spectra [7]. Alternatively, this temperature region corresponds to the predicted conversion of cumulene chains to polyene form [14]. Understanding of the electron emission features requires the elaboration of the microscopic mechanism behind. Despite a complex nanocomposite structure of the coating under study, we started our numerical investigations with an idealized model of short chains on crystalline substrate.

3.2. Density-Functional Theory (DFT) Modeling

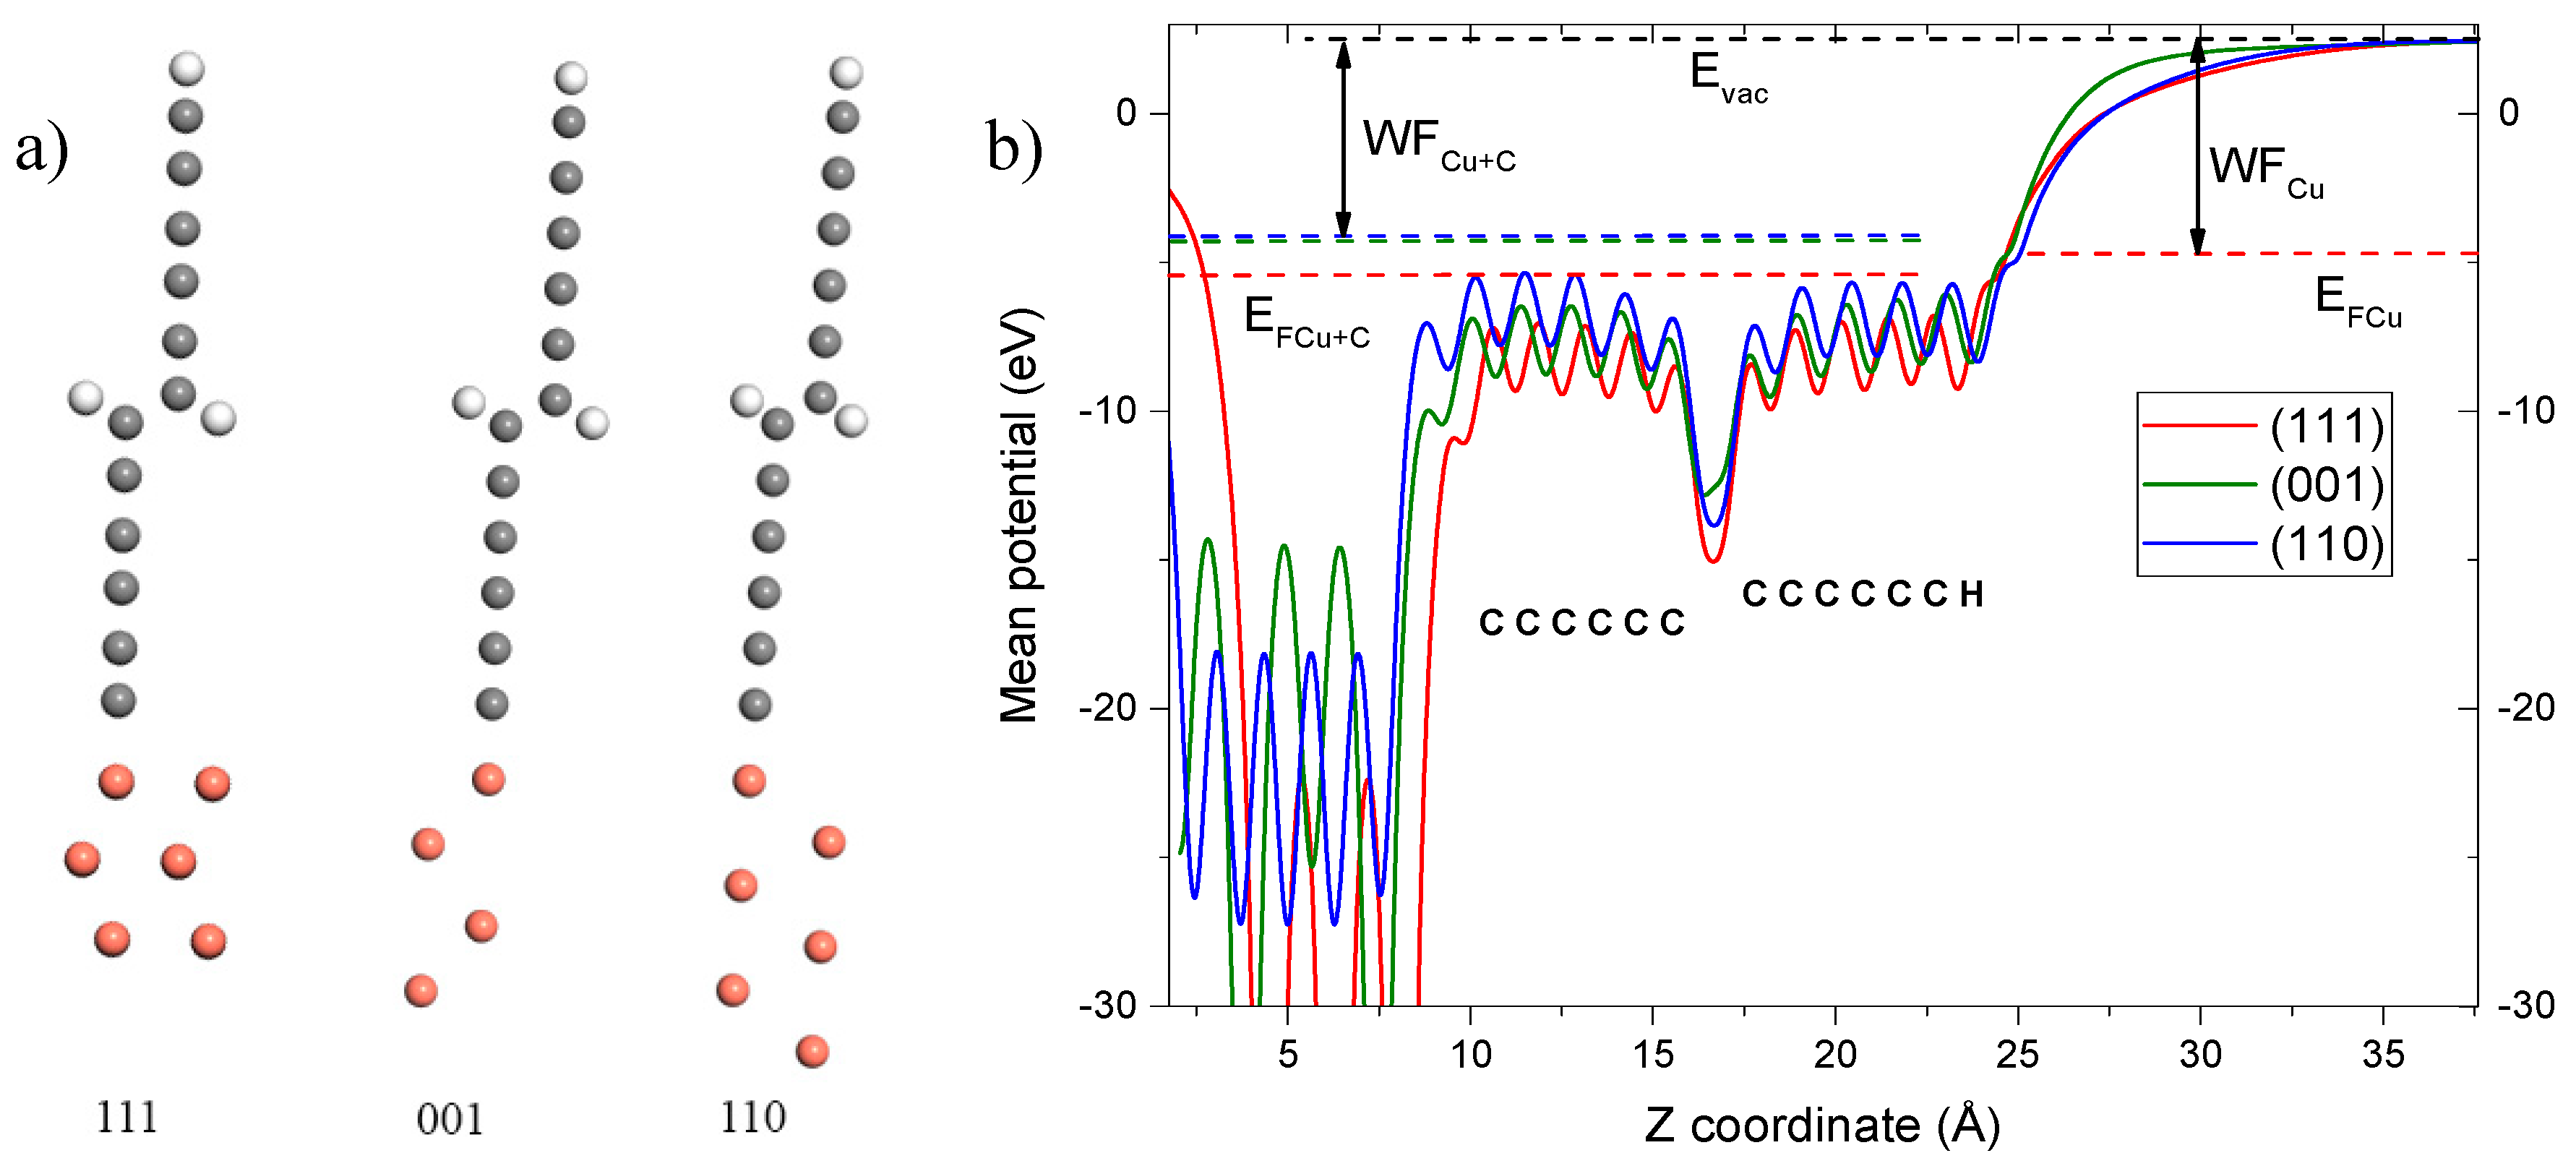
In order to discover the reasons of the work function change in the samples under study, we performed the DFT calculation of the electric potential along the axis perpendicular to the substrate. Surface slabs of copper crystal cut by (001), (110), and (111) planes were covered by a layer of carbon chains (Figure 3a).
Figure 3b shows the spatial distribution of the average electric potential along the Z axis, normal to the surface. The left part of the graph shows the potential along the copper substrate, the potential along the carbon chain is shown from 7 Å. The right part, from 25 Å, corresponds to the vacuum layer. The difference between the vacuum level and the Fermi level in this system allowed us to obtain the thermodynamic work function. When calculated this way, the theoretical work function calculated depends on the crystalline orientation of the substrate and is comparable with the literature data for pure copper [13]. The magnitude of the work function slightly depends on the type of substrate (Table 2), the highest value corresponds to (111) plane.
The main obstacle for the bottom-up synthesis of carbon chains is their high reactivity, and therefore, their inclination to crosslink and change to a more stable carbon modification [15,16]. This challenge even made scientists neglect the possible existence of a carbyne allotrope. The passivating terminal groups, which are aimed to cap the most reactive sites, play a crucial role in preventing the crosslink.
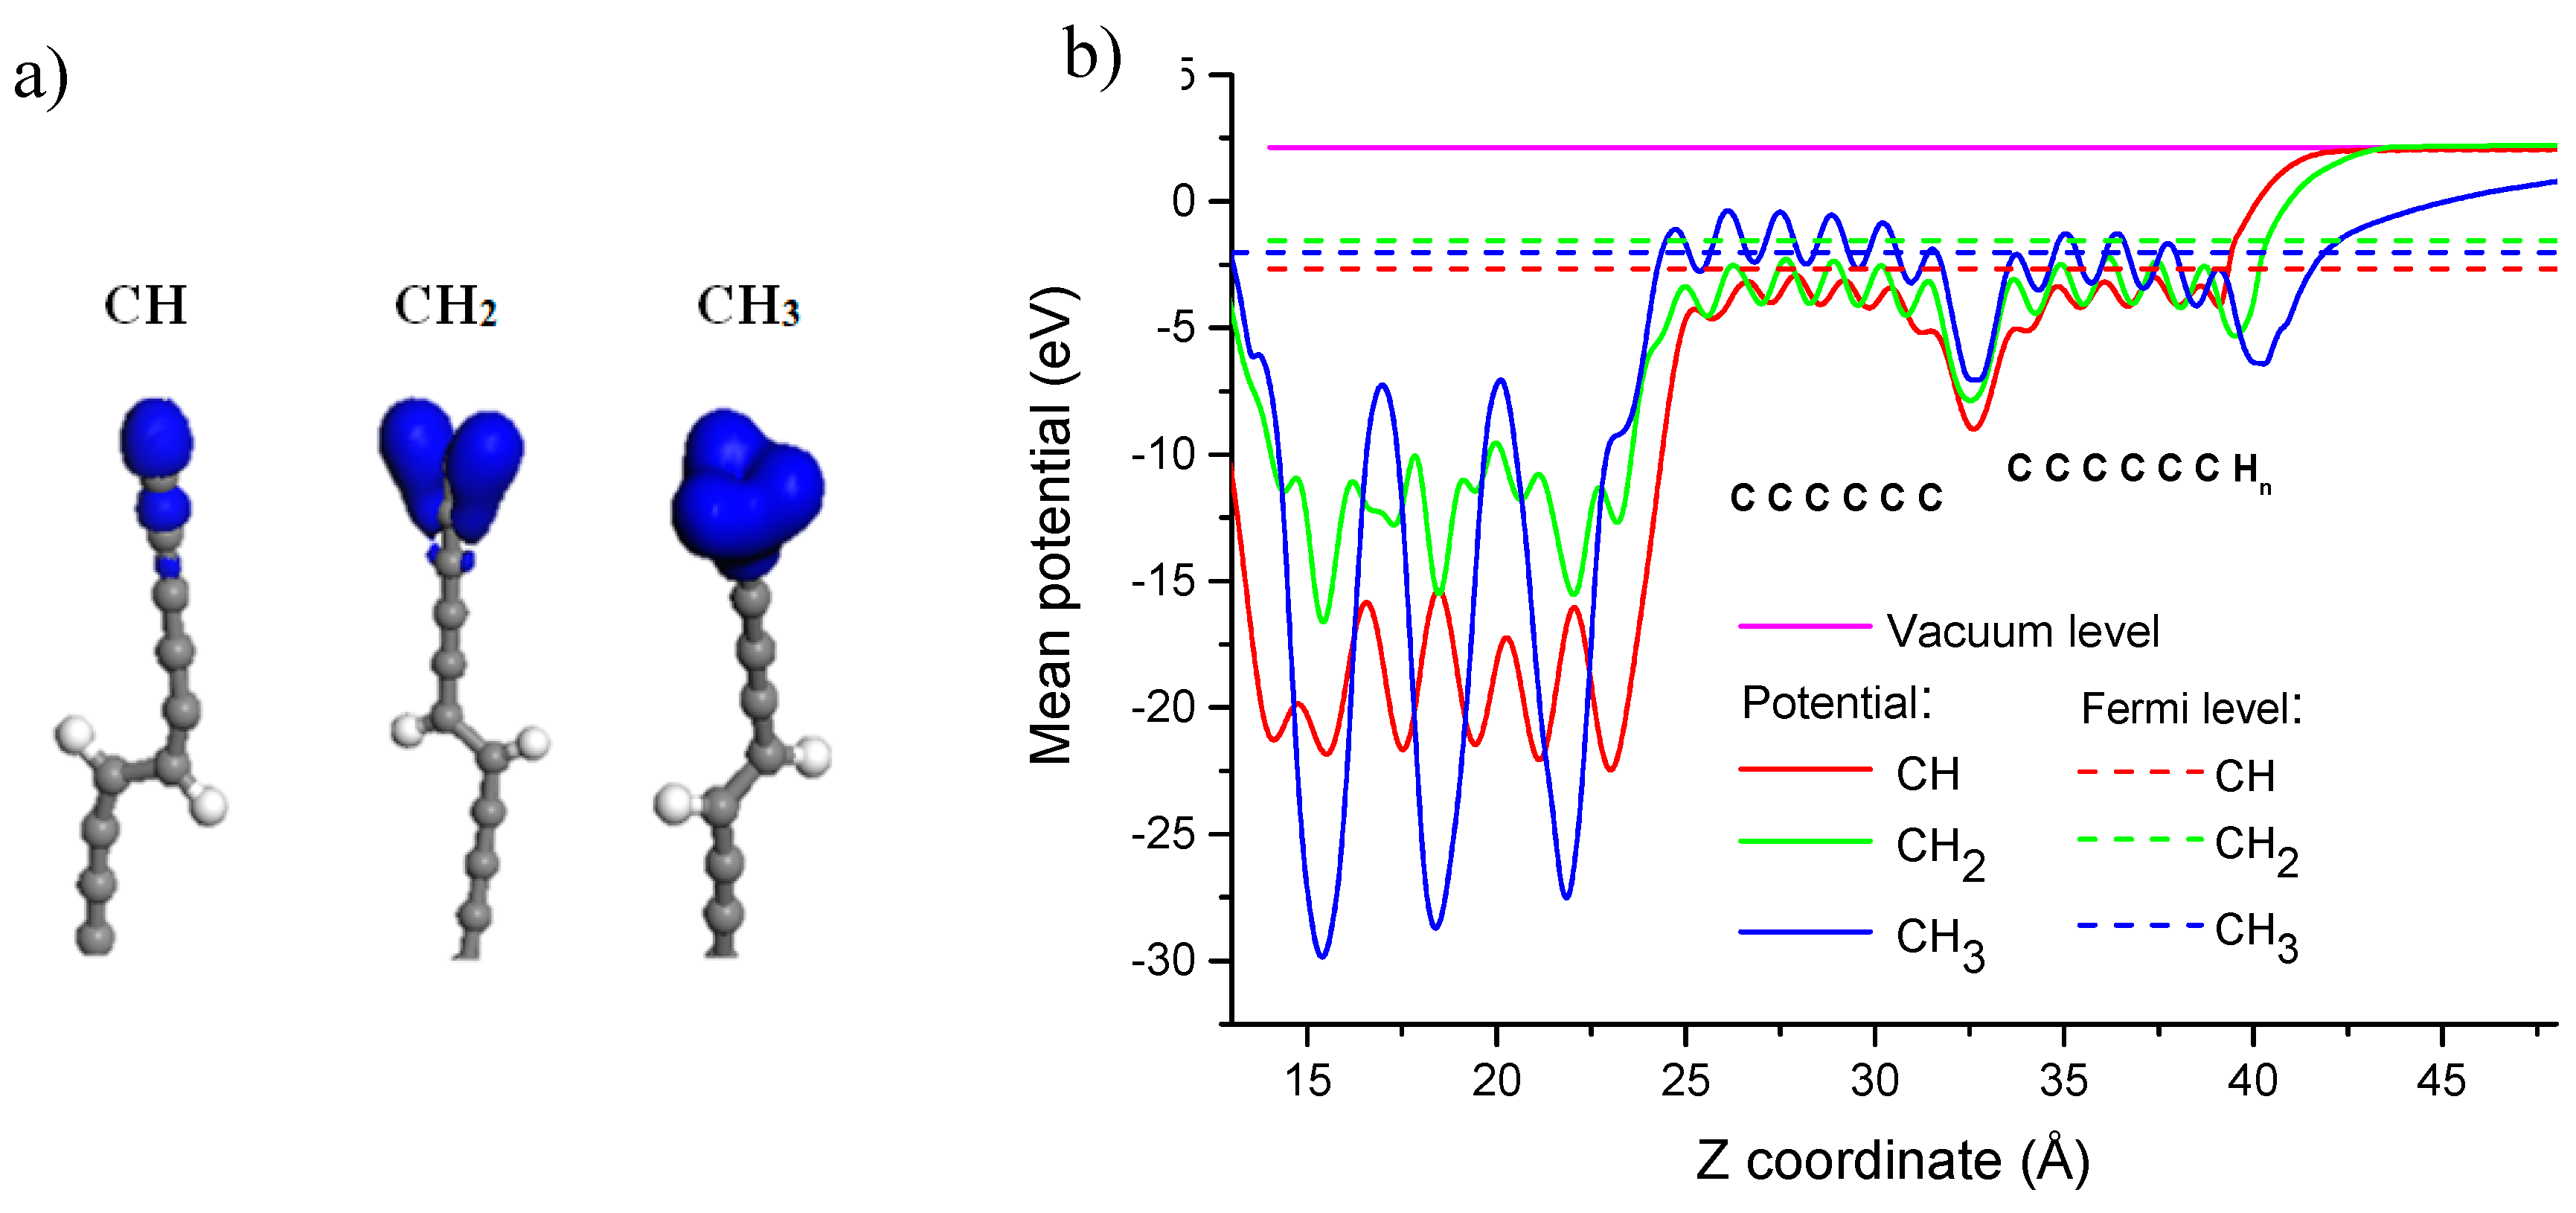
Therefore, in our study, the carbon chains with hydrogen atoms at the bend and with terminal groups of CH, CH2, and CH3 were placed on top of the Si 111 substrate (Figure 4a). The chains were arranged in such a way that a hexagonal structure with an interchain distance of about 5 Å was formed. Images of the spatial distribution of electronic orbitals are presented in Figure 4a. It can be seen how their shape depends on the type of end group, reflecting the charge redistribution.
It is known [17] that the terminal groups define the bonding types for the short chains, leading to polyyne or cumulene phase. The following bonding should occur near the chain end, or in our case: …≡C-C≡CH (CH group), …=C=CH2 (CH2 group), …≡C-C≡C-CH3 (CH3 group).
Figure 4b shows the distribution of the electrostatic potential along the z axis. The thermodynamic work function was calculated according to the graph. The calculated values, known for pure silicon, were compared with the literature, (Table 3). The calculated values of the work function decreased with increasing number of hydrogen atoms at the end of the chain. For the terminal group of CH, the value was almost the same, while for CH2 and CH3, the value decreased. The value of the work function for atomically clean silicon surfaces in vacuum was 4.83 eV [18].

4. Conclusions

In this paper, the methods of OSEE and DFT modeling were used to study thin-film linear-chained carbon films. Experimentally, it has been shown that the work function of the films weakly depends on the thickness of the carbon coating, which is due to the uniform structure of the surface layer. It was found that the electron emission stems from the indirect transitions of the surface states, while its intensity has a nonmonotonic dependence on the temperature of the experiment.
It was shown numerically that the magnitude of the work function depends on the orientation of the substrate. The greatest difference between the work function was observed for the (111) system. The models of carbon chains with CHn terminal groups on a silicon substrate were constructed. It was found that the work function decreases with increasing number of hydrogen atoms. Differences in the work function values were due to the number of hydrogen atoms at the end of the carbon chain, and consequently, the length of the bonds. Therefore, a combination of substrate structure and terminal group type influenced the work function observed during the experiment.

Author Contributions

Numerical calculations—D.O., T.K.; OSEE experiments—A.S.; writing—original draft preparation, D.B.; writing—review and editing—E.B., A.Z.

Funding

The work was carried out in the laboratory “Functional Materials Physics for Carbon Micro- and Optoelectronics” and supported by Act 211 Government of the Russian Federation, contract № 02.A03.21.0006 and in part by the Ministry of Education and Science of the Russian Federation (Government Task No. 3.1485.2017/4.6).

Conflicts of Interest

The authors declare no conflict of interest.

References

  1. Mingjie, L. Carbyne from first principles: Chain of C atoms, a nanorod or a nanorope. ACS Nano 2013, 7, 10075–100082. [Google Scholar]
  2. Christopher, B.; Goldman, N. Carbyne fiber synthesis within evaporating metallic liquid carbon. J. Phy. Chem. C 2015, 119, 21605–21611. [Google Scholar]
  3. Bitao, P. Carbyne with finite length: The one-dimensional sp carbon. Sci. Adv. 2015, 1, e1500857. [Google Scholar]
  4. Sladkov, A.M.; Kasatochkin, V.I.; Korshak, V.V. New crystalline form of carbon - carbyne. USSR Patent No. 107, 7 December 1971. Priority date 4 November 1960. [Google Scholar]
  5. Pacchioni, G.; Skuja, L.; Griscom, D. Defects in SiO2 and Related Dielectrics: Science and Technology; Springer: Heidelberg, Germany, 2012; p. 624. [Google Scholar]
  6. Luth, H. Solid Surfaces. In Interfaces and Thin Films; Springer: Heidelberg, Germany, 2010; p. 586. [Google Scholar]
  7. Buntov, E.A.; Zatsepin, A.F.; Slesarev, A.I.; Shchapova, Y.V.; Challinger, S.; Baikie, I. Effect of thickness and substrate type on the structure and low vacuum photoemission of carbyne-containing films. Carbon 2019, 152, 388–395. [Google Scholar] [CrossRef]
  8. Kudryavtsev, Y.P.; Guseva, M.B.; Babaev, V.G. Oriented carbyne layers. Carbon 1992, 30, 213–221. [Google Scholar] [CrossRef]
  9. Zatsepin, A.F.; Biryukov, D.Y.; Kortov, V.S. Taking account of the nonstationarity in analyzing the optically stimulated electron emission of irradiated dielectrics. J. Appl. Spectr. 2005, 72, 671–678. [Google Scholar] [CrossRef]
  10. Buntov, E.A.; Zatsepin, A.F. OSEE fitter program, registered in the Russian state register of software. No. 2008614289. 11 November 2008. [Google Scholar]
  11. Smeu, M.; Guo, H.; Ji, W.; Wolkow, R.A. Electronic properties of Si(111)-7 × 7 and related reconstructions: Density functional theory calculations. Phys. Rev. B 2012, 85, 195315. [Google Scholar] [CrossRef]
  12. Kane, E.O. Theory of Photoelectric Emission from Semiconductors. Phys. Rev. 1962, 127, 131. [Google Scholar] [CrossRef]
  13. Anderson, P.A. The Work Function of Copper. Phys. Rev. 1949, 76, 388–390. [Google Scholar] [CrossRef]
  14. Wong, C.H.; Buntov, E.A.; Rychkov, V.N.; Guseva, M.B.; Zatsepin, A.F. Simulation of chemical bond distributions and phase transformation in carbon chains. Carbon 2017, 114, 106–110. [Google Scholar] [CrossRef] [Green Version]
  15. Ravagnan, L.; Siviero, F.; Lenardi, C.; Piseri, P.; Barborini, E.; Milani, P.; Casari, C.S.; Li Bassi, A.; Bottani, C.E. Cluster-beam deposition and in situ characterization of carbyne-rich carbon films. Phys. Rev. Lett. 2002, 89, 285506. [Google Scholar] [CrossRef]
  16. Lucotti, A.; Casari, C.S.; Tommasini, M.; Li Bassi, A.; Fazzi, D.; Russo, V.; Del Zoppo, M.; Castiglioni, C.; Cataldo, F.; Bottani, C.E.; et al. Sp Carbon chain interaction with silver nanoparticles probed by Surface Enhanced Raman Scattering. Chem. Phys. Lett. 2009, 478, 45. [Google Scholar] [CrossRef]
  17. Casari, C.S.; Milani, A. Carbyne: From the elusive allotrope to stable carbon atom wires. MRS Commun. 2018, 8, 207–219. [Google Scholar] [CrossRef]
  18. Allen, F.G.; Cobelli, G.W. Work Function, Photoelectric Threshold and Surface States of Atomically Clean Silicon. Phys. Rev. 1962, 127, 150–158. [Google Scholar] [CrossRef]
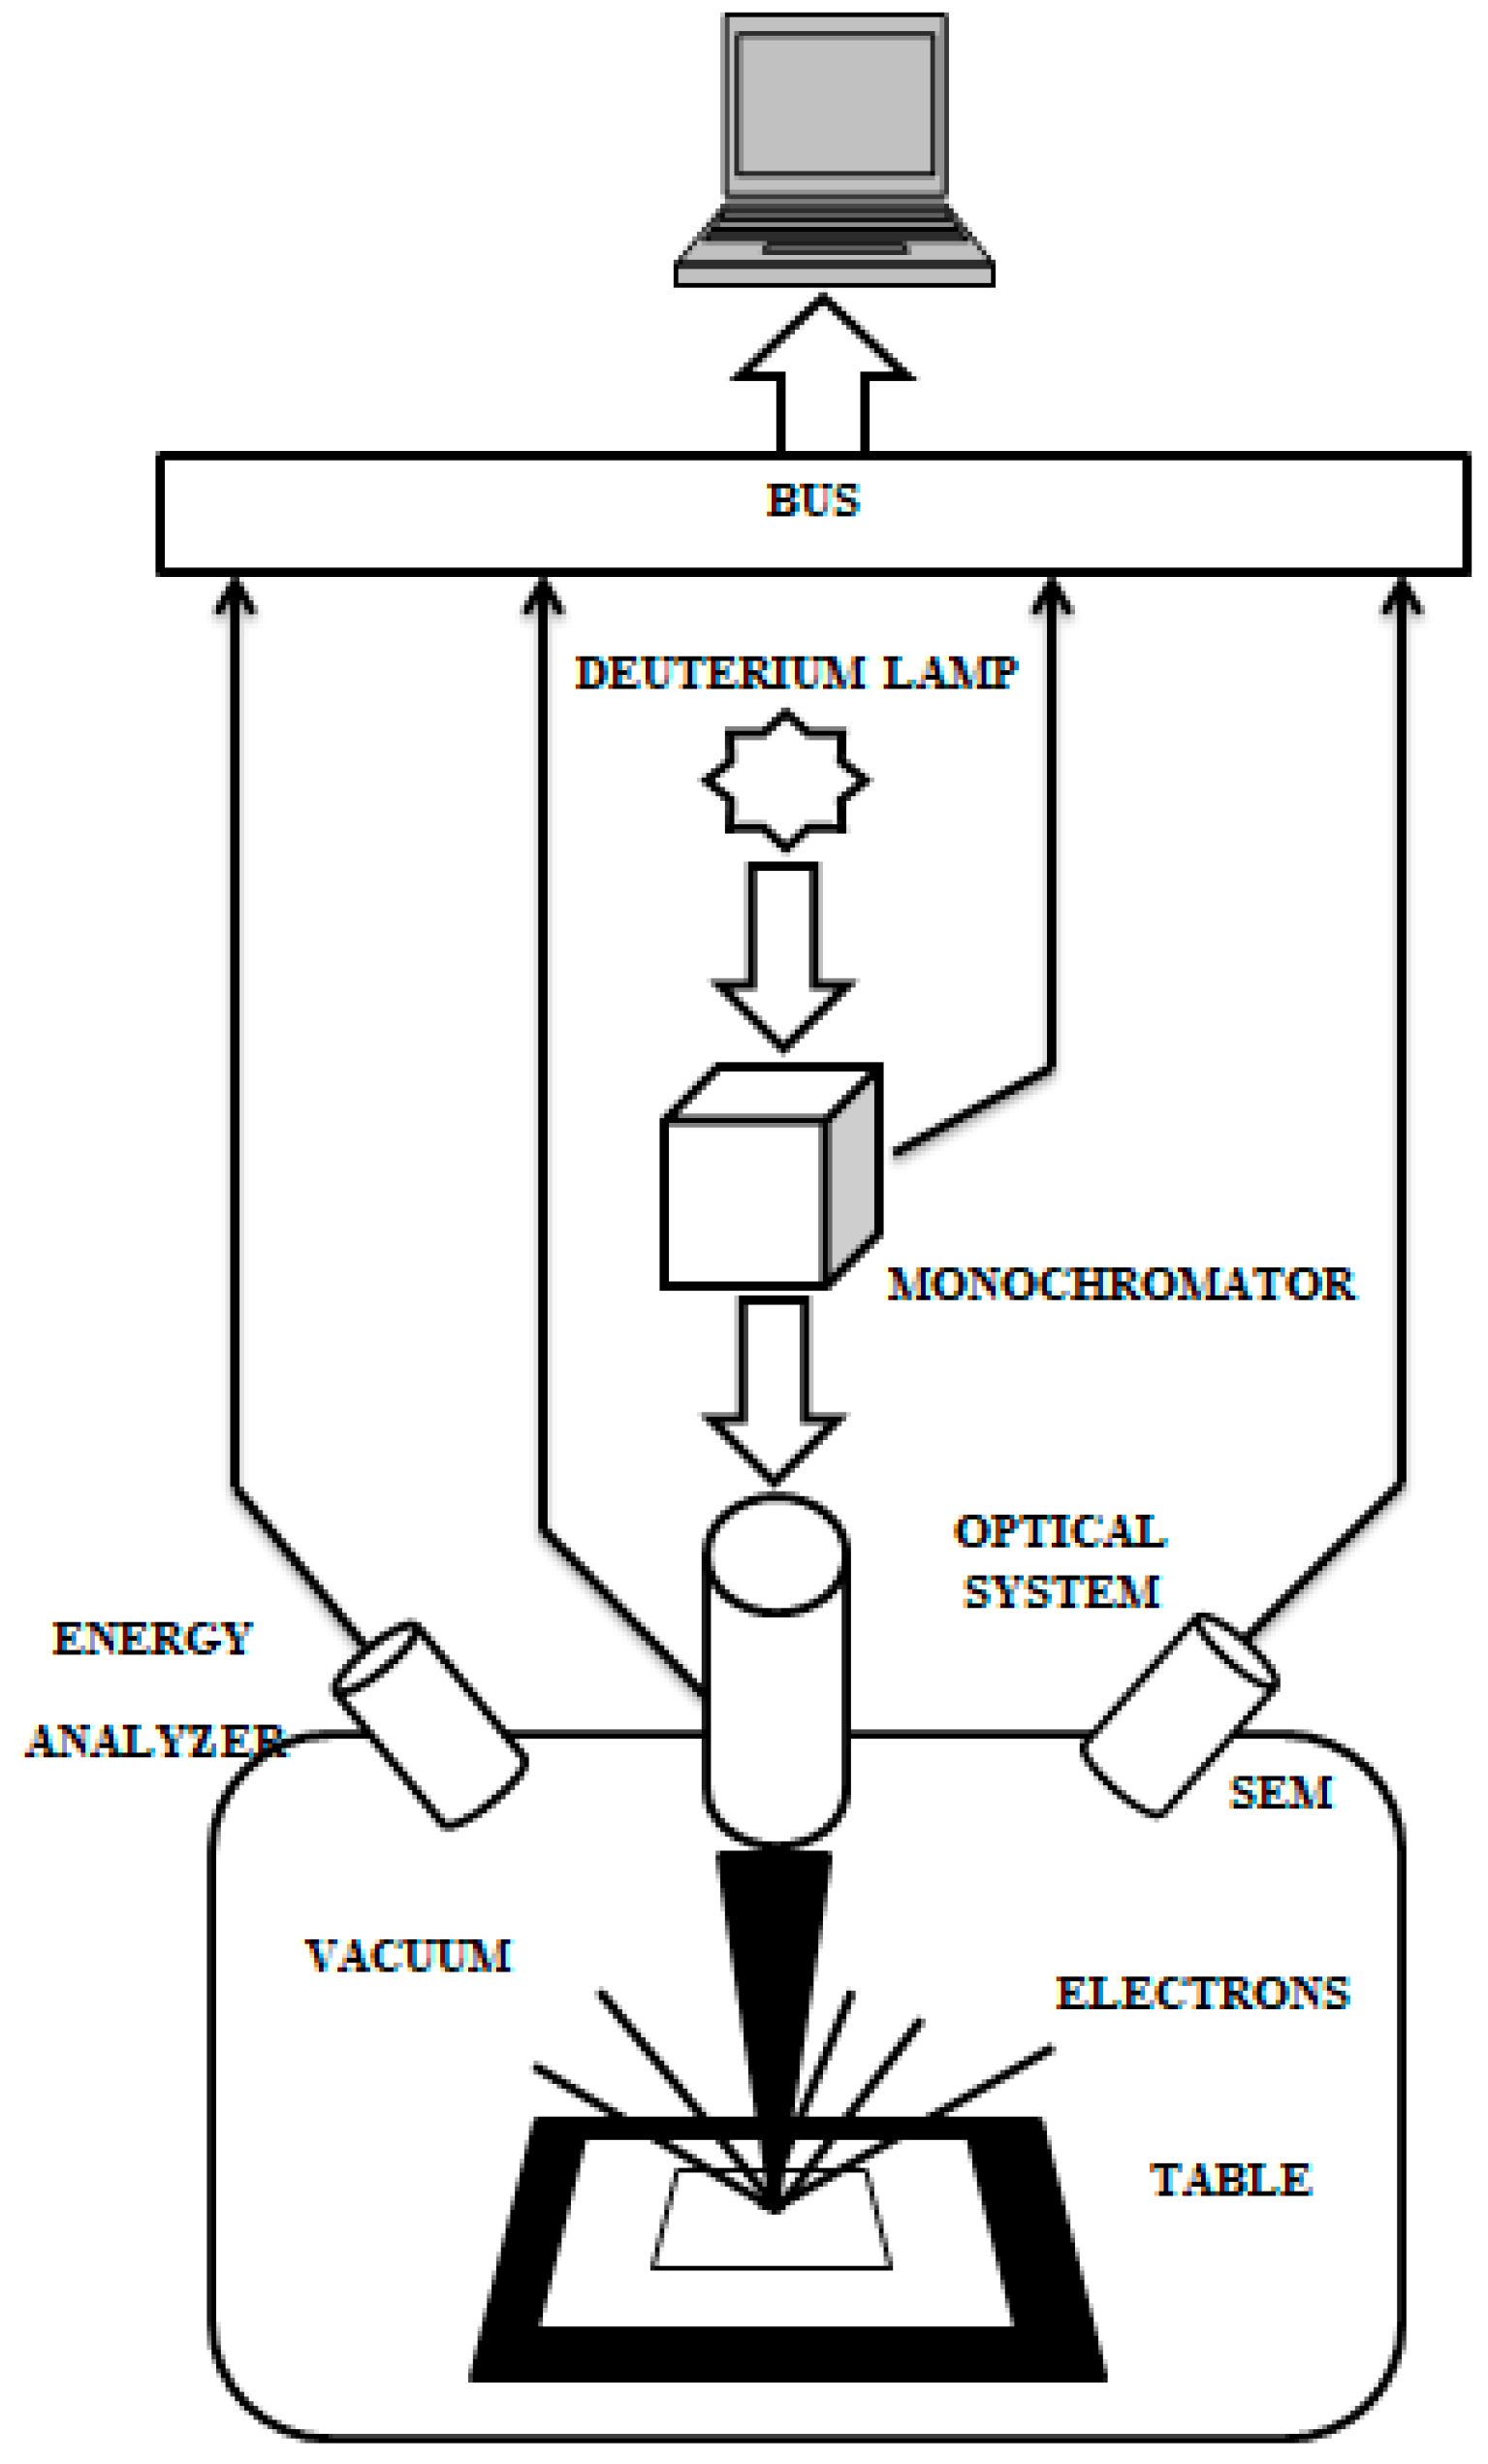
Figure 1. Scheme of the optically stimulated electron spectroscopy (OSEE) spectrometer. UV light is focused on the sample surface, which emits electrons registered by electron multiplier.
Carbon 05 00055 g001
Figure 2. Approximation of the high-energy part of the OSEE spectra for carbyne-containing films with a thickness of 20 nm (a) and 400 nm (b) on a copper substrate using the Kane equation.
Carbon 05 00055 g002aCarbon 05 00055 g002b
Figure 3. (a) Structural models of copper substrate with chains before structural relaxation (brown dots are copper atoms, gray carbon atoms, and lighter hydrogen); (b) Estimated potential chart for linear-chained carbon (LCC)-coated films for different subsystems. Fermi levels are shown by dashed lines, work functions are indicated by arrows. The position of the carbon and hydrogen atoms in the chains can be found in the lower diagram.
Carbon 05 00055 g003
Figure 4. (a) Silicon substrate model deposited by LCC with end groups of CH, CH2, and CH3 substrates (spatial distribution of electron orbitals); (b) potential curve fragment for carbon chain and end group: A potential curve bends. Chain structure is shown schematically, actual bonding depends on terminal group type.
Carbon 05 00055 g004
Table 1. Kane parameters for OSEE of the samples under study.
Temperature, °C LCC 20 nm
Φ, eV
LCC 400 nm
Φ, eV
204.264.50
1004.144.53
1504.364.03
2004.304.03
2504.244.19
3004.354.27
3504.474.47
4004.104.47
Table 2. The values of work function depending on the orientation of the substrate.
Orientation of the substrateΦtheor, eV [10]EF, eVEvacuum, eVΦtheor, eV (calculated)
(111)7.75.42.527.92
(001)8.04.42.526.92
(110)6.84.32.526.82
Table 3. Values of work function depending on the end groups of the LCC.
End groups of the LCCΦteor, eV [18]EF, eVEvacuum, eVΦteor, eV (calculated)
CH4.83−3.131.654.78
CH24.83−2.911.654.56
CH34.83−1.931.653.58