Article

Effects of Ion Bombardment Energy Flux on Chemical Compositions and Structures of Hydrogenated Amorphous Carbon Films Grown by a Radical-Injection Plasma-Enhanced Chemical Vapor Deposition

1
Graduate School of Engineering, Nagoya University, Furo-cho, Chikusa-ku, Nagoya 464-8603, Japan
2
Institute of Innovation for Future Society, Nagoya University, Furo-cho, Chikusa-ku, Nagoya 464-8603, Japan
*
Author to whom correspondence should be addressed.
Submission received: 23 December 2018 / Revised: 14 January 2019 / Accepted: 18 January 2019 / Published: 24 January 2019

Abstract

:
Hydrogenated amorphous carbon (a-C:H) films have attracted much attention, because of their excellent physical and chemical properties, such as high mechanical hardness, chemical robustness, a wide variety of optical bandgaps, and so forth. Although an ion bombardment energy has been regarded as essential in the well-know subplantation model, it alone is inadequate especially in complicated reactions of a plasma-enhanced chemical vapor deposition process. In this study, an ion bombardment energy flux (ΓEi) was proposed as a crucial factor to determine chemical compositions and structures of a-C:H films. To obtain the amounts of ΓEi, electron densities, hydrogen (H) excitation temperatures, and negative direct current (DC) self-bias voltage (-VDC) were measured. The deposition rate increased, and sp2-C clusters incorporation was induced by the ΓEi. With increasing ΓEi, photoluminescence (PL) backgrounds in Raman spectra decreased, while spin densities in electron spin resonance (ESR) measurements increased. These results suggested the H content of a-C:H film decreased depending on the amount of ΓEi. The ΓEi is one of the crucial factors to determine the properties of the a-C:H films.

Graphical Abstract

1. Introduction

Amorphous carbon (a-C) films have attracted much attention, because of their excellent properties, such as high mechanical hardness, chemical inertness, a wide variety of optical bandgaps, and so forth [1,2,3,4,5,6,7,8]. The a-C films mainly consist of sp2- and sp3-bonded carbons. Hydrogen (H) content is also important when it is included in the a-C film, usually called hydrogenated a-C (a-C:H). Their properties strongly depend on the mixture ratios among sp2-C bonding states, sp3-C ones and H atoms. Thus, controls of properties of a-C:H films have been studied from the viewpoint of how to control their chemical compositions and bonding structures.
A plasma-enhanced chemical vapor deposition (PECVD) is one of the commonly used methods and excellent in uniformity in large size wafer, coverage on high aspect patterns, and so forth. The a-C:H films deposited by the PECVD usually contain H atoms, because hydrocarbon molecular gasses are used as carbon precursors. To control their properties, the C-H bonding is quite important. For example, it has been reported that the H content affects the hardness and density of the a-C:H films [9,10]. It has also been reported that the optical bandgap decreased with decreasing the H content of the films [11].
To date, in the well-known “ion subplantation model,” which was first suggested by Lifshitz et al., the formation of sp3-bonded structures in a-C:H films was discussed as effects of ion bombardment with relatively high energies [12]. When the bombardment energy of carbon ions exceeds the penetration thresholds on the order of 30 eV, the ions can deeply penetrate the subsurface of the film [13]. At that time, the penetrating ions induce the displacement of hydrogen and break the chemical bonds between carbon and hydrogen, because the energy threshold for the displacement of hydrogen is only 2.5 eV [14]. Furthermore, the model was established by Robertson and Davis [15,16]. The penetrated energetic carbon ions with a kinetic energy of around 100 eV per atom densify the films, in which the local carbon-networks are augmented, and the carbon to carbon bonds are converted from sp2 to sp3 bonding structures [11]. When the ion energy excesses this threshold, a large fraction of the ion energy converts into heat within a small volume, called thermal spike, the density decreases, because of the stable energy state of sp2-C than sp3-C, called relaxation. Miyagawa et al. also reported that dynamic Monte Carlo simulation for the deposition based on the subplantation model and it well represented experimental results [17].
In the case of the PECVD, the ion bombardment energy (Ei) can be controlled by the bias power, such as radio frequency (RF), direct current (DC), and pulsed DC, applied to the sample stage. The RF bias voltage is useful for not only conductive, but also insulative substrates, because the negative DC self-bias voltage (-VDC) appears. The Ei is proportional to the magnitude of -VDC (|-VDC|). Robertson et al. and Godet et al. reported that the H content and optical bandgap decreased with increasing the RF bias power [11,18]. However, the effect of ion flux (Γi) has not been discussed so far. Of course, larger amounts of ions are expected to desorb more hydrogen and develop densification and bond conversion. Oda et al. also reported the importance of the ratio between Γi and radical flux in film hardness control from the simulation results [19]. Therefore, the Γi should be considered as one of the essential factors as Ei.
In this study, we investigated the effects of the ion bombardment energy flux (ΓEi = |-VDC|×Γi) on the deposition rate, the incorporation of sp2-C clusters, the H content, and electronic properties of a-C:H films based on the plasma diagnostics results. To determine the ΓEi, the electron density, the H excitation temperature, and -VDC were measured. The incorporation of sp2-C clusters, H contents, and electronic properties were discussed according to Raman spectra and electron spin resonance (ESR) measurements.

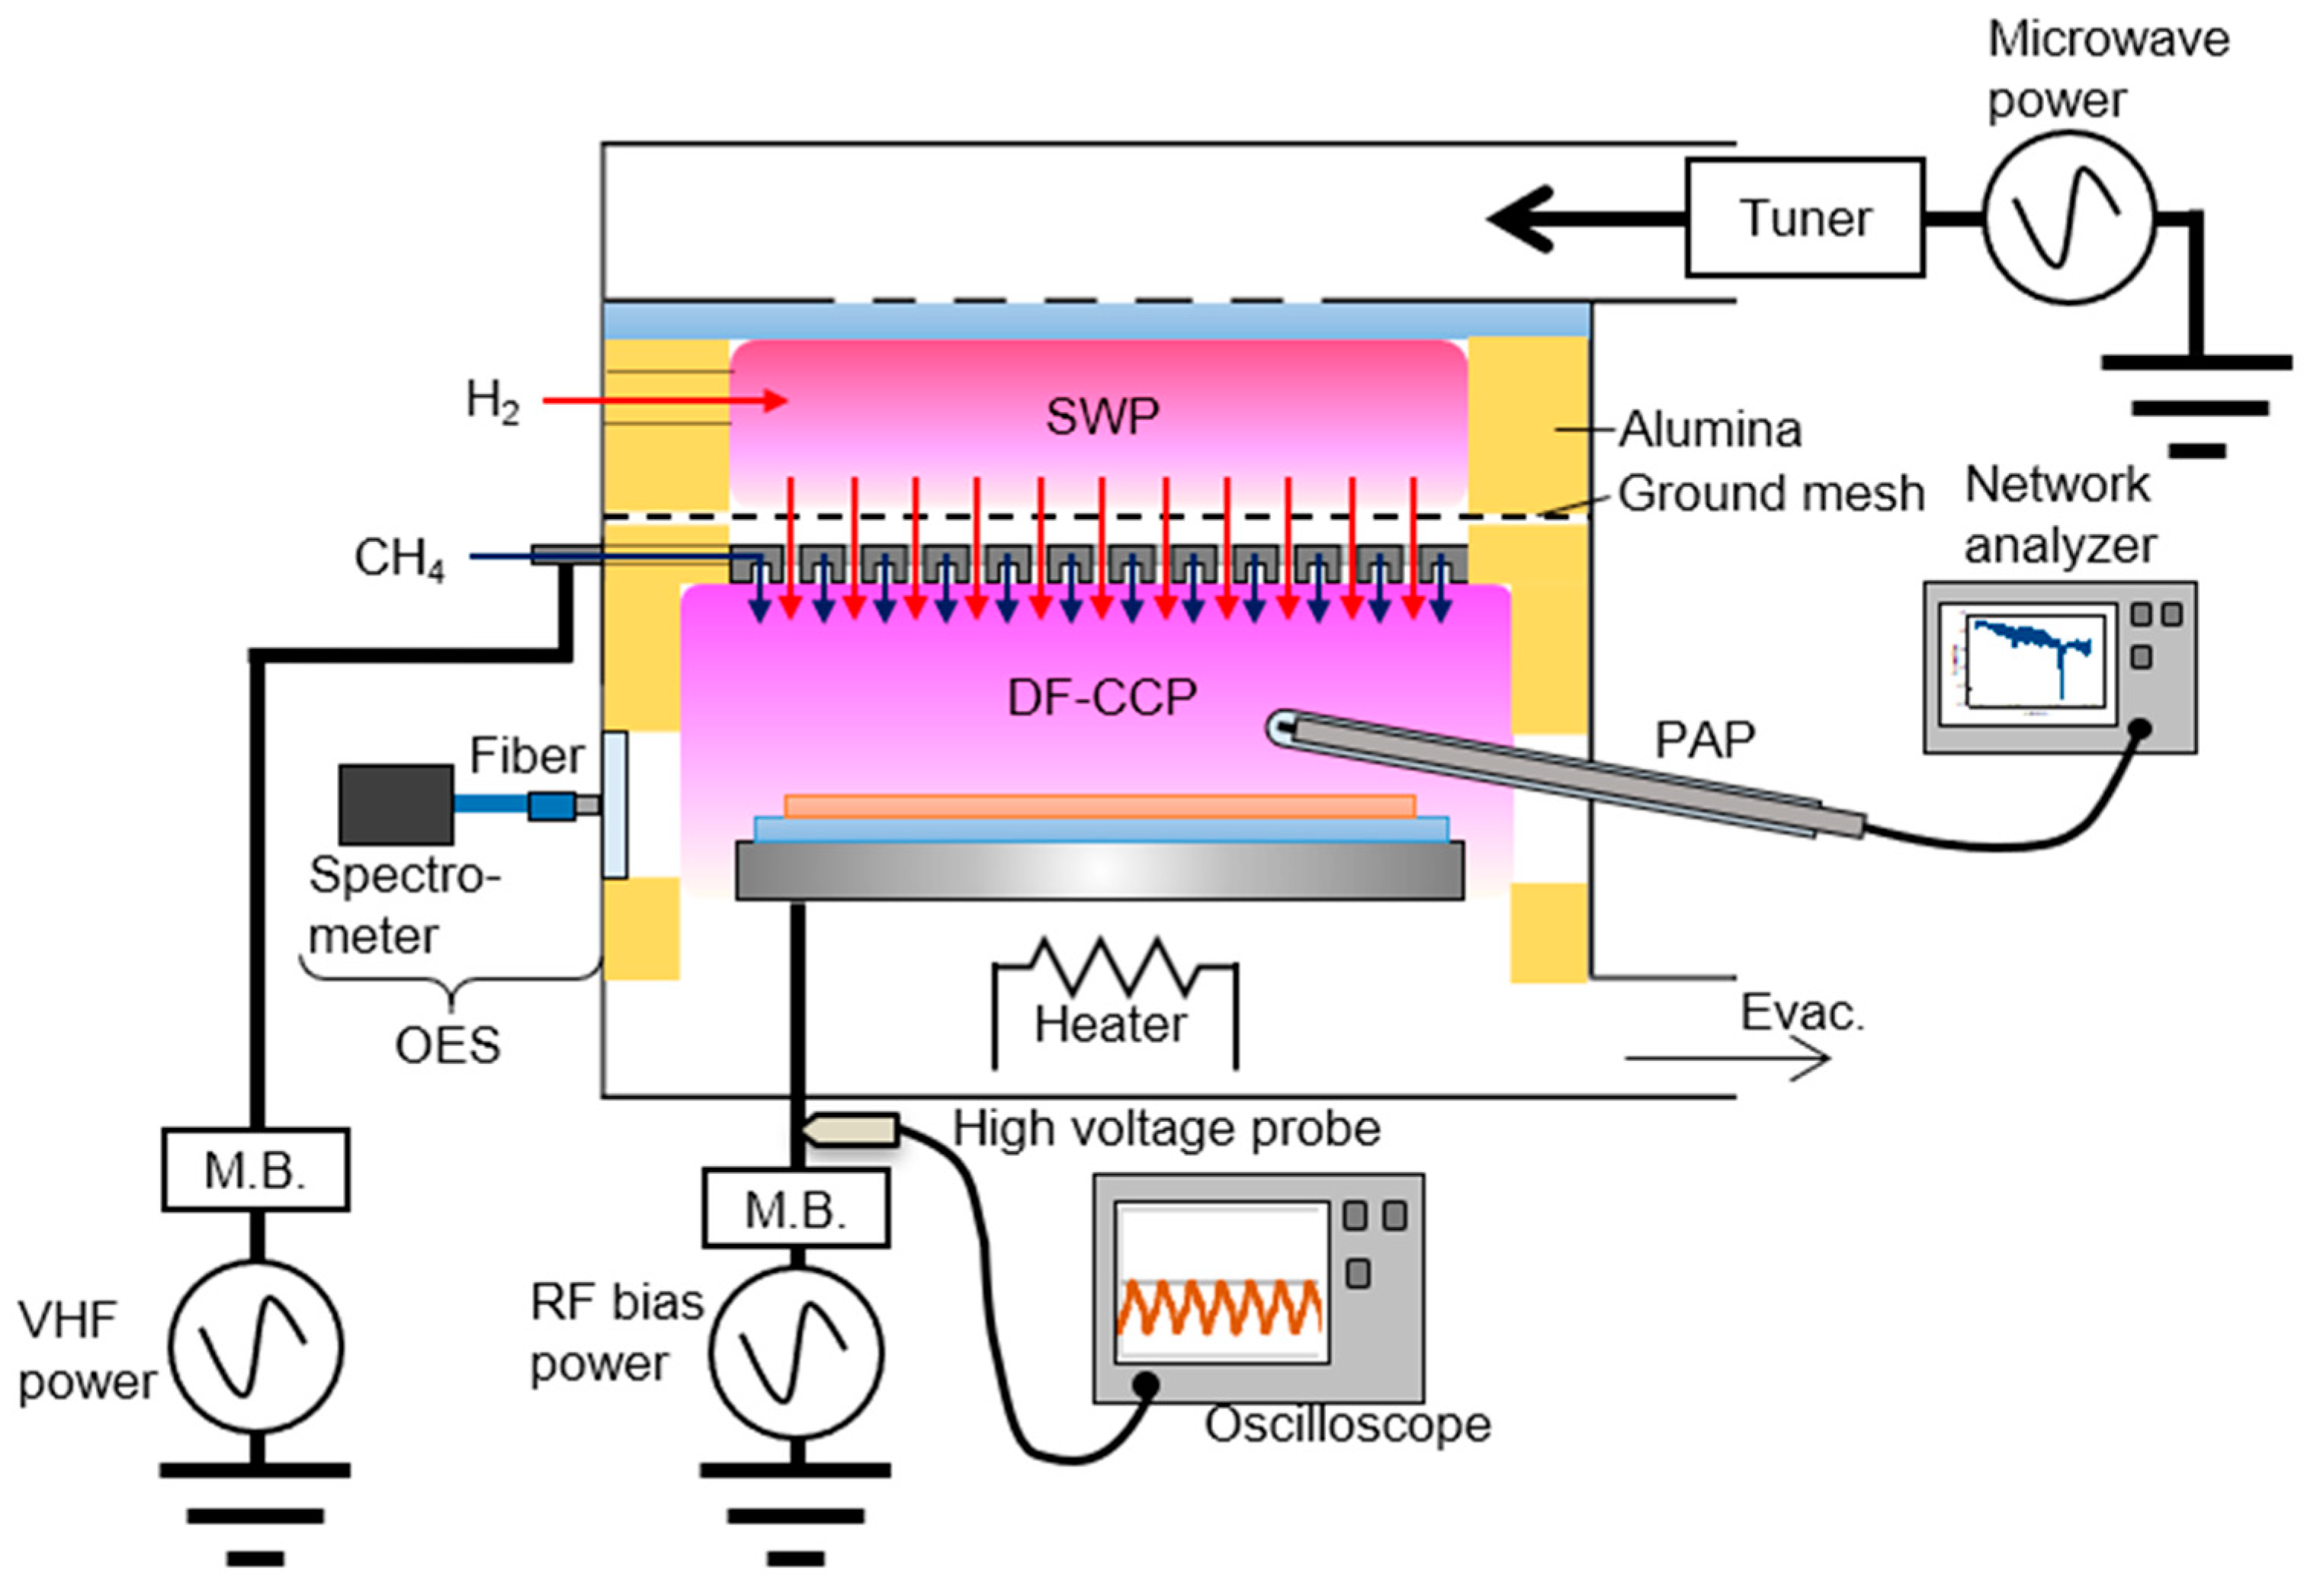
2. Materials and Methods

The growth of a-C:H films was performed using a radical-injection plasma enhanced chemical vapor deposition (RI-PECVD) system, in which two plasma sources were stacked and connected through a showerhead electrode [20,21]. Figure 1 shows the schematic diagram of RI-PECVD system. The upper plasma source for radical injection is surface wave plasma (SWP) generated by 400 W of 2.45 GHz microwaves through a quartz window. The lower plasma source is dual-frequency capacitively coupled plasma (DF-CCP) generated by 20 and 250 W of a 100 MHz very high frequency (VHF) power to the showerhead for controlling the radical generation. 13.56 MHz RF power ranging from 30–150 W was applied to the sample stage for controlling -VDC which related to the Ei. To measure -VDC, an oscilloscope was connected to the lower electrode through the high voltage probe (P6015A, Tektronix, Inc., Beaverton, OR, United States) and low pass filter with a 20 MHz cut off frequency. We determined the average voltage as the -VDC.
H2 gas was introduced to the SWP region and generated the atomic H. The atomic H traveled to the lower DF-CCP region through the showerhead. A CH4 gas was introduced to the DF-CCP chamber to generate hydrocarbon radicals. Flow rates of 500 sccm for CH4 and 250 sccm for H2 were fixed. The ratio of the flow rates, CH4/H2, significantly influenced the structure of the carbon materials [22,23,24,25]. The pressure measured at the DF-CCP region was kept at 12 Pa during all experiments. The deposition time was 20 min.
Synthetic quartz square plates with 15 mm × 15 mm sizes and thicknesses of 0.5 mm were used as substrates. The sample stage was heated to 550 °C, which was measured by a thermocouple, and the temperature of the surface of the substrate during deposition was around 400 °C, which was measured by an infrared thermometer (KTL-PRO, LEC company Ltd, Tokyo, Japan). Prior to the deposition process, seasoning of the reaction chamber was conducted for 5 min using identical conditions to the deposition, but without heating.
The DF-CCP was characterized by the plasma surface waves (SW Probe), previously called the plasma absorption probe (PAP) method, optical emission spectroscopy (OES) [26,27,28,29,30].
The electron density was measured by the PAP. The antenna probe comprising a coaxial cable with a quartz tube was introduced to the DF-CCP region. The probe position was at the center of the electrode gap and near the edge of the stage in the chamber. The antenna length, which was defined as a stripping length of the coaxial cable, i.e., the unshielded region inside the quartz tube, was 6 mm. This length determined the characteristics of the fundamental absorption by the surface wave. The absorption signals were collected by the network analyzer (E5071C, Agilent Technologies, Santa Clara, CA, United States) with a power limiter (11930B, Agilent Technologies, Santa Clara, CA, United States) and a high pass filter (NHP-150+, Mini-Circuits, Brooklyn, NY, United States). The center frequency of the resonant peaks on the measured dispersion curves was determined by fitting Lorentzian functions to the peaks. The electron densities were calculated using the center frequencies (fSW) of the resonant peaks by the following equation [30].
ne (cm−3) = 1.24 (1 + εd) fSW × 1010,
where ne is the electron density, εd is the dielectric constant of the probe quartz tube (relative permittivity of 3.78), and the unit of fSW is GHz.
Optical emission spectra were taken by a spectrometer (HR-2000 CG, Ocean Optics, Largo, FL, United States) using an optical fiber, and the light was collected through a quartz window at the DF-CCP chamber. Comparing hydrogen Balmer line intensity of alpha and beta, the excitation temperature of H was estimated on the hypothesis of Local Thermodynamic Equilibrium (LTE) by following equation [31].
I/I = [(λAg3)/(λAg4)] exp(−(EiEk)/kBTe),
where I is the optical emission intensity, λ is the wavelength of emission line, A is transition probability, g is the degeneracy, Ei and Ek are the energy of state i and k, kB is Boltzmann constant, Te is excitation temperature. The optical emission intensity was calibrated by reference light source (SL1-CAL, Tokyo Instruments, Tokyo, Japan) and subtracted background by the linear baseline.
The ion flux (Γi) was determined by the plasma density at the sheath edge (ns) and the Bohm speed (uB) [32].
Γi = nsuB = 0.61ne(eTe/Mi)1/2,
where e is the elementary charge, Mi is the mass of ion in the plasma. The electron temperature was determined by the H excitation temperature instead of actual electron temperature, because it is difficult to measure the electron temperature by a Langmuir probe method, due to the deposition to the probe. To determine Mi, the ion composition was measured by positive Secondary Ion Mass Spectroscopy (+SIMS) mode of the quadrupole mass spectrometer (EQP500, Hiden Analytical Ltd., Warrington, United Kingdom) attached at the chamber wall. The extractor voltage was set to −100 V. Only positive ions were extracted from the plasma and detected. The composition of Mi was mainly CH4+ and CH3+. Therefore, the Mi was determined to 16 amu for the calculation.
Thicknesses of a-C:H films were measured as a step height between the substrate and the film by a stylus line profiler. And then, the deposition rate was calculated as a value of a thickness divided by the deposition time.
The change of the incorporation of sp2-C clusters and H content of deposited a-C:H films was estimated by visible Raman spectroscopy (inVia Reflex Raman microscope, Renishaw, Gloucestershire, United Kingdom) with excitation of 0.25 mW of the 532 nm laser power. An objective lens of 50 magnitudes was used to collect the Raman signals. Raman spectra were obtained by accumulating 20 spectra taken at an integration time of 1 s for a good signal to noise ratio and to avoid damage by the laser irradiation. The photoluminescence (PL) background of Raman spectra was a linear fit with ranges of 920−970 and 1800−1950 cm−1. The peak deconvolution of G band and D band was conducted with the Gaussian function. The fitting was performed by the algorism of Levenberg-Marquardt. The evolution of the hydrogen content was estimated using the ratio of PL slope to G-band peak (around 1580 cm−1) intensity (Slope/IG) [10,33,34].
To study the density of dangling bonds, electron spin resonance (ESR) measurements were carried out at room temperature using an X-band ESR spectrometer (EMX-plus, BRUKER, Billerica, MA, United States) with 100 kHz modulation of the magnetic field. The density of dangling bonds was estimated using a reference sample of CuSO4·5H2O (number of spins; 6.5 × 10¹⁸).

3. Results

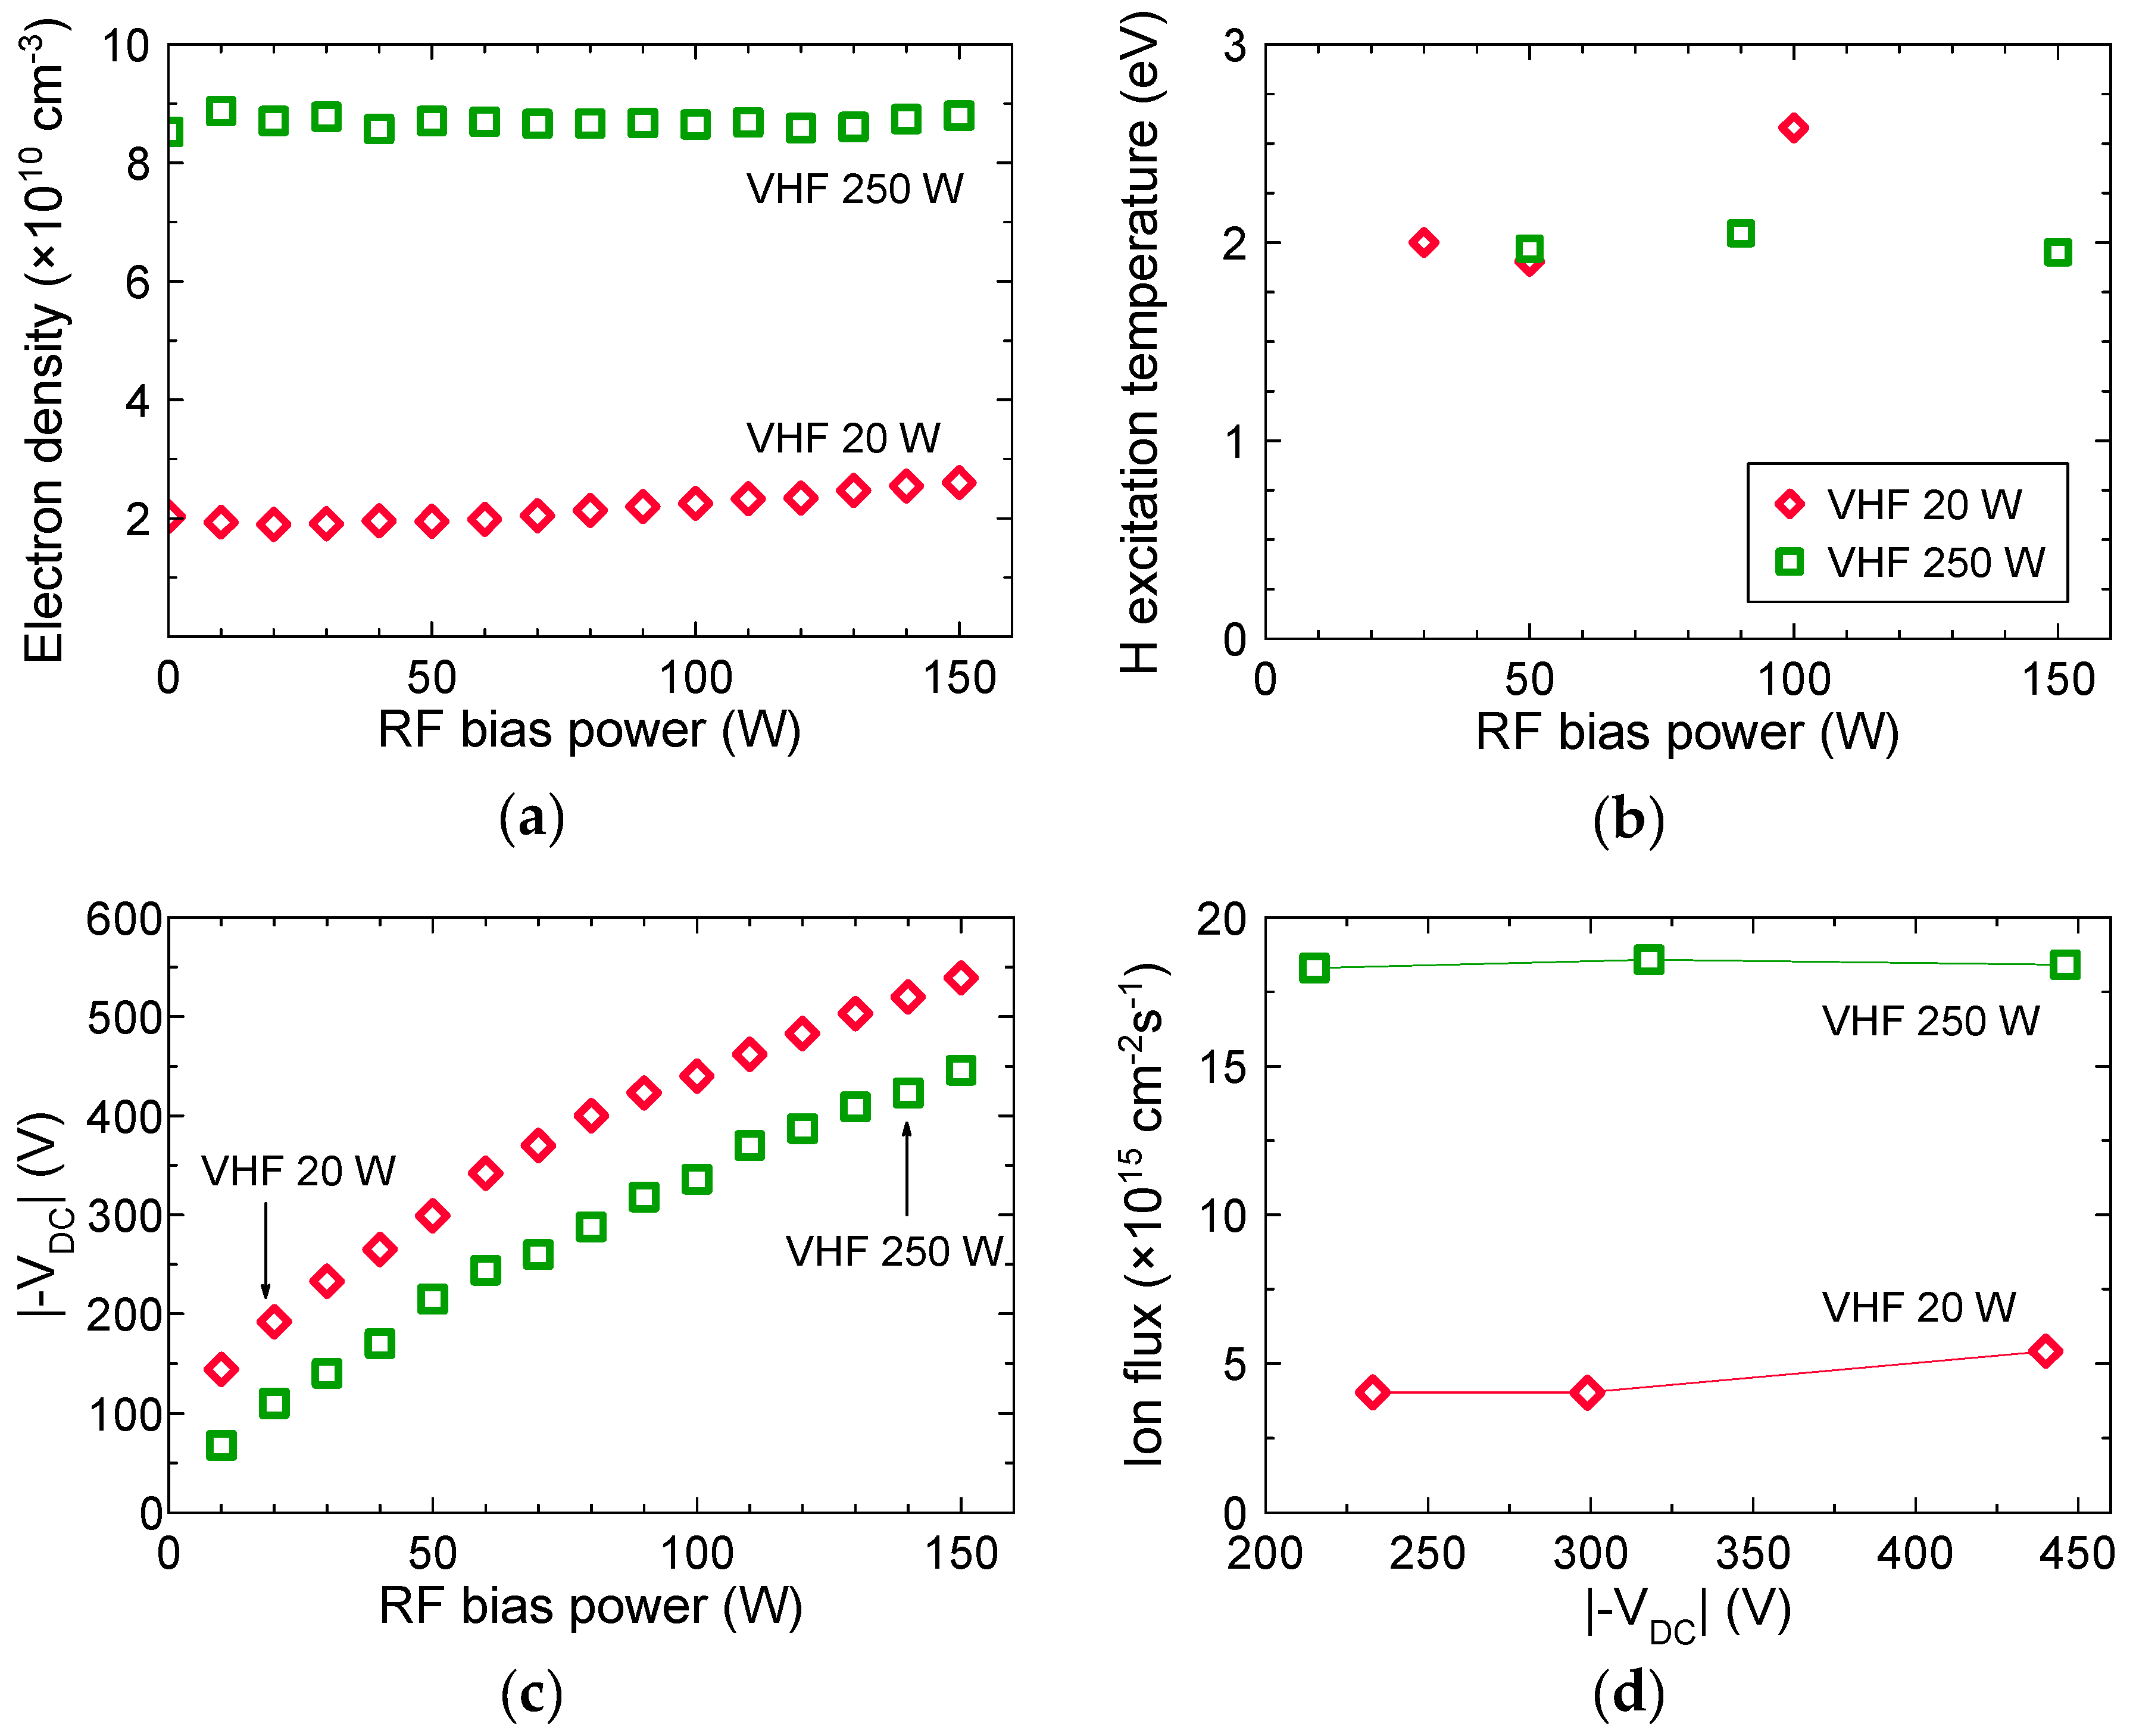
3.1. Plasma Characteristics

To determine the ΓEi, the electron density and temperature, and the -VDC were measured. Figure 1 shows the plasma diagnostics results of H2/CH4 DF-CCP. Figure 2a shows the electron densities at 20 and 250 W in the VHF power, respectively, as a function of RF bias power. The electron densities hardly changed regardless of RF bias power. They were around 2.0–2.6 × 10¹⁰ and 8.8 × 1010 cm−3 for cm−3 in the cases with 20 and 250 W in the VHF power, respectively. RF bias voltage almost did not affect the electron density, because of the electron density increase in proportion to the square of the frequency of the discharge power [35]. The contribution of RF power to the electron density is negligibly small compared with VHF power. Figure 2b shows the H excitation temperature as a function of RF bias power, calculated by the Equation (2). The H excitation temperature was almost constant to be about 2 eV regardless of both VHF and RF bias powers. The electron temperature usually depends on the process pressure, because the acceleration of electrons depends on the mean free path. In the current study, the pressure was kept at 12 Pa. So that, the electron temperature was almost not changed. Figure 2c shows the dependence of the |-VDC| on the RF bias power. The |-VDC| increased almost linearly with increasing the RF bias power. Figure 2d shows the Γi values calculated using Equation (3) as a function of |-VDC |. They hardly changed regardless of |-VDC| to be 4.0–5.4 × 10¹⁵ and 1.8 × 1016 cm−2s−1 in the cases with 20 and 250 W in VHF power, respectively. This means the Γi depends on the VHF power rather than the |-VDC|, because the Γi depends on the electron density via the VHF power, in contrast, |-VDC| depends on the RF bias power.
Figure 3 shows the ΓEi values calculated from |-VDC| × Γi at 20 and 250 W in VHF power, respectively, as a function of the RF bias power. ΓEi increased from 0.9 × 10¹⁸ to 2.4 × 10¹⁸ Vcm−2s−1 and from 3.9 × 10¹⁸ to 8.2 × 10¹⁸ Vcm–2s−1 for 20 and 250 W in VHF power, respectively. This suggested that the combination of VHF power and RF bias power can precisely control the plasma properties. Based on plasma characteristics, effects of ΓEi on the deposition rate, the incorporation of sp2-C clusters, the H content, and the density of dangling bonds are discussed in Section 3.2 and Section 3.3.

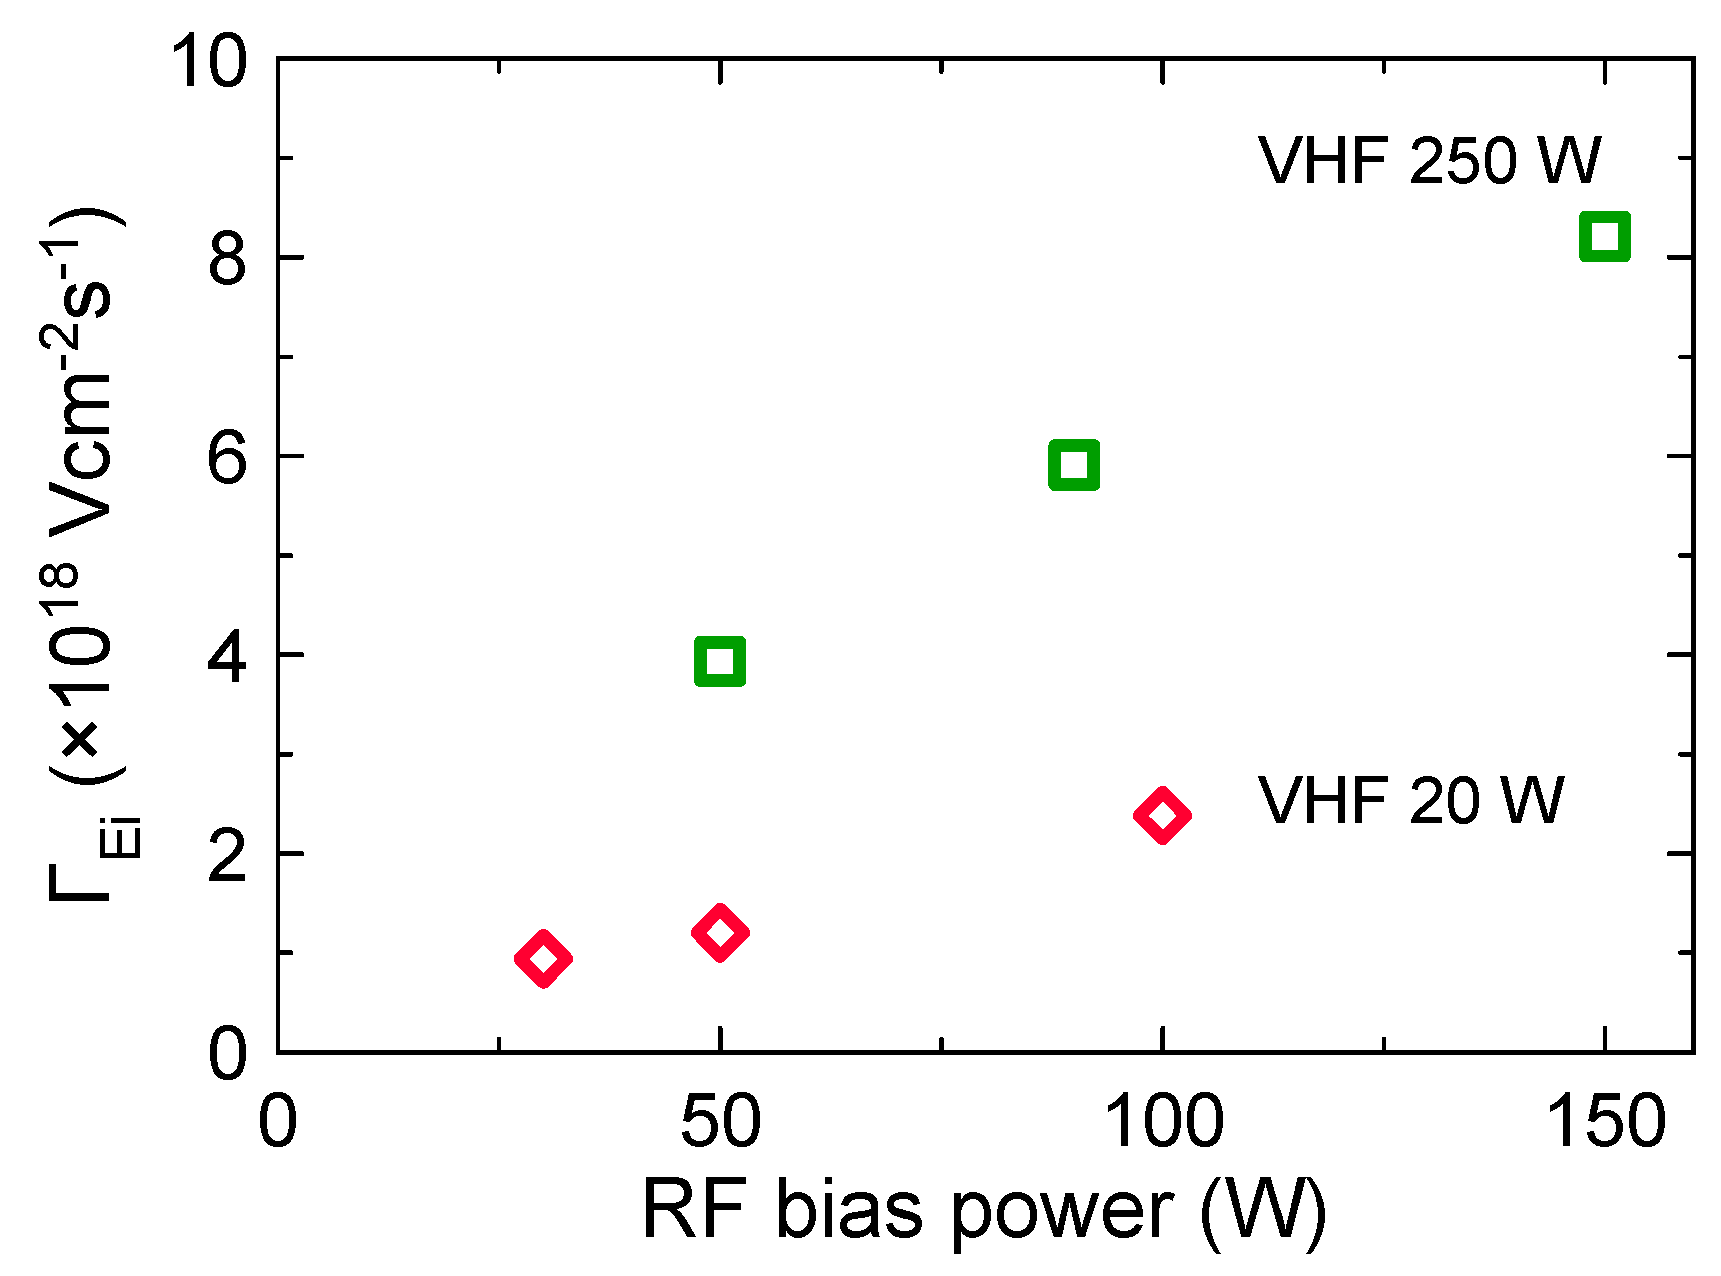
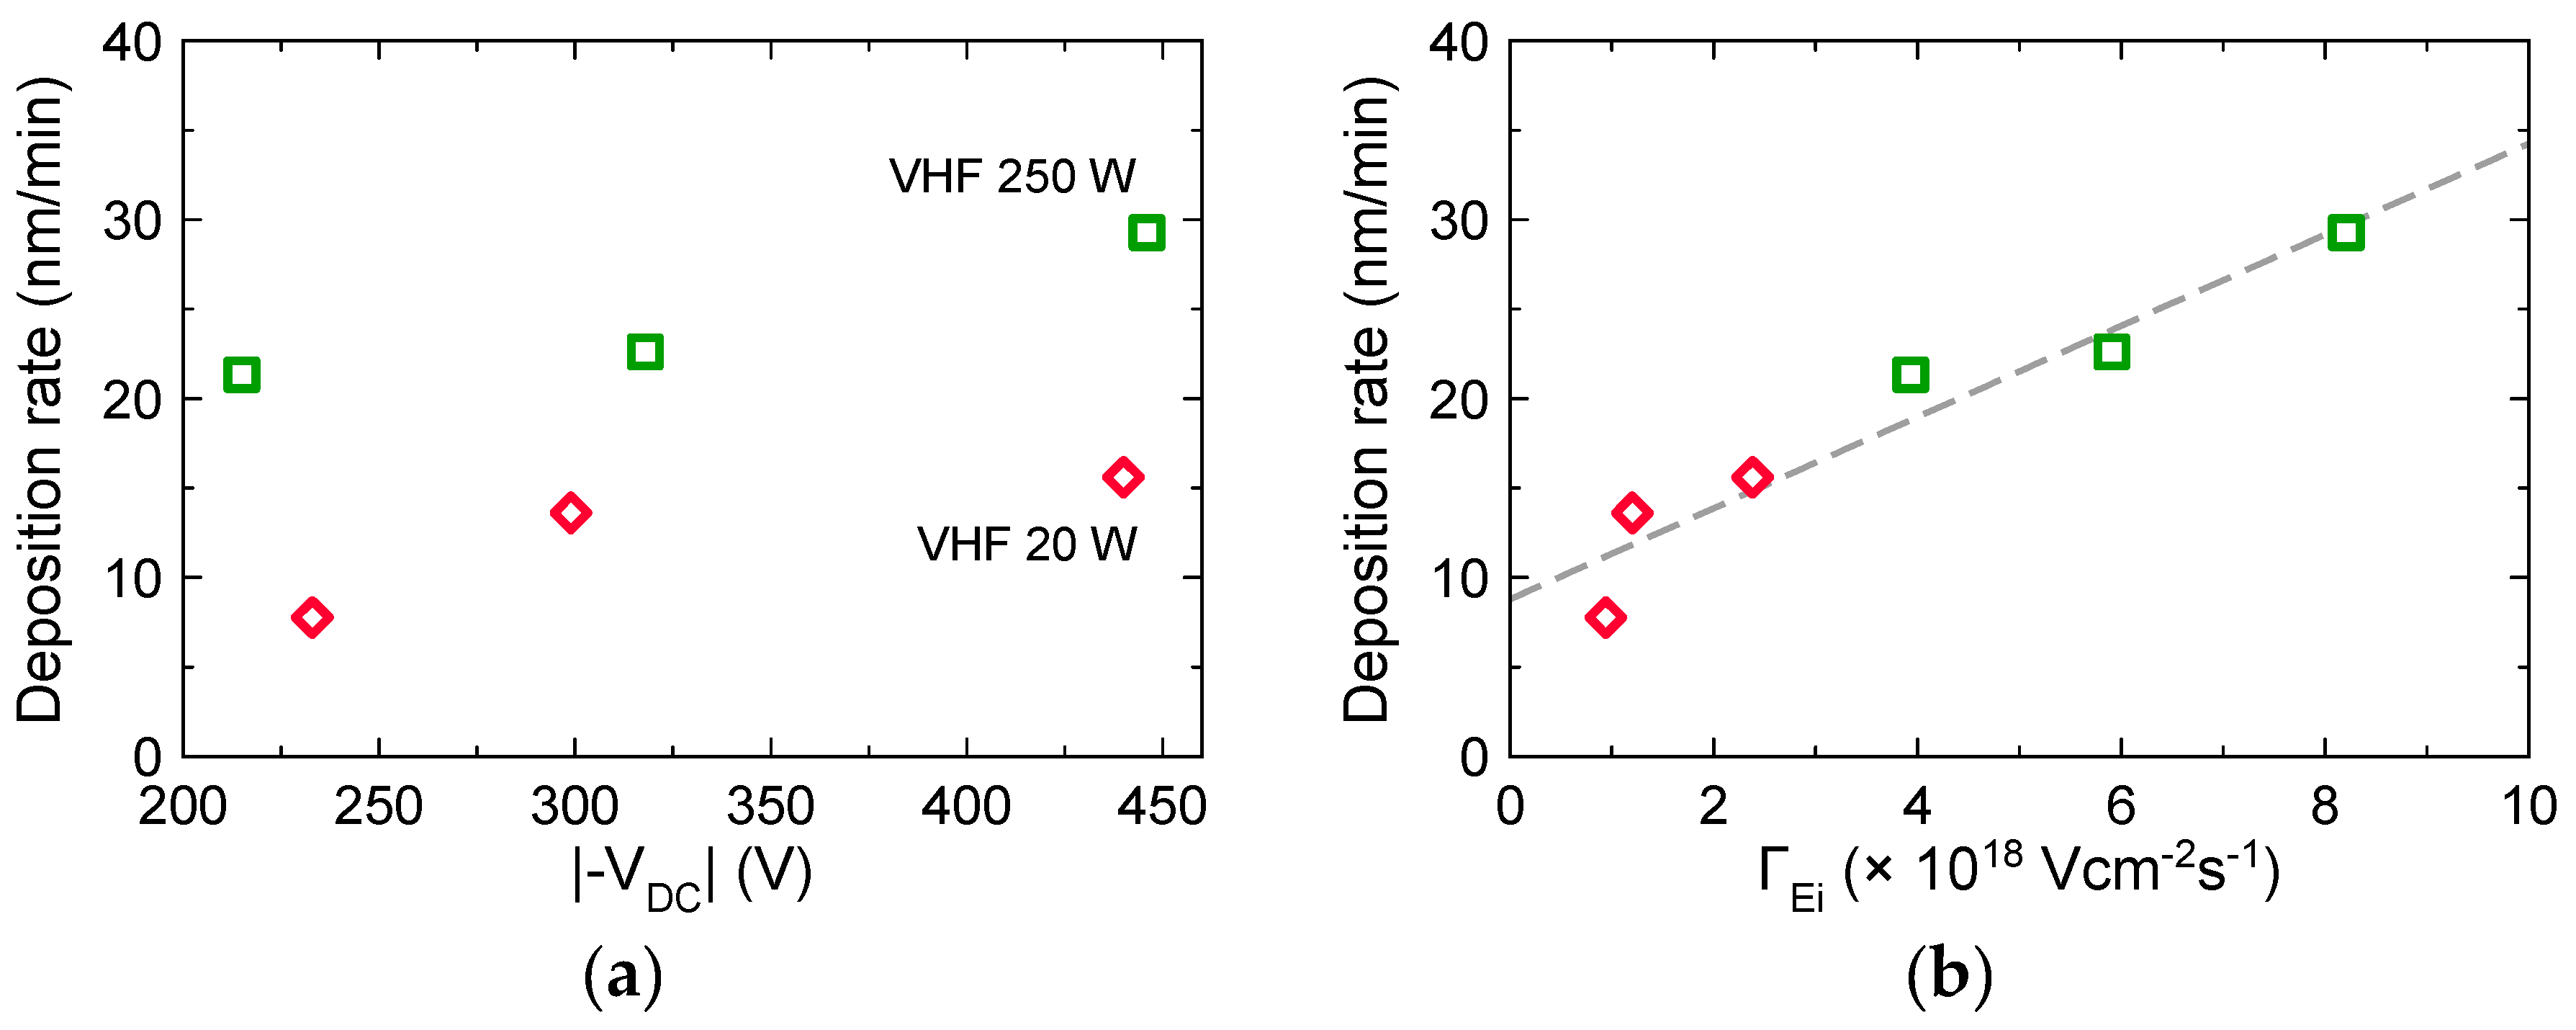
3.2. Effects of Ion Bombardment Energy Flux on the Deposition Rate

Figure 4a shows the deposition rate of a-C:H films as a function of |-VDC|. In both cases with 20 and 250 W in VHF power, they almost proportionally decreased with increasing |-VDC| in the same manner. However, values of Slope/IG in VHF 20 W are higher than that in VHF 250 W. By plotting the deposition rate as a function of ΓEi, plots are almost on one line, as shown in Figure 4b. It is assumed that the surface dangling bonds are generated by ion bombardment depending on not only its energy, but also its flux, and then the sticking of radicals are enhanced. This result indicates that the deposition rate depends on ΓEi and ΓEi should be the candidate for the factor of the deposition mechanism of a-C:H in PECVD.

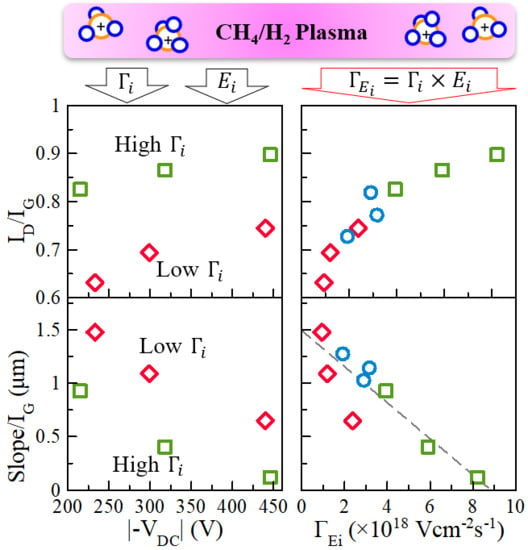
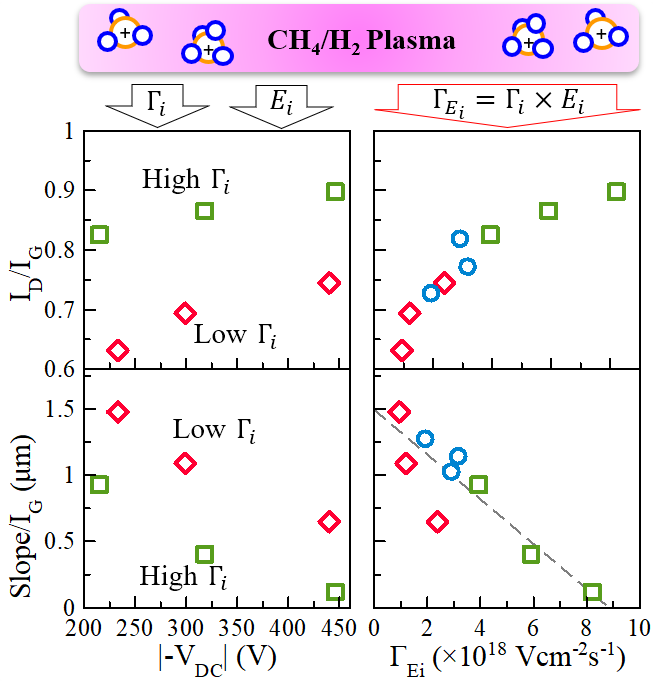
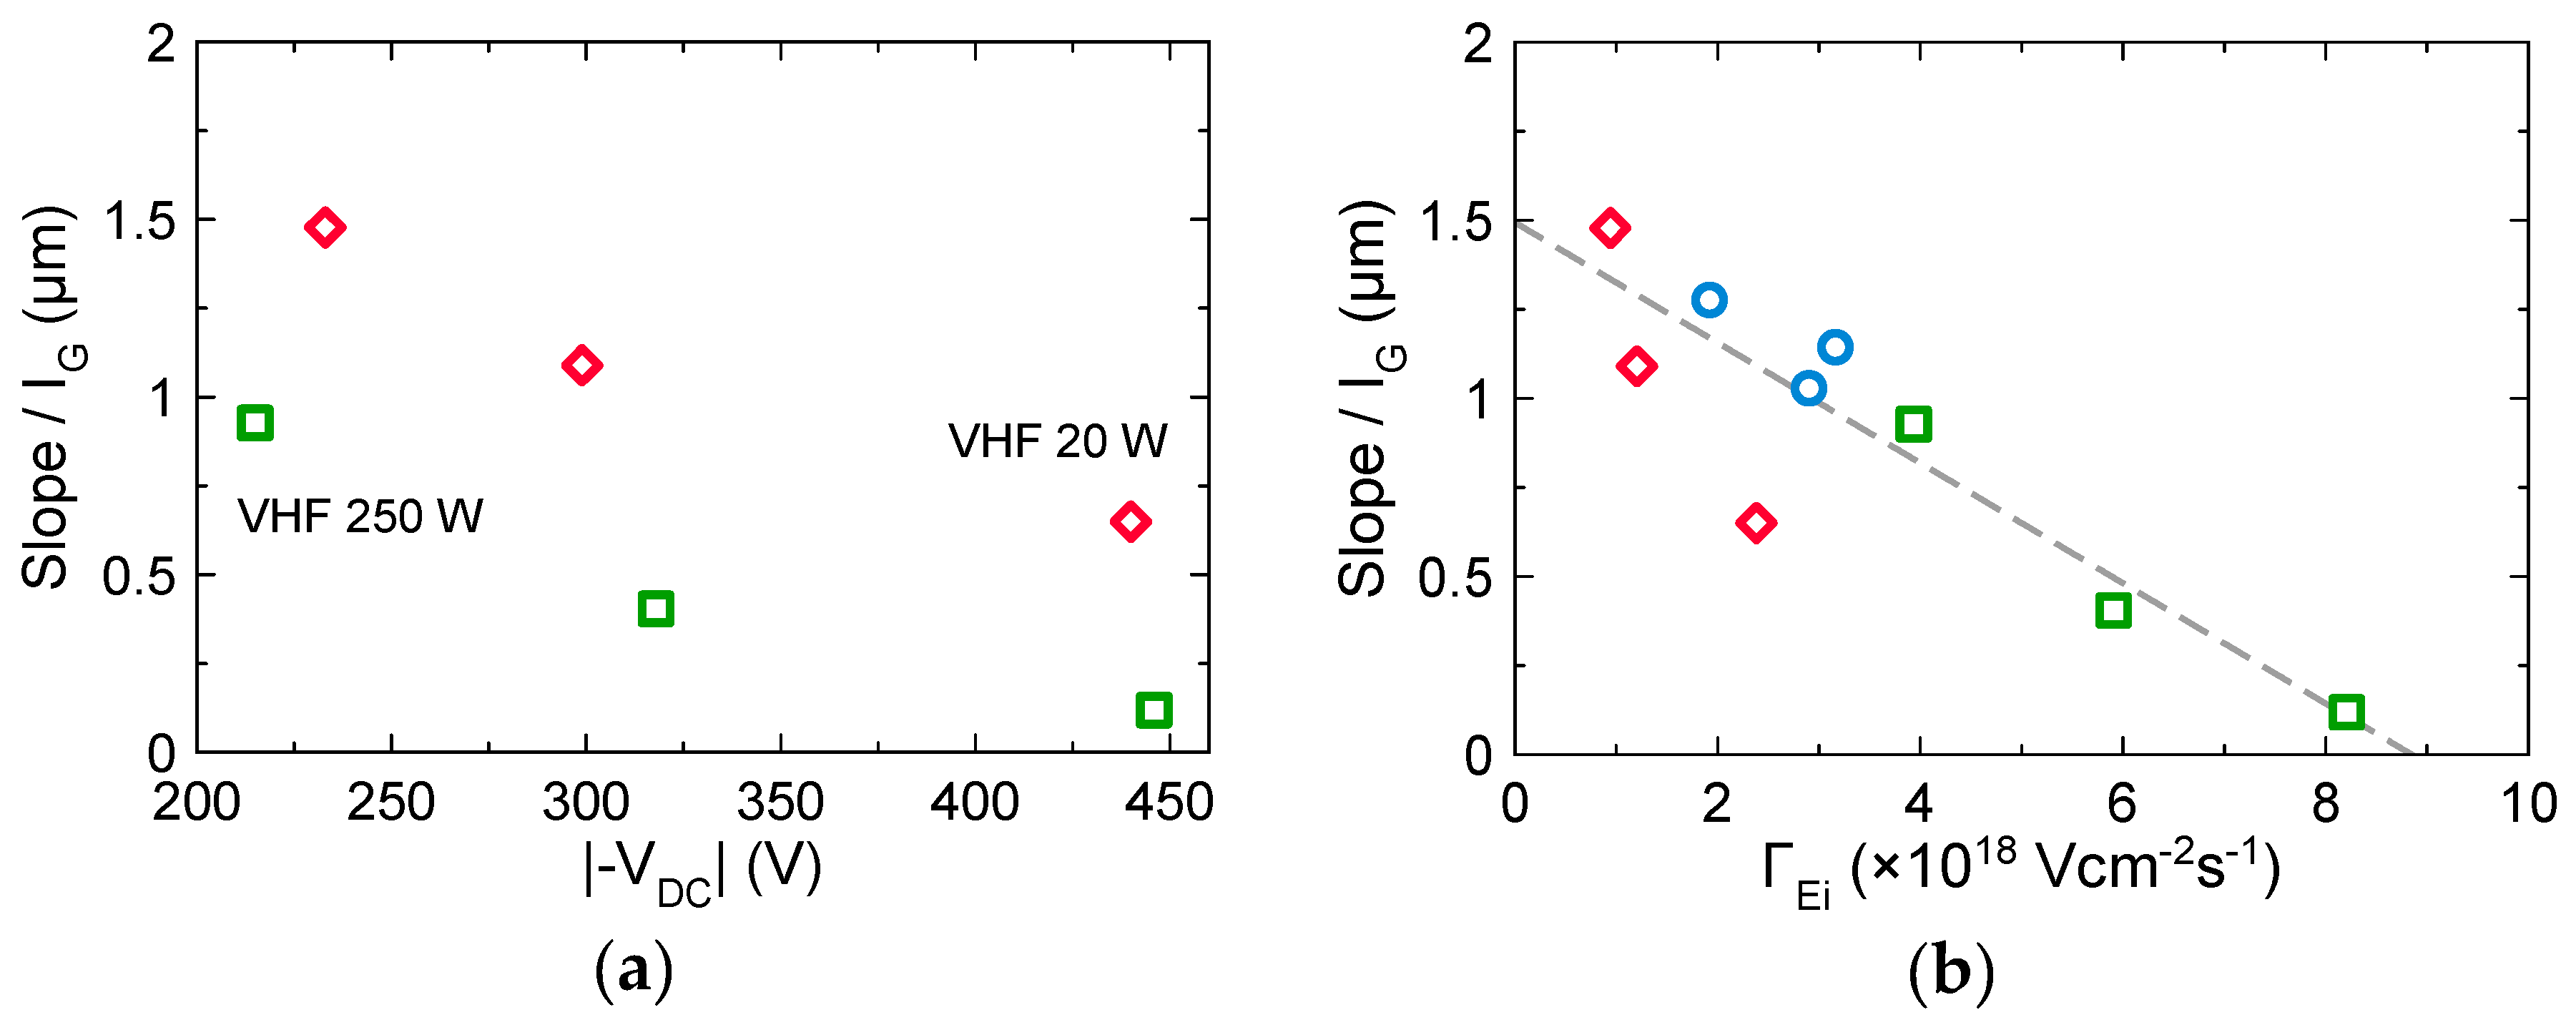
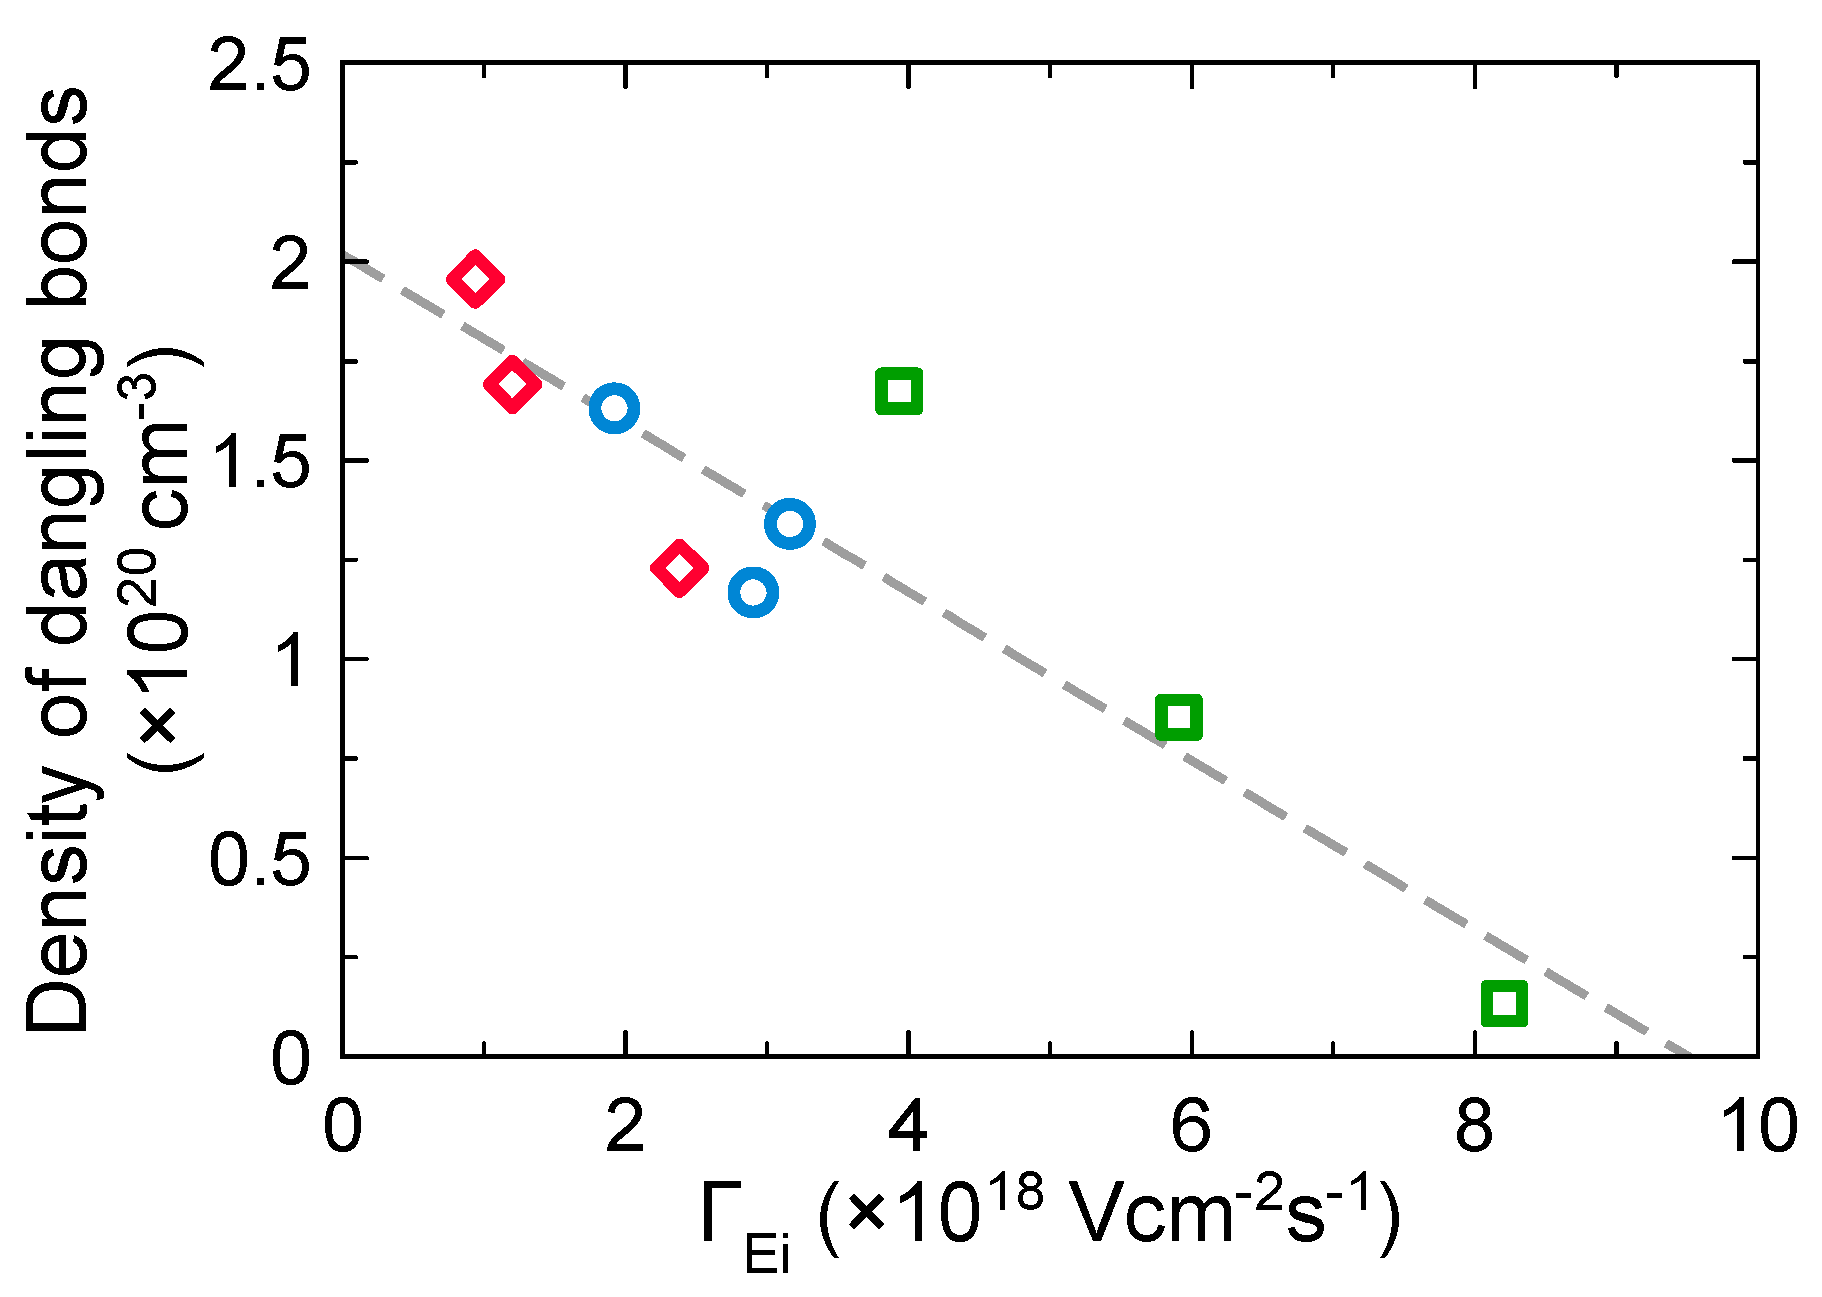
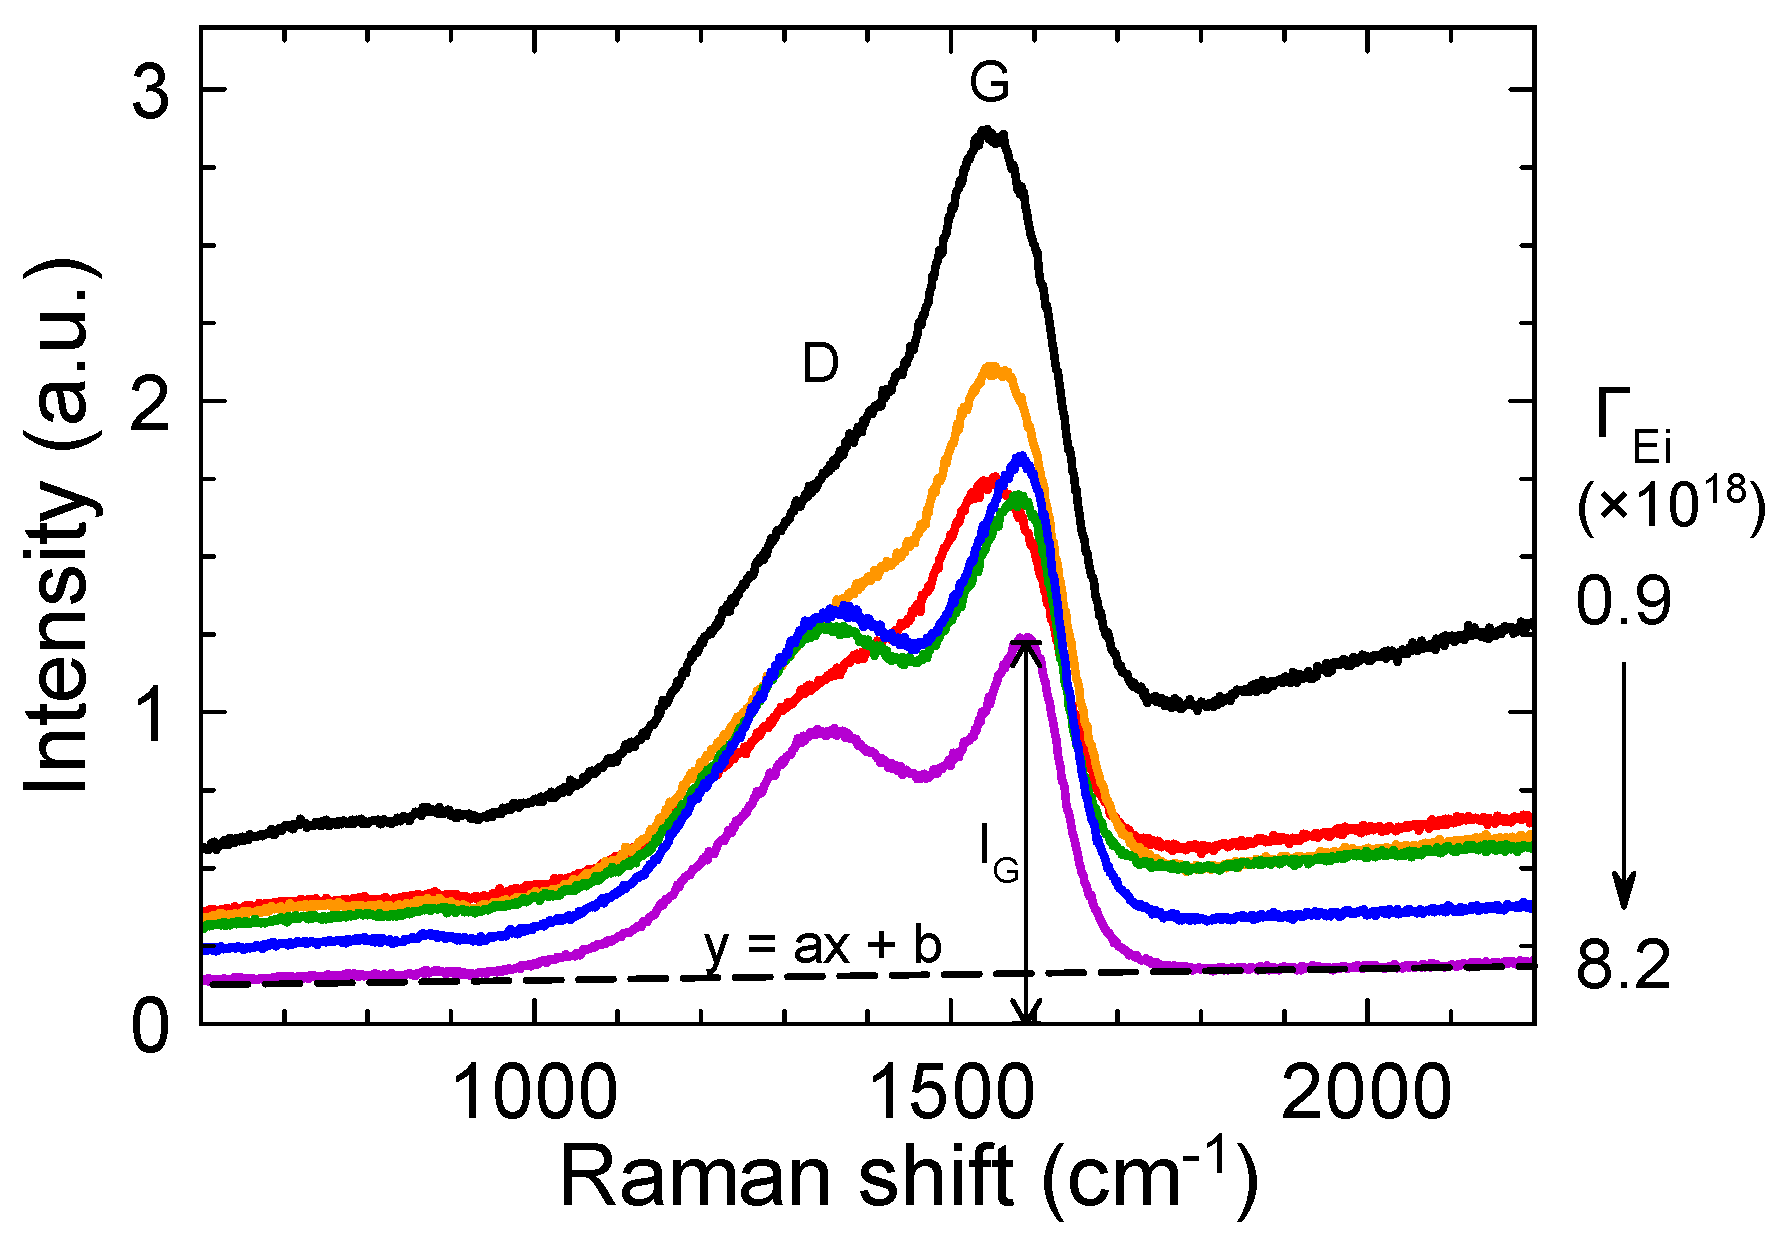
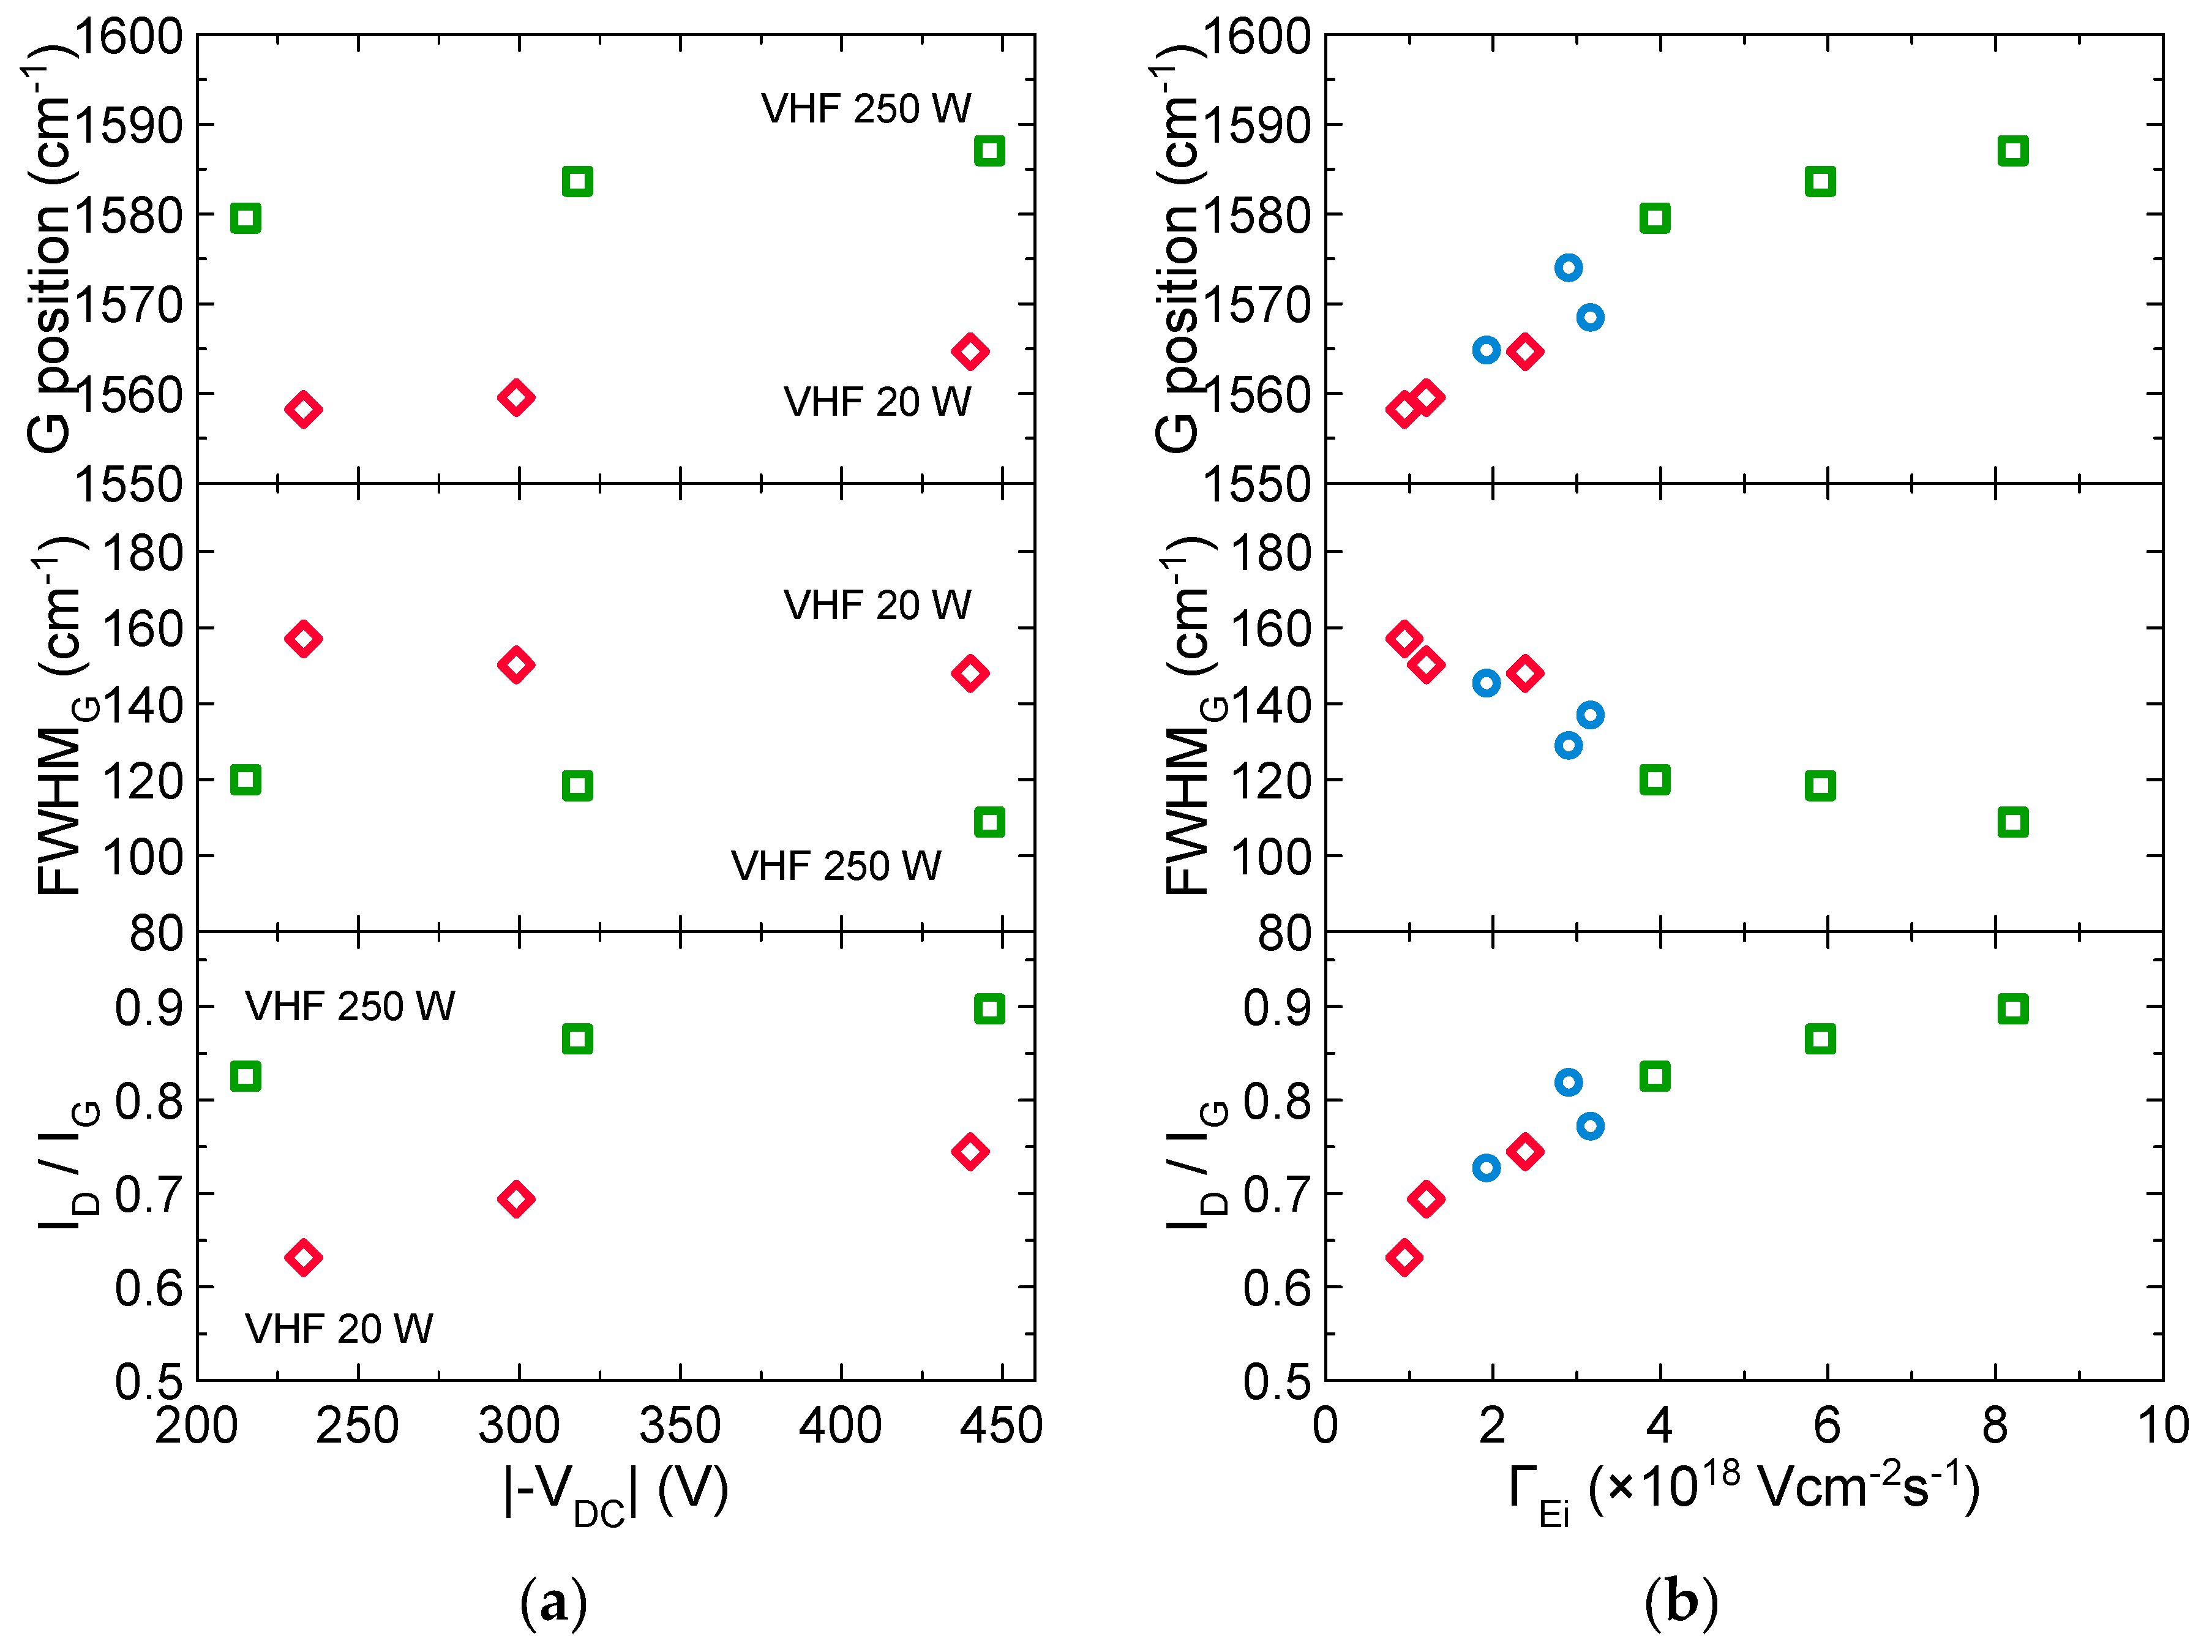
3.3. Effects of Ion Bombardment Energy Flux on the Incorpolation of sp2-C Clusters, the Slope/IG, and the Density of Dangling Bonds

Figure 5 shows the Raman spectra of as-deposited a-C:H films deposited at different VHF and RF bias powers. G- and D- band peaks, which corresponded to the sp2 bonded carbon and the edge of the six-membered ring structure respectively, became sharper as the RF bias power increased. In addition, their widths at 20 W were larger than those at 250 W. This can be interpreted that thermal spike and relaxation occur with increasing the VHF and RF bias powers.
Figure 6 shows the results of peak deconvolutions of Raman spectra of a-C:H films. Figure 6a shows the |-VDC| dependence of G band position (G position), FWHM of G band (FWHMG), and the intensity ratio of D band to G band (ID/IG). With increasing |-VDC|, the G position and ID/IG slightly increased, and the FWHMG slightly decreased. This trend implies that the ion bombardment enhances the incorporation of sp2-C clusters by thermal spike and relaxation process. However, the difference between 20 and 250 W in VHF power is larger than the changes of these values by |-VDC|. Considering ΓEi, the G position, the ID/IG, and the FWHMG can be described as one trend. Figure 6b shows the G position, the ID/IG, and the FWHMG as functions of ΓEi. With increasing ΓEi from 0.9 × 10¹⁸ up to 4.0 × 10¹⁸ Vcm−2s−1, these 3 values linearly changed. Then, from 4.0 × 10¹⁸ Vcm−2s−1, the slope of changes decreased. Merlen et al. and Rose et al. reported that the plot of G position versus FWHMG for visible Raman spectra of a-C [33,36]. They showed that the increase in G position and decrease in FWHMG indicates the incorporation of sp2-C clusters and the change of structures to nanocrystalline graphite (nc-G). Therefore, the change of G position and FWHMG in the current study can be interpreted that the a-C:H films become nc-G by the ion bombardment energy flux. The increase in ID/IG indicates that the increase in the crystallite size of sp2-C clusters [37]. So that, the increase of the ion bombardment energy flux enhanced the incorporation of sp2-C clusters.
On the other hand, the PL background was decreased with increasing the VHF and RF bias power, as shown in Figure 5. In addition, the PL backgrounds at 20 W was larger than those at 250 W. In general, the H containing a-C:H films, usually deposited by the PECVD, shows the high intensity of the background signal, because the recombination of excited electrons depends on the H content. Therefore, this PL background is often used to estimate the H content [10,33,38,39,40]. However, it should be noted that the density of dangling bonds in the a-C:H film can also increase the PL background as Rose et al. reported [33]. The intensity ratio of the PL background to G-band peak (Slope/IG), increased with increasing the post-annealing temperature, because of the passivation of the dangling bonds [33]. According to the molecular dynamic (MD) simulation, an increase of the number of C=C double bonds without changing the number of H atoms and C-H bonds suggested that the dangling bonds vanish as results of sp2 clustering and C reorganization. Conversely, this result also suggested that, if the density of dangling bonds hardly changed or decreased depending on any process conditions, an increase in the Slope/IG indicates the increase of the H content. Figure 7a shows the Slope/IG values as a function of |-VDC|. As shown in the figure, in both the cases with 20 and 250 W in VHF power, they almost proportionally decreased with increasing |-VDC| in the same manner. However, values of Slope/IG at VHF 20 W are higher than those at VHF 250 W. Figure 7b shows the Slope/IG values as a function of ΓEi. They almost proportionally decreased with increasing ΓEi in the one line. These results suggested that the Slope/IG values depend on not only the Ei, but also the ΓEi.
Figure 8 shows the density of dangling bonds of the a-C:H films. With increasing the ΓEi, the density of dangling bonds decreased in the same manner in both the cases with 20 and 250 W in VHF power, as well as the Slope/IG values. This result indicated that the ion bombardment energy flux effectively reduced the dangling bonds of a-C:H films.

4. Discussion

It was found in this study that both the Slope/IG and the density of dangling bonds decreased with increasing the ΓEi. The passivation of dangling bonds could enhance the PL background of a-C:H films. Therefore, the Slope/IG with the ΓEi found in this study indicates the decrease in H content rather than the increase in the density of dangling bonds. The passivation of dangling bonds with the desorption of H by the ion bombardment can be assumed as the following mechanism. The displacement of H atoms from the C-H bonding preferentially occurs than that of C atoms, because of the lower displacement threshold energy of H atom than that of C [15]. This displacement rate of H depends on the Ei. The penetration depth of ion become the deeper and the collisions in the film increase with increasing the Ei. Furthermore, a multiple collision in the films results in much displacement of H atom from the C-H bonding. Therefore, with increasing the ΓEi, the flux of H subtraction from the C-H bonding increases, because of the energy transfer from the ions to the C-H bonds by an increase of collision frequency. The H abstraction induces to form the carbon-carbon continuous network with the neighboring C atoms which have dangling bonds. This conversion contributes to the decrease in the density of dangling bonds with decreasing the H content. Moreover, from the Raman analysis result, it can be assumed that the formation of carbon-carbon continuous network originated from the incorporation of sp2-C clusters, due to the relaxation process proposed in the subplantation model. Therefore, the ΓEi proposed in the current study is crucial to consider for controlling the H content and the carbon-carbon continuous network of sp2-C clusters in a-C:H films deposited by the PECVD.

5. Conclusions

The effects of ion bombardment energy flux (ΓEi) on the PL background of Raman spectra and the dangling bond density were investigated. The ΓEi was estimated from the plasma density at the sheath of plasma and Bohm speed based on the measurements of electron density, H excitation temperature, and negative self-bias voltage. According to the PAP, the electron densities only depended on the VHF power. They were around 2.0–2.6 × 10¹⁰ and 8.8 × 1010 cm−3 for the 20 and 250 W in VHF power, respectively. The H excitation temperature was estimated 2 eV from the intensity ratio of Hα and Hβ of the optical emission. From the electron density at the sheath edge and the Bohm speed of CH4 ion, the ion fluxes were calculated to be 4.0–5.4 × 10¹⁵ and 1.8 × 10¹⁶ Vcm–2s–1 in the cases with 20 and 250 W in VHF power, respectively. The negative self-bias voltage was controlled by the RF bias power. Thus, the ΓEi was controlled by both the VHF power and the RF bias power. The deposition rate was increased with increasing the ΓEi, due to the formation of surface dangling bonds by the H desorption. The PL background of Raman spectra and the density of dangling bonds indicated that the decrease of H content with increasing the ΓEi. And the density of dangling bonds and Raman analysis results of G position, FWHMG, and ID/IG indicated that the carbon-carbon continuous network of sp2-C clusters was induced by an increase of the ΓEi. Therefore, the ΓEi proposed in this study is one of the crucial factors in the H desorption mechanism and makes the precise control of a-C:H films in the PECVD possible.

Author Contributions

H.S. conceived, designed, and performed the experiments, and analyzed the data, and wrote the paper. H.K., T.T., K.I., and M.H. provided advice and helped writing the paper.

Funding

This research received no external funding.

Acknowledgments

The authors would like to thank Koji Yamakawa for technical support.

Conflicts of Interest

The authors declare no conflict of interest.

References

  1. Ray, S.C.; Mukherjee, D.; Sarma, S.; Bhattacharya, G.; Mathur, A.; Roy, S.S.; McLaughlin, J.A. Functional diamond like carbon (DLC) coatings on polymer for improved gas barrier performance. Diam. Relat. Mater. 2017, 80, 59–63. [Google Scholar] [CrossRef]
  2. Koós, M.; Füle, M.; Veres, M.; Tóth, S.; Pócsik, I. Multi-band structure of amorphous carbon luminescence. Diam. Relat. Mater. 2002, 11, 1115–1118. [Google Scholar] [CrossRef]
  3. Gerstner, E.G.; Mckenzie, D.R. Fabrication and characterization of novel electronic devices using tetrahedral amorphous carbon. Diam. Relat. Mater. 2006, 7, 1172–1177. [Google Scholar] [CrossRef]
  4. Adhikari, S.; Adhikary, S.; Omer, A.M.M.; Rusop, M.; Uchida, H.; Soga, T.; Umeno, M. Optical and structural properties of amorphous carbon thin films deposited by microwave surface-wave plasma CVD. Diam. Relat. Mater. 2006, 15, 188–192. [Google Scholar] [CrossRef]
  5. Andujar, J.L.; Polo, M.C.; Esteve, J.; Robertson, J.; Milne, W.I.; Martínez, E. Study of the mechanical properties of tetrahedral amorphous carbon films by nanoindentation and nanowear measurements. Diam. Relat. Mater. 2001, 10, 145–152. [Google Scholar] [CrossRef]
  6. Tiainen, V. Amorphous carbon as a bio-mechanical coating—Mechanical properties and biological applications. Diam. Relat. Mater. 2001, 10, 153–160. [Google Scholar] [CrossRef]
  7. Kanda, K.; Fukuda, K.; Kidena, K.; Imai, R.; Niibe, M.; Fujimoto, S.; Yokota, K.; Tagawa, M. Hyperthermal atomic oxygen beam irradiation effect on the Ti-containing DLC film. Diam. Relat. Mater. 2014, 41, 49–52. [Google Scholar] [CrossRef]
  8. Wazumi, K.; Koga, Y.; Tanaka, A. Tribological properties of a-C:H films on Si substrate prepared by plasma CVD in pulse-biased process. Diam. Relat. Mater. 2003, 12, 1018–1023. [Google Scholar] [CrossRef]
  9. Ohgoe, Y.; Hirakuri, K.K.; Saitoh, H.; Nakahigashi, T.; Ohtake, N.; Hirata, A.; Kanda, K.; Hiratsuka, M.; Fukui, Y. Classification of DLC films in terms of biological response. Surf. Coat. Technol. 2012, 207, 350–354. [Google Scholar] [CrossRef]
  10. Marchon, B.; Gui, J.; Grannen, K.; Rauch, G.C.; Ager, J.W.; Silva, S.R.P.; Robertson, J. Photoluminescence and Raman spectroscopy in hydrogenated carbon films. IEEE Trans. Magn. 1997, 33, 3148–3150. [Google Scholar] [CrossRef] [Green Version]
  11. Robertson, J. Plasma Deposition of Diamond-Like Carbon. Jpn. J. Appl. Phys. 2011, 50, 01AF01. [Google Scholar] [CrossRef]
  12. Lifshitz, Y.; Kasi, S.R.; Rabalais, J.W.; Eckstein, W. Subplantation model for film growth from hyperthermal species. Phys. Rev. B 1990, 41, 10468–10480. [Google Scholar] [CrossRef]
  13. Robertson, J. Deposition mechanisms for promoting sp3 bonding in diamond-like carbon. Diam. Relat. Mater. 1993, 2, 984–989. [Google Scholar] [CrossRef]
  14. Möller, W. Modelling and computer simulation of ion-beam- and plasma-assisted film growth. Thin Solid Films 1993, 228, 319–325. [Google Scholar] [CrossRef]
  15. Robertson, J. The deposition mechanism of diamond-like a-C and a-C: H. Diam. Relat. Mater. 1994, 3, 361–368. [Google Scholar] [CrossRef]
  16. Davis, C.A. A simple model for the formation of compressive stress in thin films by ion bombardment. Thin Solid Films 1993, 226, 30–34. [Google Scholar] [CrossRef]
  17. Miyagawa, Y.; Nakadate, H.; Ikeyama, M.; Nakao, S.; Miyagawa, S. Dynamic MC simulation for a-C:H deposition in methane plasma based on subplantation model. Diam. Relat. Mater. 2003, 12, 927–930. [Google Scholar] [CrossRef]
  18. Godet, C.; Conway, N.M.J.; Bourée, J.E.; Bouamra, K.; Grosman, A.; Ortega, C. Structural and electronic properties of electron cyclotron resonance plasma deposited hydrogenated amorphous carbon and carbon nitride films. J. Appl. Phys. 2002, 91, 4154. [Google Scholar] [CrossRef]
  19. Oda, A.; Kousaka, H. Numerical Analysis of Substrate-Incident Carbon Flux in Low-Pressure Radio-Frequency CH 4 Plasmas for Deposition of Diamond-Like Carbon Films. Electron. Commun. Jpn. 2015, 98, 31–39. [Google Scholar] [CrossRef]
  20. Sugiura, H.; Jia, L.; Kondo, H.; Ishikawa, K.; Tsutsumi, T.; Hayashi, T.; Takeda, K.; Sekine, M.; Hori, M. Effects of gas residence time of CH4/H2 on sp2 fraction of amorphous carbon films and dissociated methyl density during radical-injection plasma-enhanced chemical vapor deposition. Jpn. J. Appl. Phys. 2018, 57, 06JE03. [Google Scholar] [CrossRef]
  21. Jia, L.; Sugiura, H.; Kondo, H.; Takeda, K.; Ishikawa, K.; Oda, O.; Sekine, M.; Hiramatsu, M.; Hori, M. Effects of Radical Species on Structural and Electronic Properties of Amorphous Carbon Films Deposited by Radical-Injection Plasma-Enhanced Chemical Vapor Deposition. Plasma Process. Polym. 2016, 13, 730–736. [Google Scholar] [CrossRef]
  22. Kondo, S.; Hori, M.; Yamakawa, K.; Den, S.; Kano, H.; Hiramatsu, M. Highly reliable growth process of carbon nanowalls using radical injection plasma-enhanced chemical vapor deposition. J. Vac. Sci. Technol. B Microelectron. Nanom. Struct. 2008, 26, 1294. [Google Scholar] [CrossRef]
  23. Hiramatsu, M.; Kondo, H.; Hori, M. New Progress on Graphene Research; IntechOpen: London, UK, 2013. [Google Scholar]
  24. Mankelevich, Y.A.; May, P.W. New insights into the mechanism of CVD diamond growth: Single crystal diamond in MW PECVD reactors. Diam. Relat. Mater. 2008, 17, 1021–1028. [Google Scholar] [CrossRef]
  25. Toyota, H.; Nomura, S.; Mukasa, S.; Yamashita, H.; Shimo, T.; Okuda, S. A consideration of ternary C–H–O diagram for diamond deposition using microwave in-liquid and gas phase plasma. Diam. Relat. Mater. 2011, 20, 1255–1258. [Google Scholar] [CrossRef]
  26. Ueyama, T.; Fukunaga, Y.; Tsutsumi, T.; Takeda, K.; Kondo, H.; Ishikawa, K.; Sekine, M.; Iwata, M.; Ohya, Y.; Sugai, H.; et al. Electron behaviors in afterglow of synchronized dc-imposed pulsed fluorocarbon-based plasmas. Jpn. J. Appl. Phys. 2017, 56, 06HC03. [Google Scholar] [CrossRef] [Green Version]
  27. Ohya, Y.; Ishikawa, K.; Komuro, T.; Yamaguchi, T.; Takeda, K.; Kondo, H.; Sekine, M.; Hori, M. Spatial profiles of interelectrode electron density in direct current superposed dual-frequency capacitively coupled plasmas. J. Phys. D. Appl. Phys. 2017, 50, 155201. [Google Scholar] [CrossRef]
  28. Ohya, Y.; Iwata, M.; Ishikawa, K.; Sekine, M.; Hori, M.; Sugai, H. Rapid electron density decay observed by surface-wave probe in afterglow of pulsed fluorocarbon-based plasma. Jpn. J. Appl. Phys. 2016, 55, 080309. [Google Scholar] [CrossRef]
  29. Yamaguchi, T.; Komuro, T.; Koshimizu, C.; Takashima, S.; Takeda, K.; Kondo, H.; Ishikawa, K.; Sekine, M.; Hori, M. Direct current superposed dual-frequency capacitively coupled plasmas in selective etching of SiOCH over SiC. J. Phys. D. Appl. Phys. 2012, 45, 025203. [Google Scholar] [CrossRef]
  30. Kokura, H.; Nakamura, K.; Ghanashev, I.P.; Sugai, H. Plasma Absorption Probe for Measuring Electron Density in an Environment Soiled with Processing Plasmas. Jpn. J. Appl. Phys. 1999, 38, 5262–5266. [Google Scholar] [CrossRef]
  31. Park, C. Hydrogen line ratios as electron temperature indicators in nonequilibrium plasmas. J. Quant. Spectrosc. Radiat. Transf. 1972, 12, 323–370. [Google Scholar] [CrossRef]
  32. Lieberman, M.A.; Lichtenberg, A.J. Principles of Plasma Discharges and Materials Processing; Wiley-Interscience: Hoboken, NJ, USA, 2005. [Google Scholar]
  33. Rose, F.; Wang, N.; Smith, R.; Xiao, Q.-F.; Inaba, H.; Matsumura, T.; Saito, Y.; Matsumoto, H.; Dai, Q.; Marchon, B.; et al. Complete characterization by Raman spectroscopy of the structural properties of thin hydrogenated diamond-like carbon films exposed to rapid thermal annealing. J. Appl. Phys. 2014, 116, 123516. [Google Scholar] [CrossRef] [Green Version]
  34. Buijnsters, J.G.; Gago, R.; Jiménez, I.; Camero, M.; Agulló-Rueda, F.; Gómez-Aleixandre, C. Hydrogen quantification in hydrogenated amorphous carbon films by infrared, Raman, and X-ray absorption near edge spectroscopies. J. Appl. Phys. 2009, 105, 093510. [Google Scholar] [CrossRef]
  35. Colgan, M.J.; Meyyappan, M.; Murnick, D.E. Very high-frequency capacitively coupled argon discharges. Plasma Sources Sci. Technol. 1994, 3, 181–189. [Google Scholar] [CrossRef]
  36. Merlen, A.; Buijnsters, J.; Pardanaud, C. A Guide to and Review of the Use of Multiwavelength Raman Spectroscopy for Characterizing Defective Aromatic Carbon Solids: From Graphene to Amorphous Carbons. Coatings 2017, 7, 153. [Google Scholar] [CrossRef]
  37. Ferrari, A.; Robertson, J. Interpretation of Raman spectra of disordered and amorphous carbon. Phys. Rev. B 2000, 61, 14095–14107. [Google Scholar] [CrossRef]
  38. Zhou, X.; Suzuki, T.; Nakajima, H.; Komatsu, K.; Kanda, K.; Ito, H.; Saitoh, H. Structural analysis of amorphous carbon films by spectroscopic ellipsometry, RBS/ERDA, and NEXAFS. Appl. Phys. Lett. 2017, 110, 201902. [Google Scholar] [CrossRef] [Green Version]
  39. Adamopoulos, G.; Robertson, J.; Morrison, N.A.; Godet, C. Hydrogen content estimation of hydrogenated amorphous carbon by visible Raman spectroscopy. J. Appl. Phys. 2004, 96, 6348. [Google Scholar] [CrossRef]
  40. Casiraghi, C.; Ferrari, A.C.; Robertson, J. Raman spectroscopy of hydrogenated amorphous carbons. Phys. Rev. B 2005, 72, 085401. [Google Scholar] [CrossRef]
Figure 1. The schematic diagram of radical-injection plasma enhanced chemical vapor deposition (RI-PECVD) system with equipment for optical emission spectroscopy (OES), plasma absorption probe (PAP) method, and radio frequency (RF) bias voltage measurement.
Carbon 05 00008 g001
Figure 2. (a) Electron densities, (b) H excitation temperatures, and (c) magnitudes of negative self-bias voltages (|-VDC|) as a function of RF bias power, and (d) ion fluxes as a function of |-VDC|. Diamonds (◇) and squares (□) correspond to 20 and 250 W in very high frequency (VHF) power, respectively.
Carbon 05 00008 g002
Figure 3. Ion bombardment energy fluxes ΓEi as a function of RF bias powers. Diamonds (◇) and squares (□) correspond to 20 and 250 W in VHF power, respectively.
Carbon 05 00008 g003
Figure 4. Deposition rate as a function of (a) magnitudes of negative self-bias voltages (|-VDC|) and (b) ion bombardment energy fluxes. Diamonds (◇) and squares (□) correspond to 20 and 250 W in VHF power, respectively.
Carbon 05 00008 g004
Figure 5. The Raman spectra of as-deposited a-C:H films. Top 3 spectra are a-C:H films deposited at 20 W in VHF power (black, orange, and red lines) and bottom 3 spectra are a-C:H films deposited at 250 W in VHF power (green, blue, and purple lines). The ion bombardment energy flux ΓEi are shown at the right and its value increase from top to bottom.
Carbon 05 00008 g005
Figure 6. (a) The magnitude of the negative self-bias voltage |-VDC| and (b) the ion bombardment energy flux ΓEi dependences of G band position (G position), FWHM of G band (FWHMG), and the intensity ratio of D band to G band (ID/IG). Diamonds (◇) correspond to 20 W in VHF power, squares (□) correspond to 250 W in VHF power, and circles (○) correspond to 50, 100, and 200 W in VHF power with 50 W of RF bias power.
Carbon 05 00008 g006
Figure 7. The Slope/IG as functions of (a) the magnitude of the negative self-bias voltage |-VDC| and (b) the ion bombardment energy flux ΓEi. Diamonds (◇) correspond to 20 W in VHF power, squares (□) correspond to 250 W in VHF power, and circles (○) correspond to 50, 100, and 200 W in VHF power with 50 W of RF bias power.
Carbon 05 00008 g007
Figure 8. The dangling bonds density as a function of the ion bombardment flux. Diamonds (◇) correspond to 20 W in VHF power, squares (□) correspond to 250 W in VHF power, and circles (○) correspond to 50, 100, and 200 W in VHF power with 50 W of RF bias power.
Carbon 05 00008 g008

