1. Introduction
The Paris agreement of 2017 set a long term goal to limit global temperature rise to below 2 °C (above pre-industrial average) and to achieve this has set an aim to reduce greenhouse emissions as soon as possible (
https://unfccc.int/). Energy production and transport are major contributors to greenhouse emissions, particularly in the form of CO
2 from the combustion of fossil fuels. To reduce greenhouse gas emissions and achieve the goals of the Paris agreement, alternative fuel sources are required.
Hydrogen is a portable, renewable and non-polluting fuel source. The challenge holding back the wide scale use of hydrogen as a fuel source is the difficulty in its production from water splitting (Equation (1)). Electrolysis is the current commercial method to produce hydrogen from water, with typical power conversion efficiency of 65–75% [
1]. Hydrogen produced from electrolysis is only non-polluting and renewable if the energy is derived from renewable sources (photovoltaics, wind, etc.) [
2]. These processes themselves are also limited in efficiency and large infrastructure cost (both economic and environmental). An alternative approach to produce hydrogen in a renewable manner is via photocatalytic water splitting.
Photocatalysis is a light-assisted catalysis where reactive intermediates are formed on the surface upon photoillumination. Some semiconductors (e.g., TiO
2, SrTiO
3, BiVO
4, etc.) can act as a photocatalyst due to their intrinsic electronic structure composed of a filled valence (VB) and an empty conduction band (CB) [
3,
4]. When the semiconductor is illuminated by light with energy greater than its band gap (hν ≥ E
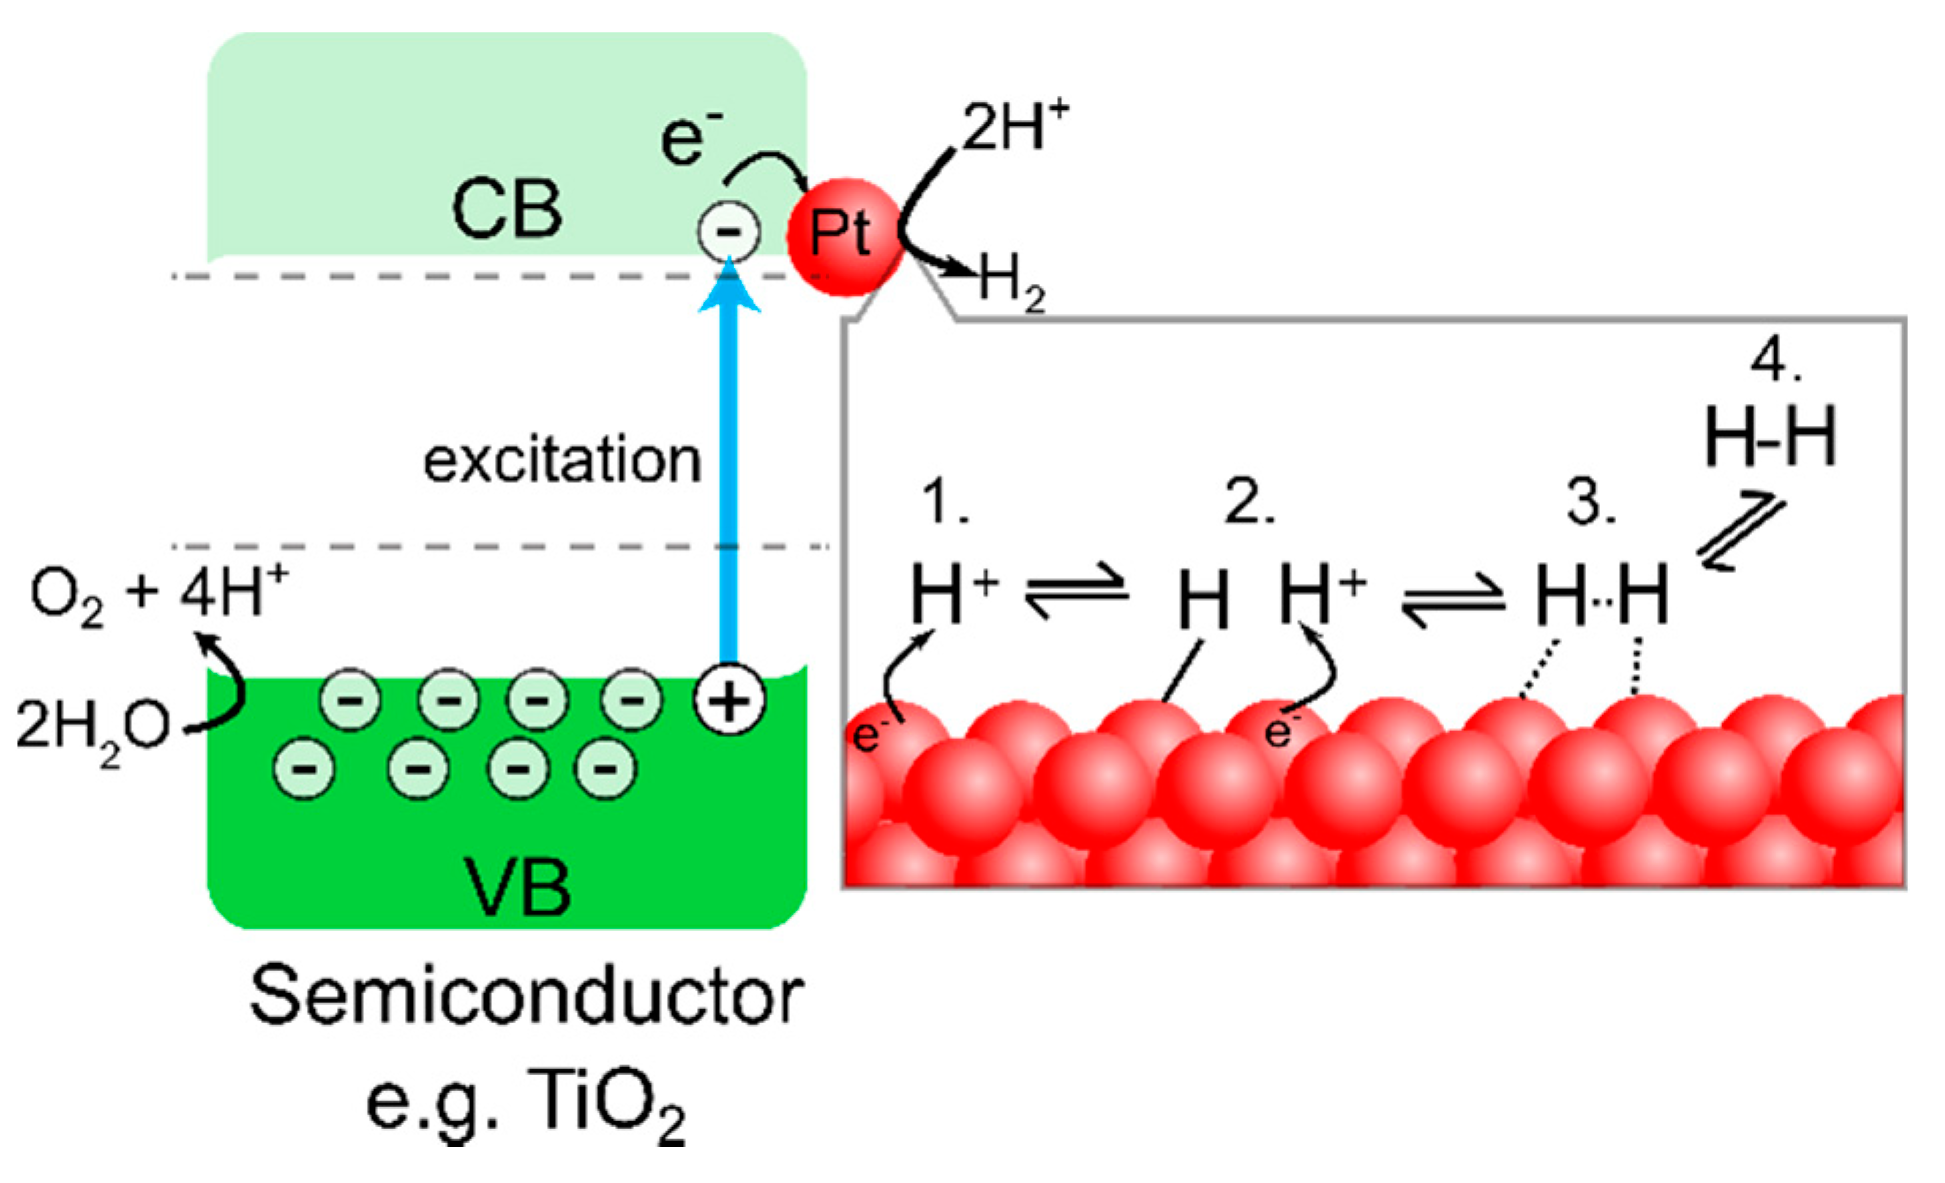
g), the VB electrons can be excited to the CB, leaving a positively charged hole in the VB. The photogenerated electrons and holes can drive reduction/oxidation reactions on the particle surface (
Figure 1).
To assist in driving the 2 electron transfer H
2 evolution reaction (HER, Equation (3)), a co-catalyst is typically used. The role of the co-catalyst is to adsorb H
+ cations and facilitate electron transfer from the semiconductor interface to H
+ and may occur through either the Volmer-Heyrovsky or the Volmer-Tafel mechanism (
Figure 1) [
5,
6,
7]. This forward reaction is in competition with the backward reaction of electron-hole recombination. Theoretical and experimental investigations have concluded that the most active elements for the hydrogen evolution reaction are noble metals (Pt, Pd, Rh) [
6]. In fact, Pt is clearly the most commonly used HER co-catalyst in the field [
2,
3].
Noble metals are rare and, therefore, expensive. Technoeconomic assessments of hydrogen production from photocatalytic water splitting typically show that the major factors in reducing the cost are solar-to-hydrogen (STH) efficiency and production cost [
8,
9]. Research in the field to reduce cost have looked at alternative co-catalysts such as sulphides and phosphides, which have shown production rates comparable to Pt nanoparticles [
10]. Other research has looked at reducing the amount of Pt used by employing Pt and other metal clusters (1–100 atoms), which have shown improved hydrogen production rates [
11,
12].
Despite the popularity of using Pt as the co-catalyst there is little consensus on the best practise of Pt deposition. This makes it difficult to compare photocatalysis results between research groups due to the disparity in Pt deposition method. In contrast, Aeroxide
® P25 (Evonik Degussa GmbH (Essen, Germany), “P25”) is a commercial source of TiO
2 which can be reliably used worldwide as an active and reliable photocatalyst and as a research benchmark [
13].
Pt nanoparticles are most commonly produced via photodeposition or impregnation [
2]. Photodeposition involves suspending the photocatalyst in a solution containing a Pt precursor (such as H
2PtCl
6) with a hole scavenger (methanol, Na
2CO
3) and illuminating with light that can excite the photocatalyst. The suspension is stirred and the reaction allowed to continue for 1–5 h before being collected and washed via repeated centrifuge steps and then dried in an oven. Pt impregnation involves mixing a Pt precursor with photocatalyst in a crucible with a small volume of solvent. The mixture is heated above the boiling temperature of the solvent until dry. The sample is ready to use directly.
Pt impregnation is far simpler but there is little control over the Pt nanoparticle size or interface with the photocatalyst. Photodeposition is far more time-consuming but produces a narrower size range of nanoparticles and, since the photocatalyst is responsible for the reduction, there is a strong interface between the Pt and the photocatalyst.
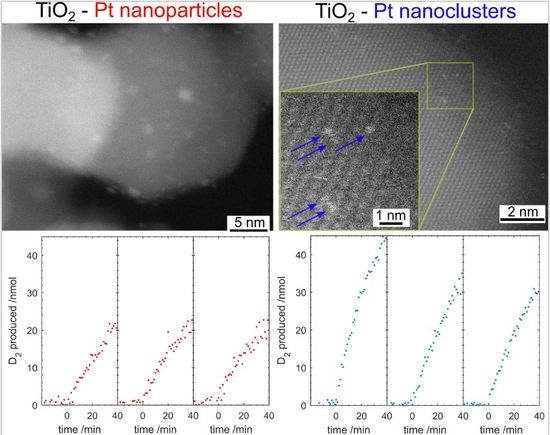
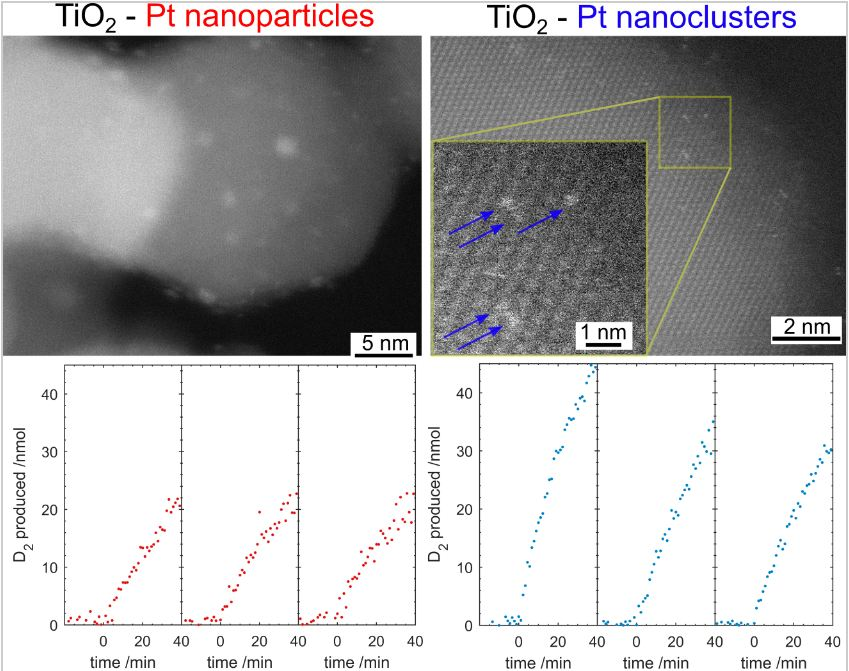
In this manuscript we present a method to prepare a Pt nanocluster (Pt-nc) co-catalyst on P25 via the impregnation method using a commercial Pt suspension typically used for electrocatalytic iodine reduction. We show that the Pt-nc co-catalyst outperforms photodeposited Pt nanoparticles (Pt-np) in gas phase photocatalytic D2 evolution from heavy water. This method, using commercially available sources for both photocatalyst and co-catalyst, could be used as a benchmark in comparing photocatalyst performance.
2. Materials and Methods
2.1. Platinum Photodeposition (P25-Pt-np)
Within a custom-made quartz lidded sealed container, commercial TiO2 powder (50 mg, Aeroxide® P25, Evonik Degussa GmbH, “P25”, Sigma-Aldrich, Castle Hill, Australia) was dispersed into a 50 mL aqueous suspension of 1 M methanol (99.8%, Chem-Supply, Gillman, Australia) via sonication for 10 min. To this stirred suspension, 256 µL of 0.01 M Pt (25.8 mg, K2PtCl6, Sigma-Aldrich, Australia) aqueous suspension was added to prepare a 1 wt% Pt on TiO2 sample. With stirring and in an ice bath, the sample was illuminated with ultraviolet (UV) irradiation (365 nm, UVATA, Shanghai, China) set to an approximate power of 2 W cm−2 for 30 min. The now slightly grey sample was repeatedly collected and washed with water (×2) and ethanol (×2, 100% undenatured, Chem-Supply, Gillman Australia) via centrifuge (Sigma 2-16P, John Morris, Chatswood, Australia) at 5304 g, before being dried in an oven at 100 °C overnight. Samples produced by this method are referred to as P25-Pt-np.
2.2. Platinum Impregnation (P25-Pt-nc)
To prepare 1 wt% Pt/TiO2 via impregnation, P25 powder (10 mg) was mixed with 102 µL Pt cluster suspension (CELS, Counter Electrode Solution, MS006220, DyeSol, Queanbeyan, Australia, see note*) and 0.9 mL methanol in an alumina crucible. The slurry was sonicated for 10 min before being placed in the centre of a muffle furnace (S.E.M Pty. Ltd., Adelaide, Australia). The temperature was increased at 1 °C min−1 until 100 °C and then heated to 450 °C without ramping control. The sample was left at 450 °C, in air for 30 min before being cooled to RT. The sample was used without further purification. Other wt% of Pt were obtained by varying volume of CELS added (e.g., 204 μL for 2 wt%) and volume of methanol such that the total volume was 1 mL (e.g., 0.8 mL for 2 wt%). Samples produced by this method are referred to as P25-Pt-nc.
*Note: CELS contains 0.005 M Pt and a trade secret mix of additives to produce Pt clusters (personal communication with Greatcell Solar, formerly known as Dyesol).
2.3. Photocatalytic Discs
The photocatalysts were deposited onto 1.3 cm2 glass microfibre discs (Type A/E, Pall, Port Washington, NY, USA) for photocatalytic testing; 5 mg of photocatalyst (to prepare 3 photocatalytic discs) was dispersed in 3 mL H2O via sonication for 10 min. The suspension was then dropped onto pre-weighed microfibre discs on a hotplate in a fumehood at 50 °C. The suspension was left to dry before the dropping procedure was repeated until all suspension was consumed. The sample left to dry overnight and then weighed. Typical sample weights were 1.2–1.8 mg (~1.5 mg). The effect of photocatalyst loading was also investigated by increasing the concentration of the photocatalyst to prepare samples of ~3 mg and ~5 mg.
2.4. Characterization
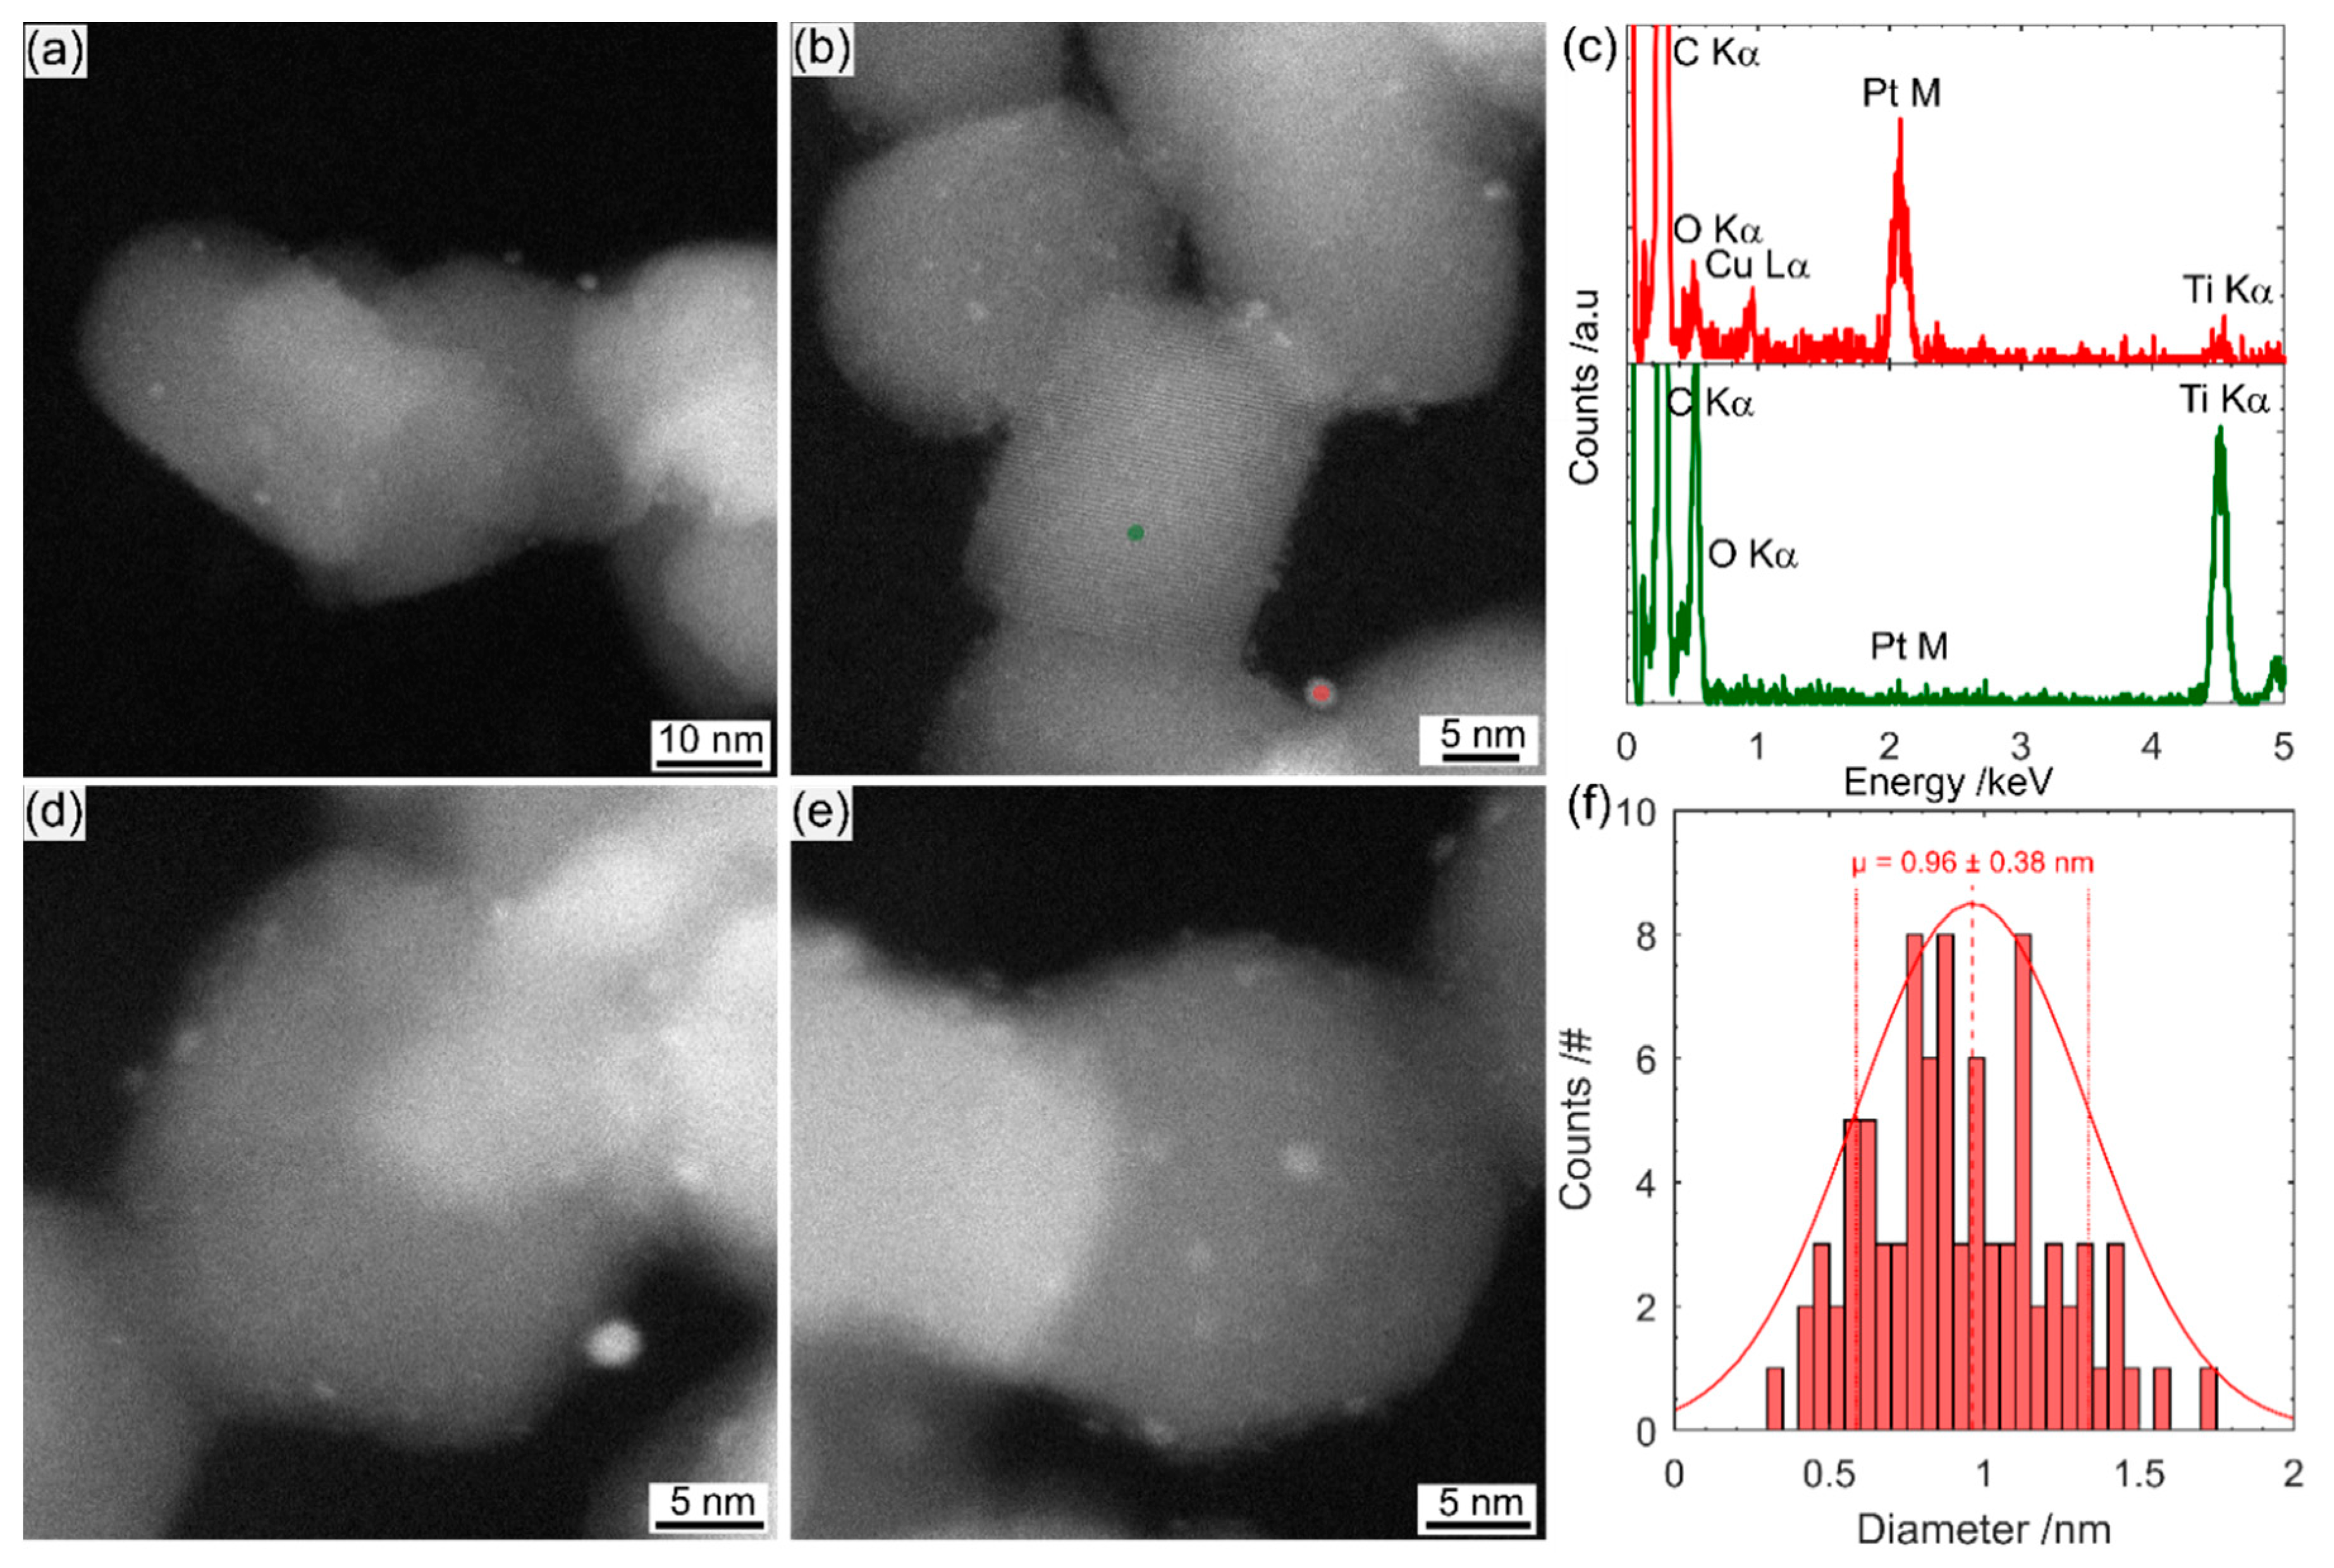
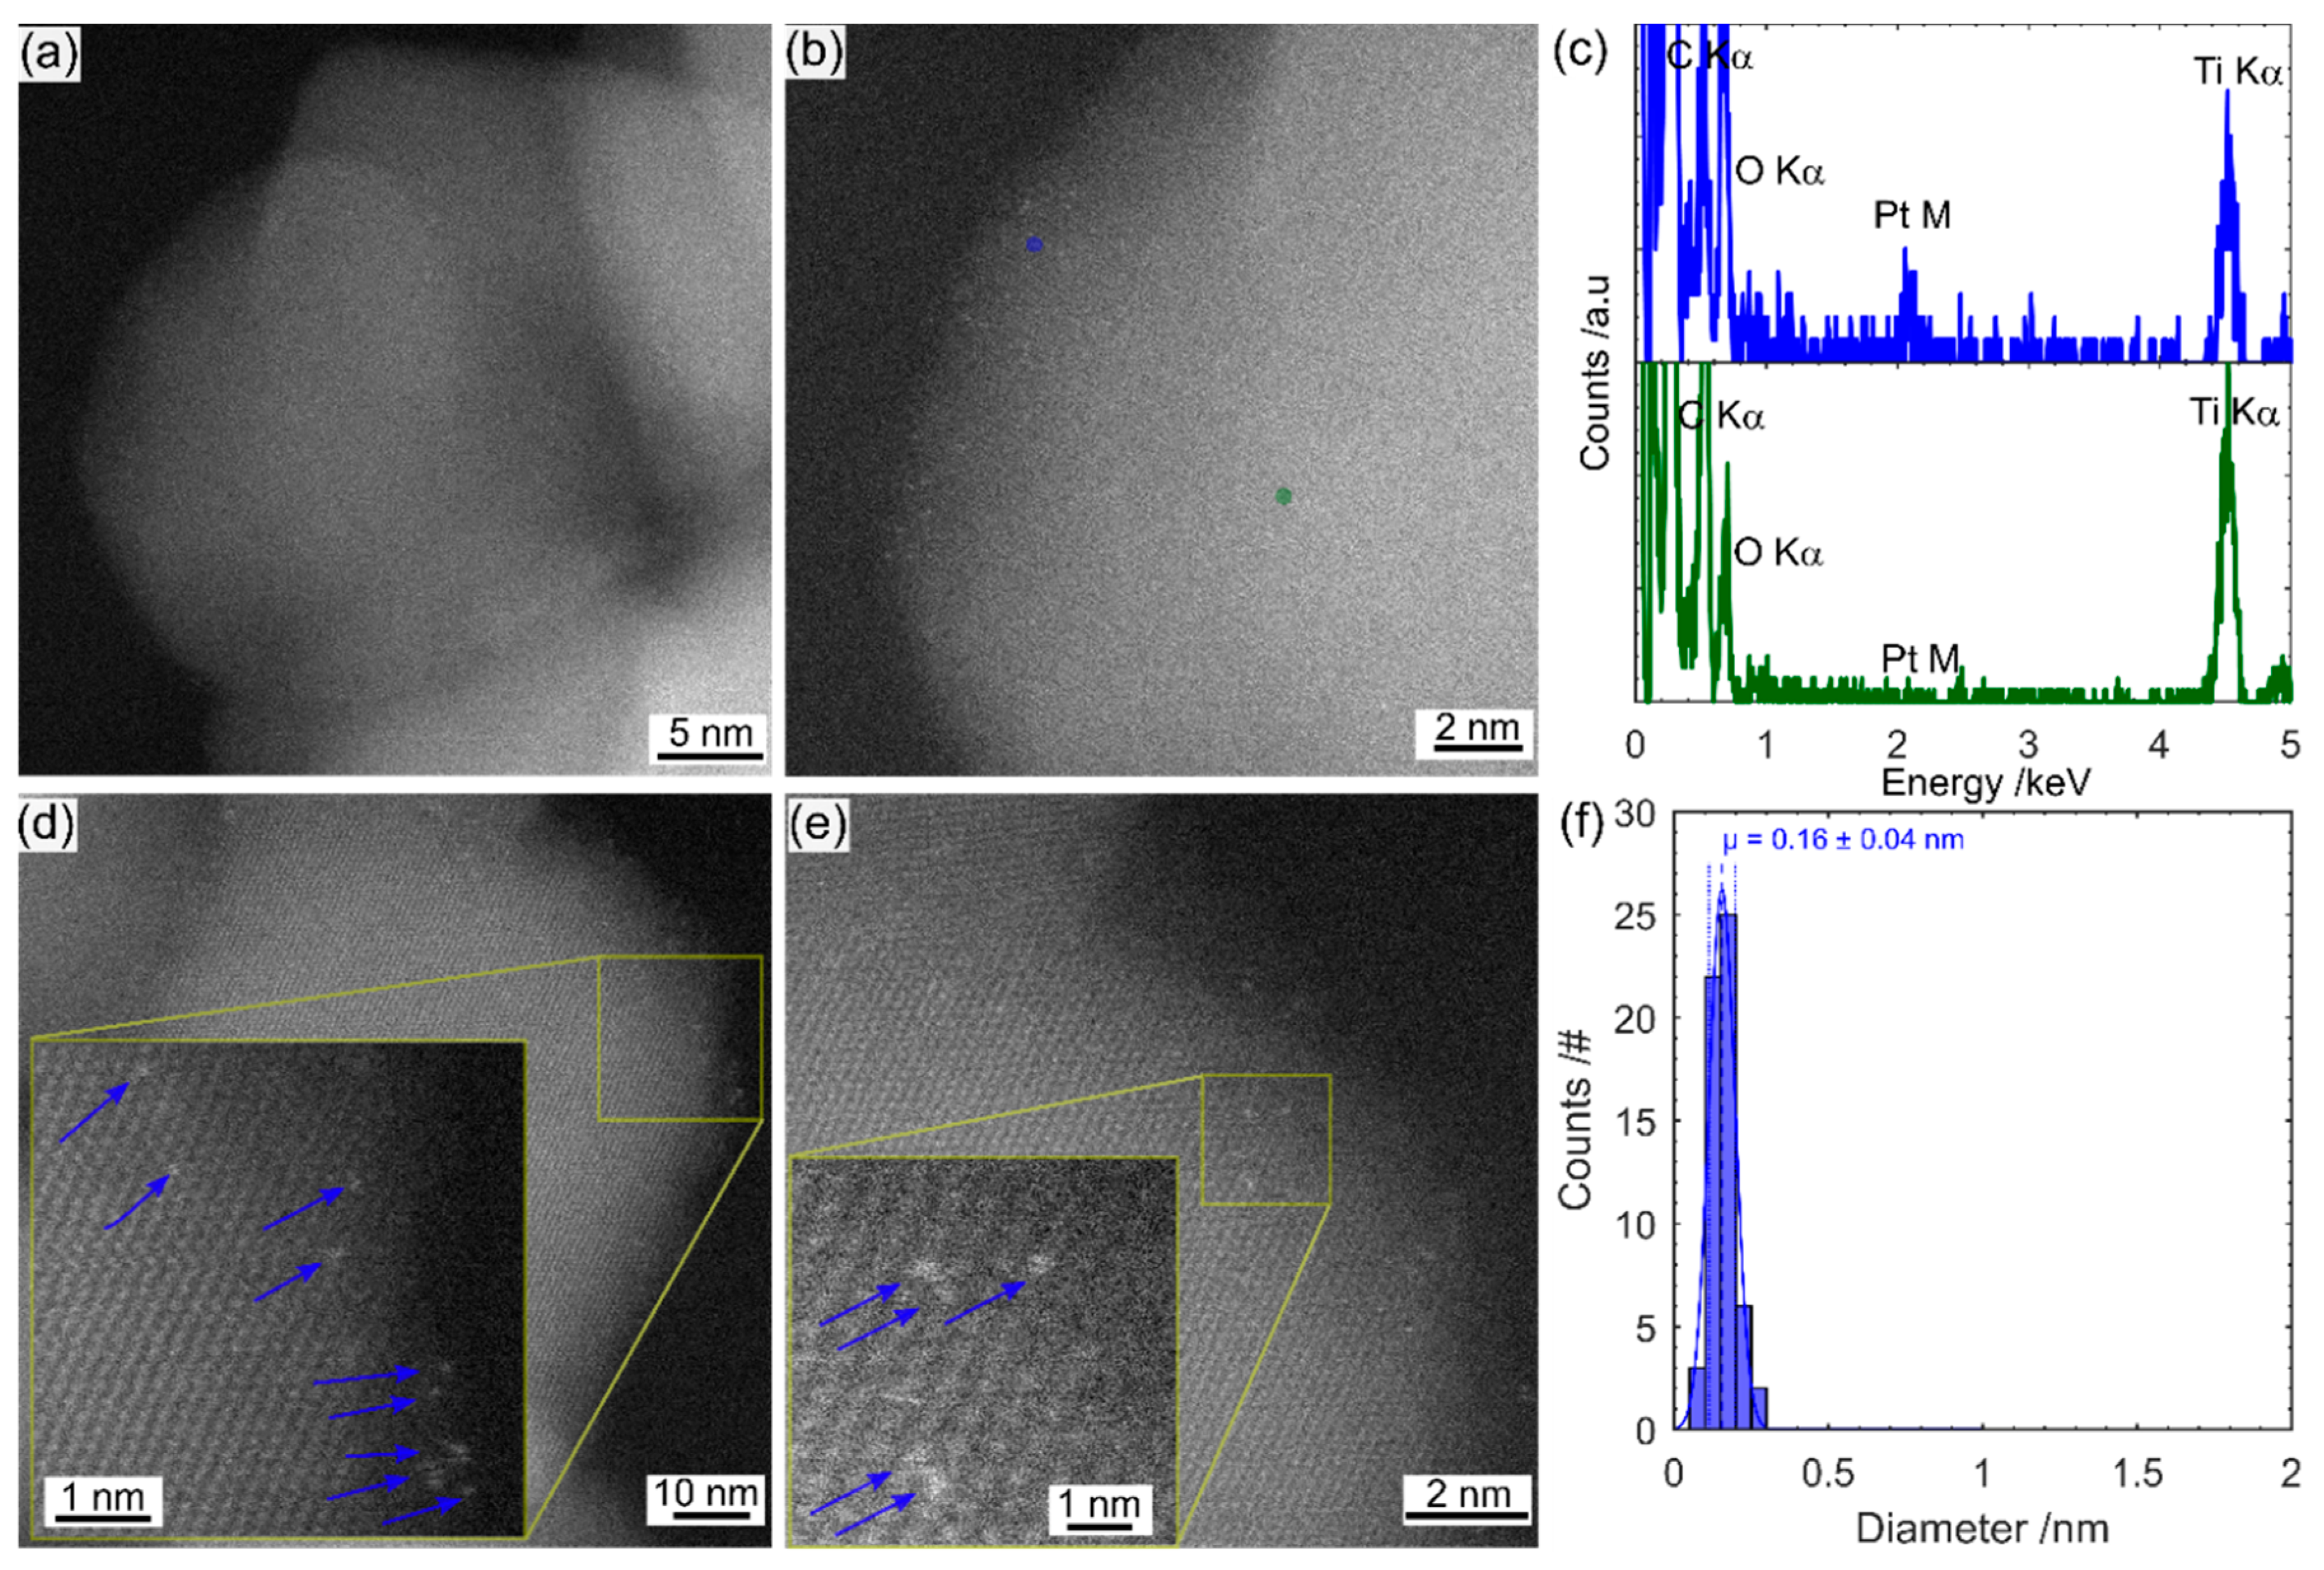
Scanning transmission electron microscopy (STEM) imaging and energy-dispersive X-ray spectroscopy (EDS) were performed on a FEI Titan Themis S/TEM instrument (Thermo Fisher Scientific, Waltham, MA, USA), operated at 200 keV. The STEM probe was aberration-corrected, enabling sub-angstrom spatial resolution, and high-angle annular dark field (HAADF) images were obtained with a collection angle greater than 50 mrad. The imaging technique is referred to as TEM in the manuscript for simplicity.
Scanning electron microscopy (SEM) and EDS were obtained using a FEI (USA) Quanta 450 SEM equipped with an Oxford Instruments (Abingdon, UK) EDAX detector.
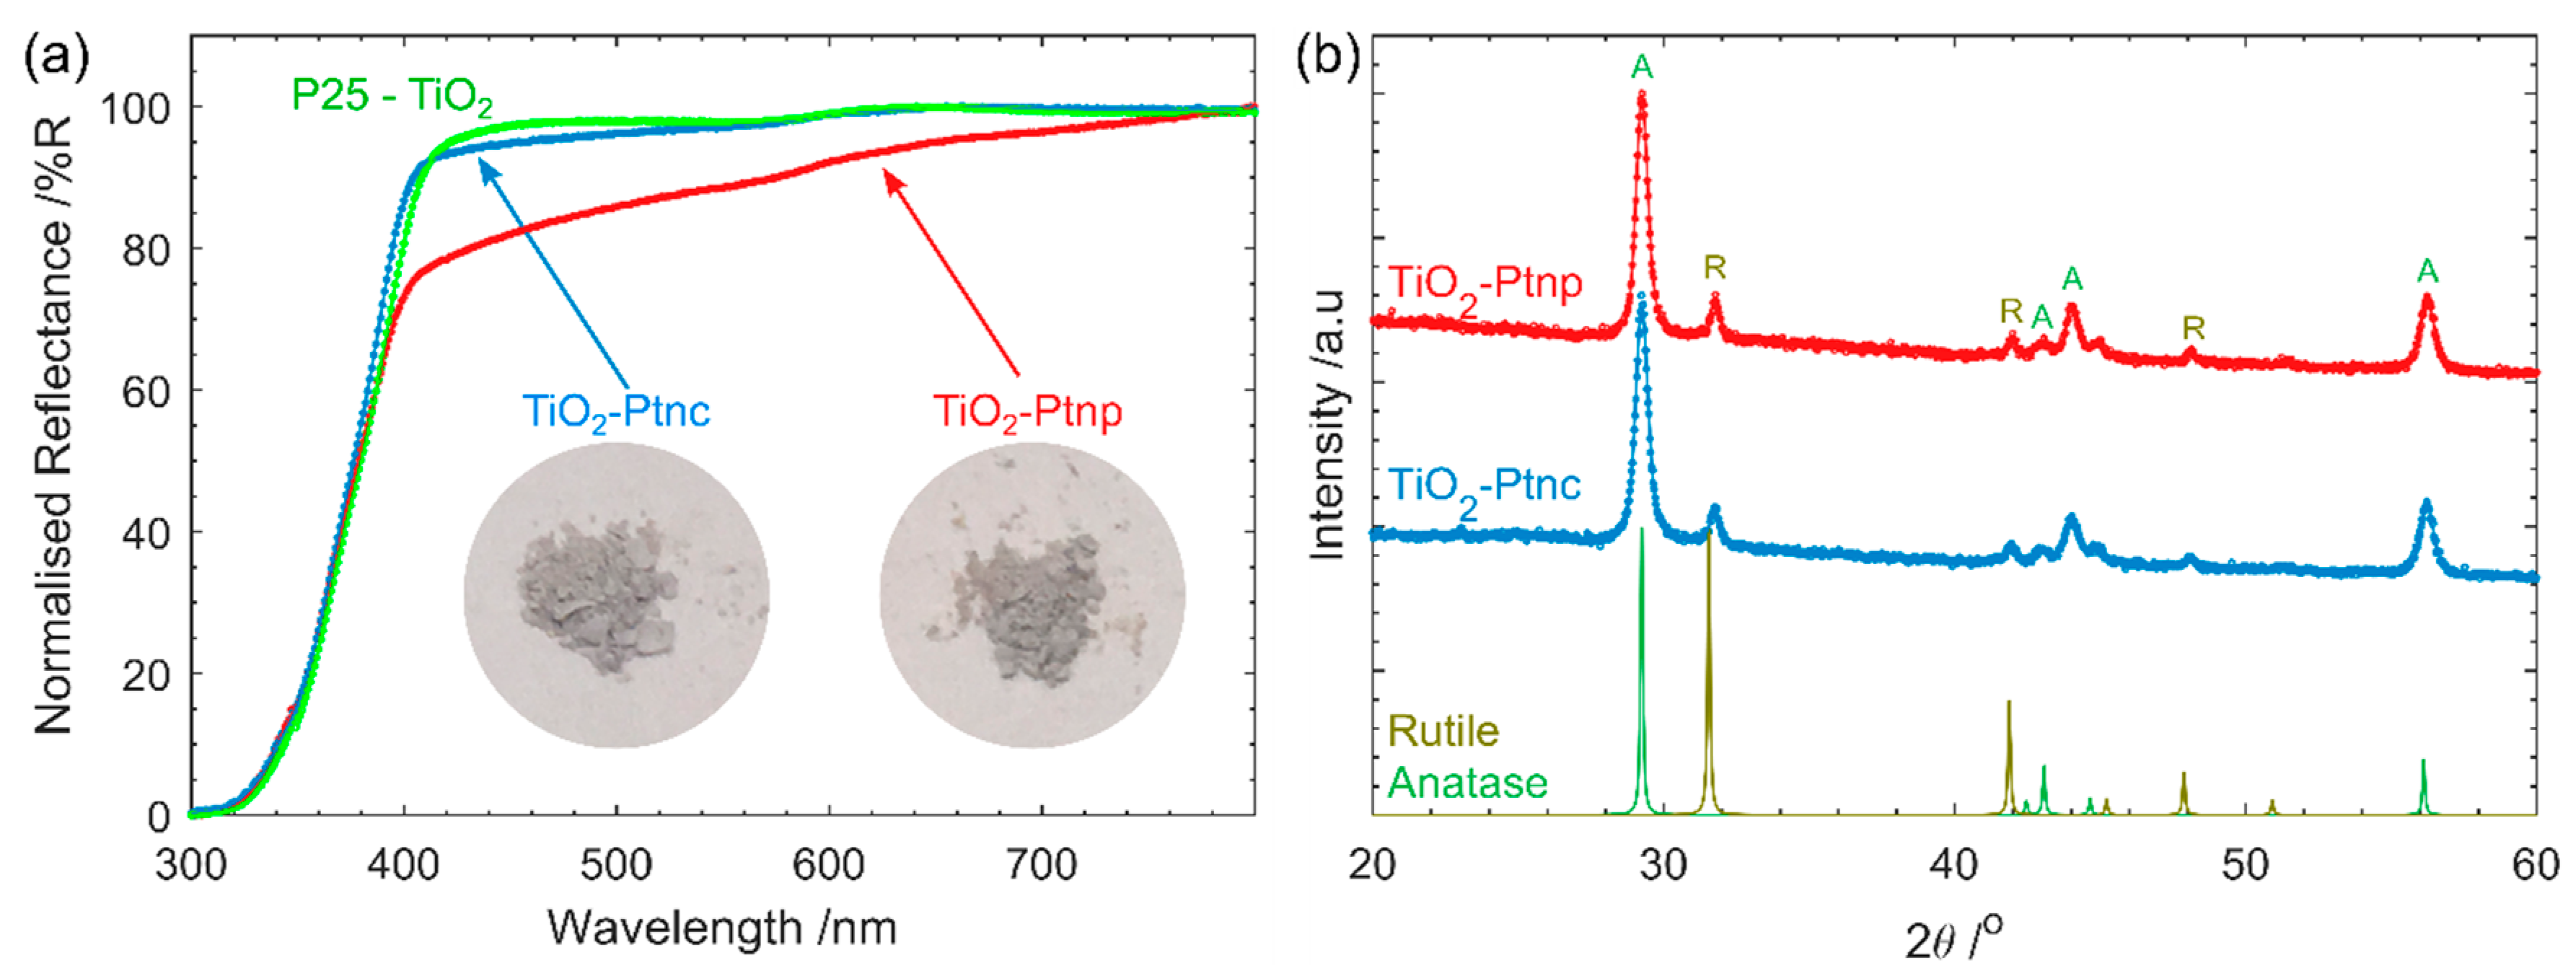
The UV-vis reflectance spectra were measured using a UV-Vis spectrophotometer (Cary 5000, Agilent, Santa Clara, CA, USA) with a Praying Mantis Sample Kit (DRP-SAP, Harrick Scientific products Inc., Pleasantville, NY, USA). The powdered samples were pressed with a spatula onto the sample holder.
X-ray diffraction (XRD) was obtained with Co irradiation (λ = 1.78896 nm) using a D4 Endeavor diffractometer (Bruker, Billerica, MA, USA). Data was obtained from 2theta 20–80 with step size of 0.02.
Attenuated total reflection Fourier transform infrared (ATR-FTIR, Perkin-Elmer) spectroscopy was obtained with a ZnSe crystal. Spectra were collected from 500–4000 cm−1 at 4 cm−1 step size with 8 accumulations. A background of air and clean crystal was used for each scan.
2.5. Photocatalysis
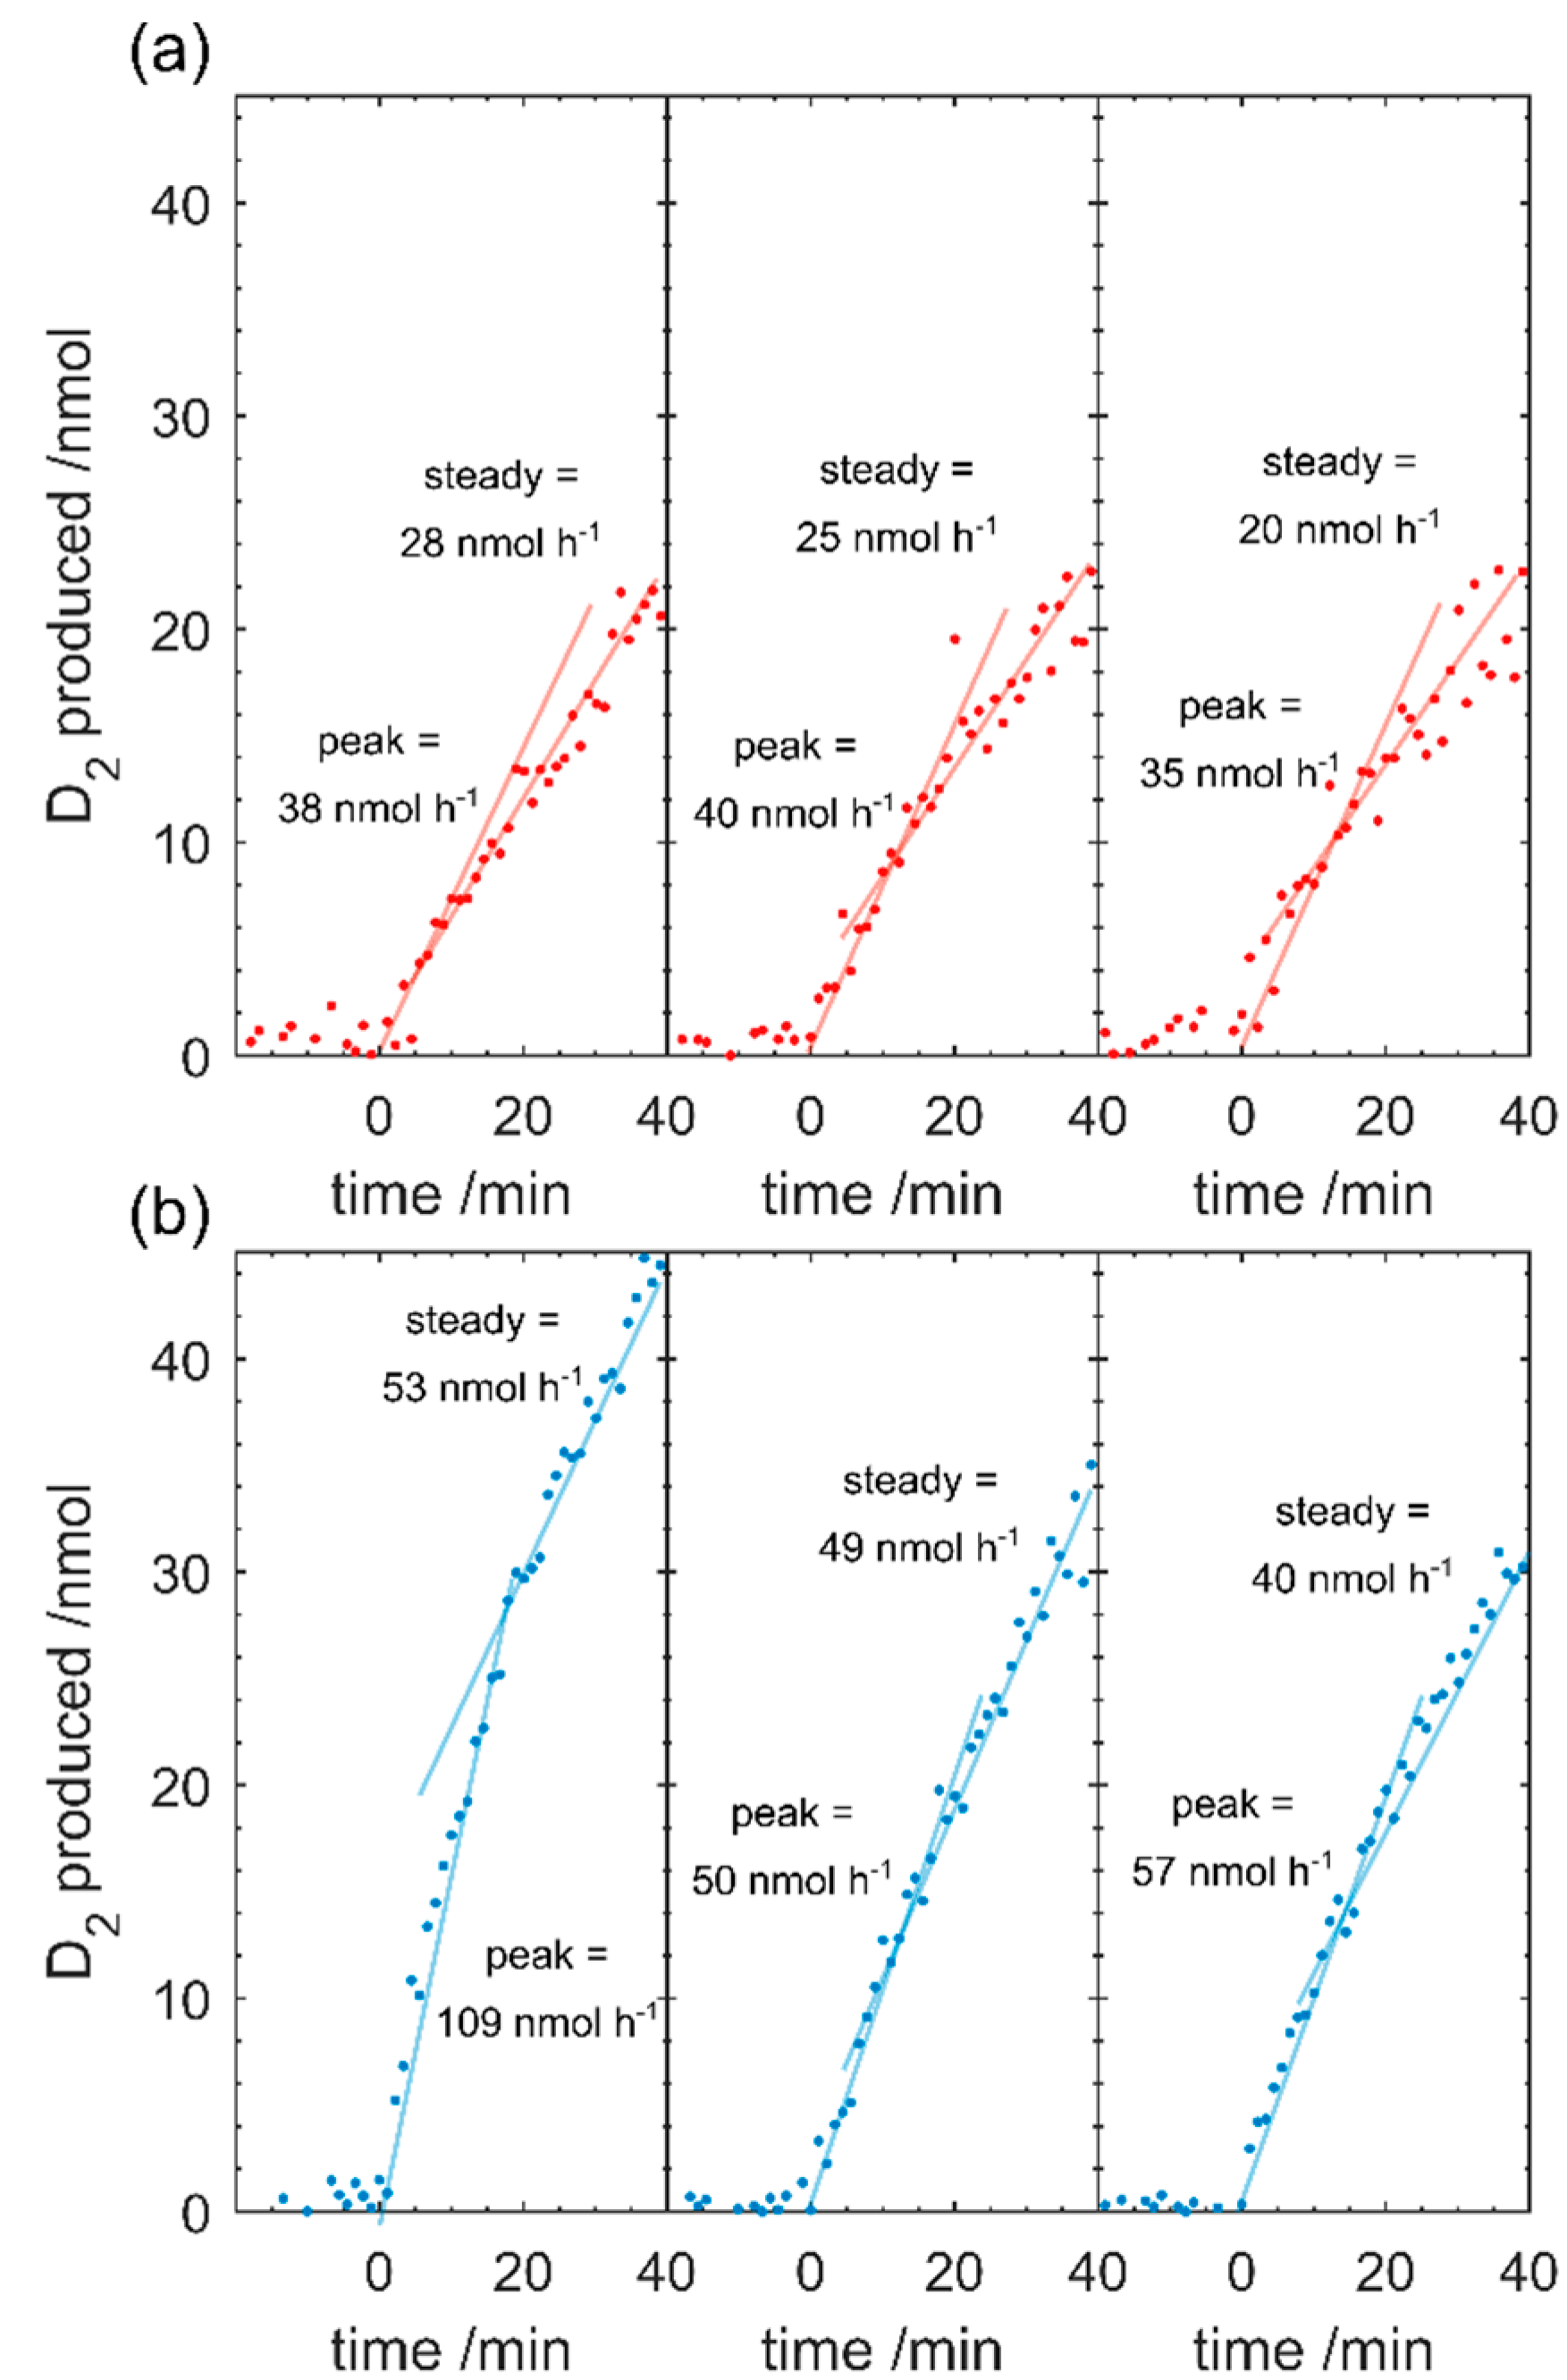
Photocatalytic D
2 evolution from heavy water (D
2O) was carried out in the gas phase using a batch reactor described in detail previously [
14]. D
2O was investigated to ensure products were not derived from sacrificial reagents or the catalyst itself. The general procedure for each experiment was to load the photocatalyst (on the microfibre disc) into the reaction cell, and evacuate to high vacuum under heating to 150 °C for 1 h before isolating the cell from vacuum. The reaction was carried out at 150 °C, which we have found to reduce noise in the produced data. D
2O (heavy water, 99.9%, Cambridge Isotopes Laboratories Inc., Cambridge, MA, USA), with purity confirmed by ATR-FTIR (
Figure S1) [
15], is then introduced by opening a valve connecting the reaction cell with a small volume of D
2O in a gas tight glass bulb. Under these conditions, approximately 17 mbar of D
2O vapour enters the reaction cell (which has volume of 3.8 mL). The valve connecting the reaction cell to the D
2O is closed and the reaction cell is filled to 1000 mbar with nitrogen (99.999%, UHP, BOC, Adelaide, Australia).
The contents of the reaction cell are analysed by a residual gas analyser (RGA, RGA200, SRS Stanford Research System, Sunnyvale, CA, USA) and is delivered from the reaction cell gas via a pulse nozzle. The pulse nozzle is controlled via a LabView program with proportional–integral–derivative (PID) control to maintain a constant RGA pressure of 2 × 10⁻⁶ Torr. This correlates to a reaction cell pressure drop of ~0.5 mbar min−1. The RGA determines the relative pressure of constituents in the m/z range of 1–65 amu Q−1, with an entire scan occurring every 67 s.
The reaction cell constituents are monitored for at least 30 min in dark to obtain the background value before illuminating the sample with UV light-emitting diode (LED) light (368 nm, 20.2 mW·cm
−2, 17 cm above sample, Shenzhen UVET, UV50-S, China). The photocatalytic products are monitored for 30–60 min. The sample reaction cell is then evacuated for 30 min before the process is repeated 2 or more times with the same sample. The recorded values from the RGA are converted into moles produced from calibration procedures and is described in detail elsewhere [
14].
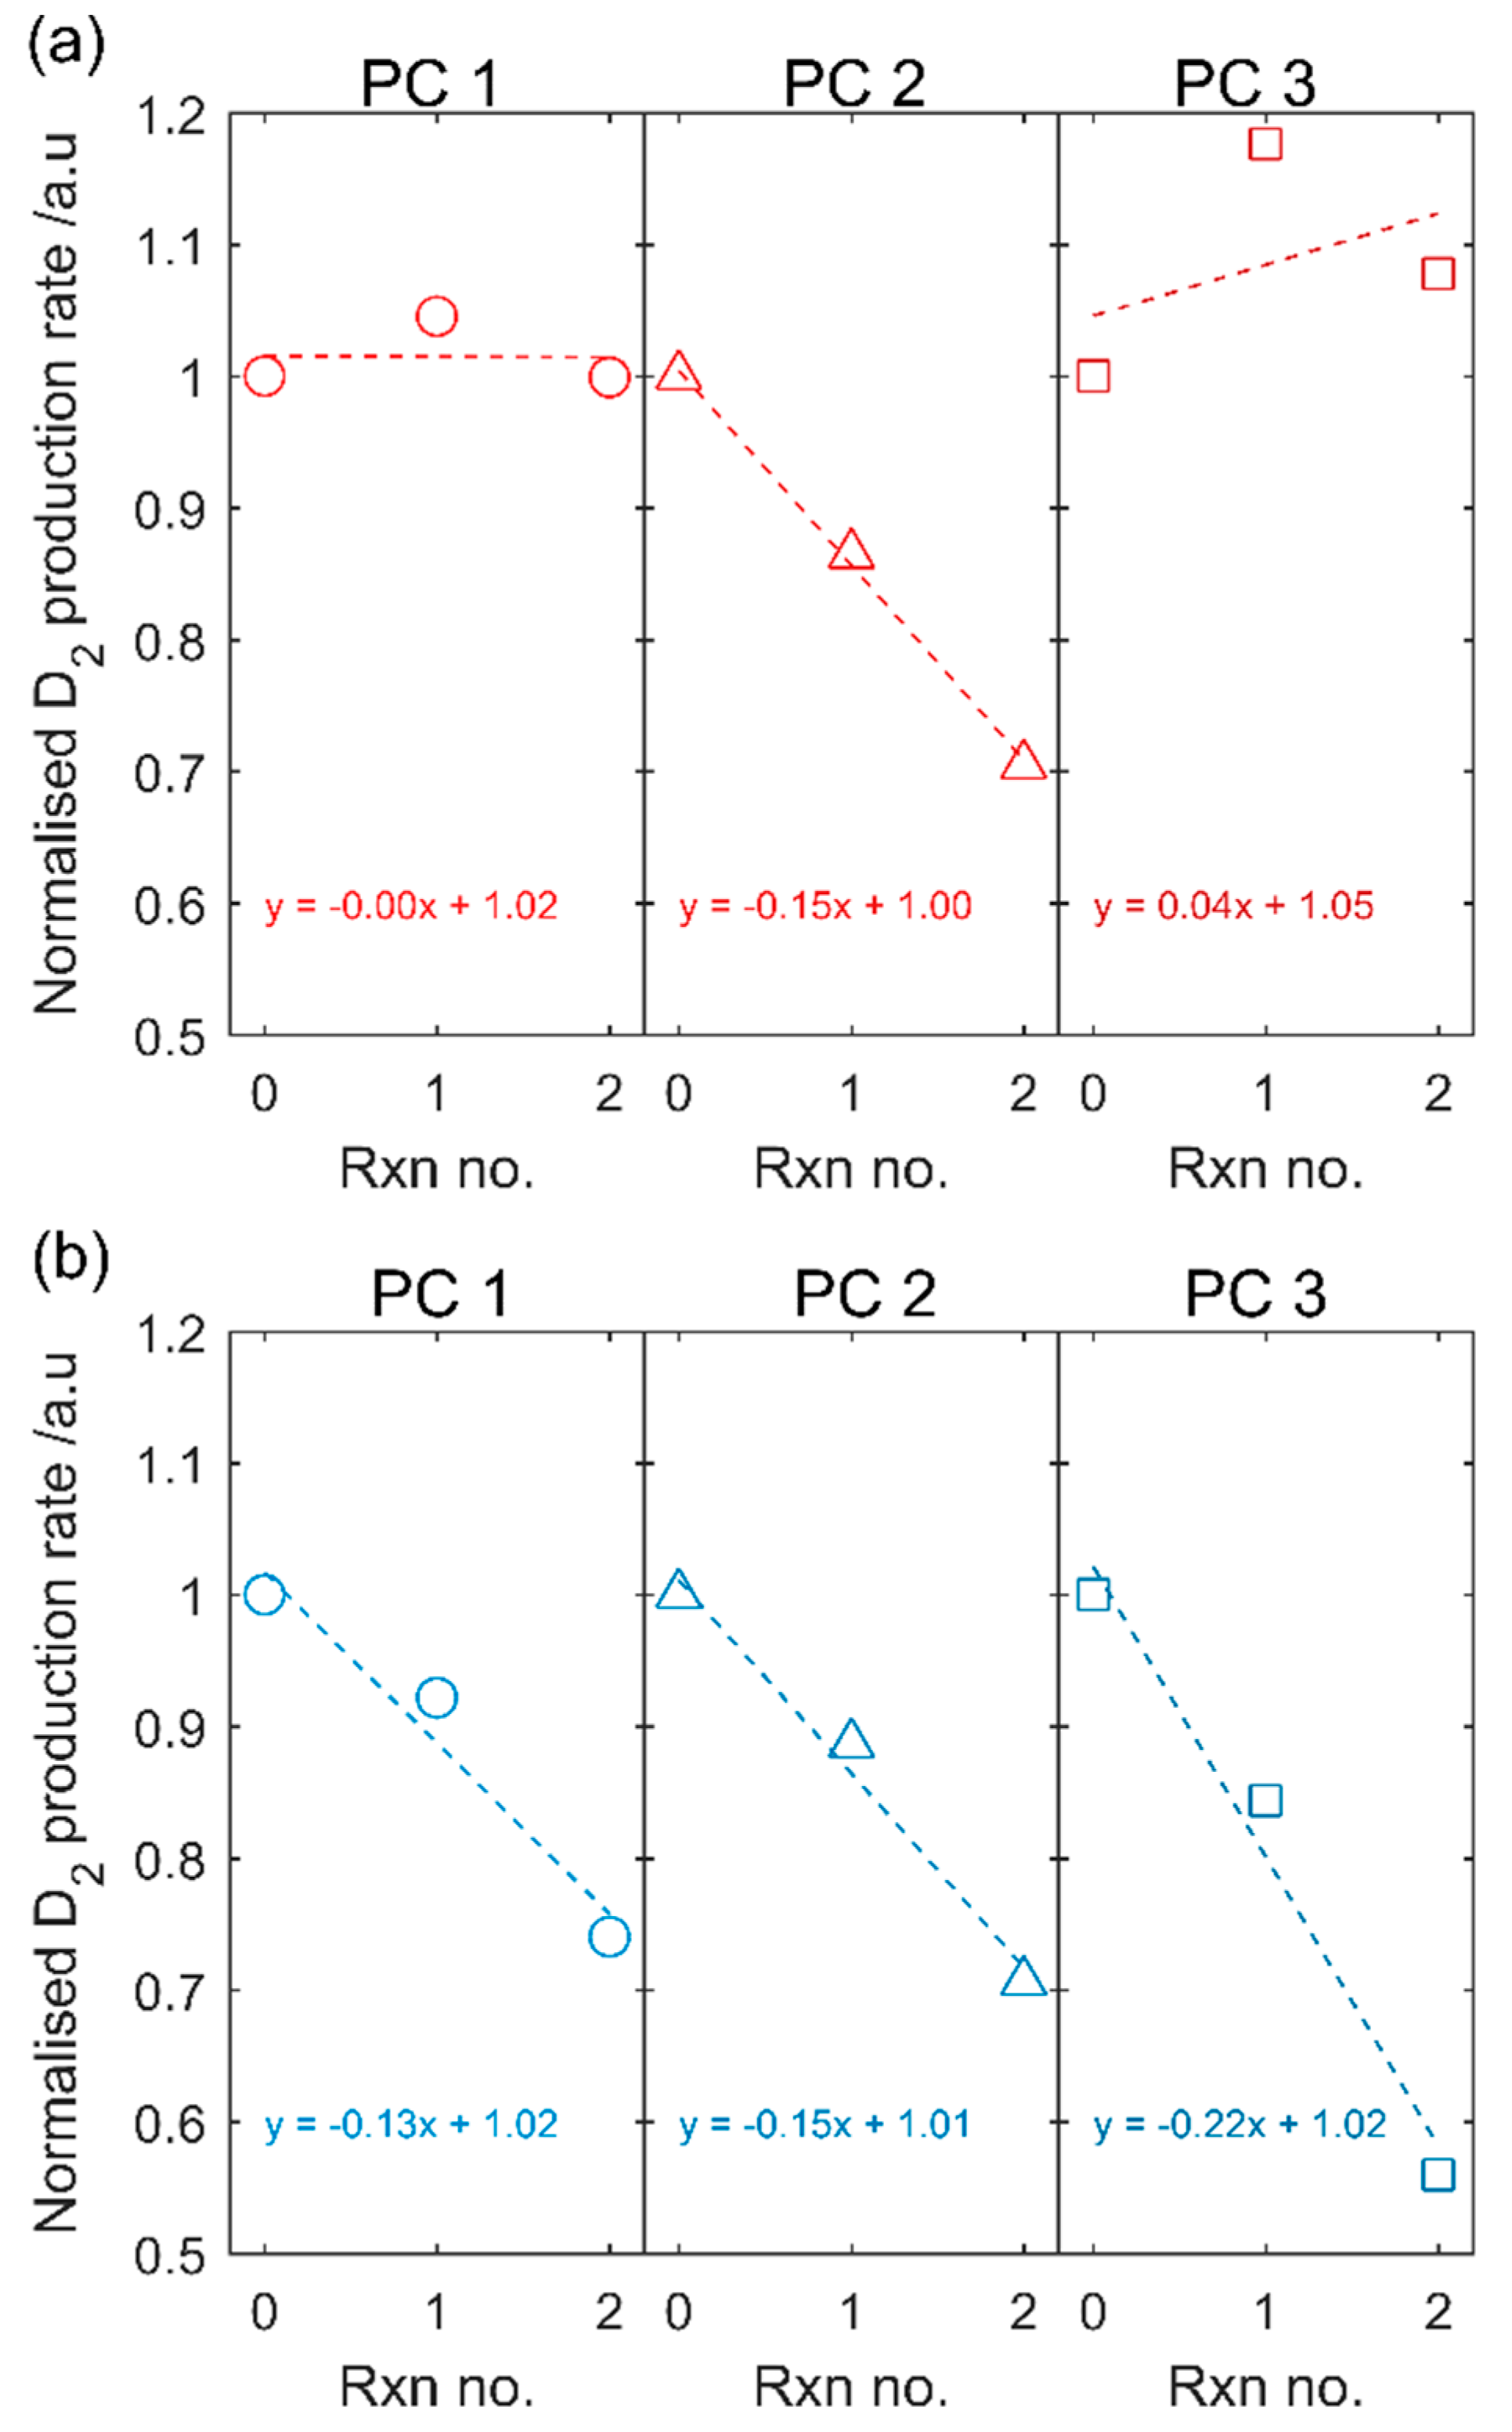
Statistical analysis of production rates were carried out using Matlab R2016b. The data are presented as box and whisker plots. On each box, the central mark indicates the median, and the bottom and top edges of the box indicate the 25th and 75th percentiles, respectively. The whiskers extend to the most extreme data points not considered outliers (Matlab documentation).
4. Discussion
The much simpler Pt impregnation method, using a commercially available Pt precursor solution has produced a much smaller size range of Pt on TiO2 than photodeposited Pt. The Pt-nc sample absorbs significantly less visible light and has not altered the TiO2 crystal structure. Photocatalysis results yield a higher D2 production rate for gas phase D2O splitting. Much like how P25 has become the benchmark photocatalyst, a reliable method to produce Pt co-catalysts has been required in the field. Pt clusters deposited using the method described here is an ideal candidate. Many of the advantages of P25 as a benchmark also apply to Pt clusters obtained from CELS Pt suspension. The material can be purchased worldwide, does not require further processing, and is deposited using only mixing and heat. In contrast, Pt photodeposition is completed from Pt precursors purchased from a range of sources, with varying purities. The Pt is then photodeposited in a solution containing one of many hole-scavengers with light of varying wavelength and intensity, with the end result of Pt with varying size and, therefore, co-catalyst ability.
A drawback observed is the reduced recyclability of the Pt-nc co-catalyst. The conditions used for the gas phase photocatalysis experiments are extreme for photocatalysis reactions and include a high vacuum and 150 °C. Optimisation of catalyst loading or photocatalysis experiments under milder conditions (e.g., T < 150 °C, visible light) may lead to higher recyclability of the Pt-nc co-catalysts.
An advantage to the Pt-nc co-catalyst that was not investigated is the reduced visible light absorption compared to Pt-nps. This advantage may prove to be an asset when assessing visible light active photocatalysts where parasitic light absorption by co-catalysts is often cited as a source of reduction in performance [
20,
21].


