Abstract
Microalgae is a promising next-generational energy. In this research, we focus on oil-extracted Botryococcus braunii residues collected by adding polysilicato-iron (PSI) as a flocculant followed by carbonization under argon atmosphere. We conducted carbonization at various temperatures as a first attempt to reveal the fundamental properties of the carbonization process of the microbes. The carbons thus obtained by heat treatment at 900 °C present a unique magnetic behavior due to reduced magnetite (Fe3O4) inclusion, which is produced from polysilicato iron (Fe2O3) during the heating process. Experimental results suggest that this carbonic material can be applied as a heavy metal-capturing carbon and magnetic porous substrate catalyst. The effective use of the waste may open a new avenue for an energy-microbiology-materials system.
1. Introduction
Biofuels have attracted remarkable attention as a sustainable energy source [1,2,3,4,5,6,7,8,9,10]. Recently, microalgae are considered as a technically and economically viable alternative energy resource having advantages such as: (1) perennial production capability; (2) appropriate land use and growth conditions; and (3) high oil content. Efforts have been made to select particular species, increase of scale of production, and technical improvement of production [11,12,13]. Botryococcus braunii (B. braunii), a hydrocarbon producing microalga, is expected to be a promising material for the next-generation energy source due to its exceedingly high oil productivity.
An outdoor mass cultivation system of B. braunii has been operated in Algae Biomass and Energy System R&D Center (ABES), University of Tsukuba since a successful achievement of a fundamental outdoor culture system of B. braunii by Shimamura et al [14]. Effective oil production and applications of the extracted oil need further study [15,16,17,18]. The number of reports of these improvements is increasing year by year in applications. However, few studies have paid attention on the biomass residues of B. braunii after oil extraction. Not only in the case of B. braunii, but in other species of algae as well, investigation of biomass residue is in little progress. After achievement of mass production of oil from biomass at industrial levels, wastes from the process need effective treatment or utilization.
Previously, several reports suggest that oil-extracted residue from B. braunii has great potential to be exploited as fertilizer and feed, or as solid fuel [19,20,21]. Extracted biomass residues are treated with polysilicato-iron (PSI: (SiO2)n·Fe2O3) as a flocculant. The biomass residue contains iron-based materials after the final process. Components such as silicon or iron in residue biomass are unignorable factors [22]. At the present stage, no results have been reported on carbonized samples of B. braunii residues treated with flocculant.
Here, we report on before and after-carbonization of biomass residue of B. braunii treated with polysilicato-iron solution. This study aims to evaluate the carbonization process and applications of carbonized B. braunii residues. Carbonization at different temperatures affords production of carbons with different physical properties. Infrared absorption spectroscopy measurements are carried out to evaluate process of the carbonization. Thermogravimetric (TG) analysis and scanning electron microscopy (SEM) measurements are carried out to reveal relationship between treatment temperature and formation of porous structures of the resultant carbons. Energy dispersive X-ray spectroscopy (EDS) and X-ray photoelectron spectroscopy (XPS) measurements are conducted to identify component of the samples. Magnetic character of the carbonized samples is evaluated with electron spin resonance (ESR) measurements. Magnetism is investigated with a superconducting quantum interference device (SQUID). 57Fe Mössbauer spectroscopy and X-ray diffraction (XRD) measurements are carried out. Mechanisms of the porous magnetic carbon material from the biomass, and possibility for future applications are discussed.
2. Results and Discussion
Carbonization at 900 °C in a gold furnace affords three kinds of product: (1) carbonized biomass residue of B. braunii, (2) organic oily material attached on the inside wall of the furnace tube, (3) metallic colored material with multilayer structure. These three materials were found in the different areas on the quartz dish and the tube in the instrument, as shown in Supplementary data (Figure S1). Volume of the B. braunii residue was reduced its size during the carbonization without breaking into fragments. Magnet attracts the carbons from the B. braunii residue thus obtained (See video in Supplementary data). The carbons show electrical conductivity.
2.1. Scanning Electron Microscopy (SEM)
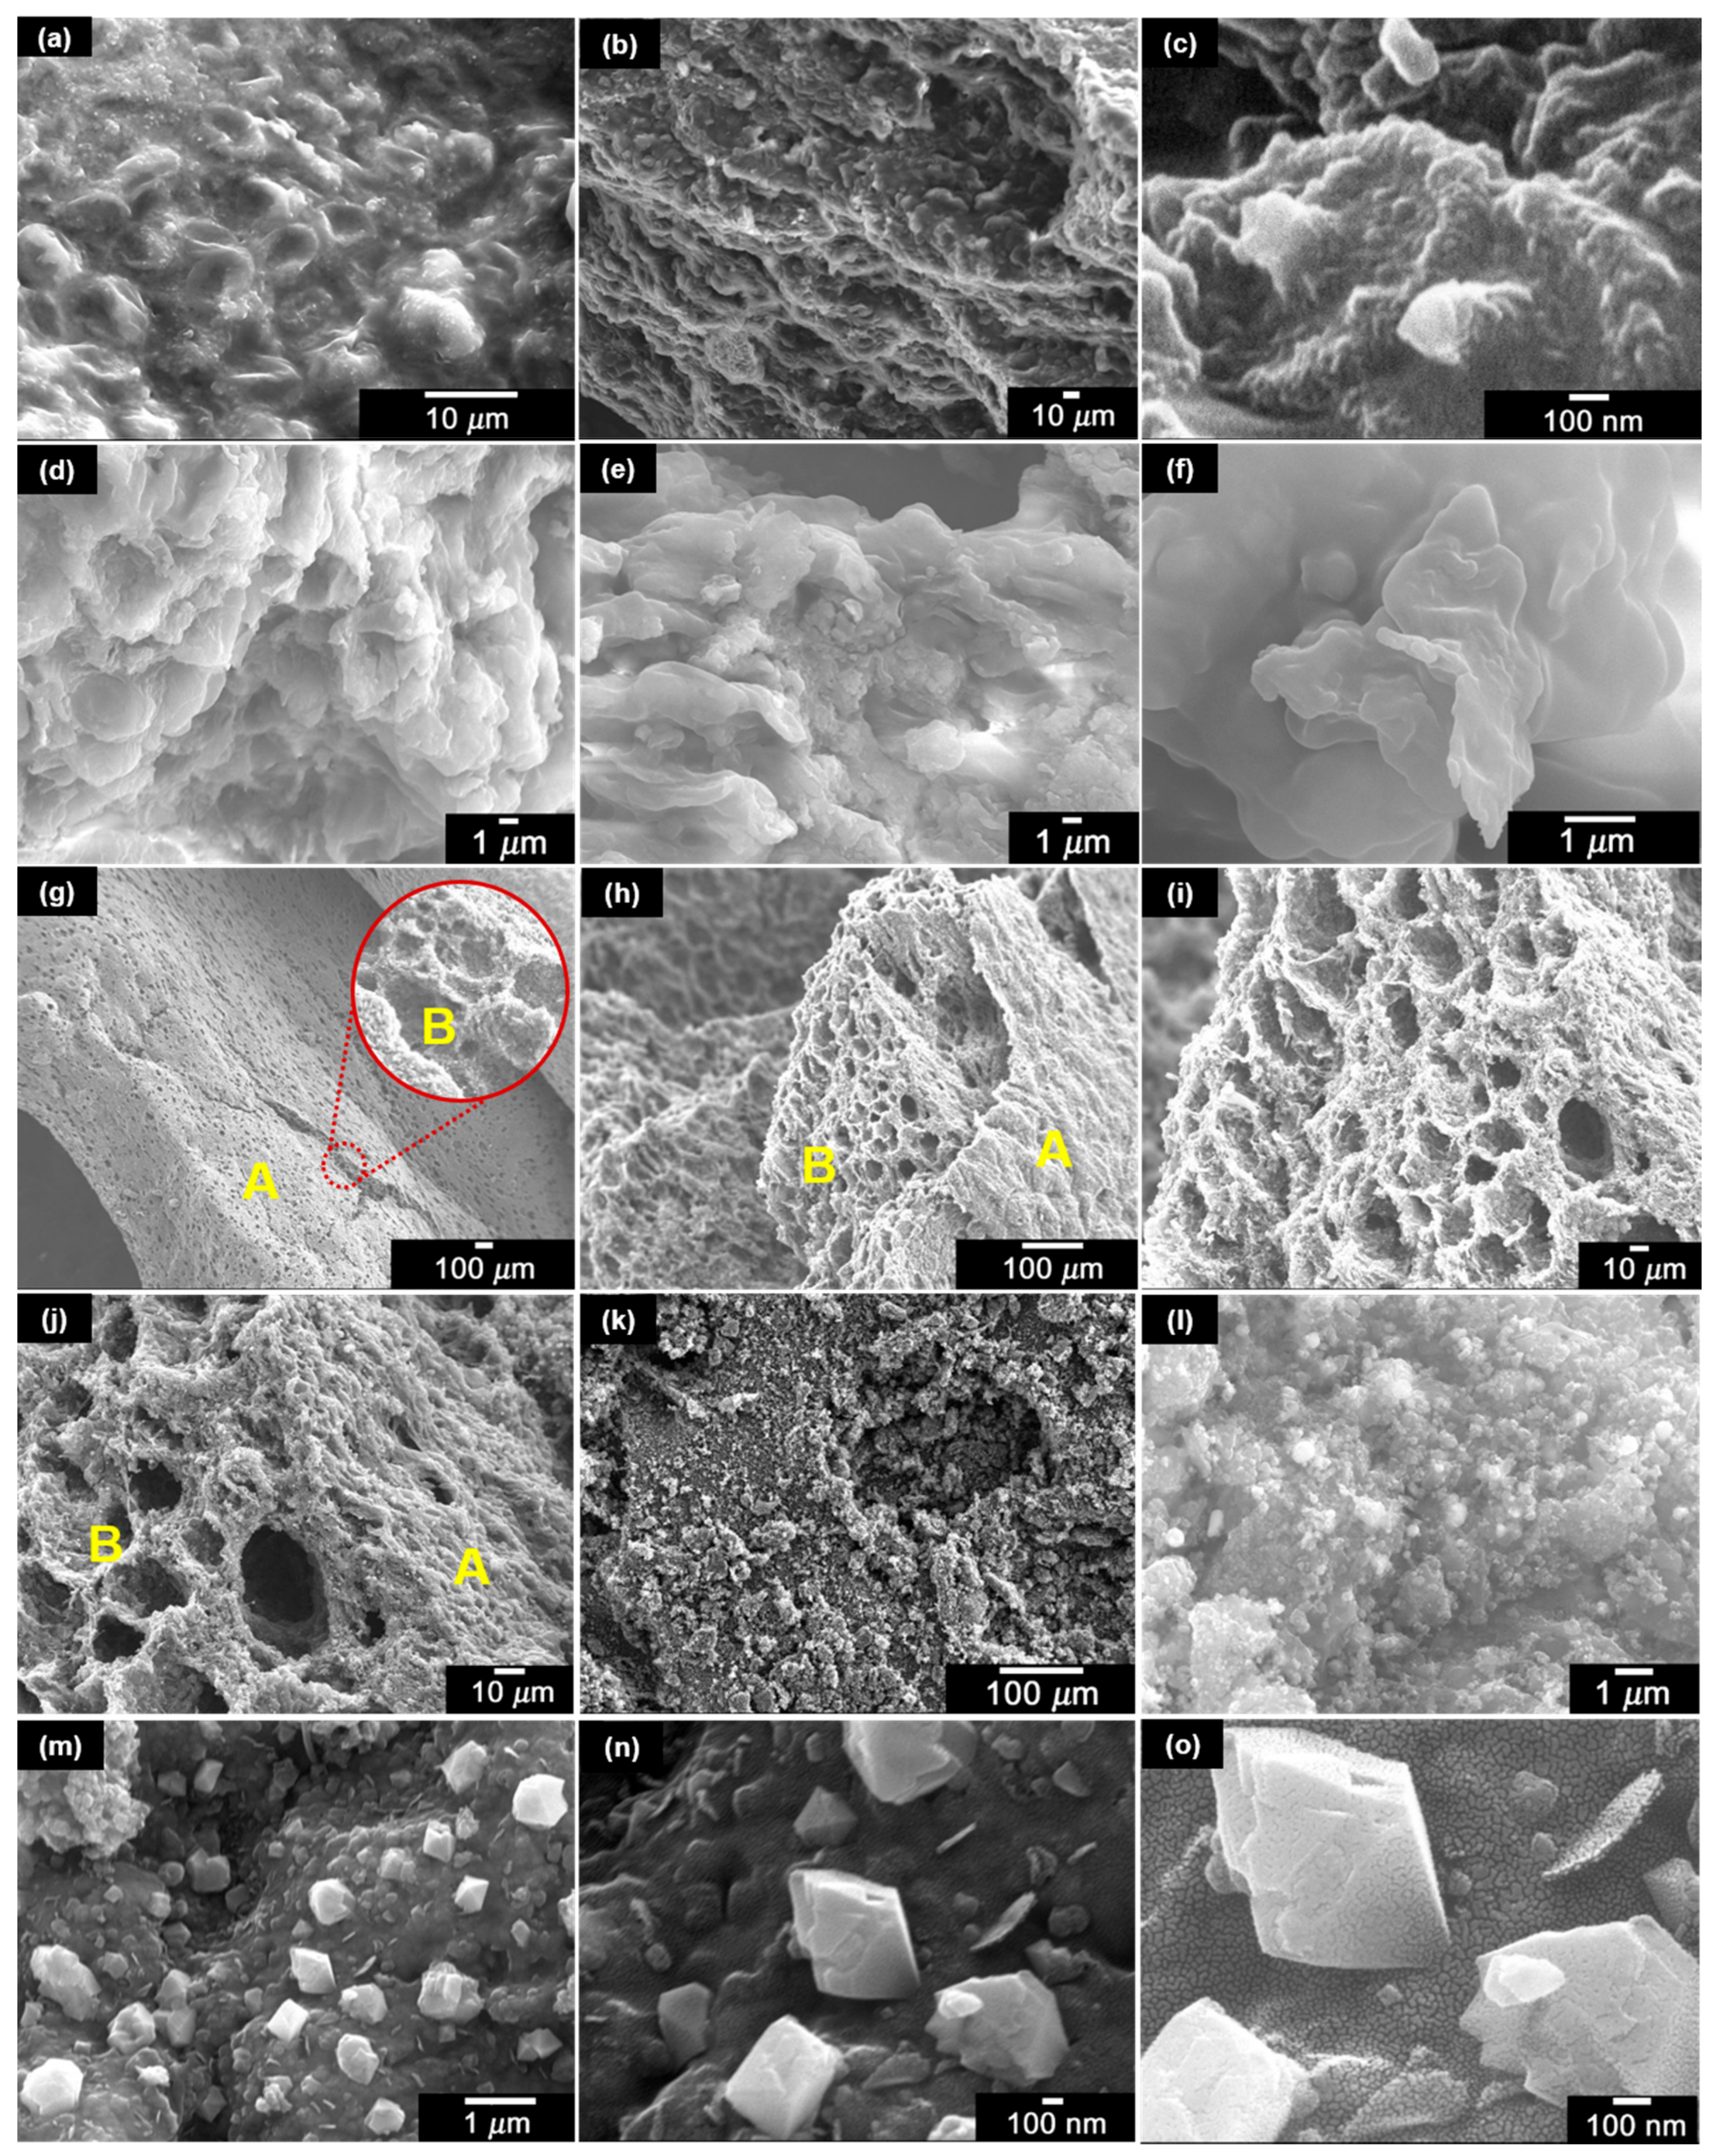
Surface of the B. braunii residues before and after carbonization (900 °C) was observed under the SEM at various magnifications. The B. braunii residues before carbonization containing moisture require vacuum drying before the SEM observations. Figure 1 shows surface images of these samples. Figure 1a–c shows the SEM images of B. braunii residues in bulk form. Round spores of diameter 7–8 μm, resembling a concave disk with a flattened center, can be found extensively on the surface (Figure 1a). Cross section image indicates that the B. braunii residues with the flocculate form a multilayer structure during the condensation process (Figure 1b). At a larger scale, some mushroom shaped structures with an elevated round margin are observed (Figure 1c). Figure 1d–f shows the SEM images of the B. braunii residues in a powder form. The powder sample was obtained by grinding the bulk sample in a mortar. Some pleated structures were partially observed on the surface; however, the shape of spores was destroyed by grinding. The samples before carbonization in bulk and powder form show no pores on the surface.
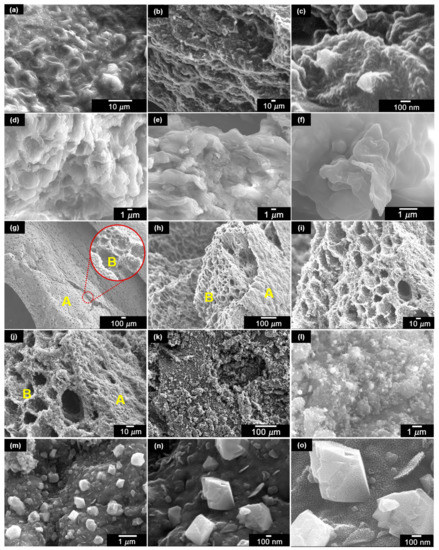
Figure 1.
Scanning electron microscopy (SEM) images of B. braunii residues before and after carbonization. (a–f) Samples before carbonization. In bulk form: (a) ×2000; (b) ×350; (c) ×85,000; in powder form: (d) ×4000; (e) ×4000; (f) ×15,000. (g–o) B. braunii residues carbonized at 900 °C. In bulk form: (g) ×37 (inset ×600); (h) ×130; (i) ×400; (j) ×650; in powder form: (k) ×180; (l) ×8000. Polygonal crystals: (m) ×15,000; (n) ×43,000; (o) ×80,000.
Figure 1g–j shows the SEM images of bulk B. braunii residues carbonized at 900 °C. A significant volumetric shrinkage occurred during the carbonization process. The carbonized B. braunii residues possess many small holes on the surface and inside of the sample, whereas the round shape spores before the carbonization disappeared. Obviously this porous structure was formed during the gas release process. The moisture inside of the spores was evaporated. The size of holes on surface (A) differs from that of inside (B), (Figure 1g,h,j). The average pore size in the inside is much larger than that of the spores. The pores on the surface are much smaller than the spore size.
Figure 1k–l is the SEM images of the carbonized B. braunii residues in the powder form. The grinding process before carbonization destroyed the multilayer structure, and no obvious pores were observed. Magnification reveals a large amount of polygonal crystals well imbedded in the sample. Some crystals are regular octahedrons with side length of 600 nm to 1 μm (Figure 1m–o). These crystals were not observed in the samples without carbonization.
2.2. Thermogravimetric (TG) Analysis and Relationship to Morphology
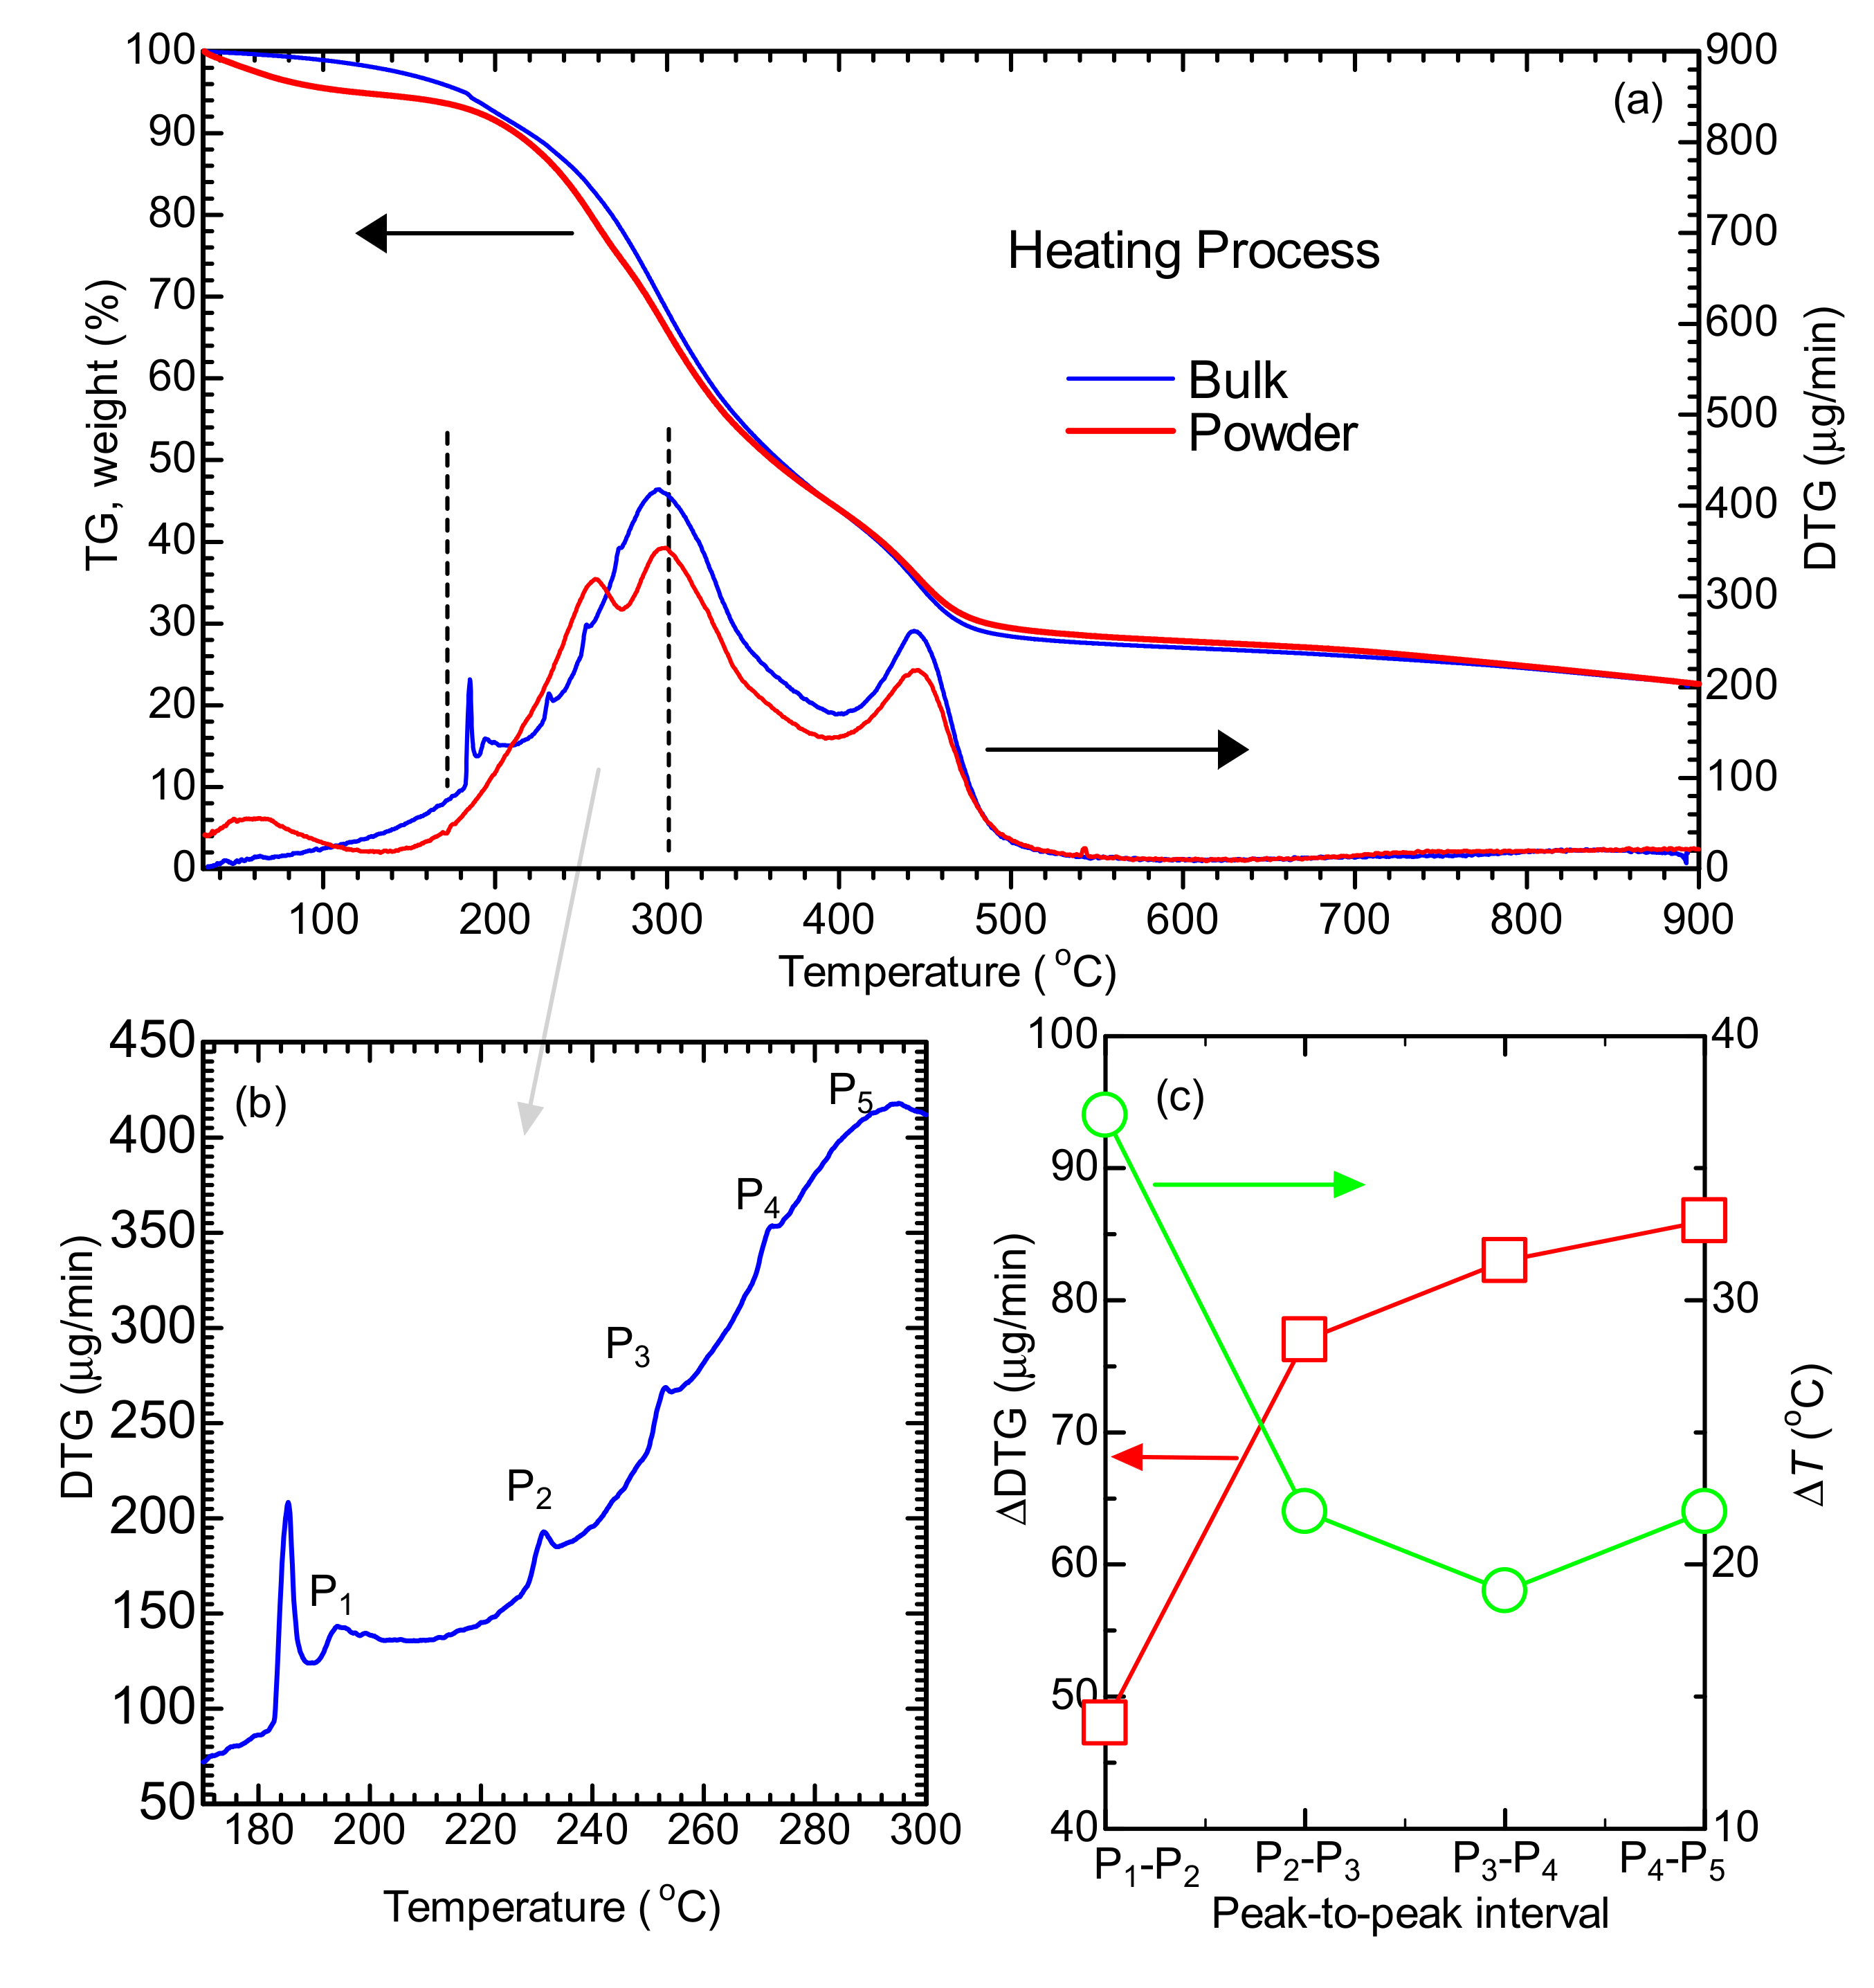
Figure 2 shows thermogravimetric (TG) analysis and differential thermogravimetry (DTG) results of the bulk and powder samples. Weight loss upon heating was measured both in the bulk and the powder form, Figure 2a. Similarities of the samples in the result are (1) decrease of 78% in their weight at 900 °C, (2) magnitude of slope of the curve becomes greater in the TG curves at 180 °C, (3) amount of weight loss is substantially equal at 400 °C. The DTG curves show intense signals for the bulk form at 295 °C and the powder form at 297 °C. Also, both samples show peaks at 445 °C.
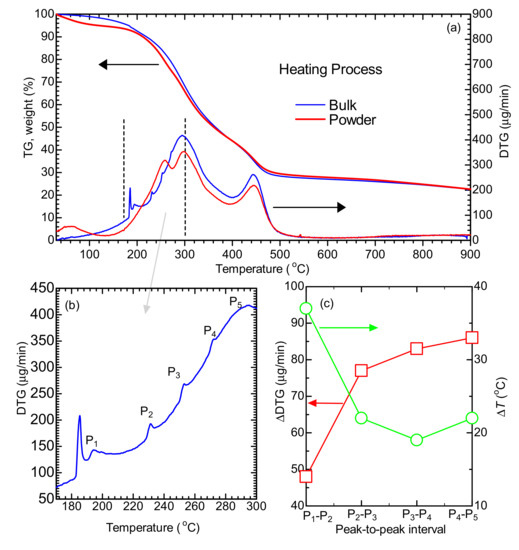
Figure 2.
Thermogravimetric (TG) analysis and differential thermogravimetry (DTG) analysis of B. braunii residues. (a) TG and DTG curves of the B. braunii residues in the heating process for bulk and powder form; (b) DTG result of the B. braunii residues of bulk form in the range of 170–300 °C; (c) ΔDTG and ΔT as a function of peak-to-peak interval obtained from Figure 2b.
The TG curves show that the powder sample loses its weight faster than that of the bulk sample at 400 °C or less. The DTG curve indicates out-gassing of the powder sample in which the moisture was evaporated below 100 °C, while two peaks appear at 257 and 297 °C, indicating two kinds of gases were released with a gradual volumetric shrinkage [19,20]. However, the bulk sample shows different character. First, a sharp peak appears at 180 °C, which is much higher than that of the first peak of the powder form at 100 °C. Then, a broad peak with maximum at 419 μg/min at 300 °C and a stepwise increase between 190 and 300 °C with four intervals appear, Figure 2b. These stepwise increases start from the first peak at 194 °C with the weight loss of 145 μg/min. ΔDTG value is decreased and ΔT value increased as a function of peak-to-peak intervals, Figure 2c. These signals in the DTG imply that the sample consists of periodic layer structure.
Gases inside are gradually released with increase of temperature in both bulk and powder form. Heat propagates concentrically from outside to inside of the sample. Absorption of heat leads emission of gases from the sample. Samples in the powder form release hydrogen gas at 700 °C, which is 100 °C lower than that of sample in the bulk form. Powder samples with large surface area quickly release the gases.
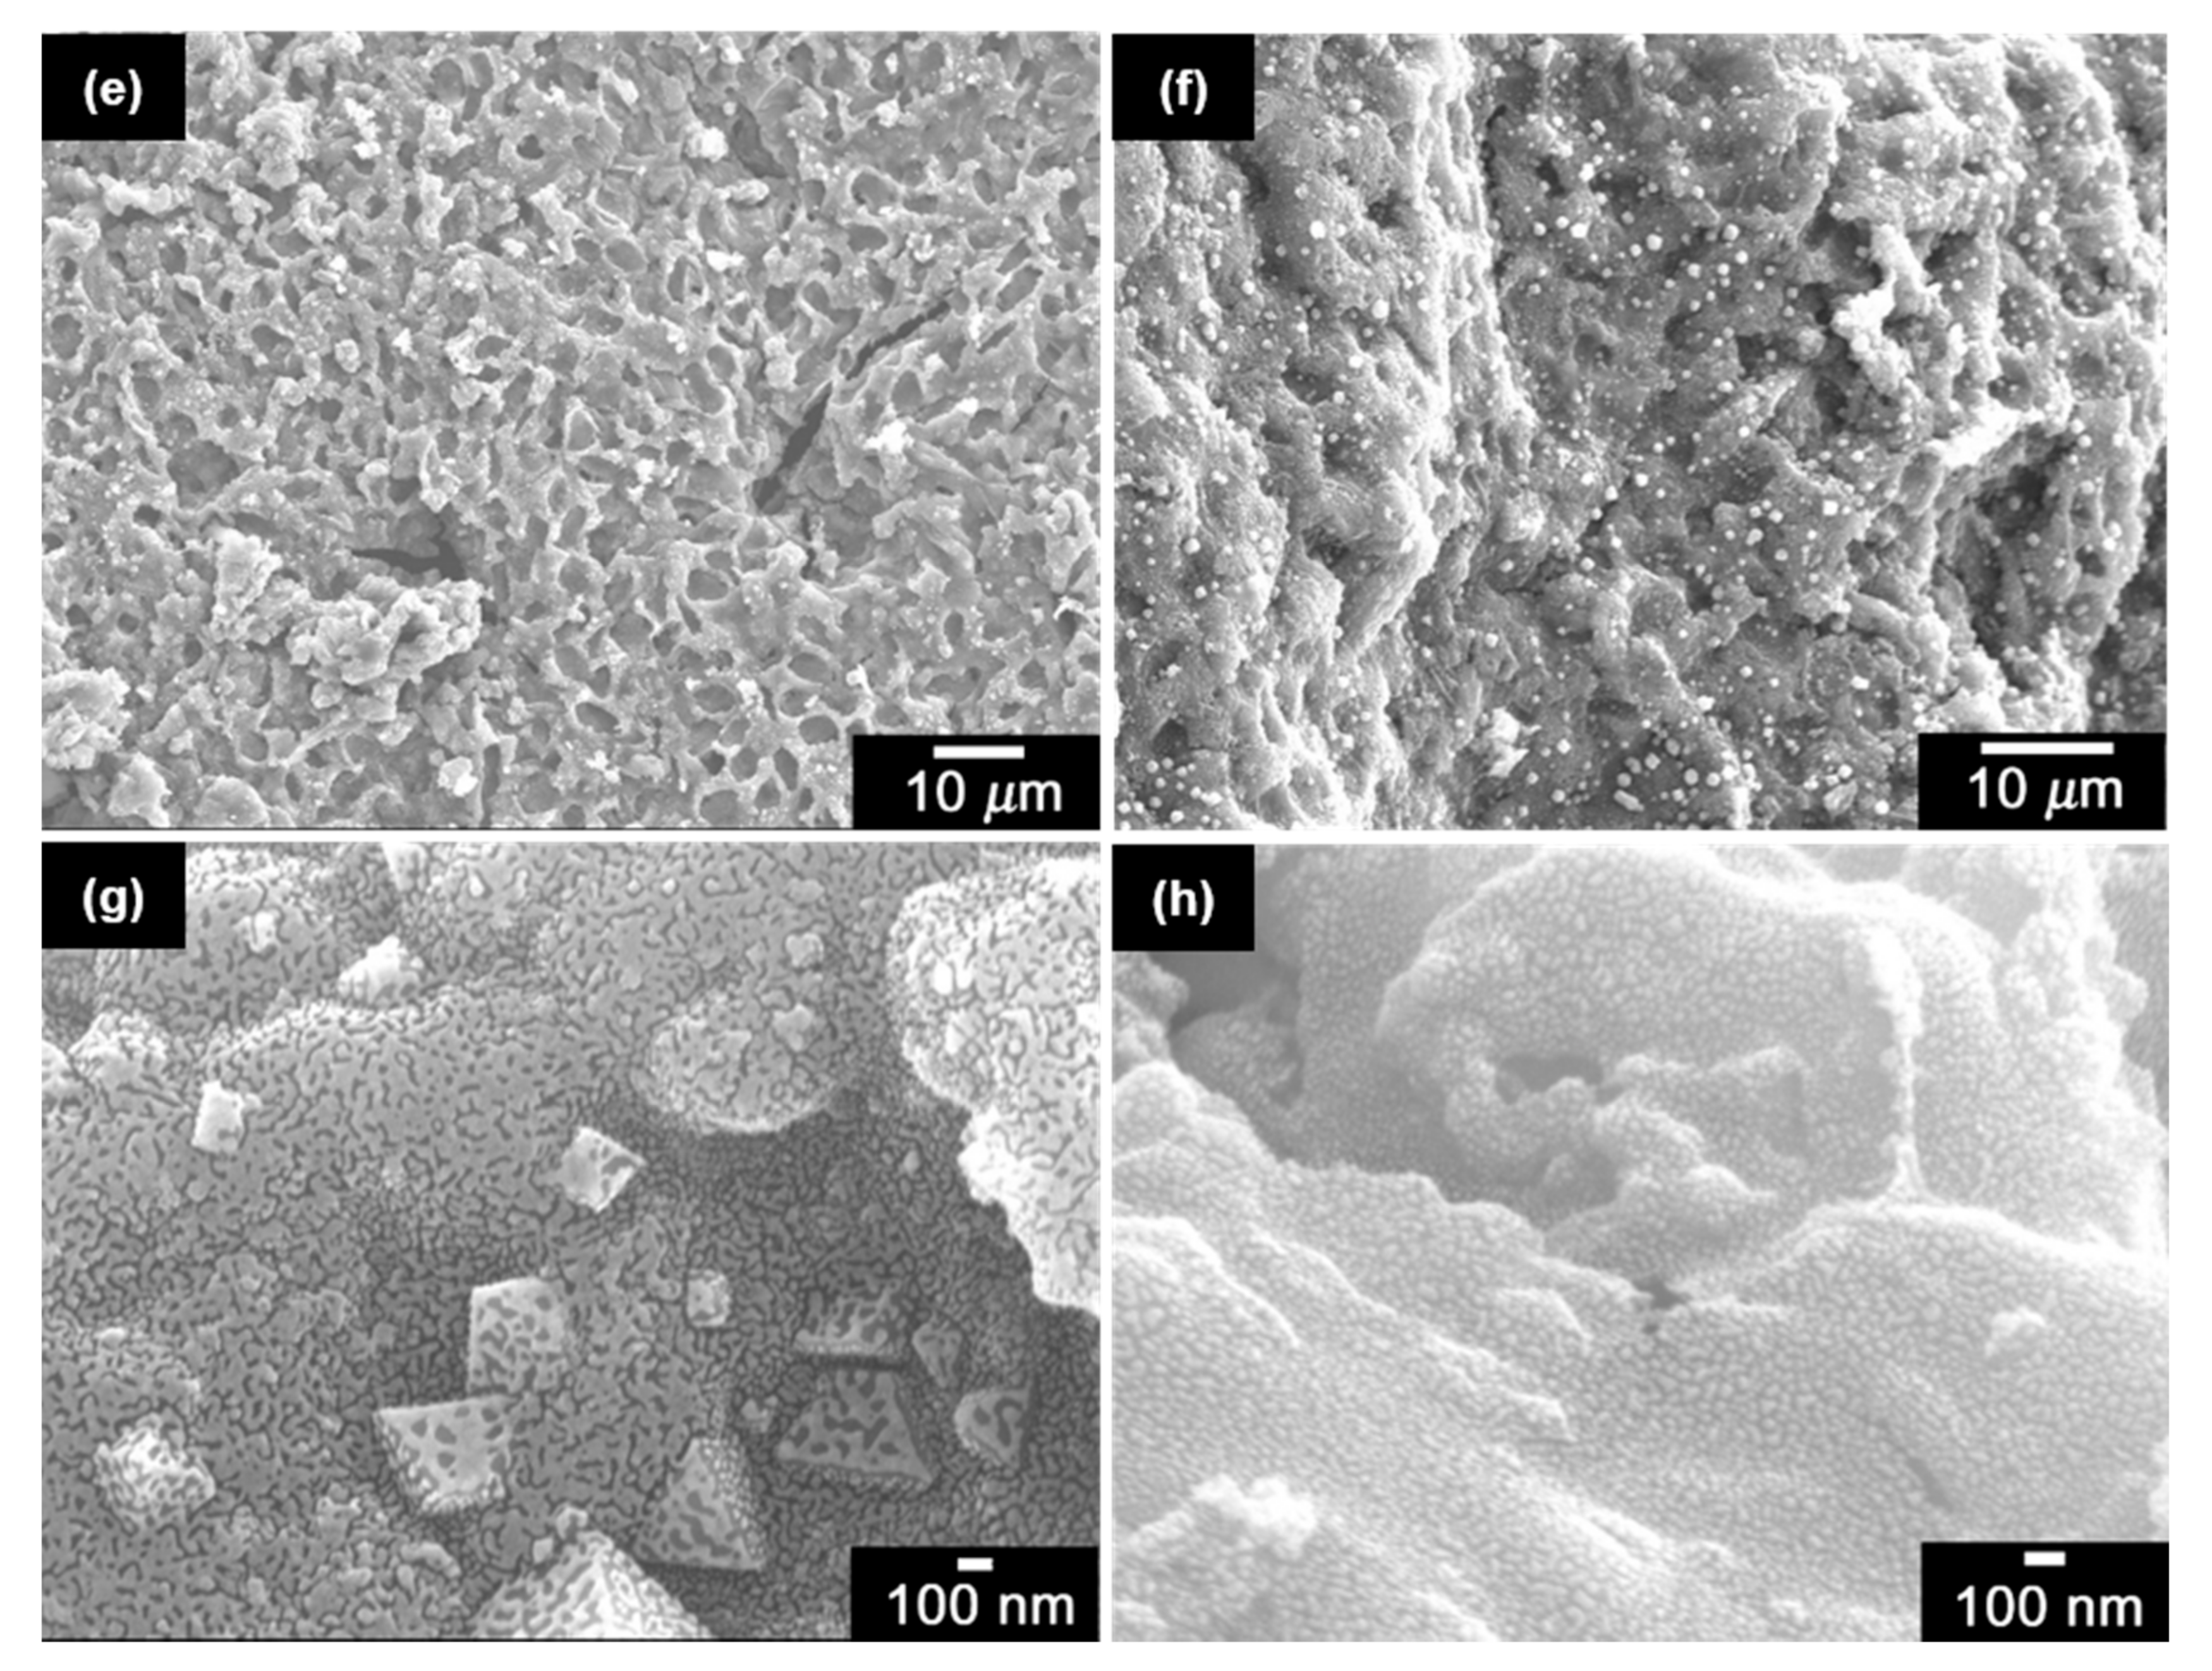
Figure 3 shows the SEM images of the B. braunii residues in the bulk form heated at different temperatures under argon atmosphere. The sharp DTG signal has not appeared at 176 °C, the characteristic round shaped spores can be observed on the surface of the B. braunii residues (Figure 3a).
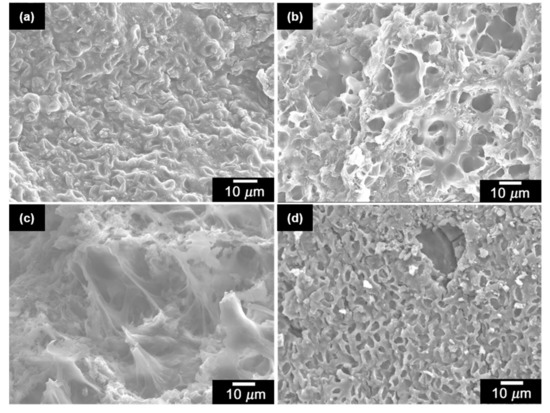

Figure 3.
Scanning electron microscopy (SEM) images of B. braunii residues carbonized at 176 °C (a); 205 °C (b); 350 °C (c); 550 °C (d); 700 °C (e); 900 °C (f); 700 °C (g); 700°C (h). (a–g) was carbonized under argon atmosphere; (h) was carbonized without argon flow.
In Figure 3b, holes are gradually generated partially on the surface and inside of the bulk form at 205 °C, which proves an assumption that the DTG peak at 180 °C is derived from rupture of the round spores. Analogously, four DTG peaks between 190 and 300 °C are also due to the rupture of the spores inside of the bulk sample. At 350 °C, weight loss is to be ca. 50%. This structure observed with the SEM implies that silicon dioxide in the sample provides viscosity, and has a role of ‘glue’ in the sample (Figure 3c).
In Figure 3d, the surface possesses uniformly distributed many cave-ins, and no spores. These elliptical holes resemble to the shape of spores observed in Figure 3a. Average of the major axis length is to be 5 μm (calculated from 50 entries). Decrease of 37% compared with the major axis length of the spores before carbonization was occurred. The subsequent heating afforded no further change to this basic morphology, only some small crystal-like structures appear on the surface (Figure 3e,f). Magnification reveals that these crystals are various sizes at 700 °C, as shown in Figure 3g. Most of them are regular octahedrons, and some crystals are partly imbedded on the sample, implying the grain growth is still in the process at 700 °C. The amount of crystals increased up to 900 °C (Figure 3f). It is worth noting that the appearance of the crystals is related with carbonization conditions. Figure 3h is the sample carbonized at 700 °C with no argon flow, in which no crystal-like structure could be observed.
2.3. Energy Dispersive X-ray Spectroscopy (EDS)
B. braunii residues before and after carbonization at 900 °C were analyzed by energy dispersive X-ray spectroscopy (EDS) to detect distribution of atomic components. The EDS measurement cannot detect hydrogen atom, and high-resolution image in magnifications is not expected. However, the qualitative observation can be performed at hundreds of nanometer depth inside of the material, and we can evaluate components inside of the material from the result. Relative increase of silicon and metal atoms (K, Mg, Fe) in the carbonized sample was observed, Figure 4. Iron atom ratio in the sample increases from 2.03 to 7.97 wt. % by carbonization, accompanied by decrease of light atoms such as carbon and oxygen. Discharge of large amount gases (CO, CO2, CH4) from the sample during the carbonization process results in decrease of the sample weight. Carbonization allows detection of sulfur in the sample. The mapping results indicate that iron atoms are uniformly dispersed on the samples in both before and after carbonizations. In the polygonal crystal, weight ratio of iron increased up to 42% after carbonization, indicating that these crystals can be iron oxide compounds. Irons were absorbed into the sample during the flocculating process from polysilicato-iron. Potassium and magnesium may be intrinsically derived from the rare B. braunii.
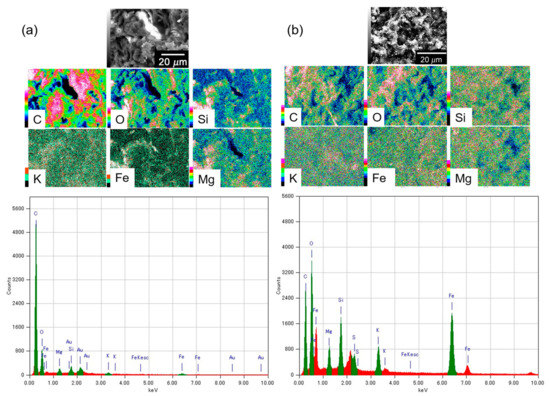
Figure 4.
Energy dispersive X-ray spectroscopy (EDS) analysis of B. braunii residues: (a) before carbonization; (b) carbonized at 900 °C.
2.4. Infrared Absorption (IR)
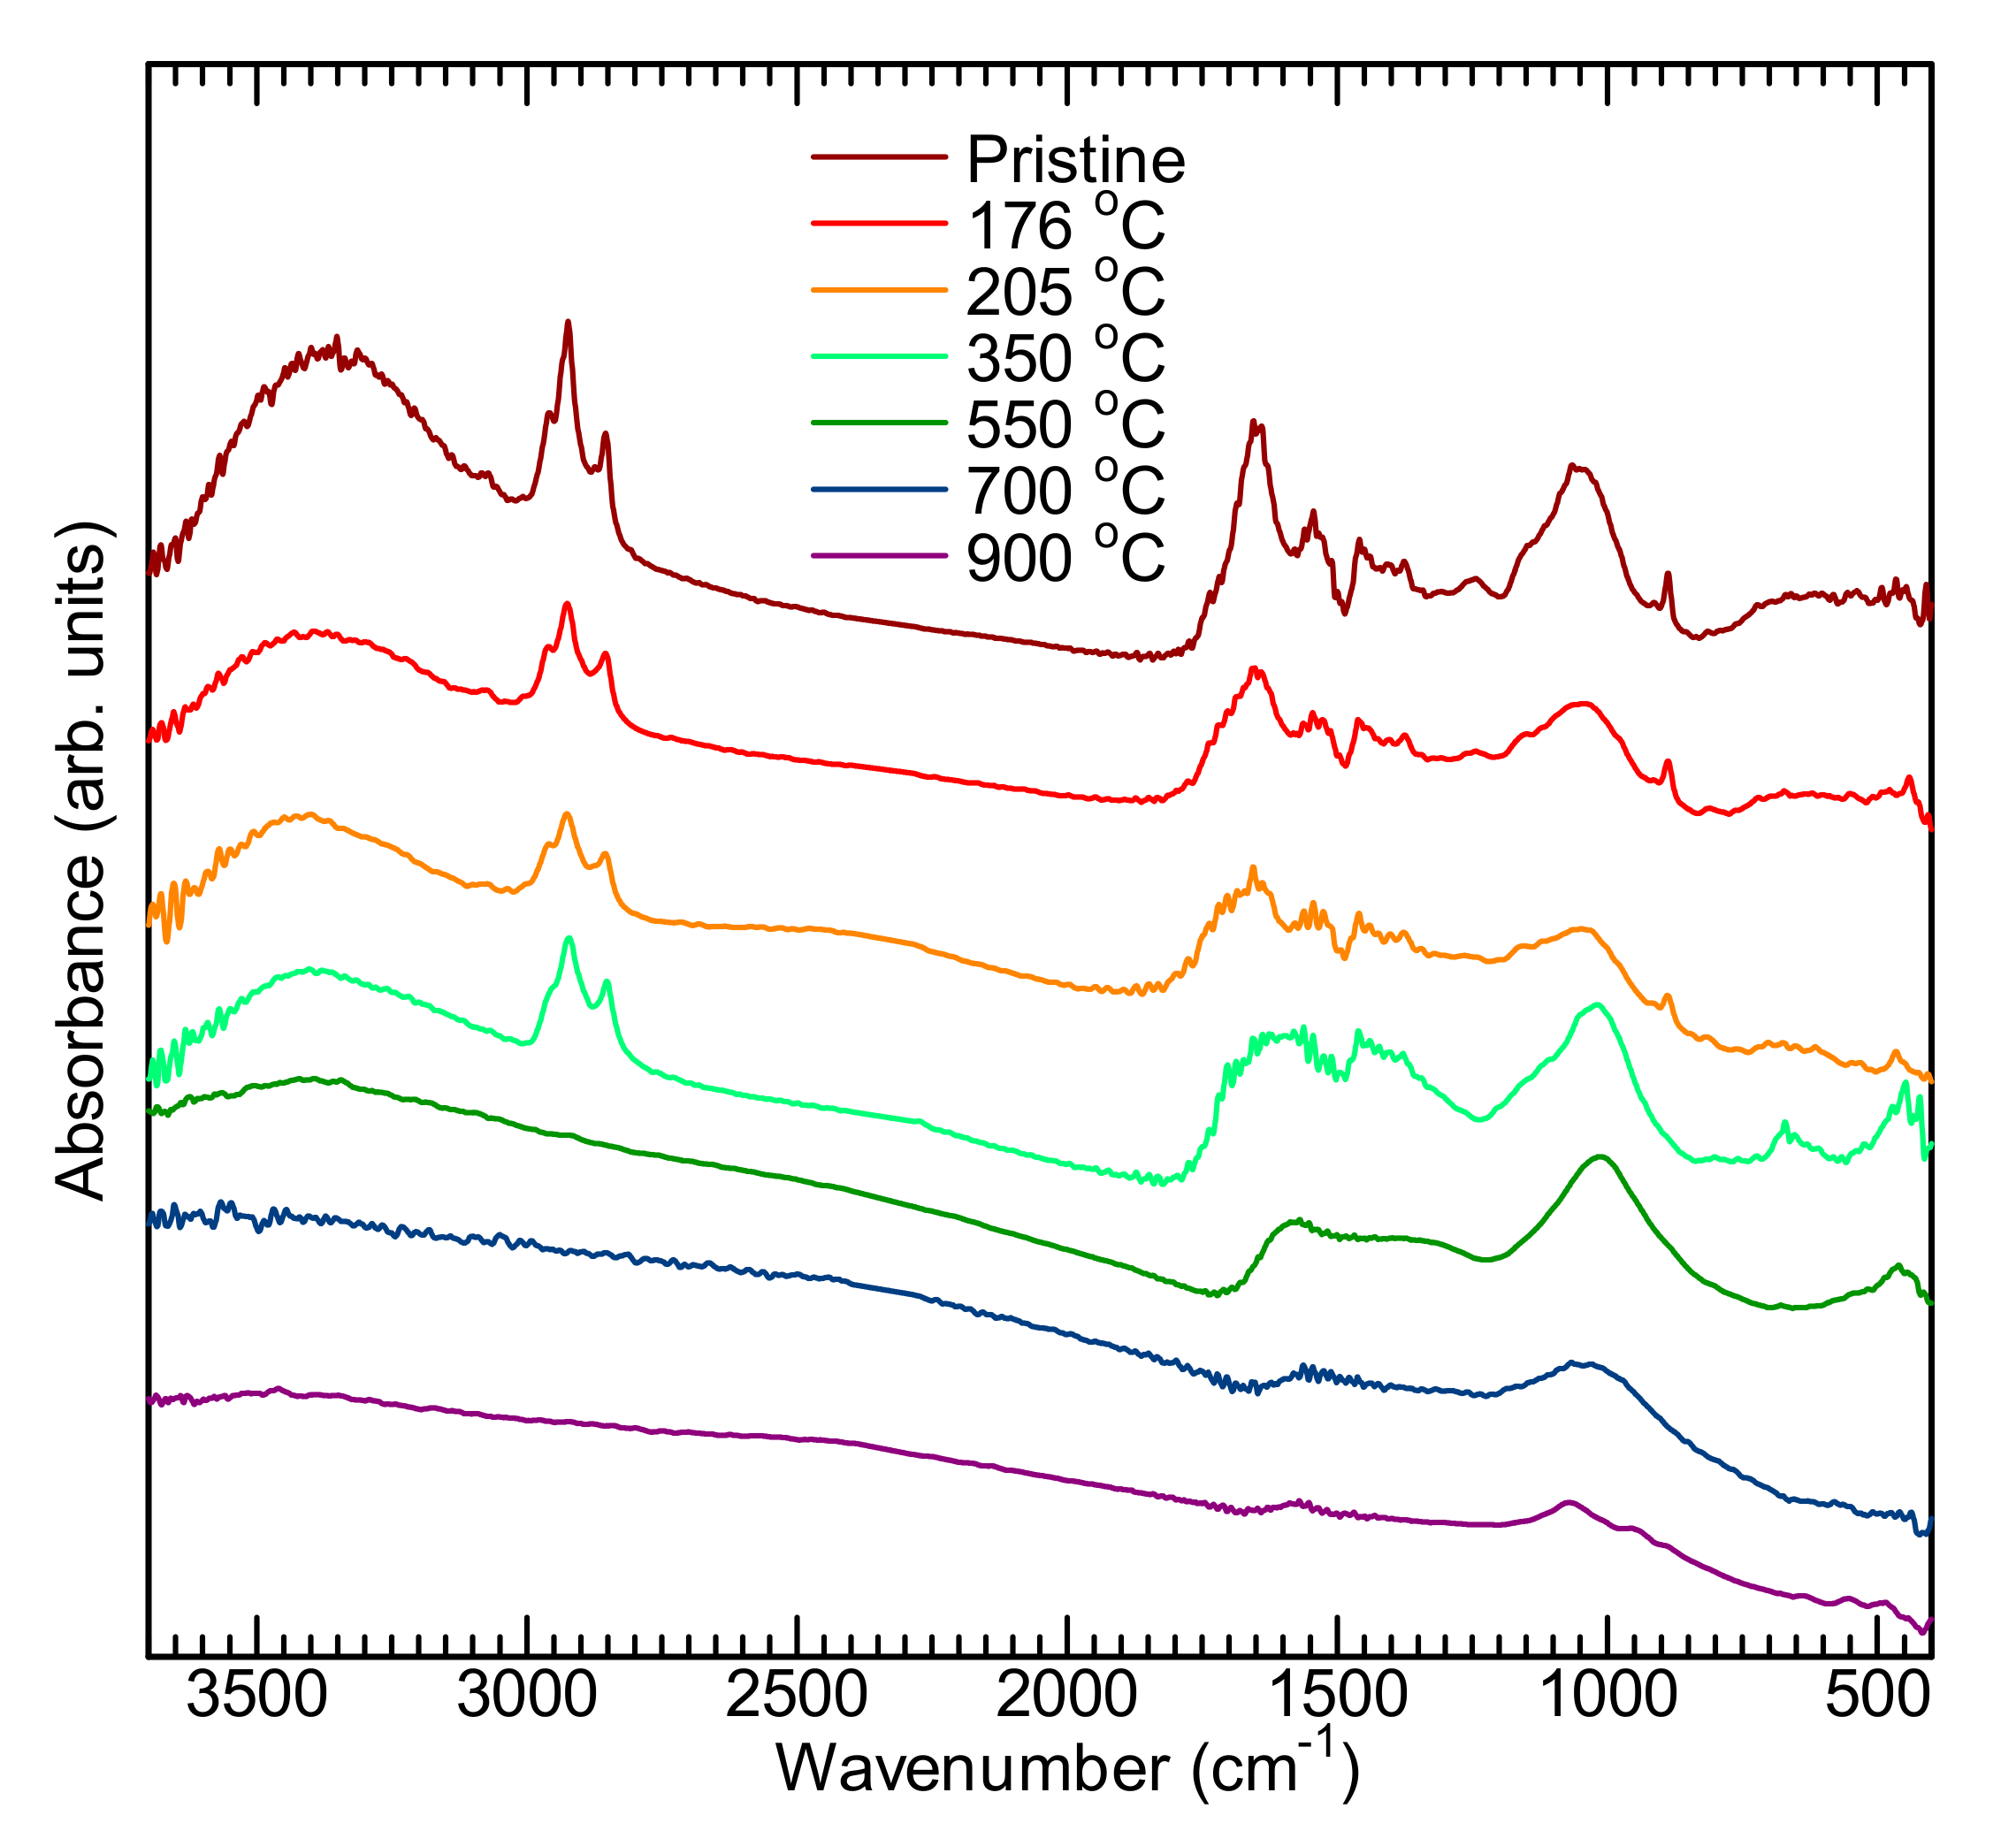
Infrared absorption (IR) spectroscopy measurements of heat-treated B. braunii residues were carried out with the KBr method at room temperature (Figure 5). The B. braunii residues before carbonization (pristine), at 176 and 205 °C contain large amounts of moisture corresponding to the broadened signal at around 3380 cm−1. The intense peak at 2924 cm−1 due to alkyl groups indicates existence of hydrocarbons in the cell wall of the B. braunii or in the oil. A small peak was observed at 3072 cm−1 up to 205 °C (heat treatment temperature), and this “olefin band” suggests an existence of polyunsaturated fatty acids. In addition, absorption bands at 1653 and 888 cm−1 due to vibration of alkenes also disappear at 350 °C. An absorption band at 2956 cm−1 ascribed to terminal alkyl group gradually disappears with increase of heat treatment temperature, while absorptions corresponding to CH2 stretching decrease. Two main peaks remained up to 900 °C, Table 1. A small broadened peak at 1546 cm−1 is inner vibration of carbon atoms of the six-membered rings derived from sp2 hybridization. This result supports achievement of the carbonization.
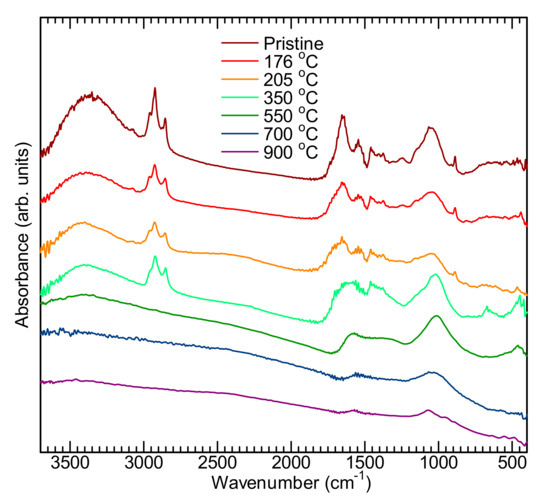
Figure 5.
Infrared (IR) absorption spectra of the B. braunii residue before and after carbonization.

Table 1.
Infrared (IR) absorptions of B. braunii residue before and after carbonization.
No IR absorption due to hydrocarbon could be observed at high temperatures. The signal at 1546 cm−1 shifts to low frequency range with increase of heat treatment temperature. Carbonization at high temperature increases crystallinity. An absorption band due to vibration of Si–O stretching at 1053 cm−1 shows prominent peak shift [23,24,25]. Abundant flocculate ((SiO2)n·Fe2O3) in the B. braunii residue results in intense and broadened absorption. This absorption gradually shifts to 1011 cm−1. The absorption band due to vibration of Si–O stretching shifts to lower wavelengths with incremental densification [26]. However, this band shifts to higher wavelengths again at >550 °C. This tendency was previously reported [27]. At 350 °C, absorptions appear at 665 and 447 cm−1. These absorptions can be assigned to bending and rocking vibrations of Si–O–Si bridges.
2.5. X-ray Photoelectron Spectroscopy (XPS)
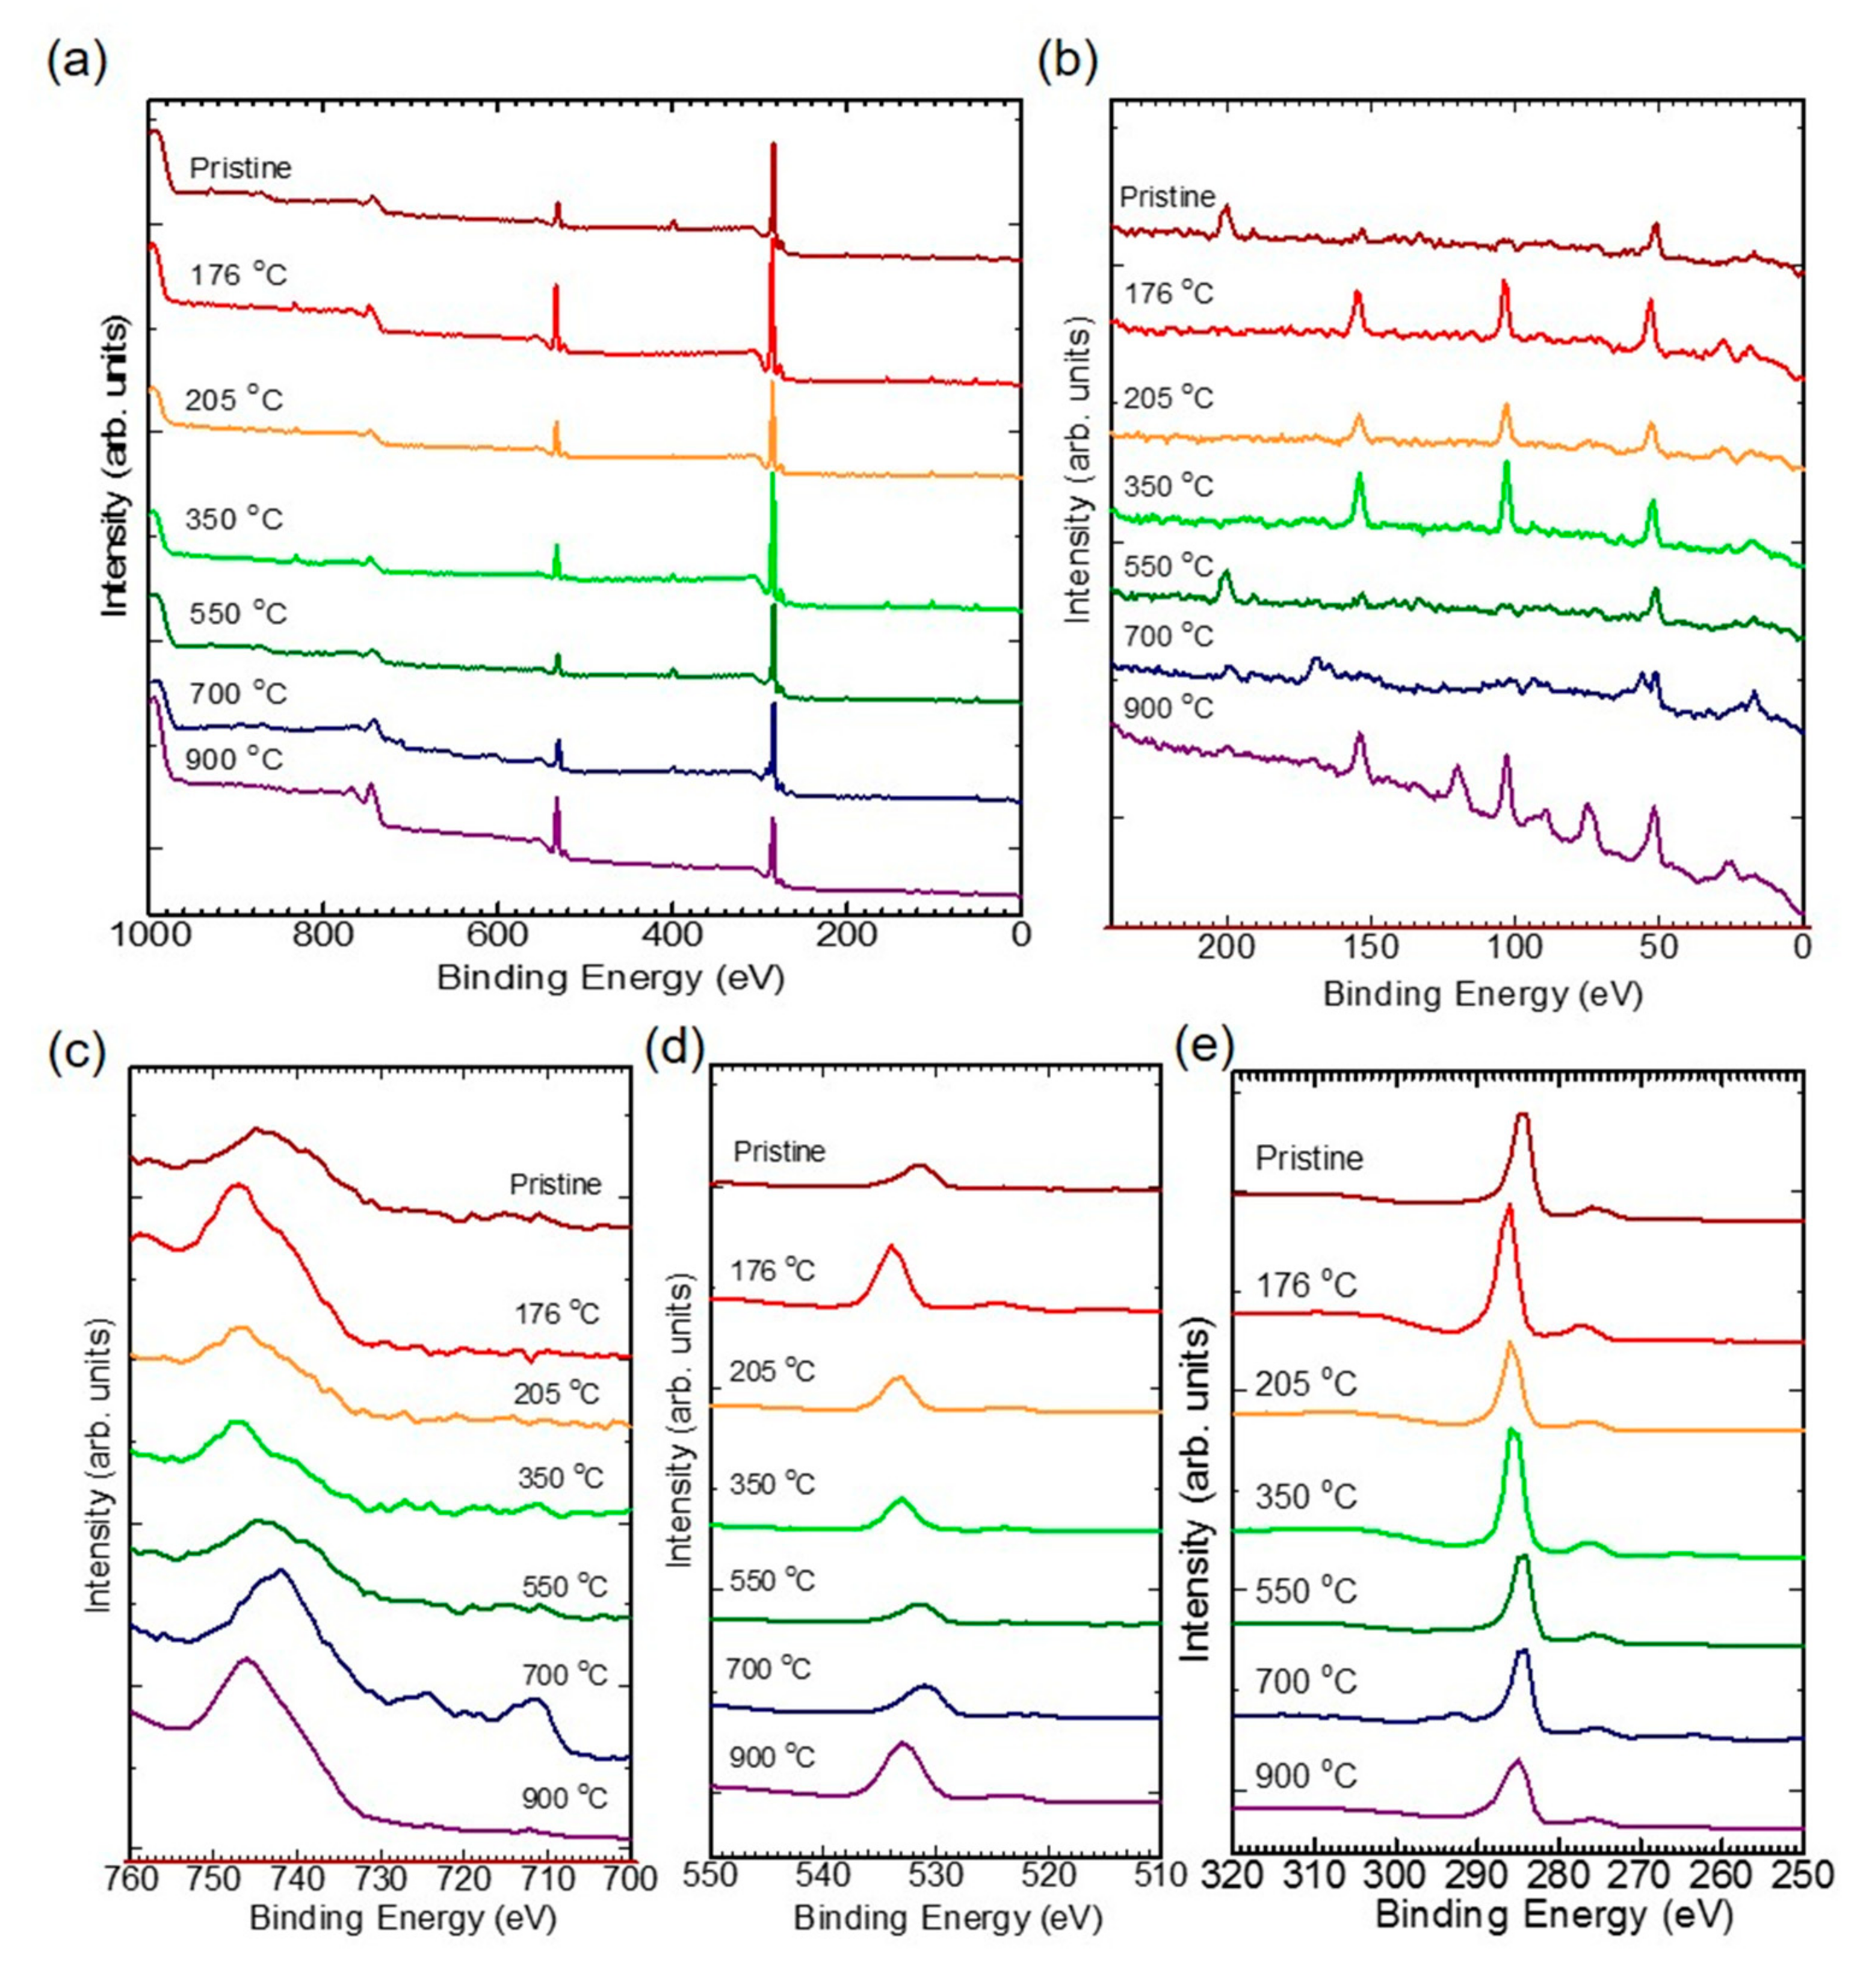
Figure 6a shows wide scan results of the X-ray photoelectron spectroscopy (XPS) measurements for the raw B. braunii residue and the carbonized B. braunii residue at different temperatures. Each sample is mainly composed of carbon and oxygen atoms which signals appear at around 285 eV (C 1s), 531 eV (O 1s), and 747 eV (O KLL). The pristine sample contains 64.7 wt % carbon derived from the large amount of the algae. Nitrogen atoms were detected at around 400 eV.
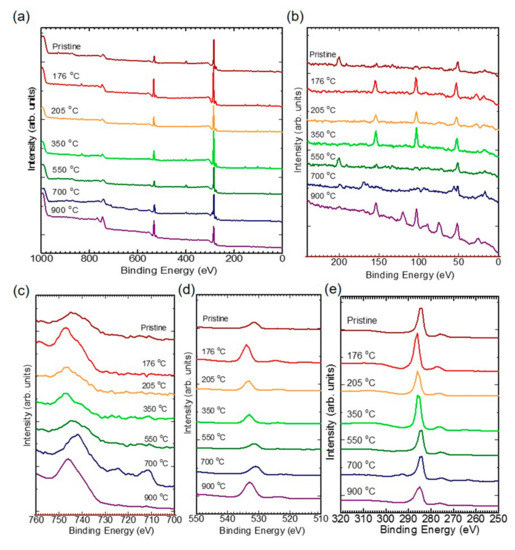
Figure 6.
X-ray photoelectron spectroscopy (XPS) results of the B. braunii residue powder carbonized at different temperatures. (a) Wide scan results; (b) Magnification of low energy region; (c) Binding energy shift of Fe 2p1/2 and Fe 2p3/2; (d) Binding energy shift of O 1s; (e) Binding energy shift of C 1s.
At lower binding energy, ranging from 200 to 0 eV, several sharp peaks were detected by magnification of the figure (Figure 6b) at 200 eV (Cl 2p), 154 eV (Si 2s), 103.5 eV (Si 2p), 90.2 eV (Mg 2s), and 52.3 eV (Fe 3p).
These results well correspond to the EDS results. The previous discussion of the SEM observations reveals that grain growth occurs by carbonization at around 700 °C. Signals at around 724 eV (Fe 2p1/2) and 711 eV (Fe 2p3/2) can be due to generation of iron oxides, Figure 6c. A distinct signal at 724.2 eV appears for carbonized sample at 700 °C. A peak at 52 eV (Fe 3p) splits to two signals in the measurement for the B. braunii residue carbonized at 700 °C. Signals due to oxygen and carbon atoms also shift to low binding energy range at 700 °C (Figure 6d,e). These changes correspond to the SEM observation results. Ionic state cannot be distinctively determined because previous reports indicated that both Fe2O3 and Fe3O4 show the XPS signals at 724 eV (Fe 2p1/2) and 712.2 eV (Fe 2p3/2). Although a satellite signal appears at 718.8 eV due to Fe2O3 [28], significant signals due to Fe3O4 in the XPS measurements cannot be confirmed.
2.6. Electron Spin Resonance (ESR)
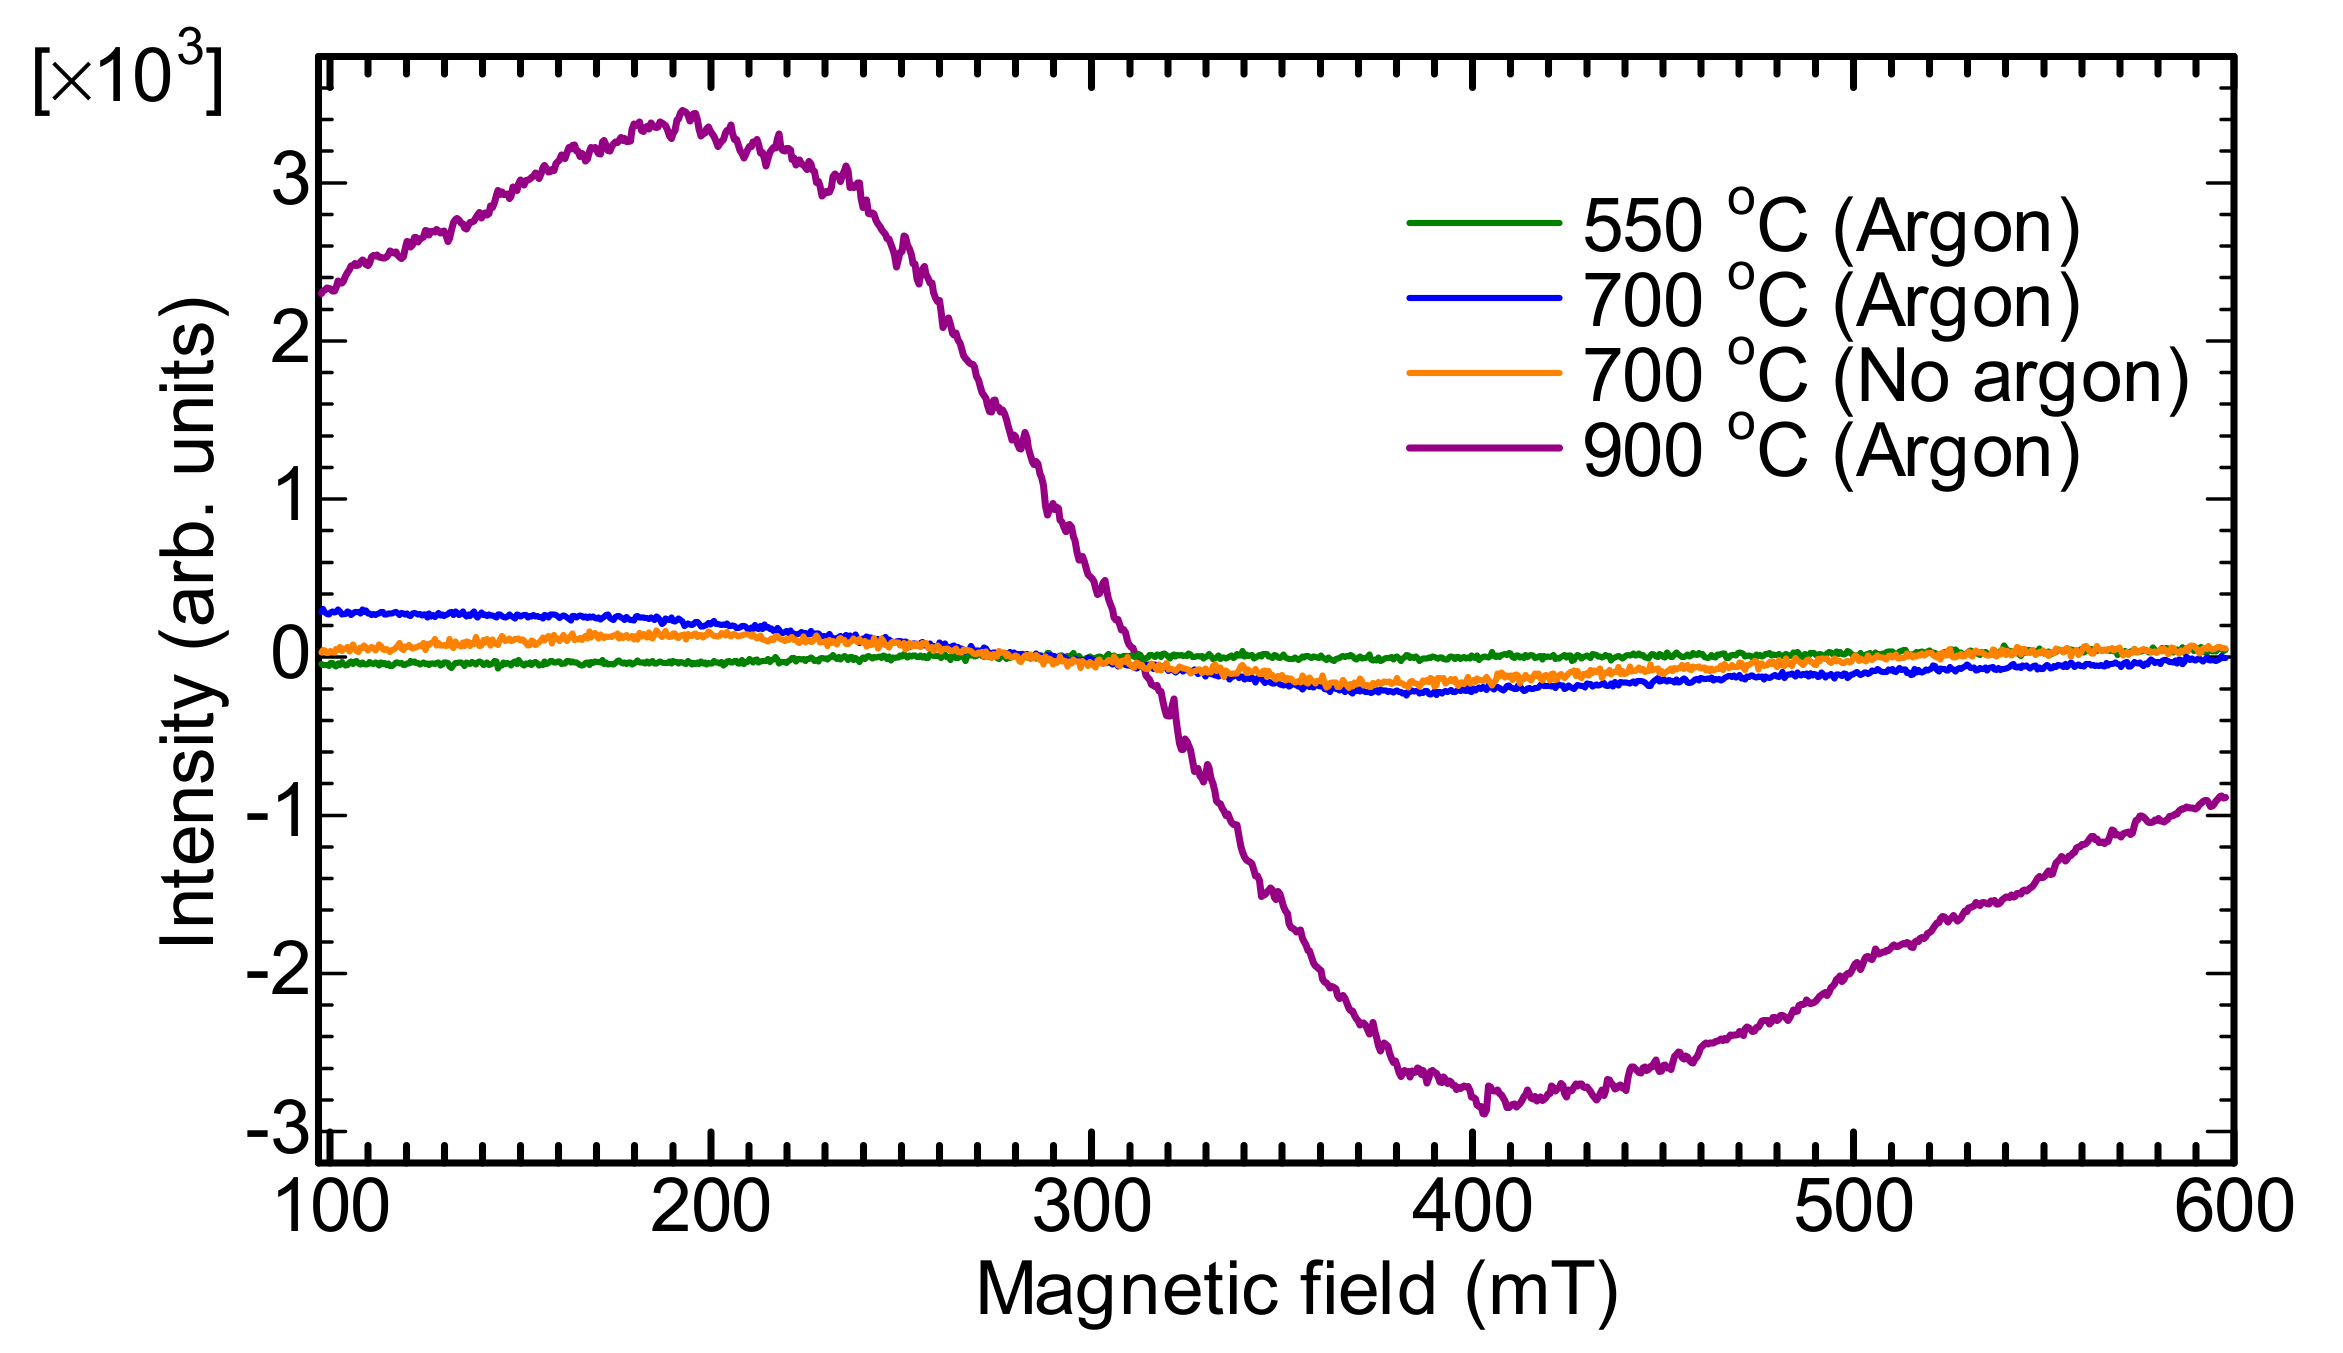
Electron spin resonance (ESR) measurement is a valid method to evaluate paramagnetic behavior by detecting spin signals of the samples. Figure 7 shows the ESR result of the carbonized B. braunii residues at different temperatures and conditions. Carbonized samples under an argon atmosphere at 550 °C show no clear signals. Carbonized samples at 700 °C, however show a weak but broad signal unrelated to the argon gas. Increasing carbonization temperature to 900 °C affords an anomalous single, broad signal ranging from 100 to 600 mT with the peak-to-peak line-width over 200 mT. Conducting materials show Dysonian type signal in the ESR [29]. Asymmetric signal of Dysonian is caused by the skin-depth effect. Conduction electrons of metallic materials diffuse like free particles [30,31,32]. In the present result, the line shape is similar to that of pencil lead [33]. Although the ESR line shape is symmetric, Dysonian component can be involved in this sample. The wide and intense absorption is ascribed to ferromagnetic resonance. Samples (700 and 900 °C, under argon) have a large amount of iron crystal firmly imbedded inside and on the surface, which suggests the material having ferromagnetism. These results are interestingly similar to previous report on carbon containing finely dispersed iron or Fe3O4/graphene composite [34,35]. The broad signal contains (1) ferromagnetic resonance absorption of iron; (2) paramagnetic resonance absorption due to free radical of oxygen and carbon radicals; (3) conduction electrons, (4) radical species from the edge effect of the carbon (radicals at the edge of dangling bond).
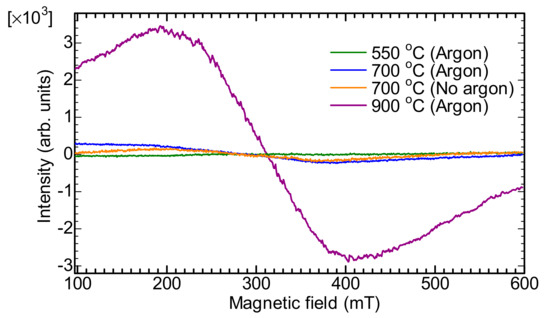
Figure 7.
Electron spin resonance (ESR) analysis of the carbonized B. braunii residue at different temperatures and conditions.
2.7. X-ray Diffraction and 57Fe Mössbauer Spectroscopy
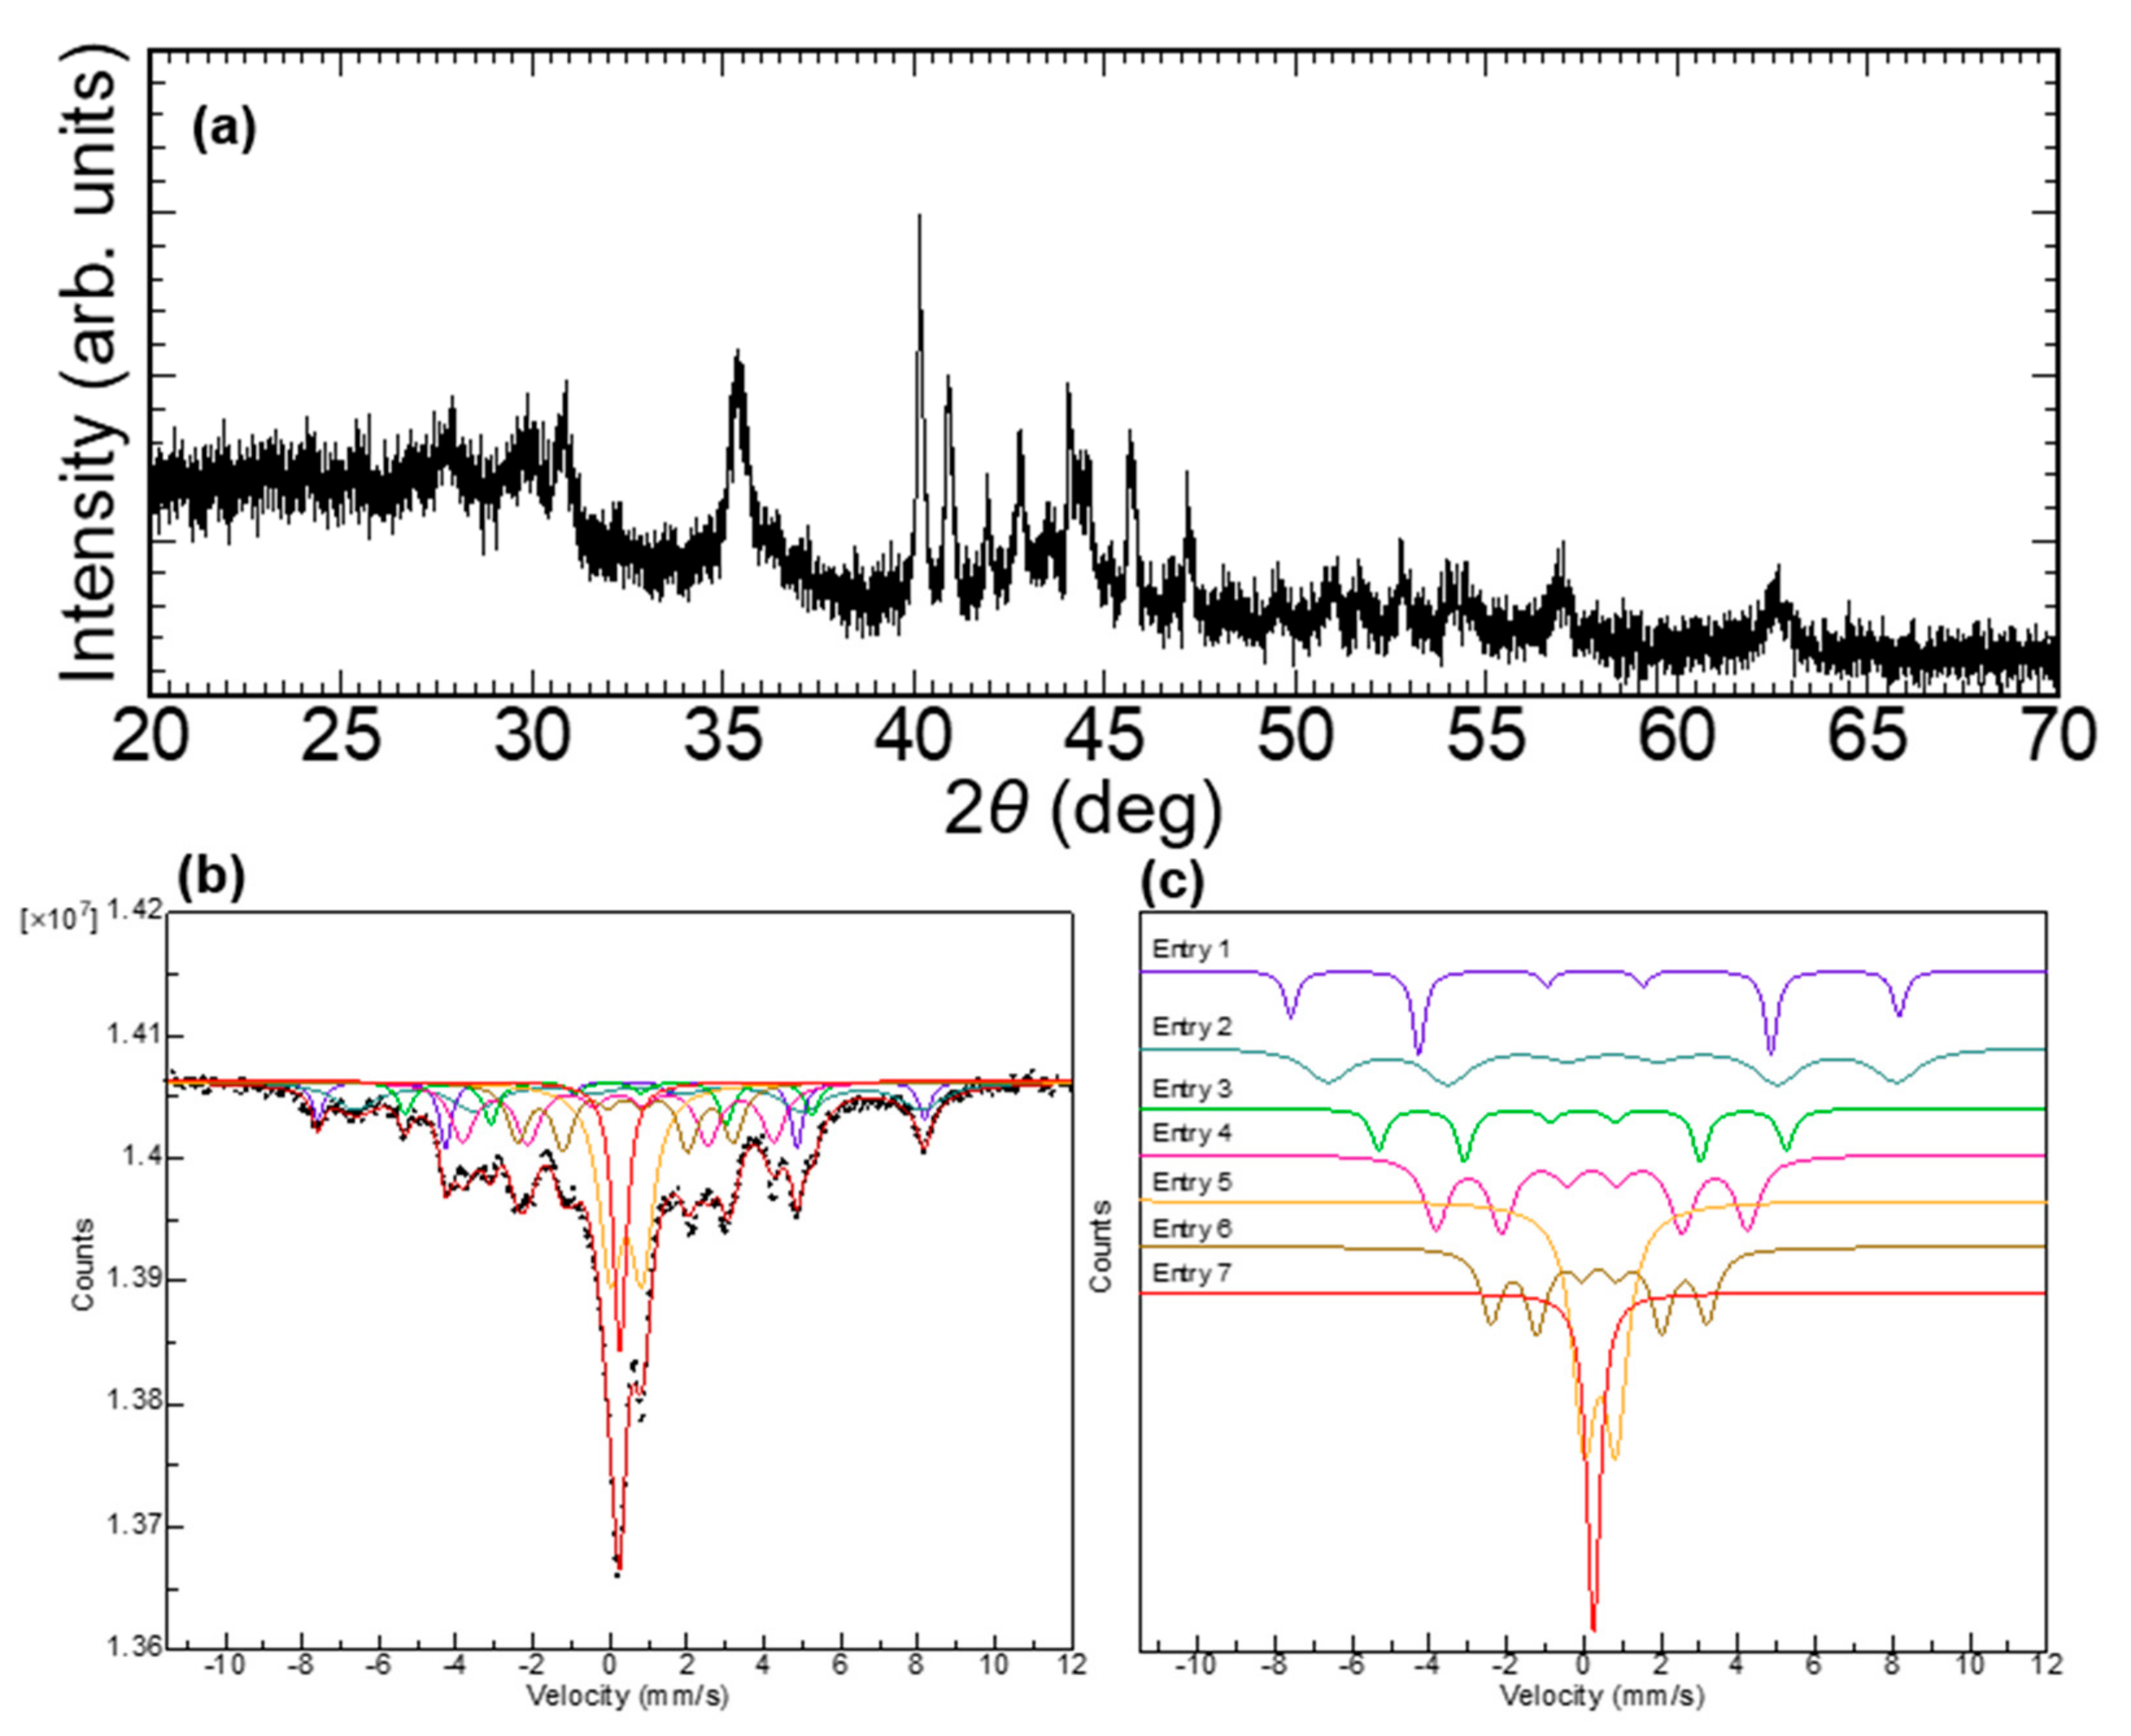
Magnetite (Fe3O4) can be synthesized by the carbonization because the sample shows magnetism. To determine the exact magnetic component during carbonization, X-ray diffraction (XRD) analysis and 57Fe Mössbauer spectra measurement were carried out, Figure 8. Figure 8a is the XRD patterns of B. braunii residue carbonized at 900 °C. Some intense peaks appear at 2θ = 30.7°, 35.3°, 40.1°, 40.8°, 41.9°, 42.7°, 44.1°, 45.6°, 47.1°, 56.7°, and 62.5°. This indicates several iron-containing components, such as Fe3O4, α-Fe, Fe3C, or FeO may exist in the carbonized sample. 57Fe Mössbauer spectra can provide valence number information of the iron atoms. Figure 8b,c shows the 57Fe Mössbauer spectra of the carbonized B. braunii residue at 900 °C. Table 2 summarizes isomer shifts, quadruplet splitting, and hyperfine field of each separated signal. Entry 1 and 2 corresponds to the A site and B site of magnetite Fe3+(Fe3+Fe2+)O4 spinel structure, respectively, whereas the molecular ratio is to be 7.94% and 16.12%, corresponding to AB2O4 structure. Sextet with hyperfine field of 32.8 T (Entry 3) shows typical signal of α-Fe. Sextet (Entry 4) with relative hyperfine field of 25.1 T and isomer shift of 0.204 mm/s may be due to cementite (Fe3C). According to previous research, the reduction value of the internal magnetic field of the iron atoms can be affected by the adjacent carbon atoms, which is generally calculated to be 60 kOe per carbon atom, and this value is also proportional to the number of the nearest neighbor carbon atoms [36]. Previous studies give approximate values of Fe3C [37]. This supports the EDS results that the octahedral crystal contains both carbon and iron atoms, forming an interstitial alloy. The doublet (Entry 5) indicates an existence of paramagnetic iron-containing crystal, which can be wüstite (FeO). Sextet (Entry 6) and singlet (Entry 7) are due to a ferromagnetic substance and a paramagnetic substance, respectively. Several studies reported on nonmagnetic iron silicide. The previous research can be references to evaluate structure of the carbons obtained in this research [27,38].

Figure 8.
(a) XRD patterns of the B. braunii residue carbonized at 900 °C. (b,c) 57Fe Mössbauer spectra of the B. braunii residue carbonized at 900 °C, recorded at room temperature.
Table 2.
57Fe Mössbauer parameters for B. braunii residue carbonized at 900 °C.
2.8. Superconducting Quantum Interference Device (SQUID) Measurement
2.8.1. SQUID Measurement (Sample before Carbonization)
Magnetic susceptibility vs. temperature of the B. braunii residue powder before carbonization is shown in Figure 9a. An exponential growth of magnetic susceptibility over the range from 300 to 5 K indicates existence of a typical paramagnetic substance in the B. braunii residue, indicating the iron oxide at this stage is not ferromagnetic yet. This result also explains the phenomenon that the B. braunii residue before carbonization could not be attracted by magnets. In the deposition process, Fe2O3 exists in the form of (SiO2)n·Fe2O3 in solution and the iron oxide is dispersed inside of the algae bulk. Figure 9b shows the M-H curve at 10 K, in which 30,000 Oe externally applied, however it cannot induce a saturated magnetization. There are two possible reasons: (1) Fe2O3 is in α-phase (ferromagnetic below 250 K) or γ-phase (ferromagnetic), both of which could not be detected in the SQUID measurement, (2) The amount of iron oxide compound is too small to be detected.
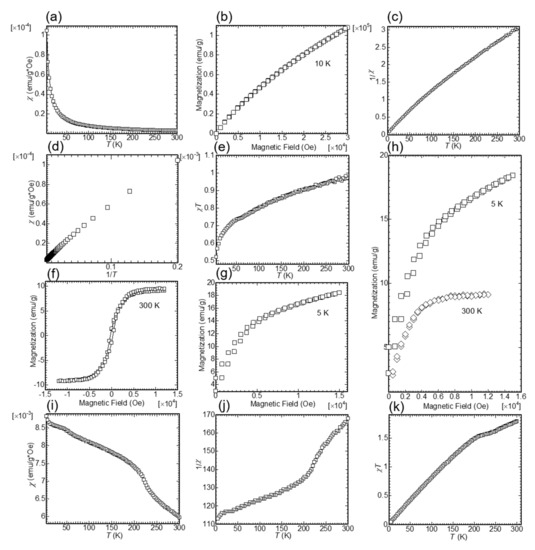
Figure 9.
Superconducting quantum interference device (SQUID) measurement results of the B. braunii residue before and after carbonization. (a–e) Samples before carbonization: (a) Magnetic susceptibility (χ) ranged from 300 to 5 K; (b) M-H curve in 10 K; (c) 1/χ vs. temperature (T) curve; (d) magnetic susceptibility vs. inverse temperature; (e) χT vs. T curve. (f–k) Carbonized sample at 900 °C: (f) M(H) loop at 300 K; (g) M-H curve at 5 K; (h) comparison between M-H curve of 300 and 5 K; (i) χ vs. T with an external field of 500 Oe; (j) 1/χ vs. T curve; (k) χT vs. T.
Figure 9c shows 1/χ vs. temperature (T) curve. Despite a slight curve and a minute fluctuation around room temperature, a linear approximation follows Curie’s law could be observed from 300 to 5 K, suggesting the existence of paramagnetic materials. Normally the magnetic susceptibility χ of a paramagnetic material follows the Curie law, χ = C/T, where C is a material-specific Curie constant and T is the temperature. In Figure 9d, the magnetic susceptibility is almost proportional to inverse temperature, and the fixed inclination represents the value of the Curie constant. Figure 9e shows relation between temperature and Curie constant. The inclination value corresponds to the magnetic susceptibility in Figure 9a. The χT value increases sharply below 50 K in Figure 9e, which corresponds to the result shown in Figure 9a.
2.8.2. SQUID Measurement (Carbonized Sample at 900 °C)
Magnetization of 0.026 mg powder of the B. braunii residue carbonized at 900 °C was measured using a SQUID magnetometer. Magnetization curve of the carbonized B. braunii residue powder at room temperature (300 K) is shown in Figure 9f. The M(H) loop exhibits a saturation magnetization of 9.13 emu/g, a remnant of 1.42 emu/g and a coercivity of 290.2 Oe at the field of 12000 Oe, indicating a soft ferromagnetism, implying a ferromagnetic substance exists inside of the powder. The SQUID measurement at 5 K also indicates existence of a ferromagnetic substance (Figure 9g). Magnetization of the sample at 5 K increases up to 15 kOe, Figure 9h. Meanwhile, the magnetization is almost saturated from 0.5 kOe at room temperature. Temperature dependence of magnetic susceptibility was examined under 500 Oe (Figure 9i). The magnetic susceptibility (χ) decreased with temperature. Figure 9j,k shows 1/χ vs. T and χT vs. T. In Figure 9i–k, significant inflection points at around 44, 210 and 237 K are observed.
Transition of magnetite (Fe3O4) at low temperature was reported by Verwey, who pointed out that homogeneous Fe3O4 shows a transition point at 120 K (Verwey transition) [39]. Fe3O4 is known for adopting the cubic inverse spinel crystal structure, in which Fe2+ and Fe3+ cations locate on two ferromagnetic Fe sublattices octahedral and tetrahedral. The Verwey transition is a process involving changes in the structural, electronic, and magnetism [40]. In this measurement, the phase transition temperature at 210 K is close to neither the Verwey transition temperature of Fe3O4 nor the Néel temperature of FeO (298 K) [41]. To date, no study has been reported on iron-containing materials showing a phase transition at 210 K.
It is noteworthy that only a few researchers have paid attention on the magnetic components of discharged materials, such as coal flyash, magnetite collected from diesel engine exhaust, and tar pitch as a binding and reductant of blast furnace flue dust waste [42,43,44].
2.9. Mechanism of Generation of Magnetic Material
As shown in Figure 10, formation of the porous, conductive, and magnetic material from B. braunii residues involve three steps during each carbonizing temperature range. (1) 200–300 °C, the polysilicato gradually forms a basic pore structure due to syngas such as CO, CO2, and CH4 generated in the bulk sample. The high pressure inside of the syngas foams causes transformation of polysilicato. (2) Carbon was gradually formed in the range of 350–700 °C. Electrical conductivity appears for the heat-treated sample at around 500 °C. (3) Magnetism gradually appears at >700 °C with some grain growth observed under the SEM. We assumed that the iron crystal imbedded on the B. braunii residues could be Fe3O4 or Fe generated during the heating. The B. braunii residue absorbs polysilicato iron in the form of paramagnetic ferric oxide (Fe2O3). Since the ferromagnetism appears after 700 °C, implying large amount of hydrogen gas may be a trigger of reductive reaction to generate Fe3O4 and Fe, as shown below.
3Fe2O3 + H2→2Fe3O4 + H2O
Fe3O4 + 4H2→3Fe + 4H2O
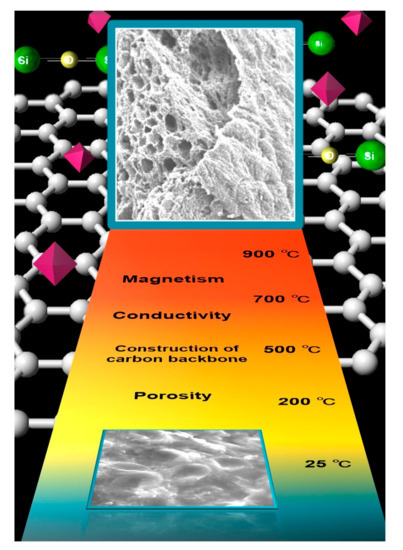
Figure 10.
Formation of porous, conductive, and magnetic material by carbonization of the B. braunii residue flocculated with polysilicato-iron.
Pyrolysis of the B. braunii would generate gaseous products (CO, CO2, CH4). Carbon monoxide could also be a reducing agent. Absence of argon gas flow results in no ferromagnetism for the sample, and no grain growth (Figure 3h). B. braunii and its residues contain large amount of C and H compared to other algae before oil extraction [45]. Hence, the B. braunii residues can be effectively used as reducing source.
2.10. Prospects for Future Applicaiton
The silicon-iron/iron oxide-carbon composite produced by carbonization of the B. braunii residues at 900 °C could be practically useful with its porous, conductive, and magnetism. In recent years, Fe3O4-graphene oxide and Fe3O4-graphite have been studied as a suitable catalyst in the reductive reaction of aromatic nitro compounds to aromatic amines, which are widely used in production of dyes, pigments, and pharmaceuticals [46,47]. Fe3O4-carbon composites can be magnetically separated. Therefore, the composites can be easily recollected for reuse. The carbonized B. braunii residues are promising candidates to produce magneto-catalytic system having good recollection function with magnet. Carbon-encapsulated Fe3O4 nanoparticles can also be used as an anode material in lithium-ion battery [48,49]. Furthermore, mesoporous silicon-Fe3O4-graphene oxide nanocomposites have been reported to be a good material to remove dyes such as methylene blue from water [50].
3. Materials and Methods
3.1.Preparation of B. braunii Residue Samples
B. braunii strain (BOT-22) used in this study was isolated from the Bot-22 was isolated from reservoir in Okinawa Prefecture, Ishigaki city, and maintained in ABES, University of Tsukuba. [51]. This strain is classified race B and produces botryococcene (C34H58) as a main component of hydrocarbons [52].
The B. braunii residue samples were prepared as follows. A mass culture system of Botryococcus developed in University of Tsukuba provided culture broth of the BOT-22 strain of B. braunii for this work [14]. The broth of the BOT-22 was concentrated by using PSI as flocculants and dried by sunlight [53]. The dried sample of the B. braunii was soaked into n-hexane for extraction of hydrocarbon oils including a small amount of carotenoids and triacylglycerols. After the extraction, the residual sample was recovered by filtration and then dried again.
3.2. Carbonization of B. braunii Residue Samples
B. braunii residues were set on a quartz dish and placed into an MIT Electric Gold Furnace instrument produced by the Lincoln Laboratory of the Massachusetts Institute of Technology (MIT, Lexington, MA, US) equipped with an Ishikawa temperature controller and gas atmosphere furnace system (Mitaka, Japan) and a handmade furnace assembled by Dr. Shinichi Ito (University of Tsukuba) (we employed two furnaces). Carbonization was performed under argon atmosphere from room temperature to the predetermined temperature. Syngas generated during the carbonization process was drawn into either water or a draft apparatus.
3.3. Infrared (IR) Absorbance Measurement
Samples were dried under vacuum in prior. Each sample was measured using the KBr pellet method. The sample powder (the amount is just enough to cover the tip of spatula) was mixed with KBr, and well ground in an agate mortar for 3–5 min. Pellet was then prepared using a hand press. The mixture of sample powder and KBr was pressed for about 30 s to form a thin and transparent pellet.
3.4. Thermogravimetric (TG) Analysis
TG analysis was performed for B. braunii residues. A 10.02 mg bulk sample and a 9.58 mg powder sample were examined. The samples were set in a platinum pan and heated up to 900 °C under argon atmosphere with heating rate of 10 °C/min and argon gas flow rate of 200 mL/min. The measurement conditions were set under the same condition as previously reported by Watanabe et al. except for the gas flow rate [19]. Additionally, appropriate carbonization condition (temperature, time) in the gold furnace was adjusted to those of the TG measurements.
3.5. Scanning Electron Microscopy (SEM) and Energy Dispersive X-ray Spectroscopy (EDS)
Samples were dried under vacuum and coated with gold on the surface to enhance the electrical contact.
3.6. X-ray Photoelectron Spectroscopy (XPS) Measurement
Both wide scan and narrow scan measurements were carried out with five scans. Intensity 54,000 cps (radiation source: Al-Mg, monochrome X-ray meter, resolution 0.90 eV). Energy sweep: constant analyzer energy method. JEOL customized software was used for deconvolution.
3.7. Electron Spin Resonance (ESR) Measurement
B. braunii residues carbonized at 550, 700, and 900 °C were measured at room temperature. Samples were sealed in a quartz tube. Magnetic field: 0.93T, X-band (9.2–9.9 GHz), Bruker customized software was used for deconvolution.
3.8. X-ray Diffraction (XRD) Spectroscopy
Powder sample of B. braunii residues carbonized at 900 °C was measured at room temperature. CuKα (λ = 1.5428 Å), XRD signals directly interpreted from 2θ value.
3.9. Techniques and Characterization
SEM and EDS analysis were carried out with JSM-7000F (JEOL, Akishima, Japan), and attachment JED-2200 (JEOL, Akishima, Japan). TG measurements were performed with an EXSTAR7000 (Seiko Instruments Inc., Chiba, Japan). IR absorption spectra were obtained with a JASCO FT-IR 550 spectrometer (Hachiōji, Japan). XPS analysis was performed with a JPS-9010TR (JEOL, Akishima, Japan). ESR spectra were measured by using a Bruker EMX-T ESR Spectrometer (Billerica, MA, USA). X-Ray Diffraction of sample was measured with PANalytical X’Pert X-ray diffractometers (Almelo, The Netherlands). 57Fe Mössbauer Spectroscopy was employed for the Mössbauer spectroscopy measurements. Superconducting quantum interference device (SQUID, Quantum Design (San Diego, CA, USA) was used for magnetic measurements.
4. Conclusions
A porous-conductive-magnetic carbon-iron composite material was successfully synthesized by carbonization of the B. braunii residue treated with PSI flocculants. The SEM images reveal that iron oxide crystals are firmly imbedded on the surface and inside of the bulk sample. We evaluated formation of the porous structure and role of silicon in the sample. ESR measurement, Mössbauer spectroscopy, and SQUID measurements confirm ferromagnetic behavior of this new composite from waste of the biomass. Combination of research of biology and materials science may open a new avenue for development of useful materials.
Supplementary Materials
The following are available online at http://www.mdpi.com/2311-5629/4/1/10/s1, Figure S1: Instrument for carbonization and three substances obtained during carbonization, Video S1: Carbonized Botryococcus braunii residues attracted by a magnet.
Acknowledgments
We acknowledge Research Facility Center for Science and Technology, Open Facility Network Office for thermogravimetric analysis and nice glasswork from Engineering Workshop. We are especially grateful to Shinichi Ito (University of Tsukuba) for assembling the handmade furnace. We are also grateful to University of Tsukuba tandem Accelerator Complex (UTTAC) for Mössbauer spectroscopy measurement. A part of this work was supported by NIMS microstructural characterization platform as a program of “Nanotechnology Platform” of the Ministry of Education. Culture, Sports, Science and Technology (MEXT), Japan. Aohan Wang is presently assistant professor in Interdisciplinary Graduate School of Science and Engineering, Shimane University.
Author Contributions
Aohan Wang and Hiromasa Goto analyzed the data; Mikihide Demura and Makoto M. Watanabe contributed B. braunii residues sample; Kotaro Ohara, Takanari Kashiwagi and Kazuo Kadowaki contributed SQUID measurement; Eiji Kita contributed 57Fe Mössbauer measurement. Jiuchao Dong contributed XRD measurement. Hiromasa Goto conceived and designed the experiments.
Conflicts of Interest
The authors declare no conflict of interest.
References
- Lapuerta, M.; Armas, O.; Rodriguez-Fernandez, J. Effect of biodiesel fuels on diesel engine emissions. Prog. Energy Combust. Sci. 2008, 34, 198–223. [Google Scholar] [CrossRef]
- Gouveia, L.; Oliveira, A.C. Microalgae as a raw material for biofuels production. J. Ind. Microbiol. Biotechnol. 2009, 36, 269–274. [Google Scholar] [CrossRef] [PubMed]
- Chu, S.; Majumdar, A. Opportunities and challenges for a sustainable energy future. Nature 2012, 488, 294–303. [Google Scholar] [CrossRef] [PubMed]
- Clarens, A.F.; Resurreccion, E.P.; White, M.A.; Colosi, L.M. Environmental life cycle comparison of algae to other bioenergy feedstocks. Environ. Sci. Technol. 2010, 44, 1813–1819. [Google Scholar] [CrossRef] [PubMed]
- Bartle, J.R.; Abadi, A. Toward sustainable production of second generation bioenergy feedstocks. Energy Fuels 2010, 24, 2–9. [Google Scholar] [CrossRef]
- Petrou, E.C.; Papppis, C.P. Biofuels: A survey on Pros and Cons. Energy Fuels 2009, 23, 1055–1066. [Google Scholar] [CrossRef]
- Perego, C.; Bosetti, A. Biomass to fuels: The role of zeolite and mesoporous materials. Microporous Mesoporous Mater. 2011, 144, 28–39. [Google Scholar] [CrossRef]
- Yin, C. Microwave-assisted pyrolysis of biomass for liquid biofuels production. Bioresour. Technol. 2012, 120, 273–284. [Google Scholar] [CrossRef] [PubMed]
- Sainz, M.B. Commercial cellulosic ethanol: The role of plant-expressed enzymes. In Vitro Cell. Dev. Biol. Plant 2009, 45, 314–329. [Google Scholar] [CrossRef]
- Jahirul, M.I.; Rasul, M.G.; Chowdhury, A.A.; Ashwath, N. Biofuels production through biomasspyrolysis—A technological review. Energies 2012, 5, 4952–5001. [Google Scholar] [CrossRef]
- Singh, S.P.; Singh, P. Effect of temperature and light on the growth of algae species: A review. Renew. Sustain. Energy Rev. 2015, 50, 431–444. [Google Scholar] [CrossRef]
- Mata, T.M.; Martins, A.A.; Caetano, N.S. Microalgae for biodiesel production and other application: A review. Renew. Sustain. Energy Rev. 2010, 14, 217–232. [Google Scholar] [CrossRef]
- Brennan, L.; Owende, P. Biofuels from microalgae—A review of technologies for production, processing, and extractions of biofuels and co-products. Renew. Sustain. Energy Rev. 2010, 14, 557–577. [Google Scholar] [CrossRef]
- Shimamura, R.; Watanabe, S.; Sagakura, Y.; Shiho, M.; Kaya, K.; Watanabe, M.M. Development of Botryococcus seed culture system for future mass culture. Procedia Environ. Sci. 2012, 15, 80–89. [Google Scholar] [CrossRef]
- Xu, L.; Wang, S.; Wang, F.; Guo, C.; Liu, C. Improved biomass and hydrocarbon productivity of Botryococcus braunii by periodic ultrasound stimulation. Bioenergy Res. 2014, 7, 986–992. [Google Scholar] [CrossRef]
- Yeesang, C.; Cheirsilp, B. Low-cost production of green microalga Botryococcus braunii biomass with high lipid content through mixotrophic and photoautotrophic cultivation. Appl. Biochem. Biotechnol. 2014, 174, 116–129. [Google Scholar] [CrossRef] [PubMed]
- Wang, S.; Wang, F.; Hu, Y.; Stiles, A.R.; Guo, C.; Liu, C. Magnetic flocculant for high efficiency harvesting of microalgal cells. ACS Appl. Mater. Interfaces 2014, 6, 109–115. [Google Scholar] [CrossRef] [PubMed]
- Abomohra, A.E.; Wagner, M.; El-Sheekh, M.; Hanelt, D. Lipid and total fatty acid productivity in photoautotrophic fresh water microalgae: Screening studies towards biodiesel production. J. Appl. Phycol. 2013, 25, 931–936. [Google Scholar] [CrossRef]
- Watanabe, H.; Li, D.; Nakagawa, Y.; Tomishige, K.; Kaya, K.; Watanabe, M.M. Characterization of oil-extracted residue biomass of Botryococcus braunii as a biofuel feed stock and its pyrolytic behavior. Appl. Energy 2014, 132, 475–484. [Google Scholar] [CrossRef]
- Watanabe, H.; Li, D.; Nakagawa, Y.; Tomishige, K.; Watanabe, M.M. Catalytic gasification of oil-extracted residue biomass of Botryococcus braunii. Bioresour. Technol. 2015, 191, 452–459. [Google Scholar] [CrossRef] [PubMed]
- Garciano, L.O.; Tran, N.H.; Kannangara, G.S.K.; Milev, A.S.; Wilson, M.A.; McKirdy, D.M.; Hall, P.A. Pyrolysis of a Naturally Dried Botryococcus braunii Residue. Energy Fuels 2012, 26, 3874–3881. [Google Scholar] [CrossRef]
- Liang, W.; Zhao, Y.; Liu, L.; Sun, X. Self-Assembled Magnetically Modified Flocculant for Separating Microalgae and Preparation Method and Application Thereof. Patent CN104480016 A 20150401, 1 April 2015. [Google Scholar]
- Bell, R.J.; Bird, N.F.; Dean, P. The vibrational spectra of vitreous silica, germania and beryllium fluoride. J. Phys. C Solid State Phys. 1968, 1, 299–303. [Google Scholar] [CrossRef]
- Devine, R.A.B. Ion implantation- and radiation-induced structural modifications in amorphous SiO2. J. Non-Cryst. Solids 1993, 152, 50–58. [Google Scholar] [CrossRef]
- Fitch, J.T.; Lucovsky, G.; Kobeda, E.; Irene, E.A. Effects of thermal history on stress-related properties of very thin films of thermally grown silicon dioxide. J. Vac. Sci. Technol. B 1989, 7, 153–162. [Google Scholar] [CrossRef]
- Agarwal, A.; Davis, K.M.; Tomozawa, M. A simple IR spectroscopic method for determining fictive temperature of silica glasses. J. Non-Cryst. Solids 1995, 185, 191–198. [Google Scholar] [CrossRef]
- Manoharan, C.; Venkatachalapathy, R.; Dhanapandian, S.; Deenadayalan, K. FTIR and Mössbauer spectroscopy applied to study of archaeological artefacts from Maligaimedu, Tamil Nadu, India. Indian J. Pure Appl. Phys. 2007, 45, 860–865. [Google Scholar]
- Yamashita, T.; Hayes, P. Analysis of XPS spectra of Fe2+ and Fe3+ ions in oxide materials. Appl. Surf. Sci. 2008, 254, 2441–2449. [Google Scholar] [CrossRef]
- Wagoner, G. Spin resonance of charge carries in graphite. Phys. Rev. 1960, 118, 647–653. [Google Scholar] [CrossRef]
- Feher, G.; Kip, A.F. Electron spin resonance absorption in metals. I. Experimental. Phys. Rev. 1955, 98, 337–348. [Google Scholar] [CrossRef]
- Dyson, F.J. Electron spin resonance absorption in metals. II. Theory of electron diffusion and the skin effect. Phys. Rev. 1955, 98, 349–359. [Google Scholar] [CrossRef]
- Joshi, J.P.; Bhat, S.V. On the analysis of broad Dysonian electron paramagnetic resonance spectra. J. Magn. Reson. 2004, 168, 284–287. [Google Scholar] [CrossRef] [PubMed]
- ESR of Material-Carbon. JEOP Application Note: ER-110001E. Available online: https://www.jeol.co.jp/en/applications/detail/1293.html (accessed on 27 January 2018).
- Banerji, S.; Adhya, S.K.; Ghosh, S.K. ESR studies of carbon containing finely dispersed iron. Carbon 1988, 26, 461–463. [Google Scholar] [CrossRef]
- Zheng, X.; Feng, J.; Zong, Y.; Miao, H.; Hu, X.; Bai, J.; Li, X. Hydrophobic graphene nanosheets decorated by monodispersed superparamagnetic Fe3O4 nanocrystals as synergistic electromagnetic wave absorbers. J. Mater. Chem. C 2015, 3, 4452–4463. [Google Scholar] [CrossRef]
- Ino, H.; Moriya, T.; Fujita, E. Mössbauer Effect Study of the Iron-Carbon Martensite and Its Tempering Process. Tetsu-to-Hagane 1968, 1, 34–48. [Google Scholar] [CrossRef]
- Mendonca, F.G.; Andisson, J.D.; Rosmaninho, M.G.; Lago, R.M.; Tristão, J.C. Mössbauer study of carbon coated iron magnetic nanoparticles produced by simultaneous reduction/pyrolysis. Hyperfine Interact. 2011, 202, 123–129. [Google Scholar] [CrossRef]
- Strijkers, G.J.; Kohlhepp, J.T.; Swagten, H.J.M.; de Jonge, W.J.M. Formation of nonmagnetic c-Fe1-xSi in antiferromagnetically coupled epitaxial Fe/Si/Fe. Phys. Rev. B 1999, 60, 9583–9587. [Google Scholar] [CrossRef]
- Verwey, E.J.W. Electronic conduction of magnetite (Fe3O4) and its transition point at low temperatures. Nature 1939, 14, 327–328. [Google Scholar] [CrossRef]
- Bernal-Villamil, I.; Gallego, S. Electronic phase transitions in ultrathin magnetite films. J. Phys. Condens. Matter 2015, 27, 293292. [Google Scholar] [CrossRef] [PubMed]
- Kittel, C. Introduction to Solid State Physics, 6th ed.; Wiley: Hoboken, NJ, USA, 1986. [Google Scholar]
- Chaddha, G.; Seehra, M.S. Magnetic components and particle size distribution of coal fly ash. J. Phys. D Appl. Phys. 1983, 16, 1767–1776. [Google Scholar] [CrossRef]
- Abdul-Razzaq, W.; Gautam, M. Discovery of magnetite in the exhausted material from a diesel engine. Appl. Phys. Lett. 2001, 78, 2018–2019. [Google Scholar] [CrossRef]
- Amorim, C.C.; Leão, M.M.D.; Dutra, P.R.; Tristão, J.C.; Magalhães, F.; Lago, R.M. Use of tar pitch as a binding and reductant of BFD waste to produce reactive materials for environmental applications. Chemosphere 2014, 109, 143–149. [Google Scholar] [CrossRef] [PubMed]
- Kadouri, A.; Derenne, S.; Largeau, E.; Casadevall, E.; Berkaloff, C. Resistant biopolymer in the outer walls of Botryococcus braunii, B race. Phytochemistry 1988, 27, 551–557. [Google Scholar] [CrossRef]
- Feng, C.; Zhang, H.; Shang, N.; Gao, S.; Wang, C. Magnetic graphene nanocomposite as an efficient catalyst for hydrogenation of nitroarenes. Chin. Chem. Lett. 2013, 24, 539–541. [Google Scholar] [CrossRef]
- He, G.; Liu, W.; Sun, X.; Chen, Q.; Wang, X.; Chen, H. Fe3O4@graphene oxide composite: A magnetically separable and efficient catalyst for the reduction of nitroarenes. Mater. Res. Bull. 2013, 48, 1885–1890. [Google Scholar] [CrossRef]
- He, C.; Wu, S.; Zhao, N.; Shi, C.; Liu, E.; Li, J. Carbon-encapsulated Fe3O4 nanoparticles as a high-rate lithium ion battery anode material. ACS Nano 2013, 7, 4459–4469. [Google Scholar] [CrossRef] [PubMed]
- Zhao, B.; Zheng, Y.; Ye, F.; Deng, X.; Xu, X.; Liu, M.; Shao, Z. Multifunctional iron-oxide-nanoflake/graphene composites derived from mechanochemical synthesis for enhanced lithium storage and electrocatalysis. ACS Appl. Mater. Interfaces 2015, 7, 14446–14455. [Google Scholar] [CrossRef] [PubMed]
- Gu, F.; Liang, M.; Han, D.; Wang, Z. Multifunctional sandwich-like mesoporous silica-Fe3O4-graphene oxide nanocomposites for removal of methylene blue from water. RSC Adv. 2015, 5, 39964–39972. [Google Scholar] [CrossRef]
- Yonezawa, N.; Matsuura, H.; Shiho, M.; Kaya, K.; Watanabe, M.M. Effects of soybean curd wastewater on the growth and hydrocarbon production of Botryococcus braunii strain BOT-22. Bioresour. Technol. 2012, 109, 304–307. [Google Scholar] [CrossRef] [PubMed]
- Ishimatsu, A.; Matsuura, H.; Sano, T.; Kaya, K.; Watanabe, M.M. Biosynthesis of isoprene units in the C34 botryococcene molecule produced by Botryococcus braunii strain Bot-22. Procedia Environ. Sci. 2012, 15, 56–65. [Google Scholar] [CrossRef]
- Polysilicato-iron mainly contains [SiO2]n·Fe2O3, according to the data sheet (in Japanese) provided by Nankai Chemical.


© 2018 by the authors. Licensee MDPI, Basel, Switzerland. This article is an open access article distributed under the terms and conditions of the Creative Commons Attribution (CC BY) license (http://creativecommons.org/licenses/by/4.0/).