Article

Exploring Activation-Free Biochars Through a Comprehensive Characterization


by
Maria Apostolopoulou
1,*,
Nikos Kavousanos
1,
Feidias Bairamis
2,
Konstantinos Brintakis
2,
Athanasia Kostopoulou
2,
Emmanuel Stratakis
2,3,
Emmanuel Spanakis
4,
Ricardo Santamaría Ramirez
5,
Dimitris Kalderis
6 and
Dimitra Vernardou
1,*
1
Department of Electrical and Computer Engineering, School of Engineering, Hellenic Mediterranean University, 71410 Heraklion, Greece
2
Institute of Electronic Structure and Laser, Foundation for Research and Technology-Hellas, 71110 Heraklion, Greece
3
Qingdao Innovation and Development Center, Harbin Engineering University, Qingdao 266000, China
4
Department of Materials Science and Engineering, University of Crete, 70013 Heraklion, Greece
5
Institute of Science and Technology of Carbon (INCAR), National Council for Scientific Research (CSIC), Apartado 73, 33080 Oviedo, Spain
6
Department of Electronic Engineering, Hellenic Mediterranean University, 73100 Chania, Greece
*
Authors to whom correspondence should be addressed.
Submission received: 21 January 2026 / Revised: 18 February 2026 / Accepted: 25 February 2026 / Published: 3 March 2026
(This article belongs to the Section Carbon Materials and Carbon Allotropes)

Abstract

Conventional carbon-based electrodes like graphene are limited by costly, energy-intensive synthesis that rely on non-renewable precursors, challenging their scalability. While biomass-derived carbons (biochar) are a promising green alternative, achieving state-of-the-art performance typically requires chemical activation. Developing high-performance biochar through simple, scalable, and green pathways therefore remains a key challenge. In this work, we present a comprehensive physicochemical characterization of activation-free biochar derived from walnut, carob, rice husk and coffee via simple pyrolysis. Surface area, porosity and structural disorder were systematically analyzed to identify the key parameters governing ion interaction and charge storage. The results reveal a strong dependence of biochar properties on biomass type, with pronounced differences in accessible porosity and defect density. Among the materials studied, walnut-derived biochar combined a high specific surface area (1146 m2/g) with a high degree of structural disorder, highlighting the critical role of defects in enhancing ion adsorption and charge-transfer processes. Electrochemical measurements illustrated the functional implications of these intrinsic characteristics. Overall, this work demonstrates that carefully selected, unprocessed biomass can serve as a direct, low-cost source of functional carbon electrodes, providing insight into the parameters that dictate their electrochemical behavior and enable broader functional potential.

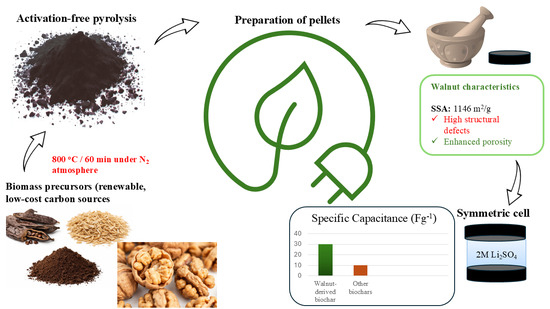
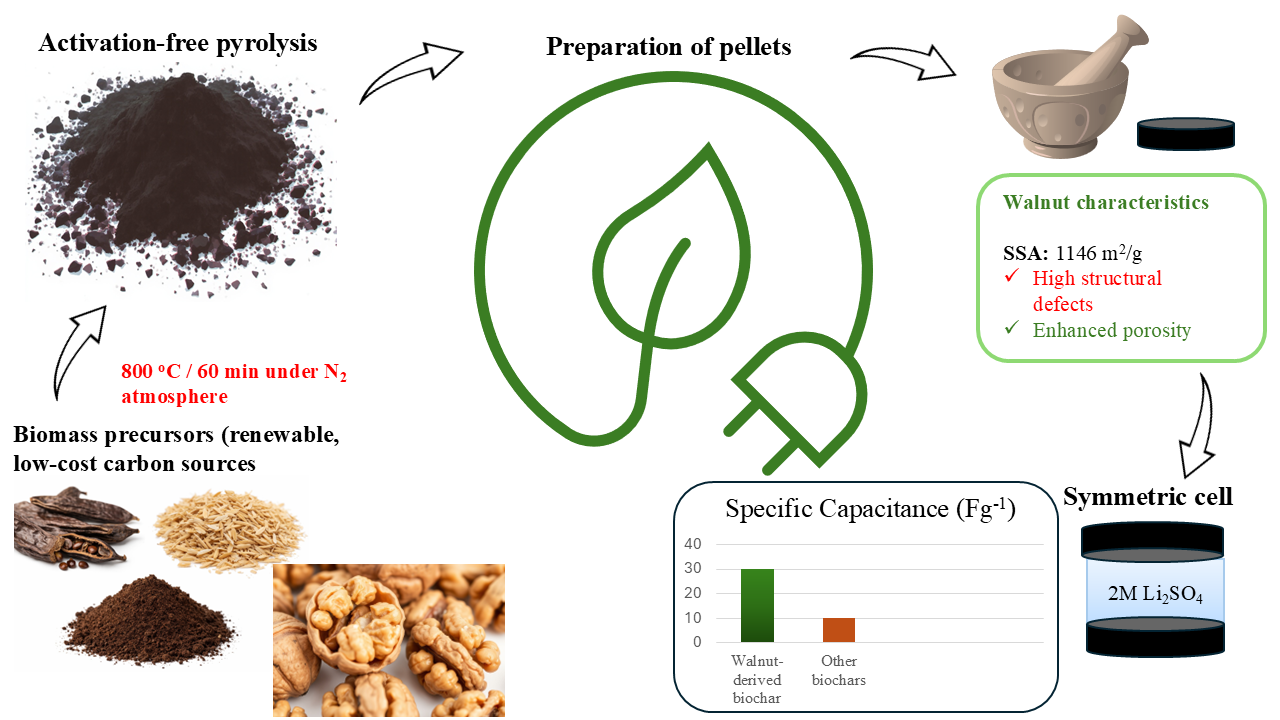
Graphical Abstract

1. Introduction

Biochar is a carbon-rich material obtained through the thermochemical decomposition of biomass in low-oxygen environments. It presents a compelling blend of environmental sustainability, economic viability, and material versatility, offering an alternative to conventional carbon materials such as graphene, carbon nanotubes and graphite, which typically require high-temperature processing and non-renewable precursors.
Biochar can be produced from numerous types of waste biomass such as lignin [1], cellulose [2,3], chitin [4], raw wooden residues [5] and agricultural residues [5] giving it a circular and sustainable alternative to traditional carbon materials. It is typically generated through pyrolysis of biomass at 350–700 °C without oxygen or with a limited oxygen supply [6]. During pyrolysis, physical activation occurs through the exposure to CO2 or H2O [7], while chemical activation involves the use of KOH solution [8,9]. Depending on the biomass type and pyrolysis temperature, there is a significant impact on the surface area of biochar with a broad size distribution [10], which can be advantageous in any application. For instance, low-temperature biochar (<500 °C) tends to retain more oxygen-containing groups, contributing to higher dielectric properties and surface chemical functionality, but with limited graphitic ordering [11]. On the contrary, high-temperature biochar (>600 °C) enhanced the size of conjugated domains, interlayer spacing, and defect density, while the effect of surface area and porosity was less pronounced [11,12]. Intermediate temperatures (520 °C) can offer a balance between structural ordering and porosity, resulting in materials with both high surface area and partially ordered carbon domains. Furthermore, the influence of biomass type became evident, as rice husk-derived biochar improved phase-change enthalpy and stability at 700 °C due to their stable porous structure, while walnut shell-derived biochar suffered from structural collapse and reduced performance at the same temperature [13]. Therefore, while biochar presents a promising green alternative, state-of-the-art performance has been achieved through chemical activation routes. This multi-step process increases production costs, energy consumption, and environmental impact, thereby offsetting the intrinsic sustainability of using biomass. A critical challenge, therefore, is to develop high-performance biochar through a simpler, scalable, and truly green manufacturing pathway.
In this study, we focus on the systematic characterization of activation-free biochar derived from four distinct and locally available feedstocks:
  • Walnut shells and carob residues: Chosen for their high lignin content, which is known to promote the formation of more graphitic, conductive carbon structures upon pyrolysis [14,15].
  • Rice husks: Selected for its high silica and ash content, which can act as a natural template to create a stable, microporous framework [16].
  • Spent coffee grounds: Investigated for their unique nanostructure, which can facilitate improved ion diffusion pathways [17].
During pyrolysis, biomass was converted to biochar solely through thermal treatment under a N2 atmosphere. After pyrolysis, samples underwent mild HCl wash (0.1 M, 200 mL) purely to reduce ash content. No external chemical agents (e.g., KOH) were used, confirming their classification as non-activated biochar.
This work moves beyond the conventional focus on maximizing surface area. Instead, we conduct a fundamental investigation into the synergistic relationship between specific surface area, accessible porosity, and structural defects. While the primary focus is on biochar structure and properties, their electrochemical behavior is also evaluated as an illustration of the functional implications of these characteristics. We demonstrate that a high density of structural defects, which can be tailored by biomass selection, is a critical and often overlooked factor that enhances ion adsorption and promotes charge transfer, making these materials relevant for applications like supercapacitors [18,19,20,21]. By correlating the physicochemical properties of these activation-free biochars with their electrochemical performance, we aim to show that biomass selection and controlled pyrolysis can produce high-quality biochar without the need for additional chemical activation, reducing both energy input and environmental impact. This approach not only highlights the potential of locally available biomass to yield carbon materials with tailored properties but also reinforces the role of detailed structural and chemical characterization in guiding sustainable material design for energy-related and other functional applications.

2. Materials and Methods

2.1. Materials

The soft part of the walnut shell was collected from local producers in Chania, Crete. Carob-processing residues were obtained from the company Creta Carob, in Rethymno, Crete, Greece. Rice husks were received from a rice processing industry in Hanoi, Vietnam. Spent coffee grounds were collected from a local coffee shop in Chania, Crete, Greece. All materials were air-dried for several days and then ground to <1 mm particle size (except for coffee grounds, which did not require milling) using a conventional knife mill.

2.2. Pyrolysis Process and Post-Treatment of Activation-Free Biochars

Pyrolysis was conducted at 800 °C for 60 min under a N2 atmosphere (0.5 L/min flow rate), in a Carbolite ELF chamber furnace (Neuhausen, Germany). The pre-weighed biomass samples were placed inside porcelain crucibles. After pyrolysis, the crucibles were allowed to cool down, and the biochar recovered and weighed. The biochar yield was calculated as shown in Equation (1):
Y i e l d % = w e i g h t   o f   b i o c h a r   ( g ) w e i g h t   o f   b i o m a s s   ( g ) × 100
Each biochar sample was washed with 0.1 M HCl (200 mL) to reduce the ash content (standard purification process), followed by rinsing with distilled water until pH 7 and drying at 105 °C for 12 h. The yields were 31.8%, 32.2%, 32.4%, 11.2% for walnut-, carob-, rice husk-, coffee-derived biochar, respectively.

2.3. Charactrerization Methods

Τhe morphology of the different biochar samples was investigated using Scanning Electron Microscopy (SEM, JEOL 7000, by Thermo Fisher Scientific- Neuhofstrasse 11, 4153 Reinach TechCenter, 4153 Basel, Switzerland) operating at an accelerating voltage of 15 kV, to analyze the surface features. X-ray diffraction (XRD) analysis was performed using a powder X-ray diffractometer (Cu Kα graphite, λ = 1.5406 Å) operating at 40 kV/15 mA with a Kβ foil filter (by Rigaku Europe SE-Hugenottenallee 167 Neu-Isenburg 63263, Germany). Speed scanning for all samples was 4°/min. Raman measurements were performed at room temperature (RT) using a Horiba (Kyoto, Japan) LabRAM HR Evolution confocal micro spectrometer, in backscattering geometry (180°), equipped with an air-cooled solid-state laser operating at 532 nm with 100 mW output power. The laser beam was focused on the samples using a 10× Olympus microscope objective (numerical aperture of 0.25), providing 20 mW of power on each sample. A monochromatic Al-Kα source was utilized for X-ray photoelectron spectroscopy (XPS) measurements in Flex Mod (SPECS- SPECS Surface Nano Analysis GmbH Volta Strasse 5, 13355 Berlin, Germany) with X-ray source XR-50 and 15 kV/200 W. Nitrogen adsorption–desorption isotherms were obtained using an Anton Paar Autosorb 6100 instrument (Boynton Beach, FL, USA) at 77 K. The prepared chars were loaded in a 9 mm measuring glass cell with an inner filler rod and were degassed at 250 °C for 18 h, with a heating rate of 5 °C/min. For all chars, a quantity larger than 200 mg was used to ensure accuracy (walnut 431 mg, carob 267 mg, rice husk 243 mg, and 357 mg coffee). The specific surface area (SSADFT) and pore size distribution (PSD) were derived using the Density Functional Theory (DFT) model assuming a slit-pore kernel, which provides a more realistic representation of the pore structure in microporous materials compared to classical thermodynamic methods. The limitations of the BET model for these specific samples are discussed in Section 3.1.4.

2.4. Electrode Preparation and Electrochemical Charactrerization

The fabrication of the electrodes began with the preparation of pellets composed of biochar, carbon black (average particles 13 nm and specific surface 550 m2 g−1), and PTFE-Teflon (Polytetrafluoroethylene) as a binder, in a mass ratio of 90:5:5 with the 90% biomass, 5% carbon black and 5% binder. The components were thoroughly ground in an agate mortar to obtain a fine powder. This mixture was then placed into a 1 cm diameter die and compressed under a hydraulic pressure of 500 kg to form dense electrode pellets.
The prepared electrodes were used for electrochemical analysis in a symmetric two-electrode cell configuration. A glass fiber separator soaked in 2 M Li2SO4 served as the electrolyte. The cell assembly was carried out in a sealed Teflon system equipped with stainless-steel current collectors. Electrochemical measurements were conducted using an Autolab PGSTAT302N potentiostat/galvanostat.
The specific cell capacitance was calculated by using the following formula in Equation (2) [22]:
C p = I × Δ t m × Δ v
where Cp is the specific capacitance (F/g), I: the applied current (A), Δt is the discharge time (s) obtained from the GCD curve, m is the effective mass of both electrode materials (g), and ΔV is the potential window (V).

3. Results and Discussion

3.1. Physicochemical Characterization of Activation-Free Biochars

3.1.1. Morphological and Structural Analysis

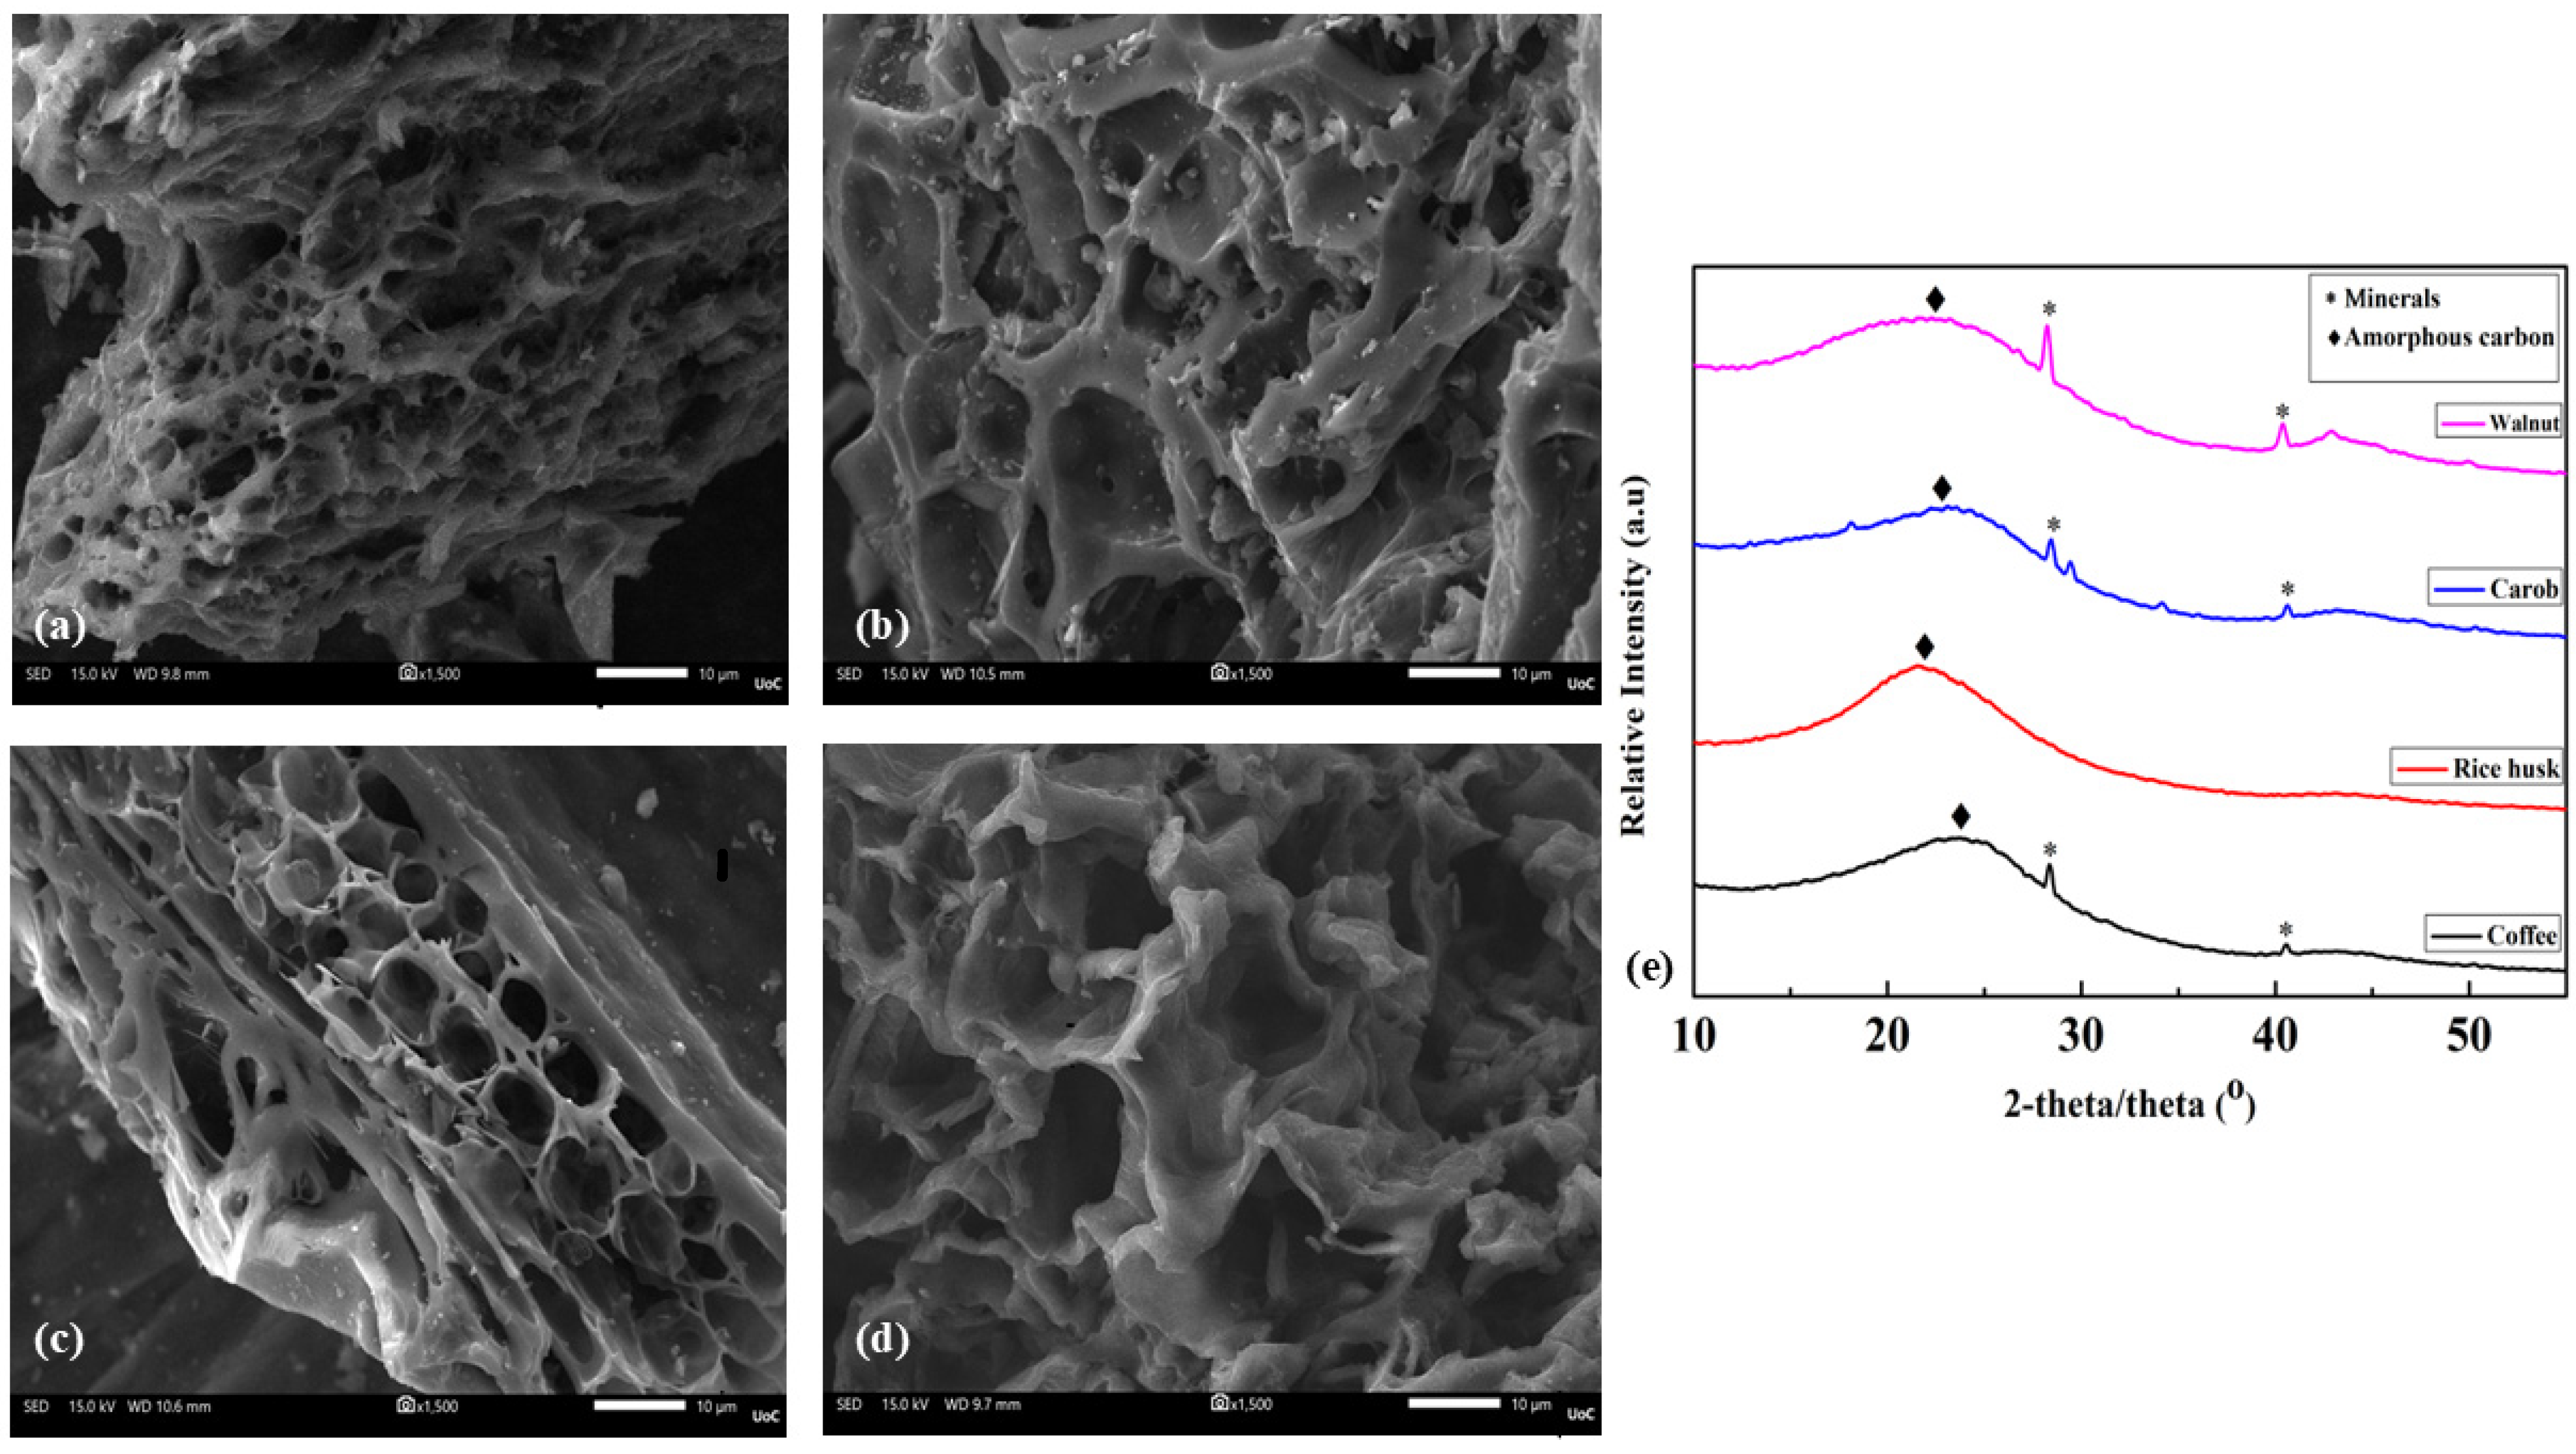
The surface morphology of the biochar samples (Figure 1) was investigated using SEM. The SEM image of walnut biochar (Figure 1a) reveals a highly irregular and heterogeneous surface with fractured layers and interconnected micro-pores. The pore structure is non-uniform, with a distribution of pore sizes ranging approximately 2–3 µm. The rough, uneven surface suggests partial breakdown during thermal conversion, resulting in a predominantly amorphous carbon matrix with no clearly defined graphitic domains. In the case of carob biochar (Figure 1b), the microstructure exhibits a well-defined open-cell architecture with large, predominantly hexagonal pores separated by relatively thin walls. The surface pores size distribution ranges 5–15 µm. The pore walls indicate good preservation of the original plant cellular framework during pyrolysis. The rice husk biochar (Figure 1c) shows a distinctly different morphology, dominated by elongated, tubular, and channel-like pores aligned in a preferred direction. This ordered and anisotropic structure reflects the preserved vascular bundles of the rice husk material. Channel diameters are approximately 2–10 µm, while the pore walls are thick ranging from 10 to 20 μm and more compact than those observed in the other samples, indicating higher rigidity and structural integrity. The coffee biochar sample (Figure 1d) displays a collapsed, sponge-like structure with large, irregular cavities and thin, wrinkled walls. Extensive folding and deformation of the cell walls are evident, resulting in a highly porous carbon network with pore sizes ranging from a few micrometers up to approximately 15–20 µm.
The XRD patterns of all biochar samples (Figure 1e) are characterized by broad diffraction peaks indicative of predominantly amorphous carbon structure. A prominent broad peak between 20 and 25° 2θ corresponding to (002) plane of graphitic-like stacked carbon layers (d ≈ 3.85 Å) [23,24], consistent with amorphous carbon pyrolyzed at 700–900 °C were expanded spacing enhances ion intercalation for electric double-layer capacitors (EDLC) [25]. The secondary broader peak in the 40–45° range, corresponding to the (100) plane (d ≈ 2.10 Å), reflected in-plane disorder typical of biomass-derived carbons [26,27].
Interplanar d-spacings were calculated using Bragg’s law [27], Equation (3):
n λ = 2 d s i n θ
where λ = 0.15406 nm (Cu Kα) and n = 1 (Table 1). The rice husk-derived biochar displays a distinct pattern, with (002) peak shifted to 22.8° (d = 3.90 Å) and an additional peak at 21.0° (d = 4.22 Å) assigned to SiO2, reflecting silica interference that disrupts regular carbon stacking following post-0.1 M HCl washing. In contrast, walnut, carob, and coffee biochar show two additional sharp peaks at 28.4° (d = 3.14 Å) and 40.5° (d = 2.22 Å) (marked *), assigned to calcite-type CaCO3 (Crystallography Open Database COD #7000017, d_ {104} = 3.035 Å) with minor phosphate minerals contribution (~0.2 wt.% P) [28]. The calculated d-spacings (Table 1) were validated using free tools: COD [29] and XRDCALC [30,31] with top 3 d1,2,3 = 3.86/3.14/2.22 Å confirming calcite and amorphous carbon in walnut-derived biochar. The substantial differences in amorphous phase characteristics (Table 1) stem from biomass composition and pyrolysis effects (Gaussian peak fitting). Walnut-derived biochar displays the broadest (002) peak (FWHM = 8.5° at 23.0°), indicating maximum structural disorder due to lignin-dominated (40 wt.%) random aromatic stacking during pyrolysis. These yields expanded interlayer spacing (d = 3.86 Å vs. graphite 3.35 Å), creating abundant defect sites for ion adsorption [32]. Rice husk biochar exhibits the narrowest (002) peak (FWHM = 5.2° at 22.8°), forming most ordered, tubular carbon frameworks (Figure 1c) templated by silicon (21.0°, d = 4.22 Å), limiting defect density, but enhancing structural integrity [33]. Carob and coffee-derived biochars show intermediate disorder (FWHM = 6.8° and 7.2°), reflecting balanced cellulose/lignin content and partial pore collapse during pyrolysis of softer biomasses. Quantification of minerals (peak decomposition against calcite standard COD 7000017 [28]) reveals calcite (CaCO3) and traces of phosphates in lignocellulose biochar (walnut, carob, and coffee), which remain after washing with HCl (walnut ash: 26.6 → 8.2 wt.%, yield 31.8%, correlating with walnut’s porous SEM structure (Figure 1a)) probably due to (i) protection of micropores within the particles (<2 nm), (ii) recrystallization during drying at 105 °C (atmospheric CO2), (iii) stability of phosphate salts–mechanisms that have been documented for walnut-derived biochar [28]. These amorphous-mineral synergies (d-spacing expansion, disorder gradations) set the stage for quantitative structural analysis and electrochemical evaluation below, where structural disorder often dictates the capacitance.

3.1.2. Raman Spectroscopy Analysis

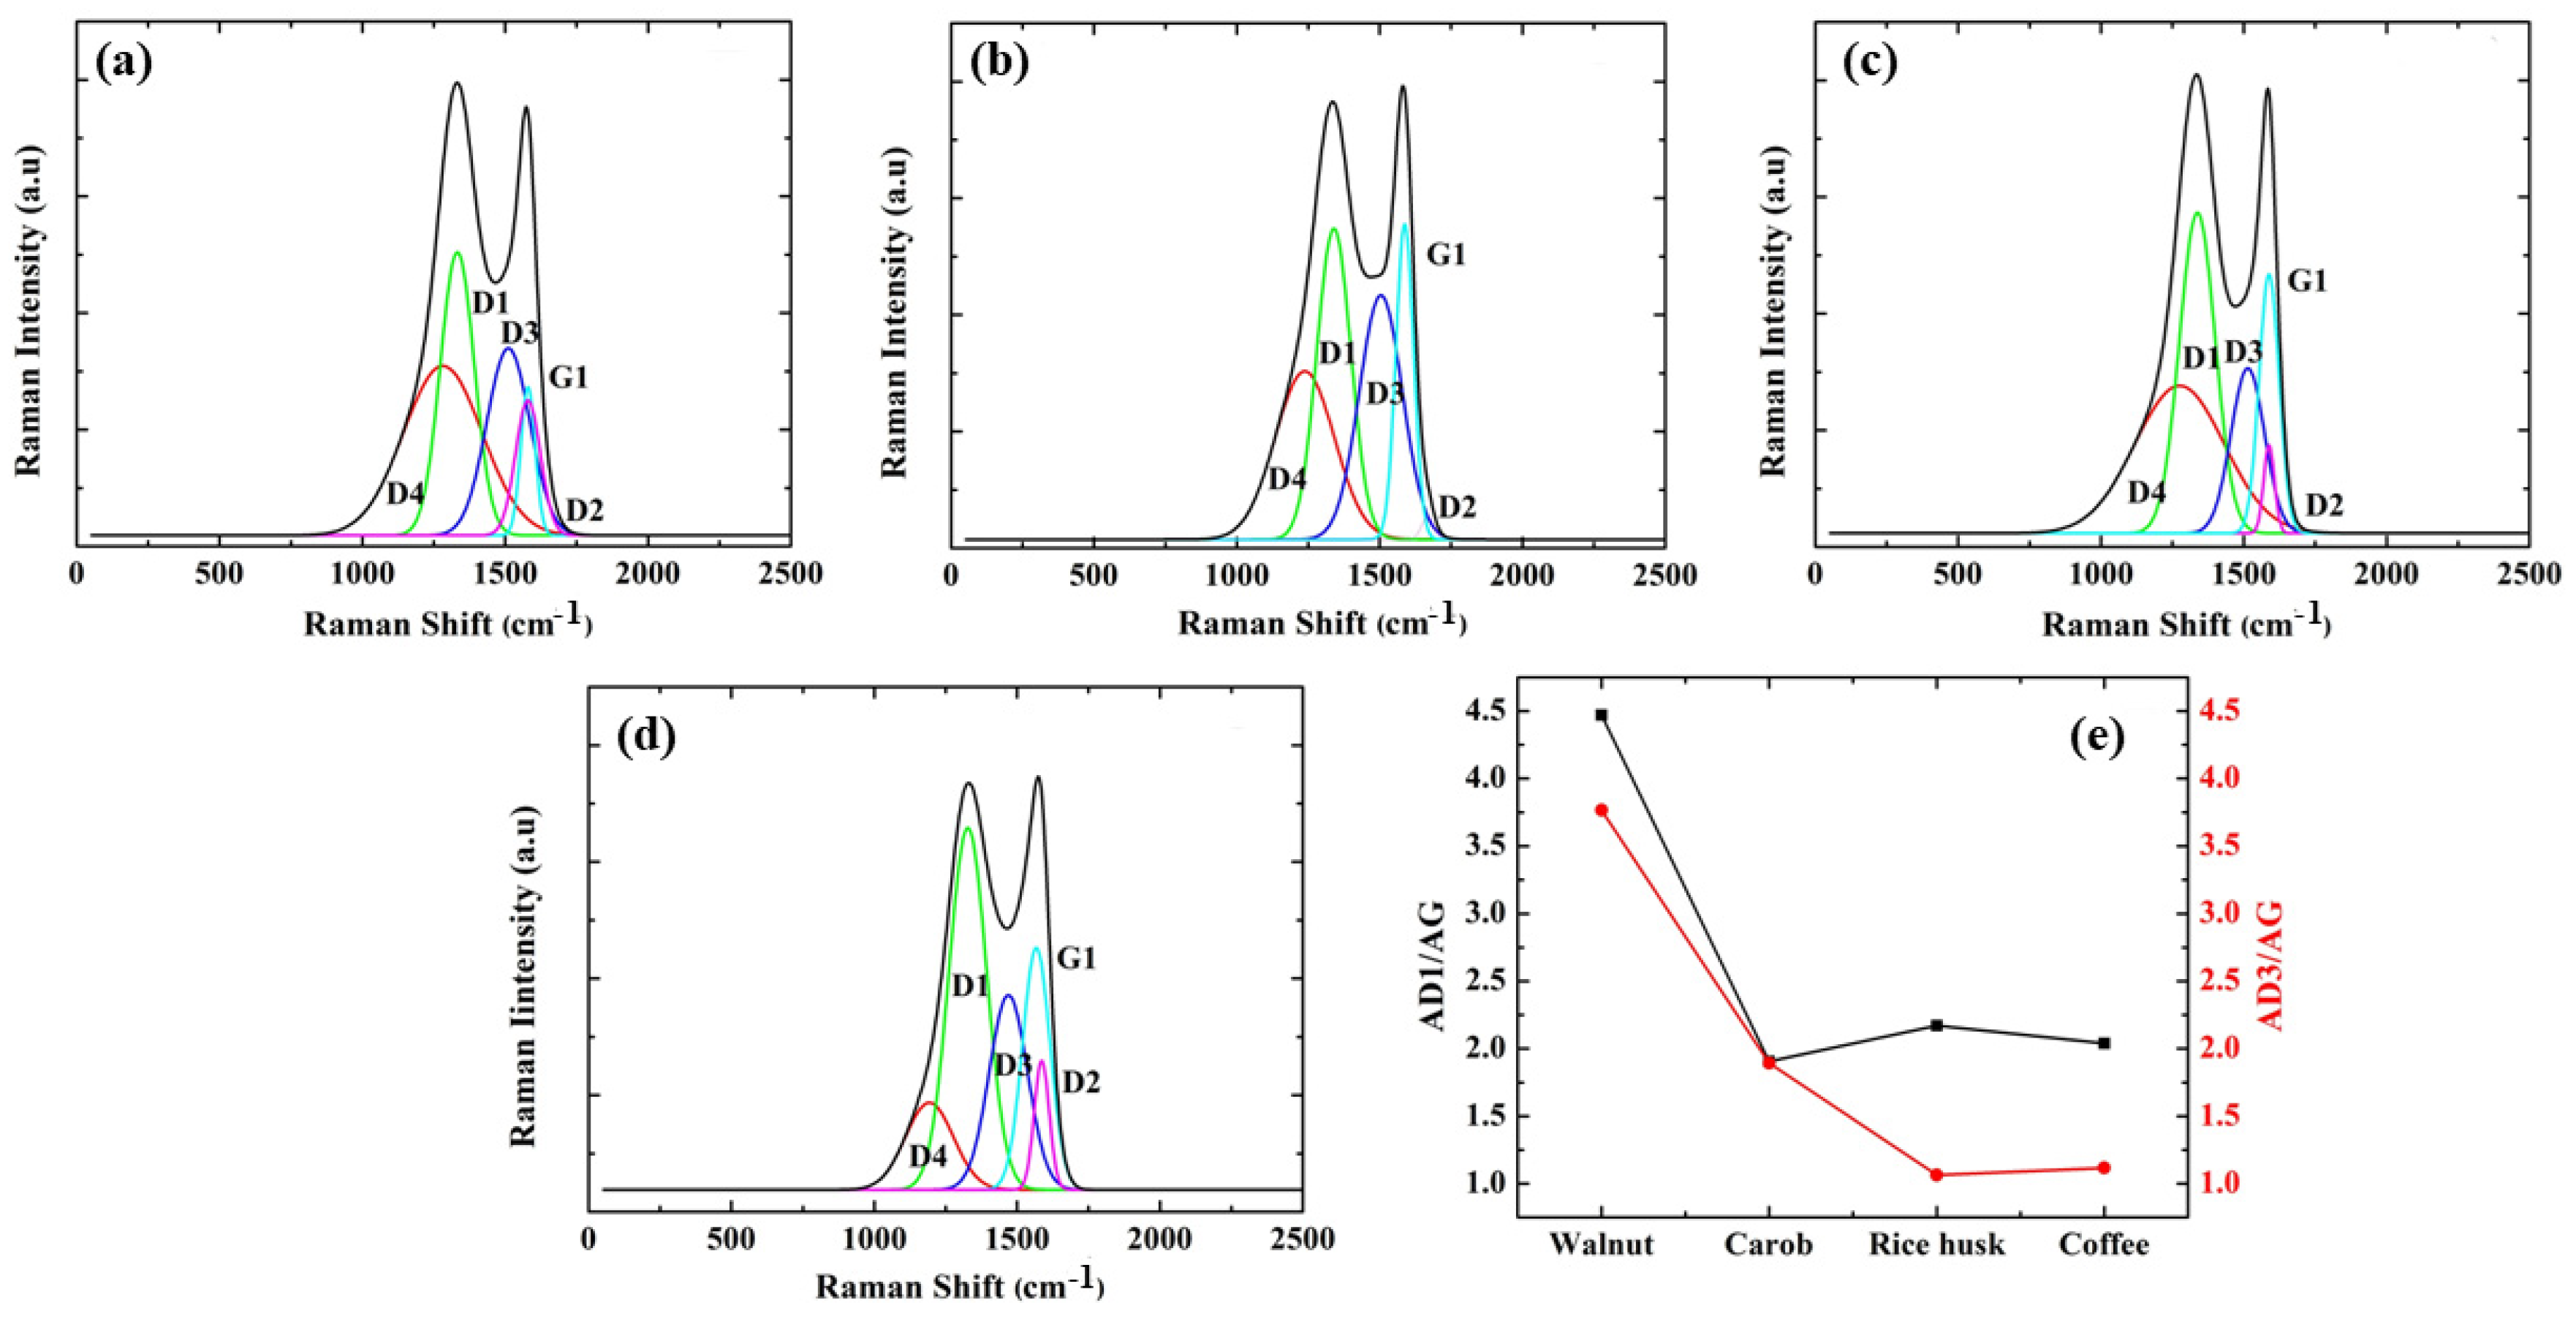
To probe the atomic structure and degree of disorder in the biochar, Raman spectroscopy was employed (Figure 2a–d). All spectra were deconvoluted using a five-band fitting model to quantify the contributions of ordered and disordered carbon structures. The analysis focuses on the two key area ratios derived from the integrated intensities of the deconvoluted peaks (Figure 2e): the ratio of the D1 band (disordered graphitic rings) to the G band (ideal graphitic vibrations), denoted as AD1/AG (black line), which reflects the level of defects within the graphitic structure [34,35], and the ratio of the D3 band (amorphous carbon) to the G band, denoted as AD3/AG (red line), which provides insight into the proportion of amorphous content. The analysis of these ratios revealed distinct structural differences among the samples [36,37,38,39,40,41].
The walnut-derived biochar (Figure 2a) exhibits the highest AD1/AG and AD3/AG ratios (Figure 2e), indicating a highly disordered carbon structure with the highest density of defects. In contrast, carob-derived biochar (Figure 2b) shows a significantly lower AD1/AG ratio (Figure 2e), suggesting a more ordered structure; notably, its AD1/AG and AD3/AG ratios are nearly equal, implying similar contributions from both graphitic defects and amorphous carbon. Finally, the rice husk (Figure 2c) and coffee-derived biochar (Figure 2d) display the lowest ratios overall (Figure 2e). For these samples, the AD1/AG ratio is higher than the AD3/AG ratio, which suggests that they are the most structurally ordered materials, with disorder originating primarily from defects in graphitic domains rather than from a significant amorphous phase.

3.1.3. Surface Element Composition and Chemical States

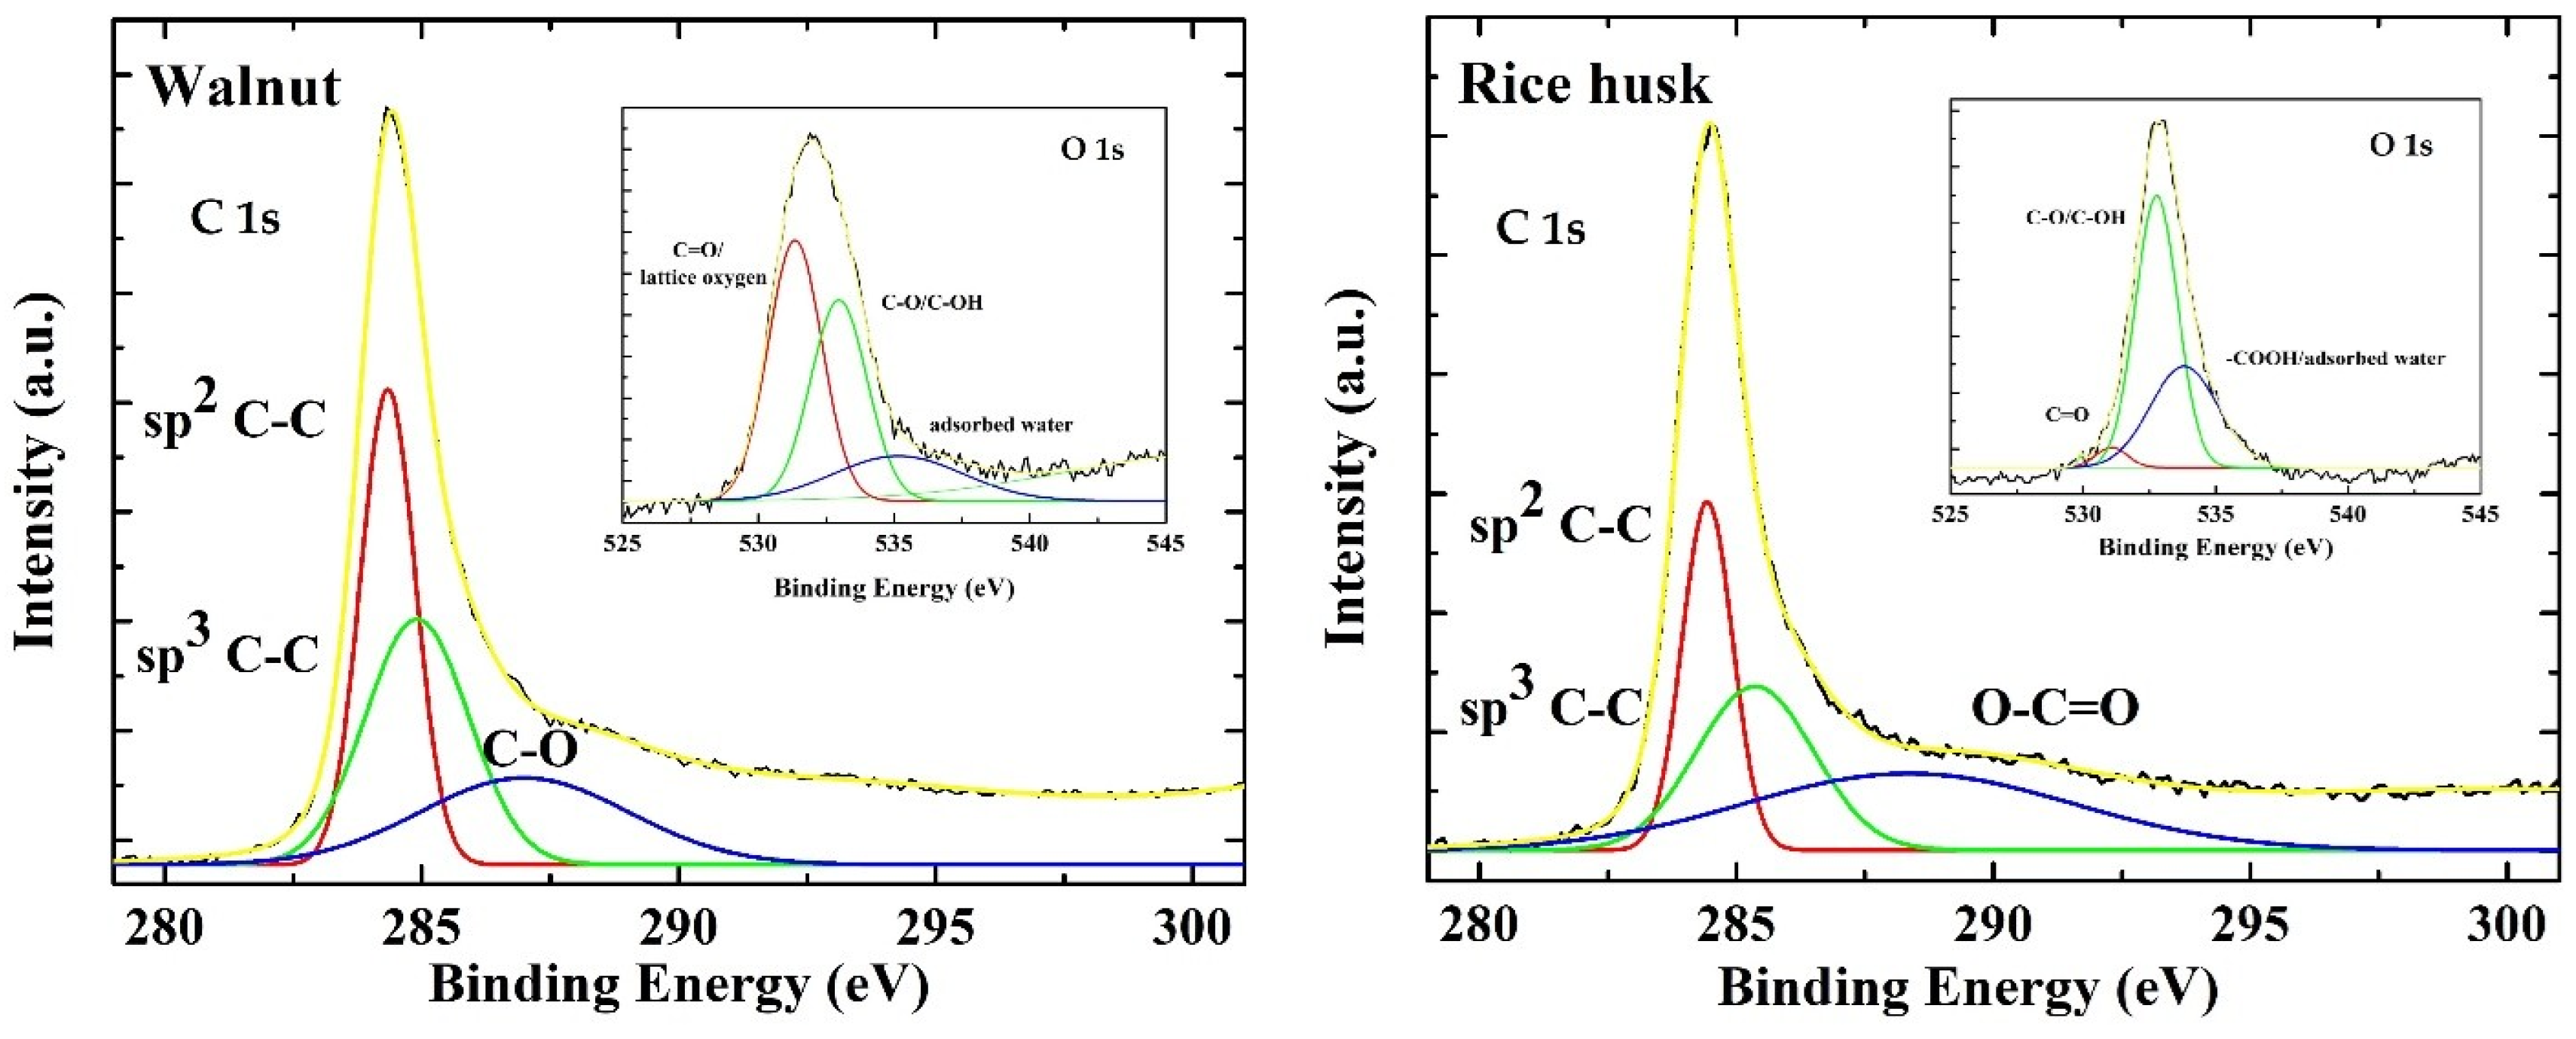
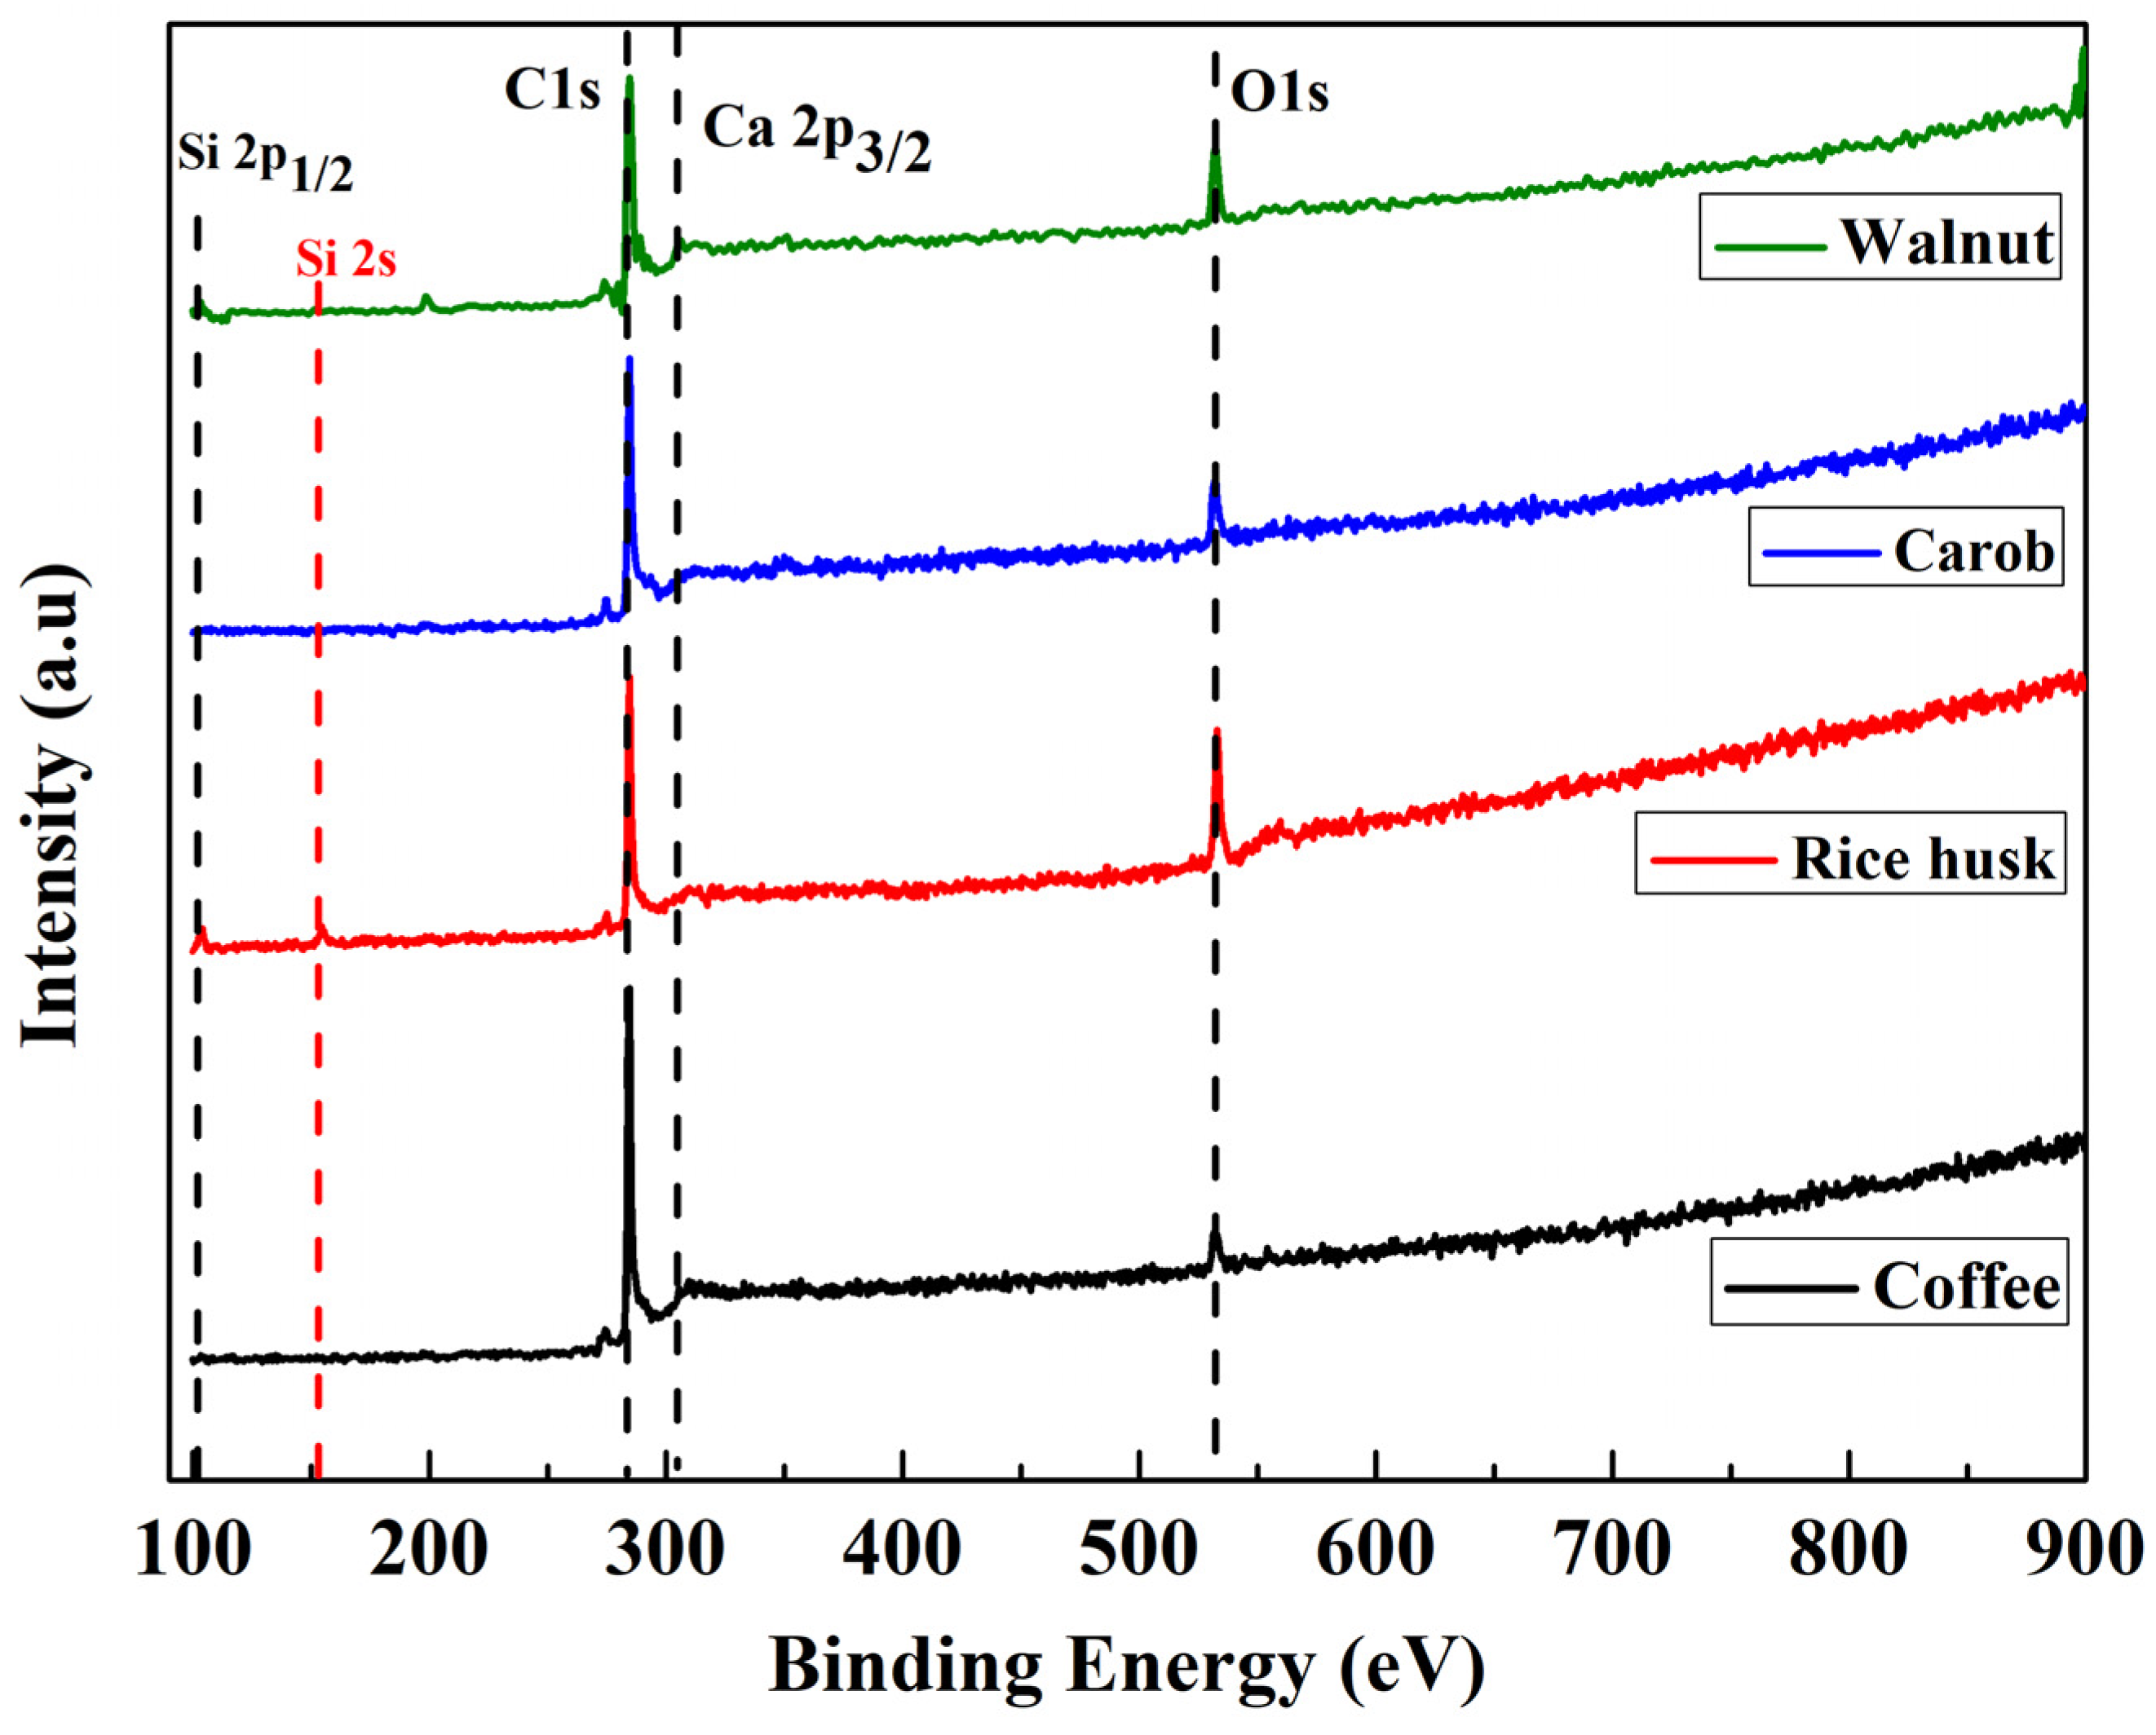
XPS analysis (Figure 3) was used to investigate the surface chemistry of walnut- and rice husk-derived biochar, which were deliberately chosen for their distinct structural and compositional characteristics. By focusing on these two materials, we aimed to capture the extremes of the biochar characteristics within our study, obtaining insights into how the biomass type influences surface chemistry. Before discussing the detailed analysis of C 1s and O 1s spectra, it is useful to consider the full survey scans of all four biochar (Figure A1). Notably, the walnut shell-derived biochar exhibited distinct peaks corresponding to calcium (Ca 2p3/2 at ~347.37 eV) [42], which were absent in the biochar derived from carob, rice husk and coffee. These observations are consistent with XRD results (Figure 1e), which identified the presence of mineral phases in the walnut biochar. The presence of Ca can be attributed to the naturally higher mineral content of walnut shells, enriched during pyrolysis. It can act as a pore-forming agent during pyrolysis, enhancing the specific surface area [43]. Furthermore, the XPS analysis (Figure A1) detected traces of silicon (Si 2p1/2 at ~100 eV and Si 2s at ~150 eV) [44] on the rice husk biochar, in agreement with the XRD findings. Silicon, typically found in plant-derived biochar, may stabilize the carbon structure and preserve porosity [45]. In contrast, carob and coffee biochars show primarily carbon- and oxygen-based functionalities, reflecting their lower inherent mineral content and the dominance of the organic matrix. This comparison indicates that walnut and rice husk biochar possess a more complex surface chemistry, combining both organic functional groups and inorganic elements. Nitrogen was not analyzed because the nitrogen content in all biomasses is very low and eliminated (i.e., volatilized) during pyrolysis.
Walnut-derived biochar. The high-resolution C 1s spectrum of walnut-derived biochar was deconvoluted into the following three peaks: sp2 C-C (284.3 eV), sp3 C-C (284.9 eV) and C-O (286.0 eV) similar to that found in the literature [46,47,48]. The O 1s spectrum showed peaks at 531.35 eV (C=O/lattice oxygen), 532.9 eV (C-O/C-OH), and 535.26 eV (adsorbed water) [43]. While the C-O peak in C 1s corresponds well to the 532.9 eV O 1s peak, the carbonyl and carboxyl species observed in O 1s are not fully resolved in C 1s due to their low abundance and overlapping with the C-O signal. This mismatch reflects the higher sensitivity of O 1s to minor oxygen-containing groups, highlighting the heterogeneous surface chemistry of the walnut shell biochar. The area ratio between the sp2 and sp3 hybridized carbon is a key metric, where a higher sp2 content indicates more graphitic and conductive characteristics, while a higher sp3 content corresponds to structures with higher degree of disorder [49,50]. For the walnut-derived biochar, the sp2/sp3 area ratio was equal to 1, indicating an equal contribution from both carbon types. This contrasts with the Raman spectroscopy results, which suggested a highly disordered structure. The discrepancy highlights Raman’s sensitivity to the quality and arrangement of the sp2 domains themselves, which can be highly defective even when the overall sp2/sp3 ratio is balanced [51].
Rice husk-derived biochar. Similarly, the C 1s spectrum for the rice husk-derived biochar showed contributions from sp2 and sp3 carbon, along with an additional peak for O-C=O (288.3 eV), indicating a more oxidized surface due to the presence of carboxylic or ester groups (46–48). The O 1s spectrum exhibited peaks at 530.8 eV, 532.8 eV, and 534.1 eV, corresponding to carbonyl/lattice oxygen (C=O), hydroxyl/ether groups (C-O/C-OH), and carboxyl/adsorbed water (-COOH/H2O), respectively [47]. Similar to the walnut shell biochar, the O-C=O peak in C 1s corresponds broadly to the 534.1 eV O 1s peak, but the minor carbonyl and hydroxyl species detected in O 1s are not fully resolved in C 1s due to low abundance and signal overlap. This indicates that the rice husk-derived biochar possesses a more oxidized surface compared to the walnut shell biochar, with diverse oxygen functionalities alongside graphitic domains. Its sp2/sp3 ratio was 0.91, suggesting a slightly higher proportion of disordered sp3-hybridized carbon on the surface. This result is particularly interesting when compared to its Raman analysis, which showed the lowest AD1/AG and AD3/AG, corresponding to the most ordered graphitic structure among all samples. This apparent contradiction is well-explained by the complementary nature of the techniques: XPS, being highly surface-sensitive, reveals a disordered surface, while Raman probes the bulk material, which in this case possesses more structurally ordered sp2 domains.

3.1.4. Textural Properties and Porosity Analysis

The textural properties of the prepared biochar investigated by N2 physisorption at 77 K. An initial analysis using the BET model revealed significant limitations. Specifically, when applying the BET equation within the standard relative pressure range (p/p0 = 0.05–0.3), all samples resulted in physically meaningless negative C constants. This outcome is characteristic for materials exhibiting Type I isotherms, where micropore filling dominates over the layer-by-layer adsorption mechanism assumed by BET theory. Such limitations are well-documented in the literature, and IUPAC explicitly advises against using the BET model for accurately determining surface areas in microporous carbonaceous materials [52]. To obtain positive C constant, the pressure range had to significantly reduce (p/p0 < 0.05), further highlighting the model’s unsuitability. Given these challenges, and in line with current best practices, DFT regarded as a more accurate and reliable method for evaluating both the SSA and PSD in complex porous carbons [53]. Accordingly, all subsequent discussions and correlations are based on the DFT-derived specific surface area (SSADFT).
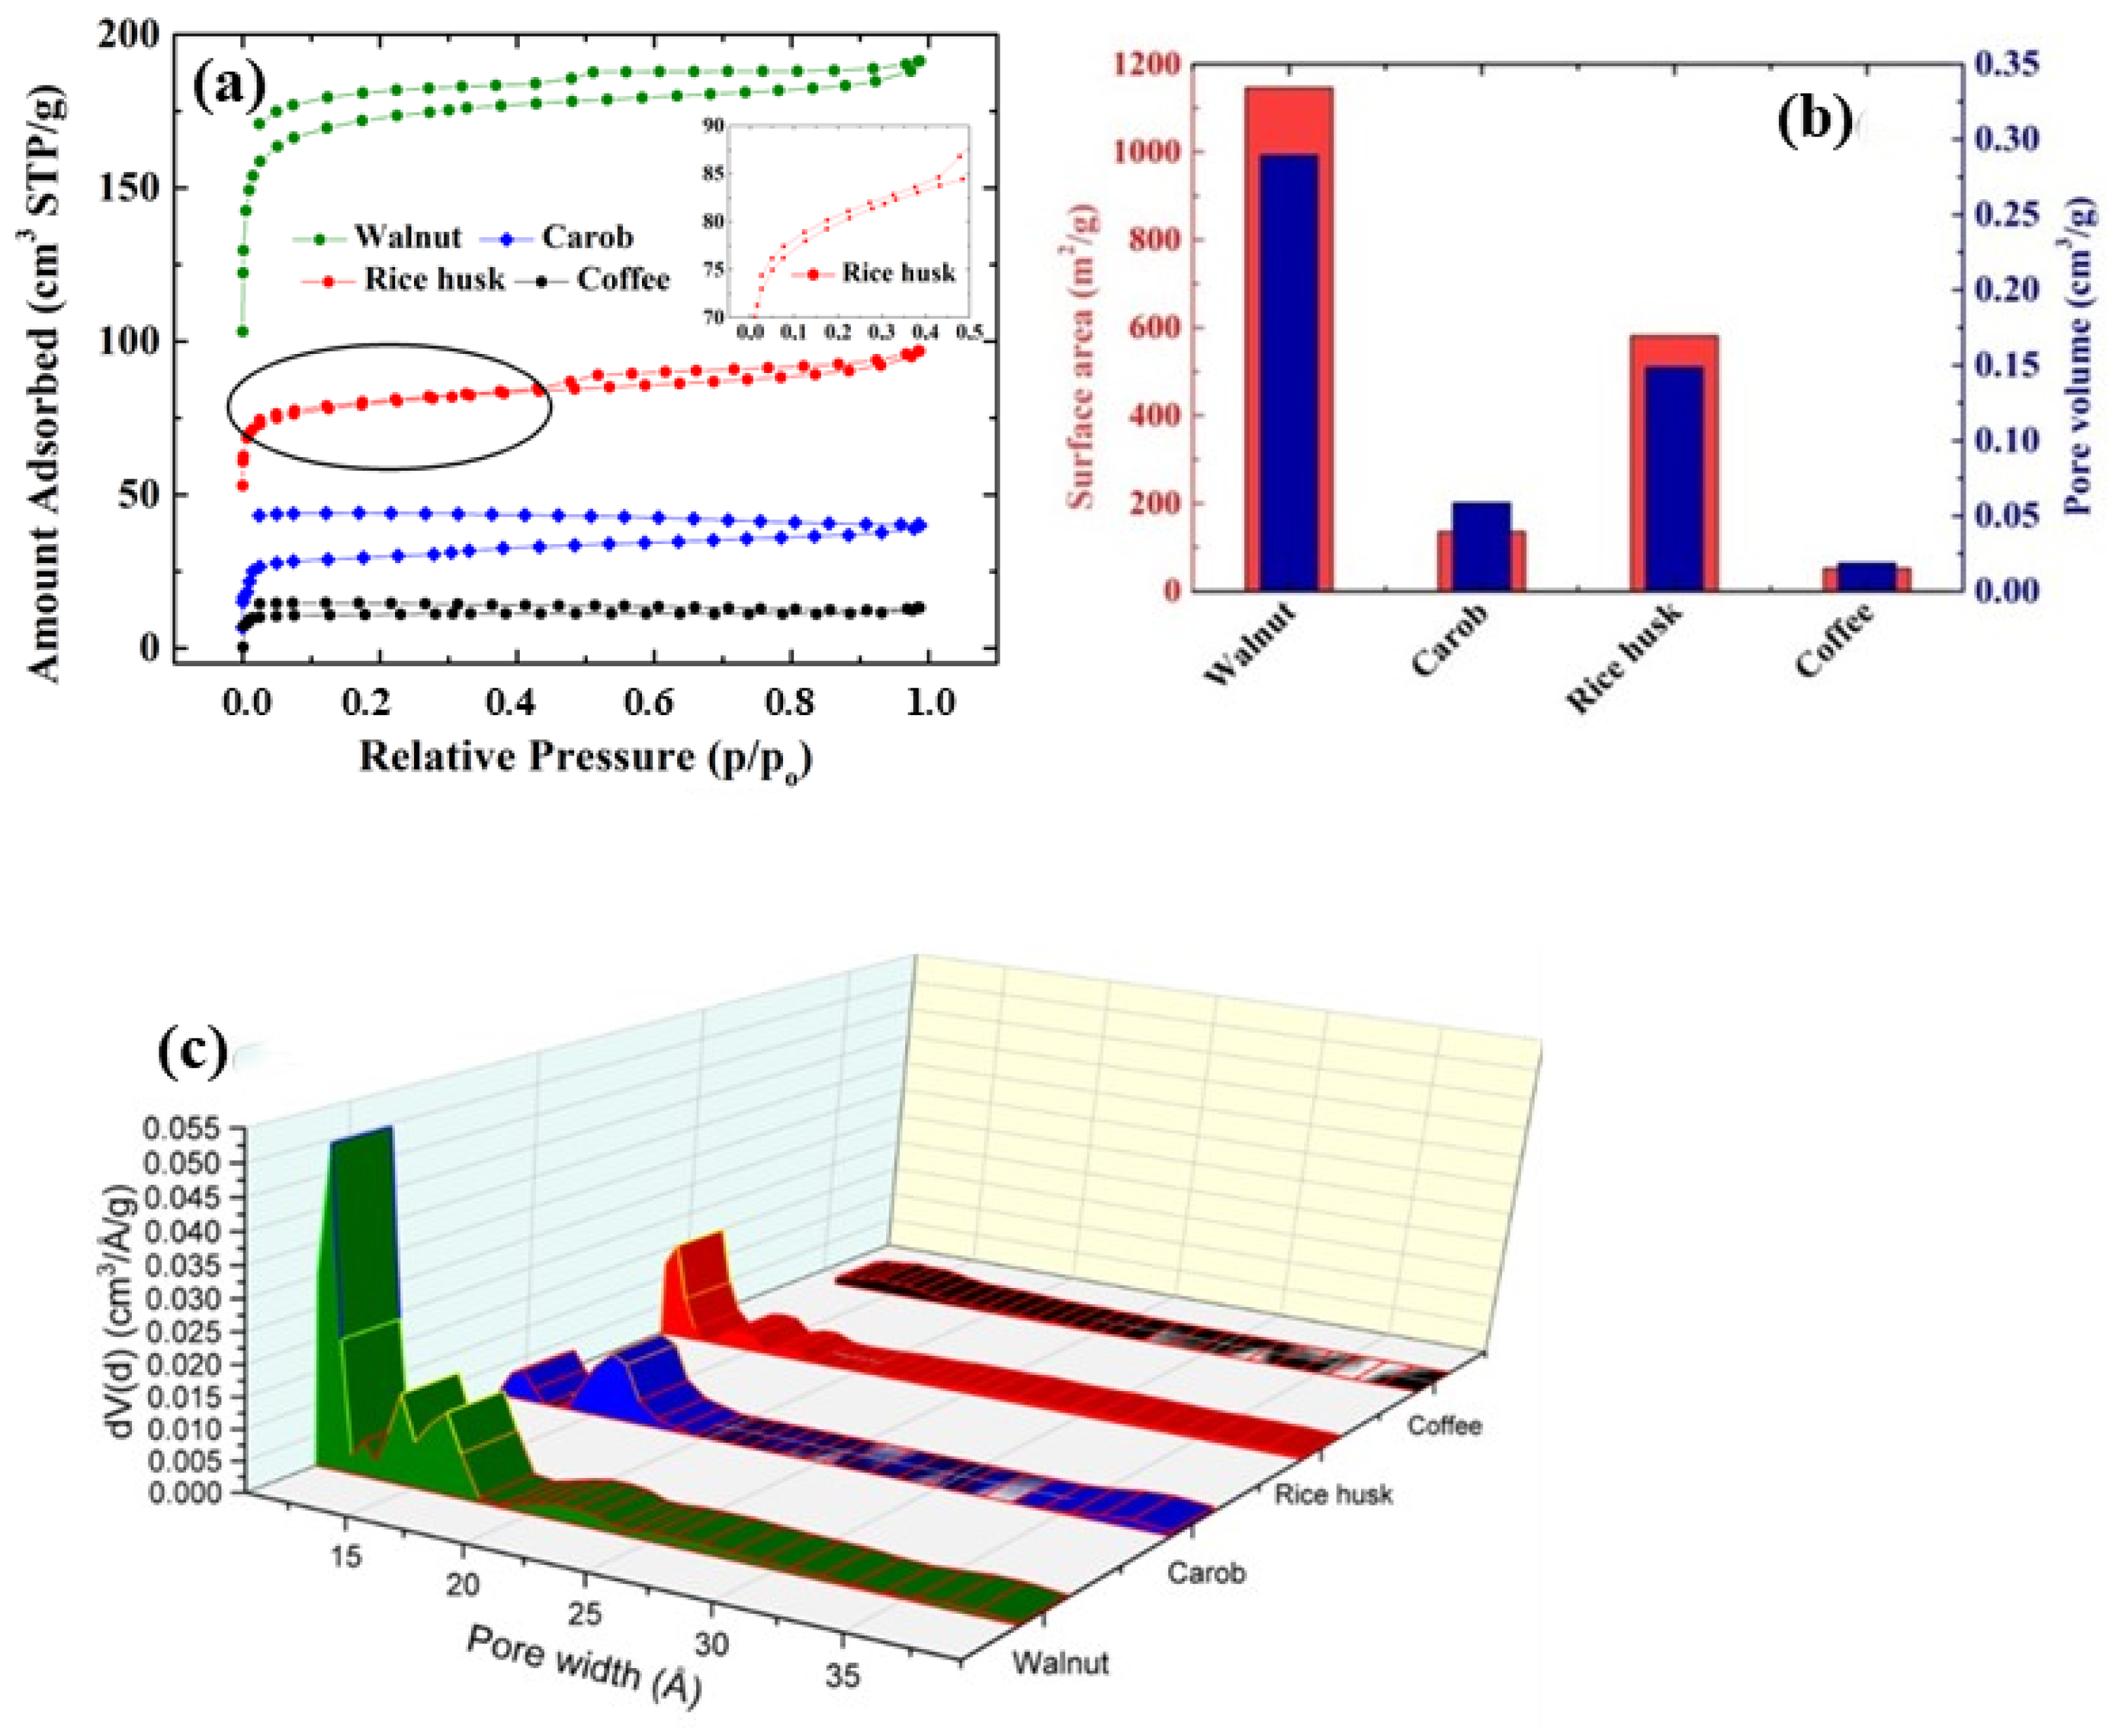
The N2 adsorption isotherms for all samples (Figure 4a) confirmed their microporous nature, exhibiting Type I characteristics, where a sharp uptake at low relative pressures indicates micropore filling. However, a distinct hysteresis loop is observed, particularly for the rice husk-derived biochar. The degree of openness in the N2 adsorption–desorption hysteresis loops reflects differences in pore structure and preservation of the original biomass framework among the biochar. Carob biochar, with large open hexagonal pores (5–15 μm, Figure 1b), exhibits the most open loop, indicating extensive meso porosity and well-preserved structure. Walnut, with irregular layers and interconnected micropores (2–3 μm, Figure 1a), shows a moderately open loop. Coffee, with collapsed, sponge-like pores (Figure 1d), has a narrower loop, while rice husk, with tubular channels and thick, compact walls (2–10 µm, Figure 1c), shows the tightest loop, consistent with a rigid, highly carbonized framework. This ‘open-loop’ behavior (low-pressure hysteresis) for rice husk suggests the presence of constricted microporosity or ‘inkbottle’ shaped pores, where nitrogen molecules are trapped within the narrow graphitic interlayers or silica-carbon interfaces, hindering complete desorption. This aligns with the complex morphology observed in SEM (Figure 1c), indicating that ion accessibility may be diffusion-limited despite the available surface area.
Figure 4b summarizes the DFT-derived specific surface area (SSADFT) and total pore volume. The walnut-derived biochar demonstrated the highest values (1145 m2/g and 0.29 cm3/g, respectively), significantly outperforming the other biomass sources.
To provide a deeper insight into the porous architecture, the evolution of the pore size distribution (PSD) [54] presented in Figure 4c. This 3D plot of differential pore volume (dV(d)) versus pore width reveals that the walnut-derived biochar (green profile) characterized by a sharp, intense peak in the ultra-microporous region (10–20 Å or 1–2 nm). This confirms that the majority of its surface area originates from fine micropores, which are critical for ion adsorption. In contrast, the rice husk sample (red profile) shows a much lower peak intensity with a broader distribution, indicating a less developed microporous network, while carob and coffee biochar exhibit negligible porosity in this active range.
Among the investigated samples, the walnut-derived biochar emerges as the top-performing material, exhibiting the highest SSADFT (1146 m2/g) and the largest pore volume (0.29 cm3/g). This result is in direct agreement with the Raman analysis, which indicated that this sample possesses the greatest structural disorder and the highest density of defects among all materials (the highest AD1/AG and AD3/AG ratios). The high specific surface area attributed to the interplay of the intrinsic biomass structure, chemical composition, and volatile content of walnut shells. The combination of a rigid lignin-dominated architecture (micro- and macro-porosity) and volatile content (~60–65%) explains the superior porosity [55] expecting to provide abundant sites for ion adsorption and facilitate efficient charge transfer. In addition, the presence of calcium species, detected by surface analysis in XPS (Figure A1), may further contribute to pore development, as Ca-containing minerals can function as in situ activating agents during pyrolysis, enhancing the specific surface area [43].
Rice husk-derived biochar also showed high performance, with SSADFT values of 582 m2/g. Interestingly, despite showing a higher degree of structural order within its sp2 domains (lowest AD1/AG ratio), their intrinsic porous structure, largely dictated by high silica content, allows considerable surface area development even in more ordered carbon structures [55]. These silicon-based phases as confirmed from XRD (Figure 1e) and XPS (Figure A1) may act as structural stabilizers during carbonization, helping to preserve pore channels [45].
In contrast, the biochar derived from carob and coffee exhibited significantly lower SSADFT values of 135 m2/g and 52 m2/g, respectively. This finding correlates directly with the spectroscopic results, which point to a more ordered, graphitic structure (lower AD1/AG ratios). The increased structural order in these samples appears to inhibit the formation of an extensive porous network, thus drastically limiting the specific surface area. Carob residues, with intermediate lignin and volatile content, form moderately porous biochar, but lack the dense, rigid architecture of walnut shells, while coffee’s soft, spongy structure and volatile content (~65–70%) can lead to partial pore collapse during pyrolysis [56]. In contrast to walnut and rice husk samples, these biochars contain primarily carbon- and oxygen-based surface functionalities, reflecting their lower inherent mineral content and the dominance of the organic matrix as indicated in XPS.
The differences in pore size distribution observed among the biochar are due to the combined effects of biomass composition, mineral content, and carbonization behavior during pyrolysis. Lignin-containing biomass (walnut) yields a hard carbon material that preserves micropores, while biomass with high volatile content (coffee) generates pore networks that may also cause the collapse of mechanically weak structures. Inorganic components also contribute to this process, with Ca-containing compounds (walnuts) as activating agents for micropore formation, while Si-containing components (rice husk) help to maintain the carbon matrix and prevent pore contraction. Finally, increased graphitic ordering (carob and coffee) inhibits pore development, leading to low surface area for carob and coffee biochar.

3.2. Electrochemical Evaluation of Biochar-Based Electrodes

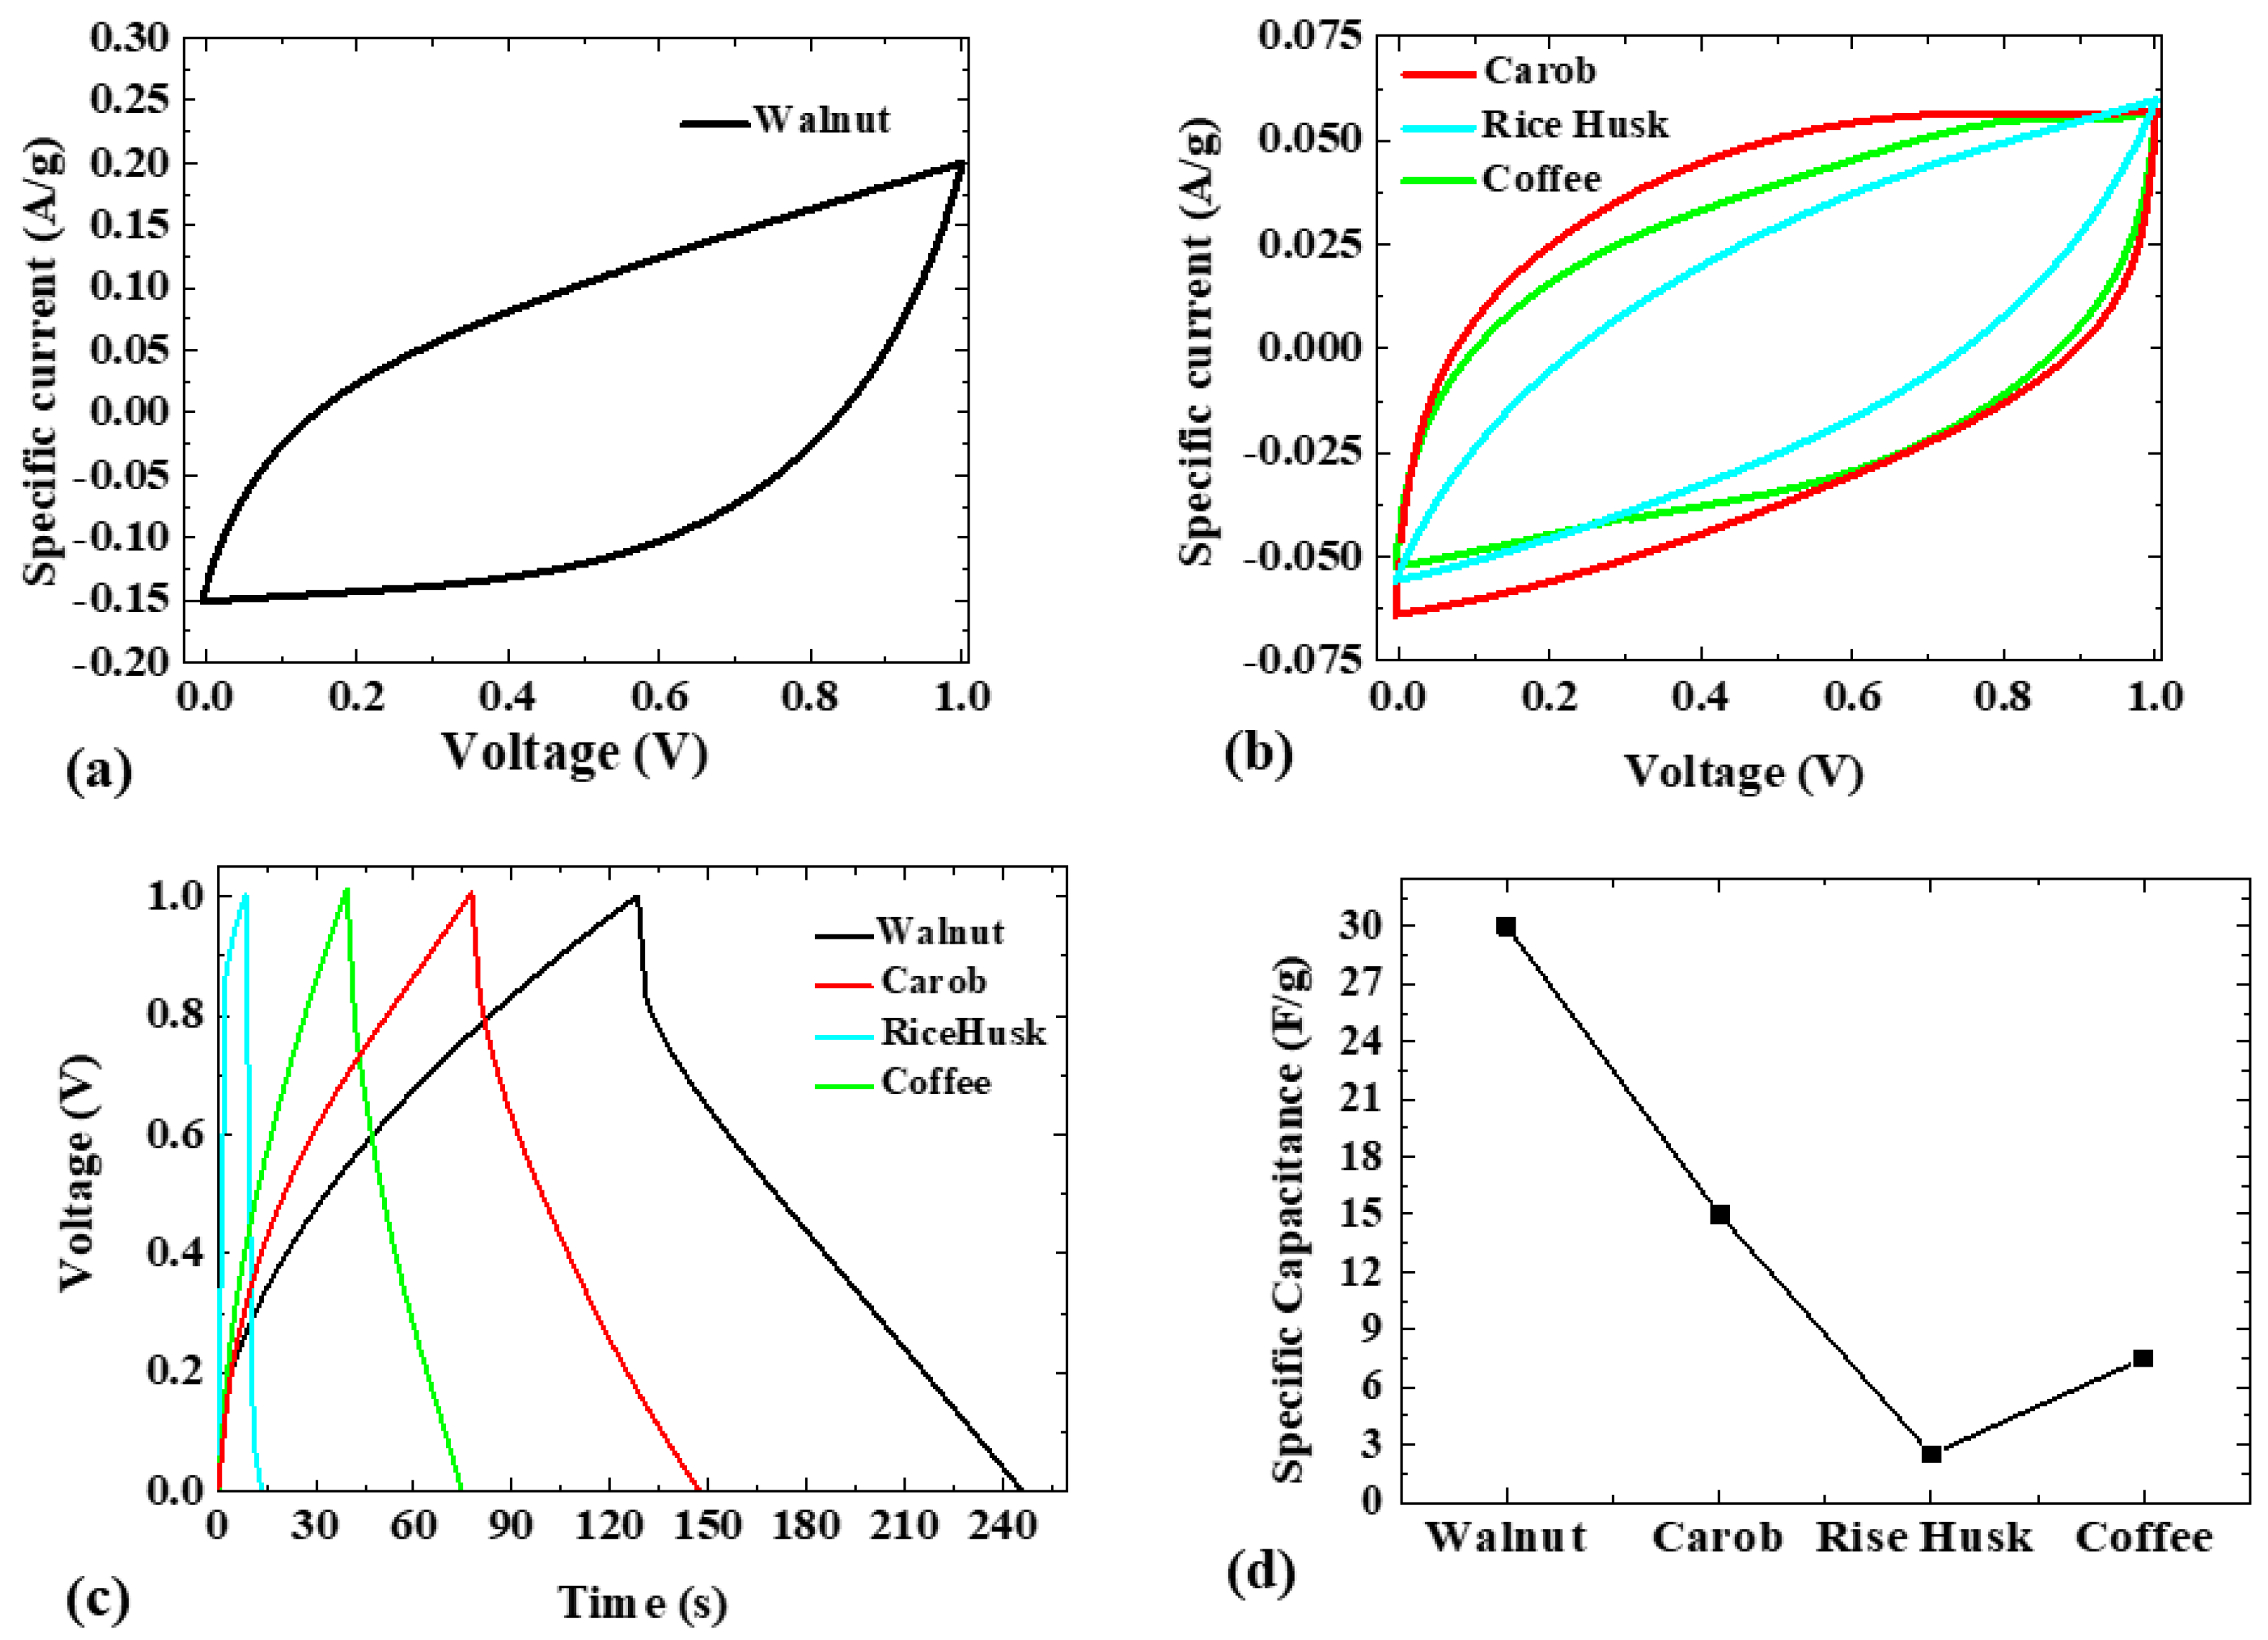
The electrochemical performance of the derived biochar pellets was evaluated to elucidate the relationship between their physicochemical properties and charge storage behavior. The CV profiles recorded at a scan rate of 10 mV s−1 (Figure 5a,b) exhibit quasi-rectangular shapes without distinct redox peaks, which are indicative of EDLC behavior with an efficient ion transport within the porous carbon matrix [57]. This behavior suggests that charge storage is mainly governed by surface-controlled processes rather than diffusion-limited faradaic reactions.
Among the tested biochar, the walnut-derived electrode displayed the largest enclosed CV area (0.172) and the highest specific current (±0.18 A g−1) (Figure 5a). This can be attributed to the synergy between its textural and structural properties: (i) its highly porous, sponge-like structure (Figure 1a) provides favorable and accessible transport pathways for electrolyte ions; (ii) its highest specific surface area (1146 m2 g−1) and the substantial pore volume (~0.26 cm3 g−1) (Figure 4b) are essential for double-layer formation. The coexistence of micro- and mesopores enhances ion confinement, while maintaining sufficient ion transport kinetics, a key requirement for high-performance EDLC electrodes. Beyond textural characteristics, structural disorder plays a decisive role. Raman spectroscopy (Figure 2a,e) revealed that walnut-derived biochar exhibits the highest degree of structural disorder, reflected by the elevated AD1/AG and AD3/AG ratios. These defect sites and edge planes act as electrochemically active centers, enhancing ion adsorption and potentially contributing to localized pseudocapacitive effects. As reported in the literature [58,59], such defect-induced contributions can significantly boost charge storage beyond what is expected from surface area alone.
In contrast, biochar derived from carob, coffee, and rice husk displayed smaller CV areas (0.0732, 0.06, and 0.04, respectively), reflecting significantly lower charge storage capabilities (Figure 5b). The rice husk-derived biochar showed the poorest performance (smallest CV area and specific current), suggesting minimal electrochemical performance, despite possessing a moderately high specific surface area (~582 m2 g−1). SEM imaging (Figure 1c) revealed an ordered, tubular macrostructure whose surface appears to be covered by a dense outer layer, likely hindering ion access to the internal porous network. Furthermore, its low AD1/AG and AD3/AG ratios from Raman analysis (Figure 2e) indicated a more ordered, graphitic structure with fewer defect sites for ion adsorption. This combination of limited ion accessibility and low defect density constrains its electrochemical activity, underscoring that high surface area alone is not sufficient to guarantee high performance [60].
To further evaluate the charge storage performance, the galvanostatic charge/discharge curves were carried out and the specific capacitance was estimated from Equation (2). At 0.1 A g−1, all the GCD curves (Figure 5c) exhibited nearly symmetrical triangular shapes, characteristic of capacitive behavior and excellent charge/discharge reversibility [61]. Consistent with CV results, (Figure 5d) illustrates the specific capacitance of the different biomass-derived electrodes. The walnut-derived electrode exhibited the longest discharge time and the highest specific capacitance of 30 F g−1. This was followed by the carob- and coffee-derived electrodes, which yielded 15 F g−1 and 7.5 F g−1, respectively. The rice husk-based electrode exhibited the shortest discharge time and the lowest capacitance of only 2.5 F g−1. The poor performance of the rice husk-derived electrode further confirms the detrimental impact of inaccessible porosity and low defect density on electrochemical activity.
These findings underscore that electrochemical performance is governed by a synergistic interplay between accessible porosity and structural disorder rather than by surface area alone. Defects introduced during biochar formation enhance ion adsorption and may enable additional pseudo capacitance contributions, significantly improving charge storage capability [62]. The enhanced electrochemical behavior of the walnut-derived biochar is therefore attributed to its hierarchical pore structure that facilitates rapid ion diffusion, combined with a high defect density of electrochemically active defect sites that provide abundant active sites for charge storage [62].

4. Conclusions

In this work, we thoroughly investigated activation-free biochar prepared from four different biomasses: walnut, carob, rice husk and coffee. Going beyond the traditional aspect of surface area, we investigated the synergy between surface area, porosity, and structural defects. The materials exhibited significantly different structural characteristics, with DFT-derived specific surface areas varied from 52 m2 g−1 (coffee) and 135 m2 g−1 (carob) to 582 m2 g−1 (rice husk) and 1146 m2 g−1 (walnut), accompanied by a maximum pore volume of 0.29 cm3 g−1. Raman analysis further indicated large differences in disorder, with walnut biochar presenting the highest defect density, while rice husk and coffee had the lowest. By correlating these physicochemical features with electrochemical behavior, we show that defect density, not just surface area controls performance. Rice husk biochar, despite its moderate surface area (~582 m2 g−1), delivered only 2.5 F g−1. In contrast, walnut biochar achieved 30 F g−1 due to its highly defective ultra-microporous network.
Overall, this work confirms that activation-free biochar can serve as a green, low-cost alternative to conventionally activated carbons, addressing the key challenge of developing high-performance, scalable, and eco-friendly carbon materials. Building on these findings, future strategies may include heteroatom doping, composite formation, and optimization of pyrolysis conditions to fine-tune structure and defect density. Pursuing these avenues will help narrow the performance gap between sustainable biochar and chemically activated carbons, paving the way for a wide range of applications.

Author Contributions

M.A., N.K. and D.V. conceived the study. D.V. led the preparation of the manuscript. D.V., N.K. and M.A. contributed to the interpretation of the data and the editing of the manuscript and E.S. (Emmanuel Stratakis) the review. M.A. performed the XRD characterization analysis, and N.K. assisted in the Raman and SEM analyses and performed the electrochemical measurements. F.B., K.B. and A.K., performed the BET characterization and analysis. E.S. (Emmanuel Spanakis) performed the XPS measurements. R.S.R. contributed to the analysis and discussion of the carbon properties and the electrochemical analysis. D.K. contributed to the synthesis of biochar and the optimization of the pyrolysis process. Finally, D.V. contributed to the general structural and morphological interpretation of the results. All authors have read and agreed to the published version of the manuscript.

Funding

M.A., N.K., F.B., K.B.,A.K. and D.V. were funded by the research project in framework of H.F.R.I call “Basic Research Financing (Horizontal support of all Sciences)” under the National Recovery and Resilience Plan “GREECE 2.0” funded by the European Union–Next Generation EU (H.F.R.I. Project Number: 016465–Gr-Pero2LiBs.

Data Availability Statement

The original contributions presented in this study are included in the article. Further inquiries can be directed to the corresponding author(s).

Acknowledgments

The authors would like to thank Alexandra Manousaki for the observation of the samples on SEM in the University of Crete, as well as George Kenanakis and Clytemnestra Katsara for Raman spectroscopy in IESL/FORTH.

Conflicts of Interest

The authors declare no conflicts of interest.

Appendix A

Figure A1. XPS survey spectra of the four biochars (walnut, carob, rice husk, and coffee). Vertical dashed lines mark the characteristic binding energies: C 1s (~284.5 eV, sp2/sp3 carbon), O 1s (~532 eV, surface oxides), Si 2p (~103 eV, silicon-black line)/Si 2s (red line), Ca 2p3/2 (~347 eV, calcite residues).
Carbon 12 00022 g0a1

References

  1. Lei, Z.; Zhang, J.; Zhang, L.L.; Kumar, N.A.; Zhao, X.S. Functionalization of chemically derived graphene for improving its electrocapacitive energy storage properties. Energy Environ. Sci. 2016, 9, 1891–1930. [Google Scholar] [CrossRef]
  2. Gul, E.; Alrawashdeh, K.A.B.; Masek, O.; Skreiberg, Ø.; Corona, A.; Zampilli, M.; Wang, L.; Samaras, P.; Yang, Q.; Zhou, H.; et al. Production and use of biochar from lignin and lignin-rich residues (such as digestive and olive stones) for wastewater treatment. J. Anal. Appl. Pyrolysis 2021, 158, 105263. [Google Scholar] [CrossRef]
  3. Salmeron, I.; Núñez-Tafalla, P.; Venditti, S.; Hansen, J. Biochar obtained from recovered cellulose and its mixture with conventional sources: Assessment of its potential for the removal of pollutants in water. Sci. Total Environ. 2024, 954, 176357. [Google Scholar] [CrossRef] [PubMed]
  4. Foong, S.Y.; Liew, R.K.; Yek, P.N.Y.; Chang, Y.H.; Lam, S.S. A review in production of nitrogen-enriched carbon materials via chitin pyrolysis and activation for enhanced wastewater remediation. Curr. Opin. Green Sustain. Chem. 2024, 47, 100920. [Google Scholar] [CrossRef]
  5. Di Domenico, G.; Bianchini, L.; Di Stefano, V.; Venanzi, R.; Lo Monaco, A.; Colantoni, A.; Picchio, R. New frontiers for raw wooden residues, biochar production as a resource for environmental challenges. C 2024, 10, 54. [Google Scholar] [CrossRef]
  6. Patel, M.R.; Panwar, N.L. Biochar from agricultural crop residues: Environmental, production, and life cycle assessment overview. RSC Adv. 2023, 19, 200173. [Google Scholar] [CrossRef]
  7. Liu, W.-J.; Jiang, H.; Yu, H.-Q. Emerging applications of biochar-based materials for energy storage and conversion. Energy Environ. Sci. 2019, 12, 1751. [Google Scholar] [CrossRef]
  8. Jiang, Y.; Ming, C.; Zhang, S.; Gholizadeh, M.; Wang, Y.; Hu, S.; Xiang, J.; Hu, X. Activation of lignin-derived biochar with mixed H2O and CO2: Characterization of reaction intermediates and investigation their potential synergistic effects. J. Anal. Appl. Pyrolysis 2023, 176, 106242. [Google Scholar] [CrossRef]
  9. Fu, F.; Yang, D.; Zhang, W.; Wang, H.; Qiu, X. Green self-assembly synthesis of porous lignin-derived carbon quasi-nanosheets for high-performance supercapacitors. Chem. Eng. J. 2020, 392, 123721. [Google Scholar] [CrossRef]
  10. Deng, L.; Shi, J.; Zhao, Y.; Feng, D.; Zhang, W.; Yu, Y.; Sun, S. Straw-based biochar prepared from multi-step KOH activation and its structure-effect relationship of CO2 capture under atmospheric/pressurized conditions via experimental analysis and MD/DFT calculations. Chem. Eng. J. 2024, 495, 153403. [Google Scholar] [CrossRef]
  11. Tomczyk, A.; Sokołowska, Z.; Boguta, P. Biochar physicochemical properties: Pyrolysis temperature and feedstock kind effects. Rev. Environ. Sci. Bio/Technol. 2020, 19, 191. [Google Scholar] [CrossRef]
  12. Iurchenkova, A.; Kobets, A.; Ahaliabadeh, Z.; Kosir, J.; Laakso, E.; Virtanen, T.; Siipola, V.; Lahtinen, J.; Kallio, T. The effect of the pyrolysis temperature and biomass type on the biocarbons characteristics. ChemSusChem 2024, 17, e202301005. [Google Scholar] [CrossRef] [PubMed]
  13. Liu, S.; Peng, S.; Zhang, B.; Xue, B.; Yang, Z.; Wang, S.; Xu, G. Effects of biochar pyrolysis temperature on thermal properties of polyethylene glycol/biochar composites as shape-stable bio composite phase change materials. RSC Adv. 2022, 12, 9587–9598. [Google Scholar] [CrossRef] [PubMed]
  14. Atinafu, D.G.; Choi, J.Y.; Nam, J.; Kang, Y.; Kim, S. Insights into the effects of biomass feedstock and pyrolysis conditions on the energy storage capacity and durability of standard biochar-based phase-change composites. Biochar 2025, 7, 1. [Google Scholar] [CrossRef]
  15. Infurna, G.; Botta, L.; Maniscalco, M.; Morici, E.; Caputo, G.; Marullo, S.; D’Anna, F.; Dintcheva, N.T. Biochar particles obtained from agricultural carob waste as a suitable filler for sustainable biocomposite formulations. Polymers 2022, 14, 3075. [Google Scholar] [CrossRef]
  16. Sehrawat, P.; Abid, A.; Islam, S.S.; Mauger, A.; Julien, C.M. Nanostructured graphene oxide-based hybrids as anodes for lithium-ion. C 2020, 6, 81. [Google Scholar] [CrossRef]
  17. Kuo, L.-A.; Tsai, W.-T.; Yang, R.-Y.; Tsai, J.-H. Production of high-porosity biochar from rice husk by the microwave pyrolysis process. Processes 2023, 11, 3119. [Google Scholar] [CrossRef]
  18. Reis, G.S.d.; Oliveira, H.P.d.; Larsson, S.H.; Thyrel, M.; Claudio Lima, E. A short review of the electrochemical performance of hierarchical and nitrogen-doped activated biocarbon-based electrodes for supercapacitors. Nanomaterials 2021, 11, 424. [Google Scholar] [CrossRef]
  19. Jalal, N.I.; Ibrahim, R.I.; Oudah, M.K. A review of supercapacitors: Types and components. J. Phys. Conf. Ser. 2021, 1973, 012015. [Google Scholar] [CrossRef]
  20. Saikia, B.K.; Benoy, S.M.; Bora, M.; Tamuly, J.; Pandey, M.; Bhattacharya, D. A brief review on supercapacitor energy storage devices and utilization of natural carbon resources as their electrode materials. Fuel 2020, 282, 118796. [Google Scholar] [CrossRef]
  21. Ran, F.; Yang, X.; Shao, L. Recent progress in carbon-based nanoarchitectures for advanced supercapacitors. Adv. Compos. Hybrid Mater. 2018, 1, 32–55. [Google Scholar] [CrossRef]
  22. Ma, Z.-W.; Liu, H.-Q.; Lu, Q.-F. Porous biochar derived from tea saponin for supercapacitor electrode: Effect of preparation technique. J. Energy Storage 2021, 40, 102773. [Google Scholar] [CrossRef]
  23. El Hamdouni, Y.; El Hajjaji, S.; Szabó, T.J.; Trif, L.; Felhosi, I.; Abbi, K.; Labjar, N.; Harmouche, L.; Shaban, A. Biomass valorization of walnut shell into biochar as a resource for electrochemical simultaneous detection of heavy metal ions in water and soil samples: Preparation, characterization, and applications. Arab. J. Chem. 2022, 15, 104252. [Google Scholar] [CrossRef]
  24. Deng, C.; Lin, R.; Kang, X.; Wu, B.; Wall, D.M.; Murphy, J.D. What physicochemical properties of biochar facilitate interspecies electron transfer in anaerobic digestion: A case study of digestion of whiskey by-products. Fuel 2021, 306, 121736. [Google Scholar] [CrossRef]
  25. Li, R.; Zhou, Y.; Li, W.; Zhu, J.; Huang, W. Structure engineering in biomass-derived carbon materials for electrochemical energy storage. Research 2020, 2020, 8685436. [Google Scholar] [CrossRef]
  26. Gale, M.; Nguyen, T.; Moreno, M.; Gilliard-AbdulAziz, K.L. Physicochemical properties of biochar and activated carbon from biomass residue: Influence of process conditions to adsorbent properties. ACS Omega 2021, 6, 10224–10233. [Google Scholar] [CrossRef]
  27. Cullity, B.D.; Stock, S.R. Elements of X-Ray Diffraction, 3rd ed.; Pearson Education Limited: Upper Saddle River, NJ, USA, 2014. [Google Scholar]
  28. Zhang, M.; Fan, Y.; Dong, T.; Cui, H.; Feng, X.; Zhang, S.; Zhou, J. The impacts of aging on the mobility of cadmium and free radicals from biochars. Ecotoxicol. Environ. Saf. 2025, 305, 119283. [Google Scholar] [CrossRef]
  29. Available online: https://crystallography.net/cod/ (accessed on 23 February 2026).
  30. Available online: https://www.geologynet.com/xrdcalc/ (accessed on 23 February 2026).
  31. Available online: https://webmineral.com/MySQL/xray.php?st=2101&minmax=10&lambda=1.54056%20-%20CuKa1&ed1=3,14&ed2=&ed3=&chem=& (accessed on 23 February 2026).
  32. Chen, S. Catalytic Graphitization of Biochar to Produce Graphitic Carbon Materials. Master’s Thesis, KTH Royal Institute of Technology, Stockholm, Sweden, 2020. Available online: https://www.diva-portal.org/smash/get/diva2:1459789/FULLTEXT01.pdf (accessed on 23 February 2026).
  33. Opedun, J.C.; Wanasolo, W.; Okullo Apita, A.; Omara, T. Optimization of pyrolysis and selected physicochemical properties of ground nut shells, coffee and rice husks for biochar production. Jordan J. Mech. Ind. Eng. 2023, 17, 441–452. [Google Scholar] [CrossRef]
  34. Ngernyen, Y.; Petsri, D.; Sribanthao, K.; Kongpennit, K.; Pinijnam, P.; Pedsakul, R.; Hunt, A.J. Adsorption of the non-steroidal anti-inflammatory drug (ibuprofen) onto biochar and magnetic biochar prepared from chrysanthemum waste of the beverage industry. RSC Adv. 2023, 13, 14712–14728. [Google Scholar] [CrossRef]
  35. Casiraghi, C. Raman intensity of graphene. Phys. Status Solidi B 2011, 248, 2593–2597. [Google Scholar] [CrossRef]
  36. Casiraghi, C. Probing disorder and charged impurities in graphene by Raman spectroscopy. Phys. Status Solidi RRL 2009, 3, 175–177. [Google Scholar] [CrossRef]
  37. Saffaripour, M.; Tay, L.-L.; Thomson, K.A.; Smallwood, G.J.; Brem, B.T.; Durdina, L.; Johnson, M. Raman spectroscopy and TEM characterization of solid particulate matter emitted from soot generators and aircraft turbine engines. Aerosol Sci. Technol. 2017, 51, 518–531. [Google Scholar] [CrossRef]
  38. Lapuerta, M.; Oliva, F.; Agudelo, J.R.; Stitt, J.P. Optimization of Raman spectroscopy parameters for characterizing soot from different diesel fuels. Combust. Sci. Technol. 2011, 183, 1203–1220. [Google Scholar] [CrossRef]
  39. Liu, X.; Yuan, L.; Zhong, M.; Ni, S.; Yang, F.; Fu, Z.; Xu, X.; Wang, C.; Tang, Y. Enhanced capacitive performance by improving the graphitized structure in carbon aerogel microspheres. RSC Adv. 2020, 10, 22242–22249. [Google Scholar] [CrossRef] [PubMed]
  40. Baldelli, A.; Rogak, S.N. Morphology and Raman spectra of aerodynamically classified soot samples. Atmos. Meas. Tech. 2019, 12, 4339–4346. [Google Scholar] [CrossRef]
  41. Pfau, S.A.; La Rocca, A.; Haffner-Staton, E.; Rance, G.A.; Fay, M.W.; Brough, R.J.; Malizia, S. Comparative nanostructure analysis of gasoline turbocharged direct injection and diesel soot-in-oil with carbon black. Carbon 2018, 139, 342–352. [Google Scholar] [CrossRef]
  42. Zhang, Y.; Wu, B.; Dong, H.; Guan, X.; Lo, I.M.C. Alginate-Sludge Derived Biochar-Calcium Hydrogel for Phoshate Removal and Slow-Release Fertilizer: A Sustainable and Multifunctional Solution. Adv. Funct. Mater. 2025, 36, e10234. [Google Scholar] [CrossRef]
  43. Loc, N.X.; Phuong, D.T.M. Optimizing biochar production: A review of recent progress in lignocellulosic biomass pyrolysis. Front. Agric. Sci. Eng. 2025, 12, 148–172. [Google Scholar] [CrossRef]
  44. Ray, S.C.; Mishra, D.K.; Strydom, A.M.; Papakonstantinou, P. Magnetic Behavioural Change of Silane Exposed Graphene Nanoflakes. J. Appl. Phys. 2015, 118, 115302. [Google Scholar] [CrossRef]
  45. He, W.; Luo, H.; Jing, P.; Wang, H.; Xu, C.; Wu, H.; Wang, Q.; Zhang, Y. Embedding silicon in biomass-derived porous carbon framework as high-performance anode of lithium-ion batteries. J. Alloys Compd. 2022, 918, 165364. [Google Scholar] [CrossRef]
  46. Puppa, L.D.; Ducousso, M.; Batisse, N.; Dubois, M.; Verney, V.; Xavier, V.; Delor-Jestin, F. Poplar wood and tea biochars for trichloroethylene remediation in pure water and contaminated groundwater. Environ. Chall. 2020, 1, 100003. [Google Scholar] [CrossRef]
  47. Ge, S.; Wang, S.; Mai, W.; Zhang, K.; Tanveer, M.; Wang, L.; Tian, C. Characteristics and acidic soil amelioration effects of biochar derived from a typical halophyte Salicornia europaea L. (common glasswort). Environ. Sci. Pollut. Res. 2023, 30, 66113–66124. [Google Scholar] [CrossRef] [PubMed]
  48. Filik, J.; May, P.M.; Pearce, S.R.J.; Wild, R.; Hallam, K.R. XPS and laser Raman analysis of hydrogenated amorphous carbon films. Diam. Relat. Mater. 2003, 12, 974–978. [Google Scholar] [CrossRef]
  49. Zu, Y.; Tang, J.; Zhu, W.; Zhang, M.; Liu, G.; Liu, Y.; Zhang, W.; Jia, M. Graphite oxide-supported CaO catalysts for transesterification of soybean oil with methanol. Bioresour. Technol. 2011, 102, 8939–8944. [Google Scholar] [CrossRef]
  50. Han, H.S.; You, J.-M.; Jeong, H.; Jeon, S. Synthesis of graphene oxide grafted poly (lactic acid) with palladium nanoparticles and its application to serotonin sensing. Appl. Surf. Sci. 2013, 284, 438–445. [Google Scholar] [CrossRef]
  51. Lascovich, J.C.; Giorgi, R.; Scaglione, S. Evaluation of the sp2/sp3 ratio in amorphous carbon structure by XPS and XAES. Appl. Surf. Sci. 1991, 47, 17–21. [Google Scholar] [CrossRef]
  52. Álvarez-Centeno, T.; Stoeckli, F. The assessment of surface areas in porous carbons by two model-independent techniques, the DR equation and DFT. Carbon 2010, 48, 2478–2486. [Google Scholar] [CrossRef]
  53. Bardestani, R.; Patience, G.S.; Kaliaguine, S. Experimental methods in chemical engineering: Specific surface area and pore size distribution measurements—BET, BJH, and DFT. Can. J. Chem. Eng. 2019, 97, 2781–2791. [Google Scholar] [CrossRef]
  54. Hyväluoma, J.; Kulju, S.; Hannula, M.; Wikberg, H.; Källi, A.; Rasa, K. Quantitative characterization of pore structure of several biochars with 3D imaging. Environ. Sci. Pollut. Res. 2017, 25, 25648–25658. [Google Scholar] [CrossRef]
  55. Burachevskaya, M.; Minkina, T.; Bauer, T.; Lobzenko, I.; Fedorenko, A.; Mazarji, M.; Sushkova, S.; Mandzhieva, S.; Nazarenko, A.Y.; Butova, V.V.; et al. Fabrication of biochar derived from different types of feedstocks as an efficient adsorbent for soil heavy metal removal. Sci. Rep. 2023, 13, 27638. [Google Scholar] [CrossRef]
  56. Zungu, V.; Hadebe, L.; Mpungose, P.; Hamza, I.; Amaku, J.; Gumbi, B. Fabrication of biochar materials from biowaste coffee grounds and assessment of its adsorbent efficiency for remediation of water-soluble pharmaceuticals. Sustainability 2022, 14, 2931. [Google Scholar] [CrossRef]
  57. Kurzweil, P.; Schottenbauer, J.; Schell, C. Past, present and future of electrochemical capacitors: Pseudocapacitance, aging mechanisms and service life estimation. J. Energy Storage 2021, 35, 102311. [Google Scholar] [CrossRef]
  58. Zhu, J.; Childress, A.S.; Karakaya, M.; Dandeliya, S.; Srivastava, A.; Lin, Y.; Rao, A.M.; Podila, R. Defect-engineered graphene for high-energy- and high-power-density supercapacitor devices. Adv. Mater. 2016, 28, 7185–7192. [Google Scholar] [CrossRef]
  59. Wang, H.; Casalongue, H.S.; Liang, Y.; Dai, H. Ni (OH)2Nanoplates Grown on Graphene as Advanced Electrochemical Pseudocapacitor Materials. J. Am. Chem. Soc. 2010, 132, 7472–7477. [Google Scholar] [CrossRef]
  60. Jin, Z.; Hu, K.; Lin, F.; Liu, S.; Gu, R.; Zhang, W.; Liu, S.; Li, C.; Liao, H.; Cai, X.; et al. Nickel Foam Supported Biochar Doped Ni-Mo Bimetallic Oxide for Supercapacitor Applications. React. Chem. Eng. 2025, 10, 224–236. [Google Scholar] [CrossRef]
  61. Brandão, A.T.S.C.; State, S.; Costa, R.; Potorac, P.; Vázquez, J.A.; Valcarcel, J.; Silva, A.F.; Anicai, L.; Enachescu, M.; Pereira, C.M. Renewable Carbon Materials as Electrodes for High-Performance Supercapacitors: From Marine Biowaste to High Specific Surface Area Porous Biocarbons. ACS Omega 2023, 8, 18782–18798. [Google Scholar] [CrossRef]
  62. Hu, H.; Yan, M.; Jiang, J.; Huang, A.; Cai, S.; Lan, L.; Ye, K.; Chen, D.; Tang, K.; Zuo, Q.; et al. A State-of-The-Art Review on Biomass-Derived Carbon Materials for Supercapacitor Applications: From Precursor Selection to Design Optimization. Sci. Total Environ. 2023, 912, 169141. [Google Scholar] [CrossRef]
Figure 1. SEM images of (a) walnut; (b) carob, (c) rice husk; (d) coffee-derived biochar; (e) XRD patterns and the patterns the mineral phases indicated by an asterisk. In SEM images, the bar is equal to 10 μm and the magnification 1500×. Notes: Sharp peaks indicated by asterisks and literature comparison values marked in parentheses.
Carbon 12 00022 g001
Figure 2. Deconvoluted Raman spectra of (a) walnut-; (b) carob-; (c) rice husk- and (d) coffee-derived biochar; along with (e) the variation in their ratios AD1/AG (black line) and AD3/AG (red line).
Carbon 12 00022 g002
Figure 3. Deconvoluted C 1s and O 1s XPS of walnut- and rice husk-derived biochar.
Carbon 12 00022 g003
Figure 4. Textural properties of the prepared biochar. (a) N2 adsorption–desorption isotherms at 77 K; (b) comparison of the DFT-derived specific surface area and total pore volume for the four samples; (c) 3D plot of the DFT pore size distribution (PSD), illustrating the differential pore volume evolution relative to pore width (Å) for the four biochar samples.
Carbon 12 00022 g004
Figure 5. (a) Cyclic voltammetry curve of walnut-derived biochar recorded at a scan rate of 10 mV/s; (b) cyclic voltammetry curves of the different biochar (carob, coffee and rice) recorded at a scan rate of 10 mV/s; (c) GCD profiles of the three biochar at a specific current of 0.1 A/g; (d) specific capacitance vs. different biomass.
Carbon 12 00022 g005
Table 1. Interlayer d-spacings (Å) calculated via Bragg’s law (Equation (3)) from XRD patterns of walnut-, carob-, rice husk- and coffee-derived biochar.
Biochar2θ (ο)d-Spacing (Å)Peak Assignment
Walnut-derived23.0
(FWHM = 8.5)
3.86 (3.80–3.90)Amorphous C
28.43.14 (Calcium minerals: 3.035/Phosphate minerals: 3.21)Ca/P minerals
40.52.22 (Ca minerals: 2.095)Ca minerals
43.12.10 (2.07–2.012)Graphitic C
Carob-derived23.5
(FWHM = 6.8)
3.79 (3.80–3.90)Amorphous C
28.43.14 (Calcium minerals: 3.035/Phosphate minerals: 3.21)Ca/P minerals
43.52.08 (2.07–2.012)Graphitic C
Rice husk-derived21.0
(FWHM = 5.2)
4.22 (4.18)SiO2
22.83.90 (3.80–3.90)Amorphous C
42.92.11 (2.07–2.012)Graphitic C
Coffee-derived23.1
(FWHM = 7.2)
3.85 (3.80–3.90)Amorphous C
28.43.14 (Calcium minerals: 3.035/Phosphate minerals: 3.21)Ca/P minerals
43.22.09 (2.07–2.012)Graphitic C
Disclaimer/Publisher’s Note: The statements, opinions and data contained in all publications are solely those of the individual author(s) and contributor(s) and not of MDPI and/or the editor(s). MDPI and/or the editor(s) disclaim responsibility for any injury to people or property resulting from any ideas, methods, instructions or products referred to in the content.