Abstract
Carbon dioxide emissions, particularly from large point sources such as fossil-fuel power plants, represent a primary driver of global warming. Although various carbon-based adsorbents have been developed for carbon capture applications, most existing materials exhibit limited CO2 adsorption capacity at flue gas-relevant partial pressures and are susceptible to interference from impurity components. In this study, a series of nitrogen-doped carbons was prepared from commercial phenolic resin and melamine via a two-step carbonization–activation process. The effects of precursor-to-dopant ratio and thermal conditions on CO2 adsorption were systematically investigated. The results indicated that CO2 uptake was influenced by specific surface area, nitrogen content, micropore volume, and total pore volume, with a maximum adsorption capacity of 2.455 mmol·g−1 and selectivity over 28 at 25 °C and 1 bar. The series also exhibited excellent cycling stability (<1% loss after 5 cycles) and fast kinetics (>90% uptake within 3 min), suggesting its potential applicability in flue gas CO2 capture.
1. Introduction
Since the Industrial Revolution, the demand for fossil fuels has expanded rapidly, leading to massive energy consumption and greenhouse gas emissions. Among these emissions, carbon dioxide (CO2), the primary greenhouse gas, accumulates from fossil fuel combustion and directly causes global warming and ocean acidification [1,2,3]. To meet the Paris Agreement’s 2 °C goal, global CO2 emissions must be cut 50% by 2050 [4]. Therefore, it is imperative to advance low-carbon technologies such as carbon capture, utilization, and storage (CCUS) [5]. Carbon capture stands as one of the most critical singular mitigation strategies available today [6].
Common carbon capture methods include amine scrubbing, cryogenic distillation, membrane separation, and adsorption [7,8,9]. Despite its high efficiency and wide use, amine scrubbing suffers from solvent volatility, degradation, corrosivity, and high regeneration energy costs [10,11,12,13,14,15,16,17]. Cryogenic distillation produces high-purity liquid CO2 suitable for storage and transport but is energy-intensive and less cost-effective [18,19]. Membrane systems offer modularity, operational simplicity, and lower energy use, yet are limited by plasticization, fouling, aging, and high replacement costs [18,20,21,22,23,24,25]. In contrast, adsorption-based processes utilizing solid sorbents to separate CO2 from flue gas offer a promising low-energy alternative for carbon capture. This approach is recognized for its process simplicity, low corrosivity, cost-effectiveness, and high efficiency, making it a viable technology option [3,26,27,28].
In adsorption-based CO2 capture processes, the performance of the adsorbent is a critical determinant of overall system efficiency [29]. Conventional adsorbents are often constrained by limitations such as insufficient selectivity, low adsorption capacity, and inadequate thermal stability [30]. Therefore, significant attention has been devoted to the adsorption of CO2 on porous materials, such as metal–organic frameworks (MOFs), amine-grafted silica, zeolites, carbon-based materials, and mesoporous alumina [31,32,33]. Among these, carbon materials have emerged as highly promising candidates for CO2 capture because of their wide availability, low cost, excellent hydrophobicity, tunable pore structures, high stability, and low energy requirements for regeneration [34,35,36]. Activated carbons are typically classified by precursors into coal-derived, biomass-derived, resin-based, and nitrogen-doped types. Key textural properties, including specific surface area, micropore volume, and pore size distribution, can be tuned through precursor selection and synthesis conditions, directly governing their CO2 adsorption performance [37,38,39]. To improve CO2 separation on carbon adsorbents, amine functionalization and nitrogen doping are commonly employed. Despite its high capacity, amine grafting suffers from limited regenerative stability. Nitrogen doping, which integrates nitrogen atoms into the carbon framework to enhance surface polarity and basicity, offers a more robust and widely adopted alternative [5,40,41].
YUE et al. synthesized a series of modified carbon materials using urea-treated coconut shell activated carbon, achieving a CO2 adsorption capacity of 3.71 mmol·g−1 at 1 bar and 25 °C [42]. LIU et al. prepared N-doped porous carbon from industrial phenolic resin using urea as a nitrogen source and KOH as an activating agent, reporting a CO2 uptake of 5.01 mmol·g−1 under the same conditions [43]. Souza et al. utilized formaldehyde and phloroglucinol as carbon precursors to synthesize phenolic resin-based carbons via a soft-templating method, followed by KOH activation to enhance microporosity. The activated sample demonstrated a CO2 adsorption capacity of 4.4 mmol·g−1 at ambient pressure and 25 °C [44]. Lucas Spessato et al. developed nitrogen-doped adsorbents using Brazil nut shells (BNSs) as the carbon source, with melamine, hexamethylenetetramine, and tetramethylammonium hydroxide as nitrogen agents, achieving CO2 adsorption capacities ranging from 4.16 to 5.30 mmol·g−1 [45]. Wang et al. synthesized N-doped porous carbon using polypyrrole prepared from FeCl3, KOH, and pyrrole as a precursor, achieving a CO2 adsorption capacity of 3.61 mmol·g−1 at 30 °C and 100 kPa [46]. Liu et al. carbonized low-cost urea-formaldehyde resin followed by KOH activation, yielding a sample with a CO2 uptake of 1.44 mmol·g−1 at 1 bar and 25 °C [47]. Rao et al. produced nitrogen-rich activated carbon via a single-step sodium amide activation of carbonized water chestnut shell, which exhibited a CO2 adsorption capacity of 4.5 mmol·g−1 at 25 °C and 1 bar [48]. Dang et al. prepared N-doped microporous activated carbon using starch as the carbon source, phenolic resin as a nitrogen modifier, and KOH as the activating agent, reporting a high CO2 uptake of 6.54 mmol·g−1 at 0 °C and 100 kPa [49].
Although these nitrogen-doped carbon materials exhibit promising CO2 adsorption performance, their synthesis often involves complex procedures and cumbersome precursor processing, and poses scaling challenges. Moreover, most of these materials are produced via chemical activation, which requires extensive washing processes, leading to resource consumption and potential chemical pollution [50]. In this study, we employ low-cost phenolic resin with well-controllable porosity as the precursor [51] and melamine as the nitrogen dopant [52]. A nitrogen-doped carbon-based adsorbent is synthesized using CO2 as the physical activating agent. The effects of the dopant-to-precursor mass ratio, carbonization temperature, and activation temperature on the adsorption performance are systematically investigated. The adsorbent is further evaluated in terms of its CO2/N2 selectivity, adsorption kinetics and cyclic stability.
2. Materials and Methods
2.1. Preparation
The commercial phenolic resin used in this study was obtained from Zhejiang Juhua Co., Ltd., Quzhou, China melamine was sourced from Tianjin Kermel Chemical Reagent Co., Ltd., Tianjin, China. and both CO2 and N2 gases were supplied by Tianjin Best Gas Corporation., Tianjin, China.
2.1.1. Carbonization Under N2 Atmosphere
Carbonization is a pyrolysis process conducted under an inert and oxygen-free atmosphere, where the precursor undergoes thermal decomposition to eliminate volatile components, yielding carbon with a rudimentary pore structure. This intermediate carbon is subsequently transformed into a highly developed porous architecture during the activation stage [53,54].
In this study, melamine and phenolic resin were thoroughly mixed in an agate mortar at various mass ratios and then transferred into a porcelain boat. (The mass ratio of melamine to phenolic resin is denoted as R, where R = 0 corresponds to pure phenolic resin. The carbonization and activation temperatures are designated as X and Y, respectively, in degrees Celsius (°C)). The mixture was subjected to carbonization in a horizontal tube furnace under a N2 atmosphere with a flow rate of 0.6 L/min. The thermal treatment was carried out at a heating rate of 5 °C/min up to a carbonization temperature X (e.g., 500 °C), held for 2 h, followed by natural cooling to room temperature. The N2 atmosphere was maintained throughout this cooling period. The cooled char was subsequently activated.
2.1.2. CO2 Activation
Physical activation involves the reaction of carbonized char with gaseous activating agents at elevated temperatures, typically employing steam or carbon dioxide as the agents [53,55]. After cooling to room temperature following the carbonization stage, the atmosphere was switched to CO2 at a flow rate of 0.8 L/min and maintained for 30 min to allow for complete gas purging. The activation process was then initiated at a heating rate of 5 °C/min up to the activation temperature Y (e.g., 600 °C) and held for 1 h. The CO2 atmosphere was retained during the subsequent cooling stage. After cooling to room temperature, the resulting material was repeatedly washed with deionized water to remove ash, and then dried at 120 °C for 2 h in a constant-temperature drying oven. The final black N-doped carbon powder was designated as NCR-X-Y.
In this study, the melamine-to-phenolic resin mass ratio R was selected as 0, 0.5, 1, 2, and 3; carbonization temperatures X were set at 450 °C, 500 °C, 550 °C, and 600 °C; and activation temperatures Y were tested at 550 °C, 600 °C, 650 °C, and 700 °C.
2.2. Adsorption Performance Evaluation
2.2.1. Static Volumetric Method
The CO2 adsorption isotherms of the nitrogen-doped activated carbons were measured using custom-built static volumetric apparatus, as schematically illustrated in Figure 1. The system consists of gas cylinders, a reference tank, an adsorption tank, pressure transducers, a vacuum pump, a thermostatic water bath, and associated valves and tubing.
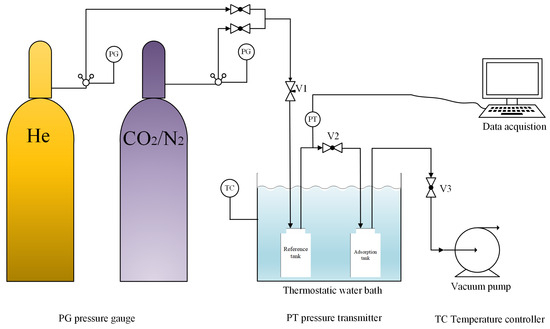
Figure 1.
Schematic diagram of a static adsorption device.
The tubing volume between the inlet valve V1 and valve V2 was attributed to the reference tank volume, while the volume between V2 and the evacuation valve V3 was assigned to the free volume of the adsorption tank. The volume of the reference tank (Vr) was pre-calibrated. A sample of mass m (g) was loaded into the adsorption tank. After opening the equalization valve V2, the vacuum pump and valve V3 were activated to evacuate the system for 3 h.
The experiment consisted of the following two steps:
- Measurement of the Free Volume in the Adsorption Tank
After evacuation, the pressures in both the adsorption tank and the reference tank were equal, recorded as the initial system pressure P0. Valve V2 was then closed, and a certain amount of helium was introduced into the reference tank via valve V1 before closing V1. After the pressure reading stabilized, the elevated pressure was recorded as P1. Subsequently, valve V2 was opened, allowing gas to flow from the high-pressure reference tank to the low-pressure adsorption tank until pressure equilibrium was reached. The resulting equilibrium pressure was denoted as P2. Since helium is not adsorbed by the adsorbent, the total amount of substance remained unchanged before and after pressure equalization. The free volume V0 was then calculated using Equation (1):
where V0 represents the free volume (mL) remaining in the adsorption tank after loading the adsorbent, Vr is the volume (mL) of the reference tank, P0 denotes the initial system pressure (Pa), P1 indicates the pressure (Pa) after pressurization of the reference tank, and P2 is the equilibrium pressure (Pa) after opening the equalization valve.
- 2.
- Measurement of Adsorption Isotherms
The procedure for determining the adsorption isotherm followed a method similar to that used for free volume measurement. After determining the free volume, valves V2 and V3 and the vacuum pump were opened to evacuate helium from the system. The resulting initial system pressure was recorded as P3. Valve V2 was then closed, and the gas inlet valve V1 was opened to pressurize the system to P4. Subsequently, valve V2 was opened to allow gas to enter the adsorption tank, initiating the adsorption process. Once the pressure stabilized and no further changes were observed, the equilibrium pressure was recorded as P5. This procedure was repeated to collect 9–12 pressure points. The amount adsorbed was calculated based on the change in the number of moles before and after adsorption. Prior to pressure equalization, the change in the number of moles introduced into the system satisfies Equation (2):
Following the opening of the equalization valve and the attainment of adsorption equilibrium, the amount of gas remaining in the system is given by the following Equation (3):
The static adsorption capacity at equilibrium pressure P5 is defined as the difference in the number of moles before and after pressure equalization, given by:
In Equation (4), qi denotes the equilibrium adsorption capacity (mmol·g−1) at equilibrium pressure P5; n1 represents the amount of substance (mmol) of gas introduced into the system; n2 is the amount of substance (mmol) of gas remaining in the system after adsorption equilibrium; and m refers to the mass (g) of the adsorbent loaded in the adsorption tank.
2.2.2. Selectivity
Selectivity is an important parameter of adsorbents, and its definition is provided in Equation (5):
where: s refers to the separation performance of the adsorbent for binary-component adsorbates; a larger value of s indicates a greater ease of separating the mixed system. xi and xj denote the mole fractions of component i and component j in the adsorbed phase at adsorption equilibrium, respectively. yi and yj denote the mole fractions of component i and component j in the gas phase at adsorption equilibrium, respectively.
The adsorption isotherms of CO2 and N2 were fitted using the Langmuir equation:
where q refers to the equilibrium adsorption capacity, with the unit of mmol·g−1; qm denotes the saturation adsorption capacity, with the unit of mmol·g−1; b represents the adsorption constant, with the unit of Pa−1; pi is the partial pressure of component i, with the unit of Pa.
Based on the parameters of the adsorption isotherms, the adsorption capacity of each component at a specified pressure was calculated first, and the resulting values were then substituted into Equation (5) to determine the selectivity of the adsorbent.
3. Results and Discussion
3.1. Porosity Characterization
Figure 2 shows the N2 adsorption–desorption isotherms of the synthesized NCR-X-Y series samples. A sharp increase in adsorption capacity was observed at low relative pressure (P/P0 < 0.01), followed by a nearly horizontal plateau, which is characteristic of a Type I isotherm and indicates the predominantly microporous nature of the materials [56].
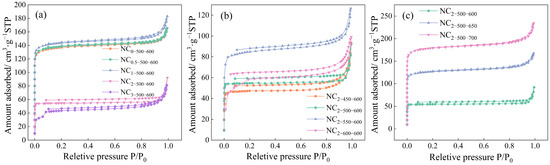
Figure 2.
Nitrogen adsorption–desorption isotherm of the samples at (a) different mass ratios, (b) different carbonization temperatures, and (c) different activation temperatures.
As illustrated in Table 1, with increasing melamine doping ratio, the specific surface area of the samples initially increased slightly and then decreased significantly. This trend can be attributed to the fact that a moderate amount of melamine produces nitrogen-containing gases and other volatile compounds during pyrolysis. These gases react with carbon atoms on the carbon surface, and their subsequent release etches the carbon framework, thereby synergistically promoting the formation and expansion of micro- and mesopores. However, excessive melamine leads to the accumulation of solid carbonaceous residues that block the pores, resulting in a noticeable reduction in specific surface area.

Table 1.
Porous structure of series samples.
The specific surface area of the samples increased with rising carbonization and activation temperatures, with the activation temperature exhibiting a more pronounced influence. This trend can be attributed to the distinct roles of each process: carbonization primarily involves the thermal decomposition of the precursor, eliminating volatile components and facilitating structural reorganization. Since N2 serves solely as an inert protective gas and does not participate in the reaction, the carbonization temperature mainly affects the preliminary formation of the pore structure, contributing only modestly to the final specific surface area. In contrast, during activation, CO2 reacts with carbon atoms on the material surface, resulting in etching and substantial development of the porous architecture. Higher activation temperatures accelerate the reaction kinetics and intensify the etching effect, thereby significantly enhancing the porosity and specific surface area of the activated carbon.
The pore size distribution (PSD) curves of the samples are shown in Figure 3. As the melamine mass increased, the PSD initially broadened and then narrowed, indicating that melamine can, to some extent, promote pore development at moderate amounts, whereas excessive amounts lead to pore blockage. Both higher carbonization and activation temperatures resulted in broader PSD profiles. A comparison between samples NC2-450-600 and NC2-500-550 revealed that even at the lowest carbonization temperature, some microporosity was developed, whereas at the lowest activation temperature, virtually no micropores were detected. This further confirms that the activation temperature plays a more critical role in determining the final porous structure of the activated carbon.
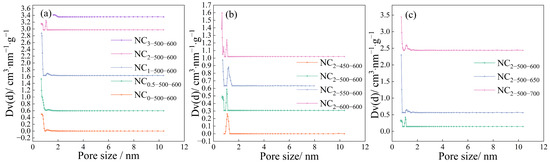
Figure 3.
Pore size distribution of the samples at (a) different mass ratios, (b) different carbonization temperatures, and (c) different activation temperatures.
3.2. Elemental Composition and Surface Chemistry
To investigate the influence of synthesis conditions on the composition and properties of the adsorbents, elemental analysis (EA) was performed on the series of samples, with selected representative samples further analyzed by X-ray photoelectron spectroscopy (XPS). As summarized in Table 2, the nitrogen content of the N-doped sample NC0-500-600 was 1.09 wt%, while the melamine-modified samples exhibited significantly higher N content, ranging from 4.75 wt% to 25.8 wt%. This indicates that the pristine precursor contains negligible nitrogen, and melamine effectively serves as a source for nitrogen incorporation into the carbon framework.
Table 2.
Elemental composition and CO2 uptake of series samples.
With the increase in the melamine-to-precursor mass ratio (R) from 0 to 3, the nitrogen content in the samples increased from 1.09 wt% to 25.86 wt%, while the carbon content decreased from 84.02 wt% to 57.53 wt%. This inverse trend can be attributed to the partial substitution of carbon atoms by nitrogen within the carbon framework, along with the chemical adsorption of nitrogen-containing gaseous species on the carbon surface during pyrolysis, collectively leading to enhanced nitrogen incorporation at the expense of carbon content. Furthermore, the oxygen content in the nitrogen-doped samples was generally higher than that in the undoped sample, though it exhibited a declining trend with increasing R. The undoped sample had an oxygen content of 13.153 wt%. At R = 0.5 and 1, the oxygen content increased to 20.603 wt% and 19.871 wt%, suggesting that nitrogen doping promotes the formation of oxygen-containing functional groups. However, as R increased further to 3, the oxygen content decreased to 15.088 wt%, implying that excessively high nitrogen loading suppresses oxygen introduction and functional group formation.
With the mass ratio R fixed at 2 and the activation temperature held at 600 °C, variations in carbonization temperature were investigated. As the carbonization temperature increased, the carbon content of the samples rose from 60.25 wt% to 63.84 wt%, while the nitrogen content decreased from 23.52 wt% to 20.72 wt%. These relatively minor alterations in elemental composition suggest that the carbonization temperature has limited influence on the chemical structure of the samples, which is consistent with the BET surface area results. Similarly, with R fixed at 2 and the carbonization temperature maintained at 500 °C, an increase in activation temperature led to a noticeable decrease in nitrogen content from 25.9 wt% to 10.37 wt%, accompanied by an increase in both carbon and oxygen contents. This behavior can be attributed to accelerated thermal decomposition of melamine at higher temperatures, promoting the release of nitrogen in gaseous forms and reducing its incorporation into the carbon framework. Additionally, nitrogen species chemically adsorbed on the carbon surface are prone to desorption as temperature rises. Concurrently, the heterogeneous reaction between CO2 and the carbon surface may enhance the chemical adsorption of oxygen, contributing to the observed increase in oxygen content [57].
Based on the CO2 adsorption capacity and selectivity under partial pressure, three representative samples were selected from the series for further investigation into the effects of synthesis conditions on adsorbent performance and structure: NC2-500-600, NC2-550-600, and NC2-500-700.
To elucidate the nitrogen speciation on the carbon surface, XPS analysis (Figure 4) was conducted on the representative samples. All three samples exhibited distinct peaks at binding energies of 398.3–398.6 eV and 400.1–400.2 eV, which are attributed to pyridinic-N (N-6) and pyrrolic-N (N-5), respectively. These results indicate that nitrogen is primarily present in the form of N-5 and N-6 configurations, with negligible contributions from oxidized nitrogen or quaternary nitrogen species.
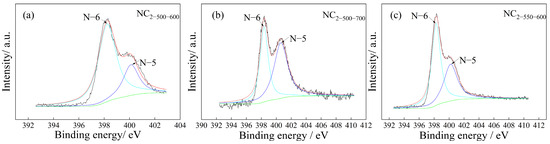
Figure 4.
XPS N1s spectrum of the samples (a) NC2-500-600, (b) NC2-500-700, (c) NC2-550-600.
As shown in Figure 4a,b, under the same carbonization temperature, an increase in the activation temperature from 600 °C to 700 °C led to a noticeable increase in the content of pyrrolic-N (N-5). Comparison between Figure 4a,c further reveals that, at a fixed activation temperature, raising the carbonization temperature promoted a partial transition from pyridinic-N (N-6) to pyrrolic-N (N-5), although this change was not pronounced. This transformation suggests that during thermal treatment, nitrogen species undergo a transition from the less stable N-6 state to the more energetically favorable N-5 configuration, accompanied by partial nitrogen loss through decomposition. These findings are consistent with the elemental analysis results and the applied synthesis conditions.
3.3. Surface Morphology and Phase Analysis
The SEM and TEM characterization results of the representative samples NC2-500-600, NC2-500-700, and NC2-550-600 are presented in Figure 5. The images indicate that the melamine-doped adsorbents possess well-developed porous structures with an abundance of fine micropores.
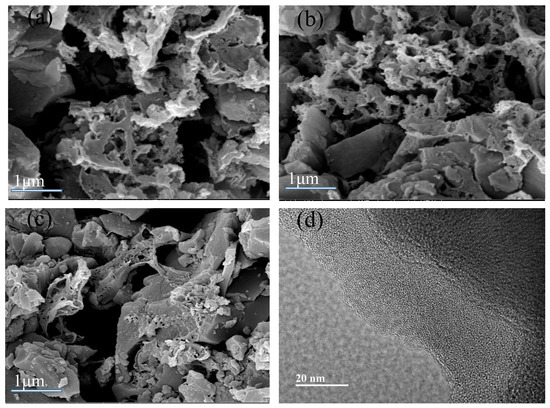
Figure 5.
SEM images of (a) NC2-500-600, (b) NC2-500-700, and (c) NC2-550-600, and TEM image of (d) NC2-500-600.
Figure 6 shows the X-ray diffraction (XRD) pattern of sample NC2-500-600, which exhibits a broad peak centered at 2θ = 22.5° and a weaker diffuse peak around 2θ = 43°. These features correspond to the (002) and (100) diffractions of amorphous carbon. These features indicate the presence of short-range ordered structures with low crystallinity, which is characteristic of amorphous carbon materials. This amorphous nature was further confirmed by TEM analysis (Figure 5d), where numerous randomly distributed worm-like micropores were observed, unequivocally verifying the disordered structure of the prepared N-doped carbon. Such a disordered structure is conducive to the development of a high level of porosity, thereby facilitating CO2 adsorption [58,59].
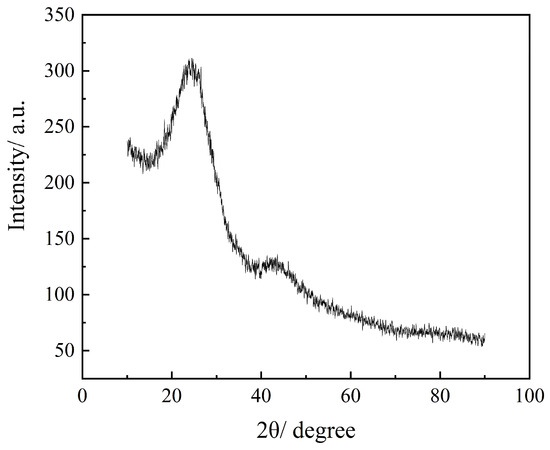
Figure 6.
XRD of NC2-500-600.
3.4. Adsorption Performance
3.4.1. CO2 and N2 Adsorption Isotherms
The CO2 and N2 adsorption isotherms of the adsorbents were measured at 25 °C using a static volumetric adsorption apparatus, as shown in Figure 7a,b. As the nitrogen doping ratio increased, the nitrogen content of the samples rose, while the specific surface area initially increased slightly and then decreased significantly. Accordingly, the adsorption capacities for both CO2 and N2 under identical pressures first increased and then decreased, making it difficult to discern the individual contributions of nitrogen content and specific surface area to the CO2 adsorption capacity.
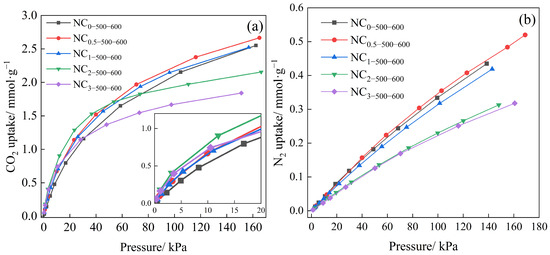
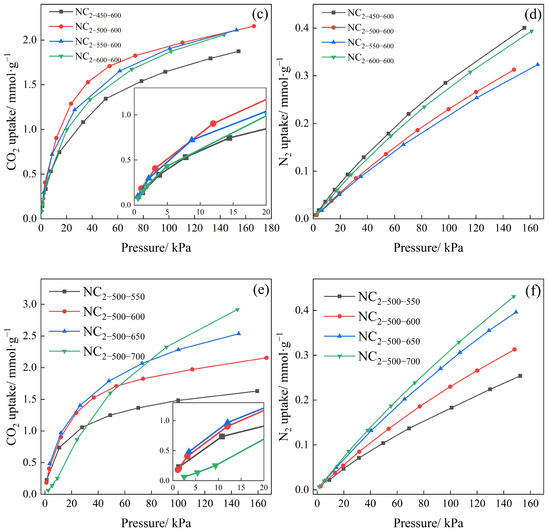
Figure 7.
Adsorption isotherms of series samples at different doping mass ratios, (a) CO2 and (b) N2, different carbonization temperatures, (c) CO2 and (d) N2, and different activation temperatures, (e) CO2 and (f) N2.
Figure 7c,d demonstrate that CO2 adsorption capacity first increases and then decreases with rising carbonization temperature, with an optimum of 1.973 mmol·g−1 observed for NC2-500-600. Notably, as the carbonization temperature increased, the specific surface area increased while the nitrogen content decreased, indicating that the CO2 adsorption capacity is a multi-factorial process.
From Figure 7e,f, it is evident that higher activation temperatures generally lead to greater CO2 and N2 adsorption capacities. However, the CO2 adsorption isotherm in Figure 7e shows that although the sample activated at 700 °C achieved the highest adsorption capacity at high pressure, it exhibited the lowest capacity in the low-pressure region. This behavior can be attributed to excessive activation temperature, which promotes pore widening and reduces the proportion of narrow micropores, thereby diminishing low-pressure adsorption performance.
As summarized in Table 2, the CO2 adsorption capacities of the adsorbents at 1 bar ranged from 1.491 to 2.455 mmol·g−1, while the capacities at 15 kPa varied from 0.575 to 1.051 mmol·g−1. For most samples, the adsorption capacity at 15 kPa reached nearly half of that at 100 kPa. The high adsorption performance in the low-pressure region can be attributed to the filling of CO2 in narrow micropores [60]. It is noteworthy that sample NC2-500-700, which showed the highest adsorption capacity at 100 kPa, exhibited the lowest at 15 kPa. This indicates that higher activation temperatures promote more thorough reaction between CO2 (as an activating agent) and the carbon product, resulting in a reduction in narrow micropores suitable for low-pressure adsorption, which is disadvantageous for separation under flue gas conditions. Given that the CO2 partial pressure in typical flue gas is approximately 15 kPa, the selection of the optimal sample was based on a combination of low-pressure adsorption capacity and separation selectivity rather than performance at 1 bar. Thus, instead of choosing NC2-500-700, which shows the highest capacity at 1 bar, NC2-500-600 was selected for further investigation of adsorption kinetics and cyclic stability. This decision was based on its superior performance under flue gas conditions, achieving an adsorption capacity of 1.037 mmol·g−1 and a separation selectivity of up to 40.
Based on the analysis of CO2 adsorption isotherms and structural characterization data of the NCR-X-Y series samples, it can be concluded that the CO2 adsorption capacity is influenced by multiple factors, including the pore size distribution, specific surface area, micropore volume, and nitrogen doping level. The correlation between CO2 uptake and individual structural parameters is illustrated in Figure 8. The results indicate positive yet non-linear relationships between the CO2 adsorption capacity and the specific surface area, micropore volume, and total pore volume. Under identical carbonization and activation temperatures, the CO2 adsorption capacity initially increases and then decreases with rising nitrogen content. The sample with the highest CO2 uptake, NC2-500-700, has a nitrogen content of 10.37 wt%. Notably, the sample with the lowest nitrogen content, NC0-500-600, does not exhibit the lowest adsorption capacity. Further analysis incorporating specific surface area and pore size distribution data of adsorbents with different nitrogen doping ratios suggests that while nitrogen doping enhances CO2 adsorption, excessive amounts of melamine can lead to pore blockage. Beyond an optimal point, this negative effect outweighs the beneficial contribution of nitrogen functional groups to CO2 capture.
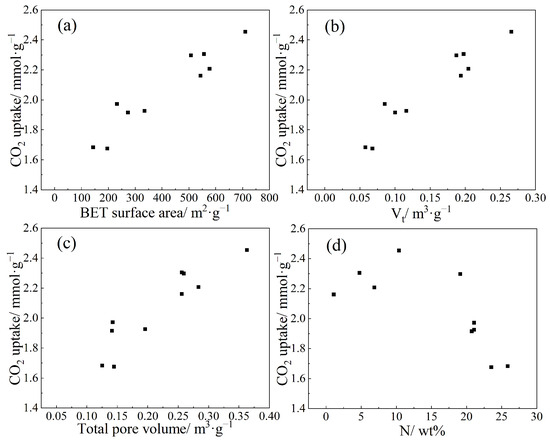
Figure 8.
Relationship between CO2 adsorption capacity and various factors: (a) specific surface area, (b) micropore volume, (c) total pore volume, and (d) nitrogen content.
3.4.2. CO2/N2 Selectivity
The separation selectivity toward CO2 over N2 is a critical performance metric for adsorbents in gas separation applications. Higher selectivity values correspond to more efficient CO2 capture from mixed gas streams. The CO2 and N2 adsorption isotherms were well-fitted by the Langmuir model, and the corresponding parameters are summarized in Table 3. The high fitting accuracy suggests that the adsorption behaviors of both CO2 and N2 on the NCR-X-Y materials comply with the assumptions of ideal monolayer adsorption under the Langmuir framework.
Table 3.
Langmuir equation fitting parameters for series samples.
The CO2/N2 selectivity of the NCR-X-Y series samples for dry flue gas containing 15% CO2 was calculated based on the Ideal Adsorbed Solution Theory (IAST), with the results presented in Figure 9.
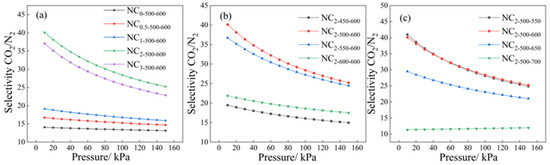
Figure 9.
Separation coefficients of series samples at (a) different doping mass ratios, (b) different carbonization temperatures, and (c) different activation temperatures.
As illustrated in Figure 9a, which depicts the relationship between selectivity and the nitrogen doping ratio, all nitrogen-doped adsorbents exhibited higher selectivity compared to the undoped sample, indicating that nitrogen incorporation enhances the separation performance. The selectivity increased consistently as the doping ratio rose from 0 to 2. However, at a doping ratio of 3, the selectivity decreased, which can be attributed to excessive melamine leading to pore blockage and consequently impairing CO2 adsorption. Figure 9b shows that the selectivity also exhibited an initial increase followed by a decrease with rising carbonization temperature, a trend consistent with the variation in adsorption capacity. The optimal performing sample, NC2-500-600, achieved a selectivity exceeding 40. Figure 9c reveals that higher activation temperatures resulted in reduced selectivity. Although elevated activation temperatures promote the development of porosity and increase overall adsorption capacity, they also cause the enlargement of narrow micropores, thereby reducing molecular sieving ability and ultimately diminishing separation performance.
3.4.3. Cyclic Stability
Cyclic stability is a critical performance indicator for adsorbents in industrial applications. To evaluate this property, five consecutive adsorption–desorption cycles were conducted on the optimal sample, NC2-500-600, at 25 °C. The resulting adsorption isotherms, shown in Figure 10, nearly overlap across all cycles, demonstrating exceptional regeneration. The CO2 uptake measured at 100 kPa was 1.973 mmol·g−1 in the first cycle and 1.965 mmol·g−1 in the fifth cycle, representing a capacity loss of less than 1%. These results confirm that NC2-500-600 possesses outstanding cyclic stability and excellent reversibility.
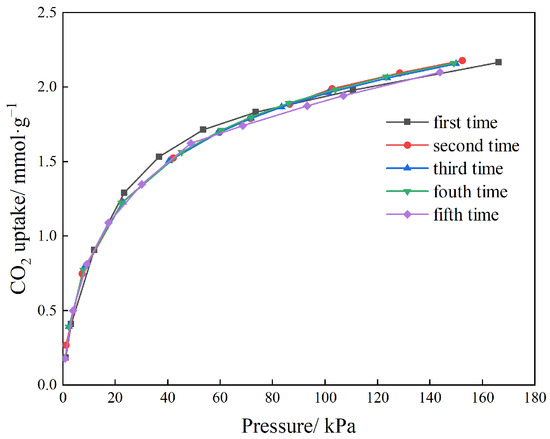
Figure 10.
Cycling stability of NC2-500-600.
3.4.4. CO2 Adsorption Kinetics
Adsorption kinetics play a crucial role in determining the productivity of adsorbents and the separation efficiency of gas mixtures. An ideal CO2 adsorbent must exhibit rapid adsorption kinetics.
The kinetic performance of the optimal sample, NC2-500-600, was evaluated at 25 °C, as shown in Figure 11. The adsorbent demonstrated exceptionally fast adsorption rates, reaching 90% of its equilibrium adsorption capacity within 3 min and 95% within 5 min. Such rapid kinetics significantly shorten the adsorption cycle duration and enhance process efficiency, underscoring the high potential of NC2-500-600 for industrial CO2 capture applications.
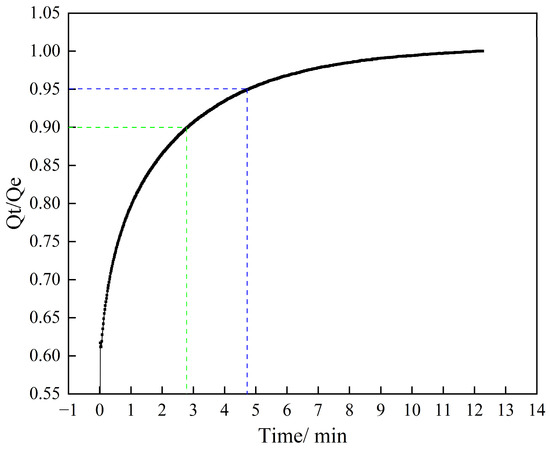
Figure 11.
Relationship between CO2 adsorption percentage and adsorption time of NC2-500-600.
3.5. Comparison with Other Resin-Derived Carbons
The properties of carbon materials derived from various resins in different studies are summarized in Table 4. While some of the reported carbons demonstrate considerable CO2 uptake, they generally share common limitations with most existing works, such as reliance on chemical activation routes or complex synthesis procedures. In contrast, the N-doped carbon developed in this work through physical activation not only achieves competitive CO2 adsorption capacity and high selectivity, but also benefits from a straightforward and cost-effective process [61]. These advantages position our material as a promising candidate for practical industrial implementation.
Table 4.
The adsorption performance of other resin-derived carbons.
4. Conclusions
Nitrogen-doped activated carbons were synthesized using phenolic resin as the precursor and melamine as the nitrogen source. By varying the melamine doping ratio, carbonization temperature, and activation temperature, a series of samples was prepared and systematically characterized in terms of structure, composition, and adsorption performance:
- (1)
- An appropriate amount of nitrogen doping enhances CO2 adsorption performance, whereas excessive doping leads to pore structure deterioration and reduced adsorption capacity.
- (2)
- Carbonization temperature had a limited effect on pore development, and higher activation temperatures promoted more extensive porosity but also broadened the pore size distribution, reducing the proportion of narrow micropores and thus diminishing low-pressure adsorption capacity and separation selectivity.
- (3)
- The obtained materials were amorphous activated carbons with abundant micropores and high specific surface area. Nitrogen was primarily incorporated as pyridinic-N (N-6), and its content increased with the doping ratio but decreased at elevated carbonization and activation temperatures.
The results indicate the CO2 adsorption performance was collectively influenced by microporous volume, total pore volume, specific surface area, micropore size distribution, nitrogen content, and nitrogen configuration. Under the conditions of 25 °C and 1 bar, the optimal sample achieved a CO2 adsorption capacity of 2.455 mmol·g−1 and a separation factor exceeding 28. In addition, the adsorbent exhibited excellent cyclic stability, and rapid adsorption kinetics. Furthermore, the proposed synthesis route offers notable advantages for large-scale application. The precursors, phenolic resin and melamine, are inexpensive and readily available. The process itself is straightforward, involving only carbonization followed by physical activation using CO2, thereby avoiding the equipment corrosion, chemical pollution, and wastewater issues. These attributes underscore the industrial potential of the developed adsorbents, particularly for CO2 capture under realistic flue gas conditions.
Supplementary Materials
The following supporting information can be downloaded at: https://www.mdpi.com/article/10.3390/c11040084/s1. Samples Characterization.
Author Contributions
L.X., investigation, data curation, writing—original draft; J.P. and Z.N., supervision, analysis and writing—review and editing; W.L. and D.Z., supervision, project administration, and writing—review and editing. All authors have read and agreed to the published version of the manuscript.
Funding
This work was financially supported by the National Natural Science Foundation of China (NO. 22478282).
Data Availability Statement
The original contributions presented in this study are included in the article/Supplementary Materials. Further inquiries can be directed to the corresponding author.
Conflicts of Interest
The authors declare no conflicts of interest.
References
- Chen, J.X.; Bao, A.; Siqin, D. N/S Dually Doped Nanoporous Carbon for CO2 Adsorption. ACS Appl. Nano Mater. 2024, 7, 12184–12193. [Google Scholar] [CrossRef]
- Ren, F.; Liu, W. Review of CO2 Adsorption Materials and Utilization Technology. Catalysts 2023, 13, 1176. [Google Scholar] [CrossRef]
- Boot-Handford, M.E.; Abanades, J.C.; Anthony, E.J.; Blunt, M.J.; Brandani, S.; Dowell, N.M.; Fernández, J.R.; Ferrari, M.-C.; Gross, R.; Hallett, J.P.; et al. Carbon Capture and Storage Update. Energy Environ. Sci. 2013, 7, 130–189. [Google Scholar] [CrossRef]
- Meng, F.; Meng, Y.; Ju, T.; Han, S.; Lin, L.; Jiang, J. Research Progress of Aqueous Amine Solution for CO2 Capture: A Review. Renew. Sustain. Energy Rev. 2022, 168, 112902. [Google Scholar] [CrossRef]
- Lashaki, M.J.; Khiavi, S.; Sayari, A. Stability of Amine-Functionalized CO2 Adsorbents: A Multifaceted Puzzle. Chem. Soc. Rev. 2019, 48, 3320–3405. [Google Scholar] [CrossRef]
- Plaza, M.G.; Pevida, C.; Arias, B.; Fermoso, J.; Casal, M.D.; Martín, C.F.; Rubiera, F.; Pis, J.J. Development of Low-Cost Biomass-Based Adsorbents for Postcombustion CO2 Capture. Fuel 2009, 88, 2442–2447. [Google Scholar] [CrossRef]
- Wu, T.; Wang, Z.; Wang, Y.; Ren, H.; Li, W.; Tang, Z.; Zhang, D. Investigations of Turbulence Influence on Pressure Swing Adsorption Process for CO2 Capture by Computational Mass Transfer. J. Environ. Chem. Eng. 2023, 11, 110485. [Google Scholar] [CrossRef]
- Younas, M.; Rezakazemi, M.; Daud, M.; Wazir, M.B.; Ahmad, S.; Ullah, N.; Inamuddin; Ramakrishna, S. Recent Progress and Remaining Challenges in Post-Combustion CO2 Capture Using Metal-Organic Frameworks (MOFs). Prog. Energy Combust. Sci. 2020, 80, 100849. [Google Scholar] [CrossRef]
- Wang, J.; Shen, Y.; Zhang, D.; Tang, Z.; Li, W. Integrated Vacuum Pressure Swing Adsorption and Rectisol Process for CO2 Capture from Underground Coal Gasification Syngas. Chin. J. Chem. Eng. 2023, 57, 265–279. [Google Scholar] [CrossRef]
- Pellegrini, L.A.; Moioli, S.; Gamba, S. Energy Saving in a CO2 Capture Plant by MEA Scrubbing. Chem. Eng. Res. Des. 2011, 89, 1676–1683. [Google Scholar] [CrossRef]
- Radosz, M.; Hu, X.; Krutkramelis, K.; Shen, Y. Flue-Gas Carbon Capture on Carbonaceous Sorbents: Toward a Low-Cost Multifunctional Carbon Filter for “Green” Energy Producers. Ind. Eng. Chem. Res. 2008, 47, 3783–3794. [Google Scholar] [CrossRef]
- Shafeeyan, M.S.; Daud, W.M.A.W.; Houshmand, A.; Shamiri, A. A Review on Surface Modification of Activated Carbon for Carbon Dioxide Adsorption. J. Anal. Appl. Pyrolysis 2010, 89, 143–151. [Google Scholar] [CrossRef]
- Sarwar, A.; Ali, M.; Khoja, A.H.; Nawar, A.; Waqas, A.; Liaquat, R.; Naqvi, S.R.; Asjid, M. Synthesis and Characterization of Biomass-Derived Surface-Modified Activated Carbon for Enhanced CO2 Adsorption. J. CO2 Util. 2021, 46, 101476. [Google Scholar] [CrossRef]
- Sneddon, G.; Greenaway, A.; Yiu, H.H.P. The Potential Applications of Nanoporous Materials for the Adsorption, Separation, and Catalytic Conversion of Carbon Dioxide. Adv. Energy Mater. 2014, 4, 1301873. [Google Scholar] [CrossRef]
- Ramdin, M.; de Loos, T.W.; Vlugt, T.J.H. State-of-the-Art of CO2 Capture with Ionic Liquids. Ind. Eng. Chem. Res. 2012, 51, 8149–8177. [Google Scholar] [CrossRef]
- Rashidi, N.A.; Yusup, S. An Overview of Activated Carbons Utilization for the Post-Combustion Carbon Dioxide Capture. J. CO2 Util. 2016, 13, 1–16. [Google Scholar] [CrossRef]
- Hasib-ur-Rahman, M.; Siaj, M.; Larachi, F. CO2 Capture in Alkanolamine/Room-Temperature Ionic Liquid Emulsions: A Viable Approach with Carbamate Crystallization and Curbed Corrosion Behavior. Int. J. Greenh. Gas Control 2012, 6, 246–252. [Google Scholar] [CrossRef]
- Aaron, D.; Tsouris, C. Separation of CO2 from Flue Gas: A Review. Sep. Sci. Technol. 2005, 40, 321–348. [Google Scholar] [CrossRef]
- Wang, S.; Li, X.; Wu, H.; Tian, Z.; Xin, Q.; He, G.; Peng, D.; Chen, S.; Yin, Y.; Jiang, Z.; et al. Advances in High Permeability Polymer-Based Membrane Materials for CO2 Separations. Energy Environ. Sci. 2016, 9, 1863–1890. [Google Scholar] [CrossRef]
- Khalilpour, R.; Mumford, K.; Zhai, H.; Abbas, A.; Stevens, G.; Rubin, E.S. Membrane-Based Carbon Capture from Flue Gas: A Review. J. Clean. Prod. 2015, 103, 286–300. [Google Scholar] [CrossRef]
- Yu, C.-H.; Huang, C.-H.; Tan, C.-S. A Review of CO2 Capture by Absorption and Adsorption. Aerosol Air Qual. Res. 2012, 12, 745–769. [Google Scholar] [CrossRef]
- Hou, R.; Fong, C.; Freeman, B.D.; Hill, M.R.; Xie, Z. Current Status and Advances in Membrane Technology for Carbon Capture. Sep. Purif. Technol. 2022, 300, 121863. [Google Scholar] [CrossRef]
- Luis, P.; Van Gerven, T.; Van der Bruggen, B. Recent Developments in Membrane-Based Technologies for CO2 Capture. Prog. Energy Combust. Sci. 2012, 38, 419–448. [Google Scholar] [CrossRef]
- Scholes, C.A. Challenges for CO2 Capture by Membranes. In Advances in Carbon Capture; Rahimpour, M.R., Farsi, M., Makarem, M.A., Eds.; Woodhead Publishing: Cambridge, UK, 2020; pp. 357–377. ISBN 978-0-12-819657-1. [Google Scholar]
- Siagian, U.W.R.; Raksajati, A.; Himma, N.F.; Khoiruddin, K.; Wenten, I.G. Membrane-Based Carbon Capture Technologies: Membrane Gas Separation vs. Membrane Contactor. J. Nat. Gas Sci. Eng. 2019, 67, 172–195. [Google Scholar] [CrossRef]
- Ben-Mansour, R.; Habib, M.A.; Bamidele, O.E.; Basha, M.; Qasem, N.A.A.; Peedikakkal, A.; Laoui, T.; Ali, M. Carbon Capture by Physical Adsorption: Materials, Experimental Investigations and Numerical Modeling and Simulations—A Review. Appl. Energy 2016, 161, 225–255. [Google Scholar] [CrossRef]
- Su, Y.; Liu, S.; Gao, X. Impact of Impure Gas on CO2 Capture from Flue Gas Using Carbon Nanotubes: A Molecular Simulation Study. Molecules 2022, 27, 1627. [Google Scholar] [CrossRef]
- Jiang, L.; Liu, W.; Wang, R.Q.; Gonzalez-Diaz, A.; Rojas-Michaga, M.F.; Michailos, S.; Pourkashanian, M.; Zhang, X.J.; Font-Palma, C. Sorption Direct Air Capture with CO2 Utilization. Prog. Energy Combust. Sci. 2023, 95, 101069. [Google Scholar] [CrossRef]
- Chen, S.; Wu, W.; Niu, Z.; Kong, D.; Li, W.; Tang, Z.; Zhang, D. High Adsorption Selectivity of Activated Carbon and Carbon Molecular Sieve Boosting CO2/N2 and CH4/N2 Separation. Chin. J. Chem. Eng. 2024, 67, 282–297. [Google Scholar] [CrossRef]
- Sattari, A.; Ramazani, A.; Aghahosseini, H.; Aroua, M.K. The Application of Polymer Containing Materials in CO2 Capturing via Absorption and Adsorption Methods. J. CO2 Util. 2021, 48, 101526. [Google Scholar] [CrossRef]
- Ding, M.; Flaig, R.W.; Jiang, H.-L.; Yaghi, O.M. Carbon Capture and Conversion Using Metal–Organic Frameworks and MOF-Based Materials. Chem. Soc. Rev. 2019, 48, 2783–2828. [Google Scholar] [CrossRef]
- Varghese, A.M.; Karanikolos, G.N. CO2 Capture Adsorbents Functionalized by Amine—Bearing Polymers: A Review. Int. J. Greenh. Gas Control 2020, 96, 103005. [Google Scholar] [CrossRef]
- Singh, G.; Lakhi, K.S.; Sil, S.; Bhosale, S.V.; Kim, I.; Albahily, K.; Vinu, A. Biomass Derived Porous Carbon for CO2 Capture. Carbon 2019, 148, 164–186. [Google Scholar] [CrossRef]
- Mochizuki, Y.; Bud, J.; Byambajav, E.; Tsubouchi, N. Influence of Ammonia Treatment on the CO2 Adsorption of Activated Carbon. J. Environ. Chem. Eng. 2022, 10, 107273. [Google Scholar] [CrossRef]
- Wang, L.; Yang, R.T. Significantly Increased CO2 Adsorption Performance of Nanostructured Templated Carbon by Tuning Surface Area and Nitrogen Doping. J. Phys. Chem. C 2012, 116, 1099–1106. [Google Scholar] [CrossRef]
- Abid, M.; Martínez-Escandell, M.; Silvestre-Albero, J. NaOH-Modified Activated Carbon Materials for Hydrogen Sulfide Removal. C—J. Carbon Res. 2025, 11, 68. [Google Scholar] [CrossRef]
- Choma, J.; Jedynak, K.; Fahrenholz, W.; Ludwinowicz, J.; Jaroniec, M. Microporosity Development in Phenolic Resin-Based Mesoporous Carbons for Enhancing CO2 Adsorption at Ambient Conditions. Appl. Surf. Sci. 2014, 289, 592–600. [Google Scholar] [CrossRef]
- Siemak, J.; Wróbel, R.J.; Pęksiński, J.; Michalkiewicz, B. Investigation of CO2 Adsorption on Avocado Stone-Derived Activated Carbon Obtained through NaOH Treatment. Materials 2023, 16, 4390. [Google Scholar] [CrossRef]
- Song, C.; Ye, W.; Liu, Y.; Huang, H.; Zhang, H.; Lin, H.; Lu, R.; Zhang, S. Facile Preparation of Porous Carbon Derived from Industrial Biomass Waste as an Efficient CO2 Adsorbent. ACS Omega 2020, 5, 28255–28263. [Google Scholar] [CrossRef]
- Sanz-Pérez, E.S.; Murdock, C.R.; Didas, S.A.; Jones, C.W. Direct Capture of CO2 from Ambient Air. Chem. Rev. 2016, 116, 11840–11876. [Google Scholar] [CrossRef]
- Li, Y.; Liu, N.; Zhang, T.; Wang, B.; Wang, Y.; Wang, L.; Wei, J. Highly Microporous Nitrogen-Doped Carbons from Anthracite for Effective CO2 Capture and CO2/CH4 Separation. Energy 2020, 211, 118561. [Google Scholar] [CrossRef]
- Yue, L.; Xia, Q.; Wang, L.; Wang, L.; DaCosta, H.; Yang, J.; Hu, X. CO2 Adsorption at Nitrogen-Doped Carbons Prepared by K2CO3 Activation of Urea-Modified Coconut Shell. J. Colloid Interface Sci. 2018, 511, 259–267. [Google Scholar] [CrossRef]
- Liu, S.; Rao, L.; Yang, P.; Wang, X.; Wang, L.; Ma, R.; Yue, L.; Hu, X. Superior CO2 Uptake on Nitrogen Doped Carbonaceous Adsorbents from Commercial Phenolic Resin. J. Environ. Sci. 2020, 93, 109–116. [Google Scholar] [CrossRef]
- de Souza, L.K.C.; Wickramaratne, N.P.; Ello, A.S.; Costa, M.J.F.; da Costa, C.E.F.; Jaroniec, M. Enhancement of CO2 Adsorption on Phenolic Resin-Based Mesoporous Carbons by KOH Activation. Carbon 2013, 65, 334–340. [Google Scholar] [CrossRef]
- Spessato, L.; Duarte, V.A.; Fonseca, J.M.; Arroyo, P.A.; Almeida, V.C. Nitrogen-Doped Activated Carbons with High Performances for CO2 Adsorption. J. CO2 Util. 2022, 61, 102013. [Google Scholar] [CrossRef]
- Wang, Z.; Goyal, N.; Liu, L.; Tsang, D.C.W.; Shang, J.; Liu, W.; Li, G. N-Doped Porous Carbon Derived from Polypyrrole for CO2 Capture from Humid Flue Gases. Chem. Eng. J. 2020, 396, 125376. [Google Scholar] [CrossRef]
- Liu, Z.; Du, Z.; Song, H.; Wang, C.; Subhan, F.; Xing, W.; Yan, Z. The Fabrication of Porous N-Doped Carbon from Widely Available Urea Formaldehyde Resin for Carbon Dioxide Adsorption. J. Colloid Interface Sci. 2014, 416, 124–132. [Google Scholar] [CrossRef] [PubMed]
- Rao, L.; Liu, S.; Wang, L.; Ma, C.; Wu, J.; An, L.; Hu, X. N-Doped Porous Carbons from Low-Temperature and Single-Step Sodium Amide Activation of Carbonized Water Chestnut Shell with Excellent CO2 Capture Performance. Chem. Eng. J. 2019, 359, 428–435. [Google Scholar] [CrossRef]
- Dang, W.; Lin, Q.; Pan, H.; Zhang, D. Facile Preparation of N-Doped Porous Carbon and Its CO2 Gas Adsorption Performance. J. Mater. Sci. 2022, 57, 12438–12448. [Google Scholar] [CrossRef]
- Kim, C.; Talapaneni, S.N.; Dai, L. Porous Carbon Materials for CO2 Capture, Storage and Electrochemical Conversion. Mater. Rep. Energy 2023, 3, 100199. [Google Scholar] [CrossRef]
- Liu, S.; Li, Q.; Wang, L.; Ma, R.; Zou, J.; Huang, L.; Hu, X. Facile Single-Step Synthesis of Porous Carbons as Efficient CO2 Adsorbents. Energy Fuels 2019, 33, 11544–11551. [Google Scholar] [CrossRef]
- Yaumi, A.L.; Bakar, M.Z.A.; Hameed, B.H. Melamine-Nitrogenated Mesoporous Activated Carbon Derived from Rice Husk for Carbon Dioxide Adsorption in Fixed-Bed. Energy 2018, 155, 46–55. [Google Scholar] [CrossRef]
- Zhao, C.; Ge, L.; Li, X.; Zuo, M.; Xu, C.; Chen, S.; Li, Q.; Wang, Y.; Xu, C. Effects of the Carbonization Temperature and Intermediate Cooling Mode on the Properties of Coal-Based Activated Carbon. Energy 2023, 273, 127177. [Google Scholar] [CrossRef]
- Heidarinejad, Z.; Dehghani, M.H.; Heidari, M.; Javedan, G.; Sillanpää, M. Methods for Preparation and Activation of Activated Carbon: A Review. Environ. Chem. Lett. 2020, 18, 393–415. [Google Scholar] [CrossRef]
- Zhu, Y.; Gao, J.; Li, Y.; Sun, F.; Gao, J.; Wu, S.; Qin, Y. Preparation of Activated Carbons for SO2 Adsorption by CO2 and Steam Activation. J. Taiwan Inst. Chem. Eng. 2012, 43, 112–119. [Google Scholar] [CrossRef]
- Kruk, M.; Jaroniec, M. Gas Adsorption Characterization of Ordered Organic−Inorganic Nanocomposite Materials. Chem. Mater. 2001, 13, 3169–3183. [Google Scholar] [CrossRef]
- Tiwari, D.; Bhunia, H.; Bajpai, P.K. Synthesis of Nitrogen Enriched Porous Carbons from Urea Formaldehyde Resin and Their Carbon Dioxide Adsorption Capacity. J. CO2 Util. 2017, 21, 302–313. [Google Scholar] [CrossRef]
- Liu, S.; Ma, R.; Hu, X.; Wang, L.; Wang, X.; Radosz, M.; Fan, M. CO2 Adsorption on Hazelnut-Shell-Derived Nitrogen-Doped Porous Carbons Synthesized by Single-Step Sodium Amide Activation. Ind. Eng. Chem. Res. 2020, 59, 7046–7053. [Google Scholar] [CrossRef]
- Yang, M.; Guo, L.; Hu, G.; Hu, X.; Xu, L.; Chen, J.; Dai, W.; Fan, M. Highly Cost-Effective Nitrogen-Doped Porous Coconut Shell-Based CO2 Sorbent Synthesized by Combining Ammoxidation with KOH Activation. Environ. Sci. Technol. 2015, 49, 7063–7070. [Google Scholar] [CrossRef]
- Li, Q.; Liu, S.; Wang, L.; Chen, F.; Shao, J.; Hu, X. Efficient Nitrogen Doped Porous Carbonaceous CO2 Adsorbents Based on Lotus Leaf. J. Environ. Sci. 2021, 103, 268–278. [Google Scholar] [CrossRef]
- Krupadam, R.J.; Rayalu, S.S. Melamine-Based Resins and Their Carbons for CO2 Capture: A Review. Emergent Mater. 2021, 4, 545–563. [Google Scholar] [CrossRef]
- Tian, L.; Zhi, Y.; Yu, Q.; Xu, Q.; Demir, M.; Colak, S.G.; Farghaly, A.A.; Wang, L.; Hu, X. Enhanced CO2 Adsorption Capacity in Highly Porous Carbon Materials Derived from Melamine-Formaldehyde Resin. Energy Fuels 2024, 38, 13186–13195. [Google Scholar] [CrossRef]
- Wei, M.; Zhao, Q. CO2 Adsorption and Desorption by Waste Ion-Exchange Resin–Based Activated Carbon on Fixed Bed. Front. Energy Res. 2021, 9, 772710. [Google Scholar] [CrossRef]
- Ouyang, L.; Xiao, J.; Jiang, H.; Yuan, S. Nitrogen-Doped Porous Carbon Materials Derived from Graphene Oxide/Melamine Resin Composites for CO2 Adsorption. Molecules 2021, 26, 5293. [Google Scholar] [CrossRef]
- Yue, L.; Rao, L.; Wang, L.; Sun, Y.; Wu, Z.; DaCosta, H.; Hu, X. Enhanced CO2 Adsorption on Nitrogen-Doped Porous Carbons Derived from Commercial Phenolic Resin. Energy Fuels 2018, 32, 2081–2088. [Google Scholar] [CrossRef]
- Yu, Q.; Bai, J.; Huang, J.; Demir, M.; Farghaly, A.A.; Aghamohammadi, P.; Hu, X.; Wang, L. One-Pot Synthesis of Melamine Formaldehyde Resin-Derived N-Doped Porous Carbon for CO2 Capture Application. Molecules 2023, 28, 1772. [Google Scholar] [CrossRef]
Disclaimer/Publisher’s Note: The statements, opinions and data contained in all publications are solely those of the individual author(s) and contributor(s) and not of MDPI and/or the editor(s). MDPI and/or the editor(s) disclaim responsibility for any injury to people or property resulting from any ideas, methods, instructions or products referred to in the content. |
© 2025 by the authors. Licensee MDPI, Basel, Switzerland. This article is an open access article distributed under the terms and conditions of the Creative Commons Attribution (CC BY) license (https://creativecommons.org/licenses/by/4.0/).