Article

Comparative Study of Graphite Exfoliation Techniques Using Nafion as a Surfactant

by
Anna O. Krasnova
1,*,
Nadezhda V. Glebova
1,
Andrey A. Nechitailov
1,
Angelina G. Kastsova
1,
Anna O. Pelageikina
1,
Demid A. Kirilenko
1,
Alexander V. Shvidchenko
1,
Mikhail S. Shestakov
1,
Aleksandra V. Koroleva
2 and
Ekaterina K. Khrapova
1
1
Ioffe Institute, 26 Polytechnicheskaya, Saint Petersburg 194021, Russia
2
Research Park, St. Petersburg State University, 7/9 Universitetskaya Emb., Saint Petersburg 199034, Russia
*
Author to whom correspondence should be addressed.
Submission received: 22 August 2025 / Revised: 30 September 2025 / Accepted: 5 October 2025 / Published: 9 October 2025
(This article belongs to the Section Carbon Materials and Carbon Allotropes)

Abstract

This work presents a comparative study of graphene exfoliation technologies from various graphite precursors—spectral graphite and thermally expanded graphite (Graflex)—using ultrasonic treatment and electrochemical methods in the presence of the ionic surfactant Nafion. The influence of exfoliation parameters, the nature of the starting material, and the presence of surfactant additives on the morphology, dispersibility, stability, and structural characteristics of the resulting graphene-containing dispersions was investigated. Particular attention is paid to a two-step technology combining pulsed electrochemical exfoliation with subsequent mild ultrasonic treatment. Comprehensive characterization of the samples was carried out using UV–Vis spectroscopy, X-ray diffraction (XRD), thermogravimetric analysis (TGA), electron microscopy, electron diffraction (ED), dynamic light scattering (DLS), and X-ray photoelectron spectroscopy (XPS). It was found that the use of Nafion significantly enhances exfoliation efficiency and contributes to the stabilization of the dispersions. Graphene sheets obtained from Graflex exhibit significantly larger lateral dimensions (up to 1 μm or more) compared to those exfoliated from spectral graphite (100–300 nm). The approach combining the use of Graflex and pulsed electrochemical exfoliation in the presence of Nafion with subsequent low-power ultrasonic treatment enables the production of few-layer graphene (1–3 layers) with high stability.

1. Introduction

Graphene has found wide applications in various industries due to its outstanding mechanical, electrical, thermal, and optical properties [1,2].
The unique properties of graphene, such as its almost two-dimensional structure [3], high electrical and thermal conductivities [4,5], and high charge carrier mobility [6], have led to attempts to apply it in various engineering fields. Several studies have explored the use of graphene-containing composites for corrosion protection. Materials based on graphene and polymer Nafion [7], as well as those including graphene, boron nitride, and polyaniline [8], have been reported. The role of graphene in enhancing the thermal stability of Nafion-type polymers has been demonstrated [9]. Studies [10,11,12] have provided information on the use of graphene in supercapacitors, which is facilitated by its large specific surface area.
Graphene has recently gained attention for its application in hydrogen energy. In particular, graphene has been extensively investigated as a catalyst support in proton exchange membrane fuel cells (PEMFCs) and in water electrolyzers, especially at the cathode, where its high surface area, electrical conductivity, and structural stability can improve catalytic activity and durability. In addition, the incorporation of graphene-based materials as additives in membranes and electrodes is considered a promising approach to enhance proton conductivity and to improve the thermal and mechanical stability of electrochemical systems. Pavko et al. [13] described the use of graphene in proton exchange membrane fuel cells (PEMFC). The study also presents a scalable method for synthesizing platinum-based electrocatalysts on graphene-derived supports. Liu et al. [14] reported the fabrication and investigation of a PEM based on graphene oxide. Samantaray et al. [15] reviewed the recent advances in graphene-based cathode materials for fuel cell applications. It has been reported that the large surface area, high conductivity, and mechanical durability of graphene make it highly suitable for use in various solid oxide fuel cells as well as in PEMFCs. Pham et al. [16] investigated the electronic properties and electrocatalytic activity of phosphorus-doped bilayer graphene toward the oxygen reduction reaction (ORR) in sulfuric acid solution. The potential of using such a platinum-free catalyst is demonstrated. Materials based on graphene and the polymer Nafion have been described [7], as well as materials composed of graphene, boron nitride, and polyaniline [8]. The role of graphene in increasing the thermal stability of polymers such as Nafion has been shown [9]. Studies [10,11,12] report on the application of graphene in supercapacitors, enabled by its high specific surface area.
Graphene is commonly produced using two fundamental approaches: top-down methods involving the exfoliation of graphite and other carbon materials [17,18] by chemical or mechanical cleavage of graphite layers, and bottom-up methods, which involve the deposition of graphite layers onto a substrate, for example, by chemical vapor deposition.
Recent reviews emphasize that no universal method for graphene synthesis, capable of meeting all requirements, has yet been achieved. Liquid-phase exfoliation provides an accessible route to graphene dispersions, but suffers from limitations in flake size and structural defects. Reduction of graphene oxide can yield bulk quantities of material but introduces residual defects that degrade electronic properties. Epitaxial growth on silicon carbide enables high-quality graphene, but requires expensive substrates and extreme conditions. Meanwhile, methods employing surfactants or polymers (e.g., Nafion) can simultaneously facilitate exfoliation and stabilize the resulting graphene, thereby minimizing issues related to stabilizer removal while preserving the intrinsic properties of graphene. Such approaches open promising opportunities for applications in electrochemistry and related fields [19].
Mechanical exfoliation is the best-known among these techniques. Graphene was first obtained using adhesive tape to mechanically peel off graphite layers by Geim and Novoselov in 2004 [4]. However, despite producing low-defect graphene, this approach is limited by its very low production yield. This approach has evolved into combined mechanical and chemical methods [20,21,22]. A widely used and cost-effective method for large-scale graphene production is the chemical exfoliation of graphite using the well-known Hummers’ method [23]. Nevertheless, this process has certain drawbacks, such as potential structural defects in the sheets of reduced graphene oxide (rGO). This often results in low electrical conductivity. Furthermore, this method largely relies on the removal of functional groups through chemical or thermal reduction. For example, Johra et al. [24] studied graphene oxide (GO), obtained using the Hummers’ method, and graphene reduced from oxide. It is reported that the obtained graphene consists of multiple layers and exhibits an intense D band in Raman spectra, indicating defects that may be caused by ultrasonic (US) treatment. It is noted that this can affect the quality of graphene, which is one of the disadvantages of the solution-based approach.
Alternative approaches include liquid-phase exfoliation of graphite, epitaxial growth on SiC, reduction of graphene oxide, and chemical vapor deposition (CVD). Among these, CVD is considered the most promising for the fabrication of large-area graphene films; however, it requires high temperatures and complicated transfer processes, which hinder its integration into devices. Pang et al. proposed an improved approach—extrinsic corrugation-assisted mechanical exfoliation (ECAME)—which allows the preparation of monolayer graphene films with a high yield (>60%) directly on Si/SiO2 substrates, combining simplicity with scalability [25].
Methods based on electrochemical exfoliation of graphite form a distinct group [26,27,28,29]. The principle of these methods is based on the intercalation of different ions or charged particles into the interlayer space of graphite. This process is driven by an electric field applied between the graphite (working) and auxiliary electrodes. Thus, an electrochemical process occurs, involving oxidation or reduction of the intercalated ions. As a result, fragments of the graphite structure are exfoliated, containing fewer layers than the original graphite, along with the release of reaction products.
Htwe et al. [28] described an electrochemical intercalation method for producing graphene. The influence of applied potential on the properties of exfoliated graphene was investigated. The findings demonstrated that a lower applied potential of 5 V led to the formation of thinner graphene with a lower defect density and enhanced thermal stability, as compared to the application of 10 V. Notably, the electrical conductivity of graphene obtained at 5 V (2.53 × 10⁻¹ S/cm) was higher than that at 10 V (6.33 × 10⁻² S/cm).
Carrasco et al. [26] reported an electrochemical method of anodic exfoliation of graphite in the presence of a combination of common salts/bases (NaCl, NaOH) as an aqueous electrolyte, aimed at producing highly oxidized graphenes with controlled oxygen group content while maintaining electrical conductivity (~102–103 S/m). It is noted that carboxyl-enriched anodic graphene has advantages over reduced graphene oxide when used in electrochemical devices. Carboxyl-enriched anodic graphene was pressed into a compact film and tested as a cathode material in aqueous zinc-ion hybrid capacitors. The material generally demonstrated higher capacitance and rate performance compared to both standard anodic graphene and reduced graphene oxides produced via conventional approaches, including the Hummers method.
Liquid-phase exfoliation of graphite under external force (e.g., mechanical stirring or ultrasonic field) represents the second widely used approach, an alternative to the Hummers method [30]. Narayan et al. [31] reviewed the achievements and limitations of liquid-phase graphene synthesis, including evaluation of the quality and yield of graphene sheets using various surfactants. The initial solvents were found to be toxic and had high boiling points, which encouraged the search for safer alternatives, such as water. However, pure water is not sufficiently effective, so various surfactants classified as aromatic, non-aromatic, ionic liquids, and polymers are therefore employed. The work highlights that several challenges must be addressed to enable further progress in liquid-phase exfoliation of graphite using surfactants. These include (1) the overall yield of liquid-phase exfoliation remains low; (2) effective exfoliating solvents are often expensive and toxic; (3) ultrasonic treatment typically leads to a significant reduction in the size of exfoliated graphene sheets; (4) residual surfactants are difficult to remove; (5) most commonly used surfactants are electrically insulating, which can severely impair interlayer electrical connectivity; and (6) liquid-phase exfoliation often produces graphene sheets with high polydispersity.
According to Griffin et al. [32], liquid-phase exfoliation has evolved significantly in recent years and is now a common technique for producing 2D materials. Surfactants are used to prevent the aggregation of nanosheets. Using WS2, the influence of surfactant type and concentration on the yield and size of the nanosheets was investigated. In the case of ionic surfactants, the exfoliation yield was stable at low concentrations but decreased significantly when the concentration exceeded ~10 mmol. A similar trend was observed for the length and thickness of the nanosheets. It was found that at a surfactant concentration of up to 0.07 mmol, stable dispersions with a zeta potential of >40 mV are formed. It is shown that the size and thickness of the nanosheets depend on the stabilization rather than the exfoliation process itself.
Thus, graphene and graphene materials, when using the “top-down” approach, are obtained by exfoliation of graphite mainly using four methods: dry mechanical exfoliation, chemical exfoliation (Hummers method), electrochemical exfoliation, and liquid-phase exfoliation under the action of external forces. To improve certain parameters of the technology, combinations of these methods are often employed. Electrochemical exfoliation is of particular interest, and is promising due to the possibility of fine-tuning process parameters such as electrode potential, current density, time, electrolyte composition, temperature, and others. Furthermore, it allows the introduction of certain alloying additives in order to modify the composition and surface of the graphene sheet.
The defect level, particle size, number of graphene layers, and monodispersity are influenced by the synthesis method, the starting material, and the extent of treatment (temperature, chemicals, ultrasound) applied to the precursor graphite. Milder conditions contribute to obtaining graphene with fewer defects and larger particle sizes.
The use of surfactants in graphite exfoliation allows for the process to be intensified, and the stability and size of particles to be controlled. However, their application is associated with several significant limitations: surfactants adsorb onto the graphene surface, forming stable surface complexes with high activation energy. This makes their subsequent removal difficult, which in turn either leads to aggregation of graphene layers upon surfactant desorption, or to distortion of the electronic structure and chemical properties of the material when surfactants remain. Thus, the presence of surfactants considerably restricts the practical utility of graphene systems.
The use of proton-exchange polymer Nafion makes it possible to avoid these drawbacks. This material performs a dual function: it simultaneously catalyzes the exfoliation process and stabilizes the obtained graphene material. As a widely employed component of electrochemical systems with mixed conductivity, Nafion integrates seamlessly into the composite without the need for removal. This ensures the preservation of the intrinsic properties of graphene and broadens its application range in electrochemistry and related fields.
Therefore, the proposed approach not only enhances the efficiency and stability of the exfoliation process but also offers a fundamental advantage over conventional surfactant-assisted methods, underscoring the novelty of the present study.
At this stage, the issue of controlling the characteristics of the obtained material becomes essential. Reliable analytical methods are required for the identification and evaluation of graphene and its derivatives. Due to the presence of characteristic electronic transitions in graphene-based materials (GO, few-layer graphene, graphene with various surface functional groups), electronic spectroscopy is one of the most powerful tools for studying these materials. Graphene is characterized by three peaks in the ultraviolet region of the spectrum: around 230, 265, and 310 nm. The first two peaks correspond to π–π*, while the third is attributed to n–π* transitions [24,33,34,35]. The π–π* absorption band is associated with the conjugated bonds in the hexagonal rings of graphite, whereas the n– π* is due to non-bonding electrons of functional groups (for example, oxygen-containing) of atoms. The position of the peaks (along the wavelength axis) depends on factors that influence the energy state of the electrons. Such factors include the composition and number of functional groups, the number of graphene layers, and possibly the compounds adsorbed on the surface.
Johra et al. [24] noted that the absorption spectra of the aqueous dispersion of GO in the UV-visible region display a peak at 235 nm, which corresponds to the π–π* electronic transition of sp2 C=C bonds. This peak shifts to a longer wavelength (265 nm) after the reduction of GO to graphene. This effect is attributed to the increase in π-conjugation [33]. As π-conjugation enhances, less energy is required for the transition, which corresponds to the observed shift in absorption to longer wavelengths. Lai et al. [34] demonstrated that GO dispersions containing a high percentage of few-layer (1–3 layers) GO can be distinguished from those with a high percentage of multilayer (4–10 layers) or thicker (>10 layers) GO by UV–visible spectroscopy through the analysis of the intensity of the peak at 230 nm. GO with few layers has a single peak, while GO with many layers has a shoulder. With the increase in the number of layers, the shoulder intensity of multilayer GO tends to decrease. The peak or shoulder is not observed for GO with a large number of layers (>10). This observation enabled a qualitative analysis of the GO dispersion. Empirical methods for determining the number of layers in graphene dispersions are also known, allowing for a comparative analysis of graphene stacks thickness.
An analysis of graphene testing methods and layer number evaluation in the material was conducted by Kumar et al. [36]. It is noted that the determination of graphene layer number is crucial because the unique properties of monolayer graphene gradually decrease with increasing layer count: up to 5 layers for few-layer graphene, up to 10 layers for multilayer graphene, and more than 10 layers, at which point the material behaves as bulk graphite. The study compares the effectiveness of determining the number of graphene layers using various characterization methods, such as transmission electron microscopy (TEM), atomic force microscopy (AFM), scanning electron microscopy (SEM), X-ray diffraction, electron diffraction, Raman spectroscopy and mapping, as well as spin Hall effect–based techniques. Among these methods, TEM and ED proved to be the most promising for determining the number of graphene layers and their stacking order.
The results of a study on the graphene production by electrochemical and ultrasound-assisted liquid-phase exfoliation of carbon materials in the presence of surfactants are presented in this paper.
The scientific significance and relevance of addressing the problem of degradation and insufficient energy conversion efficiency in water electrolyzers for hydrogen production arise from recent trends identifying hydrogen as one of the promising energy carriers. Meanwhile, the known issues of degradation in such electrolyzers and their relatively short service life necessitate the search for scientific and technical solutions to extend their lifespan and improve safety while maintaining acceptable performance levels.

2. Materials and Methods

2.1. Materials

Two types of graphite materials were used as precursors:
-
spectral graphite rods of grade EC-22 (length 19.9 cm, diameter 0.6 cm); density 1.65 g/cm3, porosity 25%, electrical resistivity ≤ 20 µOhm [37];
-
graphite foil made of thermally expanded graphite from Graflex®(Graflex, Podolsk, Russia), density ≤ 0.05 g/cm3;
A proton-conducting ionomer of the Nafion type was used as a surfactant, specifically the commercial product DE1021 (DuPont™, Wilmington, DE, USA), with an available acid capacity ≥ 0.92 meq/g and a total acid capacity in the range of 0.95–1.03 meq/g.
The electrolyte was prepared using extra pure sulfuric acid (Neva-Reaktiv, Saint Petersburg, Russia).

2.2. Methods

2.2.1. UV-Vis

Absorption spectra were recorded using a double-beam spectrophotometer Specord 210 (Analytik Jena, Jena, Germany) with WinAspect 2.2 software at a scan rate of 5 nm/s and a resolution of 0.1 nm. Sedimentation curves were obtained at a wavelength of 500 nm. A quartz cuvette with an optical path length of 1 cm was used. Reference solutions had the same composition as the dispersion medium of the studied samples: a mixture of isopropanol and water (1:1), n-propanol and water (1:1), or 0.5 M H2SO4 solution.

2.2.2. DTA

Thermogravimetric analysis was performed on a Mettler-Toledo TGA/DSC 1 derivatograph with STARe System v.16.40 software (Mettler-Toledo LLC, Columbus, OH, USA). Air was purged through the derivatograph chamber at a flow rate of 30 cm3·min−1. The temperature was ramped at a constant rate of 10 K·min−1 over the range of 35–1000 °C. Measurements were carried out at room temperature (~25 °C) and atmospheric pressure, with relative humidity between 40 and 50%. Samples weighing a few milligrams were placed in alumina crucibles. Mass loss (thermogravimetric, TG) and heat flow (differential thermal, DT) curves were recorded during heating.

2.2.3. XRD

X-ray diffraction analysis was carried out on a DRON-8N powder diffractometer (Bourevestnik, JSC, Saint Petersburg, Russia) using Bragg–Brentano geometry (copper anode x-ray tube, a Ni Kβ filter, and Cu Kα radiation, λ = 1.54186 Å). Data were acquired in the 2θ range of 5–120° with a step size of 0.0142° and an exposure time of 6 s per step. Sample rotation speed was 6 s per revolution. Measurements were performed using a low-background silicon sample holder. The system featured a linear position-sensitive detector Mythen2 R 1D° (DECTRIS Ltd., Dättwil AG, Switzerland) with a 4.48° angular opening and a Göbel mirror.
Processing of XRD patterns and calculations of the interlayer spacing (d) and coherent scattering region (CSR) were carried out using Rigaku SmartLAB Studio II v2.0 software.

2.2.4. DLS

Measurements were carried out using a Zetasizer Nano ZS analyzer (Malvern Panalytical, Malvern, United Kingdom) at a constant temperature of 25 °С. The dispersion medium consisted of a 1:1 volume ratio mixture of isopropanol and deionized water. A helium–neon laser (λ = 632.8 nm) served as the light source. Zeta potential values were calculated using the Smoluchowski equation.

2.2.5. XPS

XPS measurements were performed at the Research Center “Physical Methods of Surface Investigation” of St. Petersburg State University using an Escalab 250Xi spectrometer (Thermo Fisher Scientific Inc., Waltham, MA, USA) equipped with a monochromatic AlKα source (photon energy 1486.6 eV). The spectrometer was calibrated using the Au 4f7/2 line (binding energy 84.0 eV). The spectra were acquired in constant pass energy mode at 50 eV with an XPS spot size of 650 μm. The overall energy resolution of the experiment was approximately 0.3 eV. All measurements were conducted at room temperature under ultra-high vacuum conditions (~1 × 10⁻⁹ mbar). A combined ion-electron charge compensation system was used to neutralize sample charging. The spectra were deconvoluted using Avantage v5.9925 software (Thermo Fisher Scientific Inc., Waltham, MA, USA).

2.2.6. TEM and Electron Diffraction

Structural properties were investigated using TEM in cross-sectional geometry with a Jeol JEM-2100F microscope (Jeol, Tokyo, Japan) operated at 200 kV and a pixel resolution of 0.19 nm.

2.3. Calculations and Data Processing

To calculate the charge (Q) involved in the electrochemical exfoliation of the carbon material, the following equation was used:
Q = 0 t I t d t ,
where Q—total charge, C; I—current (А), t—exfoliation time (s).
Pulsed exfoliation was performed at two voltage levels: +3 V and −1.5 V. The charge corresponding to each level was calculated separately, enabling the evaluation of the contributions of the anodic and cathodic stages.
The XRD results were processed using established methodologies [36,38]. The anisotropy of particle shape was determined as the ratio of coherent scattering region sizes in the orthogonal (002) and parallel (100) directions with respect to the graphene layers, following standard approaches [39,40].
The degree of graphitization (G) was determined by the Mering-Maire formula according to the following relation:
G = 0.344 d 002 0.344 0.3354 ,
where the average interlayer spacing of an ideal graphite crystal is 0.3354 nm, and the average interplanar spacing of turbostratic graphite is 0.3440 nm.
Electrophoretic mobility (U) was calculated using the Helmholtz–Smoluchowski equation:
U = ξ ε ε 0 k π η ,
where U—electrophoretic mobility (m2/V*s); ξ—zeta potential (V); Ɛ—relative dielectric permittivity of the dispersion medium; Ɛ0—electric constant (8.85 × 10⁻¹² F/m); k—shape factor (6 for a sphere); η—dynamic viscosity of the dispersion medium.
The peak position, absorption spectrum shape, and extinction coefficients depend on the thickness of graphene nanosheets. The number of graphene layers (N) was determined using an empirical equation [41]:
N = 13.7 · A 550 A m a x 1.2 ,
where A550—optical density at a wavelength of 550 nm; Amax—maximum optical density.

2.4. Technologies of Few-Layer Graphene

Exfoliation of carbon materials was carried out using two technologies: (1) a single-step process involving high-power ultrasonic dispersion (liquid-phase exfoliation), and (2) a two-step process consisting of electrochemical exfoliation followed by dispersion using low-power ultrasound.

2.4.1. Ultrasound-Assisted Liquid-Phase Exfoliation (High-Power Ultrasound)

Dispersions were prepared with two carbon materials (spectral graphite and Graflex) and the surfactant Nafion to develop the ultrasonic dispersion process for graphene synthesis. The effect of various surfactant concentrations and duration of sonication on effectiveness of the exfoliation process was investigated. The most effective exfoliation parameters were used to scale up the process.
Due to the presence of both hydrophobic (carbon backbone: –CF2–CF2–) and hydrophilic (sulfonic acid groups: –SO3H) groups, Nafion exhibits surface-active properties and is expected to be adsorbed onto the surface of graphene layers (sheets). It facilitates the exfoliation of graphite layers through the redistribution of the electron density associated with the π-electrons.
Precise amount of carbon material (18 mg) and surfactant (4.5 mg, on a dry basis) were mixed in a flask, followed by the addition of 30 mL of an isopropanol–water mixture (1:1). The resulting dispersions were treated with high-power ultrasound (US) using a submerged titanium waveguide. A UZD1-1.0/22 ultrasonic disperser (LLC “UZVD“, Saint Petersburg, Russia) with 120 W sonication power and total power of 1 kW (FSUE Research Institute of High-Frequency Currents, Saint Petersburg, Russia) was used. Dispersion was carried out in 1.5 min intervals with 30 s pauses, with the vessel placed in an ice bath to prevent overheating and evaporation of the dispersion medium. When total sonication time (13, 25, or 45 min) had been reached, the dispersion was kept in the ice bath for another 5 min to ensure full cooling. The sonication power was 4 W/mL. The compositions and processing parameters are presented in Table 1.
UV-Vis spectroscopy (for determining the number of graphene layers) and sedimentation analysis with optical monitoring (for evaluating particle size and dispersion stability) were employed to evaluate the technology’s efficiency and identify the most promising systems. The criteria considered were:
-
number of graphene layers;
-
particle size;
-
monodispersity;
-
stability of the dispersion;
-
overall process efficiency, including product yield and exfoliation duration.
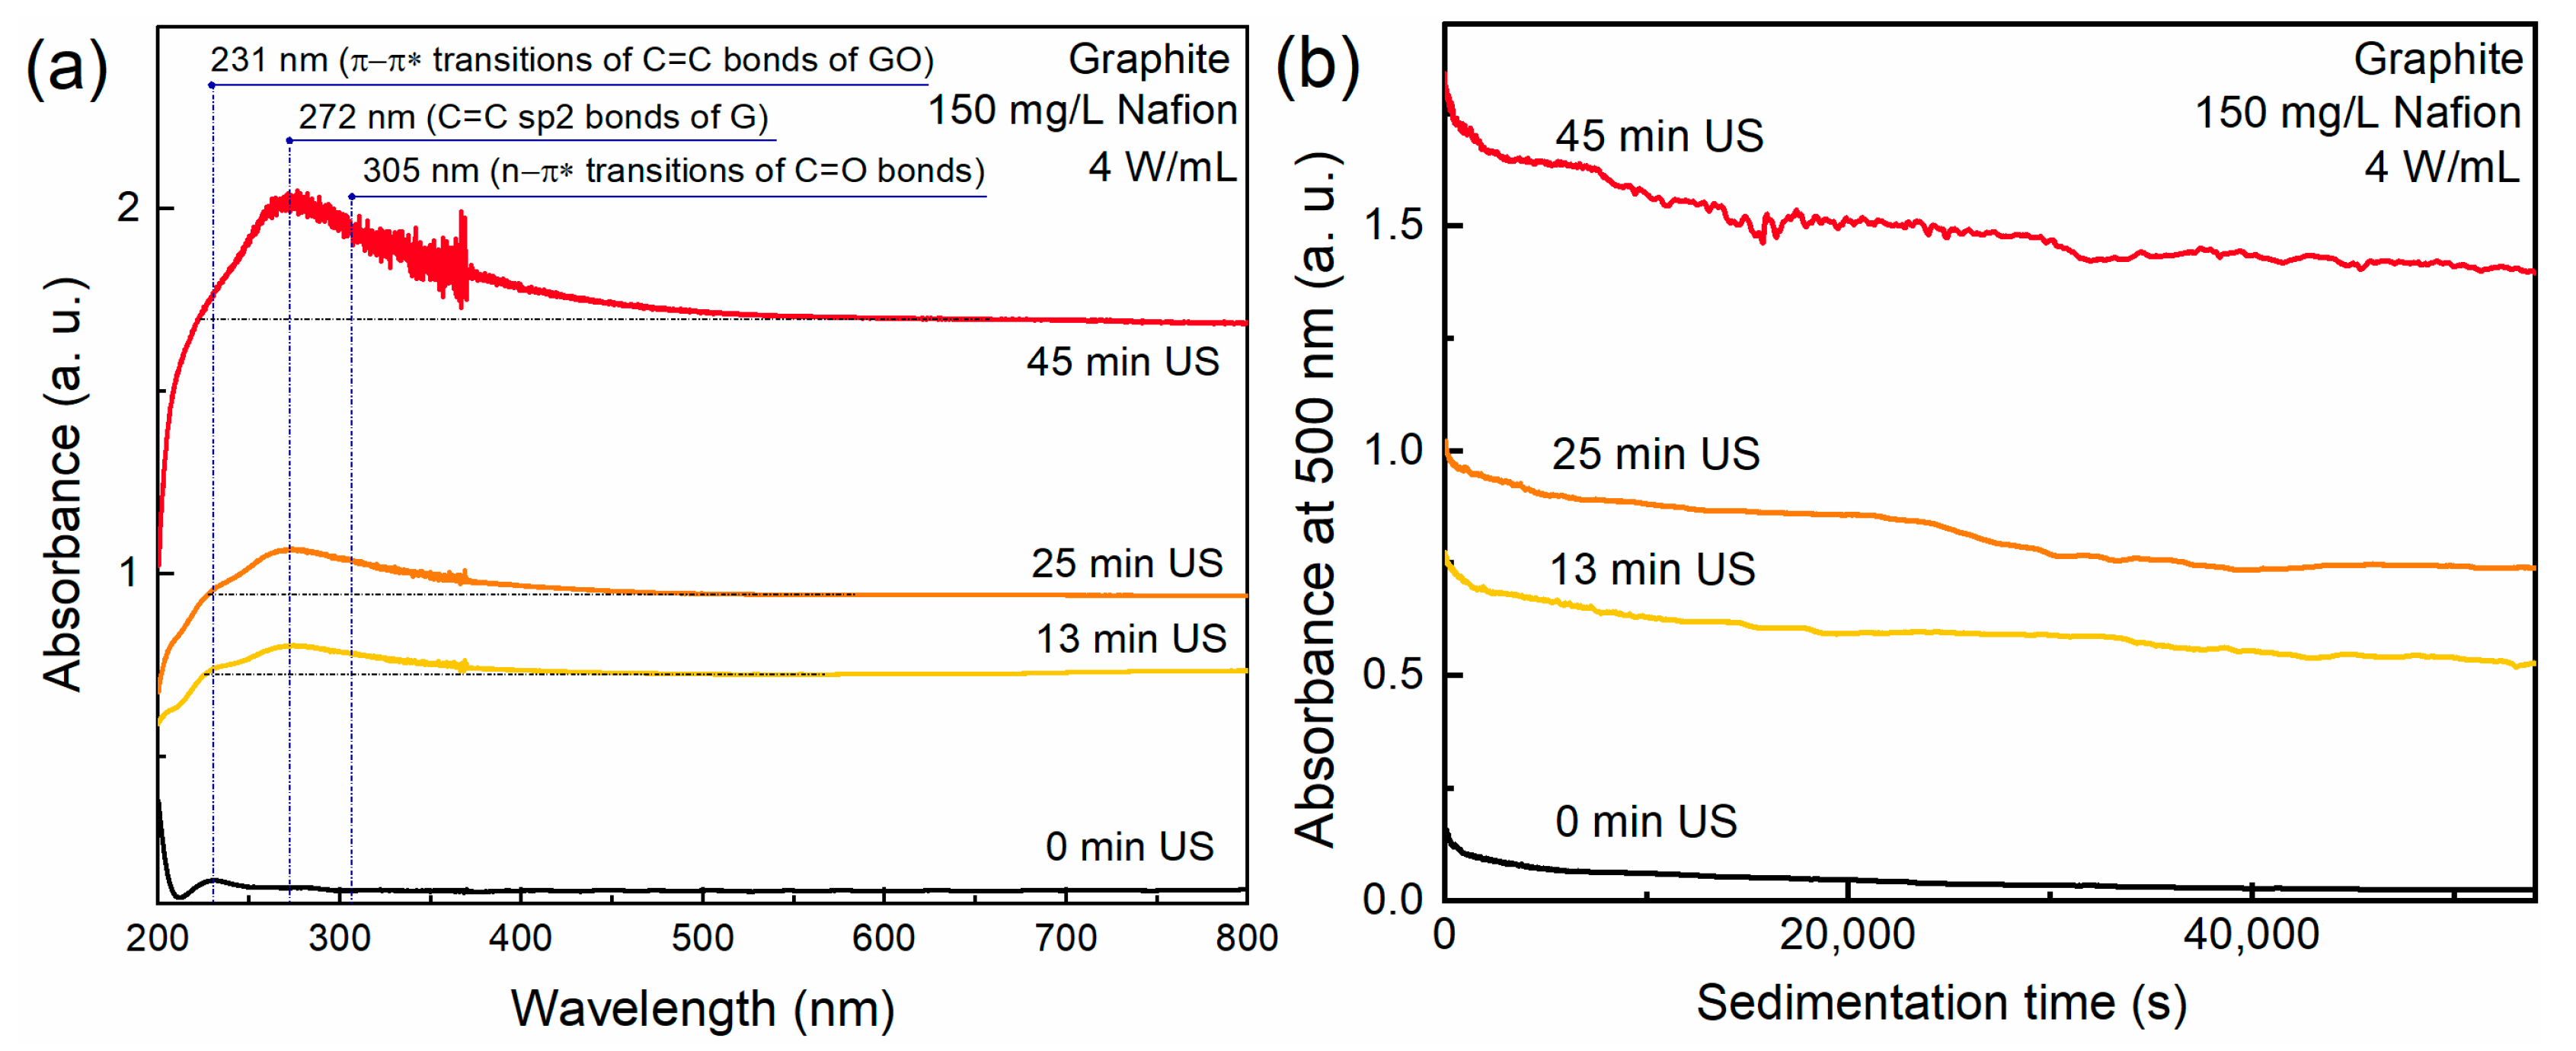
Figure 1a shows the UV-Vis absorption spectra of dispersions of spectral graphite and Graflex. The surfactant concentration in the dispersions was 150 mg/L, the ultrasound treatment time was 13 min, and the ultrasound power was 4 W/mL.
The absorption bands observed at approximately 235 nm and 273 nm are typically attributed to π–π* electronic transitions in C=C bonds of oxidized and reduced graphene, respectively, as reported by Luo et al. [42]. The absorption band near 305 nm, corresponding to the n–π* transition of electrons in C=O bonds, is not observed in the spectrum. An empirical correlation yielded a graphene layer count of 10 for the graphene dispersion and more than 11 for the spectral graphite dispersion (Graphite_US_13min), as presented in Table 2. The assessment of the number of layers is based on a comparative approach, enabling the analysis of peak intensities associated with π–π* electronic transitions in C=C bonds of reduced graphene; however, it does not represent the absolute layer count within a graphene stack. The slight shift in the absorption peak from 230 nm to 235 nm suggests a reduced presence of oxygen-containing groups [43].
The most pronounced dispersing effect, resulting in the formation of few-layer and weakly oxidized graphene, is observed in the dispersion with Graflex (Figure 1a). The elevated background in the range of 500–800 nm is attributed to light scattering by large particles that entered the dispersion during exfoliation. In the spectrum of the dispersion with spectral graphite, the peak near 273 nm is less distinct, and the background is lower, indicating the exfoliation of a smaller amount of few-layer graphene and fewer larger particles.
Absorption spectra of dispersions obtained with varying surfactant concentrations, using Nafion as the surfactant, are presented in Figure 1b. The strongest dispersing effect occurs at a Nafion concentration of 150 mg/L.
Figure 2a presents the absorption spectra of dispersions subjected to varying durations of US treatment. The spectrum of the untreated sample shows no distinct peaks within the investigated range. In contrast, the spectrum of the dispersion treated for 13 min exhibits bands near 231 nm and 272 nm. With increasing sonication time, the characteristic graphene peaks become more intense, accompanied by a rise in background absorption. The most pronounced effect is observed after 45 min of US treatment.
Figure 2b displays the sedimentation curves of dispersions prepared under varying durations of US treatment. As evident from the curves, the dispersion prior to sonication exhibited poor stability: the Graphite US 0min sample (untreated) showed the fastest sedimentation rate, with a half-settling time (τ1/2, the time at which the optical density drops to 50% of its initial value) of 1390 s. The most stable dispersions were those treated for 25 and 45 min, where the optical density decreased only to 0.73 and 0.76 of the initial level over the course of the experiment. The results of the sedimentation curve analysis are summarized in Table 3.
The most effective exfoliation effect was achieved with systems based on spectral graphite and Graflex after 45 min of sonication. To facilitate further material investigations, it was necessary to scale up the process. Dispersions were prepared with 755 mg of carbon material, 50 mL of dispersion medium, and a Nafion concentration of 100 mg/L. Additionally, a dispersion without surfactant was produced. US treatment was conducted at a power density of 2.4 W/mL. Following sonication, the dispersions were air-dried and weighed, and the product yield was determined. The compositions and technological parameters for the production of suspensions are given in Table 4.

2.4.2. Electrochemical Exfoliation Followed by Liquid-Phase Exfoliation Using Mild US Treatment

Electrochemical exfoliation (EE) was carried out using two types of carbon materials: spectral graphite and Graflex. An aqueous dispersion of Nafion DE1021 (DuPont™, Wilmington, DE, USA) was employed as a surfactant at a concentration of 100 mg/L in the electrolyte. A 0.5 M sulfuric acid solution served as the electrolyte. Two electrochemical modes were explored: pulsed potential application and potentiostatic control.
To perform the electrochemical exfoliation a three-electrode cell configuration was used. Two electrodes made of spectral graphite or Graflex were placed in the cell at a constant distance of 3.0 cm to ensure uniform current distribution. One of the electrodes was serving as the working electrode and the other as the counter electrode. The working electrode was immersed so that the mass of the submerged part was 755 mg (1.7 cm of immersion part). The non-submerged sections of the electrodes were insulated. An Ag/AgCl reference electrode (ESr-10101, 4.2 M, No. 08554, LLC “Izmeritelnaya Tekhnika”, Moscow, Russia) was used. The potential was controlled using an Elins P-150 potentiostat/galvanostat (Elins, Chernogolovka, Russia).
To implement the pulsed potential mode, a potential of +3 V was applied to the working electrode for 30 s, followed by −1.5 V for 30 s. This cycle was repeated until the active part of the working electrode was fully exfoliated into the dispersion. For the potentiostatic mode, a constant potential of +3 V was applied to the working electrode until complete exfoliation into the dispersion was achieved. Cyclic voltammograms (CVs) were periodically recorded at a scan rate of 50 mV/s in the potential range from −1.5 V to +3 V. The compositions and processing parameters of the samples are summarized in Table 5.
The electrochemical exfoliation efficiency for different experimental conditions was as follows: EE-1—24,641 C/g; EE-2—11,634 C/g; EE-3—45,644 C/g; EE-4—143,340 C/g. These results demonstrate that the pulsed mode yields lower efficiency compared to the potentiostatic mode. Nevertheless, a comparison of pulsed exfoliation with (EE-1) and without (EE-3) surfactant indicates that the presence of Nafion significantly enhances the efficiency. For sample EE-4, intense gas evolution and rapid exfoliation were observed, which hindered stable positioning of the reference electrode throughout the process. As a result, harsher conditions may have developed not only at the working electrode but also at the counter electrode, potentially leading to intense oxidation of the carbon material. As shown in Table 5, the product yield correlates with the total anodic charge passed through the cell. The lowest yield was recorded for EE-4, and the highest for EE-2. The observed losses are presumably associated with electrochemical oxidation of carbon under positive potentials.
The method consistently yielded comparable results both in terms of the amount of exfoliated material and its structural quality.
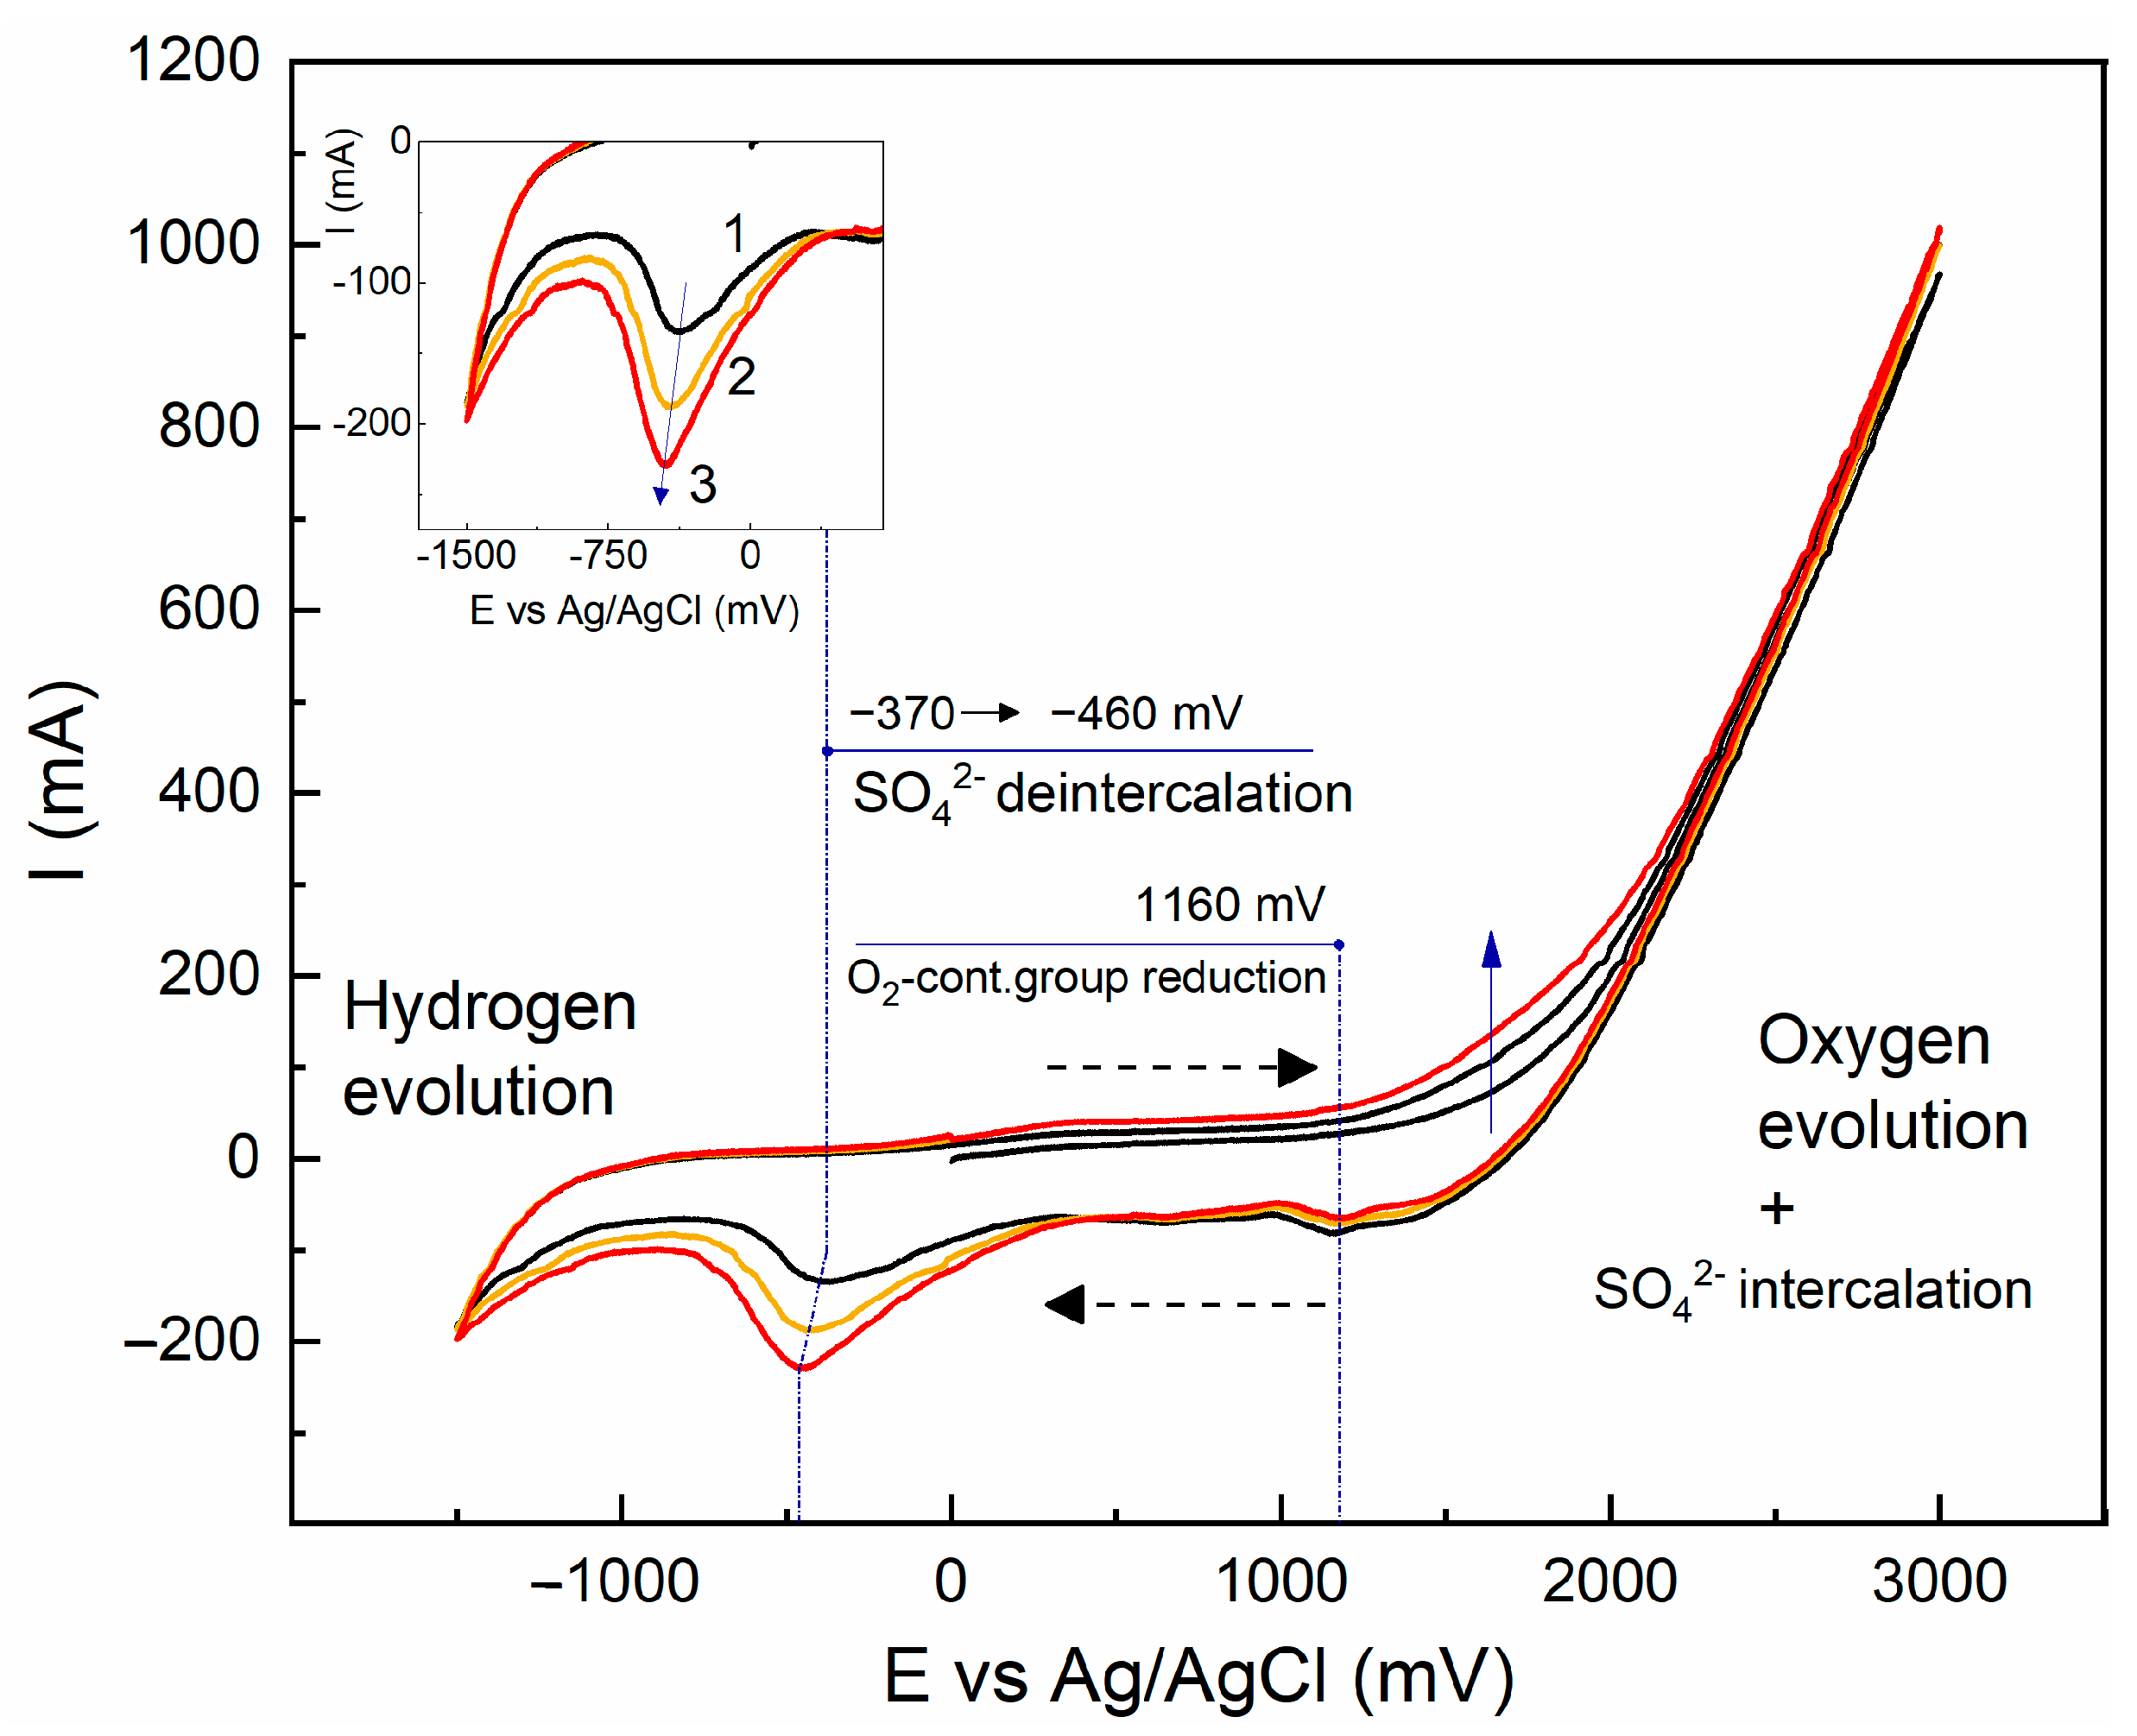
Figure 3 shows a current-voltage characteristic (CV) of the carbon materials during electrochemical exfoliation.
Voltammograms at the boundary potentials (−1.5 and +3 V) demonstrate an increase in current due to water electrolysis: hydrogen and oxygen evolution, respectively. Gas bubble formation was visually observed near these potentials. During exfoliation, phenomena similar to those described by Xia et al. [44] were observed. Potentiostatic holding at the extreme potentials led to gas bubble formation. These bubbles resulted from intercalation and oxidation of solvated anions, followed by gas release (e.g., O2 from water electrolysis and CO2 from carbon oxidation). Gas evolution was fast and macroscopically visible, as the applied potential exceeded the thermodynamic potentials for carbon and water oxidation (Ecarbon = +0.95 V; EO2/H2O = +1.23 V). Anodic polarization led to anion intercalation and cation deintercalation from the solution. Upon reversal of the polarization direction, the opposite processes take place [45].
The cathode sweep exhibits two peaks: a distinct one at −0.460 V vs. Ag/AgCl and a less pronounced peak at 1.16 V vs. Ag/AgCl. The first peak is attributed to sulfate ion deintercalation or the reduction of dissolved oxygen, and may also involve the reduction of hydroxyl and carboxyl functional groups. The peak at 1.16 V may correspond to the reduction of oxygen-containing surface groups (primarily carbonyls) formed during the preceding anodic scan. It may also be attributed to the reduction of persulfate ions or hydrogen peroxide formed at high anodic potentials. Their standard redox potentials are 2.1 V and 1.8 V, respectively [46]. The anodic branch shows no corresponding peaks. The first three CV cycles are shown in the figure (see inset). The absence of anodic counterpeaks indicates the irreversibility of the cathodic processes.
The use of magnetic stirring at a rotor speed of ~1200 min−1 had no substantial influence on the CV shape. This implies that external diffusion is not a limiting factor and points to the oxidant being embedded within the electrode rather than present in the bulk solution.
A kinetic experiment was carried out to identify the rate-limiting step of the process corresponding to the peak at −0.46 V. CV curves were recorded at various scan rates ranging from 10 to 100 mV/s. Prior to each measurement, the working electrode was polarized at +3 V for 30 s to accumulate the same amount of oxidant (intercalate). The peak intensity (peak current) showed a linear dependence on the scan rate (see Figure 3, inset), which indicates that the cathodic process is under kinetic control (i.e., the rate is limited by charge transfer rather than diffusion).
A significant increase in the peak current at −0.46 V is observed during the first three cycles (Figure 3). The arrow indicates the direction of peak evolution with increasing cycle number, which is labeled with digits. The hysteresis on the anodic branch in the potential range of 1.2–3 V, corresponding to sulfate ion intercalation, also increases as the current grows with the positive shift in potential. Meanwhile, the peak at 1.16 V diminishes and becomes barely visible. Such changes in the CV profile can be explained by modifications to the electrode surface.
As the electrochemical process progressed, the electrode surface diminished, and the liquid medium turned dark due to exfoliated particles. As a result, by the end of the process, the CV current values significantly decreased, while its shape was preserved.
Figure 4 shows CVs of the graphite electrode recorded after polarization at +3 V for 30 s, 60 s, and without prior polarization. As seen from the figure, at a polarization time of 30 s, saturation of the deintercalation current Imax (see the inset in Figure 4). Thus, the pulse mode with a 30 s delay ensures complete intercalation.
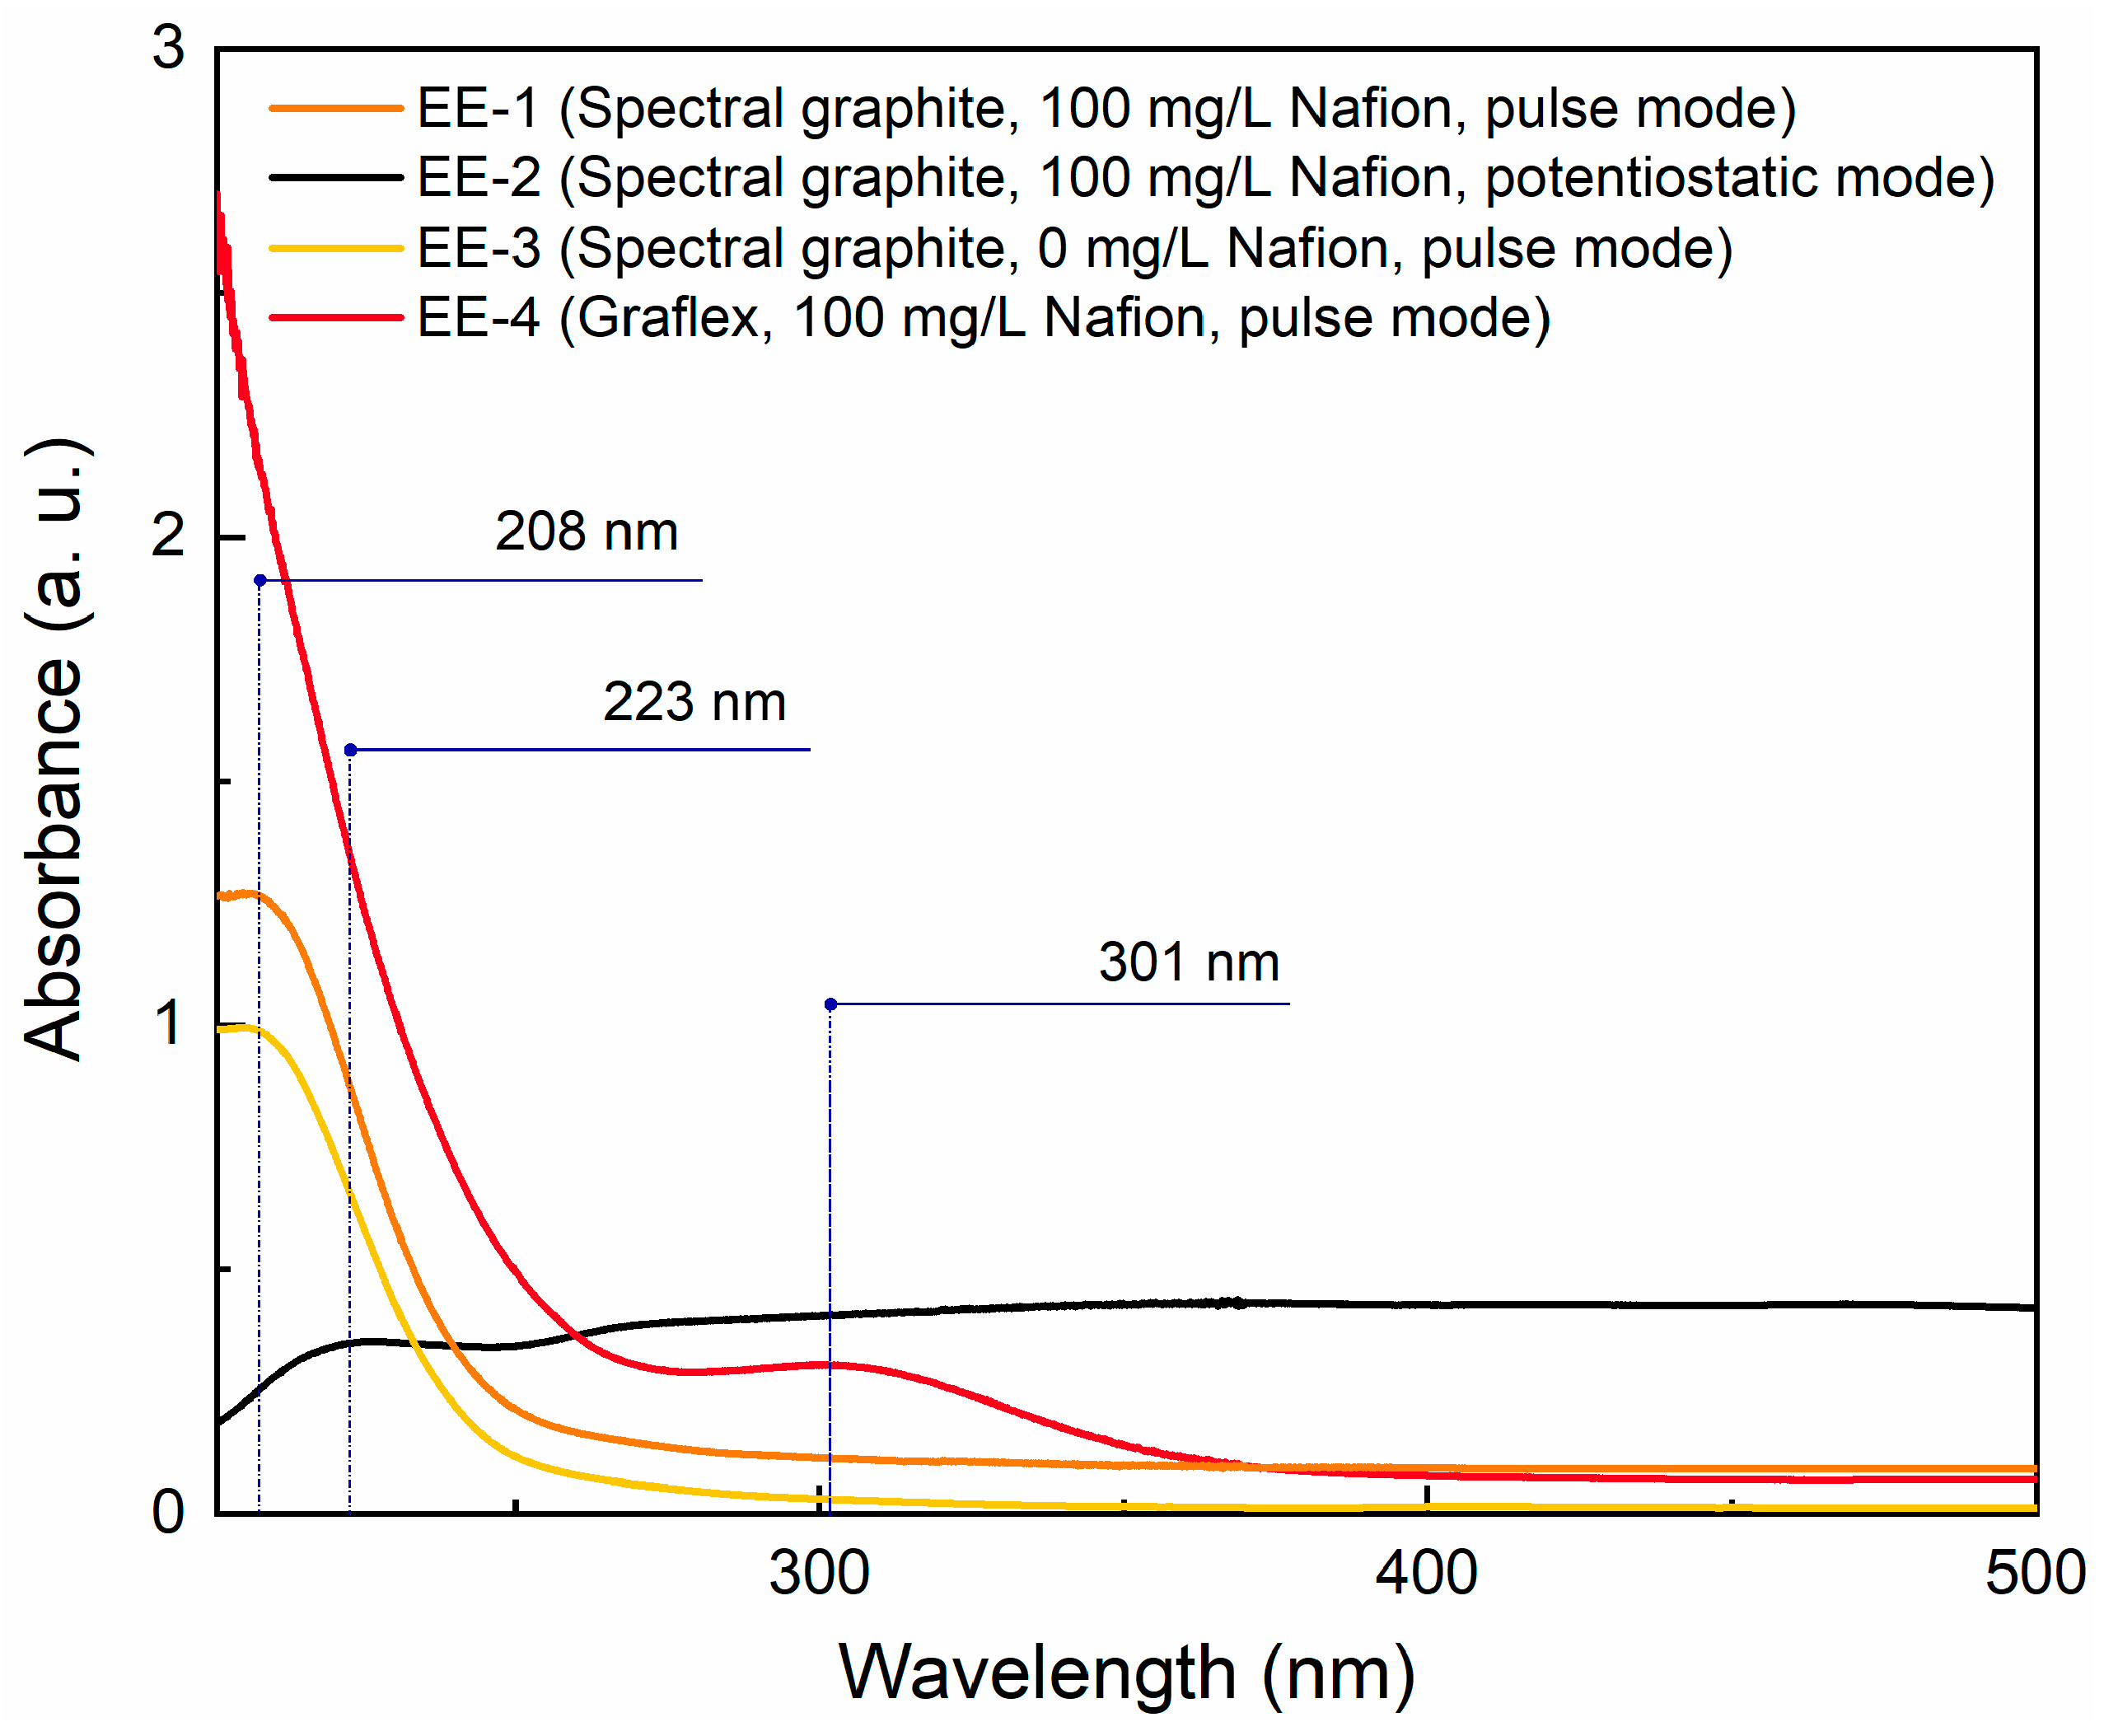
Absorption spectra of dispersions prepared by electrochemical exfoliation are presented in Figure 5. A shoulder at approximately 223 nm is observed, indicating the presence of oxidized carbon forms.
In the spectra of the sample obtained in pulsed mode without Nafion (EE-3) a bend (almost a shoulder) centered around 208 nm is observed, which can be attributed to multilayer graphene with approximately 10 layers. The spectrum of the sample with Nafion (EE-1) shows a more pronounced effect in the same region—a diffuse maximum (a shoulder turning into a peak), indicating a smaller number of graphene layers, approaching 3. In the spectrum of sample EE-2, obtained in potentiostatic anodic mode in the presence of Nafion, a weak feature at approximately 223 nm is observed, which suggests a small amount of exfoliated few-layer particles, while the high background indicates the presence of a large number of coarse particles. The number of graphene layers is estimated to be greater than 10. In the spectrum of the sample obtained from Graflex (EE-4), a clearly pronounced peak located at 301 nm is observed, corresponding to the n–π* optical transition of electrons in C=O bonds, indicating the highest degree of oxidation in this sample.
The highest electrochemical efficiency and product yield (Table 5) for EE-2 are attributed to the fact that, under potentiostatic conditions, the extent of fine exfoliation is minimal, and the electrode rapidly splits into relatively large particles. A comparison of pulsed modes in the presence and absence of Nafion suggests that Nafion promotes finer and more efficient graphite splitting into graphene particles and inhibits their oxidation. This effect likely results from the surfactant properties of Nafion and its adsorption on graphene. Electrochemical efficiency is significantly higher in the presence of Nafion.
The obtained dispersions of carbon materials EE-1–EE-4 were purified from sulfuric acid by repeated centrifugation cycles using a Sigma 6-16 centrifuge (SIGMA Laborzentrifugen, Osterode am Harz, Germany) at 18,000 rcf (12,400 rpm), followed by decantation and washing of the precipitate with DI water until the pH of the washing solution reached neutral. After purification, the precipitate was air-dried, weighed, and the product yield was determined.
Samples EE-1 and EE-4 underwent US treatment at low power (18 W/L) for 30 h with the addition of surfactant. Suspensions were prepared using an isopropanol-water mixture (1:1) containing 20% surfactant (Nafion). The treatment was performed using a Bransonic 3510 ultrasonic bath (Branson Ultrasonics Corporation, Danbury, CT, USA). The resulting carbon material samples (Table 6) were subsequently analyzed either as a suspension form or as powders after drying, depending on the requirements of the specific analytical method.
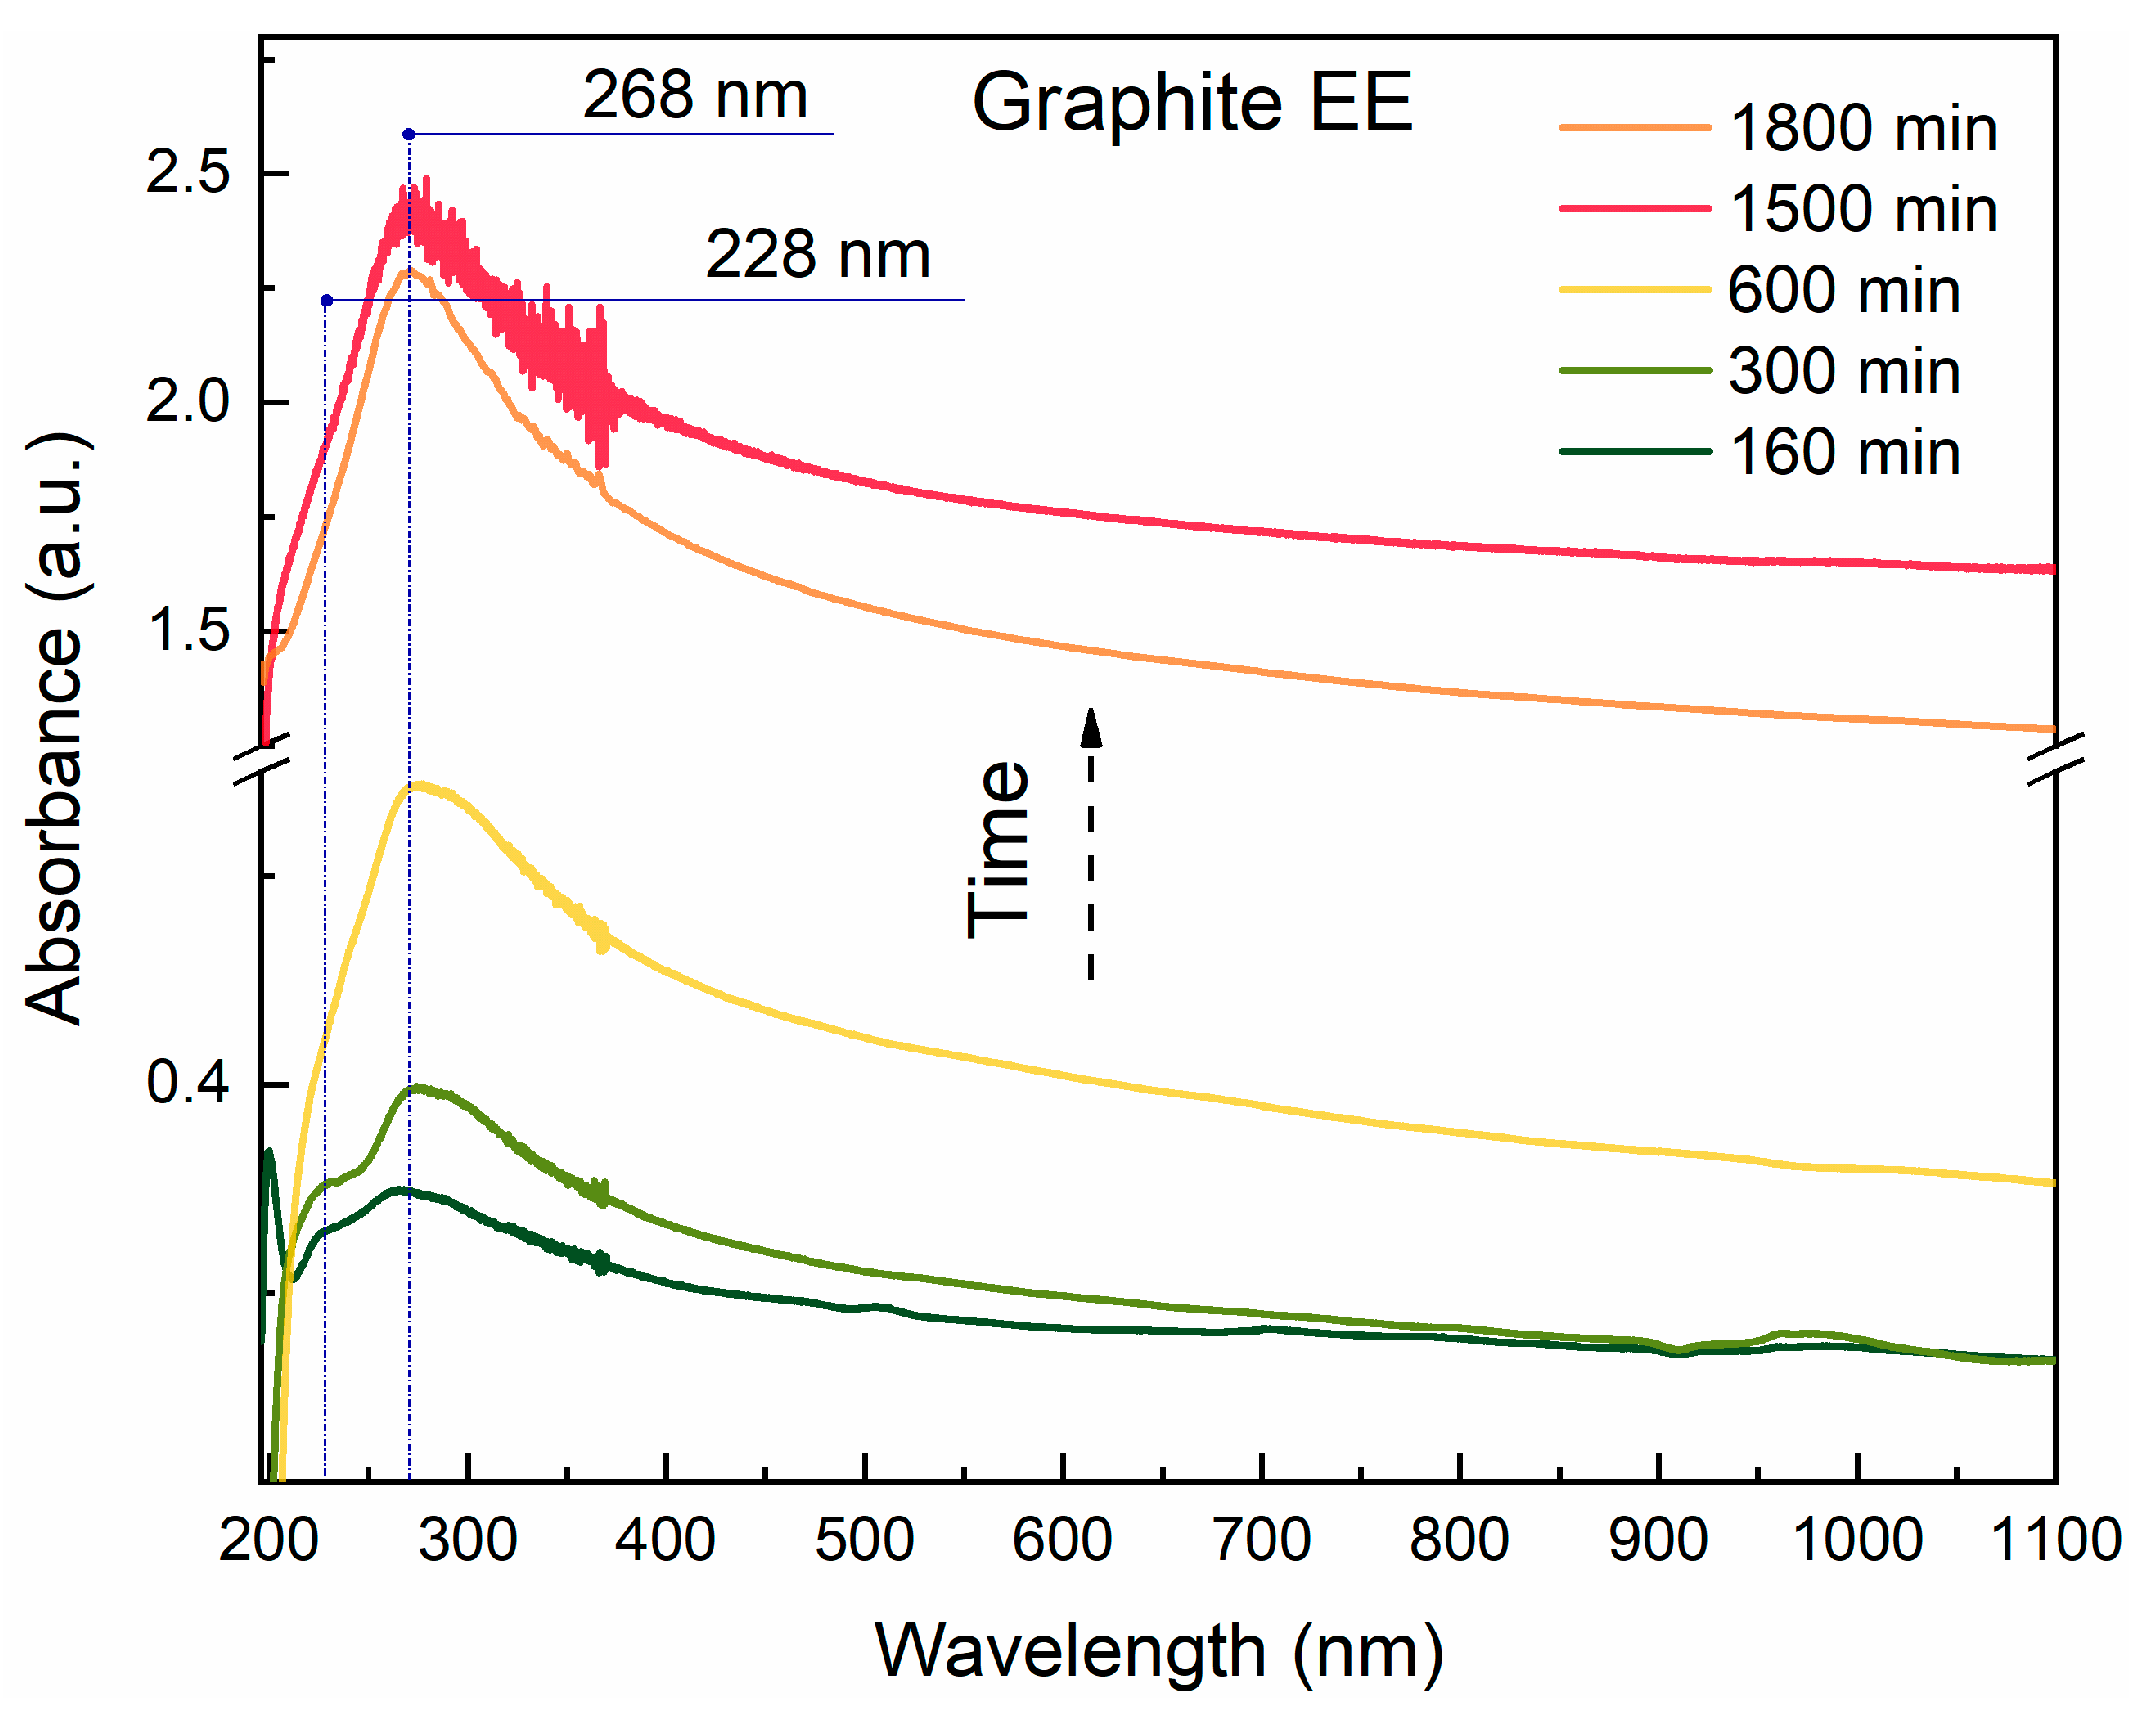
Figure 6 presents the absorption spectra of the Graphite EE dispersion during mild US treatment of the carbon material EE-1. As the dispersion time progresses, the intensity of the peak at 268 nm—characteristic of few-layer graphene—increases significantly. The number of graphene layers per stack, estimated using an empirical formula, was found to be 7. At the early stage of dispersion, a weak short-wavelength peak at 228 nm is also observed, which is typical for graphene oxide. The peak may be attributed to the presence of a small amount of oxygen atoms on the graphene surface (see XPS data). The intensity of this peak decreases during the dispersion process, as the surface fraction containing oxygen atoms is reduced.

3. Results

3.1. UV-Vis Spectroscopy and Sedimentation Curves

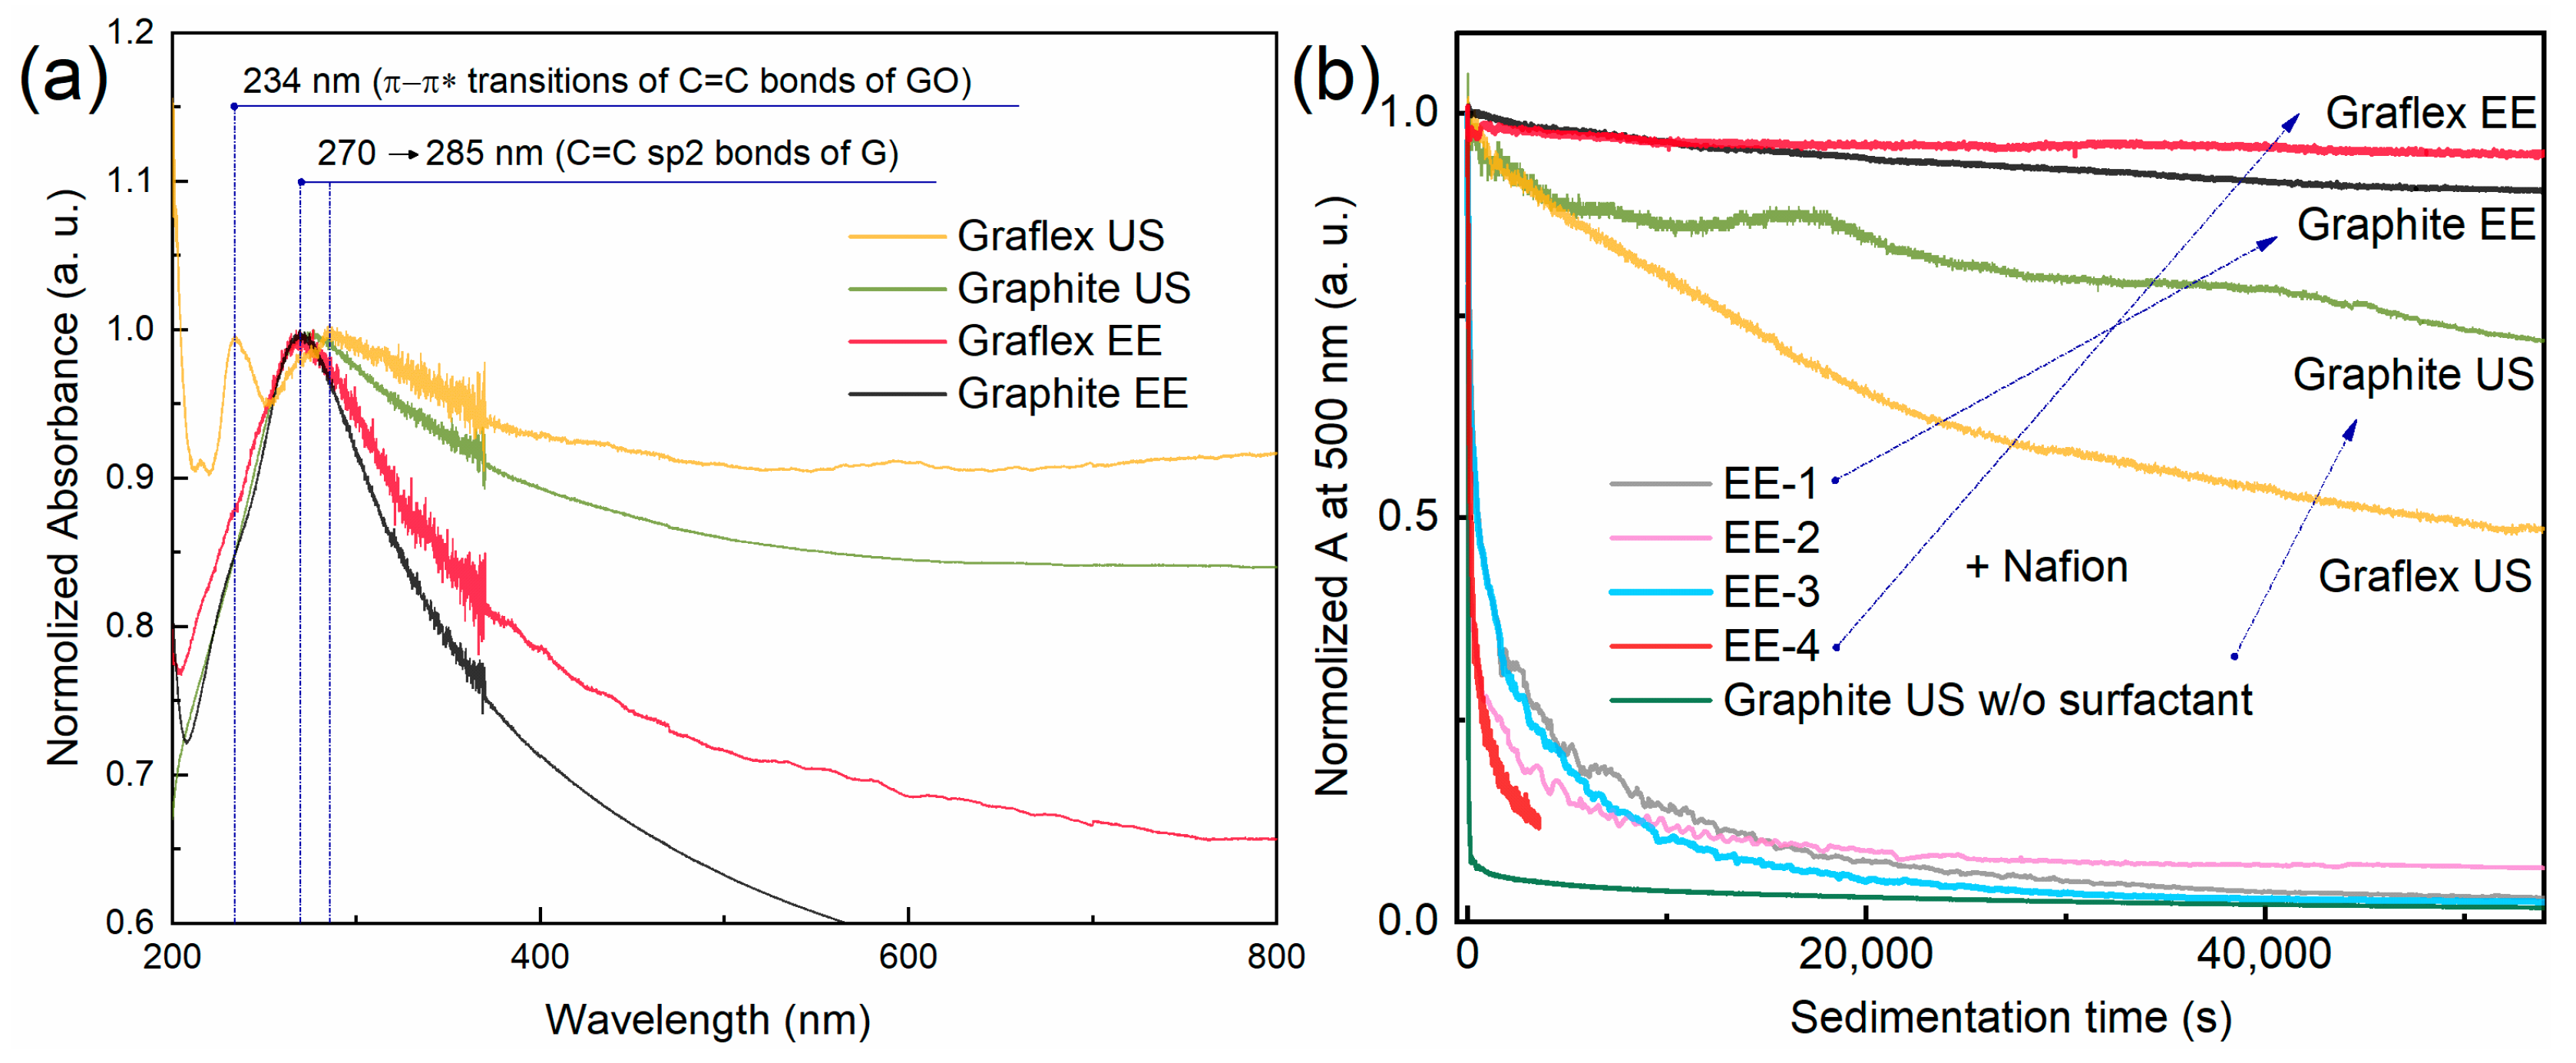
Normalized absorption spectra of dispersions are shown in Figure 7a. The dispersions were prepared using spectral graphite, either by a two-step method (Graphite EE) or by liquid-phase exfoliation at 2.4 W/mL (Graphite US), and using Graflex, also by a two-step method (Graflex EE) or by liquid-phase exfoliation (Graflex US). All spectra display clear peaks near 270 nm, which indicates the presence of few-layer graphene (1–3 layers). The most distinct peaks are observed in the spectra of samples obtained via the two-step method. The number of layers calculated using the empirical formula is the lowest for the samples obtained via the two-stage method (Table 7). The spectrum of Graflex EE shows a pronounced peak at approximately 234 nm, suggesting the presence of oxygen-containing functional groups on the graphene surface (π→π* transition in GO). Additionally, the peak corresponding to the π–π* electronic transition in graphene is red-shifted to 285 nm, which indicates a high degree of reduction. It is likely that the Graflex EE sample has a mixed structure containing both oxidized and reduced graphene fragments.
Analysis of sedimentation curves using optical (photometric) detection of particle concentration in the dispersions [47,48] enabled comparison of the dispersity of graphene produced by different methods (Figure 7b).
Figure 7b demonstrates that the samples vary significantly in both the rate and completeness of particle sedimentation. The highest sedimentation rates were observed in the samples without Nafion (Graphite US w/o surfactant), EE-2, and EE-4. Their half-sedimentation times, which are inversely proportional to the fraction of large, fast-settling particles, were 19, 72, and 170 s, respectively. The greatest dispersion stability was observed for samples prepared via the two-step method, where the optical density decreased by only 5% (Graflex EE) and 10% (Graphite EE) over the entire experimental period. The residual optical density after 54000 s indicates the fraction of small, non-sedimenting particles remaining in the suspension, with the highest values recorded for Graflex EE (0.949), Graphite EE (0.905), Graphite US (0.749), and Graflex US (0.478). The electrochemically exfoliated graphene-like samples contained relatively low amounts of small particles, with the lowest value observed for the ultrasonically dispersed sample without Nafion (A/A0 = 0.0131). Table 8 provides a summary of the sedimentation curve analysis results.
To summarize, among the electrochemically exfoliated samples, the EE-1 dispersion obtained via the pulsed method in the presence of Nafion demonstrated the highest stability. Among the US dispersed samples, the most stable was Graphite US, obtained by dispersing graphite in the presence of Nafion. Pulsed electrochemical exfoliation of carbon materials in the presence of Nafion, followed by mild liquid-phase ultrasonication (18 W/L), results in the formation of few-layer graphene (1–3 layers) with relatively small particle sizes. In contrast, in the absence of Nafion, the exfoliation produces larger particles with a higher number of layers (>10). Under potentiostatic conditions, predominantly large, rapidly sedimenting multilayer structures form, although some few-layer fragments are also identified. The highest electrochemical efficiency and product yield are observed in the potentiostatic mode due to the minimal extent of fine exfoliation and rapid disintegration of the electrode into relatively large particles. A comparison of pulsed exfoliation with and without Nafion reveals that Nafion promotes finer, more effective exfoliation and suppresses graphene oxidation, most likely as a result of its surfactant properties and adsorption on the graphene surface. Electrochemical efficiency in the presence of Nafion is significantly higher.

3.2. TEM, ED, and XRD

TEM and ED were employed to investigate the morphology and structure of the synthesized carbon materials. TEM images revealed that the graphene obtained from Graflex using Nafion as a surfactant is predominantly present as single layers or stacks of a small number of layers. The presence of a Nafion coating on the sheet surfaces was confirmed by EDX analysis.
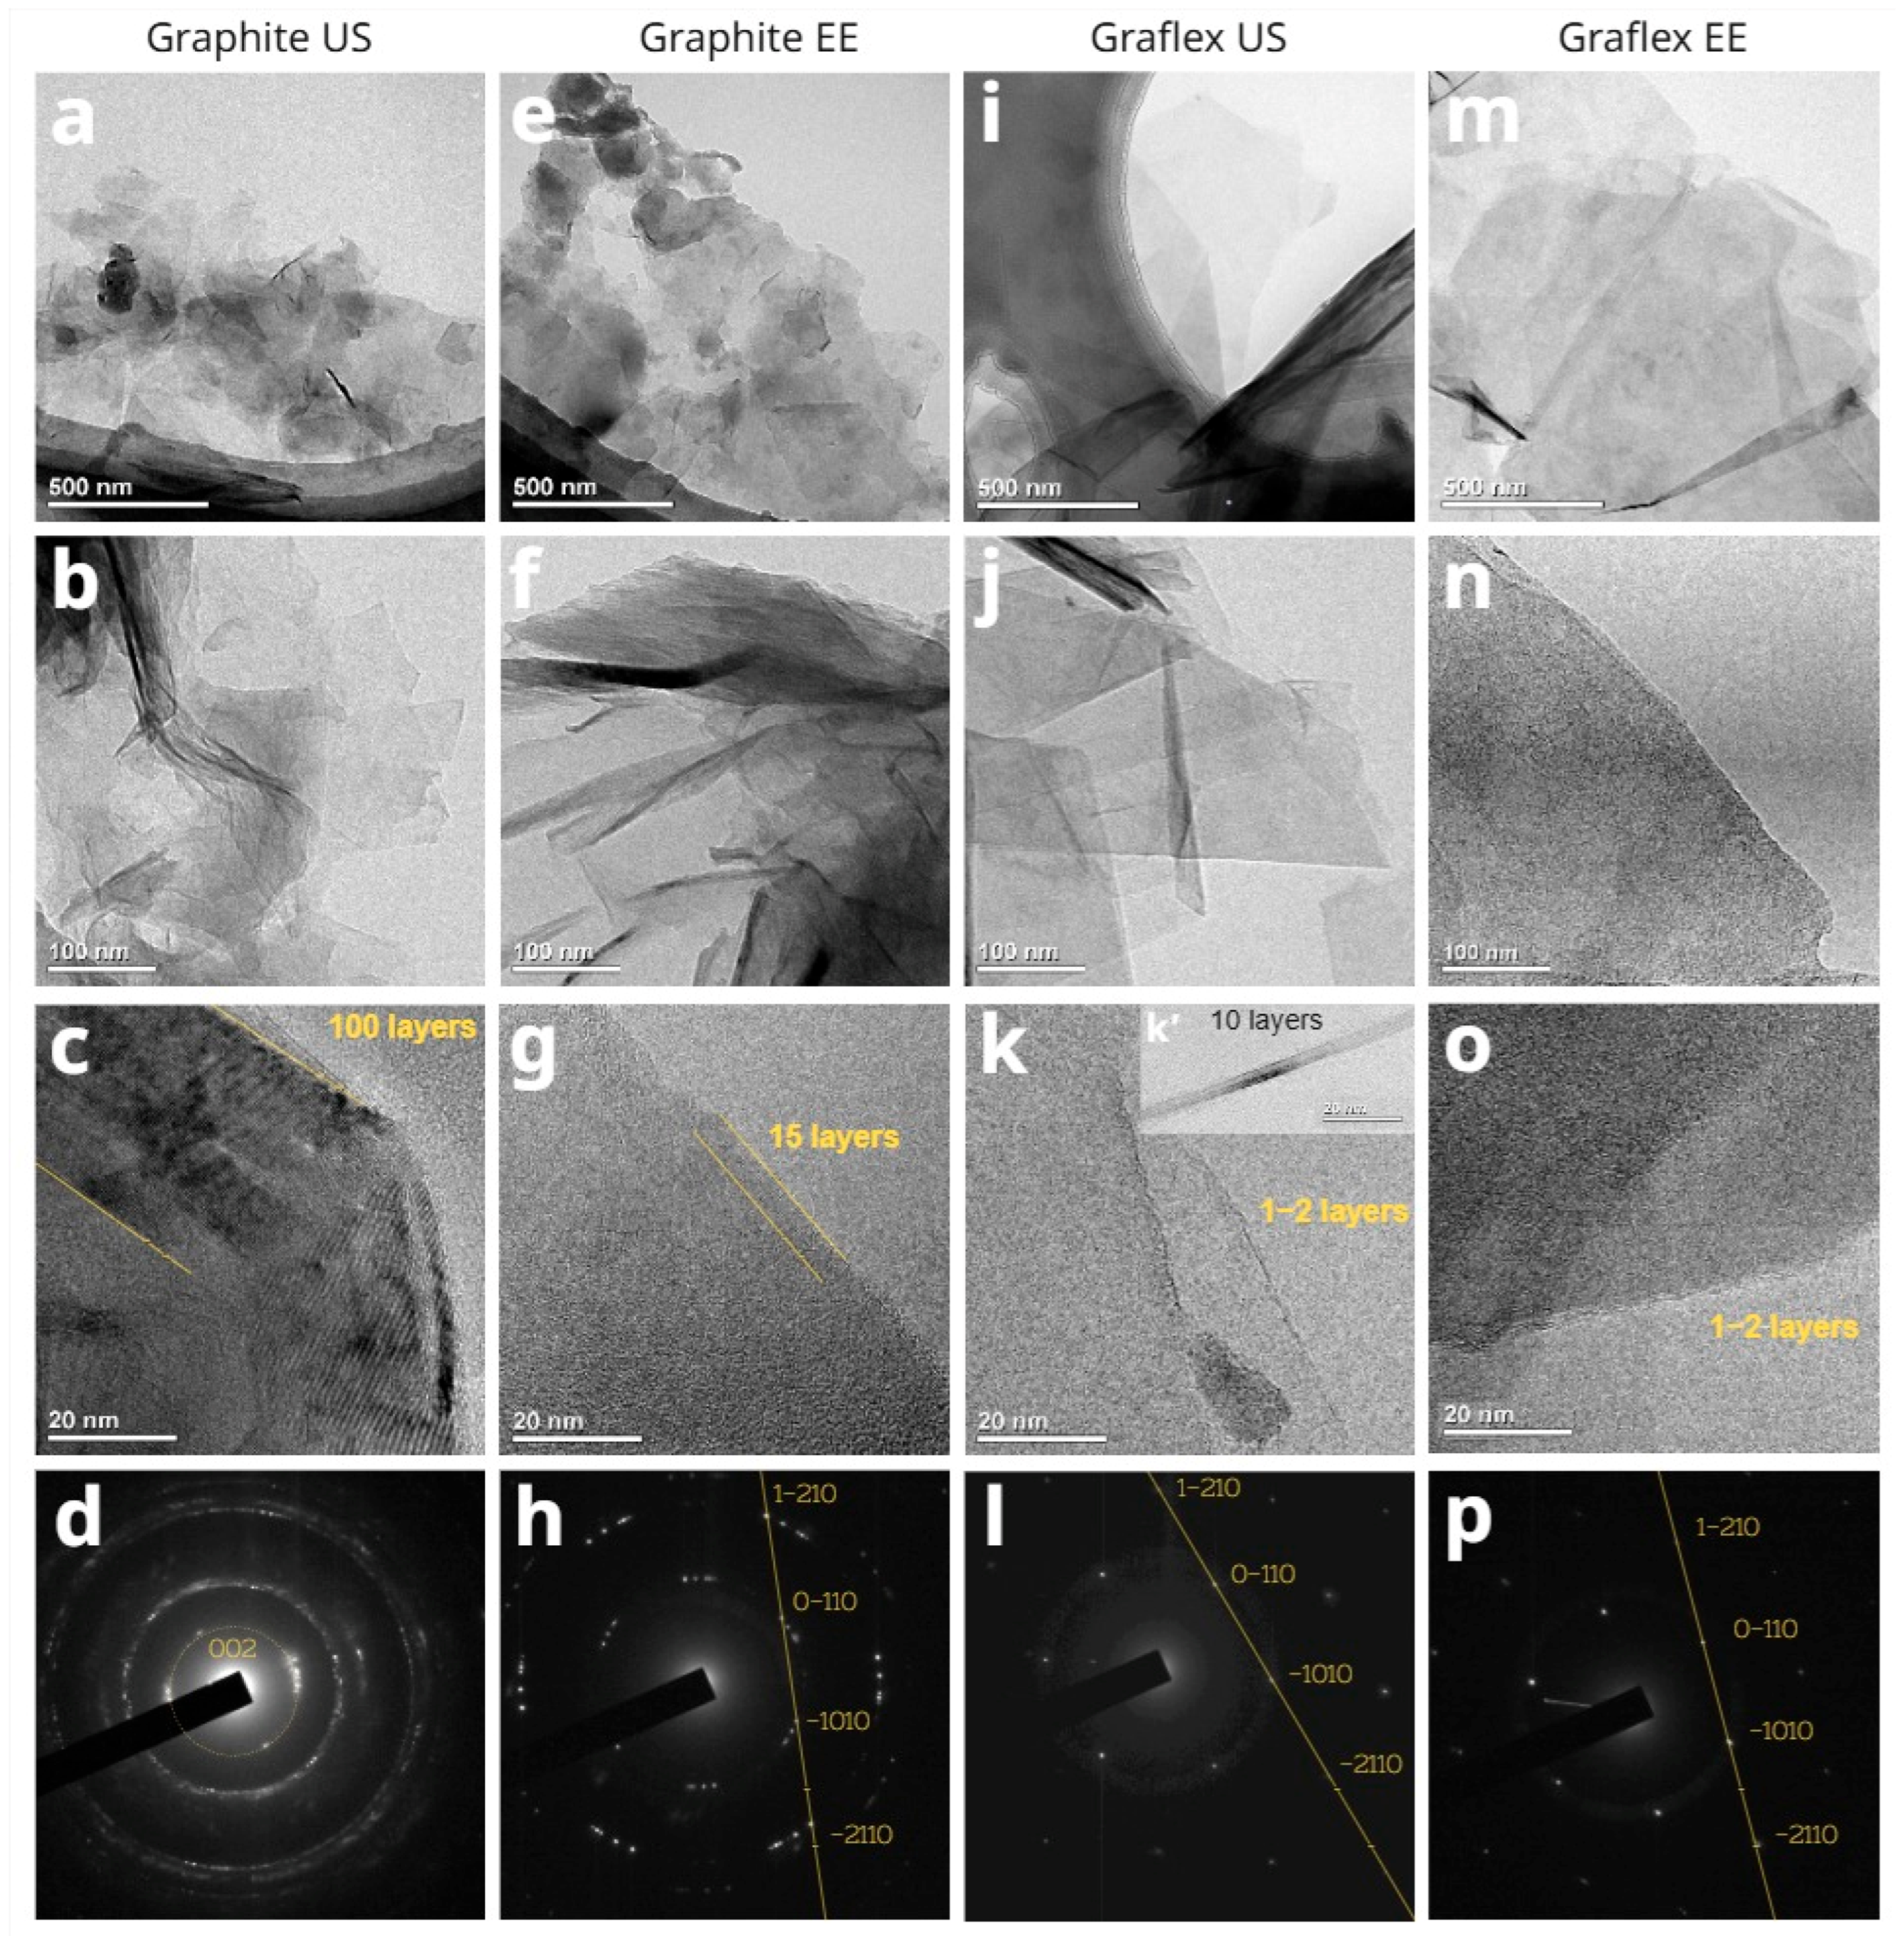
A representative TEM image of graphene structures with varying morphologies and magnifications is presented in Figure 8. The ED patterns recorded from regions with sizes of 100–200 nm are shown in Figure 8d,h,l,p.
Graphene materials synthesized from graphite (Graphite US, Graphite EE) consist of fragments 100–300 nm in lateral size (Figure 8a,e) and a thickness ranging from a few layers to several tens of layers. In the case of EG sample, the number of layers is lower (10–15 layers, Figure 8g) compared to the sample obtained by high-power US treatment (multiple stacks of up to 100 layers, Figure 8c). Additionally, in the case of EG, the shape of the sheets is noticeably different, with more irregular edges. Diffraction analysis shows that the sheets are predominantly multilayered. The diffraction patterns in Figure 8d,h demonstrate that the (0–110) and (–1010) spots have lower intensity compared to the (1–210) and (–2110) spots, which indicates the presence of several graphene layers. Furthermore, in the diffraction pattern in Figure 8d, a characteristic (002) ring corresponding to the graphite plane [49,50] is observed, confirming a certain degree of graphitization.
Samples synthesized using Graflex (Graflex US, Graflex EE) as the precursor contain noticeably larger sheets, with lateral dimensions exceeding 1 µm (Figure 8i,m). EG affects the sheet morphology, although to a lesser extent than in the case of graphite. According to diffraction analysis, the sheets are predominantly monolayer (Figure 8l,p): the (0–110) and (–1010) diffraction spots exhibit higher intensity compared to the (1–210) and (–2110) spots (Figure 8o,p) [51,52,53,54]. Although overlapping regions of several layers are observed in Figure 8m, the corresponding diffraction pattern indicates the preservation of a predominantly single-layer structure, possibly due to the absence of periodicity along the C-axis. Nevertheless, multilayer fragments are also found in the images (Figure 8k′).
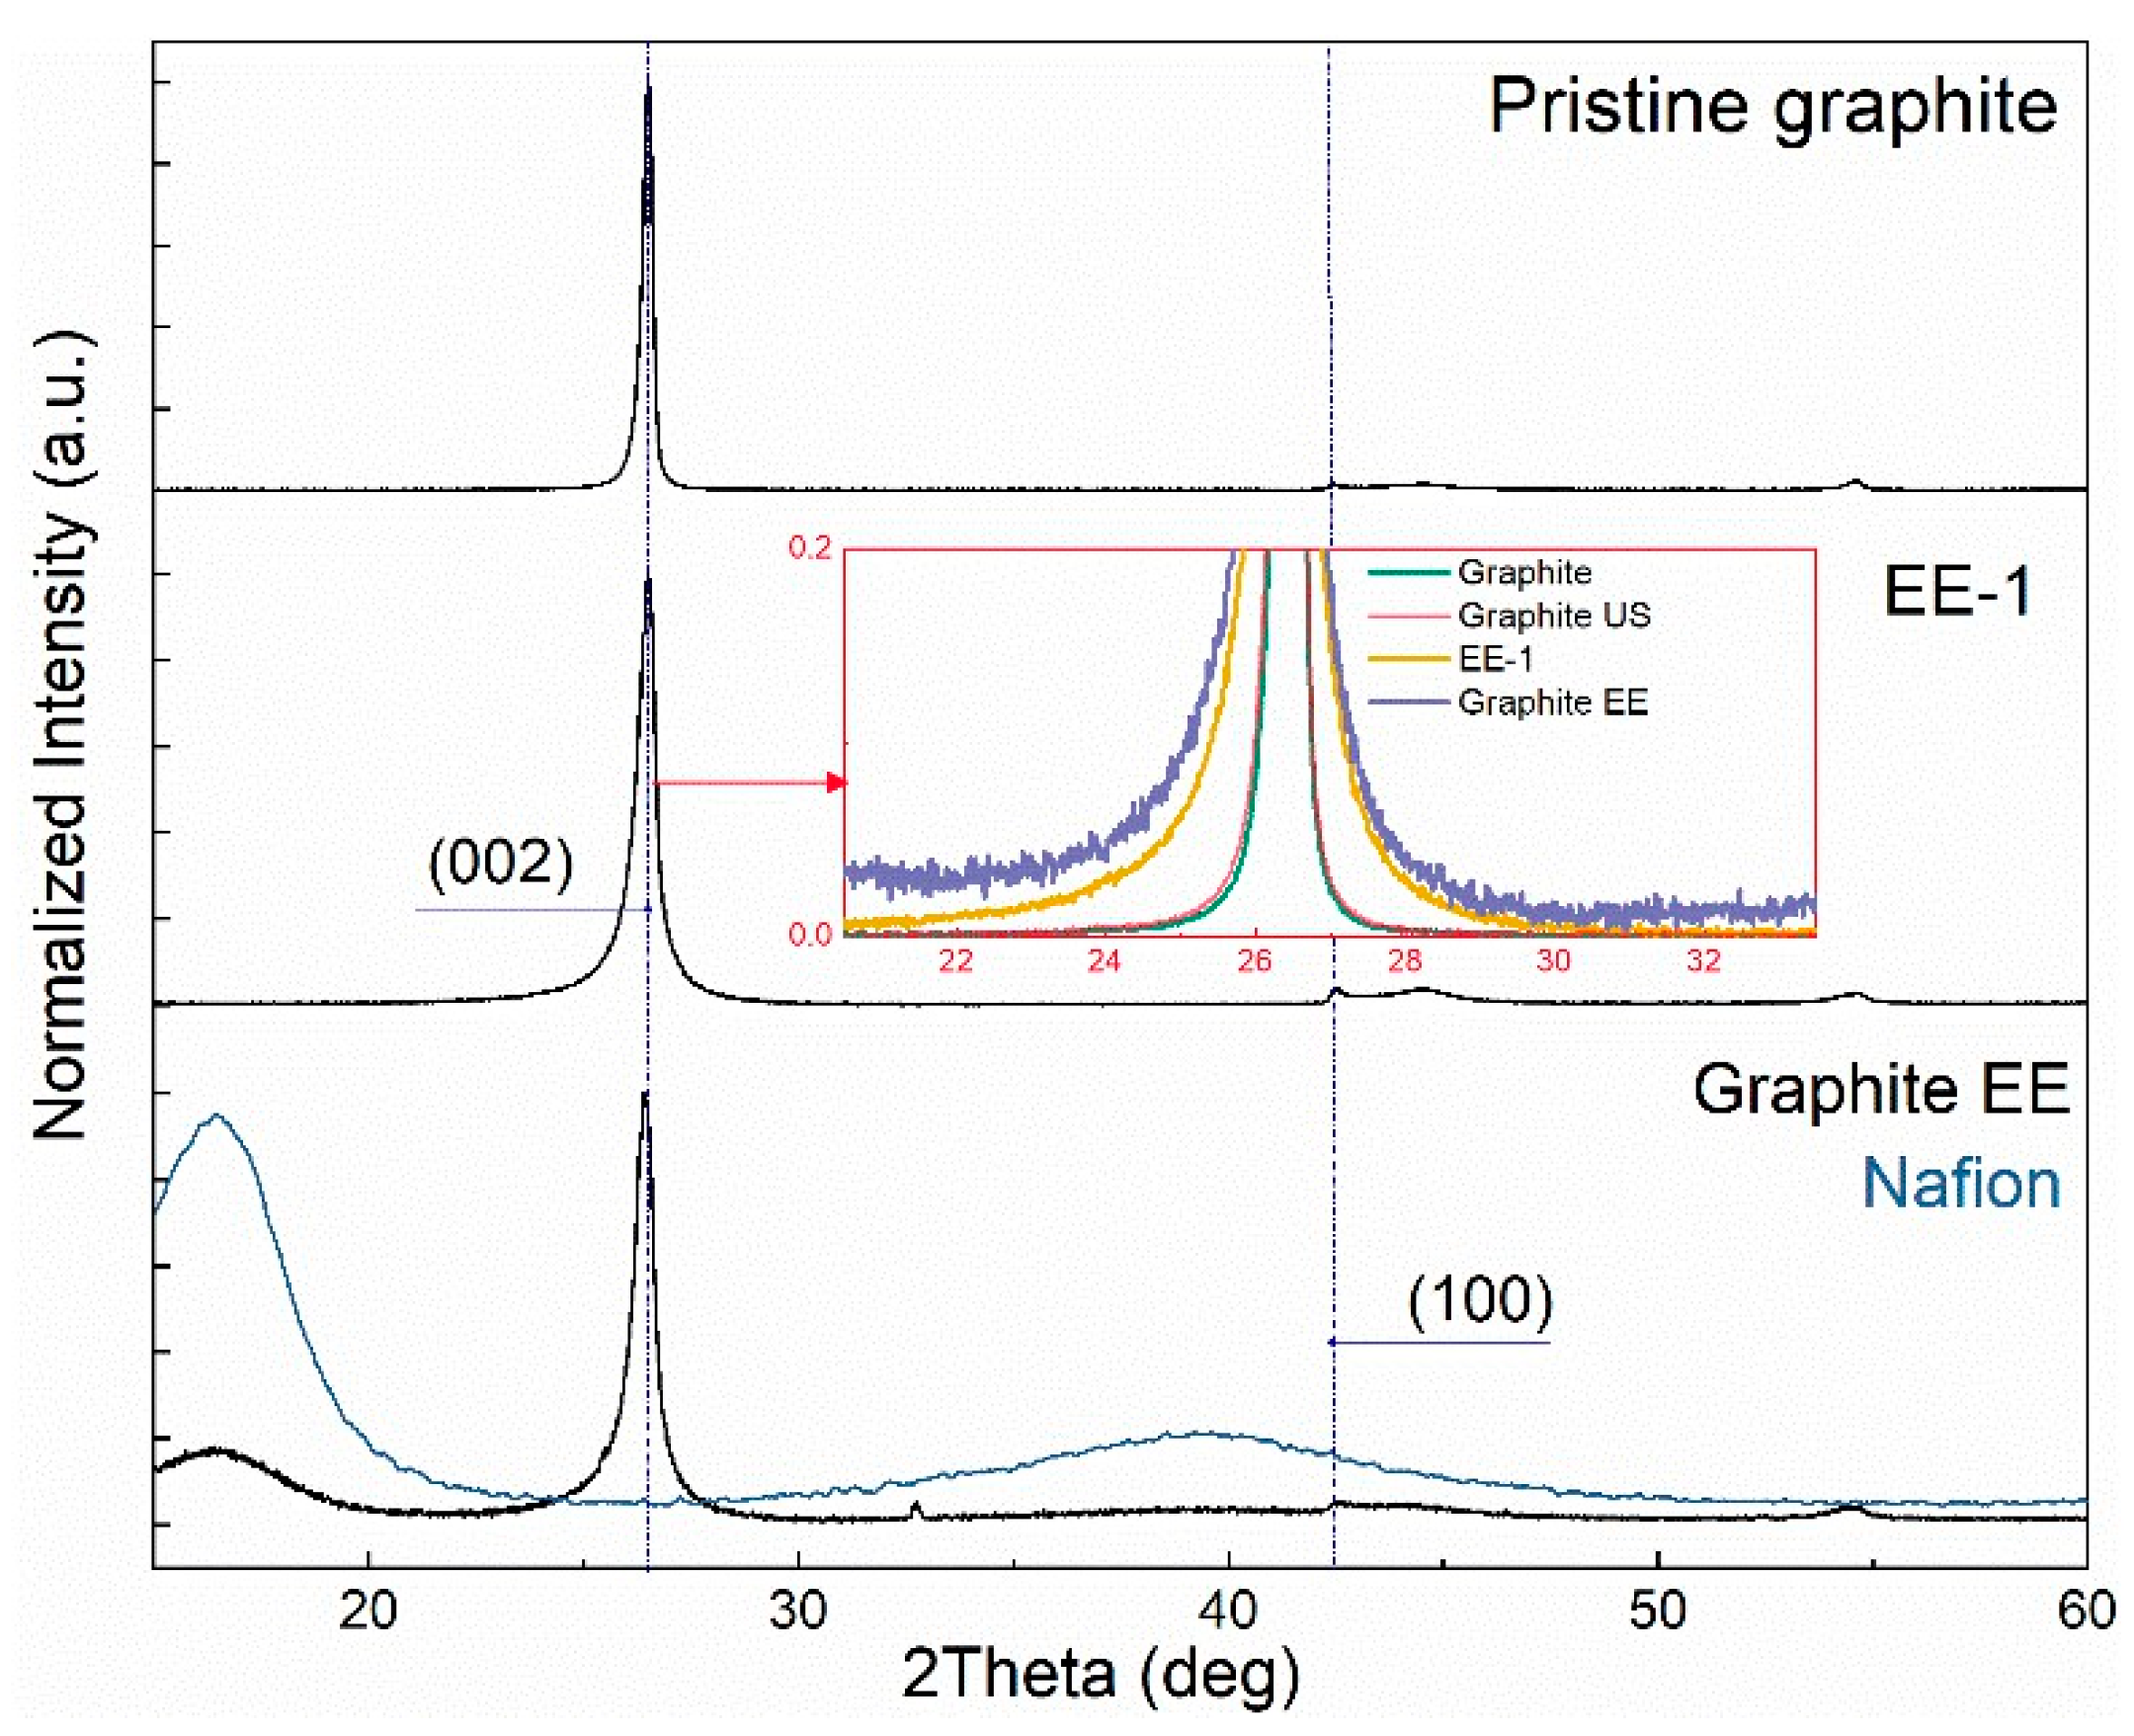
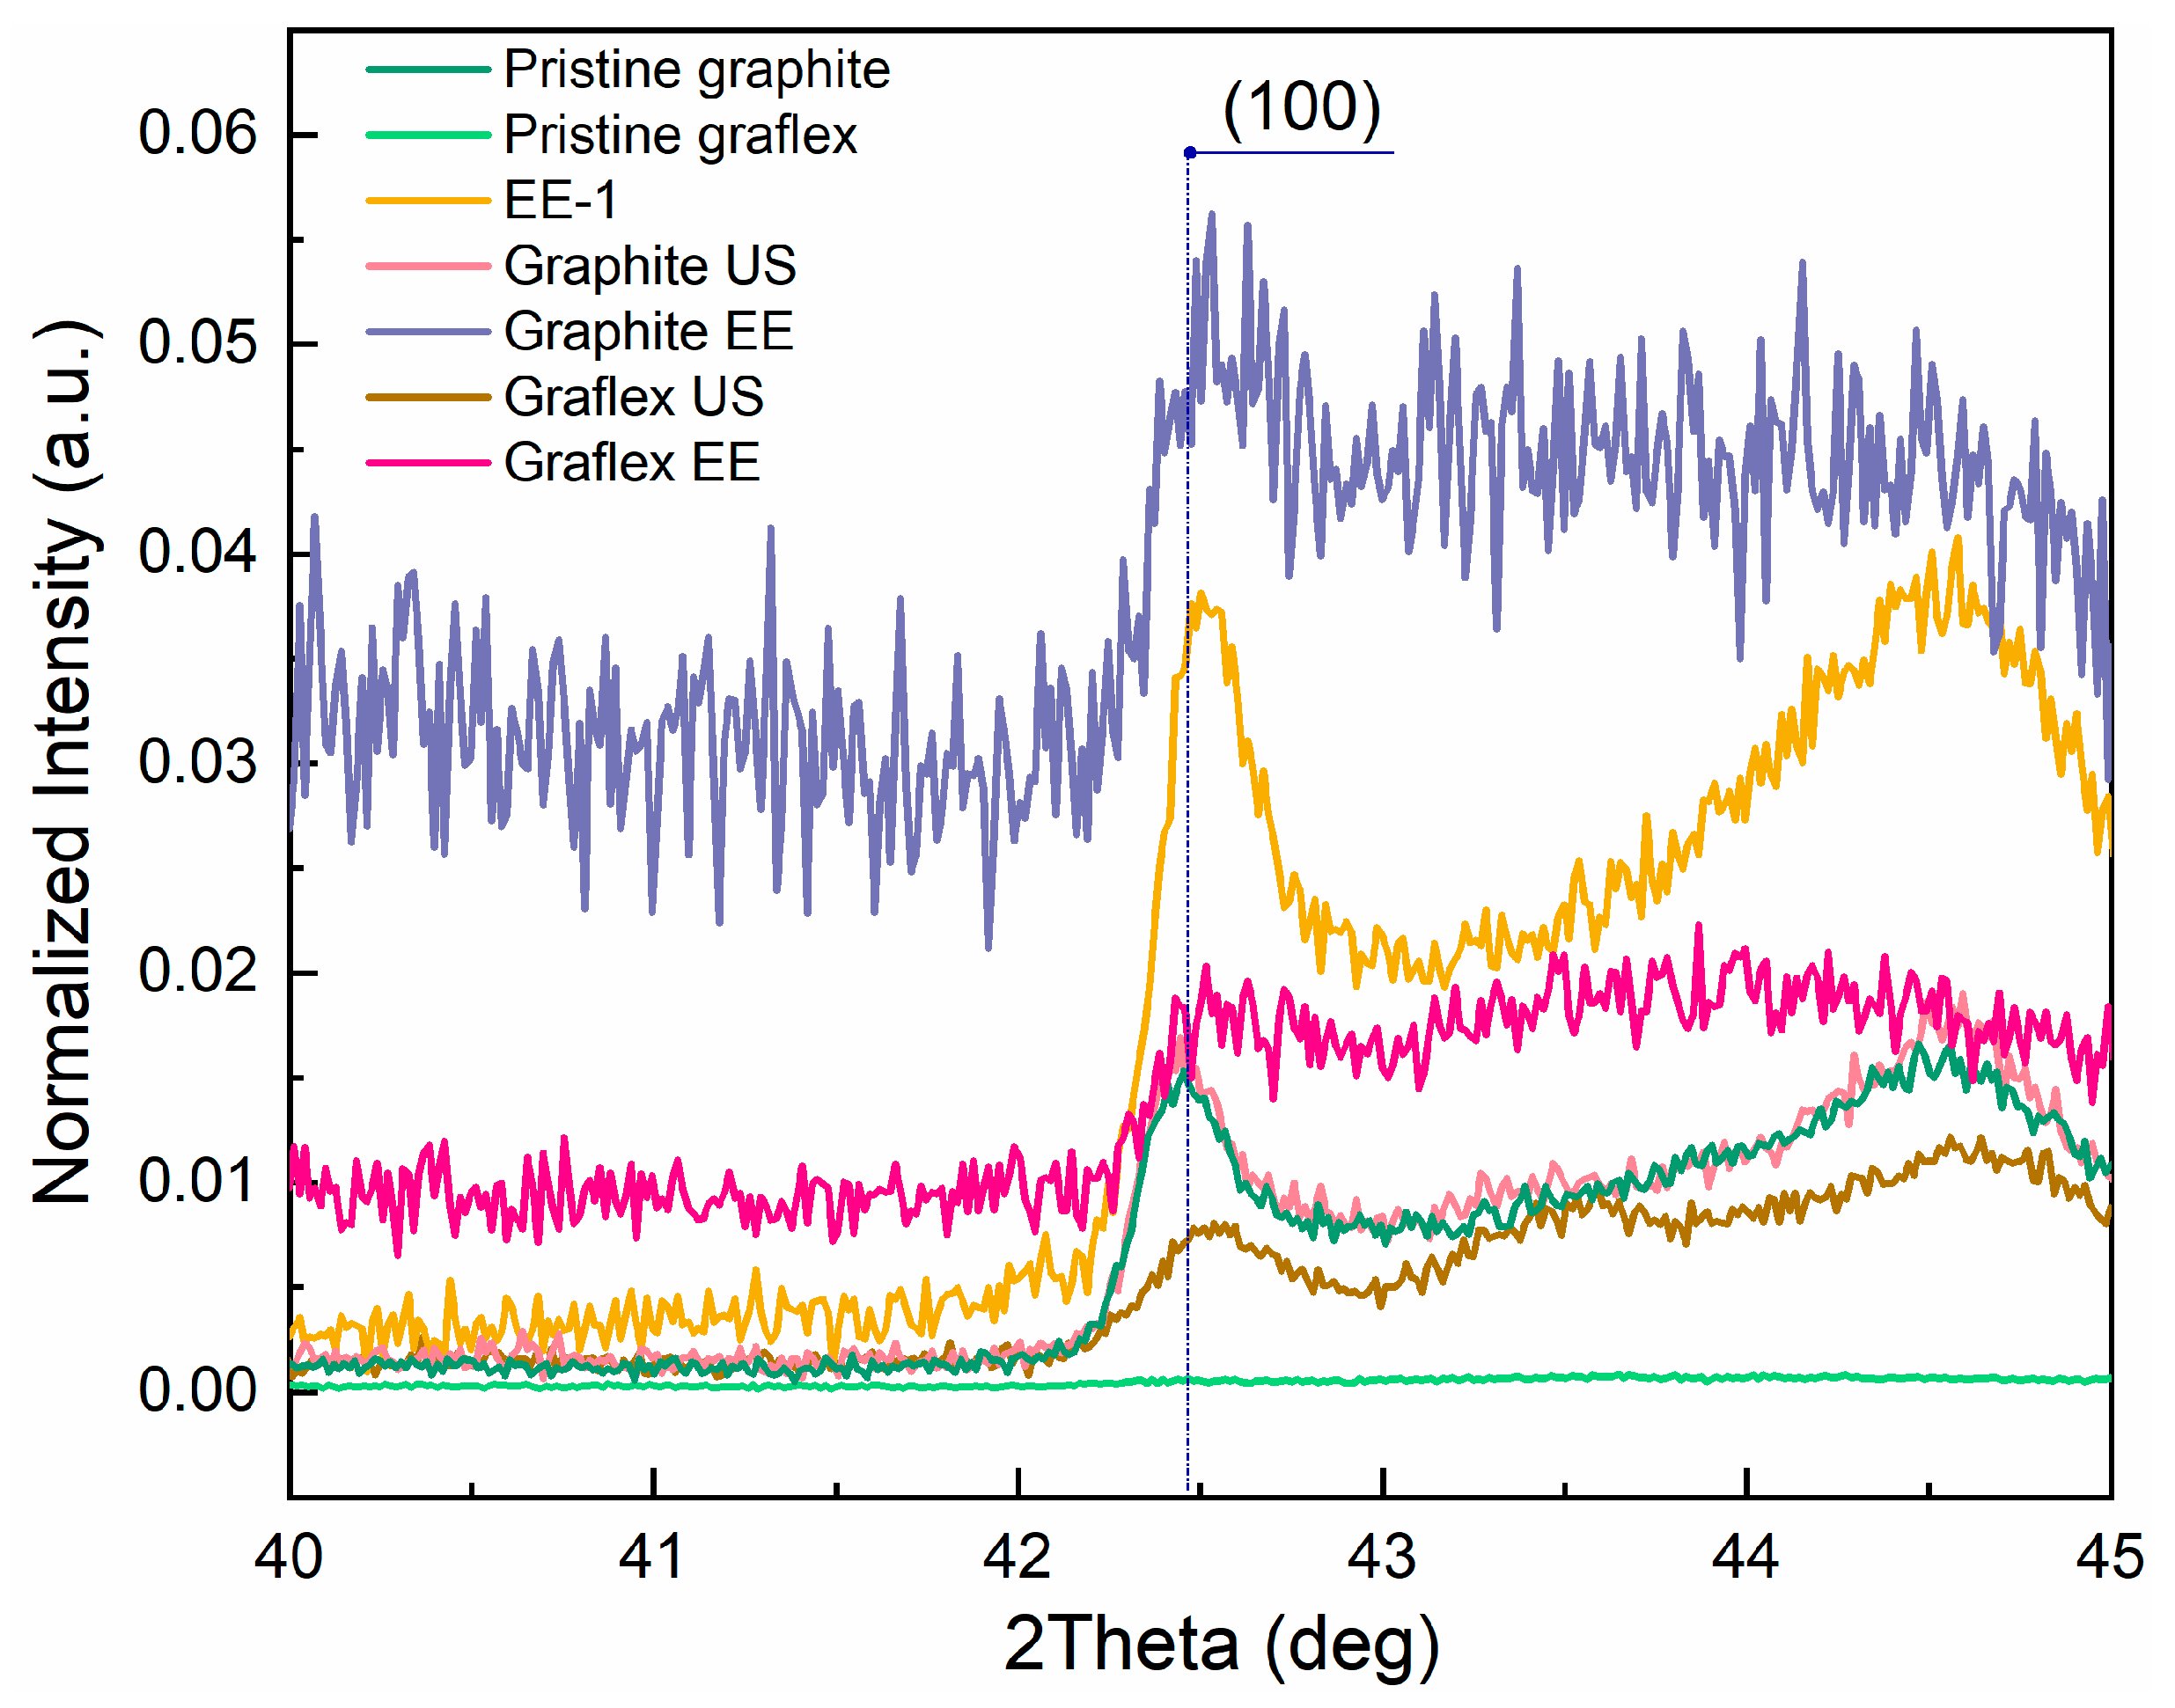
The results obtained via TEM are supported by XRD data. Figure 9, Figure 10 and Figure 11 show the XRD patterns of the studied carbon-based materials. All XRD patterns exhibit reflections characteristic of graphite, including a strong peak at 2θ ~26.5, corresponding to the (002) plane, along with weaker reflections at higher angles. The XRD patterns of Graflex reveal a textured pattern, which is associated with the shape of the sample (graphite foil particles). The XRD pattern of the Graphite EE sample contains Nafion peaks at ~16.43 and ~39°, indicating its semi-crystalline state [55]. The positions of these Nafion reflections are consistent with previously published data [55,56,57,58]. Compared to pristine Nafion (Figure 9), the Nafion peaks in the composite are slightly broadened, likely due to a reduction in crystallinity resulting from interfacial interactions with the graphene surface.
According to the XRD patterns, the main graphite peak (002) broadens, and its intensity changes significantly after treatment. Additionally, the peak slightly shifts toward lower angles. The broadening indicates a decrease in the size of the CSR, while the shift to lower angles is due to an increase in interlayer spacing. The reduction in peak intensity may be attributed to the lower degree of graphitization in the exfoliated graphene sheets. This effect is associated with graphite exfoliation and a reduction in grain size [45,59]. Selected XRD data are summarized in Table 9. Since the samples represent a polydisperse mixture of materials with varying degrees of exfoliation, the reported values reflect integral characteristics.
Table 9 shows that the treatment of spectral graphite leads to the destruction of its graphite structure, which is reflected in an increase in the interlayer spacing d002 and a decrease in the degree of graphitization. A change in the anisotropy of the CSR shape is observed. The nature of this change specifically, the increase in anisotropy indicates that exfoliation of graphene layers along the (002) planes is the dominant process. The effect of liquid-phase exfoliation without a preliminary electrochemical stage is less pronounced.
The data in Table 9 are consistent with the results of sedimentation analysis and DLS measurements. The degree of graphitization decreases in the following order: spectral graphite, EE-1, Graphite US, Graphite EE. The sedimentation curves of these samples are positioned from bottom to top. Among the Graflex samples, the electrochemically exfoliated one exhibited the lowest degree of graphitization.
A relatively small increase in d002 indicates that exfoliation proceeds via the peeling of graphene layers, rather than through prior expansion of the interlayer spacing.
XRD data indicate that the Graphite EE sample contains a relatively small number of layers, approximately 44, while monolayer structures are not identified in TEM images. Such findings suggest that the material predominantly consists of multilayer graphene-like structures.
In the case of Graflex US and Graflex EE materials, the observations differ. According to powder XRD data, the graphene stacks consist of 50.5 and 30.7 layers for Graflex US and Graflex EE, respectively. Meanwhile, TEM data indicate a predominantly monolayer graphene structure in both samples. These findings suggest polydispersity of the resulting material, reflecting the presence of a large number of monolayer particles with a lateral size greater than 1 μm, as well as particles with a higher number of layers. Thus, the integral characteristic obtained by XRD shifts towards higher layer counts.

3.3. DLS

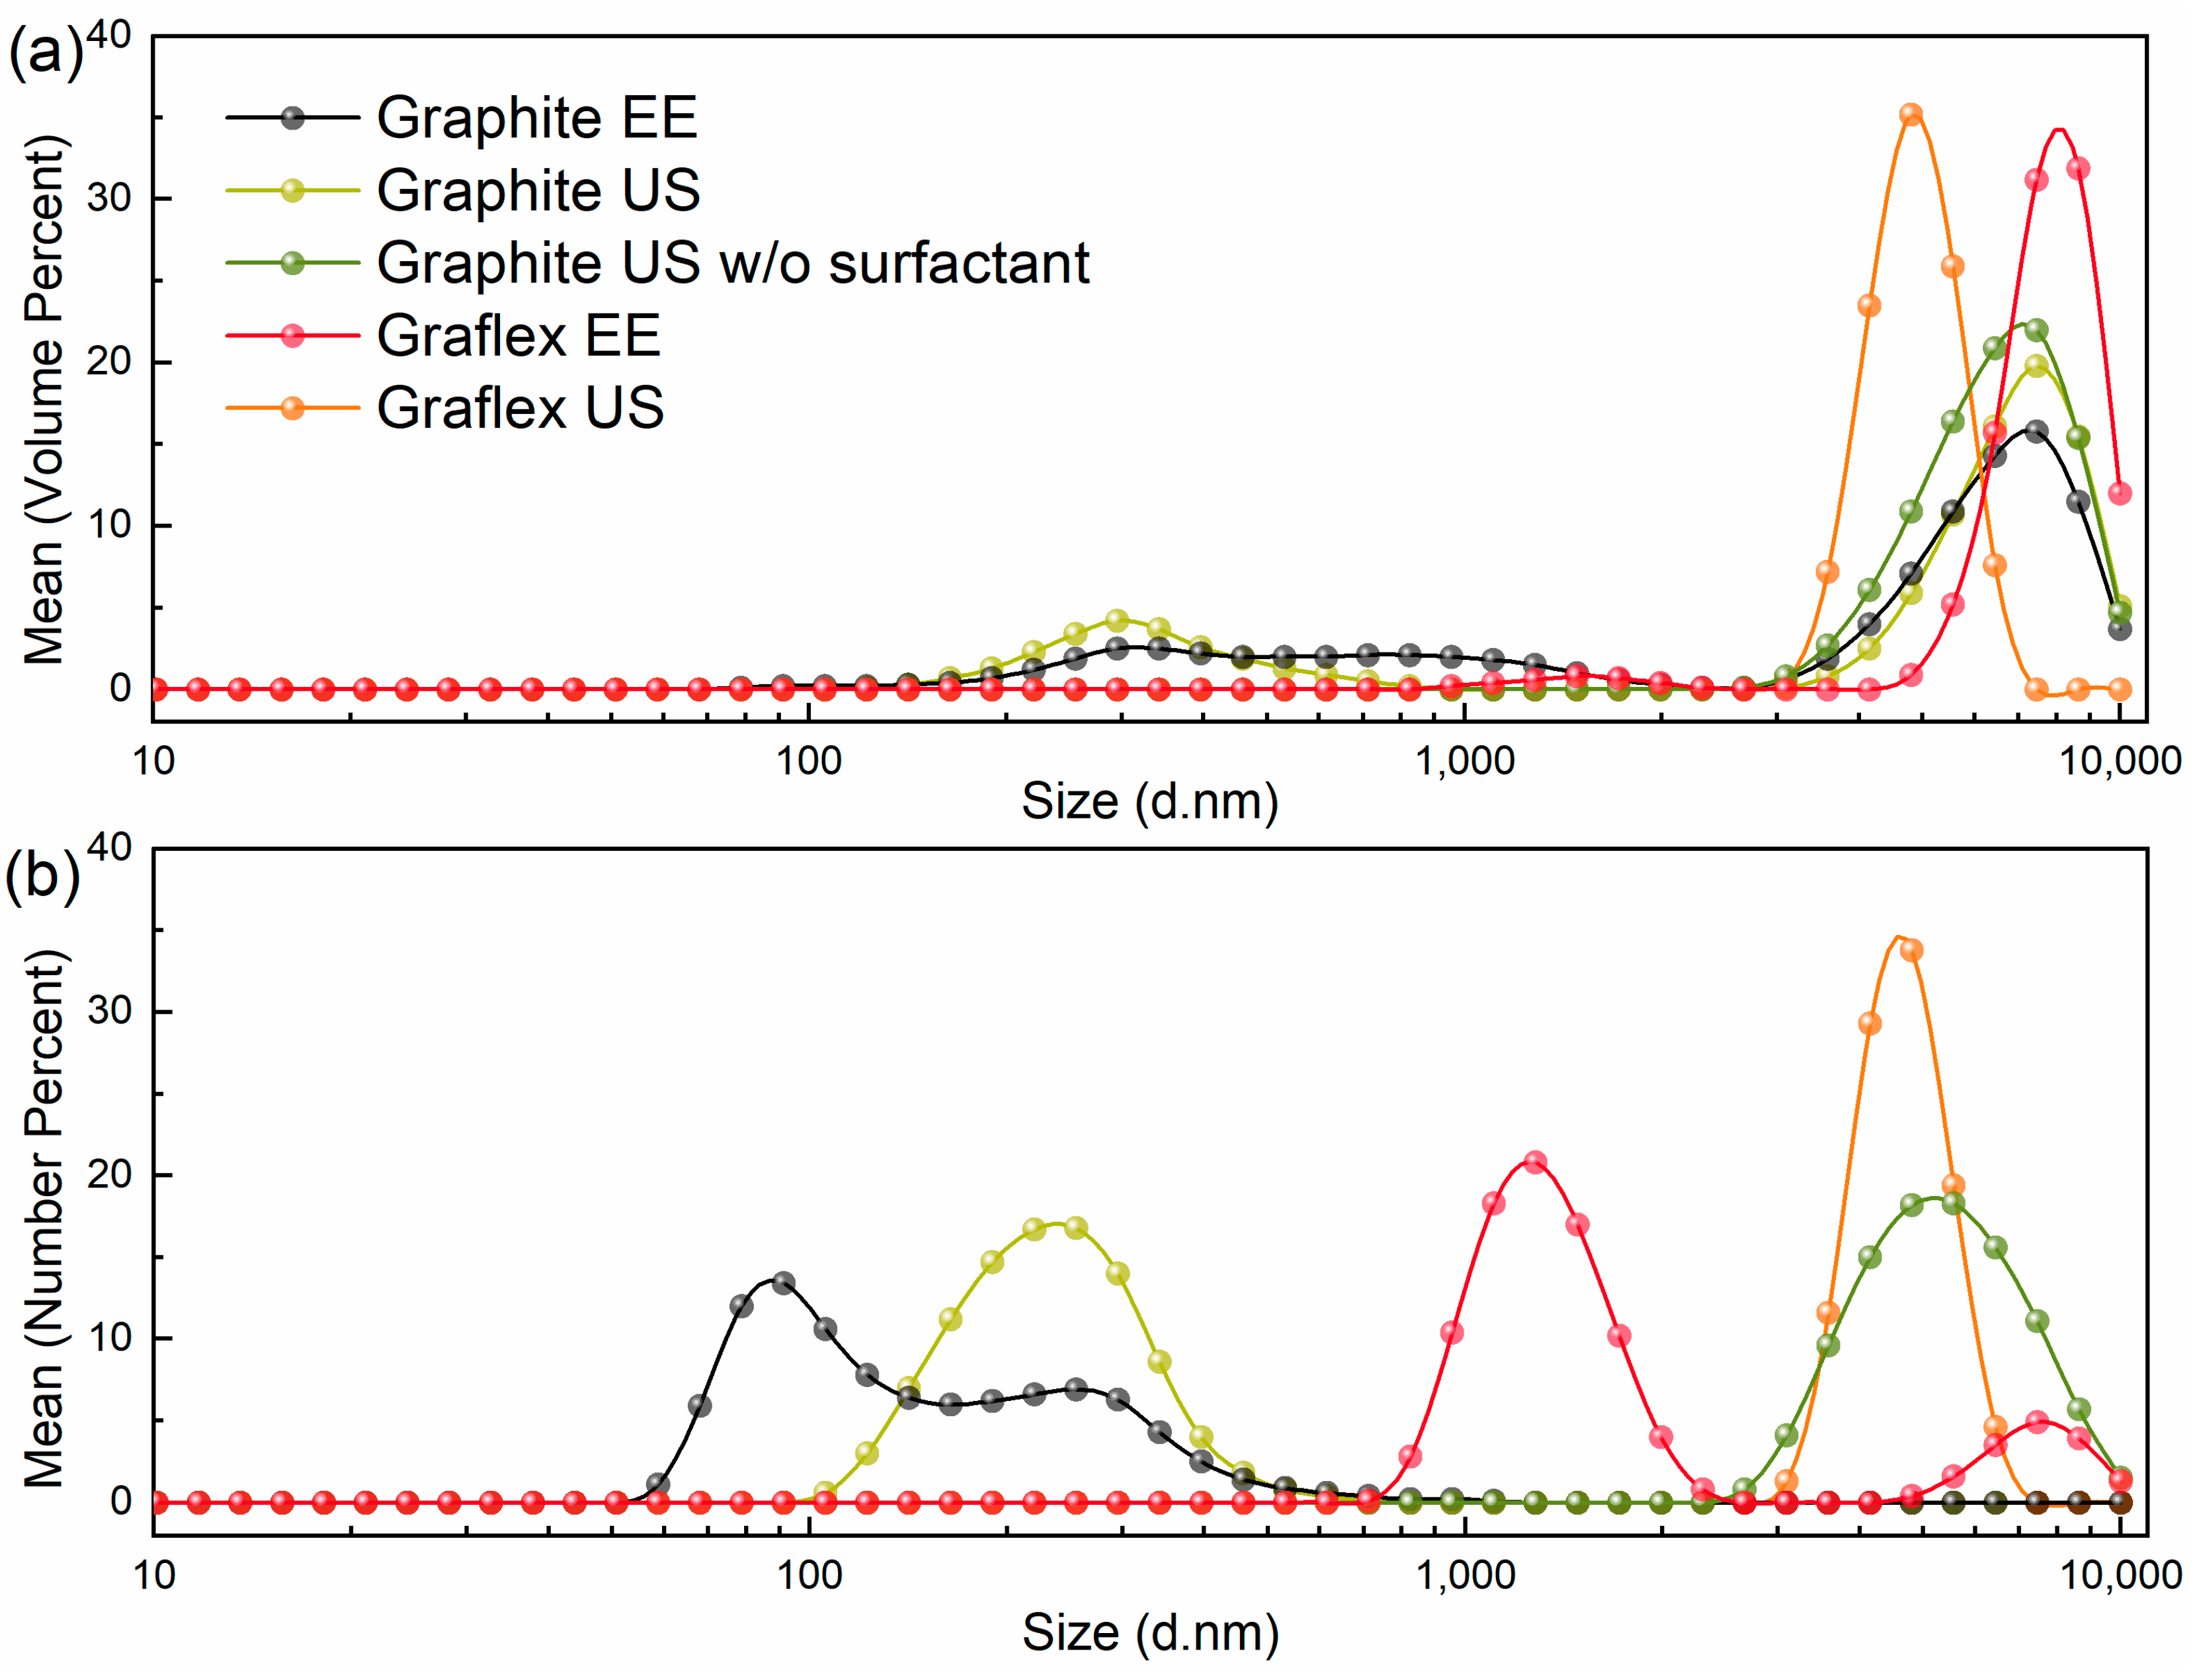
The particle size distribution graphs (Figure 12) demonstrate that all synthesized materials exhibit a polydisperse nature. The distributions for sample pairs based on graphite (Graphite US, Graphite EE) and Graflex (Graflex US, Graflex EE) are similar. For the first pair, the volume-based and number-based distributions differ significantly: the samples contain a small number of large particles (7–8 µm), while the majority of particles fall within the 90–255 nm range. A clear difference between these distributions is indicated by the presence of a peak in the volume distribution and its absence in the number distribution. The second pair is characterized by a larger particle size (several micrometers), which correlates with TEM data on lateral dimensions. A comparison between Graphite US samples prepared with and without surfactant demonstrates that Nafion facilitates the formation of smaller particles via improved exfoliation efficiency.
Table 10 summarizes the characteristics of the particle number distribution peaks. According to the data, the narrowest distribution, with a full width at half maximum (FWHM) of 195 nm, centered around 255 nm, is observed for the Graphite US sample. The dispersion contains approximately 17% of these particles. The Graphite EE sample shows the smallest particle size (90 nm), but with a broader distribution. The corresponding curve extends toward larger sizes up to 255 nm, and the fraction of 90 nm particles is 13%.
According to Table 8, the ζ-potentials of the samples differ greatly. The samples with Nafion (EE-1, Graphite EE, Graphite US, Graflex US) have much higher ζ-potentials than the sample without Nafion (Graphite US w/o surfactant). In the case of Graphite EE sample, the ζ-potential exceeds 30 mV and reaches −35 mV, which explains its high resistance to particle agglomeration. The DLS results are consistent with those obtained by sedimentation analysis.

3.4. DTA

The derivatograms of the studied samples reveal several characteristic temperature ranges corresponding to various processes of material destruction. The low-temperature range (up to 150 °C) corresponds to water evaporation. Mass loss at moderate temperatures, around 200 °C, is related to desulfurization and decomposition of some oxygen-containing surface compounds [48,60,61,62,63,64]. In the temperature interval of approximately ~280–500 °C, degradation of the Nafion polymer (if present) is observed [9,65,66,67]. At higher temperatures (>500 °C), carbon combustion occurs along with the breakdown of more thermally stable functional groups [68,69].
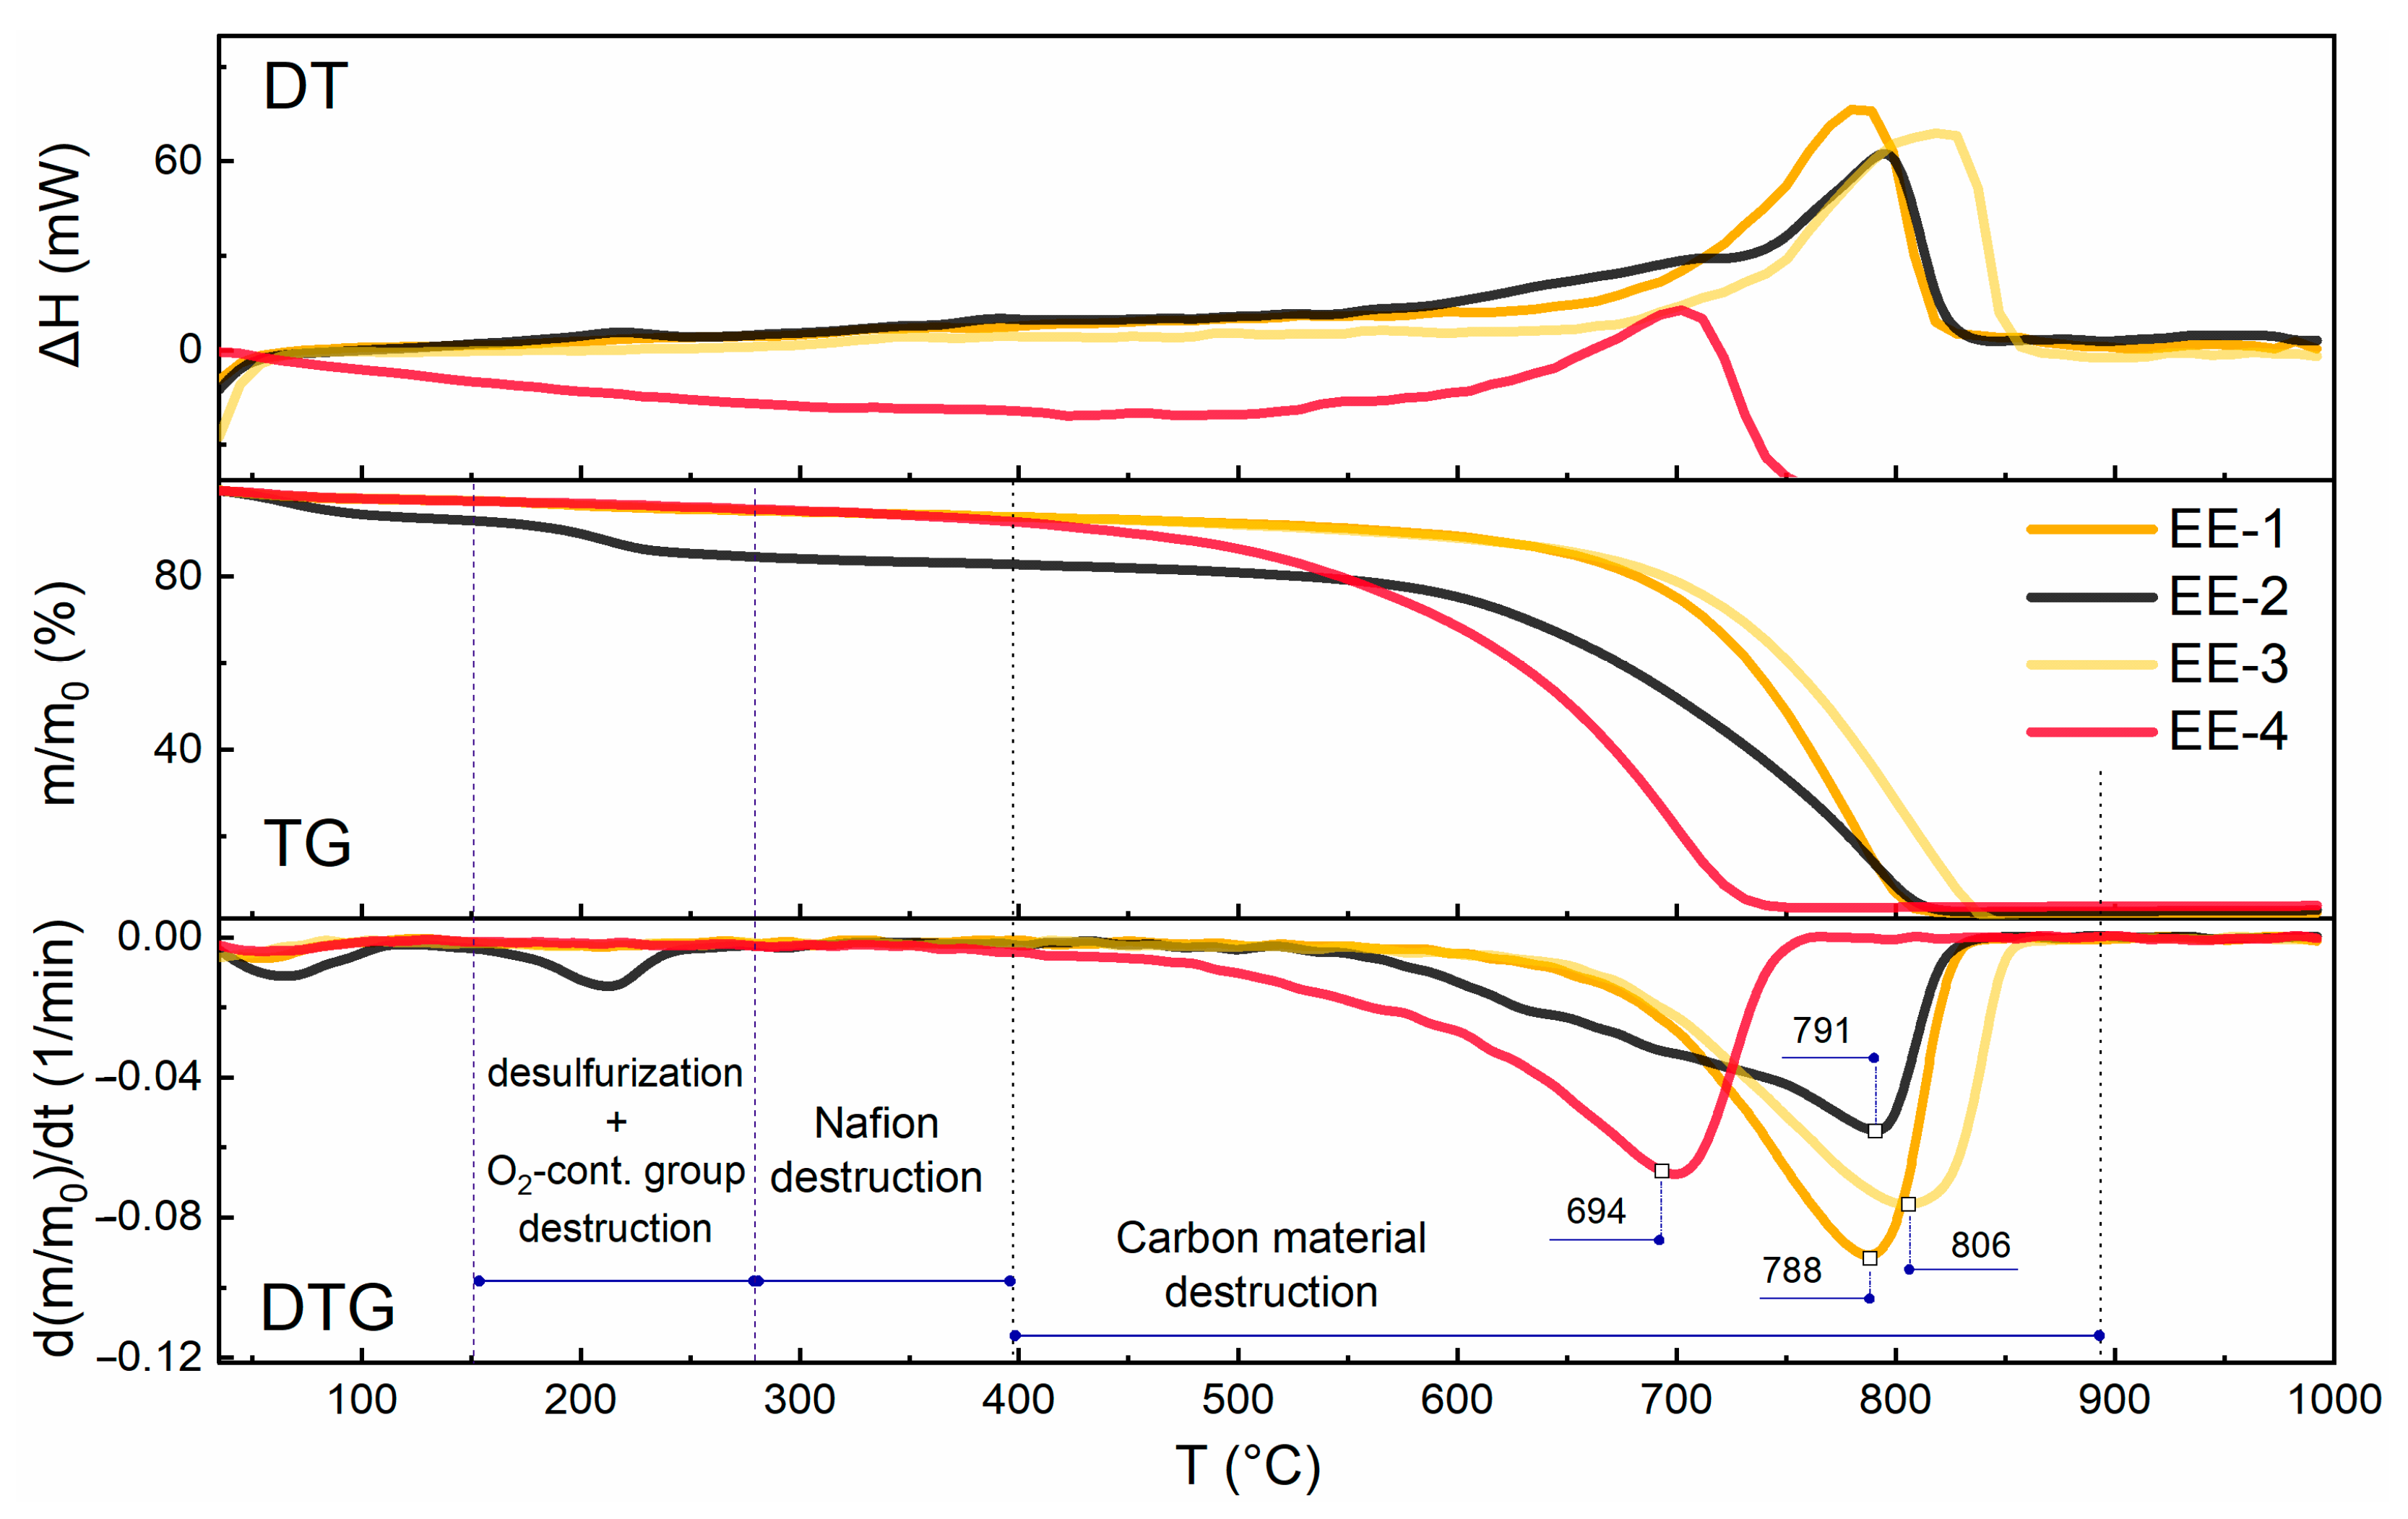
Figure 13 presents derivatograms for samples obtained by electrochemical exfoliation of graphite (EE-1, EE-2, EE-3) and Graflex (EE-4). The greatest mass loss at 200 °C is observed for sample EE-2 (potentiostatic mode, anodic potential), indicating a higher content of oxygen-containing functional groups compared to the pulsed mode samples (EE-1, EE-3), which were subjected to reduction at −1.5 V.
The lowest thermal stability in the high-temperature region is observed for sample Ee-4 (Graflex), with a peak mass loss rate at 694 °C. For EE-1 (pulsed mode with ionomer), the peak is at 788 °C; for EE-2 (potentiostatic mode with ionomer), at 791 °C; and for EE-3 (pulsed mode without ionomer), at 806 °C. Evidently, the presence of the ionomer reduces thermal stability. In the case of EE-2 sample, the TG curve in the high-temperature combustion region (534–840 °C) reveals several mass loss steps, while the derivative thermogravimetric (DTG) curve displays unresolved peaks, which are likely associated with the oxidation of different functional groups [9,64].
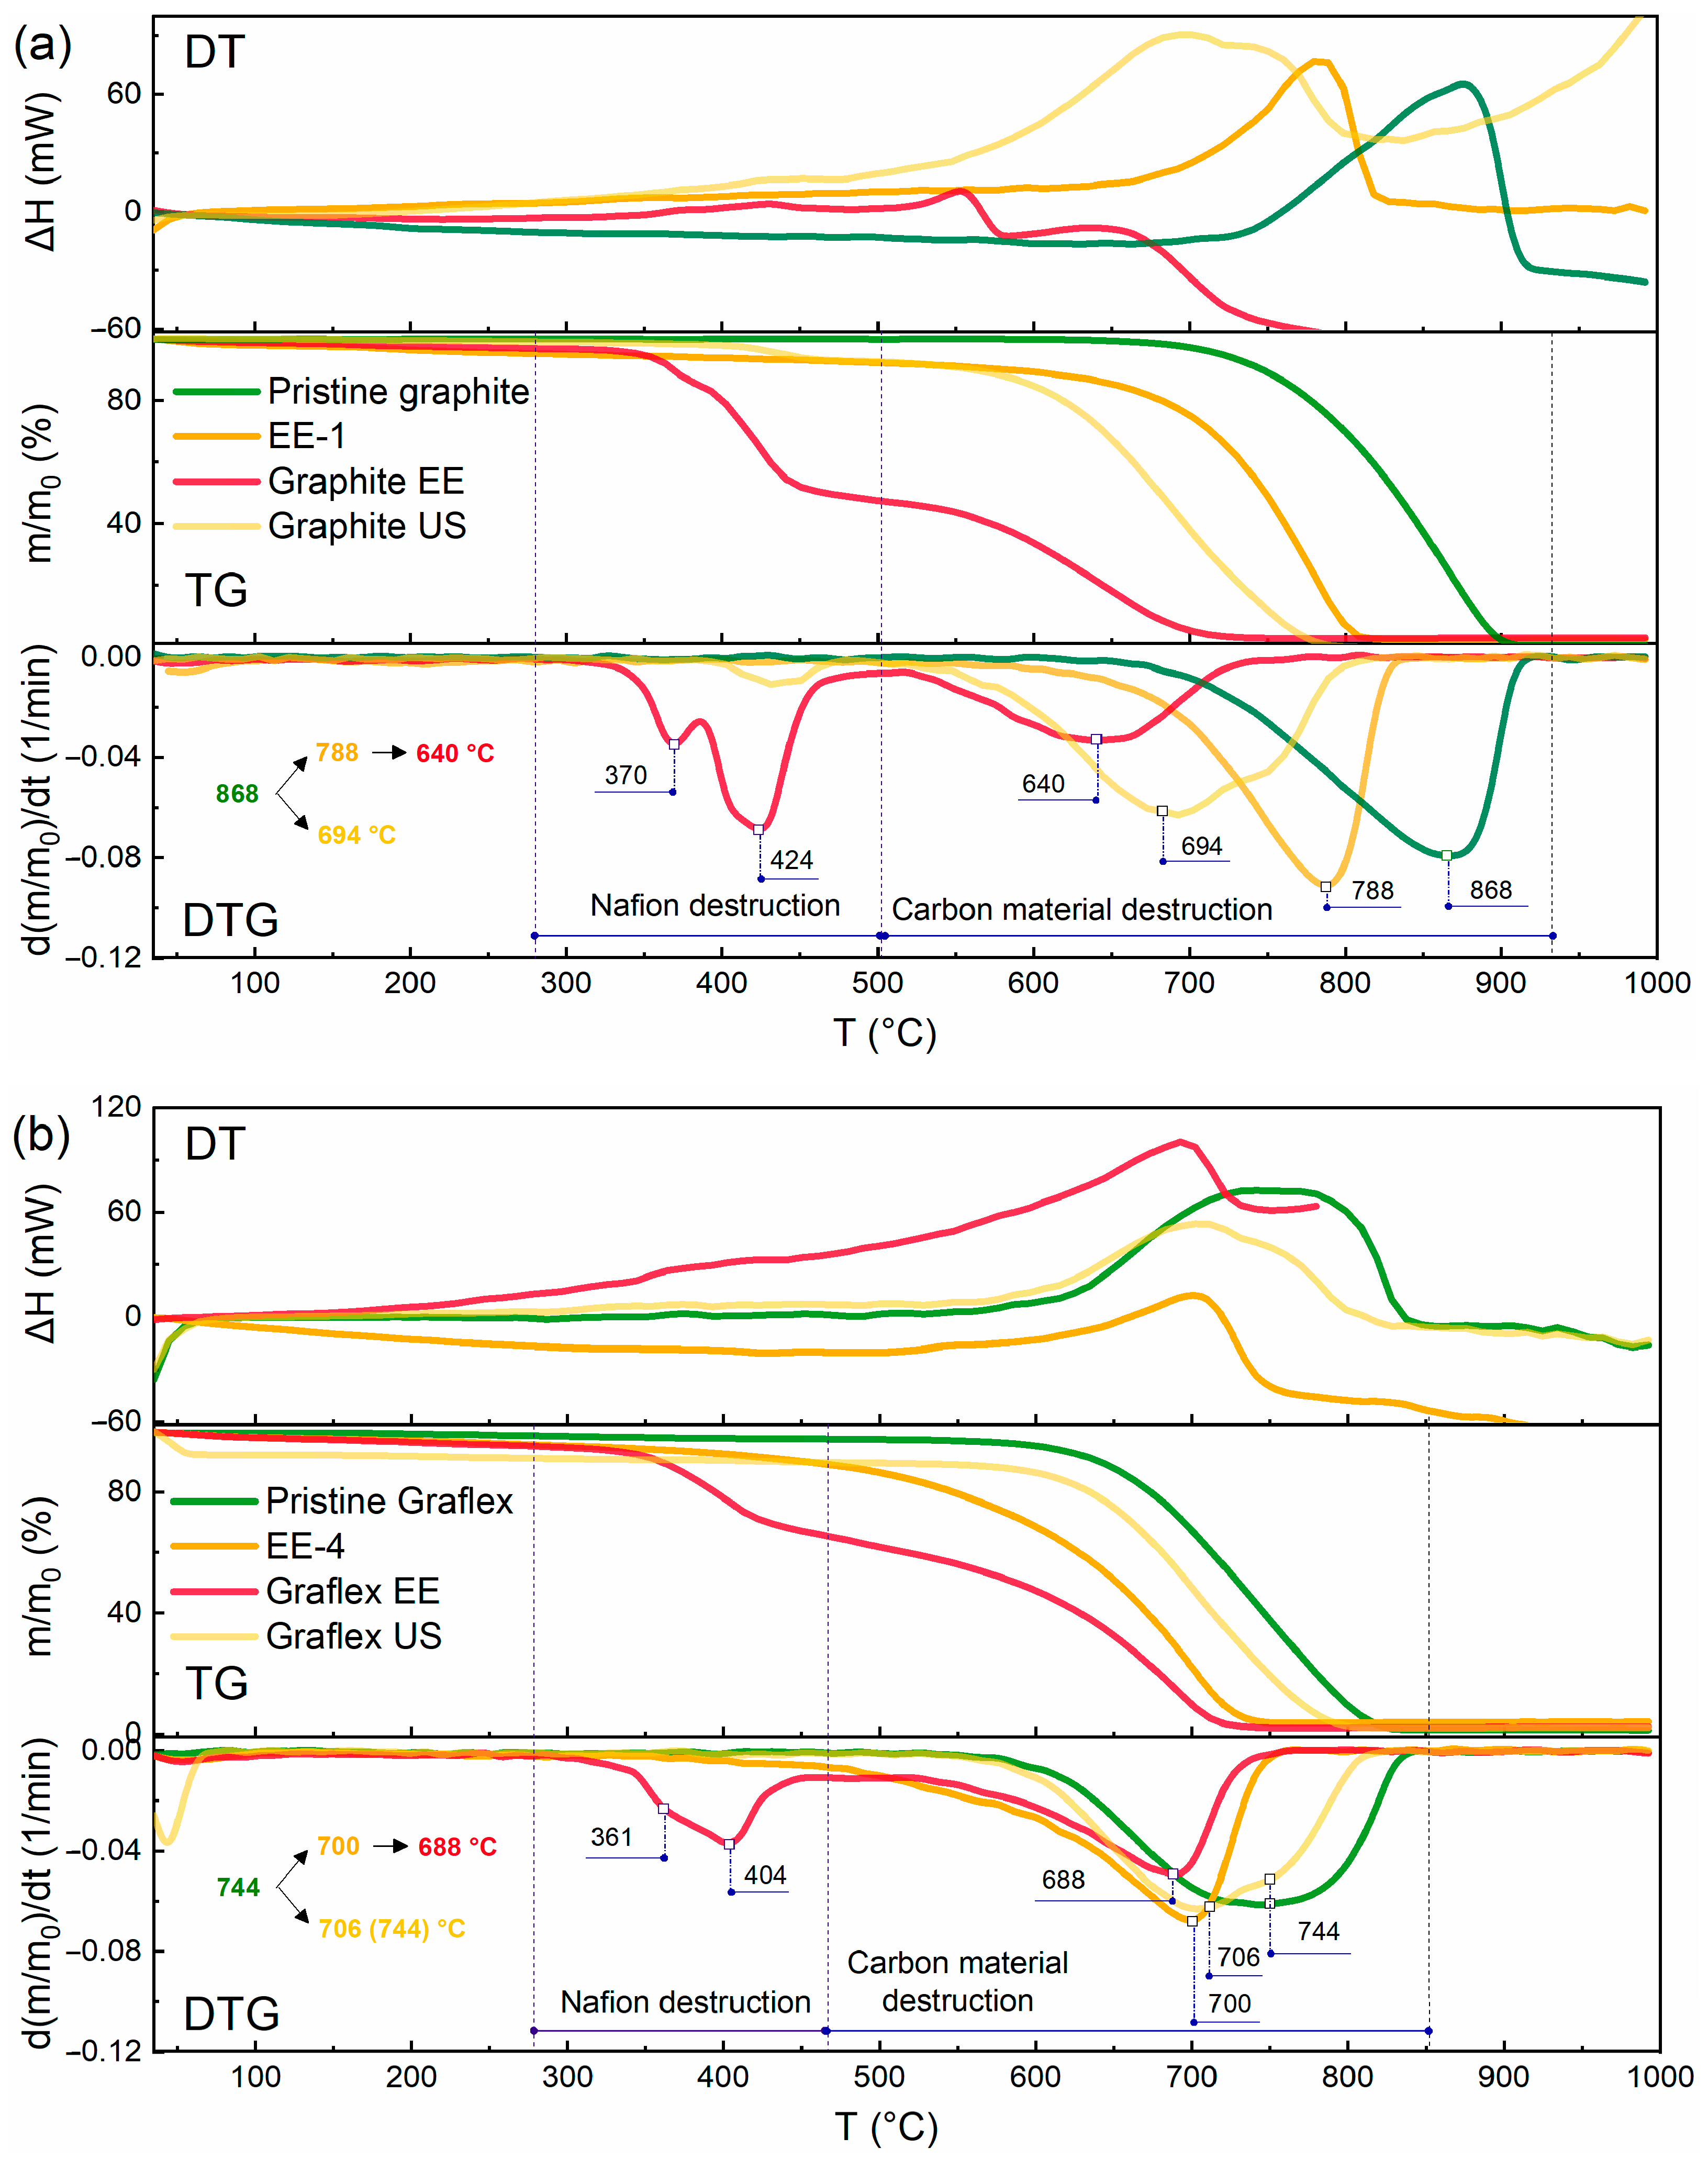
Figure 14a presents the TG curves of samples obtained from spectral graphite. Pristine spectral graphite exhibits high thermal stability at temperatures above 650 °C (Figure 14a, green curve). The exothermic peak is associated with carbon oxidation. In the case of the EE-1 sample (Figure 14a), mass loss begins earlier compared to graphite, which is attributed to the increased surface area. The addition of an ionomer (Graphite EE, Figure 14a, red curve) leads to the appearance of additional thermal effects, while further US treatment reduces thermal stability (maximum mass loss rate at 680 °C vs. 788 °C for EE-1 and 868 °C for spectral graphite), due to structural changes in the material (easier oxidation as a result of increased surface area).
The Graphite US sample (Figure 14a, yellow curve) exhibits lower thermal stability compared to pristine spectral graphite, due to structural changes and additional decomposition peaks from the ionomer. The maximum mass loss rate occurs at 694 °C, compared to 868 °C for pristine spectral graphite. The presence of two peaks on the DTG curve indicates the existence of two dispersed phases.
The sample obtained using high-power US treatment without the ionomer demonstrated thermal stability comparable to that of spectral graphite, with maximum mass loss rates at 838 °C and 868 °C, respectively. In the absence of the ionomer, structural changes in the material are less pronounced.
The series of samples obtained via liquid-phase exfoliation of graphite exhibits higher thermal stability compared to the series produced using the two-step method involving electrochemical exfoliation.
Graflex (Figure 14b, green curve) is less thermally stable than spectral graphite, with decomposition starting at 550 °C. The maximum mass loss rate for Graflex is observed at 744 °C, compared to 868 °C for spectral graphite. Its denser structure is confirmed by a broad peak in the DTG curve, indicating diffusion-controlled combustion. Electrochemical exfoliation (EE-4, Figure 14b, orange curve) further reduces thermal stability, resulting in a loose structure with a high surface area. The presence of an ionomer (Graflex EE, Figure 14b, red curve) leads to additional thermal effects, while subsequent US treatment decreases thermal stability (maximum mass loss rate at 688 °C vs. 700 °C for EE-4 and 744 °C for spectral graphite) due to structural changes in the material (facilitated oxidation resulting from increased surface area).
The Graflex US sample (Figure 14b, yellow curve), obtained by ultrasound-assisted liquid-phase exfoliation, exhibits thermal stability similar to that of the original Graflex. Two peaks on the DTG curve indicate the presence of two dispersed phases. The peak at 744 °C, which coincides with that of the initial Graflex, is likely attributable to the remaining non-exfoliated fraction, while the peak at 706 °C, shifted to a lower temperature, is associated with the oxidation of graphene-based material.
The DTA data correspond to the Raman spectroscopy results, with lower thermal stability being associated with a higher number of defects, as indicated by these results (Figure S1, Table S1).
Thermogravimetric analysis reveals that the processing parameters employed during material fabrication influence its thermal stability due to structural changes. High-power ultrasound-assisted liquid-phase exfoliation (2.4 W/mL), performed with a small amount of surfactant, exerts little influence on the thermal characteristics of Graflex. The sample obtained by liquid-phase exfoliation of graphite turned out to be less thermally stable, which confirms the effect of exfoliation and the role of surfactants in this process. Electrochemical exfoliation followed by low-power liquid-phase exfoliation (18 W/L) in the presence of a surfactant results in a more significant decrease in thermal stability.

3.5. XPS

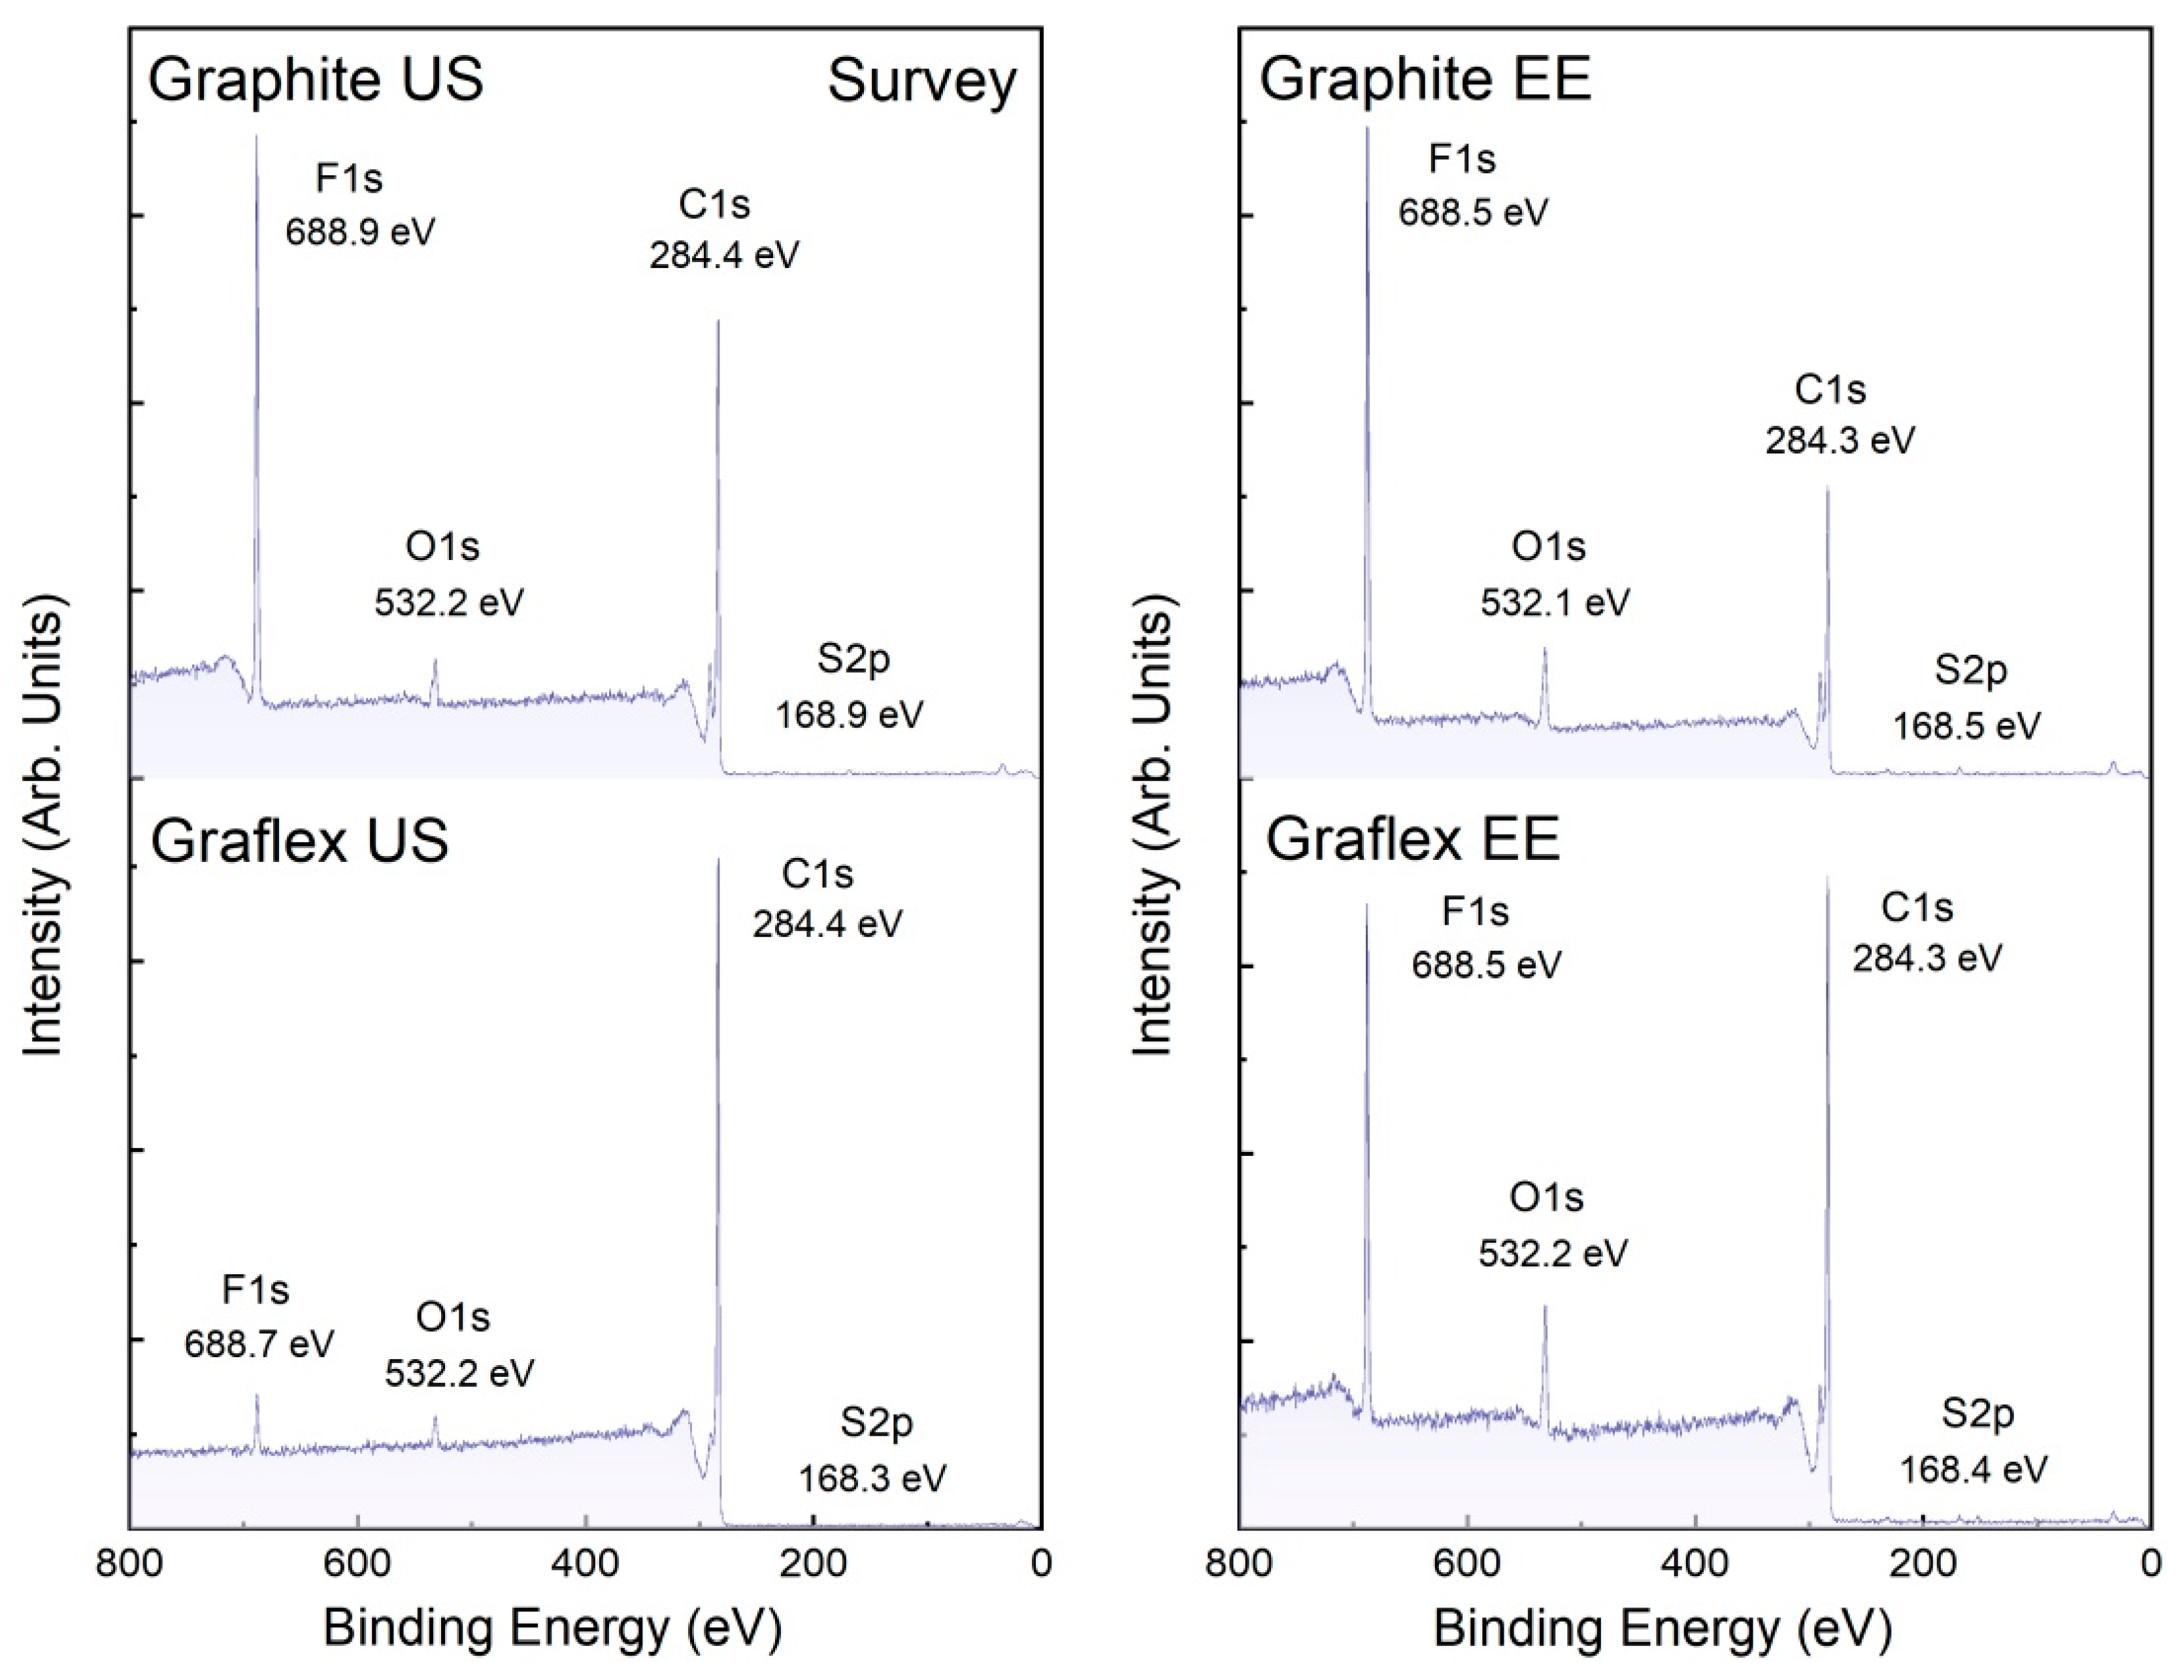
To analyze the influence of synthesis parameters and the type of precursor used for synthesis on the chemical composition and electronic structure of graphene, XPS studies of the synthesized graphene powders were carried out. Survey spectra were acquired to identify the elements present and to estimate their quantities (Figure 15). The elemental composition of the synthesized samples and the original Nafion is presented in Table 11. To calculate the C1s/O1s ratio for the graphene sheets excluding Nafion contributions, the F1s/C1s and F1s/O1s ratios from the Nafion spectrum were used to estimate the fractions of oxygen and carbon attributable to Nafion and the сarbon material. The C1s/O1s ratio calculated from the spectra indicates a higher degree of oxidation in the samples obtained by electrochemical exfoliation (Graphite EE, Graflex EE) compared to those produced by liquid-phase exfoliation. Among samples synthesized using the same method, the least oxidized graphene was obtained when Graflex was used as the precursor.
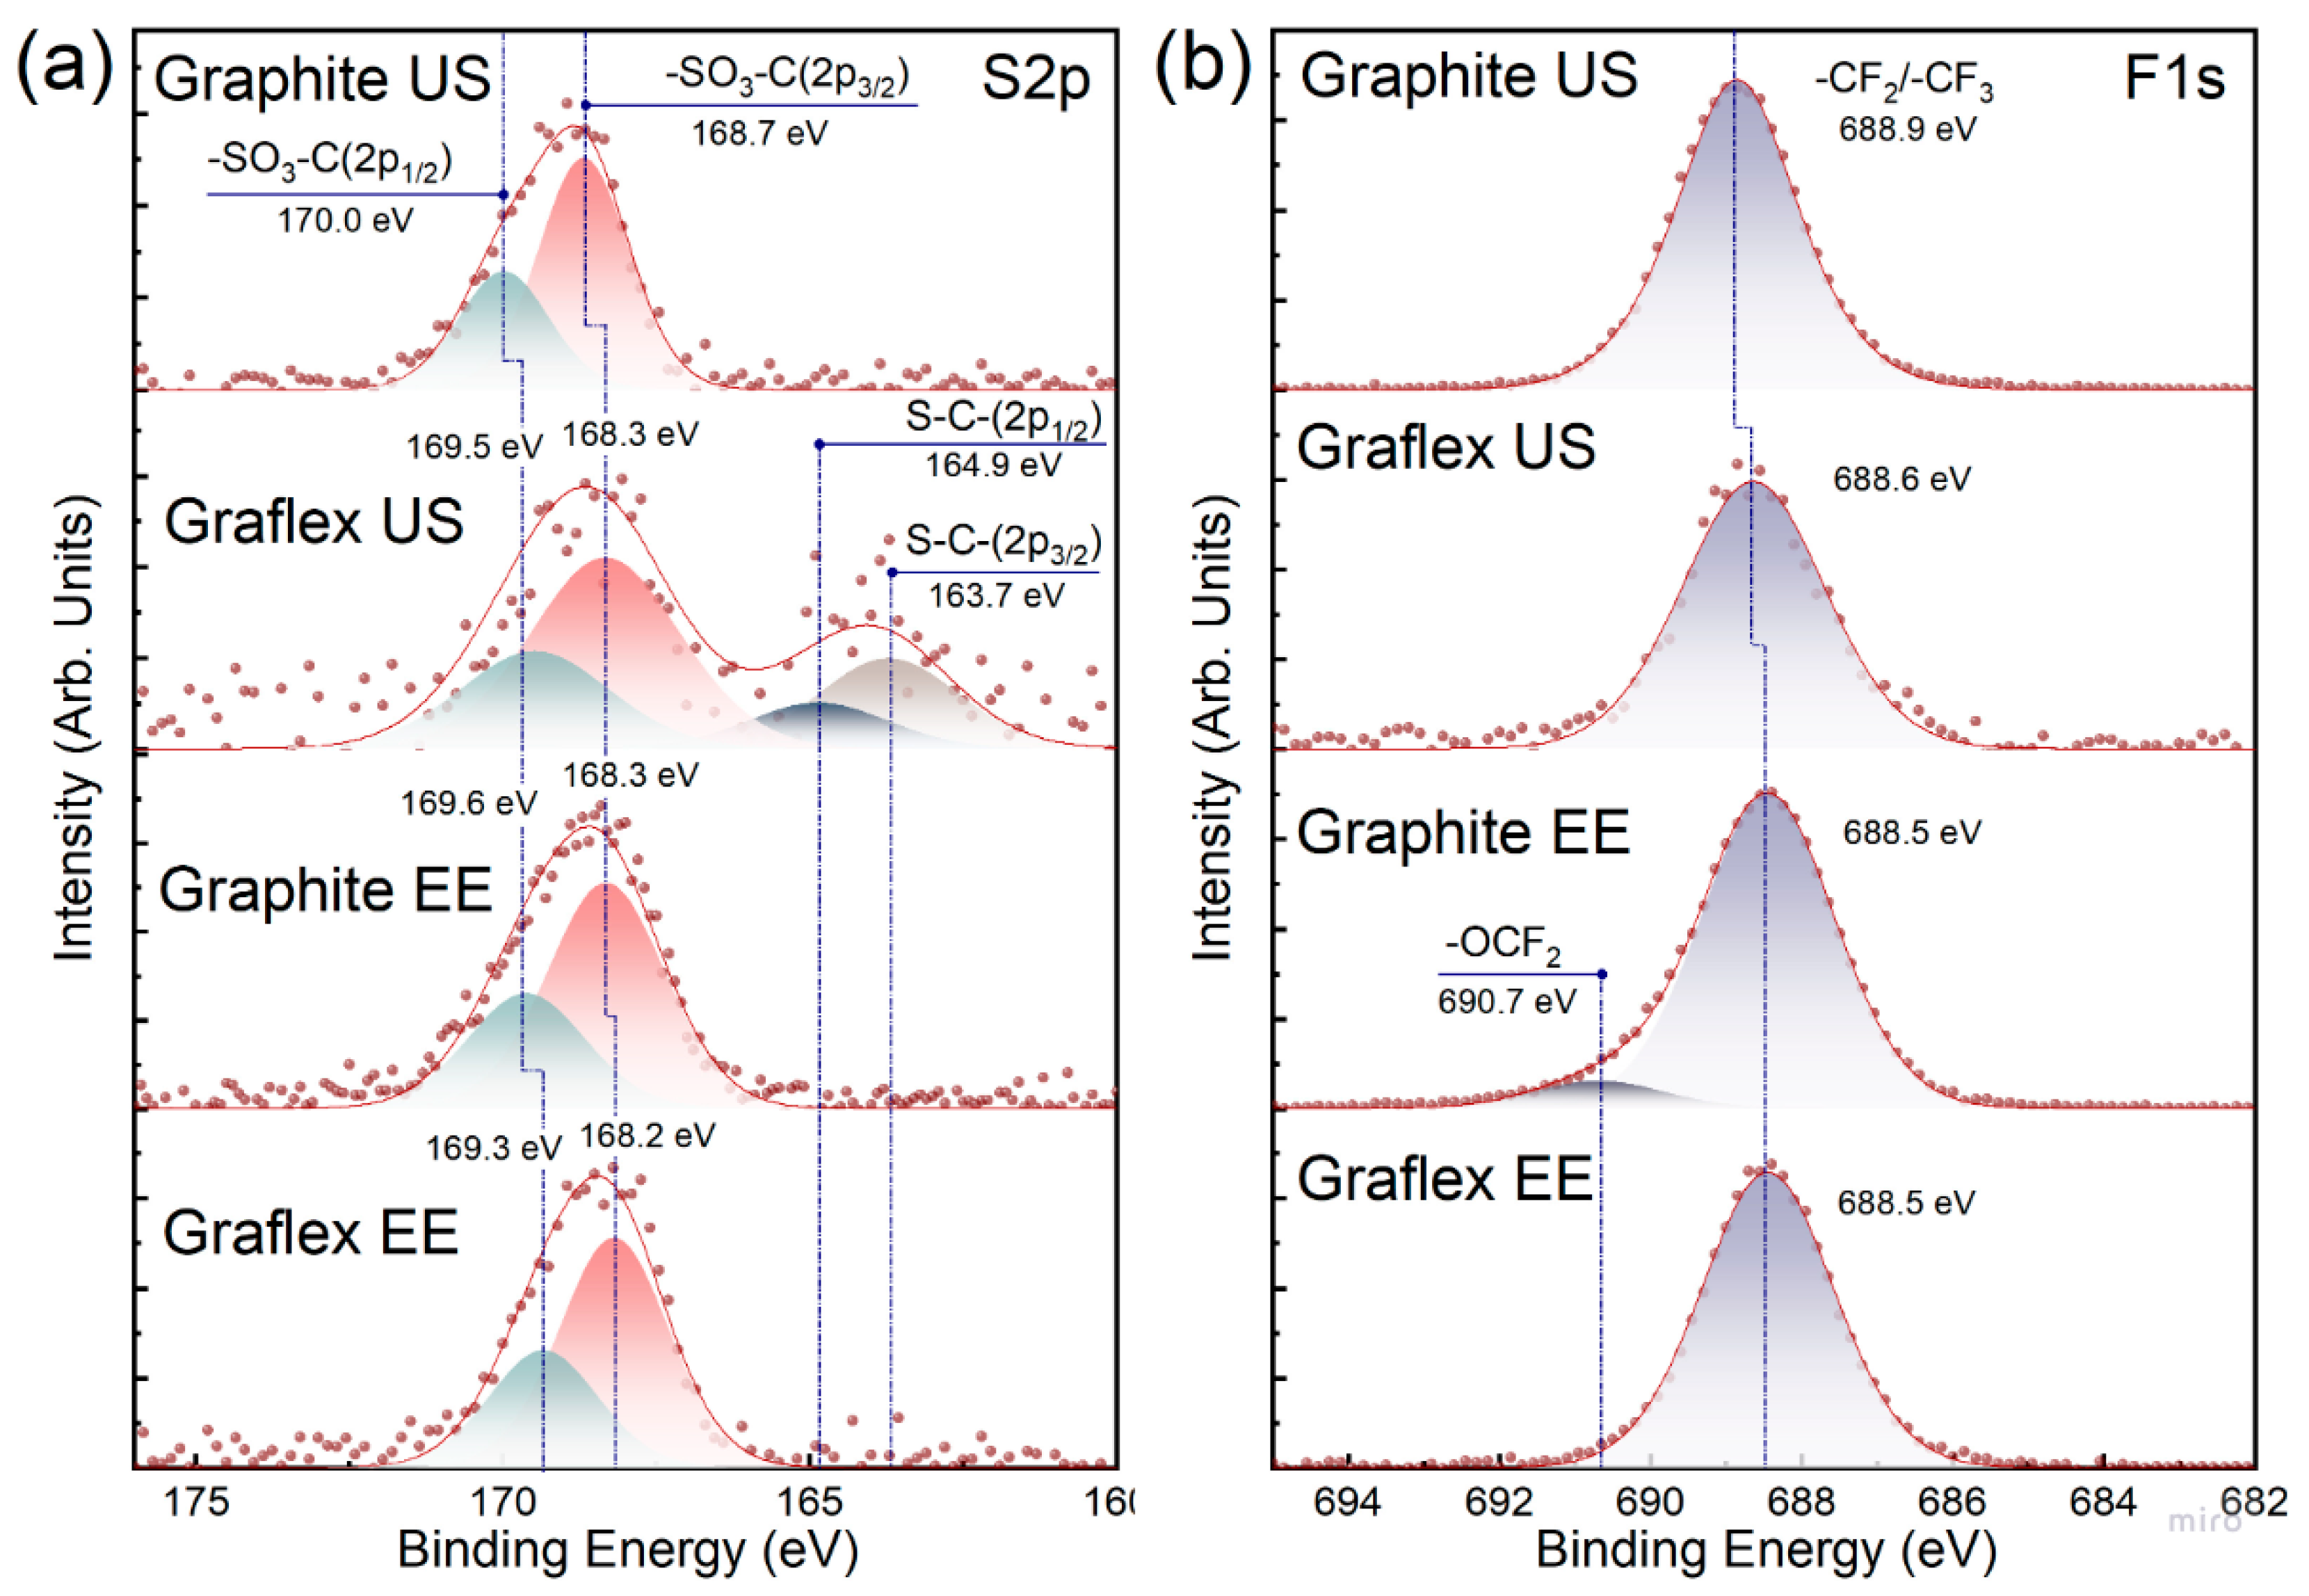
The F1s/S2p ratio in the graphene–Nafion composite samples remains close to that of pristine Nafion, indicating that the polymer structure is largely preserved during the graphene exfoliation process. In contrast, the Graflex US sample shows a reduction of this ratio by approximately a factor of two compared to pristine Nafion, suggesting partial degradation of Nafion’s fluorocarbon chains during US treatment.
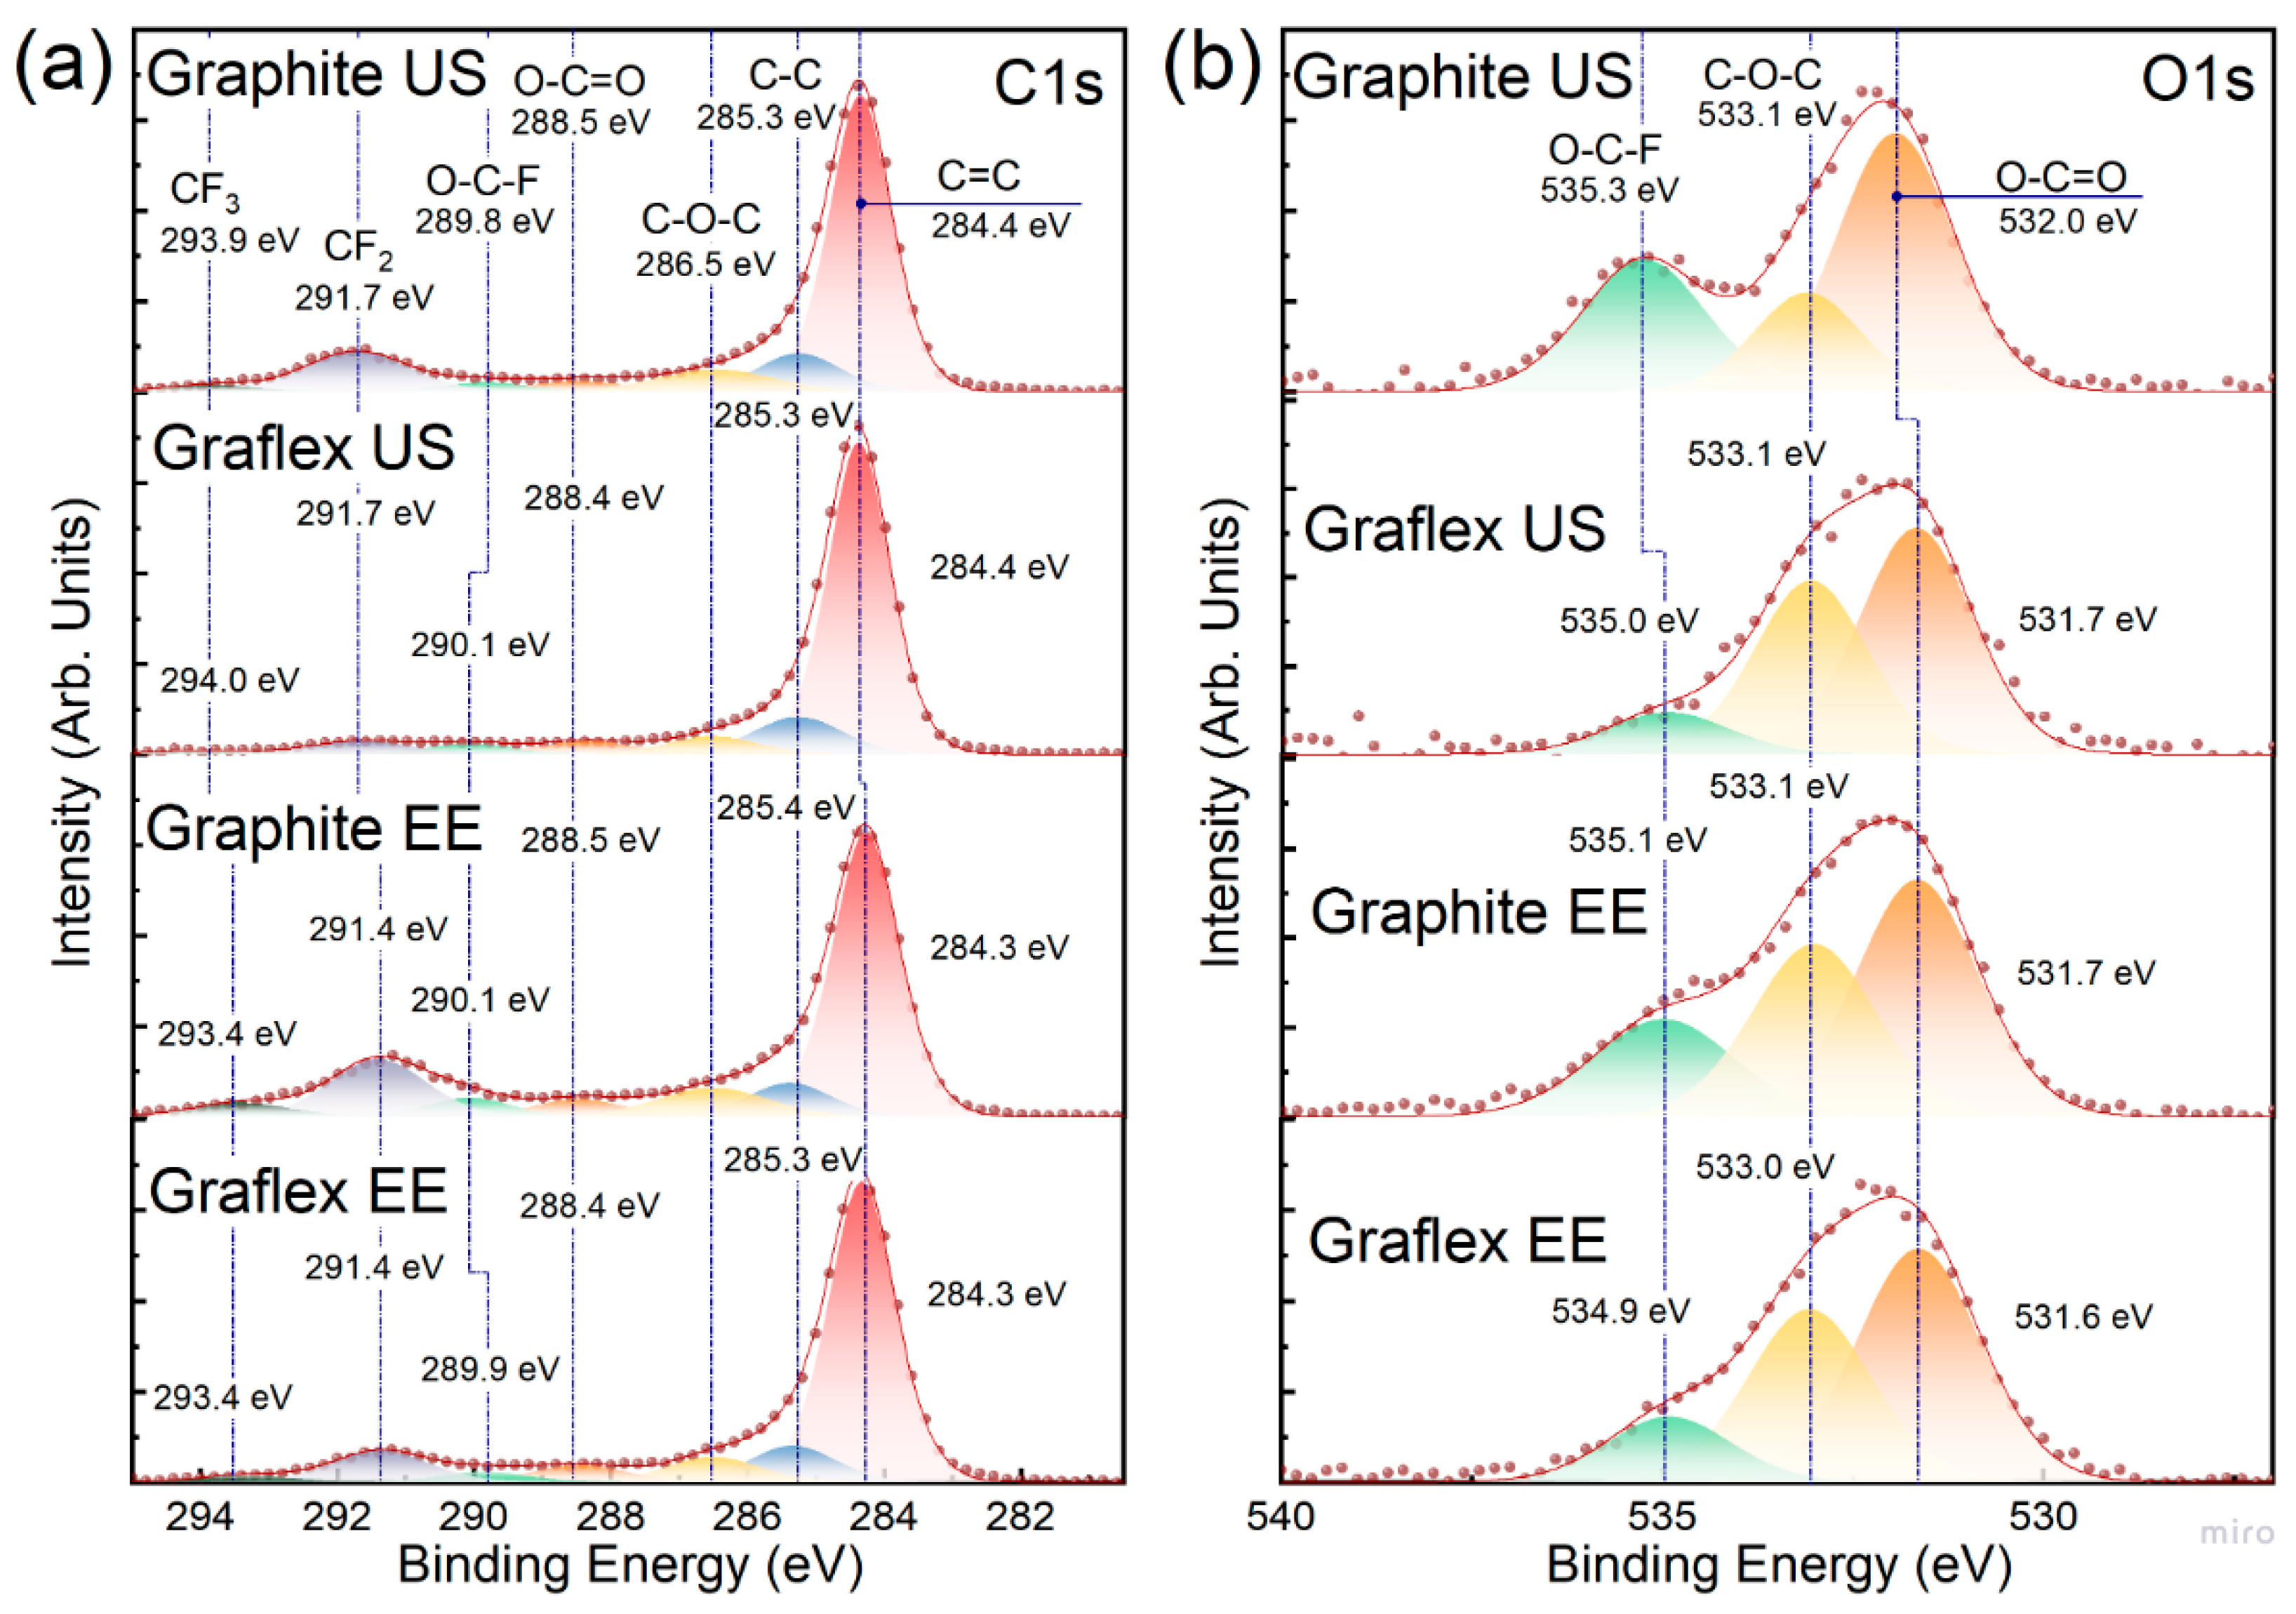
Figure 16a presents the C1s spectra for the Graphite US, Graflex US, Graphite EE, and Graflex EE samples. The line at a binding energy of 284.3–284.4 eV corresponds to graphene-like carbon with sp2 hybridization, while the line at 285.3–285.4 eV is associated with sp3-hybridized carbon in oxidized graphene regions. Lines corresponding to C–O–C, O–C=O, and O–C–F chemical bonds appear at 286.5, 288.5, and 289.8–290.1 eV, respectively. C1s lines related to –CF2 and –CF3 groups (characteristic of carbon structures in the PTFE main chain, –CF2–CF2–CF3) are located at 291.4–291.7 and 293.4–294.0 eV, respectively. In the O1s spectra, three energy peaks are observed: a high-energy peak at 531.6–532.0 eV, a medium-energy peak at 533.1 eV, and a low-energy peak at 534.9–535.3 eV, corresponding to O–C=O, C–O–C, and O–C–F bonds, respectively (Figure 16b).
Deconvolution of the S2p spectra displayed in Figure 17a revealed a single component in all samples, corresponding to an SO3–C– type bond, with a binding energy in the range of 168.2–168.7 eV depending on the sample. A different pattern was observed in the case of the Graflex US sample: the overall sulfur content was lower compared to the Graphite US, Graphite EE, and Graflex EE samples. Two components were detected in this sample, associated with SO3–C– and S–C– bonds, the latter attributed to polysulfides with terminal sulfur atoms and located at 163.7 eV [70].
Deconvolution of the F1s spectra revealed a component corresponding to a combination of –CF2 and –CF3 bonds at 688.5 eV in all samples produced via the two-step process (Graphite EE and Graflex EE), with a minor shift to 688.6 eV in Graflex US and 688.9 eV in Graphite US (liquid-phase exfoliation). Additionally, the Graphite EE sample showed a second component at 690.7 eV, attributed to the –OCF2 bond. This finding supports the higher oxidation level of the sample prepared from spectral graphite using electrochemical exfoliation.
Table 12 lists the functional composition of the samples derived from C1s spectrum deconvolution. The samples obtained by liquid-phase exfoliation exhibited the highest C/O ratios: 35.56 for Graflex US and 13.38 for Graphite US. Samples produced via the two-step method contained more oxygen. The sp2/sp3 ratio was highest in the Graphite EE sample, suggesting better preservation of the graphene sheet structure with minimal defects. The Graphite US sample had the highest defect concentration.

4. Discussion and Conclusions

The conducted study demonstrates that both ultrasonic and electrochemical exfoliation are effective methods for producing few-layer graphene; however, the efficiency and properties of the final material strongly depend on the type of precursor, processing parameters, and the presence of the ionic surfactant Nafion.
Ultrasound-assisted liquid-phase exfoliation of carbon materials at high power levels (2.4–4 W/mL) results in the formation of few-layer graphene dispersions. UV-Vis spectra and sedimentation curves confirm the influence of Nafion and sonication time on the exfoliation process. The highest exfoliation efficiency is observed after 45 min of sonication with a surfactant concentration of 100–150 mg/L. Graflex as a precursor results in the formation of sheets with lateral dimensions up to 1 µm or more, while spectral graphite forms sheets sized between 100 and 300 nm.
Electrochemical exfoliation of carbon materials in pulsed mode (+3 V for 30 s, −1.5 V for 30 s) in the presence of Nafion, combined with subsequent mild ultrasound-assisted liquid-phase exfoliation (18 W/L), leads to the formation of few-layer graphene (1–3 layers) with relatively small particles. In contrast, without Nafion, the exfoliation process yields larger, thicker particles (>10 layers). Under potentiostatic conditions, large aggregates with more than 10 layers form and rapidly sediment, although some few-layer fragments are also detected. Nafion enhances exfoliation efficiency and suppresses oxidation, likely due to its surface-active nature and adsorption onto graphene. Electrochemical efficiency is significantly higher in the presence of Nafion.
The intensity of the sulfate ion deintercalation peak on the CV at −0.460 V vs. Ag/AgClsat. linearly depends on the scan rate of the working electrode, which indicates reaction-controlled kinetics of the cathodic process (the rate is limited by the charge transfer reaction, not diffusion).
At a polarization time of 30 s, the saturation of the sulfate ion deintercalation current is observed at −0.460 V vs. Ag/AgClsat. Thus, the pulse mode with a 30 s wait ensures complete intercalation.
TEM and ED analyses revealed that using graphite as a precursor (Graphite US, Graphite EE) results in graphene fragments with lateral dimensions of 100–300 nm and thicknesses ranging from a few layers up to several tens of layers. Electrochemically exfoliated graphite exhibits and fewer layers (10–15 layers) compared to samples treated with high-power US, which form stacks of about 100 layers. ED confirms that the sheets are predominantly multilayered. Furthermore, in the case of electrochemical exfoliation, the sheets have noticeably different shapes, with rougher edges.
The sheets are significantly larger, with lateral dimensions exceeding 1 µm for samples where Graflex was used as the precursor (Graflex US, Graflex EE) Electrochemical exfoliation influences the sheet shape as well, but to a lesser extent compared to graphite. Diffraction results indicate that the sheets are mainly single-layer.
XRD data indicate a relatively low number of layers in the Graphite EE sample–44 layers, while single-layer structures are not observed in TEM images. Such observations suggest the graphene-like material predominantly consists of multilayer structures.
The characteristics of Graflex US and Graflex EE materials differ significantly. According to powder XRD data, the graphene stacks consist of about 50 and 30 layers for Graflex US and Graflex EE, respectively. In contrast, TEM data indicate a predominantly single-layer graphene structure in both Graflex US and Graflex EE samples. These findings point to the polydispersity of the resulting material: the presence of a large number of single-layer particles with lateral sizes greater than 1 µm alongside particles with a larger number of layers. Consequently, the integral characteristic obtained by XRD is shifted toward higher values in terms of layer count.
DLS data support the TEM findings regarding lateral particle size. For the two samples derived from spectral graphite, the majority of particles fall within the 90–255 nm range. In contrast, the samples obtained from Graflex exhibit significantly larger particle sizes, typically in the micron range. The presence of Nafion promotes exfoliation, resulting in smaller particle sizes.
DTA reveals that processing parameters influence the thermal stability of the materials due to structural changes. Ultrasound-assisted liquid-phase exfoliation at high power (2.4 W/mL) in the presence of a small amount of surfactant has little effect on the thermal behavior of Graflex. In contrast, the graphite-based sample produced under similar conditions demonstrates reduced thermal stability, confirming both the exfoliation effect and the role of the surfactant. Electrochemical exfoliation followed by mild sonication (18 W/L) in the presence of a surfactant exerts a more significant influence, leading to further reduction in thermal stability.
The highest C/O ratios were found in samples obtained via ultrasound-assisted liquid-phase exfoliation: 35.56 for Graflex US and 13.38 for Graphite US. Samples prepared using the two-step exfoliation method contained more oxygen. Graphite EE had the highest sp2/sp3 ratio, indicating fewer defects and better structural integrity. Conversely, the highest defect density was observed in the Graphite US sample.
One of the key factors influencing the morphology and composition of graphene-based materials is the tendency of individual layers to reaggregate during drying. Although liquid-phase exfoliation or electrochemical exfoliation enables the production of thin fragments with a thickness of 1–3 layers, these particles remain thermodynamically unstable and tend to restack into multilayer structures. Such reaggregation is primarily caused by van der Waals interactions between the basal planes of graphene sheets and, in the case of reduced graphene oxides, by hydrophobic forces. During the drying process, individual layers in dispersion reaggregate, forming stacks of 10–15 layers or more, as observed by TEM and XRD analyses. This effect was noted for graphenes derived from graphite, where the average lateral size of crystallites in the starting material was several tens of nanometers. In contrast, materials obtained from Graflex, which has a larger lateral crystallite size, exhibited a predominantly single-layer structure according to TEM and ED, while XRD analysis revealed the smallest number of layers (30.7) among the studied samples.
The comparison (Table 13) clearly shows that electrochemical exfoliation enables a lower number of layers (down to ~30), thus providing better dispersity and structural quality compared to ultrasonic treatment. However, this advantage comes at the expense of much higher synthesis times and energy consumption. Therefore, while electrochemical exfoliation is superior in terms of graphene performance, US remains more favorable in terms of scalability and efficiency.
Therefore, the two-step exfoliation method, consisting of electrochemical exfoliation in pulsed mode in the presence of Nafion followed by mild US treatment, is the most versatile and promising approach. Using Graflex as a precursor enables achieving maximum graphene sheet sizes and high dispersity, while the use of Nafion helps control the structure and suppress aggregation.
These findings may be employed to improve the stability of electrochemical energy devices and extend their service life. Beyond electrochemical applications, such Nafion–graphene materials also hold promise for use in anticorrosion coatings and electromagnetic shielding composites. The choice of method depends on the requirements for the final product. Ultrasonic exfoliation is advantageous for rapid and scalable production, making it suitable for bulk applications such as composites, coatings, and fillers, where moderate defect levels are acceptable. In contrast, electrochemical exfoliation, while more time- and energy-demanding, provides graphene with fewer layers, which is highly relevant for electrochemical devices, sensors, batteries, and supercapacitors requiring high conductivity and controlled structural properties.

Supplementary Materials

The following supporting information can be downloaded at https://www.mdpi.com/article/10.3390/c11040076/s1, Figure S1: Raman spectra of the synthesized samples; Table S1: Raman spectroscopy data of the samples.

Author Contributions

Conceptualization, A.O.K., N.V.G. and A.A.N.; data curation, A.O.K., N.V.G., A.G.K., A.O.P. and A.A.N.; funding acquisition, A.O.K.; investigation, A.O.K., N.V.G., A.G.K., A.O.P., D.A.K., A.V.S., M.S.S., A.V.K., E.K.K. and A.A.N.; methodology, A.O.K., N.V.G. and A.A.N.; project administration, A.O.K. and N.V.G.; supervision, A.O.K. and N.V.G.; validation, A.O.K.; visualization, A.O.K. and N.V.G.; writing—original draft, A.O.K. and A.A.N.; writing—review and editing, A.O.K., N.V.G. and A.O.P. All authors have read and agreed to the published version of the manuscript.

Funding

This research was funded by the RUSSIAN SCIENCE FOUNDATION, grant number 24-73-10176, https://rscf.ru/en/project/24-73-10176/ (accessed on 13 June 2025).

Data Availability Statement

The original contributions presented in this study are included in the article/Supplementary Materials. Further inquiries can be directed to the corresponding author(s).

Acknowledgments

Structural studies (TEM, ED) were carried out in the Joint Research Center ‘Materials science and characterization in advanced technology’ (Ioffe Institute, St. Petersburg, Russia). The XPS studies were performed on the equipment of the Resource Center “Physical methods of surface investigation” of the Scientific Park of St. Petersburg University.

Conflicts of Interest

The authors declare no conflicts of interest.

Abbreviations

The following abbreviations are used in this manuscript:
XRDX-ray diffraction
TGAthermogravimetric analysis
EDelectron diffraction
DLSdynamic light scattering
EDXenergy-dispersive X-ray spectroscopy
XPSX-ray photoelectron spectroscopy
PEMproton exchange membrane
PEM WEproton exchange membrane water electrolyzer
MEAsmembrane electrode assemblies
PTFEpolytetrafluoroethylene
PEMFCproton exchange membrane fuel cells
rGOreduced graphene oxide
GOgraphene oxide
TEMtransmission electron microscopy
AFMatomic force microscopy
SEMscanning electron microscopy
USultrasound
CVcurrent-voltage
TGthermogravimetric
DTdifferential thermal
CSRcoherent scattering region
EEelectrochemical exfoliation

References

  1. Rao, C.N.R.; Sood, A.K.; Subrahmanyam, K.S.; Govindaraj, A. Graphene: The New Two-Dimensional Nanomaterial. Angew. Chem. Int. Ed. 2009, 48, 7752–7777. [Google Scholar] [CrossRef]
  2. Baig, N. Two-Dimensional Nanomaterials: A Critical Review of Recent Progress, Properties, Applications, and Future Directions. Compos. Part A Appl. Sci. Manuf. 2023, 165, 107362. [Google Scholar] [CrossRef]
  3. Geim, A.K. Graphene: Status and Prospects. Science 2009, 324, 1530–1534. [Google Scholar] [CrossRef]
  4. Novoselov, K.S.; Geim, A.K.; Morozov, S.V.; Jiang, D.; Zhang, Y.; Dubonos, S.V.; Grigorieva, I.V.; Firsov, A.A. Electric Field Effect in Atomically Thin Carbon Films. Science 2004, 306, 666–669. [Google Scholar] [CrossRef]
  5. Yoo, E.; Kim, J.; Hosono, E.; Zhou, H.; Kudo, T.; Honma, I. Large Reversible Li Storage of Graphene Nanosheet Families for Use in Rechargeable Lithium Ion Batteries. Nano Lett. 2008, 8, 2277–2282. [Google Scholar] [CrossRef] [PubMed]
  6. Stankovich, S.; Dikin, D.A.; Dommett, G.H.B.; Kohlhaas, K.M.; Zimney, E.J.; Stach, E.A.; Piner, R.D.; Nguyen, S.T.; Ruoff, R.S. Graphene-Based Composite Materials. Nature 2006, 442, 282–286. [Google Scholar] [CrossRef] [PubMed]
  7. Ding, J.; Liu, P.; Zhou, M.; Yu, H. Nafion-Endowed Graphene Super-Anticorrosion Performance. ACS Sustain. Chem. Eng. 2020, 8, 15344–15353. [Google Scholar] [CrossRef]
  8. Tang, G.; Hou, X.; Wang, Y.; Yan, Z.; Ren, T.; Ma, L.; Huang, X.; Wang, C. Hexagonal Boron Nitride/Polyaniline Nanocomposites for Anticorrosive Waterborne Epoxy Coatings. ACS Appl. Nano Mater. 2022, 5, 361–372. [Google Scholar] [CrossRef]
  9. Glebova, N.V.; Krasnova, A.O.; Nechitailov, A.A. Thermal degradation of nafion in the presence of nanostructured materials: Thermally expanded graphite, carbon black, and platinum. Russ. J. Appl. Chem. 2020, 93, 1034–1041. [Google Scholar] [CrossRef]
  10. Teng, C.-C.; Ma, C.-C.M.; Lu, C.-H.; Yang, S.-Y.; Lee, S.-H.; Hsiao, M.-C.; Yen, M.-Y.; Chiou, K.-C.; Lee, T.-M. Thermal Conductivity and Structure of Non-Covalent Functionalized Graphene/Epoxy Composites. Carbon 2011, 49, 5107–5116. [Google Scholar] [CrossRef]
  11. Wadekar, P.H.; Khose, R.V.; Pethsangave, D.A.; Some, S. One-Pot Synthesis of Sulfur and Nitrogen Co-Functionalized Graphene Material Using Deep Eutectic Solvents for Supercapacitors. ChemSusChem 2019, 12, 3326–3335. [Google Scholar] [CrossRef]
  12. Wang, T.; Wang, L.-X.; Wu, D.-L.; Xia, W.; Jia, D.-Z. Interaction between Nitrogen and Sulfur in Co-Doped Graphene and Synergetic Effect in Supercapacitor. Sci. Rep. 2015, 5, 9591. [Google Scholar] [CrossRef]
  13. Pavko, L.; Gatalo, M.; Finšgar, M.; Ruiz-Zepeda, F.; Ehelebe, K.; Kaiser, P.; Geuß, M.; Đukić, T.; Surca, A.K.; Šala, M.; et al. Graphene-Derived Carbon Support Boosts Proton Exchange Membrane Fuel Cell Catalyst Stability. ACS Catal. 2022, 12, 9540–9548. [Google Scholar] [CrossRef] [PubMed]
  14. Liu, J.; Ishitobi, H.; Nakagawa, N. Different Functional Groups Cross-Linked Graphene Oxide Membranes for Proton Exchange Membrane Fuel Cell. Int. J. Hydrogen Energy 2024, 85, 586–597. [Google Scholar] [CrossRef]
  15. Samantaray, S.; Mohanty, D.; Satpathy, S.K.; Hung, I.-M. Exploring Recent Developments in Graphene-Based Cathode Materials for Fuel Cell Applications: A Comprehensive Overview. Molecules 2024, 29, 2937. [Google Scholar] [CrossRef]
  16. Pham, N.N.T.; Nguyen, V.K.T.; Guo, H.; Lee, S.G. Influence of Phosphorus-Doped Bilayer Graphene Configuration on the Oxygen Reduction Reaction in Acidic Solution. Carbon 2023, 210, 118012. [Google Scholar] [CrossRef]
  17. Strativnov, E.; Khovavko, A.; Guachao, N. Obtaining of Globular Graphene Based on Thermally Expanded Graphite. Appl. Nanosci. 2022, 12, 2791–2811. [Google Scholar] [CrossRef]
  18. Vacacela Gomez, C.; Tene, T.; Guevara, M.; Tubon Usca, G.; Colcha, D.; Brito, H.; Molina, R.; Bellucci, S.; Tavolaro, A. Preparation of Few-Layer Graphene Dispersions from Hydrothermally Expanded Graphite. Appl. Sci. 2019, 9, 2539. [Google Scholar] [CrossRef]
  19. Li, M.; Yin, B.; Gao, C.; Guo, J.; Zhao, C.; Jia, C.; Guo, X. Graphene: Preparation, Tailoring, and Modification. Exploration 2023, 3, 20210233. [Google Scholar] [CrossRef]
  20. Cheng, C.; Jia, P.; Xiao, L.; Geng, J. Tandem Chemical Modification/Mechanical Exfoliation of Graphite: Scalable Synthesis of High-Quality, Surface-Functionalized Graphene. Carbon 2019, 145, 668–676. [Google Scholar] [CrossRef]
  21. Barsukov, M.G.; Ritt, C.L.; Barsukov, I.V.; Syth, E.M.; Elimelech, M. Influence of Graphite Geography on the Yield of Mechanically Exfoliated Few-Layer Graphene. Carbon 2023, 208, 355–364. [Google Scholar] [CrossRef]
  22. Mbayachi, V.B.; Ndayiragije, E.; Sammani, T.; Taj, S.; Mbuta, E.R.; Khan, A.U. Graphene Synthesis, Characterization and Its Applications: A Review. Results Chem. 2021, 3, 100163. [Google Scholar] [CrossRef]
  23. Chen, J.; Yao, B.; Li, C.; Shi, G. An Improved Hummers Method for Eco-Friendly Synthesis of Graphene Oxide. Carbon 2013, 64, 225–229. [Google Scholar] [CrossRef]
  24. Johra, F.T.; Lee, J.-W.; Jung, W.-G. Facile and Safe Graphene Preparation on Solution Based Platform. J. Ind. Eng. Chem. 2014, 20, 2883–2887. [Google Scholar] [CrossRef]
  25. Pang, S.; Englert, J.M.; Tsao, H.N.; Hernandez, Y.; Hirsch, A.; Feng, X.; Müllen, K. Extrinsic Corrugation-Assisted Mechanical Exfoliation of Monolayer Graphene. Adv. Mater. 2010, 22, 5374–5377. [Google Scholar] [CrossRef] [PubMed]
  26. Carrasco, D.F.; Álvarez-Rubiera, E.; Villar-Rodil, S.; Martínez-Jódar, A.; Tascón, J.M.D.; Suárez-García, F.; Paredes, J.I. Chemically Tuning Graphene via Anodic Exfoliation for Enhanced Performance in Aqueous Zinc-Based Electrochemical Energy Storage Applications. Carbon 2024, 228, 119293. [Google Scholar] [CrossRef]
  27. Gürsu, H.; Gençten, M.; Şahin, Y. One-Step Electrochemical Preparation of Graphene-Coated Pencil Graphite Electrodes by Cyclic Voltammetry and Their Application in Vanadium Redox Batteries. Electrochim. Acta 2017, 243, 239–249. [Google Scholar] [CrossRef]
  28. Htwe, Y.Z.N.; Mariatti, M.; Chin, S.Y. Fabrication of Graphene by Electrochemical Intercalation Method and Performance of Graphene/PVA Composites as Stretchable Strain Sensor. Arab. J. Sci. Eng. 2020, 45, 7677–7689. [Google Scholar] [CrossRef]
  29. Aghamohammadi, H.; Eslami-Farsani, R.; Torabian, M.; Amousa, N. Recent Advances in One-Pot Functionalization of Graphene Using Electrochemical Exfoliation of Graphite: A Review Study. Synth. Met. 2020, 269, 116549. [Google Scholar] [CrossRef]
  30. Girish, S.; Tambe, P. Surfactant Assisted Exfoliation of High Purity Graphene in Aqueous Solution as a Nanofluid Using Kitchen Blender: Influence on Dispersion, Thermal Conductivity and Rheological Properties. Adv. Powder Technol. 2022, 33, 103767. [Google Scholar] [CrossRef]
  31. Narayan, R.; Kim, S.O. Surfactant Mediated Liquid Phase Exfoliation of Graphene. Nano Converg. 2015, 2, 20. [Google Scholar] [CrossRef]
  32. Griffin, A.; Nisi, K.; Pepper, J.; Harvey, A.; Szydłowska, B.M.; Coleman, J.N.; Backes, C. Effect of Surfactant Choice and Concentration on the Dimensions and Yield of Liquid-Phase-Exfoliated Nanosheets. Chem. Mater. 2020, 32, 2852–2862. [Google Scholar] [CrossRef]
  33. Zhou, Y.; Bao, Q.; Tang, L.A.L.; Zhong, Y.; Loh, K.P. Hydrothermal Dehydration for the “Green” Reduction of Exfoliated Graphene Oxide to Graphene and Demonstration of Tunable Optical Limiting Properties. Chem. Mater. 2009, 21, 2950–2956. [Google Scholar] [CrossRef]
  34. Lai, Q.; Zhu, S.; Luo, X.; Zou, M.; Huang, S. Ultraviolet-Visible Spectroscopy of Graphene Oxides. AIP Adv. 2012, 2, 032146. [Google Scholar] [CrossRef]
  35. Baggio, A.R.; Santos, M.S.C.; Souza, F.H.V.; Nunes, R.B.; Souza, P.E.N.; Báo, S.N.; Patrocinio, A.O.T.; Bahnemann, D.W.; Silva, L.P.; Sales, M.J.A.; et al. Quenching Effects of Graphene Oxides on the Fluorescence Emission and Reactive Oxygen Species Generation of Chloroaluminum Phthalocyanine. J. Phys. Chem. A 2018, 122, 6842–6851. [Google Scholar] [CrossRef] [PubMed]
  36. Kumar, V.; Kumar, A.; Lee, D.-J.; Park, S.-S. Estimation of Number of Graphene Layers Using Different Methods: A Focused Review. Materials 2021, 14, 4590. [Google Scholar] [CrossRef]
  37. Graphite Electrodes for Spectral Analysis. Available online: https://www.shj-carbon.com/high-purity-graphite/spectral-analysis-graphite-electrode.html (accessed on 18 August 2025).
  38. Kumar, V.; Alam, N.; Lee, D.-J.; Giese, U. Role of low surface area few layer graphene in enhancing mechanical properties of poly (1,4-cis-isoprene) rubber nanocomposites. Rubber Chem. Technol. 2020, 93, 172–182. [Google Scholar] [CrossRef]
  39. Galimberti, M.; Kumar, V.; Coombs, M.; Cipolletti, V.; Agnelli, S.; Pandini, S.; Conzatti, L. Filler networking of a nanographite with a high shape anisotropy and synergism with carbon black in poly(1,4-cis-isoprene)–based nanocomposites. Rubber Chem. Technol. 2014, 87, 197–218. [Google Scholar] [CrossRef]
  40. Mauro, M.; Cipolletti, V.; Galimberti, M.; Longo, P.; Guerra, G. Chemically Reduced Graphite Oxide with Improved Shape Anisotropy. J. Phys. Chem. C 2012, 116, 24809–24813. [Google Scholar] [CrossRef]
  41. Backes, C.; Paton, K.R.; Hanlon, D.; Yuan, S.; Katsnelson, M.I.; Houston, J.; Smith, R.J.; McCloskey, D.; Donegan, J.F.; Coleman, J.N. Spectroscopic Metrics Allow in Situ Measurement of Mean Size and Thickness of Liquid-Exfoliated Few-Layer Graphene Nanosheets. Nanoscale 2016, 8, 4311–4323. [Google Scholar] [CrossRef] [PubMed]
  42. Luo, Z.; Lu, Y.; Somers, L.A.; Johnson, A.T.C. High Yield Preparation of Macroscopic Graphene Oxide Membranes. J. Am. Chem. Soc. 2009, 131, 898–899. [Google Scholar] [CrossRef]
  43. Tene, T.; Guevara, M.; Benalcázar Palacios, F.; Morocho Barrionuevo, T.P.; Vacacela Gomez, C.; Bellucci, S. Optical Properties of Graphene Oxide. Front. Chem. 2023, 11, 1214072. [Google Scholar] [CrossRef]
  44. Xia, Z.; Bellani, V.; Sun, J.; Palermo, V. Electrochemical Exfoliation of Graphite in H2SO4, Li2SO4 and NaClO4 Solutions Monitored in Situ by Raman Microscopy and Spectroscopy. Faraday Discuss. 2021, 227, 291–305. [Google Scholar] [CrossRef] [PubMed]
  45. Zhang, Y.; Xu, Y.; Liu, R.; Niu, Y. Synthesis of High-Quality Graphene by Electrochemical Anodic and Cathodic Co-Exfoliation Method. Chem. Eng. J. 2023, 461, 141985. [Google Scholar] [CrossRef]
  46. Redox Tech. Persulfate. Available online: https://www.redox-tech.com/persulfate (accessed on 18 August 2025).
  47. Han, J.; Xin, J.; Zheng, X.; Kolditz, O.; Shao, H. Remediation of Trichloroethylene-Contaminated Groundwater by Three Modifier-Coated Microscale Zero-Valent Iron. Environ. Sci. Pollut. Res. 2016, 23, 14442–14450. [Google Scholar] [CrossRef]
  48. Alexander, C.M.; Goodisman, J. Size Histograms of Gold Nanoparticles Measured by Gravitational Sedimentation. J. Colloid Interface Sci. 2014, 418, 103–112. [Google Scholar] [CrossRef]
  49. Shi, G.; Michelmore, A.; Jin, J.; Li, L.H.; Chen, Y.; Wang, L.; Yu, H.; Wallace, G.; Gambhir, S.; Zhu, S.; et al. Advancement in Liquid Exfoliation of Graphite through Simultaneously Oxidizing and Ultrasonicating. J. Mater. Chem. A 2014, 2, 20382–20392. [Google Scholar] [CrossRef]
  50. Lee, J.-K.; Lee, S.; Kim, Y.-I.; Kim, J.-G.; Min, B.-K.; Lee, K.-I.; Park, Y.; John, P. The Seeded Growth of Graphene. Sci. Rep. 2014, 4, 5682. [Google Scholar] [CrossRef] [PubMed]
  51. Meyer, J.C.; Geim, A.K.; Katsnelson, M.I.; Novoselov, K.S.; Obergfell, D.; Roth, S.; Girit, C.; Zettl, A. On the Roughness of Single- and Bi-Layer Graphene Membranes. Solid State Commun. 2007, 143, 101–109. [Google Scholar] [CrossRef]
  52. Li, C.; Zhang, X.; Wang, K.; Sun, X.; Liu, G.; Li, J.; Tian, H.; Li, J.; Ma, Y. Scalable Self-Propagating High-Temperature Synthesis of Graphene for Supercapacitors with Superior Power Density and Cyclic Stability. Adv. Mater. 2017, 29, 1604690. [Google Scholar] [CrossRef] [PubMed]
  53. Geng, J.; Kong, B.-S.; Yang, S.B.; Jung, H.-T. Preparation of Graphene Relying on Porphyrin Exfoliation of Graphite. Chem. Commun. 2010, 46, 5091. [Google Scholar] [CrossRef] [PubMed]
  54. Meyer, J.C.; Geim, A.K.; Katsnelson, M.I.; Novoselov, K.S.; Booth, T.J.; Roth, S. The Structure of Suspended Graphene Sheets. Nature 2007, 446, 60–63. [Google Scholar] [CrossRef]
  55. Sigwadi, R.; Dhlamini, M.S.; Mokrani, T.; Ṋemavhola, F.; Nonjola, P.F.; Msomi, P.F. The Proton Conductivity and Mechanical Properties of Nafion®/ ZrP Nanocomposite Membrane. Heliyon 2019, 5, e02240. [Google Scholar] [CrossRef]
  56. Xu, G.; Wei, Z.; Li, S.; Li, J.; Yang, Z.; Grigoriev, S.A. In-Situ Sulfonation of Targeted Silica-Filled Nafion for High-Temperature PEM Fuel Cell Application. Int. J. Hydrogen Energy 2019, 44, 29711–29716. [Google Scholar] [CrossRef]
  57. Li, K.; Ye, G.; Pan, J.; Zhang, H.; Pan, M. Self-Assembled Nafion®/Metal Oxide Nanoparticles Hybrid Proton Exchange Membranes. J. Membr. Sci. 2010, 347, 26–31. [Google Scholar] [CrossRef]
  58. Kim, H.J.; Talukdar, K.; Choi, S.-J. Tuning of Nafion® by HKUST-1 as Coordination Network to Enhance Proton Conductivity for Fuel Cell Applications. J. Nanopart. Res. 2016, 18, 47. [Google Scholar] [CrossRef]
  59. Wang, X.; Zhang, L. Green and Facile Production of High-Quality Graphene from Graphite by the Combination of Hydroxyl Radicals and Electrical Exfoliation in Different Electrolyte Systems. RSC Adv. 2019, 9, 3693–3703. [Google Scholar] [CrossRef]
  60. Karakoti, M.; Jangra, R.; Pandey, S.; Dhapola, P.S.; Dhali, S.; Mahendia, S.; Singh, P.K.; Sahoo, N.G. Binder-Free Reduced Graphene Oxide as Electrode Material for Efficient Supercapacitor with Aqueous and Polymer Electrolytes. High Perform. Polym. 2020, 32, 175–182. [Google Scholar] [CrossRef]
  61. Sadek, R.; Sharawi, M.S.; Dubois, C.; Tantawy, H.; Chaouki, J. Superior Quality Chemically Reduced Graphene Oxide for High Performance EMI Shielding Materials. RSC Adv. 2022, 12, 22608–22622. [Google Scholar] [CrossRef] [PubMed]
  62. Wang, Y.-X.; Huang, L.; Sun, L.-C.; Xie, S.-Y.; Xu, G.-L.; Chen, S.-R.; Xu, Y.-F.; Li, J.-T.; Chou, S.-L.; Dou, S.-X.; et al. Facile Synthesis of a Interleaved Expanded Graphite-Embedded Sulphur Nanocomposite as Cathode of Li–S Batteries with Excellent Lithium Storage Performance. J. Mater. Chem. 2012, 22, 4744. [Google Scholar] [CrossRef]
  63. Vittore, A.; Acocella, M.R.; Guerra, G. Graphite Functionalization by Ball Milling with Sulfur. SN Appl. Sci. 2019, 1, 169. [Google Scholar] [CrossRef]
  64. Li, C.; Chen, X.; Shen, L.; Bao, N. Revisiting the Oxidation of Graphite: Reaction Mechanism, Chemical Stability, and Structure Self-Regulation. ACS Omega 2020, 5, 3397–3404. [Google Scholar] [CrossRef] [PubMed]
  65. Jeon, Y.; Hwang, H.; Park, J.; Hwang, H.; Shul, Y.-G. Temperature-Dependent Performance of the Polymer Electrolyte Membrane Fuel Cell Using Short-Side-Chain Perfluorosulfonic Acid Ionomer. Int. J. Hydrogen Energy 2014, 39, 11690–11699. [Google Scholar] [CrossRef]
  66. Likhomanov, V.S.; Primachenko, O.N.; Ivanchev, S.S. Thermodynamic Properties of Water in Perfluorinated Membranes of Nafion and Aquivion Types, Prepared by Emulsion Polymerization. Russ. J. Appl. Chem. 2014, 87, 1314–1318. [Google Scholar] [CrossRef]
  67. Park, H.; Kim, Y.; Hong, W.H.; Choi, Y.S.; Lee, H. Influence of Morphology on the Transport Properties of Perfluorosulfonate Ionomers/Polypyrrole Composite Membrane. Macromolecules 2005, 38, 2289–2295. [Google Scholar] [CrossRef]
  68. Düngen, P.; Schlögl, R.; Heumann, S. Non-Linear Thermogravimetric Mass Spectrometry of Carbon Materials Providing Direct Speciation Separation of Oxygen Functional Groups. Carbon 2018, 130, 614–622. [Google Scholar] [CrossRef]
  69. Friedel Ortega, K.; Arrigo, R.; Frank, B.; Schlögl, R.; Trunschke, A. Acid–Base Properties of N-Doped Carbon Nanotubes: A Combined Temperature-Programmed Desorption, X-Ray Photoelectron Spectroscopy, and 2-Propanol Reaction Investigation. Chem. Mater. 2016, 28, 6826–6839. [Google Scholar] [CrossRef]
  70. Fantauzzi, M.; Elsener, B.; Atzei, D.; Rigoldi, A.; Rossi, A. Exploiting XPS for the Identification of Sulfides and Polysulfides. RSC Adv. 2015, 5, 75953–75963. [Google Scholar] [CrossRef]
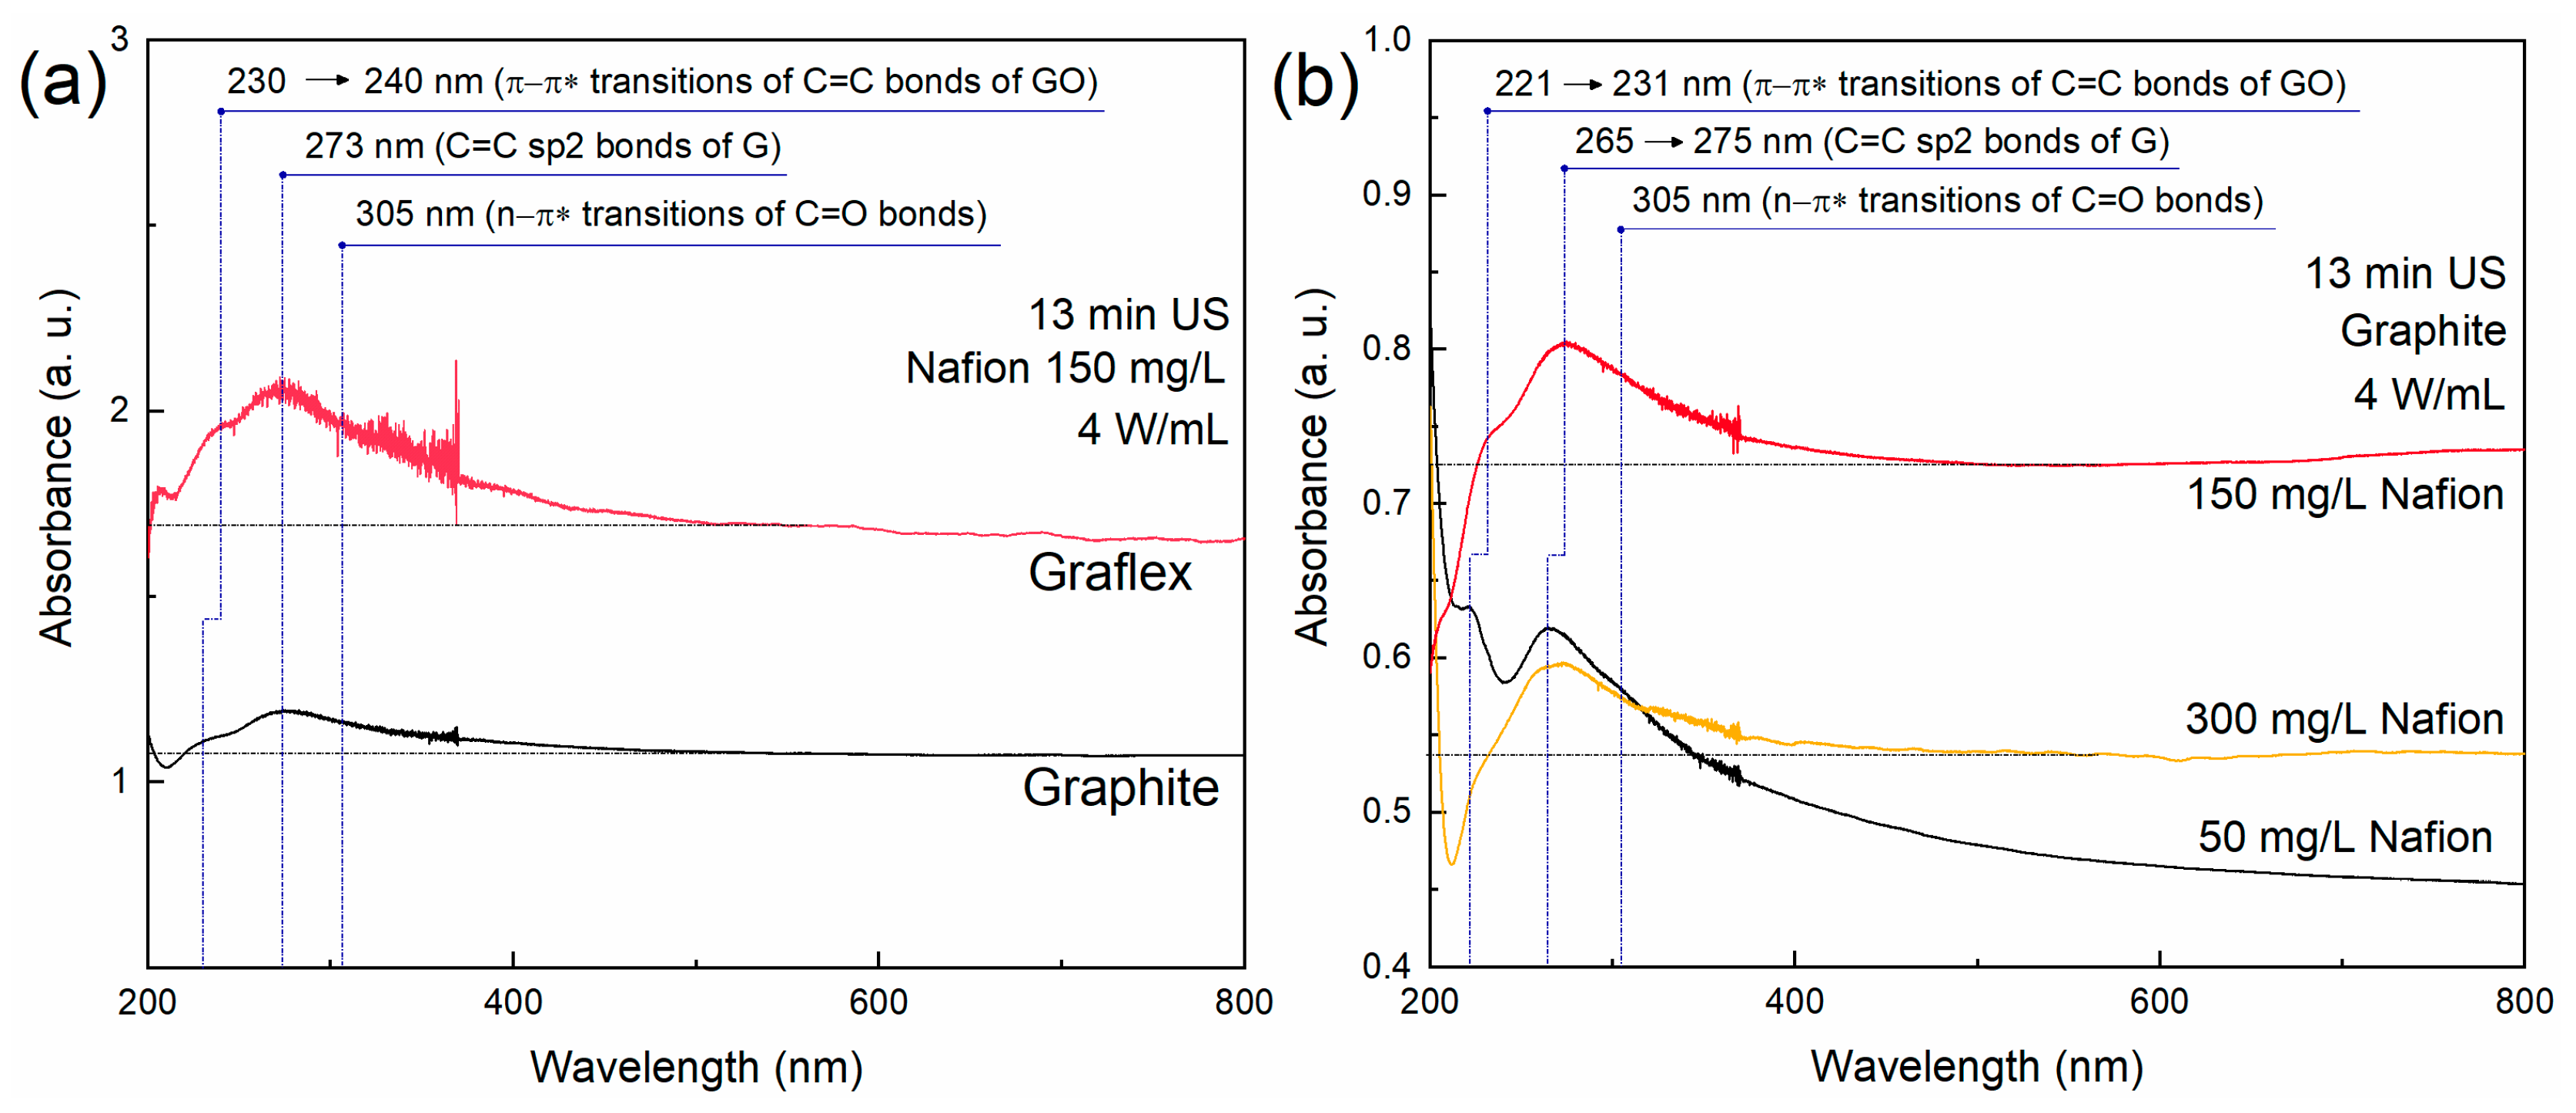
Figure 1. UV-Vis absorption spectra of (a) spectral graphite and Graflex dispersions obtained under identical surfactant concentration, sonication time, and US power; (b) dispersions prepared using different concentrations of Nafion.
Carbon 11 00076 g001
Figure 2. (a) UV-Vis absorption spectra of spectral graphite dispersions with the addition of 150 mg/L Nafion at different sonication times (0–45 min); (b) changes in dispersion sedimentation curves with increasing sonication time.
Carbon 11 00076 g002
Figure 3. CVs of the initial graphite electrode, 3 cycles; 0.5 M H2SO4; scan rate v = 50 mV/s; T = 25 °C; in equilibrium with air. Polarization direction is shown with dashed arrows. Inset: enlarged cathodic peak; dependence of sulfo group deintercalation peak current on scan rate.
Carbon 11 00076 g003
Figure 4. CVs of the initial graphite electrode; 0.5 M H2SO4; scan rate v = 50 mV/s; T = 25 °C; in equilibrium with air. Polarization direction is shown with dashed arrows. Inset: current of sulfate ion deintercalation as a function of potentiostatic time at 3 V.
Carbon 11 00076 g004
Figure 5. UV-Vis absorption spectra of various dispersions obtained from two types of carbon materials (spectral graphite, Graflex) by electrochemical exfoliation; reference solution: 0.5 M H2SO4.
Carbon 11 00076 g005
Figure 6. Absorption spectra of the dispersion of the sample obtained during mild (18 W/L) US treatment; the arrow indicates the direction of sonication time increasing; carbon material concentration 0.38 g/L.
Carbon 11 00076 g006
Figure 7. Normalized absorption spectra (a) and normalized sedimentation curves (A/A0) (b) of dispersions obtained through various techniques.
Carbon 11 00076 g007
Figure 8. TEM images and ED patterns of Graphite US (ad), Graphite EE (eh), Graflex US (il), and Graflex EE (mp).
Carbon 11 00076 g008
Figure 9. XRD patterns of pristine graphite, pristine Nafion, and samples obtained using graphite as a precursor. The red arrow defines the area of the zoomed section (002, dynamics of the increase in peak width).
Carbon 11 00076 g009
Figure 10. XRD patterns of pristine Graflex and samples obtained using Graflex as a precursor. The red arrow defines the area of the zoomed section (002, dynamics of the increase in peak width).
Carbon 11 00076 g010
Figure 11. XRD patterns (hkl plane (100)) of the various samples. Peak identification was performed using the reference pattern [96-900-8570].
Carbon 11 00076 g011
Figure 12. Particle size distribution curves for dispersions prepared using different methods: (a) volume-based distribution, (b) number-based distribution.
Carbon 11 00076 g012
Figure 13. Derivatograms of samples obtained in different modes of electrochemical exfoliation. Heating rate: 10 K/min; air.
Carbon 11 00076 g013
Figure 14. Derivatograms of initial and derived materials: (a) graphite precursor and materials synthesized from it; (b) Graflex precursor and materials synthesized from it. Heating rate: 10 K/min; air.
Carbon 11 00076 g014
Figure 15. XPS survey spectra of the synthesized samples.
Carbon 11 00076 g015
Figure 16. C1s (a) and O1s (b) XPS spectra of the prepared samples.
Carbon 11 00076 g016
Figure 17. S2p (a) and F1s (b) XPS spectra of the prepared samples.
Carbon 11 00076 g017
Table 1. Samples obtained by liquid exfoliation using high-power US with and without the addition of surfactants.
SamplePrecursorС (Surfactant), mg/LSonication Time, min
Graphite US 0 mg/LSpectral graphite013
Graphite US 50 mg/LSpectral graphite5013
Graphite US 150 mg/LSpectral graphite15013
Graphite US 300 mg/LSpectral graphite30013
Graphite US 0 minSpectral graphite1500
Graphite US 13 minSpectral graphite15013
Graphite US 25 minSpectral graphite15025
Graphite US 45 minSpectral graphite15045
Graflex US 13 minGraflex15013
Table 2. The average number of layers in a graphene stack for materials after sonication, calculated using an empirical formula.
SampleA550Amax (270)N
Graphite US 0 mg/L1.0341.116>11
Graphite US 150 mg/L0.6220.710>11
Graphite US 300 mg/L0.5380.597>11
Graphite US 13 min0.7240.804>11
Graphite US 25 min0.9431.068>11
Graphite US 45 min1.7062.02310
Graflex US 13 min1.6902.05510
Graphite US 13 min (replicate)1.0771.192>11
Table 3. Selected data obtained from the sedimentation analysis of the investigated dispersions.
SampleSonication Time, minτ1/2, sA54000/A0
Graphite US 0 min013900.13
Graphite US 13 min1369000.68
Graphite US 25 min2510,7000.73
Graphite US 45 min4577000.76
Table 4. Samples obtained by ultrasound-assisted liquid-phase exfoliation, with a precursor mass of 755 mg, at a power density of 2.4 W/mL and sonication time of 45 min.
SampleCompositionС (Surfactant), mg/LProduct Yield
Carbon MaterialSurfactant
Graphite USSpectral graphiteNafion1000.83
Graflex USGraflexNafion100(1.28) associated with partial exfoliation of the auxiliary electrode
Graphite US w/o surfactantSpectral graphite-00.82
Table 5. Samples obtained by electrochemical exfoliation.
SampleCompositionModeProduct YieldChargeSpecific Charge, C/g
Carbon MaterialNafion, mg/L
EE-1Spectral graphite100pulse +3 V, −1.5 V, 30 s0.78+3 V: 9010 C
−1.5 V: 3310 C
24,641
EE-2Spectral graphite100potentiostatic +3 V0.97+3 V: 8493 C11,634
EE-3Spectral graphite0pulse +3 V, −1.5 V, 30 s0.53+3 V: 13,285 C
−1.5 V: 4953 C
45,644
EE-4Graflex100pulse +3 V, −1.5 V, 30 s0.35+3 V: 27,887 C
−1.5 V: 13,465 C
143,340
Table 6. Samples obtained using a two-step procedure: (1) electrochemical exfoliation, and (2) liquid-phase exfoliation (18 W/L).
SampleComposition, %wtС (Nafion), mg/LN (UV-Vis)
Carbon MaterialSurfactant (Nafion)
Graphite EE80 (EE-1)2020007
Graflex EE80 (EE-4)9
Table 7. The average number of layers in a graphene stack, calculated using an empirical formula.
SampleA550Amax (270)N
Graphite US0.9101.06610
Graflex US1.3371.477>11
Graphite US w/o surfactant0.4590.483>11
Graphite EE1.5052.2898
Graphite EE (replicate)0.8211.3487
Graflex EE1.3411.8949
Table 8. Selected data from the analysis of sedimentation curves of the studied dispersions.
SampleC Carbon, g/Lτ1/2, sA54000/A0
EE-1155340.0302
EE-215720.0675
EE-3155040.0253
EE-415170-
Graphite EE0.24>54,0000.905
Graphite US3.8>54,0000.720
Graflex US0.3846,2000.488
Graphite US w/o surfactant15190.0131
Graflex EE0.24>54,0000.949
Table 9. XRD analysis data of carbon materials.
SamplePosition (hkl), 2θAverage CSR Size (hkl), ÅFWHM (hkl), 2θd (002), ÅNumber of LayersGAS
(002)(100)(002)(100)(002)(100) N = Lc/d(002) A = La/Lc
Graphite pristine26.50442.393308.480270.1000.2760.3293.36091.80.9270.876
EE-126.47442.439169.700264.1900.4870.3423.36450.40.8831.557
EE-1 (replicate)26.48742.462168.300249.0000.5100.3583.36350.10.9001.480
Graphite US26.46342.405378.913259.1400.2250.3433.365112.60.8670.684
Graphite EE26.448-149.71117.7330.5705.0403.36744.50.8450.118
Graflex pristine26.500-220.833-0.386-3.36165.70.921-
Graflex US26.47142.486169.922266.1300.5020.3333.36450.50.8791.566
Graflex EE26.468-103.344-0.825-3.36530.70.874-
Table 10. Characteristics of particle size distribution peaks.
SampleMax,
nm
Particle Fraction, %Size Range,
nm
FWHM,
nm
ζ-Potential,
mV
Graphite EE (1st peak)911359–1106198−35
Graphite EE (2nd peak)
Graphite US25517106–712195−28.1
Graphite US w/o surfactant5560182669–10,0004180−5.9
Graflex EE (1st peak)128121712–2305755-
Graflex EE (2nd peak)745654801–10,0003050
Graflex US4801343091–64391959−27.2
Table 11. Relative atomic concentrations of elements and their ratios in the analyzed samples, determined from XPS survey spectra.
Sample Atomic % (XPS Survey Spectrum) Ratios
C1s F1s O1s S2p C1s/O1s
(Carbon Material)
F1s/S2p
Graphite US71.4024.193.900.5137.4847.43
Graflex US94.862.682.320.1545.3117.87
Graphite EE61.1731.007.160.6711.2246.27
Graflex EE75.2717.037.270.4311.9739.60
Nafion28.1464.256.051.55-41.45
Table 12. Functional composition of the samples obtained from the deconvolution C1s spectra shown in Figure 16a. Values are given in at %.
SampleC=CC–C–CF2–CF3O–C–FC–O–CO–C=Osp2/sp3C/O
Graphite US59.910.313.42.02.78.43.45.813.38
Graflex US69.011.74.61.33.35.84.45.935.56
Graphite EE54.57.915.54.04.69.14.56.95.50
Graflex EE63.59.89.52.02.97.35.06.57.82
Nafion012.867.714.305.20--
Table 13. Summary of structural and process parameters of graphene prepared via ultrasonic and electrochemical routes.
SampleGraphite USGraflex USGraphite EEGraflex EE
Number of graphene layers (XRD data)~100~50~45~30
Number of graphene layers (TEM data)1001–2151–2
Lateral size (DLS and TEM data), nm100–300>1000100–300>1000
C/O (C1s XPS spectra)13.3835.565.507.82
Product yield, %98987633
Time of synthesis, min 4545500 + 1800528 + 1800
Energy input, kWh0.750.750.012 + 3.90.034 + 3.9
Disclaimer/Publisher’s Note: The statements, opinions and data contained in all publications are solely those of the individual author(s) and contributor(s) and not of MDPI and/or the editor(s). MDPI and/or the editor(s) disclaim responsibility for any injury to people or property resulting from any ideas, methods, instructions or products referred to in the content.