Article

Industrial Off-Gas Fermentation for Acetic Acid Production: A Carbon Footprint Assessment in the Context of Energy Transition

by
Marta Pacheco
1,2,
Adrien Brac de la Perrière
3,
Patrícia Moura
1 and
Carla Silva
2,*
1
Laboratório Nacional de Energia e Geologia, Unidade de Bioenergia e Biorrefinarias, 1649-038 Lisboa, Portugal
2
Instituto Dom Luiz, Faculdade de Ciências, Universidade de Lisboa, 1749-016 Lisboa, Portugal
3
Department of Process Engineering, Toulouse INP-ENSIACET Graduate Engineering School, 31030 Cedex 4 Toulouse, France
*
Author to whom correspondence should be addressed.
Submission received: 1 June 2025 / Revised: 14 July 2025 / Accepted: 17 July 2025 / Published: 23 July 2025
(This article belongs to the Section Carbon Cycle, Capture and Storage)

Abstract

Most industrial processes depend on heat, electricity, demineralized water, and chemical inputs, which themselves are produced through energy- and resource-intensive industrial activities. In this work, acetic acid (AA) production from syngas (CO, CO2, and H2) fermentation is explored and compared against a thermochemical fossil benchmark and other thermochemical/biological processes across four main Key Performance Indicators (KPI)—electricity use, heat use, water consumption, and carbon footprint (CF)—for the years 2023 and 2050 in Portugal and France. CF was evaluated through transparent and public inventories for all the processes involved in chemical production and utilities. Spreadsheet-traceable matrices for hotspot identification were also developed. The fossil benchmark, with all the necessary cascade processes, was 0.64 kg CO2-eq/kg AA, 1.53 kWh/kg AA, 22.02 MJ/kg AA, and 1.62 L water/kg AA for the Portuguese 2023 energy mix, with a reduction of 162% of the CO2-eq in the 2050 energy transition context. The results demonstrated that industrial practices would benefit greatly from the transition from fossil to renewable energy and from more sustainable chemical sources. For carbon-intensive sectors like steel or cement, the acetogenic syngas fermentation appears as a scalable bridge technology, converting the flue gas waste stream into marketable products and accelerating the transition towards a circular economy.

Graphical Abstract

1. Introduction

The global demand for acetic acid (CH3COOH, CAS 64-19-7) has been steadily increasing over the past years, from ~14 million tons in 2015 to ~18 million tons in 2022. This growth was driven not only by a rising demand for paints, adhesives, and coatings in end-use industries, but also by an increasing demand for food additives and preservatives in the expanding food and beverage sector, as well as its growing use in pharmaceutical and chemical applications. Moreover, acetic acid is a versatile and essential chemical in many other industries. For example, in the textile industry, acetic acid contributes to various stages of fabric production by enhancing the final quality and performance [1,2,3,4]. In the energy sector, it can be used to produce lipids through yeast fermentation, which can subsequently be converted into jet fuel and/or maritime fuels [5,6,7,8].
The production of acetic acid is primarily dominated by the People’s Republic of China and the United States of America (USA). In 2020, Asia led the global acetic acid demand, consuming 68%, followed by North America at 16%, with Russia accounting for a distant third place at 2% [2]. Acetic acid production predominantly relies on thermochemical processes, with methanol serving as the primary raw material. Equations (1)–(5) are the main chemical reactions present in methanol synthesis and carbonylation to acetic acid pathways:
Methanol synthesis
C H 4 + H 2 O C O + 3   H 2
C H 4 + 3 H 2 O C O 2 + 4   H 2
C O 2 + 3 H 2 C H 3 O H + H 2 O
C O + 2 H 2 C H 3 O H
Methanol carbonylation
C H 3 O H + C O C H 3 C O O H
Industrially, methanol is typically produced through natural gas steam reforming, followed by chemical synthesis (Equations (1)–(4)). Alternative methods for methanol production include coal or biomass gasification, followed by chemical synthesis from syngas, as well as e-methanol, generated using hydrogen from electrolysis, and CO2, captured through carbon capture technologies. Besides serving as the basis for the production of different chemicals, e-methanol is currently being explored as an alternative maritime transportation fuel and a substitute road transportation fuel and is classified as a renewable fuel of non-biological origin [9,10]. This resulted in competition regarding e-methanol, which may boost alternative processes of acetic acid production that are non-methanol-dependent, such as syngas fermentation, as summarized in Figure 1.
Methanol carbonylation is the leading acetic acid production method, with approximately five times more patents than fermentation-based processes [14], and has evolved over time, with the Cativa™ Iridium Catalyst replacing the earlier Monsanto Rhodium Catalyst process [15]. The dependence of such production methods on methanol is substantial; in 2021, acetic acid production consumed 7.89 million tons of methanol [16], reflecting the established infrastructure, efficiency, and cost-effectiveness of thermochemical processes for large-scale acetic acid production [17]. Recently, BP (British Petroleum) developed a proprietary process called SaaBre™, which provides an innovative methanol-free route for producing acetic acid directly from syngas. This technology emerges as a direct competitor to syngas fermentation. However, given the growing global demand for acetic acid and the need for diversified production methods, both processes will likely coexist in the market.
Long-term climate strategies to mitigate climate change focus on reducing greenhouse gas (GHG) emissions, particularly CO2. Decarbonization efforts aim to eliminate fossil fuel consumption in industrial processes, enabling a transition to sustainable chemical production. In this context, the acetic acid production process must adapt by utilizing carbon from waste gases generated by carbon-intensive industries or through integrated carbon capture technologies, rather than relying on fossil fuel feedstocks. Furthermore, the production process must follow circular standards and be thoroughly assessed along the value chain to determine the actual impacts of the selected technologies.
An environmental life cycle assessment (e-LCA), conducted in accordance with ISO 14040/44 standards [18,19], is a well-established methodology that provides a comprehensive understanding of the environmental impacts associated with chemical production. e-LCA encompasses the entire lifecycle of a chemical, from cradle to gate (i.e., from feedstock extraction to the factory exit). Among the environmental impact studies, characterization of the carbon footprint, as specified by ISO 14067 [20], is the most common determiner and will also be the focus of this research.
The fossil benchmark for acetic acid production, using methanol and carbon monoxide derived from natural gas reforming, is estimated to be 1 kg CO2-eq/kg AA (99.8% purity) based on a cradle-to-gate analysis conducted in the USA in 2012 [21]. When transportation is included, the cradle-to-gate emissions in the same region increase to 1.2 kg CO2-eq/kg AA [22]. Another study for the USA reports cradle-to-gate emissions of 2.84 tons CO2-eq/ton AA [23]. Proprietary databases such as Ecoinvent 3.4 (2017) provide varying values, reporting emissions of 1.3921 to 1.8746 kg CO2-eq/kg AA [24]. Furthermore, when using databases like Ecoinvent or commercially available inventories from the U.S. LCI database [25], significant variations in the gate-to-gate emissions of acetic acid production have been observed, primarily due to differences in direct CO2 and CH4 emissions data. This variation highlights discrepancies related to the chosen inventory database [26,27].
Alternative production methods have also been compared to the fossil benchmark:
(I) Dry reforming of biogas requiring high temperatures (>900 °C), with reported emissions of 2 kg CO2-eq/kg AA in the USA [28].
(II) Fermentation of sugars, primarily for food applications such as vinegar production. European studies on this fermentation process, using corn stover as a feedstock to produce acetic acid (15 wt.%, aqueous solution), report emissions ranging from 0 to 5 kg CO2-eq/kg AA [29].
(III) Microbial electrosynthesis (MES), as a reference to assess a novel process for acetic acid production. A study from the United Kingdom used benchmark data for fossil-based acetic acid production and estimated rates of 1.3 kg CO2-eq/kg AA [30].
Given yearly variations, boundary or allocation assumptions, database differences, and inventory availability, these studies cannot be directly compared. Therefore, a comprehensive benchmark for European countries must be developed, with a particular focus on case studies for Portugal and France. Additionally, publicly available and transparent inventory data for chemicals remain scarce, and company claims regarding carbon footprints often lack transparency. For example, the assertion that “LENZING™ Acetic Acid Biobased has a reduced carbon footprint that is 85% lower than that of fossil-based acetic acid” is not supported by credible scientific evidence, highlighting a significant shortcoming [31].
This research aims to develop a transparent inventory for both fossil-based acetic acid production and alternative production pathways, such as methanol carbonylation with methanol produced from refuse waste gasification and reforming, microbial electrosynthesis, CO2 + H2 fermentation using thermophilic acetogenic bacteria, and acetogenic syngas fermentation (results obtained from own experiments). This last process relies on the acetogenic bacteria Butyribacterium methylotrophicum (Eubacterium callanderi) to perform biological carbon capture while resisting flue gas and syngas impurities [32,33]. This study addresses discrepancies in carbon footprints across various production processes while examining the potential impact of a fully decarbonized electricity grid on future carbon emissions, with a specific focus on Portugal and France. Furthermore, it explores the burden of utilities (energy, heat and water) in each of the analyzed processes, to find the most favorable for implementation in an industrial setting, i.e., using the CO2 of a cement plant to produce acetic acid.

2. Materials and Methods

The goal and scope of this study was to evaluate the carbon footprint (CF) of acetic acid produced via several biochemical and thermochemical pathways. The system boundaries were defined as cradle-to-gate. While infrastructure construction materials are excluded, energy-related emission factors primarily consider direct emissions from combustion, aligning with the EU ETS benchmarks. All indirect emissions from chemicals and water were included. All direct energy production emissions were also accounted for.
The declared unit (DU) was 1 kg of acetic acid, while the functional unit (FU) represented the yearly feasible amount of high-purity acetic acid, constrained by the availability of cement CO2 and biomethane. Transportation and gray materials were considered out of scope.
Data were categorized as foreground or background and as belonging to either the technosphere or ecosphere [34]. Process schematics can be found in Section S1 of the Supplementary Materials. The impact assessment focused on the Global Warming Potential (GWP) over a 100-year timeframe, using IPCC AR5 as the basis for determining the CF [35]. The CF was defined as the sum of the CO2-eq emissions from purchased energy (electricity or heat) consumed throughout the unitary process chain j, and the direct CO2-eq emissions released into the atmosphere during each process, as expressed in Equation (6):
C F = j n E l e c t r i c i t y j × E F E l e c t r i c i t y + H e a t j E F H e a t + A i r   C O 2 e q j
where n is the number of unitary processes for each thermochemical or biological pathway; EF is the emission factor for heat and electricity and depends on the analyzed country (location-based method); air CO2-eq is based on the carbon related emissions of the unitary process, be it direct, fossil or biogenic. According to IPCC AR5, biogenic CO2 is not accounted for, but fossil/biogenic CH4 has a CO2 equivalency of 28 and N2O has a CO2 equivalency of 265 [35]. GHG savings refers to the comparison of the analyzed processes with the fossil industrial benchmark.

2.1. Foreground Inventory for Methanol Carbonylation Thermochemical Process

In this work, methanol carbonylation was one of the base processes evaluated as the production method adopted by industry, being primarily dependent on fossil inputs. The fossil methanol carbonylation inventory, based on Equation (5), was retrieved from the literature [25] and is presented in Table 1.
Methanol for this process can be produced from natural gas reforming or from refuse-derived waste gasification [36]. As part of a chemical input, its production is part of the background inventories of this main process and can be found in Section 2.4 and in Section S2 of the Supplementary Materials.

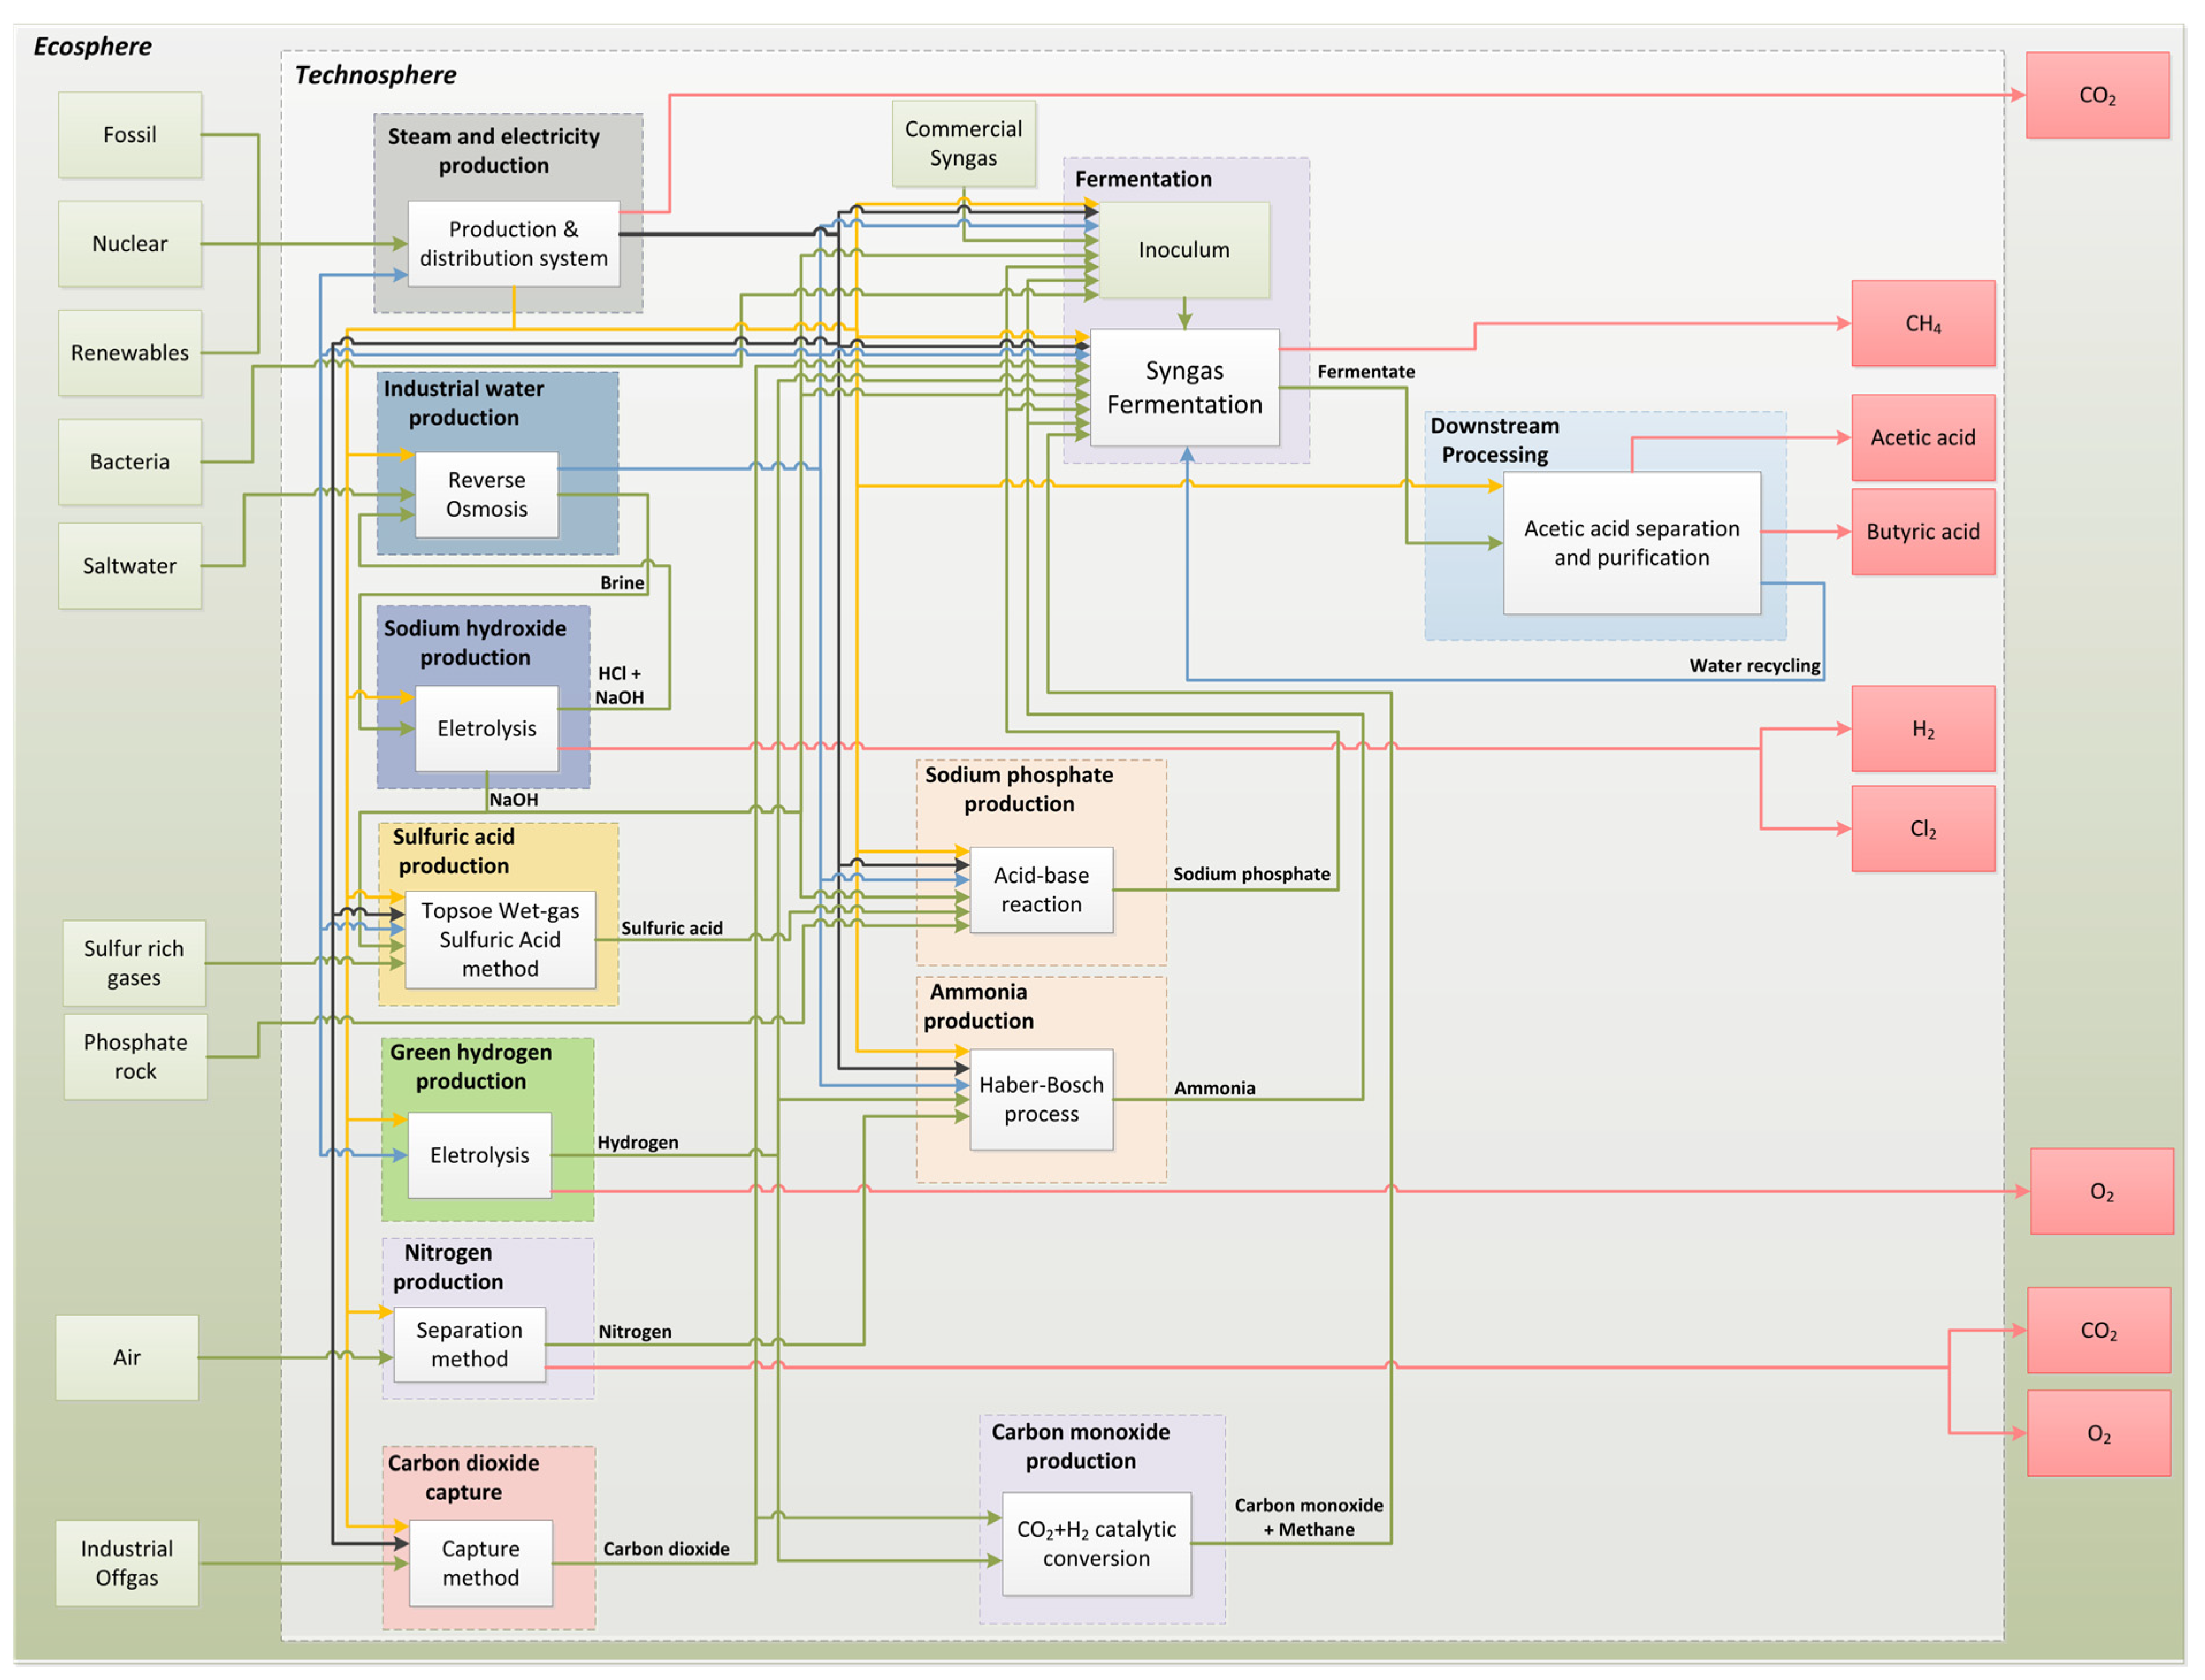
2.2. Foreground Inventory for Acetogenic Syngas Fermentation

The production of acetic acid through syngas fermentation, be it from the gasification of biomass, from industrial off-gases supplemented with green hydrogen, or from both, can provide an alternative to methanol carbonylation. Figure 2 shows a schematic representation of the process, with the possible inputs, outputs, and utility flows.
In order to better evaluate the necessary inputs and outputs of an acetic acid production process based on the biological fermentation of syngas, a lab-scale bioreactor assay was performed, and all the mass balances were calculated. The bacterial cells used for this study were Butyribacterium methylotrophicum, recently renamed Eubacterium callanderi, strain Marburg (DSM 3468, DSMZ, Braunschweig, Germany), a carboxydotrophic acetogenic bacteria that uses CO and CO2 + H2 as carbon and energy sources, producing mainly acetic and butyric acids as fermentation products [32,33,37]. The microorganism was grown in a 2050 mL air-tight glass bioreactor with pH control and all the inlets and outlets necessary for sampling, pH correction, and syngas feeding. The operating volume was 800 mL of Syn1 culture medium [33,37], and the cells were grown at pH 7.0 and 37 °C, with an agitation of 150 rpm, for approximately 290 h. To better simulate an industrial syngas fermentation process, synthetic syngas with the same composition as the syngas obtained from the gasification of lignin was used: 31.9 vol.% H2, 29.0 vol.% CO, 23.0 vol.% CO2, and 16.0 vol.% CH4 [33]. The bioreactor assemblage was performed as described in Pacheco et al., 2021 [33]; however, in this assay, a peristaltic pump with Viton® tubing (Watson-Marlow, Falmouth, UK) was used to force a stable and continuous flow of syngas into the bioreactor, maintaining a medium syngas flow rate of 217 mL/h (batch assay with continuous syngas flow).
Table 2 shows the inventory for foreground production of 1 kg acetic acid through syngas fermentation by B. methylotrophicum (Eubacterium callanderi) in the lab-scale assay.

2.3. Foreground Inventory for Other Biochemical Processes

To better emulate the production alternatives for acetic acid, two other biochemical processes were selected for a cross-comparison with the benchmark process. One is also based on syngas fermentation but uses a thermophilic microorganism, while the other is a process that uses bio-electrolysis.

2.3.1. PYROCO2

CO2 capture plus hydrogen from water electrolysis and subsequent fermentation was explored in the PYROCO2 European project [38]. The PYROCO2 project aims to produce acetone through a thermophilic microbial bioprocess that uses industrial CO2 and hydrogen derived from renewable electricity. One of the steps in this process is the production of acetic acid; the foreground inventory for the pilot-scale process can be found in Table 3.

2.3.2. Microbial Electrosynthesis

Microbial electrosynthesis (MES) is a bio-electrochemical process that uses biocatalysts to capture and convert CO2 into valuable carbon-based compounds. This approach integrates established carbon capture and utilization technologies with anaerobic consortia and an electric current, leveraging CO2 as a substrate to produce value-added products [39]. The inventory for acetic acid production through MES can be found in Table 4.

2.4. Background Data

Background data for heat, electricity, water and chemicals (e.g., methanol, CO2, H2, H2O, KCl, KOH, H2SO4, H3PO4, NaCl, NaOH, and NH3) can be found in the Supplementary Materials, with reference to the respective literature sources. All inventories were formulated as a function of energy utility (electricity and heat) so the energy transition principles could be evaluated.
Background data regarding energy, electricity, and heat was found for Portugal and France. Emission factor (EF) trends for electricity in selected countries are presented in Figure 3, considering direct emissions from the power system at high voltage. This EF is related to the remaining combustion in power generation, since renewable sources have an associated EF of 0 g CO2-eq/kWh.
In 2023, the Portuguese energy mix comprised 26% fossil sources in its production, having relied mostly on natural gas (88%) from 2021 onward, following the national ban on coal for energy production, and a small percentage of oil. In France, energy from combustion is much lower than in Portugal, with production comprising 68% natural gas, 27% oil, and 5% coal [40]. For the same year (2023), the emission factor (EFElectricity; see Equation (6)) for the foreground emissions of electricity production was 166 g CO2-eq/kWh for continental Portugal and 56 g CO2-eq/kWh for France. When considering a 5-year average, these values increase to 230 g CO2-eq/kWh and 62.8 g CO2-eq/kWh, respectively. By 2050, an EFElectricity of 0 g CO2-eq/kWh is projected for both countries due to Europe’s 2050 net-zero-emissions goal.
Heat can be provided via the combustion of natural gas. In an energy-transition scenario, industrial natural gas will likely be replaced by biogas/biomethane/hydrogen from electrolysis [41]. Figure 4 is a simplified representation of the production of biomethane from food and garden residues.
The natural gas provided to Portugal and France is assumed to be mainly liquified natural gas (with a heating value of 49.1 MJ/kg and a combustion of emission 56.4 gCO2-eq/MJ [42]), whose extraction burden is presented in Table S1 in the Supplementary Materials. The resulting EFheat can thus be assumed to be EFHeat = 60.3 gCO2e/MJ (see Equation (6)) for 2023.
In Portugal, during 2018, the total amount of food waste (FW) and garden waste (GW) generated was 120.2 kg/capita/year and 123.8 kg/capita/year, respectively [43]. By mass, organic waste composition was 49% FW and 51% GW. For France, in the same year, these values were 122.3 kg/capita/year and 115.7 kg/capita/year, respectively, with a similar composition of 51% FW and 49% GW [43]. The biogas potential, derived from González et al. [44], is estimated to be 0.135 kgbiogas/kgFW and 0.473 kgbiogas/kgGW, corresponding to 0.317 kgbiogas/kgorganic waste for Portugal and 0.301 kgbiogas/kgorganic waste for France.
The background inventory used to produce biogas from anaerobic digestion is presented in Table S2 in the Supplementary Materials [45,46]. Further biogas processing to biomethane via pressure swing adsorption (PSA) can be found in Table S3 in the Supplementary Materials [47]. If biomethane is to replace natural gas at an industrial scale, under the condition of electricity production with 0 g CO2-eq/kWh, the resulting emissions (excluding biogenic CO2), yield an EFHeat of 1005.7 kg CO2-eq/50 MJ, or equivalently, EFHeat = 20 kg CO2-eq/MJ (see Equation (6)).
Demineralized water is widely used in industrial processes. However, the increasing pressure to meet both drinking and industrial water demands, exacerbated by the scarcity of freshwater in many European countries, particularly in southern Europe, has made seawater treatment through reverse osmosis a viable solution for producing freshwater in coastal regions. Therefore, the reverse osmosis of seawater was considered in this work to produce industrial water [48]. The corresponding background inventory for this process can be found in Table S4 in the Supplementary Materials.
As previously mentioned, industrial methanol production is commonly performed by natural gas reforming; however, in this work, methanol produced from the gasification of refuse-derived waste and the reforming of syngas was also considered. The background inventory for the two processes (natural gas reforming and refuse-derived waste gasification and reforming) can be found in Tables S5 and S6 of the Supplementary Materials. The inventory presented in Table S5 concerns not only natural gas extraction but also its transport to the processing facility [49].
NaOH, HCL, CL2, and H2 can be simultaneously produced through the direct electrosynthesis of brine [50,51]. The respective inventory is presented in Table S7 of the Supplementary Materials.
Ammonia (NH3) is industrially synthesized through the Haber–Bosch process, which involves the catalytic reaction of nitrogen (N2) and hydrogen (H2) under high temperature and pressure. Nitrogen is typically sourced from the air, while hydrogen can be produced from water electrolysis. The background inventory for this process can be found in the Supplementary Materials—Tables S8–S10, showing N2 capture, H2 electrolysis, and NH3 production [52,53,54].
CO2 capture can be implemented using a variety of sources, including direct air capture (DAC), which extracts CO2 directly from the atmosphere, as well as point sources such as coal and natural gas power plants, crude oil refineries, cement production facilities, and natural gas reforming plants used for hydrogen production [55]. Each source presents unique challenges and opportunities depending on the concentration of CO2 in the flue gas, the scale of emissions, and the integration of capture technologies with existing industrial processes. In this work, CO2 capture from the cement industry was considered, and the inventory is presented in Table S11 of the Supplementary Materials.
CO production is predominantly performed through the reverse water–gas shift (RWGS) reaction, a catalytic process that converts CO2 and H2 into CO and H2O. This reaction, which is highly endothermic, typically occurs at elevated temperatures (700–1200 °C) and is facilitated by catalysts such as iron, copper, or nickel-based materials [38]. This process is particularly significant in the context of carbon utilization and sustainable chemistry, as it provides a pathway to convert CO2—a major GHG—into valuable chemical feedstocks. The RWGS is often integrated with other industrial processes, such as Fischer–Tropsch synthesis or methanol production, to enable the synthesis of hydrocarbons and other high-value chemicals. The background inventory for CO production via RWGS can be found in Table S12 of the Supplementary Materials.
Sodium phosphate is typically produced through the neutralization reaction of phosphoric acid (H3PO4) with sodium hydroxide (NaOH), as described in Table S13 of the Supplementary Materials and Equation (7) [56].
H 3 P O 4 + 3   N a O H N a 3 P O 4 + 3   H 2 O
Phosphoric acid, a key precursor, is primarily synthesized via the wet process, which involves the reaction of sulfuric acid (H2SO4Table S14 of the Supplementary Materials [57]) with phosphate rock (primarily composed of calcium phosphate, Ca3(PO4)2). The mining of phosphate rock, a critical step in this process, is typically carried out using diesel-powered machinery, resulting in significant diesel consumption and associated GHG emissions. To account for these emissions, the diesel inventory was included, as detailed in Table S15 of the Supplementary Materials, based on data from the PRELIM (Process Emissions Lifecycle Inventory Model) developed by the University of Calgary [58].

2.5. Allocation

Both “no allocation” and “physical-based mass allocation” were assessed. The decision to evaluate physical-based mass allocation was driven by its straightforward applicability, particularly in contrast to energy allocation, which is less suitable when certain co-products lack a quantifiable energy content. Additionally, all marketable outflows were considered as co-products, while off-gas emissions were considered as by-products.

2.6. Assuring the Same Level of Acetic Acid Purity

The inventoried processes deliver 1 kg of acetic acid with different purities, for example, methanol carbonylation yields acetic acid with a purity of 99 wt.%, while the PYROCO2 process yields acetic acid with a purity of 68 wt.%. Information about the acetic acid purity of each of the analyzed processes can be found in the footnote of Table 1, Table 2, Table 3 and Table 4.
To ensure that the processes would yield the same 1 kg of acetic acid as the final product, the burden estimated in Gadkari et al. was used as a proxy [30]. The purification energy was calculated as a function of the acetic acid concentration at the inlet (%wt.) to achieve a final purity of 99.9 wt.% [30]. For example, if acetic acid is produced with an initial purity of 20 wt.%, the energy required would be 50 MJ/kg AA. Conversely, if the inlet concentration is 10 wt.%, the energy requirement increases to 250 MJ/kg AA. This approach allows for a consistent calculation of energy requirements based on the initial acetic acid concentration, ensuring comparability across different production processes.

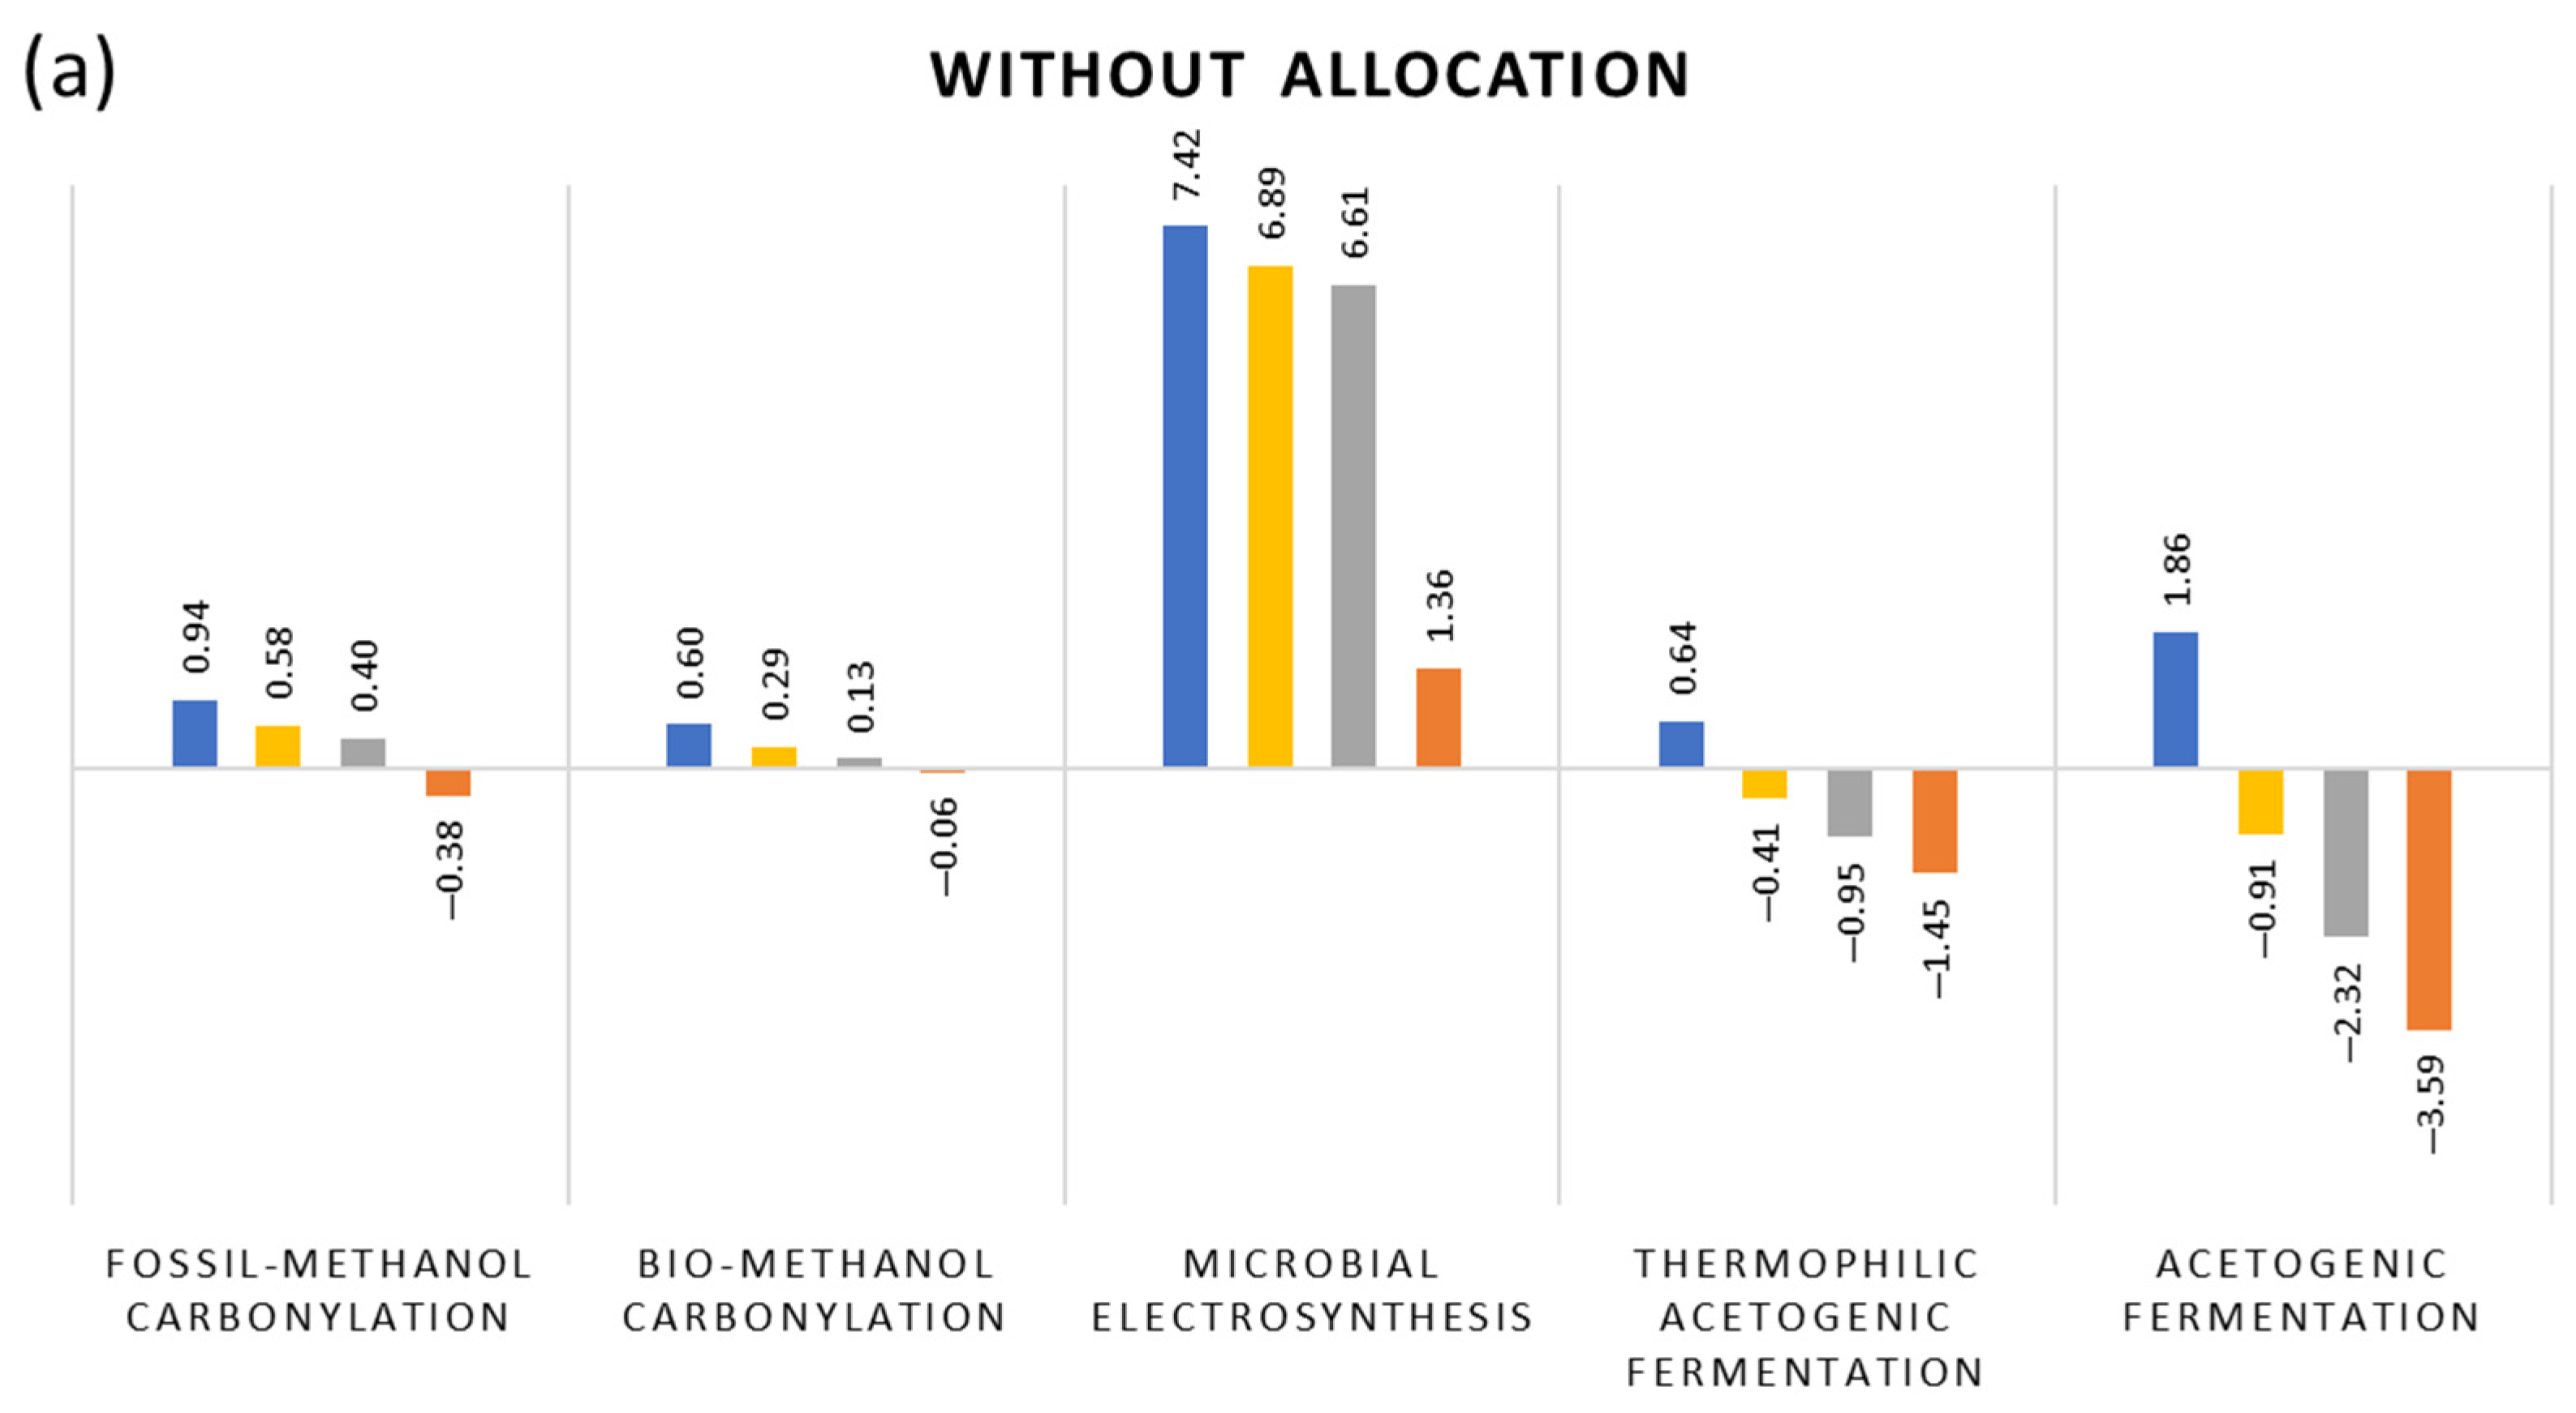
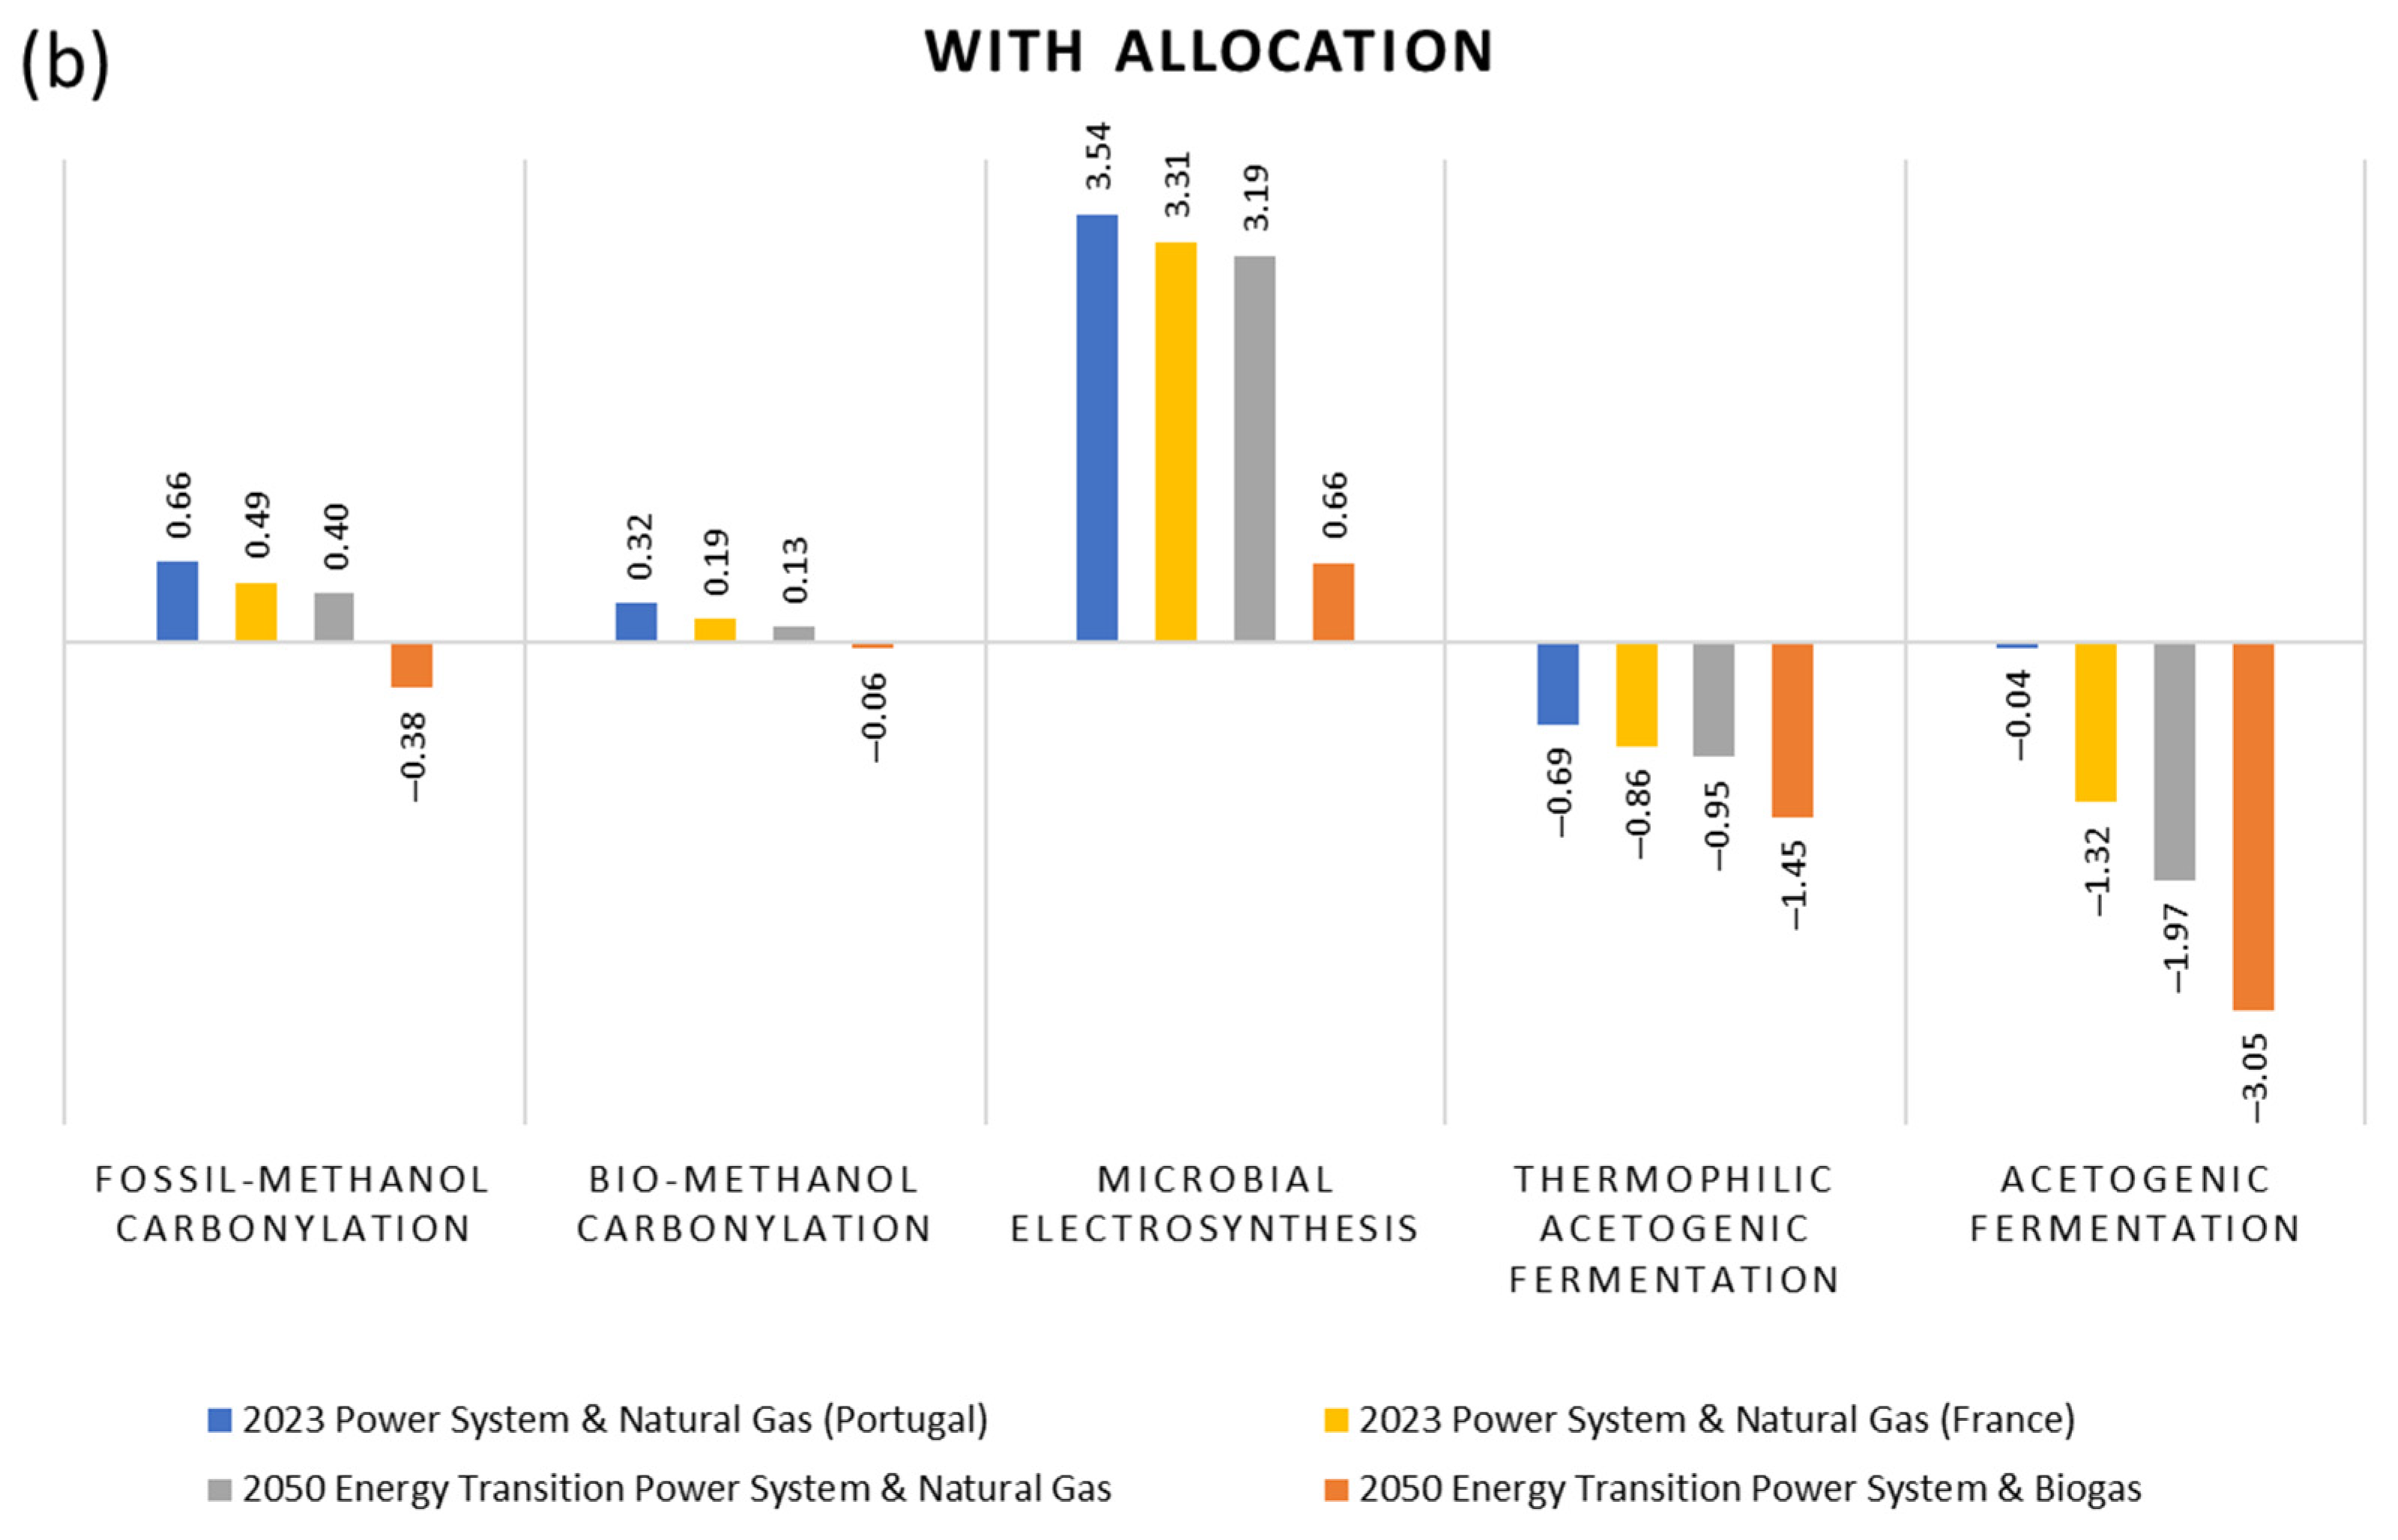
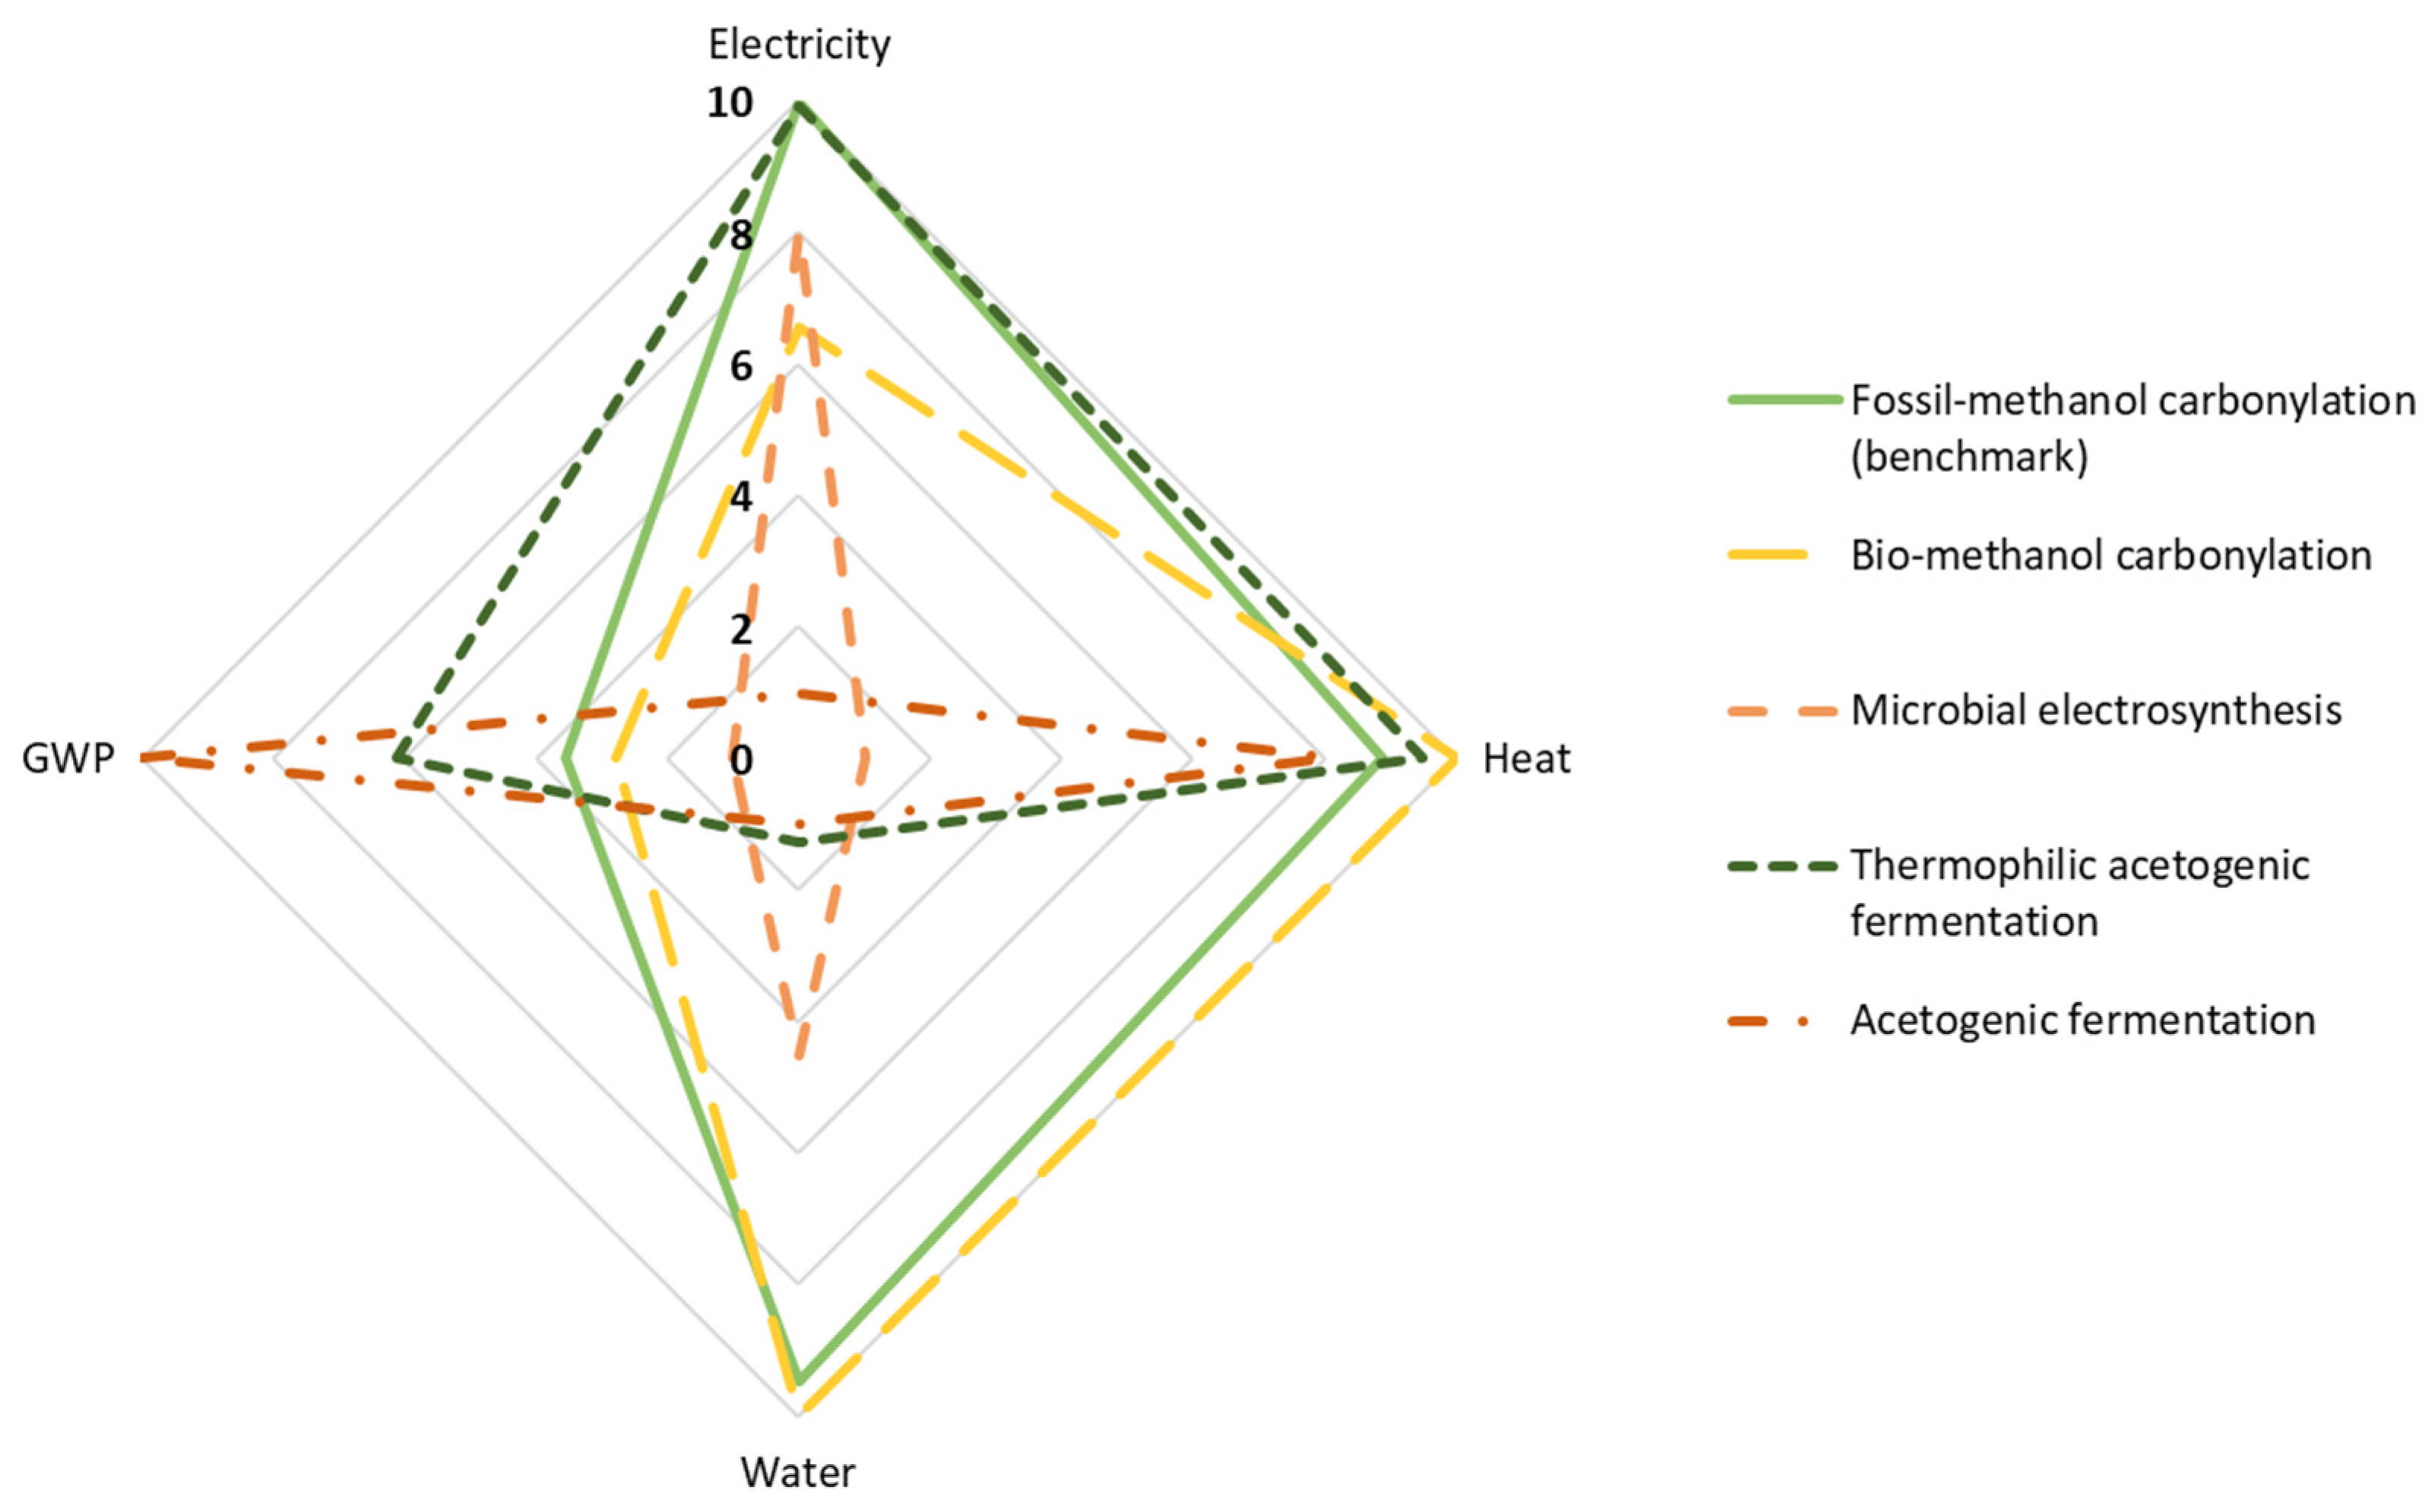
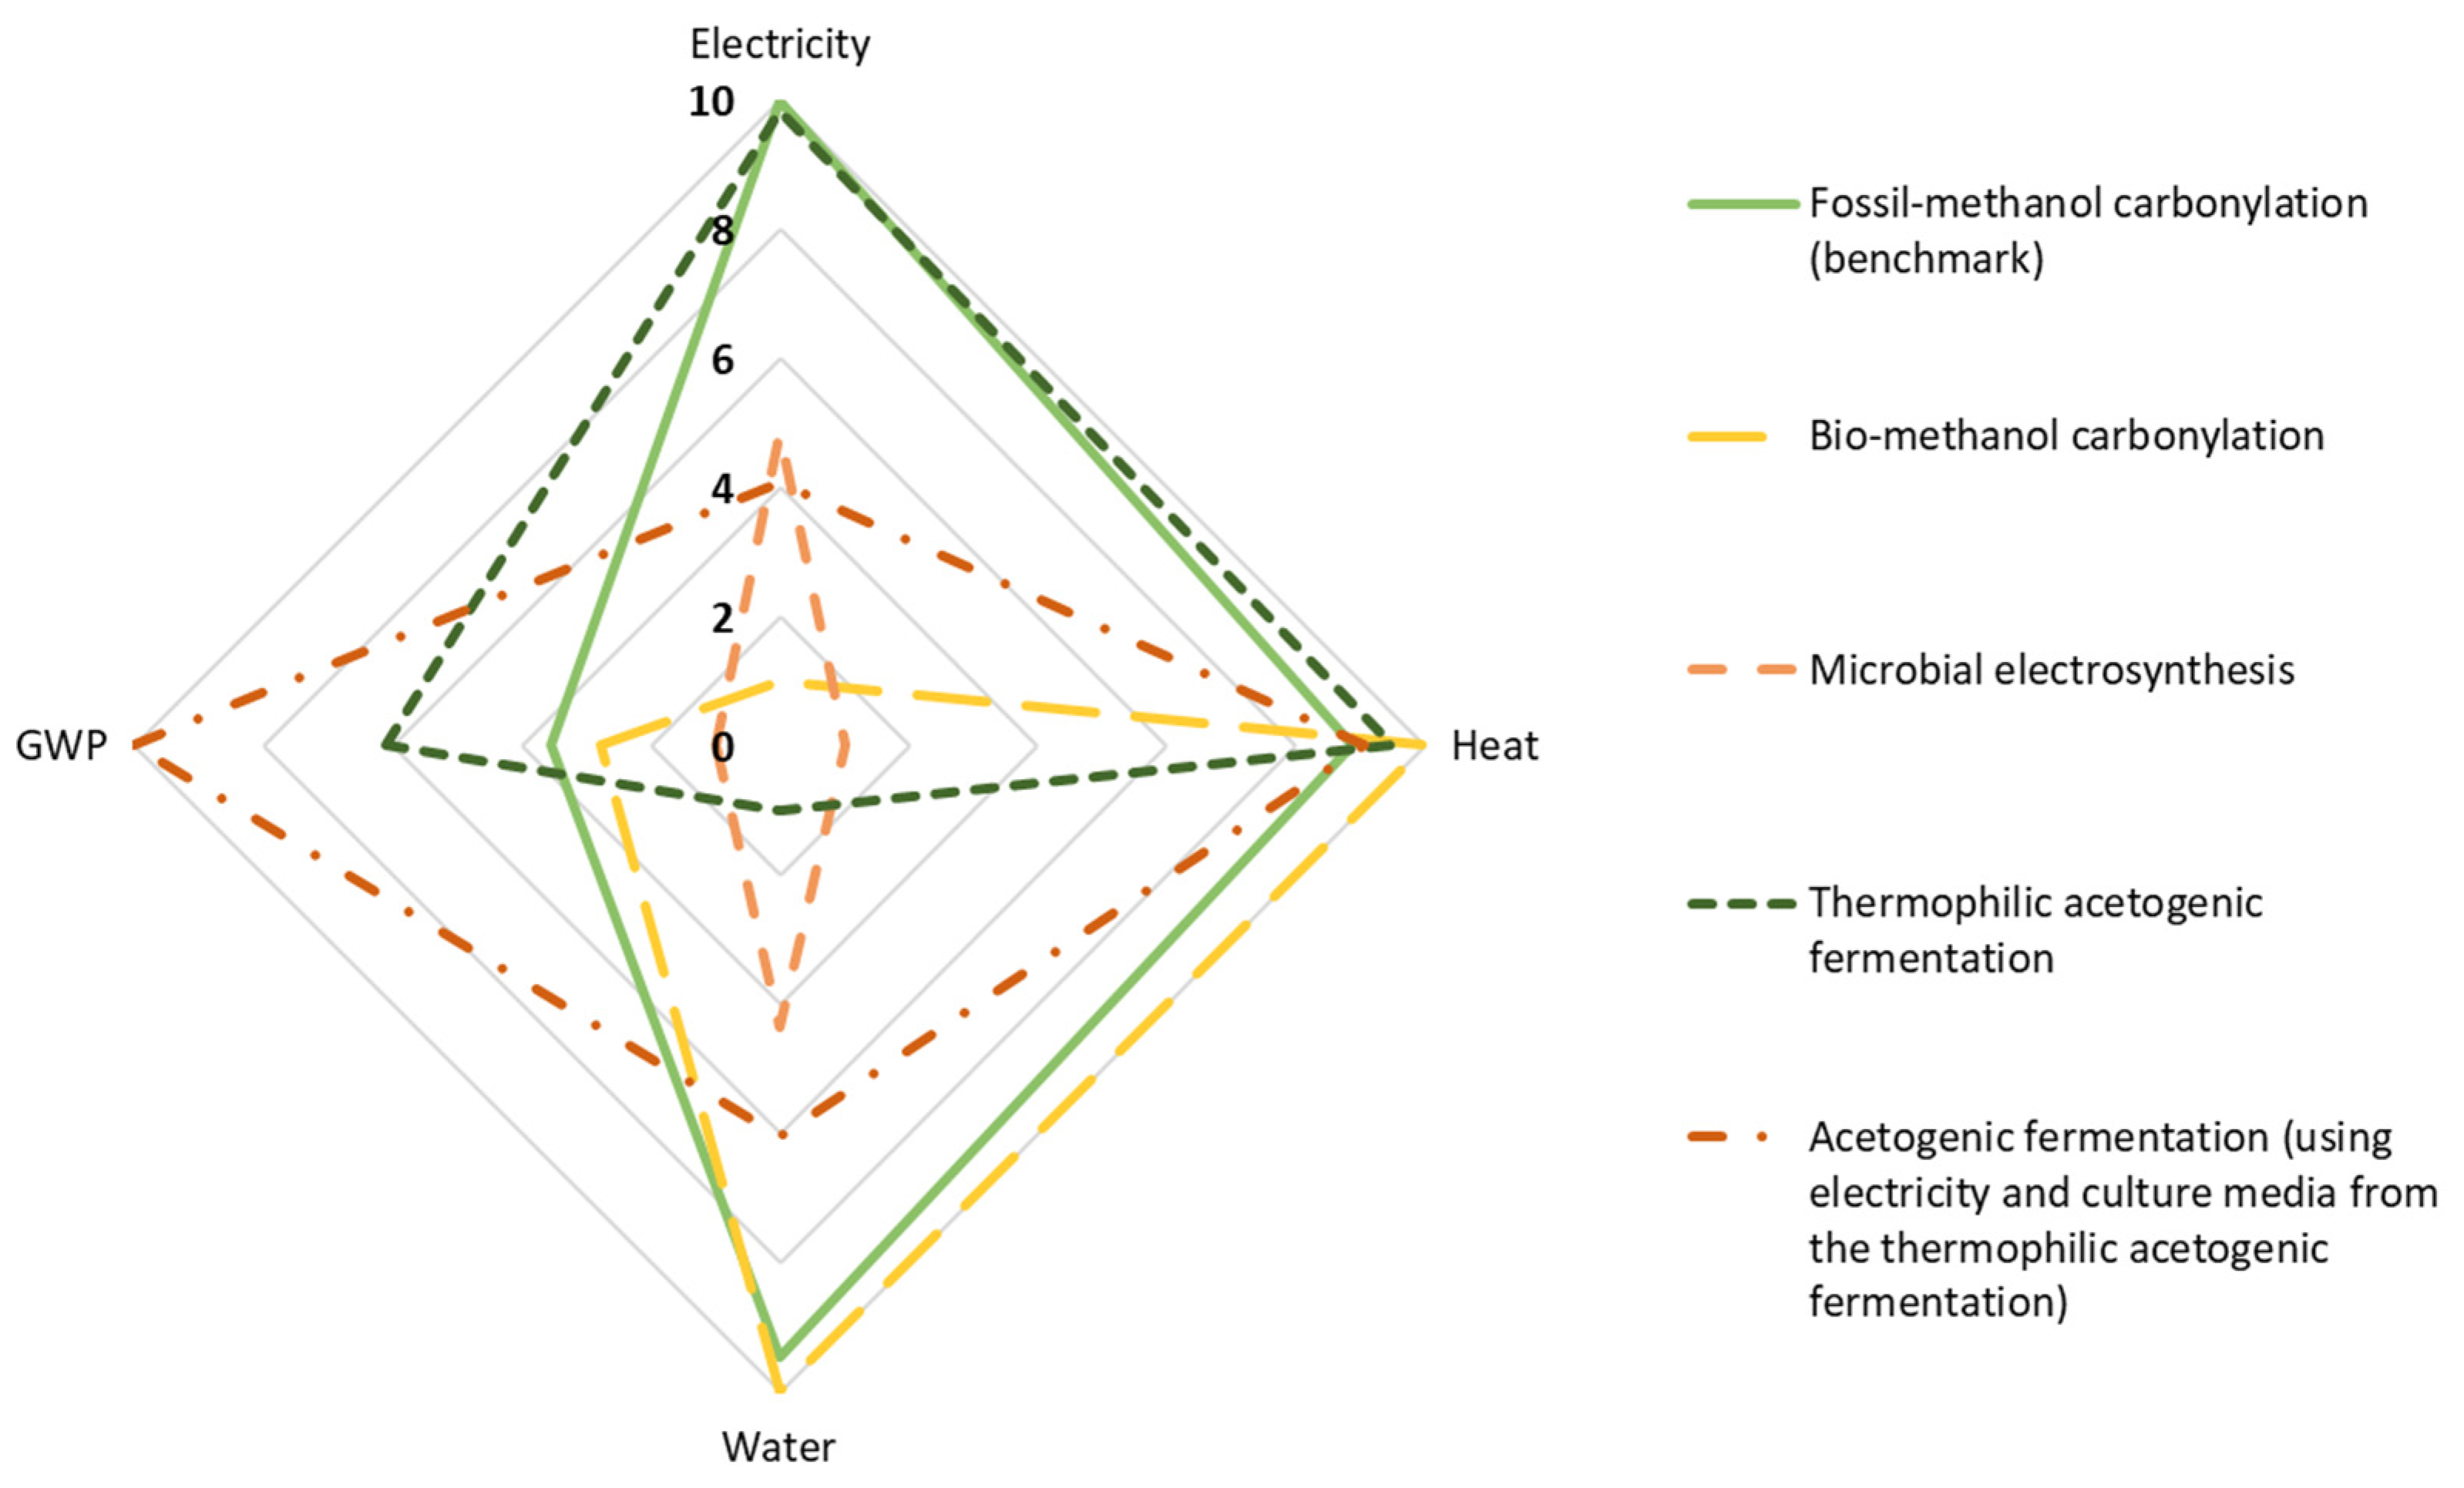
3. Results and Interpretation

The carbon footprint and utilities (water, electricity, and heat) were selected as the Key Performance Indicators (KPIs) to evaluate and compare the following five acetic acid production processes:
  • Thermochemical route, using natural gas reforming and methanol carbonylation (benchmark);
  • Thermochemical route, using refuse-derived waste gasification and methanol carbonylation;
  • Bio-electrochemical route, using MES;
  • Biochemical route, using CO2 capture and hydrogen from water electrolysis and thermophilic acetogenic fermentation;
  • Biochemical route, using CO2 capture and hydrogen from water electrolysis and acetogenic syngas fermentation under mesophilic conditions from lab-scale own experiments.
Table 5 and Figure 5 summarize the average global warming potential over 100 years (GWP100), showing results relative to the five production processes for Portugal and France, with and without allocation, under three scenarios: (1) the 2023 electricity mix, (2) a 5-year average electricity mix (2019–2023), and (3) the projected 2050 electricity mix. Scenario (3) considers either the use of fossil natural gas for industrial heating or a complete energy transition to utilizing biomethane for heating. The “2050 fully renewable energy and heat” scenario is directly related to the objectives stated in the European Green Deal and is a hypothetic ideal scenario, as contrast to the actual energetic mix of both Portugal and France.
Rather than relying on the typical ‘black box’ emission values found in the literature, “our own” calculated benchmark GWP100 was used for greater accuracy and relevance. However, inaccuracies still exist, particularly in processes other than our own acetogenic fermentation, as the process inventories were derived from the literature and could lack certain inputs/outputs due to the oversimplification of those processes.
From the analysis shown in Figure 5, the impact of energy transition is, as anticipated, more significant in Portugal than in France, as France already has a highly decarbonized electricity mix. As can be observed in Table 5, the GWP100 values for the fossil benchmark vary considerably with the energy transition, even reaching negative values when biomethane is used as the heat source. This is due to processes such as CO production using CO2 from carbon capture and H2 from electrolysis (see inventory Table S12 of the Supplementary Materials) and methanol production (see inventory Table S5 of the Supplementary Materials), which are either energy-intensive or use natural gas as a raw material. Such processes benefit greatly from the transition to an all-renewable + biomethane scenario.
Comparing the benchmark with the other thermochemical and biochemical routes, as presented in Figure 5, it is possible to observe that the biochemical process using CO2 capture, H2 from water electrolysis, and acetogenic syngas fermentation (from lab-scale own experiments) performs better in all scenarios (approximately three times better than the bio-methanol carbonylation process in the 2050 full-renewable scenario), except for the 2023 Portuguese electricity mix. Acetogenic syngas fermentation demonstrates lower GHG emissions compared to thermophilic acetogenic fermentation, primarily because it requires less energy-intensive purification. While thermophilic fermentation produces acetic acid at only 68 wt.% purity (necessitating additional purification to reach 95 wt.%), acetogenic fermentation directly yields a higher-purity product (85 wt.%), thereby reducing both energy demands and the associated GWP100 impacts. Furthermore, mass allocation significantly impacts the obtained GWP100 results, as all these processes yield multiple products rather than solely producing acetic acid.
In addition to GHG emissions, utility requirements (energy, heat, and water) for each process were analyzed, based on the 2050 fully renewable scenario. Traceback matrices with conditional formatting were developed for all thermochemical and biochemical processes applying mass allocation to identify process hotspots (see Supplementary Materials, Section S3). A synthesis table is presented in Table 6, indicating the hotspots for each production process and utility.
The utility requirements of the analyzed processes fall into three distinct categories based on their dominant demands.
Electricity-intensive processes are primarily driven by gas production, namely CO synthesis via gas reforming in the benchmark, as well as electrolysis for H2, bio-electrochemical steps in MES, and electricity for acetogenic fermentation. These steps, particularly those involving electrochemical reactions or gas synthesis, exhibit high power consumption. In the acetic acid production step in acetogenic fermentation, electricity demand was greatly overestimated, since data were collected from low-efficiency bench scale equipment. The electricity consumption of bench-scale apparatus, such as reactors, pumps, and heating baths, frequently depends on the age and size of the machinery. Normally, pilot-scale machinery is built in an integrated way, is optimized for specific uses, and is, overall, more efficient in maintaining temperature, mixing, and pH than its bench-size counterparts [59].
Heat demand peaks during acetic acid production in the bio-methanol, MES, and thermophilic fermentation routes and chemical handling stages, such as sodium phosphate production for acetogenic fermentation, where reforming, synthesis, and purification operations require significant thermal energy.
On the other hand, water-intensive processes are most prominent in methanol synthesis (both the fossil and bio-methanol pathways) and acid production (e.g., sulfuric acid used for sodium phosphate production for both the MES and acetogenic fermentation processes). Water is critical not only for electrolysis-dependent reactions (e.g., salt and acid production) but also for gas reforming processes, particularly the water–gas shift reaction central to methanol synthesis.
To facilitate the evaluation of the most efficient process, a KPI system was created to standardize comparisons (calculations for the KPI system can be found in Section S4.1 of the Supplementary Materials). The KPIs use a 1–10 scoring scale, where 10 represents the lowest utility/emission value (optimal) and 1 corresponds to the highest utility/emission value (least favorable). A multicriteria comparison of the analyzed processes can be found in Figure 6.
As can be observed in Figure 6, the benchmark (in light green) shows the best results in terms of energy efficiency, achieving a perfect score of 10 (best), alongside water efficiency at 9.48 (excellent) and heat management at 8.88 (very good). These strengths position it as a highly resource-efficient option, which should be expected as this is an established industrial process that is extensively used in different industries. However, in terms of GWP, the score of 3.56 (poor) reveals a significant environmental trade-off, mainly due to the utilization of fossil-sourced natural gas. The bio-methanol carbonylation process (in yellow) is very efficient in terms of heat and water utilization, both scoring a maximum 10 (best). This is due to the utilization of syngas and not methane for methanol synthesis, which needs less water and heat than the natural gas reforming process. In terms of energy efficiency, it shows a moderate result, at 6.55. However, similarly to the benchmark, a GWP score of 2.78 (poor) highlights its high environmental impact, due to the carbon-intensive processes. MES shows moderate energy efficiency, at 8.03 (good), but it is critically hampered by its heat management and environmental impact, scoring 1 (worst) in both heat and GWP. This difference is primarily derived from the substantial heat energy required for acetic acid purification, which demands approximately 117 MJ per kg of acetic acid produced through this process (a value 13 times higher than the heat necessary for purification in the thermophilic acetogenic fermentation process). In terms of water efficiency, it has a moderate result, at 4.53, further limiting its appeal. Thermophilic acetogenic fermentation stands out, with near-perfect energy efficiency (9.94, excellent) and heat management (9.50, excellent), making it a top contender for energy-intensive industries. However, it suffers from unsustainable water use (1.26, worst) and a moderate GWP score of 6.11. Finally, acetogenic syngas fermentation (own results) is unparalleled in terms of environmental impact, achieving a perfect GWP score of 10 (best), making it the most environmentally friendly option. However, it is severely inefficient in terms of energy and water use, with both scoring 1 (worst), and has moderate heat management, at 8.07 (good). These results are due to the utilization of sodium phosphate, which has a background production process that is highly water-intensive (Table S20 of the Supplementary Materials), and the water necessary for the fermentation process itself, while the energy score for the fermentation is greatly overestimated due to the utilization of bench-scale equipment, which is highly inefficient in terms of energy consumption.
While acetic acid from methanol carbonylation might be ideal for applications that prioritize energy and water conservation, the associated environmental impact limits its viability when the objective is a process that is both efficient and environmentally friendly. On the other hand, acetogenic fermentation sets the benchmark for low environmental impact, but its extreme resource inefficiency limits its practicality unless paired with renewable energy or water-recycling technologies. An alternative might be thermophilic acetogenic fermentation which, at the pilot scale, proved to be very efficient in both energy and heat optimization. However, its excessive water consumption and moderate carbon footprint necessitate mitigation strategies for broader applicability. Looking at the processes used in this study, acetic acid from microbial electrosynthesis seems to be the least favorable, despite having a reasonable energy performance. Its severe shortcomings in terms of heat management and environmental impact show that more research is still necessary to tackle these inherent weaknesses.
However, the results obtained do not consider methodological inconsistencies present in the studies used as basis for this work: acetogenic syngas fermentation data were derived from own bench-scale experiments, whereas other processes (e.g., thermophilic acetogenic fermentation) relied on pilot- or industrial-scale results. While bench-scale energy needs are usually higher than pilot/industrial scales, higher-scale fermentation yields are often lower when compared to bench-scale. This is primarily due to the significant challenges involved in scaling up a biological process. While laboratory-scale fermenters offer highly controlled and homogeneous conditions that can lead to optimized yields, precisely replicating these conditions at larger scales (pilot or industrial) can be complex, due to less efficient mixing, challenges in maintaining optimal gas mass-transfer rates, temperature, and pH gradients, and an increased risk of contamination. Furthermore, inventories used in LCA studies, especially those from biological processes, often lack complete information about the culture medium or the different process outputs, especially regarding by-products or the final biomass.
To harmonize the analysis, energy consumption and culture medium requirements from thermophilic acetogenic fermentation were used as proxies for the bench-scale acetogenic system, since both processes are closely related, although fermentation temperature, is superior and thus more energy-intensive in the thermophilic process (60 °C vs. 37 °C). Bench-scale product yields were maintained, since scale-up studies or process modeling would be necessary to obtain accurate production results.
This standardization enables a fairer evaluation of utility spending. Additionally, a revised hotspot analysis table (see Table S21 in the Supplementary Materials), KPI calculation (Section S4.2 of the Supplementary Materials), and a multicriteria comparison (Figure 7) were developed to visually contextualize performance differences across all processes under uniform conditions.
Comparing Figure 6 and Figure 7 it is possible to observe a significant performance variation. The normalization of the acetogenic syngas fermentation enabled a more balanced cross-process comparison, highlighting each method’s inherent strengths and weaknesses, which were previously obscured by the disproportionately high utility demands of the bench-scale process. As with the acetogenic fermentation process itself, it was possible to observe a substantial optimization, with energy efficiency improving from visible inadequacy (1.00) to moderate competency (4.09) and water use increasing from the worst (1.00) to a middle range (6.07), all while retaining an exemplary environmental performance (GWP = 10.00). This standardization markedly reduces the reliance of acetogenic fermentation on unsustainable resource trade-offs, such as sodium phosphate and sodium chloride, while balancing operational feasibility (heat = 9.06, nearing the benchmark and the results for bio-methanol carbonylation processes) with environmental concerns, reinforcing its viability in decarbonization strategies where environmental and technical metrics are critical.
From this analysis, it is possible to observe distinct technical profiles for each process that determine their adaptability to specific industrial scenarios. Fossil methanol carbonylation, with high energy efficiency and water conservation, is best suited for industries where resource optimization is critical, such as high-throughput chemical manufacturing or industries in water-constrained regions, although its moderate GWP requires supplemental carbon-mitigation strategies. The thermophilic acetogenic syngas fermentation excels in energy and heat management but suffers from poor water efficiency. This technology would be best deployed in energy-intensive sectors (e.g., steel, cement) where heat-recovery systems and water availability are manageable. The same applies to the acetogenic syngas fermentation. Allowing for high GWP savings and future improvements in energy and water use, this technology is uniquely suitable for carbon-intensive industries that seek decarbonization without complete infrastructural overhaul, particularly where waste gas valorization can offset moderate energy costs. Conversely, bio-methanol carbonylation, despite its heat and water efficiency, is undermined by its energy inefficiency, relegating it to niche applications such as low-energy, heat-driven batch processes. The microbial electrosynthesis process still lacks practical adaptability without a radical redesign, meaning that research and development is still necessary to further develop this technology.
Using the optimized results for the acetogenic fermentation, a simulation of the KPI deviations between the biological and the benchmark fossil process was performed, considering the implementation of both processes near a cement plant, in order to use the CO2 emitted from the production of cementitious products (CP). In Portugal, the SECIL cement plant located at Pataias has a publicly available EMAS (EcoManagement Audit Scheme), from which the CO2 emission data can be retrieved. The emission data from 2010 to 2023 and location of the Cibra—Pataias SECIL cement plant can be found in Figure 8.
As can be observed from Figure 8a, even though the specific CO2 emissions are quite stable, averaging 0.58 kg CO2/kg CP, CP production is variable from year to year, and this variation is reflected in the CO2 emission values (blue line). Hence, yearly variability in production will influence not only the amount of acetic acid produced in an integrated process, but also the KPIs, when compared to the fossil benchmark.
Table 7 presents the results of the simulation for a full energy transition scenario, considering a 5-year variation in emission levels from the cement plant.
As shown in Table 7, acetic acid production fluctuates significantly with CO2 availability from the cement plant, ranging from a maximum of 1035 kton in 2020 to just 33 kton in 2023. This shows that acetic acid production using CO2 from carbon-intensive industries cannot fully replace the thermochemical processes as the main production source but can serve as an auxiliary process due to its sustainability–yield trade-off. For an average value of acetic acid production, for 405 kton of captured CO2, the acetogenic fermentation is expected to consume 1860 kWh of electricity, 7867 MJ of heat, and 4255 L of demineralized water, while emitting −1236 kton of CO2-eq. The KPI analysis highlights the advantages of acetogenic fermentation over fossil–methanol carbonylation, demonstrating increased efficiency in terms of heat-spending and GWP100 mitigation. Water utilization can still be further optimized, even if, at an industrial scale, a maximum difference of 9 m3 of water-spending between processes can be considered not significant. Regarding the need to reduce resource dependency, water recirculation and reutilization can provide necessary technology to tip the scale to negative values.
Furthermore, the convergence of carbon capture and utilization (CCU) and renewable hydrogen (H2) presents a transformative framework for sustainable biorefinery systems. By coupling CO2-rich waste streams (e.g., steel or cement off-gases) with green H2—produced via electrolysis powered by renewable energy—syngas fermentation can bridge the gap between emission reductions and circular carbon economies. To ensure microbial compatibility, the cleaning and conditioning of industrial off-gases (e.g., tar removal, H2S scrubbing) can be pivotal. However, as stated in a previous publication, B. methylotrophicum emerges as a robust microorganism for integration with industrial processes due to its substantial resistance to tar and other contaminants present in industrial gases [33,37]. Together, these synergies position acetogenic syngas fermentation as a scalable platform that promotes carbon-neutral chemical production, contingent on advancements in gas logistics (e.g., compression, transport) and a reduction in the cost of renewable H2. These results also highlight the potential of acetogenic fermentation to reconcile ecological and industrial goals without compromising system performance, advancing the transition toward a circular and sustainable industry.

4. Conclusions

This study evaluated the carbon footprint across two European national contexts (France and Portugal), and the utility demands (energy, heat, and water) of five acetic acid production pathways, assessing both current (2023) and future energy transition scenarios. By analyzing the effects of allocation (no allocation or mass-based allocation) and the imposition of certain system boundaries, particularly the requirement for consistent product purity across all processes, it identifies critical trade-offs and synergies between environmental performance and resource efficiency. The primary advantage of the methodology employed in this work lies in its fully traceable and transparent inventories, which minimize reliance on “black box” assumptions and proprietary databases, thereby enhancing the reproducibility of the work.
However, limitations arise from disparities in the temporal and operational scales of the source inventories, as well as the selection of specific processes from a range of potential alternatives. For instance, variations in process design—such as hydrogen production via biomethane reforming instead of water electrolysis, methanol synthesis from biomethane rather than natural gas reforming, or alternative CO2 capture sources—could significantly influence the obtained results. Additionally, extrapolating lab-scale data to industrial-scale operations introduces uncertainties, particularly regarding the assumed acetic acid conversion efficiencies and energy consumption, which may differ at larger scales (e.g., energetic demands decrease at higher scales due to equipment optimization).
In addition to these methodology limitations, some processual key limitations were also observed, namely the availability of biomethane to fully replace natural gas not only for industrial heating, but also for chemical synthesis processes, as is the case in acetic acid production. Moreover, the dependency of acetic acid production on continuous CO2 and hydrogen supplies and the competing demands for methanol between the transportation sector (e.g., maritime/heavy-duty fuels) and the chemical industry (e.g., acetic acid synthesis) underscore the complexity of scaling sustainable production systems within a circular economy framework.
From the analysis performed herein, both fermentation processes benefit greatly from high investment in renewable/fossil-free energies (as is the case in France, with nuclear power), or from an energy transition scenario. However, each acetic acid production process has a niche application. Carbon-intensive industries can benefit greatly from the acetogenic fermentation process due to its unparalleled GWP100 mitigation, and with optimization and improved operational metrics, this process provides a good alternative for decarbonization strategies provided its moderate energy and water demands are feasible. In terms of resource efficiency, the benchmark methanol carbonylation process leads in both energy and water conservation but requires supplementary carbon-mitigation measures (e.g., carbon capture technologies, or the replacement of natural gas with biomethane). Some sector-specific applications can benefit from the thermophilic acetogenic fermentation process, since it can easily use the resources provided by heat-intensive industries in water-abundant regions, increasing GWP100 mitigation om these industries, as shown in the simulation of the benchmark and the acetogenic fermentation process, showing CO2 capture from the cement industry in the 2050 renewable + biomethane scenario. Ultimately, process selection hinges on the alignment of technical strengths with sector-specific priorities; for example, fossil methanol carbonylation can be considered if the objective is resource efficiency but requires additional GWP-mitigation strategies, thermophilic acetogenic syngas fermentation is ideal for heat–energy synergy, and acetogenic syngas fermentation is suitable for sustainable integration into legacy carbon-intensive systems.
In conclusion, this analysis reinforces that sustainable industrial practices will benefit greatly from the energy transition from fossil to renewable energy/chemical sources. However, strategic prioritization is necessary, whether for carbon neutrality, resource efficiency, or sector-specific needs, coupled with an acknowledgment of the inherent trade-offs for each process. For sectors like steel or cement, where decarbonization is structurally complex, the acetogenic fermentation process offers a scalable bridge technology, turning waste liabilities into marketable products, exemplifying how industrial symbiosis between waste valorization and sustainable production can redefine the economics of decarbonization. In this context, future research should focus on a techno-economic analysis to quantify the scalability and economic viability of the acetogenic syngas fermentation processes, particularly their integration with the existing carbon-intensive infrastructure, to ensure an alignment between their environmental benefits and industrial feasibility.

Supplementary Materials

The following supporting information can be downloaded at: https://www.mdpi.com/article/10.3390/c11030054/s1. Figure S1. Process schematic of fossil origin methanol carbonylation to acetic acid, with the description of possible inputs (light green arrows and boxes), outputs (red arrows and boxes) and utilities (blue arrows—water, yellow arrows—energy, black arrows—steam), depending on origin (ecosphere or technosphere). Figure S2. Process schematic of methanol carbonylation (with methanol from refuse derived waste) to acetic acid, with the description of possible inputs (light green arrows and boxes), outputs (red arrows and boxes) and utilities (blue arrows—water, yellow arrows—energy, black arrows—steam), depending on origin (ecosphere or technosphere). Figure S3. Process schematic of microbial electrosynthesis to acetic acid, with the description of possible inputs (light green arrows and boxes), outputs (red arrows and boxes) and utilities (blue arrows—water, yellow arrows—energy, black arrows—steam), depending on origin (ecosphere or technosphere). Figure S4. Process schematic of the thermophilic acetogenic CO2+H2 fermentation to acetic acid, with the description of possible inputs (light green arrows and boxes), outputs (red arrows and boxes) and utilities (blue arrows—water, yellow arrows—energy, black arrows—steam), depending on origin (ecosphere or technosphere). Table S1. Inventory for background extraction and processing of liquified natural gas [39]. Table S2. Inventory for background production of 1 kg biogas in Portugal and in France [42,43]. Table S3. Inventory for background production of 1 kg biomethane [44]. Table S4. Inventory for background production of 1 kg industrial water [45]. Table S5. Inventory for background production of 1 kg methanol through natural gas reforming [46]. Table S6. Inventory for background production of 1 kg methanol through refuse derived waste gasification and reforming [46]. Table S7. Inventory for background production of 1 kg NaOH through electrolysis [47,48]. Table S8. Inventory for background N2 capture [50]. Table S9. Inventory for background green H2 production through electrolysis [51]. Table S10. Inventory for background NH3 production [49]. Table S11. Inventory for background CO2 capture [35]. Table S12. Inventory for background CO production [35]. Table S13. Inventory for background sodium phosphate production [53]. Table S14. Inventory for background H2SO4 production from odorous gases [54]. Table S15. Inventory for background diesel production [55]. Table S16. Traceback utility matrices for the foreground and background processes involved in acetic-acid production through the benchmark process (fossil-methanol carbonylation). Green to red color gradation differentiates the values from the lowest to the highest. Table S17. Traceback utility matrices for the foreground and background processes involved in acetic-acid production through the bio-methanol carbonylation process. Green to red color gradation differentiates the values from the lowest to the highest. Table S18. Traceback utility matrices for the foreground and background processes involved in acetic-acid production through the microbial electrosynthesis process. Green to red color gradation differentiates the values from the lowest to the highest. Table S19. Traceback utility matrices for the foreground and background processes involved in acetic-acid production through the thermophilic acetogenic fermentation process. Green to red color gradation differentiates the values from the lowest to the highest. Table S20. Traceback utility matrices for the foreground and background processes involved in acetic-acid production through the acetogenic fermentation process. Green to red color gradation differentiates the values from the lowest to the highest. Table S21. Traceback utility matrices for the foreground and background processes involved in acetic-acid production through the acetogenic syngas fermentation process, but using the same culture media and electricity values considered for the thermophilic acetogenic fermentation. Green to red color gradation differentiates the values from the lowest to the highest.

Author Contributions

Conceptualization, C.S. and M.P.; methodology, A.B.d.l.P., M.P., and C.S.; validation, A.B.d.l.P., M.P., and C.S.; formal analysis, A.B.d.l.P., M.P., and C.S.; investigation, A.B.d.l.P. and M.P.; data curation, A.B.d.l.P., M.P. and C.S.; writing—original draft preparation, M.P. and C.S.; writing—review and editing, M.P., C.S., and P.M.; visualization, M.P.; supervision, C.S. and P.M.; project administration, C.S. and P.M.; funding acquisition, C.S. and P.M. All authors have read and agreed to the published version of the manuscript.

Funding

This work was supported by the Portuguese Fundação para a Ciência e Tecnologia (FCT), I.P./MCTES through national funds (PIDDAC): UID/50019/2025 and LA/P/0068/2020 https://doi.org/10.54499/LA/P/0068/2020). Marta Pacheco was supported by FCT through the Ph.D. grant DFA/BD/6423/2020.

Data Availability Statement

The original contributions presented in this study are included in the article/Supplementary Material. Further inquiries can be directed to the corresponding author.

Acknowledgments

Adrien Brac de la Perrière completed an internship at FCUL in the summer 2024 in the Research Group on Energy Transition, RG4 of IDL, under the supervision of Carla Silva, which very positively contributed to this research outcome.

Conflicts of Interest

The authors declare no conflicts of interest. The funders had no role in the design of the study; in the collection, analyses, or interpretation of data; in the writing of the manuscript; or in the decision to publish the results.

Abbreviations

The following abbreviations are used in this manuscript:
AAAcetic acid
CFCarbon footprint
CPCementitious products
DACDirect air capture
DUDeclared unit
EFEmission factor
e-LCAEnvironmental life cycle assessment
FUFunctional unit
FWFood waste
GHGGreenhouse gas
GWGarden waste
GWP100Average global warming potential over 100 years
KPIKey performance indicator
MESMicrobial electrosynthesis
RWGSReverse water–gas shift reaction
USAUnited States of America

References

  1. Moussa, S.; Ibrahim, A.; Okba, A.; Hamza, H.; Opwis, K.; Schollmeyer, E. Antibacterial Action of Acetic Acid Soluble Material Isolated from Mucor rouxii and Its Application onto Textile. Int. J. Biol. Macromol. 2011, 48, 736–741. [Google Scholar] [CrossRef] [PubMed]
  2. Acetic Acid Market: Trends & Challenges|Merchant Research & Consulting, Ltd. Available online: https://mcgroup.co.uk/news/20230407/acetic-acid-market-trends-challenges.html (accessed on 25 May 2025).
  3. Phan, H.N.; Nguyen, T.T.; Okubayashi, S. Textile Finishing for Bacterial Cellulose Modification: Organic Acid-Catalyzed Cellulosic Acetylation. J. Text. Inst. 2025, 116, 713–721. [Google Scholar] [CrossRef]
  4. Ren, Z.; Guan, X. Evaluating the Environmental and Easy-Care Benefits of Diacetate Fiber Blended Textiles: Implications for Sustainability in the Textile Industry. Res. J. Text. Appar. 2025; ahead-of-print. [Google Scholar] [CrossRef]
  5. Béligon, V.; Poughon, L.; Christophe, G.; Lebert, A.; Larroche, C.; Fontanille, P. Validation of a Predictive Model for Fed-Batch and Continuous Lipids Production Processes from Acetic Acid Using the Oleaginous Yeast Cryptococcus Curvatus. Biochem. Eng. J. 2016, 111, 117–128. [Google Scholar] [CrossRef]
  6. Pacheco, M.; Moura, P.; Silva, C. A Systematic Review of Syngas Bioconversion to Value-Added Products from 2012 to 2022. Energies. 2023, 16, 3241. [Google Scholar] [CrossRef]
  7. de Vicente, M.; Gonzalez-Fernández, C.; Nicaud, J.M.; Tomás-Pejó, E. Turning Residues into Valuable Compounds: Organic Waste Conversion into Odd-Chain Fatty Acids via the Carboxylate Platform by Recombinant Oleaginous Yeast. Microb. Cell Fact. 2025, 24, 32. [Google Scholar] [CrossRef] [PubMed]
  8. Zhang, L.; Tsui, T.-H.; Tong, Y.W.; Liu, R.; Smoliński, A. Microbial Lipid Technology Based on Oleaginous Yeasts. In Microbial Lipids and Biodiesel Technologies; Zhang, L., Tsui, T.H., Tong, Y.W., Liu, R., Eds.; Springer Nature Singapore: Singapore, 2025; pp. 17–50. [Google Scholar]
  9. Porsche’s Synthetic Fuel|Porsche Lauzon. Available online: https://dealer.porsche.com/ca/lauzon/en-CA/News-and-Events/Carburant-efuel (accessed on 25 May 2025).
  10. Lindstad, E.; Lagemann, B.; Rialland, A.; Gamlem, G.M.; Valland, A. Reduction of Maritime GHG Emissions and the Potential Role of E-Fuels. Transp. Res. Part D Transp. Environ. 2021, 101, 103075. [Google Scholar] [CrossRef]
  11. Chen, Z.; Shen, Q.; Sun, N.; Wei, W. Life Cycle Assessment of Typical Methanol Production Routes: The Environmental Impacts Analysis and Power Optimization. J. Clean. Prod. 2019, 220, 408–416. [Google Scholar] [CrossRef]
  12. Chen, Q.; Gu, Y.; Tang, Z.; Sun, Y. Comparative Environmental and Economic Performance of Solar Energy Integrated Methanol Production Systems in China. Energy Convers. Manag. 2019, 187, 63–75. [Google Scholar] [CrossRef]
  13. Jiang, P.; Li, L.; Zhao, G.; Zhang, H.; Ji, T.; Mu, L.; Lu, X.; Zhu, J. Seeking the Low-Carbon Route of Methanol Production with Sustainable Resources by Tracking Energy and Environment Indicators. Ind. Eng. Chem. Res. 2024, 63, 8261–8272. [Google Scholar] [CrossRef]
  14. Barbieri, M.; Manenti, F. Industrial Production of Acetic Acid: A Patent Landscape. SSRN Electron. J. 2021, 40. [Google Scholar] [CrossRef]
  15. Jones, B.J.H. The CativaTM Process for the Manufacture of Acetic Acid: Iridium Catalyst Improves Productivity in an Established Industrial Process. Platin. Met. Rev. 2000, 44, 94–105. [Google Scholar] [CrossRef]
  16. Global Acetic Acid Demand Share by Region. Available online: https://www.statista.com/statistics/1323645/distribution-of-acetic-acid-demand-worldwide-by-region/ (accessed on 25 May 2025).
  17. Martín-Espejo, J.L.; Gandara-Loe, J.; Odriozola, J.A.; Reina, T.R.; Pastor-Pérez, L. Sustainable Routes for Acetic Acid Production: Traditional Processes vs a Low-Carbon, Biogas-Based Strategy. Sci. Total Environ. 2022, 840, 156663. [Google Scholar] [CrossRef] [PubMed]
  18. ISO 14040:2006; Environmental Management—Life Cycle Assessment—Principles and Framework. ISO: Geneva, Switzerland, 2006. Available online: https://www.iso.org/standard/37456.html (accessed on 25 May 2025).
  19. ISO/TR 14047:2012; Environmental Management—Life Cycle Assessment—Illustrative Examples on How to Apply ISO 14044 to Impact Assessment Situations. ISO: Geneva, Switzerland, 2012. Available online: https://www.iso.org/standard/57109.html (accessed on 25 May 2025).
  20. ISO 14067:2018; Greenhouse Gases—Carbon Footprint of Products. ISO: Geneva, Switzerland, 2018. Available online: https://www.iso.org/standard/71206.html (accessed on 25 May 2025).
  21. Budsberg, E.; Morales-Vera, R.; Crawford, J.T.; Bura, R.; Gustafson, R. Production Routes to Bio-Acetic Acid: Life Cycle Assessment. Biotechnol. Biofuels 2020, 13, 154. [Google Scholar] [CrossRef] [PubMed]
  22. Nicholson, S.R.; Rorrer, N.A.; Uekert, T.; Avery, G.; Carpenter, A.C.; Beckham, G.T. Manufacturing Energy and Greenhouse Gas Emissions Associated with United States Consumption of Organic Petrochemicals. ACS Sustain. Chem. Eng. 2023, 11, 2198–2208. [Google Scholar] [CrossRef]
  23. Flannery, B.; Mares, J. The Greenhouse Gas Index for Products in 39 Industrial Sectors. Resour. Future. 2022. Available online: https://www.rff.org/publications/working-papers/the-greenhouse-gas-index-for-products-in-39-industrial-sectors/ (accessed on 25 May 2025).
  24. Medrano-García, J.D.; Ruiz-Femenia, R.; Caballero, J.A. Revisiting Classic Acetic Acid Synthesis: Optimal Hydrogen Consumption and Carbon Dioxide Utilization. Comput. Aided Chem. Eng. 2019, 46, 145–150. [Google Scholar] [CrossRef]
  25. Smith, R.L.; Ruiz-Mercado, G.J.; Meyer, D.E.; Gonzalez, M.A.; Abraham, J.P.; Barrett, W.M.; Randall, P.M. Coupling Computer-Aided Process Simulation and Estimations of Emissions and Land Use for Rapid Life Cycle Inventory Modeling. ACS Sustain. Chem. Eng. 2017, 5, 3786–3794. [Google Scholar] [CrossRef] [PubMed]
  26. Hischier, R.; Hellweg, S.; Capello, C.; Primas, A. Establishing Life Cycle Inventories of Chemicals Based on Differing Data Availability. Int. J. Life Cycle Assess. 2005, 10, 59–67. [Google Scholar] [CrossRef]
  27. Huber, E.; Bach, V.; Holzapfel, P.; Blizniukova, D.; Finkbeiner, M. An Approach to Determine Missing Life Cycle Inventory Data for Chemicals (RREM). Sustainability 2022, 14, 3161. [Google Scholar] [CrossRef]
  28. Pal, P.; Nayak, J. Acetic acid production and purification: Critical review towards process intensification. Sep. Purif. Rev. 2017, 46, 44–61. [Google Scholar] [CrossRef]
  29. BIO-TIC FP7 Project Acetic Acid; European Commission Environmental Factsheet, Brussels, Belgium. Available online: https://edepot.wur.nl/327986 (accessed on 25 May 2025).
  30. Gadkari, S.; Mirza Beigi, B.H.; Aryal, N.; Sadhukhan, J. Microbial Electrosynthesis: Is It Sustainable for Bioproduction of Acetic Acid? RSC Adv. 2021, 11, 9921–9932. [Google Scholar] [CrossRef] [PubMed]
  31. Lenzing Celebrates the 40th Anniversary of Excellence in LENZINGTM Acetic Acid Biobased. Available online: https://www.lenzing.com/newsroom/news-events/lenzing-celebrates-the-40th-anniversary-of-excellence-in-lenzingtm-acetic-acid-biobased/ (accessed on 25 May 2025).
  32. Flaiz, M.; Poehlein, A.; Wilhelm, W.; Mook, A.; Daniel, R.; Dürre, P.; Bengelsdorf, F.R. Refining and Illuminating Acetogenic Eubacterium Strains for Reclassification and Metabolic Engineering. Microb. Cell Fact. 2024, 23, 24. [Google Scholar] [CrossRef] [PubMed]
  33. Pacheco, M.; Pinto, F.; Ortigueira, J.; Silva, C.; Gírio, F.; Moura, P. Lignin Syngas Bioconversion by Butyribacterium methylotrophicum: Advancing towards an Integrated Biorefinery. Energies 2021, 14, 7124. [Google Scholar] [CrossRef]
  34. European Commission International Reference Life Cycle Data System (ILCD) Handbook-General Guide for Life Cycle Assessment-Provisions and Action Steps; Publications Office of the European Union: Luxembourg, 2010; p. 150. [CrossRef]
  35. AR5 Climate Change 2014: Mitigation of Climate Change. Contribution of Working Group III to the Fifth Assessment Report of the Intergovernmental Panel on Climate Change. Available online: https://www.ipcc.ch/report/ar5/wg3/ (accessed on 25 May 2025).
  36. Borgogna, A.; Salladini, A.; Spadacini, L.; Pitrelli, A.; Annesini, M.C.; Iaquaniello, G. Methanol Production from Refuse Derived Fuel: Influence of Feedstock Composition on Process Yield through Gasification Analysis. J. Clean. Prod. 2019, 235, 1080–1089. [Google Scholar] [CrossRef]
  37. Pacheco, M.; Pinto, F.; Brunsvik, A.; André, R.; Marques, P.; Mata, R.; Ortigueira, J.; Gírio, F.; Moura, P. Effects of Lignin Gasification Impurities on the Growth and Product Distribution of Butyribacterium methylotrophicum during Syngas Fermentation. Energies 2023, 16, 1722. [Google Scholar] [CrossRef]
  38. Sternberg, A.D. System-Wide Perspective for Life Cycle Assessment of CO2-Based C1-Chemicals; Aachen University: Aachen, Germany, 2017. [Google Scholar]
  39. Tharak, A.; Katakojwala, R.; Kajla, S.; Venkata Mohan, S. Chemolithoautotrophic Reduction of CO2 to Acetic Acid in Gas and Gas-Electro Fermentation Systems: Enrichment, Microbial Dynamics, and Sustainability Assessment. Chem. Eng. J. 2023, 454, 140200. [Google Scholar] [CrossRef]
  40. “Data Page: Carbon Intensity of Electricity Generation”, Part of the Following Publication: Hannah Ritchie, Pablo Rosado, and Max Roser (2023)-“Energy”. Data Adapted from Ember, Energy Institute. Available online: https://ourworldindata.org/grapher/carbon-intensity-electricity (accessed on 25 May 2025).
  41. Bento, C.; Lopes, T.F.; Rodrigues, P.; Gírio, F.; Silva, C. Biogas Reforming as a Sustainable Solution for Hydrogen Production: Comparative Environmental Metrics with Steam-Methane Reforming and Water Electrolysis in the Portuguese Context. Int. J. Hydrogen Energy 2024, 66, 661–675. [Google Scholar] [CrossRef]
  42. Prussi, M.; Yugo, M.; De Padella, L.; Edwards, R.; Lonza, L. JEC Well-to-Tank Report V5; Publications Office of the European Union: Luxembourg, 2020. [Google Scholar]
  43. Favoino, E.; Giavini, M.; Rupp, M. Bio-Waste Generation in the EU: Current Capture Levels and Future Potential; BIC/Zero Waste Europe: Brussels, Belgium, 2020. [Google Scholar]
  44. Papageorgiou, Z.; Founti, M.; Nikolaidis, G.N.; González, R.; García-Cascallana, J.; Gutiérrez-Bravo, J.; Gómez, X. Decentralized Biogas Production in Urban Areas: Studying the Feasibility of Using High-Efficiency Engines. Eng 2023, 4, 2204–2225. [Google Scholar] [CrossRef]
  45. Wang, J.; Okopi, S.I.; Ma, H.; Wang, M.; Chen, R.; Tian, W.; Xu, F. Life Cycle Assessment of the Integration of Anaerobic Digestion and Pyrolysis for Treatment of Municipal Solid Waste. Bioresour. Technol. 2021, 338, 125486. [Google Scholar] [CrossRef] [PubMed]
  46. Fei, X.; Jia, W.; Chen, T.; Ling, Y. Life Cycle Assessment of Food Waste Anaerobic Digestion with Hydrothermal and Ionizing Radiation Pretreatment. J. Clean. Prod. 2022, 338, 130611. [Google Scholar] [CrossRef]
  47. Starr, K.; Gabarrell, X.; Villalba, G.; Talens, L.; Lombardi, L. Life Cycle Assessment of Biogas Upgrading Technologies. Waste Manag. 2012, 32, 991–999. [Google Scholar] [CrossRef] [PubMed]
  48. Fayyaz, S.; Khadem Masjedi, S.; Kazemi, A.; Khaki, E.; Moeinaddini, M.; Irving Olsen, S. Life Cycle Assessment of Reverse Osmosis for High-Salinity Seawater Desalination Process: Potable and Industrial Water Production. J. Clean. Prod. 2023, 382, 135299. [Google Scholar] [CrossRef]
  49. Sutar, D.D.; Jadhav, S.V. Life Cycle Assessment of Methanol Production by Natural Gas Route. Mater. Today Proc. 2022, 57, 1559–1566. [Google Scholar] [CrossRef]
  50. Kumar, A.; Du, F.; Lienhard, J.H. Caustic Soda Production, Energy Efficiency, and Electrolyzers. ACS Energy Lett. 2021, 6, 3563–3566. [Google Scholar] [CrossRef]
  51. Kumar, A.; Phillips, K.R.; Thiel, G.P.; Schröder, U.; Lienhard, J.H. Direct Electrosynthesis of Sodium Hydroxide and Hydrochloric Acid from Brine Streams. Nat. Catal. 2019, 2, 106–113. [Google Scholar] [CrossRef]
  52. Singh, V.; Dincer, I.; Rosen, M.A. Chapter 4.2 -Life Cycle Assessment of Ammonia Production Methods. In Exergetic Energetic Environ. Dimens.; Dincer, I., Colpan, C.O., Kizilkan, O., Eds.; Academic Press: Cambridge, Massachusetts, 2018; pp. 935–959. [Google Scholar] [CrossRef]
  53. Chen, G. CEP Magazine. 2020. Available online: https://www.aiche-cep.com/cepmagazine/june_2020/MobilePagedArticle.action?articleId=1591898#articleId1591898 (accessed on 25 May 2025).
  54. Jiresten, E.; Larsson, O. Life Cycle Assessment of Acetone Production from Captured Carbon Dioxide: Using Bio-Fermentation at the PYROCO2-Pilot Plant. Master’s Thesis, Chalmers University of Technology, Chalmers, Sweeden, 2022. [Google Scholar]
  55. Von Der Assen, N.; Müller, L.J.; Steingrube, A.; Voll, P.; Bardow, A. Selecting CO2 Sources for CO2 Utilization by Environmental-Merit-Order Curves. Environ. Sci. Technol. 2016, 50, 1093–1101. [Google Scholar] [CrossRef] [PubMed]
  56. Ecoinvent Ecoinvent Database V3.1 2014. Available online: https://ecoinvent.org/ (accessed on 25 May 2025).
  57. Naukkarinen, M. Life Cycle Assessment Study of a Sulfuric Acid Mmanufacturing Process in the Chemical Pulping Industry. Master’s Thesis, Lappeenranta–Lahti University of Technology, Lappeenranta, Finland, 2023. [Google Scholar]
  58. Young, B.; Hottle, T.; Hawkins, T.; Jamieson, M.; Cooney, G.; Motazedi, K.; Bergerson, J. Expansion of the Petroleum Refinery Life Cycle Inventory Model to Support Characterization of a Full Suite of Commonly Tracked Impact Potentials. Environ. Sci. Technol. 2019, 53, 2238–2248. [Google Scholar] [CrossRef] [PubMed]
  59. Doran, P.M. Bioprocess Engineering Principles, 2nd ed.; Academic Press: New York, NY, USA, 2012; ISBN 9780080917702. [Google Scholar]
  60. Fábrica Cibra-Pataias|EMAS. Available online: https://emas.apambiente.pt/content/fabrica-cibra-pataias (accessed on 25 May 2025).
  61. Centro de Documentação. Available online: https://www.secil.pt/pt/centro-de-documentacao (accessed on 25 May 2025).
Figure 1. Methanol and non-methanol routes for acetic acid production (based on [11,12,13]). Numbers 1 to 5 represent each process step from hydrocarbon source to acetic acid, while letters “a” to “e” represent the different routes, allowing backtrack of main process contribution in each step. Grey boxes correspond to fossil syngas sources and green boxes correspond to green syngas sources.
Carbon 11 00054 g001
Figure 2. Process schematic of a syngas to acetic acid fermentative process, with the description of possible inputs (light green arrows and boxes), outputs (red arrows and boxes), and utilities (blue arrows—water; yellow arrows—energy; black arrows—steam), depending on origin (ecosphere or technosphere).
Carbon 11 00054 g002
Figure 3. Power system in selected countries [40]. Left: carbon intensity; right: generation mix.
Carbon 11 00054 g003
Figure 4. Simplified scheme of biogas processing to biomethane.
Carbon 11 00054 g004
Figure 5. Comparison of GHG emissions of each of the five acetic acid production processes, in kg CO2-eq/kg AA, (a) without and (b) with allocation (GWP100, IPCC AR5).
Carbon 11 00054 g005aCarbon 11 00054 g005b
Figure 6. Multicriteria comparison of utility and GWP with mass allocation for each process analyzed in the 2050 full energy transition scenario. The number 10 corresponds to the most favorable performance, while 1 corresponds to the least favorable performance.
Carbon 11 00054 g006
Figure 7. Multicriteria comparison of utility and GWP with mass allocation for each process analyzed in the 2050 full-energy-transition scenario; in this example, acetogenic fermentation uses the same culture media and electricity values considered for the thermophilic acetogenic fermentation. The number 10 corresponds to the most favorable performance, while 1 corresponds to the least favorable performance.
Carbon 11 00054 g007
Figure 8. (a) Portuguese SECIL Cibra—Pataias cement plant EMAS data for CO2 emissions from 2010 to 2023 [60,61], and (b) location in the Iberian Peninsula. CP—cementitious products.
Carbon 11 00054 g008
Table 1. Inventory for the foreground production of 1 kg of acetic acid through methanol carbonylation [25].
Material FlowsQuantityUnit
Inputs
Methanol0.539kg
CO0.509kg
Heat1.752MJ
Electricity0.002kWh
Outputs
CO0.022kg
CO20.002kg
CH40.001kg
Acetic acid *1kg
* ≥99 wt.% purity.
Table 2. Inventory for the foreground production of 1 kg acetic acid through syngas fermentation by B. methylotrophicum. Support equipment includes the peristaltic pump, pH meter, reactor agitation, water bath, and syngas flowmeter.
Material FlowsQuantityUnit
Inputs
Water 10.19kg
Yeast extract0.13kg
NaCl0.13kg
NH4Cl 0.16kg
KCl 0.02kg
KH2PO4 0.02kg
MgSO4.7H2O 0.03kg
CaCl2.2H2O 0.01kg
NaH2PO40.23kg
Na2HPO40.75kg
Inoculum 0.03kg
Syngas4.01kg
CO 1.51kg
CO2 1.90kg
H2 0.12kg
CH4 0.48kg
Energy8.30kWh
Reactor + support equipment1.10kWh
Centrifuge7.20kWh
Outputs
Liquid products1.18kg
Acetic acid *1.00kg
Butyric acid0.18kg
Off-gas3.56kg
CO 0.53kg
CO2 2.43kg
H2 0.06kg
CH40.49kg
Dry Biomass0.0994kg
* 85 wt.% purity.
Table 3. Inventory for foreground production of 1 kg acetic acid using the PYROCO2 fermentation process [38].
Material FlowsQuantityUnit
Inputs
H20.158kg
CO21.710kg
NH30.019kg
Electricity0.003kWh
Water23.527kg
Outputs
Acetic acid *1kg
* 68 wt.% purity.
Table 4. Inventory for the foreground production of 1 kg acetic acid from MES [39].
Material FlowsQuantityUnit
Inputs
Energy for CO2 capture0.390kWh
MES electricity2.800kWh
Anolyte water0.680kg
CO2 capture1.470kg
Sodium phosphate1.000kg
Outputs
Acetic acid *1kg
O21.070kg
* 99 wt.% purity.
Table 5. GWP100 (kg CO2-eq/kg AA) of the fossil benchmark for the production of acetic acid, from the literature, and for Portugal and France (own calculations), with and without mass allocation and using different electricity mixes.
Electricity Mix/Literature SourceGWP100, IPCC AR5 (kg CO2-eq/kg AA)
No AllocationMass Allocation
PortugalFrancePortugalFrance
Own
calculations
20230.940.580.660.49
5-year average (2019–2023)1.150.610.760.50
2050—Natural gas0.400.400.400.40
2050—Biomethane−0.38–0.38−0.38−0.38
LiteratureUK—2016 [30]1.3
USA several years [17,21,22,23,24,25,26]1–2.84
Table 6. Synthesis table of the hotspot processes for each production process and utility for the 2050 energy-transition power system and biogas scenario.
ProcessElectricityHeatDemineralized Water
Fossil–methanol carbonylation (benchmark)CO productionMethanol synthesisMethanol synthesis
Bio-methanol carbonylationMethanol synthesisAcetic acid productionMethanol synthesis
Microbial electrosynthesisAcetic acid productionAcetic acid productionSulfuric acid (for sodium phosphate production)
Thermophilic acetogenic fermentationH2 productionAcetic acid productionAcetic acid production
Acetogenic fermentationAcetic acid production
CO production
Sodium phosphate
production
Sulfuric acid (for sodium phosphate production)
Acetic acid production
Process steps with the highest utility demand are marked in bold.
Table 7. Acetic acid production through acetogenic fermentation (using the same culture media and electricity values considered for the thermophilic acetogenic fermentation method) with CO2 from a nearby cement plant. CO and H2 amounts were calculated relative to the CO2 supplied by the cement plant to maintain the gas ratio used in the fermentation experiments. KPI values are the difference between the acetogenic fermentation process and the benchmark (fossil–methanol carbonylation).
YearCO2 Flow fromCement Plant (kton)CO and H2 Adjusted for CO2 from Cement Plant Acetic Acid Production (kton)KPI Acetogenic Fermentation vs. Benchmark
CO (kton)H2 (kton)Electricity (kWh)Heat (MJ)Water (L)CO2-eq (kton)
201913671087887212201−18836401−1911
20201962156012610353159−27039187−2743
202135328123186568−4861653−493
20229777651156−134454−136
20236350433101−87295−88
Disclaimer/Publisher’s Note: The statements, opinions and data contained in all publications are solely those of the individual author(s) and contributor(s) and not of MDPI and/or the editor(s). MDPI and/or the editor(s) disclaim responsibility for any injury to people or property resulting from any ideas, methods, instructions or products referred to in the content.

