Article

Innovative X-Ray Absorption Technology for Improved Monitoring of the Degradation and Oxidation of Granular Activated Carbon Filters Used in Hospital Water Treatment Systems

1
Faculty of Electrical Engineering, University of Oriente, Santiago de Cuba 90500, Cuba
2
Neurosciences, Signal and Images Processing, Laboratory of Applied Acoustics, University of Oriente, Santiago de Cuba 90500, Cuba
3
Laboratory of Applied Acoustics, Faculty of Chemical Engineering, University of Oriente, Santiago de Cuba 90600, Cuba
4
Research Group of Analytical and Circular Chemistry, Hasselt University, Agoralaan Building D, 3590 Diepenbeek, Belgium
*
Author to whom correspondence should be addressed.
Submission received: 8 November 2024 / Revised: 28 March 2025 / Accepted: 10 April 2025 / Published: 28 April 2025
(This article belongs to the Special Issue Carbon-Based Materials Applied in Water and Wastewater Treatment)

Abstract

:
This study introduces a novel, non-invasive X-ray absorption analysis (XRA) method to evaluate the photonic absorption process of granular activated carbon (GAC) in hospital water purification systems. By leveraging digital radiographic images, this innovative technique monitors the deterioration and oxidation of the GAC filter, predicts its remaining lifetime, and estimates its water dechlorinating capacity. Analyzing the entire GAC filter and making a reuse possible, the new XRA method provides valuable insights into the filter’s condition, enhancing water purification efficiency and costs without analyzing subsamples. Complementary analytical techniques on subsamples, taken at various depths, did not yield valuable additional information of the GAC filter exhaustion condition, nor additionally make a reuse impossible.

1. Introduction

Activated carbon (AC) adsorption is a widely used technique for removing various pollutants due to its extensive surface area, high pore volume, porous structure, and specific surface functional groups. Available in both powder and granular forms (0.2–5 mm), granular activated carbon (GAC) has been extensively utilized for eliminating undesirable odours, colours, tastes, and organic and inorganic pollutants from domestic and industrial wastewaters [1,2,3,4,5]. In clinical laboratory water treatment systems, GAC is employed to remove free chlorine, commonly used in Cuba for water disinfection [6,7,8,9,10,11,12]. The disinfectant power of chlorine and its compounds relies on their oxidation capacity, with hypochlorous acid (HClO) formed through the hydrolysis of molecular chlorine. The primary mechanism for removing residual HClO by GAC involves an oxidation/reduction process, where GAC acts as a reducing agent, converting HClO into non-oxidative chloride ion (Cl) that can be efficiently removed by the RO unit [13].
Maintaining the required electrical conductivity (EC) for the outlet water (1–5 µS/cm) of the water treatment system necessitates an inlet water EC between 200 and 300 µS/cm. If the outlet water EC exceeds 5 µS/cm, the water pre-treatment system requires intervention to restore specifications. The performance of the GAC unit significantly impacts the lifespan of the most expensive components of the system, such as the following: the nanomembrane, the reverse osmosis (RO) membrane, and mixed-bed ion-exchange resin units (see Figure S1, Supplementary Material (S.M.)). This means that all filters, membranes, and ion-exchange cartridges of the water treatment system are tested as described in detail by the management flowchart of the hospital in the study of [14]. As this paper is now focused on the GAC unit, in the past, the management was executed by taking samples at different layers (as described in Section 2.1, Figure 1, XRA method 1)) and is discussed in detail in the studies of [12,13,15]. As a consequence of the sampling, the GAC filter is not suitable for its further use and must be discarded, exhausted or not, and replaced by an expensive and fresh GAC filter.
The novel XRA method 2 (fast, simple, and reliable), incorporating a new mathematical model, was developed to determine precisely and specifically when the entire cylindrical GAC filter should be replaced (or regenerated) because of complete deterioration/oxidation (making it ineffective to free chlorine removal). In this study, other analytical techniques are mentioned, addressing sample morphology (SEM), composition (TGA, EA, XRF), and porosity (BET). This approach allows us to evaluate the reliability of the proposed novel XRA method in describing the photonic absorption process after extended GAC oxidation, now with a possible reuse of the entire GAC filter during a hospital treatment.
In addition, the impact of parameters such as initial and final photonic intensity, the radius and apothem of the cylindrical filter, and the linear absorption coefficient of the entire GAC filter is investigated. Finally, data from breakthrough curves will be correlated with XRA data to predict the remaining lifetime of the filter and estimate its free chlorine removal capacity. As a result, the lifetime of the GAC filter can be extended in a cost-effective manner (which is the focus of this paper) and guarantees the required water quality (EC < 5 µS/cm).

2. Materials and Methods

Analytical procedures, experiments, and results on GAC samples using TGA, XRF, BET, SEM, and EA are described in Supplementary Material (S.M.) (Section S2).

2.1. GAC Samples and Sampling Method

Figure S1, in S.M., depicts a general set-up of the ultrapure water production system. A GAC filter (from Hyundai enterprise) was selected for the assessment of the photonic absorption process. Such a filter usually operates at a flow rate of 1.9 L/min, using pressure and temperature ranges between 1 and 3 kg/cm2 and 34–100 °C, respectively. After six months of continuous exploitation, this filter was declared as follows: ¨out of service¨ only based on EC measurements and is labelled as GAC-Used.
Three different layer regions in the GAC bed were sampled using the procedure described in the study of [12]. These subsamples were collected within each 15 cm depth of the GAC filter as shown in Figure 1a [12,13]. Figure 1b depicts how the sampling process was performed. A collection of five samples per filter layer, radially distributed over the whole layer area, was gathered and mixed to obtain per layer a representative sample. In accordance with the GAC layer position (Figure 1a), samples were labelled as GAC-Top, GAC-Middle and GAC-Bottom.
Selected layers were characterized using different conventional techniques (TGA, EA, XRF, and SEM) and XRA method 1 (Section 2.3.1).
The filter was turned over 180° during exploitation, on regular basis, in order to extend its lifetime, having no negative effect on the water-cleaning efficiency and water quality. A sample of virgin GAC (GAC-Virgin) was also included and characterized for comparison using the same conventional techniques and both XRA methods.

2.2. Sample Preparation

Prior to analysis, the subsamples were pulverized and sieved using a 63 µm sieve in a WQS vibrating screen (0.3 mm/3000 min−1) using XRA method 1 (Section 2.3.1). ASTM (Standard Test Method) D2867-04 for moisture determination [16] was used as reference for the drying process; all samples were kept in a silica-gel desiccator until analysis. As no radial dependency between the samples of each layer was found, the obtained subsamples at each layer were mixed and taken as one sample for each selected layer (GAC-Top, GAC-Middle and GAC-Bottom).
A sample of GAC-Virgin was subjected to an extended free chlorine exposure, in batch, in a dosage of 1 g of GAC to 10 mL using a solution of NaClO at a concentration of 4 mg/L during a period of 90 days. The initial concentration of NaClO, used for this experiment, was more than 20 times the real concentration that the filter would see in a real-life case scenario. The experiment was stopped when the concentration of NaClO in the solution remained the same during a period of a week. It resulted in an extremely oxidized GAC, which was used for calibration of the free chlorine removal capacity (Section 4.5). The sample was analyzed using only XRA method 1 (Section 2.3.1) and EA (Section 4.2), declared as exhausted, and labelled GAC-VExh.
The GAC-Used filter was also extra-treated with HClO, in a scaled column experiment, until exhaustion and labelled as GAC-UExh for comparison (Section 4.5).

2.3. XRA Experiments

The GAC-Used filter was analyzed by two XRA methods. First, the entire GAC filter was characterized using a new XRA method (XRA method 2) (Section 2.3.2 and Section 3.1). Afterwards, the traditional XRA method (XRA method 1), as described in Section 2.3.1, was applied using the subsampling process on the same GAC filter.

2.3.1. XRA Method 1

Recent publications [12,13,15] demonstrated the use of digital radiographic images in order to detect differences in the X-ray absorption levels between GAC samples. Experiments for GAC samples were conducted using a TOSHIBA Mamorez-mgu 100d X-ray equipment used for mammography studies and very similar to the one depicted in Figure 2. Subsamples collected at various depths of the filter were placed under the X-ray equipment, following the methodology described in references [12,13]. Briefly, X-ray radiography experiments were in manual mode. An X-ray beam with energy of 22 keV-125 mAs and a sample thickness of 12 mm were used. A focal distance of 60 cm was applied for all the experiments.
The frequency-amplitude spectra of the X-ray images were determined using the discrete fast Fourier transform in two dimensions (2D-DFT) according to the studies of [12,13]. The mathematical analysis of the digital X-ray radiographic images was performed using dedicated software developed in MATLAB®15. XRA software version 1.0 specifically for this application.

2.3.2. XRA Method 2 (New Method)

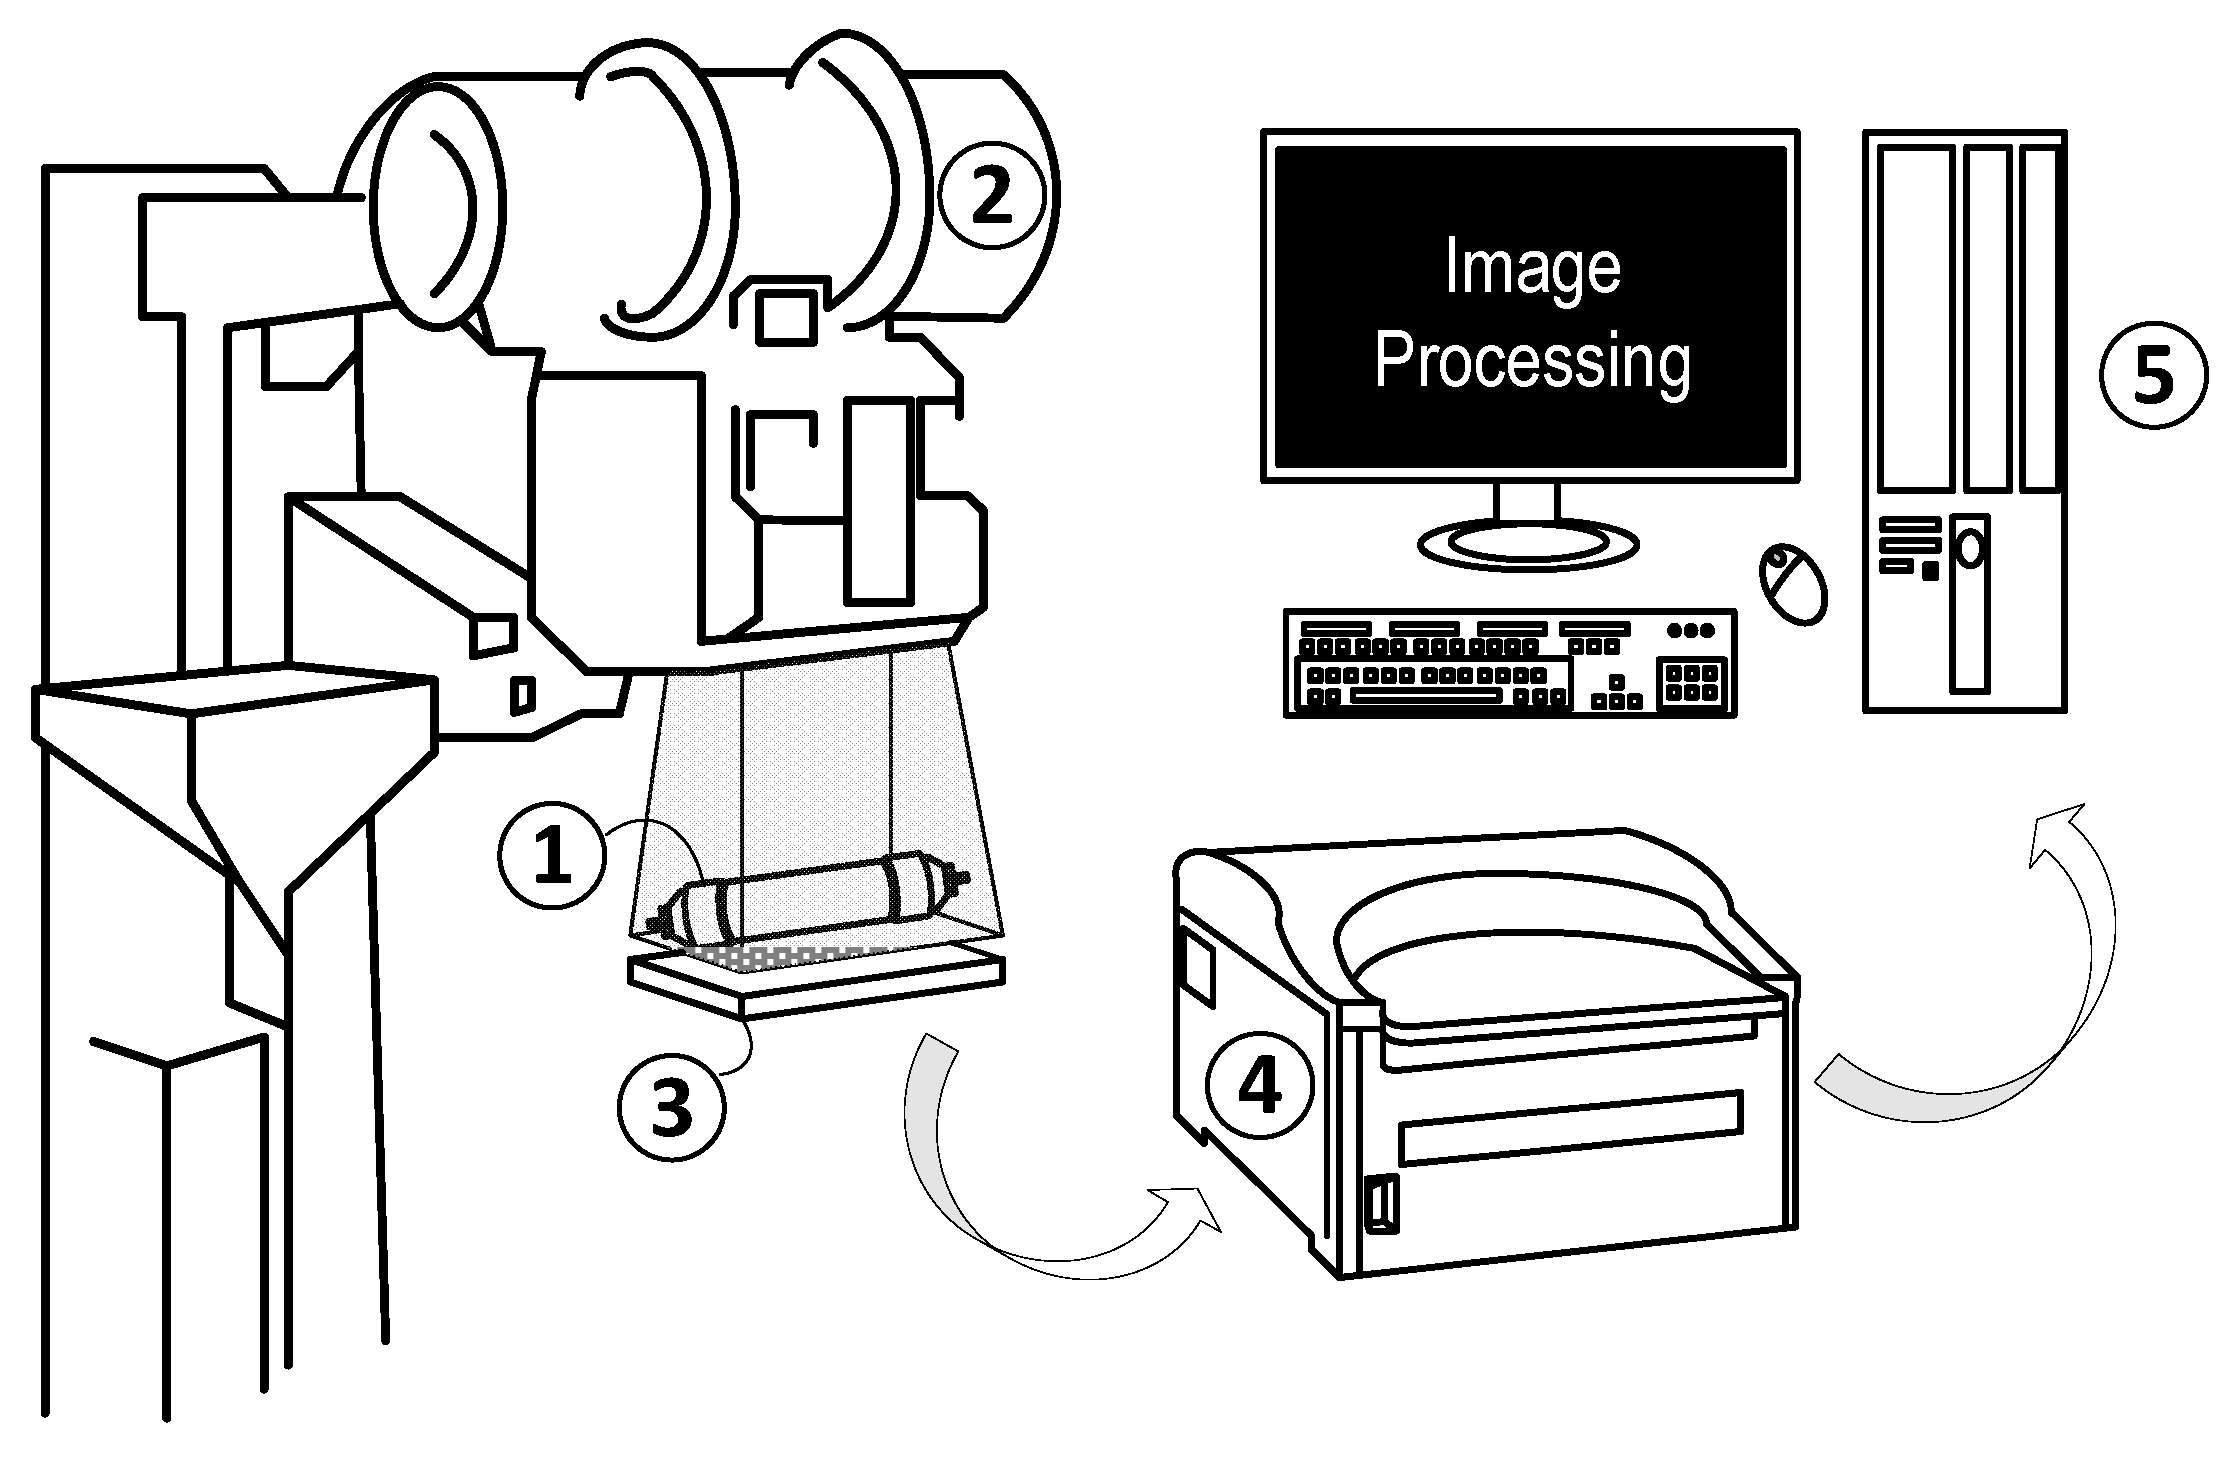
XRA experiments on the entire GAC filter were conducted at eight different energies from 40 keV to 120 keV with 10 keV steps using a TOSHIBA KXO-36 s (clinical general radiography) X-ray equipment. Figure 2 depicts the experimental set-up applied for the new method.
The entire GAC filter (1) was placed under the X-ray apparatus (2) and was exposed at the high-energy X-ray radiation beam. The attenuated photons were registered by a photosensitive detector (3), and the registered intensity of attenuated photons was transformed in a grey-scale image using the conversion unit (4). Obtained grey-scale image was conveniently processed by PC (5) using dedicated software. The cylindrical shape of GAC filter caused different X-ray absorption levels in the same X-ray digital image and produced a grey-scale image with grey-scale intensity (GSI) values decreasing from the centre of the filter to the edges, independently of its exhaustion degree (virgin filters will show the same behaviour). However, a GAC filter with a higher photonic attenuation will always show a whiter image in comparison with a virgin GAC filter.
According to the original XRA images, each filter has an approximate radius of 220 pixels, equivalent with the 5 cm radius of the cylindrical filter; each GSI measurement was performed using 20 pixel steps (equivalent to approximately 0.46 cm). According to the proposed model (Section 3.1), apothem variations were measured in pixels using XRA images and dedicated software, and, afterwards, the conversion to cm was performed using the real filter dimensions.
The photons registered by the detector are the photons that cross through the material without any interaction, reaching the detector with the same initial energy. In contrast, the photons that interact with the GAC filter will produce photoelectrons and characteristic radiation that leave the GAC filter with lower energy [17]. Scattered photons from electron transitions are not relevant from a radiologic viewpoint and therefore neglected. This inconvenience is usually solved using anti-diffusion grids, which are installed in the X-ray apparatus eliminating about 95% of this radiation [12,17].

2.4. Breakthrough Curves for Free Chlorine Removal

First, a calibration curve for NaClO determination was obtained as described in S.M. (Figure S2). A 4 mg/L NaClO solution was used for the free chlorine removal experiments in scaled columns. To determine the free chlorine in samples collected after the experiments, a total sample volume of 3 mL was used. Specifically, 1 mL of the effluent was collected every 20 min and mixed with 0.5 mL of N, N-diethyl-p-phenylenediamine sulphate (DPD) solution (2 mg/mL). The mixture was then diluted with 1.5 mL of Milli-Q (MQ) water to reach a final volume of 3 mL. The free chlorine concentration was determined by photometry using a UV–visible spectrophotometer (Ultraspec-7000, Biochrom Ltd., Holliston, MA, USA) at a wavelength of 515 nm [18,19].

3. Theory and Calculation

3.1. XRA Method 2: Relationship Between Grey-Scale Intensity (GSI), Linear Absorption Coefficient ( μ ), Radius ( r ), and Apothem ( a ) for a Cylindrical GAC Filter

An X-ray photonic detector will record the number of photons that pass through a material of thickness x, the number of photons that reach the detector will be N , and the number of photons that interact with the material and are removed from the beam is n . The number of removed photons n is proportional to the number of initial photons present in the beam and the number of atoms in the material (proportional to x ). Therefore, the relation between n , N , and x can be mathematically expressed as follows [17]:
n = μ N x
with
n : Number of photons removed from the beam (dimensionless).
μ : Linear absorption coefficient (in mm−1).
N : Number of photons that reach the detector (dimensionless).
x : Material thickness (in mm).
If Δ N represents the change in the number of photons in the incident X-ray beam that pass through x , then N is reduced by each interaction that occurs ( N = n ) , and Equation (1) adopts the following form:
N = μ N x
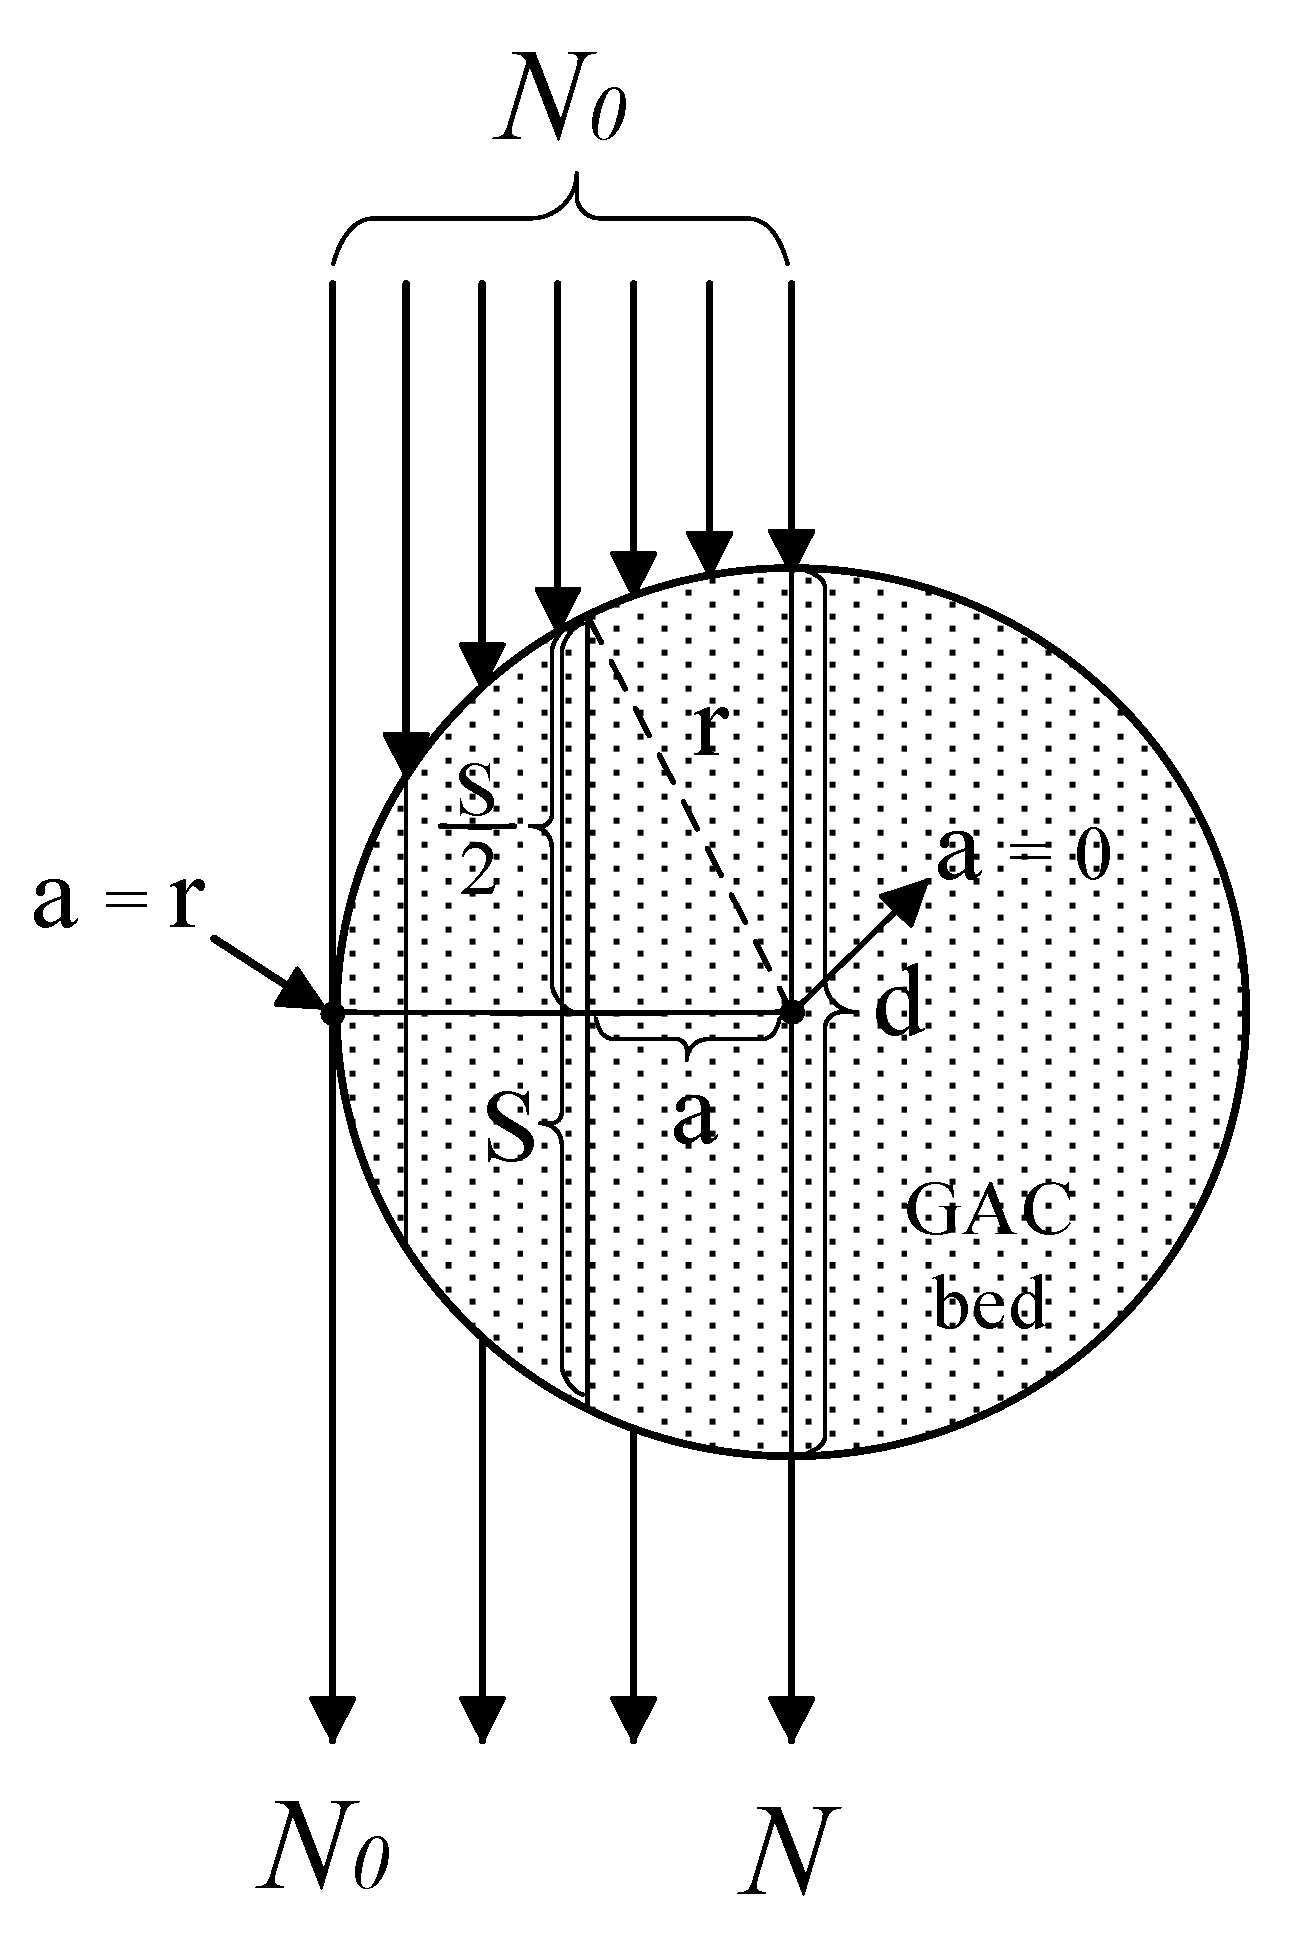
A sectional frontal view of the GAC filter is shown in Figure 3.
The photons that pass through the GAC filter without any interaction will be recorded by the photosensitive detector. For all experiments, the distance between the focus of the beam and the GAC sample should remain constant between experiments.
N 0 : Initial photonic intensity (dimensionless).
N : Final photonic intensity (dimensionless).
a : Apothem of the circumference (in mm).
d : Diameter of the circumference (in mm).
r : Radius of the circumference (in mm).
S : Chord of the circumference (in mm).
For a constant distance between the focus of the beam and the GAC filter, the number of photons that reach the detector is only modified by the square of the distance, since the air attenuation is about 0.001% and therefore negligible. Considering the cylindrical shape of the GAC filter, the longitude of the circumference chords changes proportionally to the variation in the circumference apothems. Thus, S can be related with a applying the Pythagoras theorem:
r 2 = S 2 2 + a 2
and
S = 2 r 2 a 2
According to the shape of the filter, each circumference chord corresponds to a specific x :
S = x
Then,
x = 2 r 2 a 2
Considering that the radius of the circumference ( r ) is constant, chord variations ( S = x ) are function of the apothem ( a ). Assuming the variations of Δ x and a are small enough, expression (6) can be derived with respect to a :
d x d a = 2 r 2 a 2
Then,
d x = 2 r 2 a 2 d a
For small variations of N , Equation (2) can be written as follows:
d N = μ N d x Thus ,   N = d N   and   also   x = d x
Combining Equation (8) with Equation (9) gives the following:
d N = μ N 2 r 2 a 2 d a
The differential equation shown in Equation (10) can be solved separating variables as follows:
d N N = μ 2 r 2 a 2 d a d N N = μ 2 r 2 a 2 d a ln N = μ 2 r 2 a 2 + C
where
C : Coefficient of the independent solution.
When photons pass through the cylindrical filter, the higher attenuation occurs at the centre of the filter ( S = x = 2 r = d and a = 0 ). On the other hand, when S = x = 0 and a = r , the opposite phenomenon occurs (see Figure 3).
According to Figure 3, the boundary condition can be defined:
For   a = r S = x = 0 N = N o ln N o = C   according   to   Equation   ( 11 )
Replacing the independent solution C in Equation (11) gives the following:
ln N = μ 2 r 2 a 2 + ln N o   a n d   ln N ln N o = μ 2 r 2 a 2 ln N N o = μ 2 r 2 a 2
Then,
N = N o e μ 2 r 2 a 2
When a > r , Equation (14) adopts a complex solution, meaning that the shape of the filter changed and corresponds with an ellipse, not with a circumference. In that case, the previous analysis is not valid; the parameter a is therefore restricted to the condition a < r .
According to recent publications [12,13], it is possible to establish a mathematical relationship between attenuated photons ( N ) and GSI using Equation (15).
G S I = f N
From Equation (15), GSI can be expressed as an equivalent exponential function of the photonic intensity (N). Therefore, considering the filter shape, it is possible to express the photonic absorption process using the GSI values as given by Equation (16):
G S I = G S I 0 · e μ 2 r 2 a 2
The grey-scale intensity of incident photons (GSI0) was calculated using the information at the edge of the filter (without GAC sample) according to the study of [12]. The GSI value at 40 mAs and 40–120 keV was approximately 0.0039 for all the measurements. At filter edge, GSI = GSI0, and r = a ,     μ = 0 (Equation (16 ) ) . According to the proposed new mathematical model, GSI values in the cylindrical filter change as a function of the initial photonic intensity, the linear absorption coefficient of the material, and apothem variations (reflected in chord variations).
Considering this model, the GSI value will be more intense for   a = 0 (at the centre of the cylindrical filter) by direct influence of the filter shape, regardless of the exhaustion degree of the GAC, and it will decrease from that point up to a = r , at the edge of the filter, to its lowest level (GSI = GSI0).

3.2. Parameters for the Breakthrough Curves for Free Chlorine Removal

The breakthrough curves were plotted using the ratio between the effluent free chlorine and the initial free chlorine concentrations (Ce/Co) versus time (in min). The dechlorinating capacity of the GAC was calculated and quantified taking into account the removed free chlorine concentration from the inlet water by the GAC filter and the time duration that the filter is capable to maintain its removal capacity with respect to the virgin material.
The breakthrough time (tp) was determined as the time for reaching the equilibrium at which the derivative of the ratio (Ce/Co) to the time reaches its maximum, and the breakthrough curve shows an inflexion point. At this point, the removal capacity of the GAC towards the adsorbates (free chlorine and hardness ions) can be estimated using Equation (17):
C A = 0 t p i 1 1 C o · C e i x d x 0 t p v i r g i n 1 1 C o · C e v i r g i n x d x
where
C A : Removal capacity towards the adsorbate (dimensionless).
t p i : Breakthrough time of the sample i for adsorbate removal (in min).
t p v i r g i n : Breakthrough time of GAC-Virgin sample for adsorbate removal (in min).
C e i : Adsorbate concentration of the effluent for sample i (in mg/L).
C e v i r g i n : Adsorbate concentration of the effluent for GAC-Virgin sample (in mg/L).
C o : Adsorbate concentration at the inlet of the column (in mg/L).
Equation (17) calculates the ratio between the areas under the breakthrough curves for each analyzed GAC sample and the GAC-Virgin sample. The result is expressed in percent with respect to the adsorbate removal capacity of the virgin GAC sample (CA (%)). Equation (17) utilizes the complete shape of the breakthrough curve (changes in the effluent concentration as well as the breakthrough time) for the estimation of the GAC removal capacity. The calculations for the numerical estimation of the area under the curve for each analyzed GAC sample were performed using the software packages Origin® 6.1 and MATLAB® 15 [14,20].

4. Results and Discussion

4.1. XRF Analysis

Only the contribution of inorganic cations and anions is monitored when measuring the EC of water from the hospital water treatment system. According to XRF results (see S.M., Section S3.2, Table S1), no significant differences in composition are found between GAC-Virgin and GAC-Used samples, except for the Cl, Ca, and Mg content, which differs as expected due to the HClO treatment. Additionally, XRF results do not show any evidence of precipitation or adsorption of inorganic components that could cause filter exhaustion.

4.2. Elemental Analysis (EA) Results

N, C, H and O contents for GAC layer samples and GAC-Virgin are depicted in Table 1a.
In the hospital water purification system, when the EC starts to fall out of range, trained technicians reorient the filter by turning it around. This procedure is feasible due to the filter’s small size and easy-to-manipulate mechanical characteristics, thereby extending its safe use. As a result of this practice, no significant differences in element concentrations between the GAC layers of the used filter are observed (Table 1a) [21,22].
Based on EA results, a clear increase in the oxygen content of the used GAC is observed, indicating significant oxidation. This increase in oxygen content is related to the deterioration and oxidation of the GAC as confirmed by an artificial long-term free chlorine-treated GAC-Virgin (GAC-VExh, Section 2.2) and is reported in Table 1b, demonstrating a 7% increase in oxygen content compared to GAC-Virgin and consistent with the EA results presented in Table 1a [14,20].
However, this does not mean that GAC-Used is exhausted. On the contrary, it can still effectively reduce chlorine and chloramines, providing high-quality water. This suggests that EC measurements alone do not accurately describe the exhaustion stage of the filter.
A drawback of the EA is that it renders the filter unusable for further patient treatment since sample collection was required.

4.3. XRA Method 1

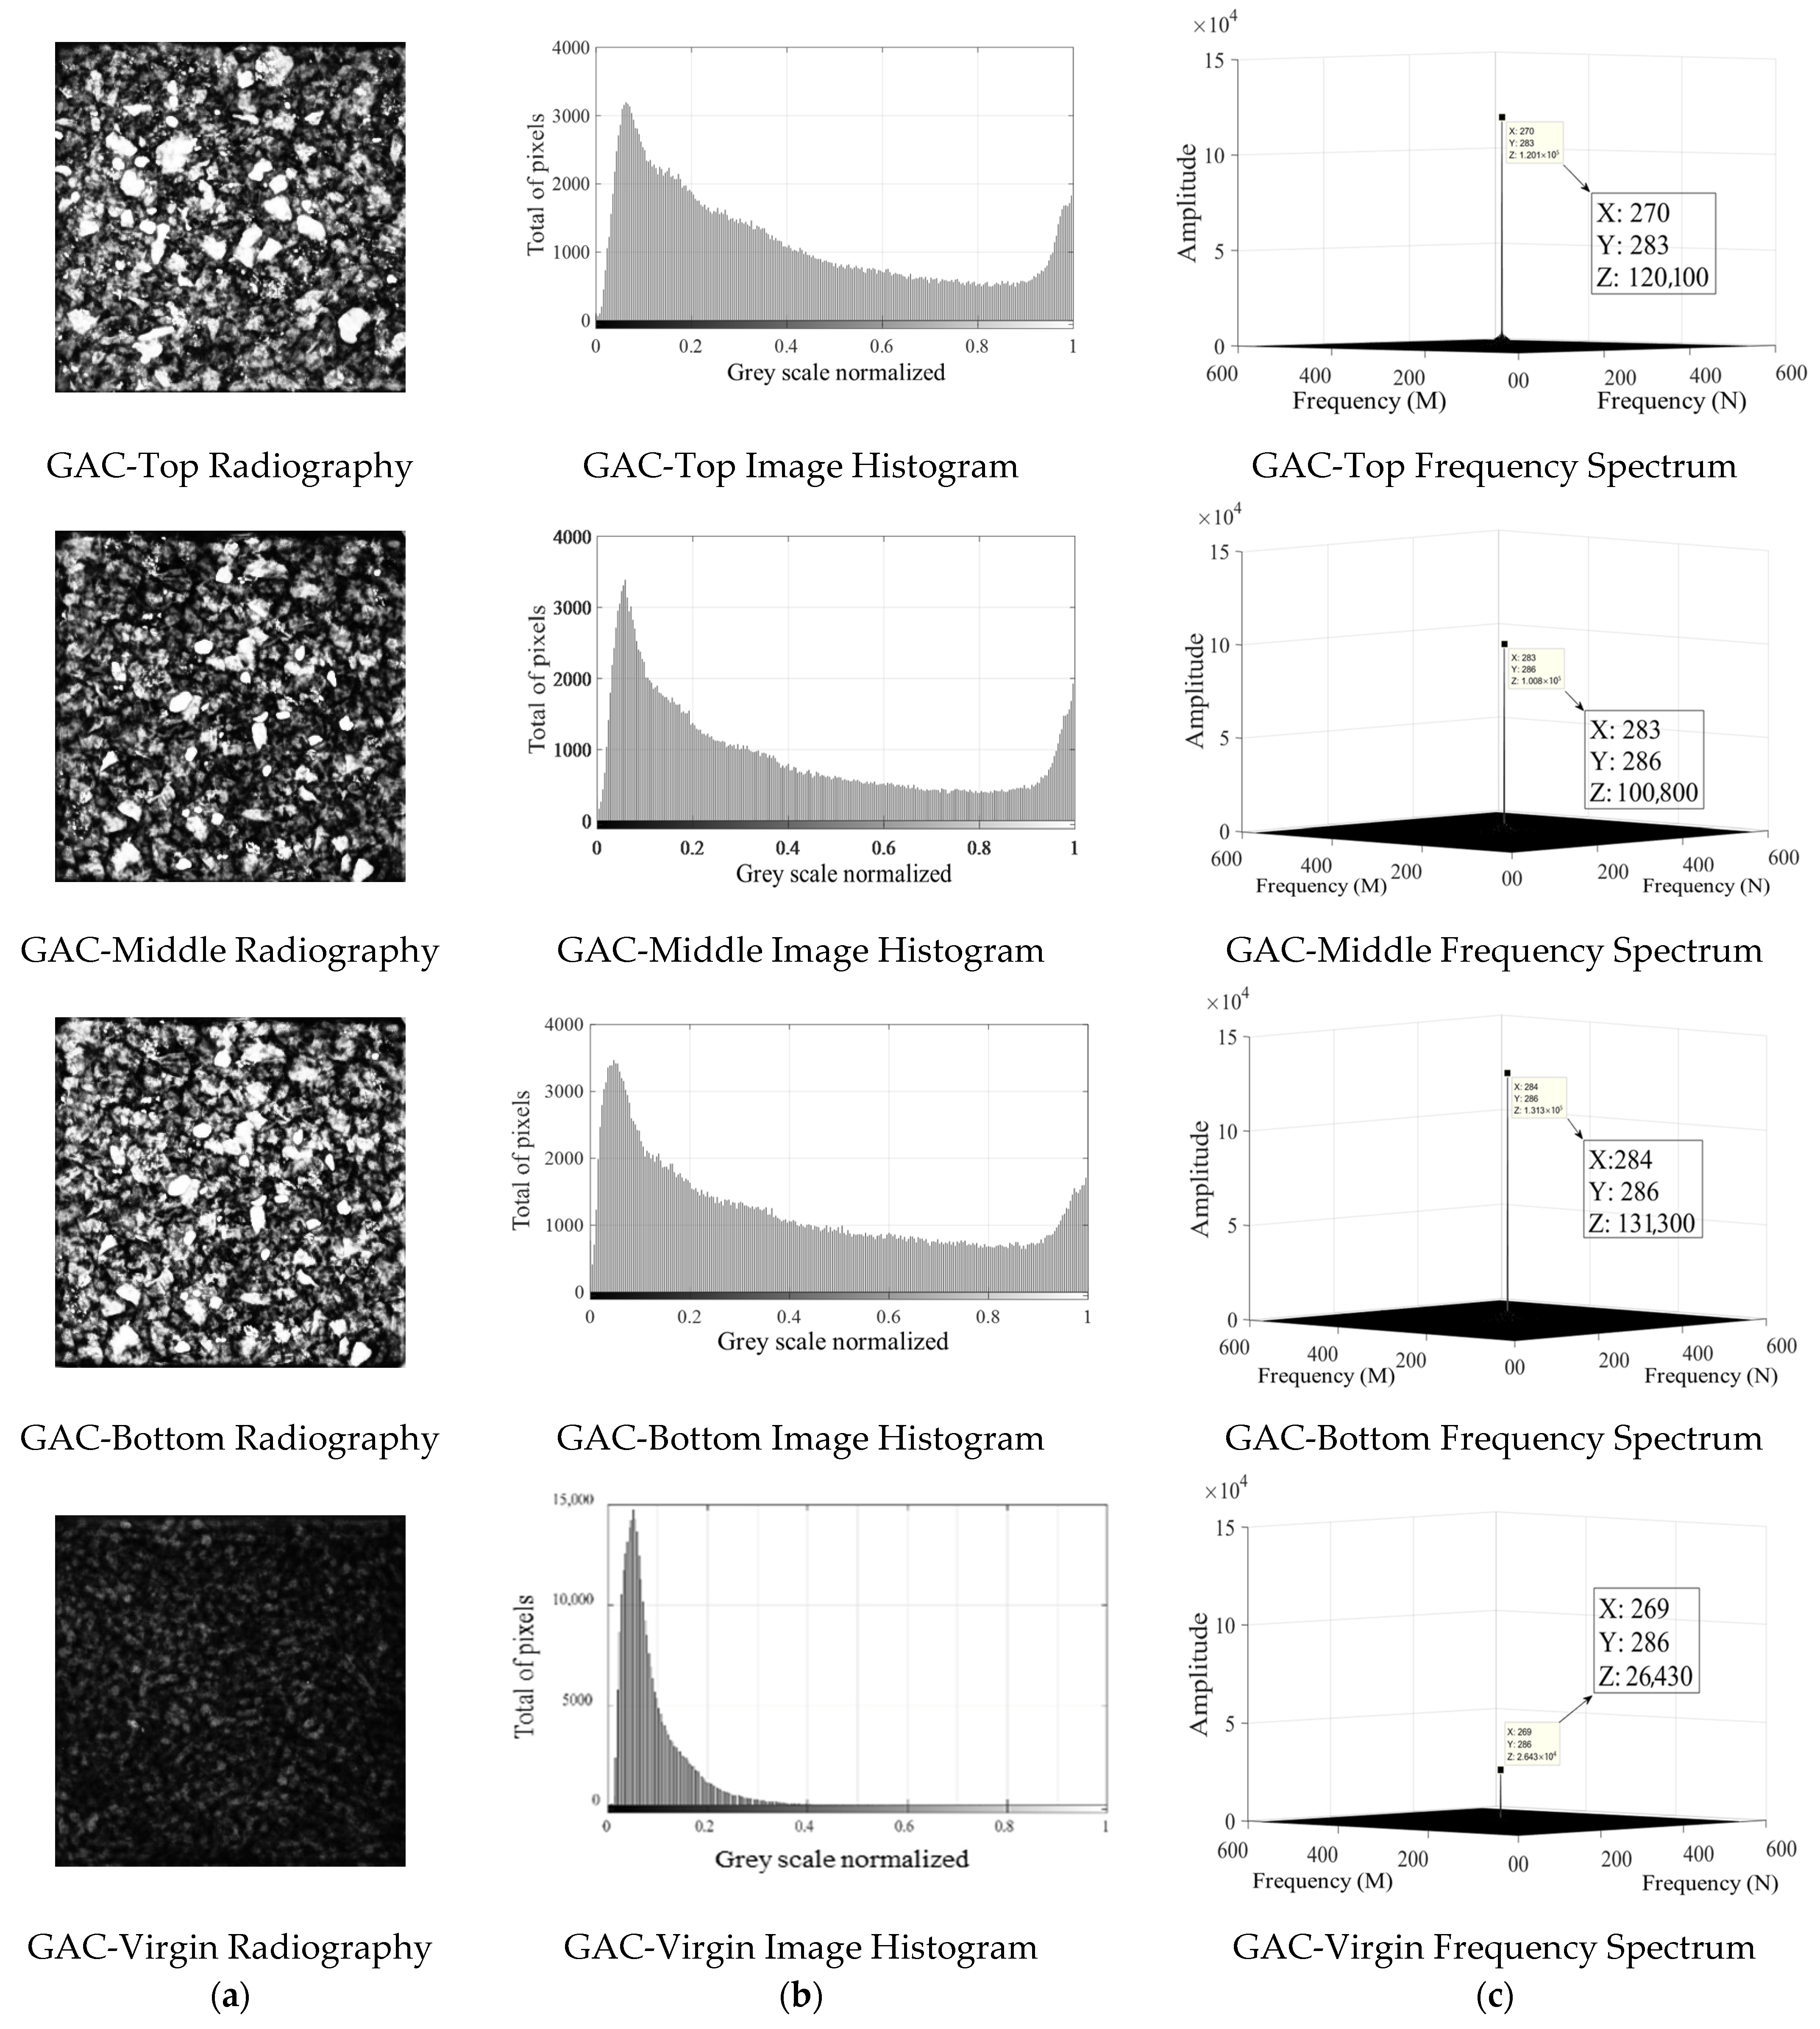
Figure 4 depicts XRA images of three sampled GAC-Used layers and GAC-Virgin as well as the image histograms and 2D-DFT frequency spectra for each analyzed image.
The digital images obtained using XRA method 1 show a grey-scale image where the GAC-Used layer samples with higher photonic absorption are closer to one in the normalized grey scale (whiter zones) and vice versa.
In Figure 4b, a quite similar pattern in the histograms from radiographic images of the different GAC-Used layer samples is observed, revealing a broad distribution of the number of pixels along the normalized grey scale. Image histograms from GAC-Top, GAC-Middle, and GAC-Bottom depict two characteristic peaks: the first displaced to the left in the normalized grey scale (GSI ≈ 0.08, closer to zero) and the second one closer to the right side of the normalized grey scale (GSI ≈ 0.99, closer to one), which is an indication of a higher photonic absorption process in comparison with GAC-Virgin [14,20].
GAC-Virgin depicts one single peak displaced to the left of the normalized grey scale (GSI ≈ 0.04) without the presence of high photonic absorption zones in the rest of the image histogram.
As GAC-Virgin has not yet been used, its photonic absorption is lower in comparison with the GAC-Used layer samples, thus producing a darker image. When analyzing the frequency spectra of obtained radiographic images (Figure 4c), similar patterns between the direct components of the 2D-DFT in samples from the used filter can be noticed. On the other hand, significant differences in amplitude are found between GAC-Virgin and the GAC-Used layer samples as the result of oxidation. However, obtained differences in the direct components of the 2D-DFT between GAC-Used layer samples from XRA method 1 are not related with differences in the exhaustion degree or oxidation degree between layers or differences in the filter last orientation as confirmed by TGA (S.M., Section S3.1), EA (Table 1a), XRF (S.M., Section S3.2), and SEM (S.M., Section S3.4) results. In addition, XRA method 1 requires sampling of the GAC-Used filter, which makes it unusable in the water treatment system.

4.4. XRA Method 2

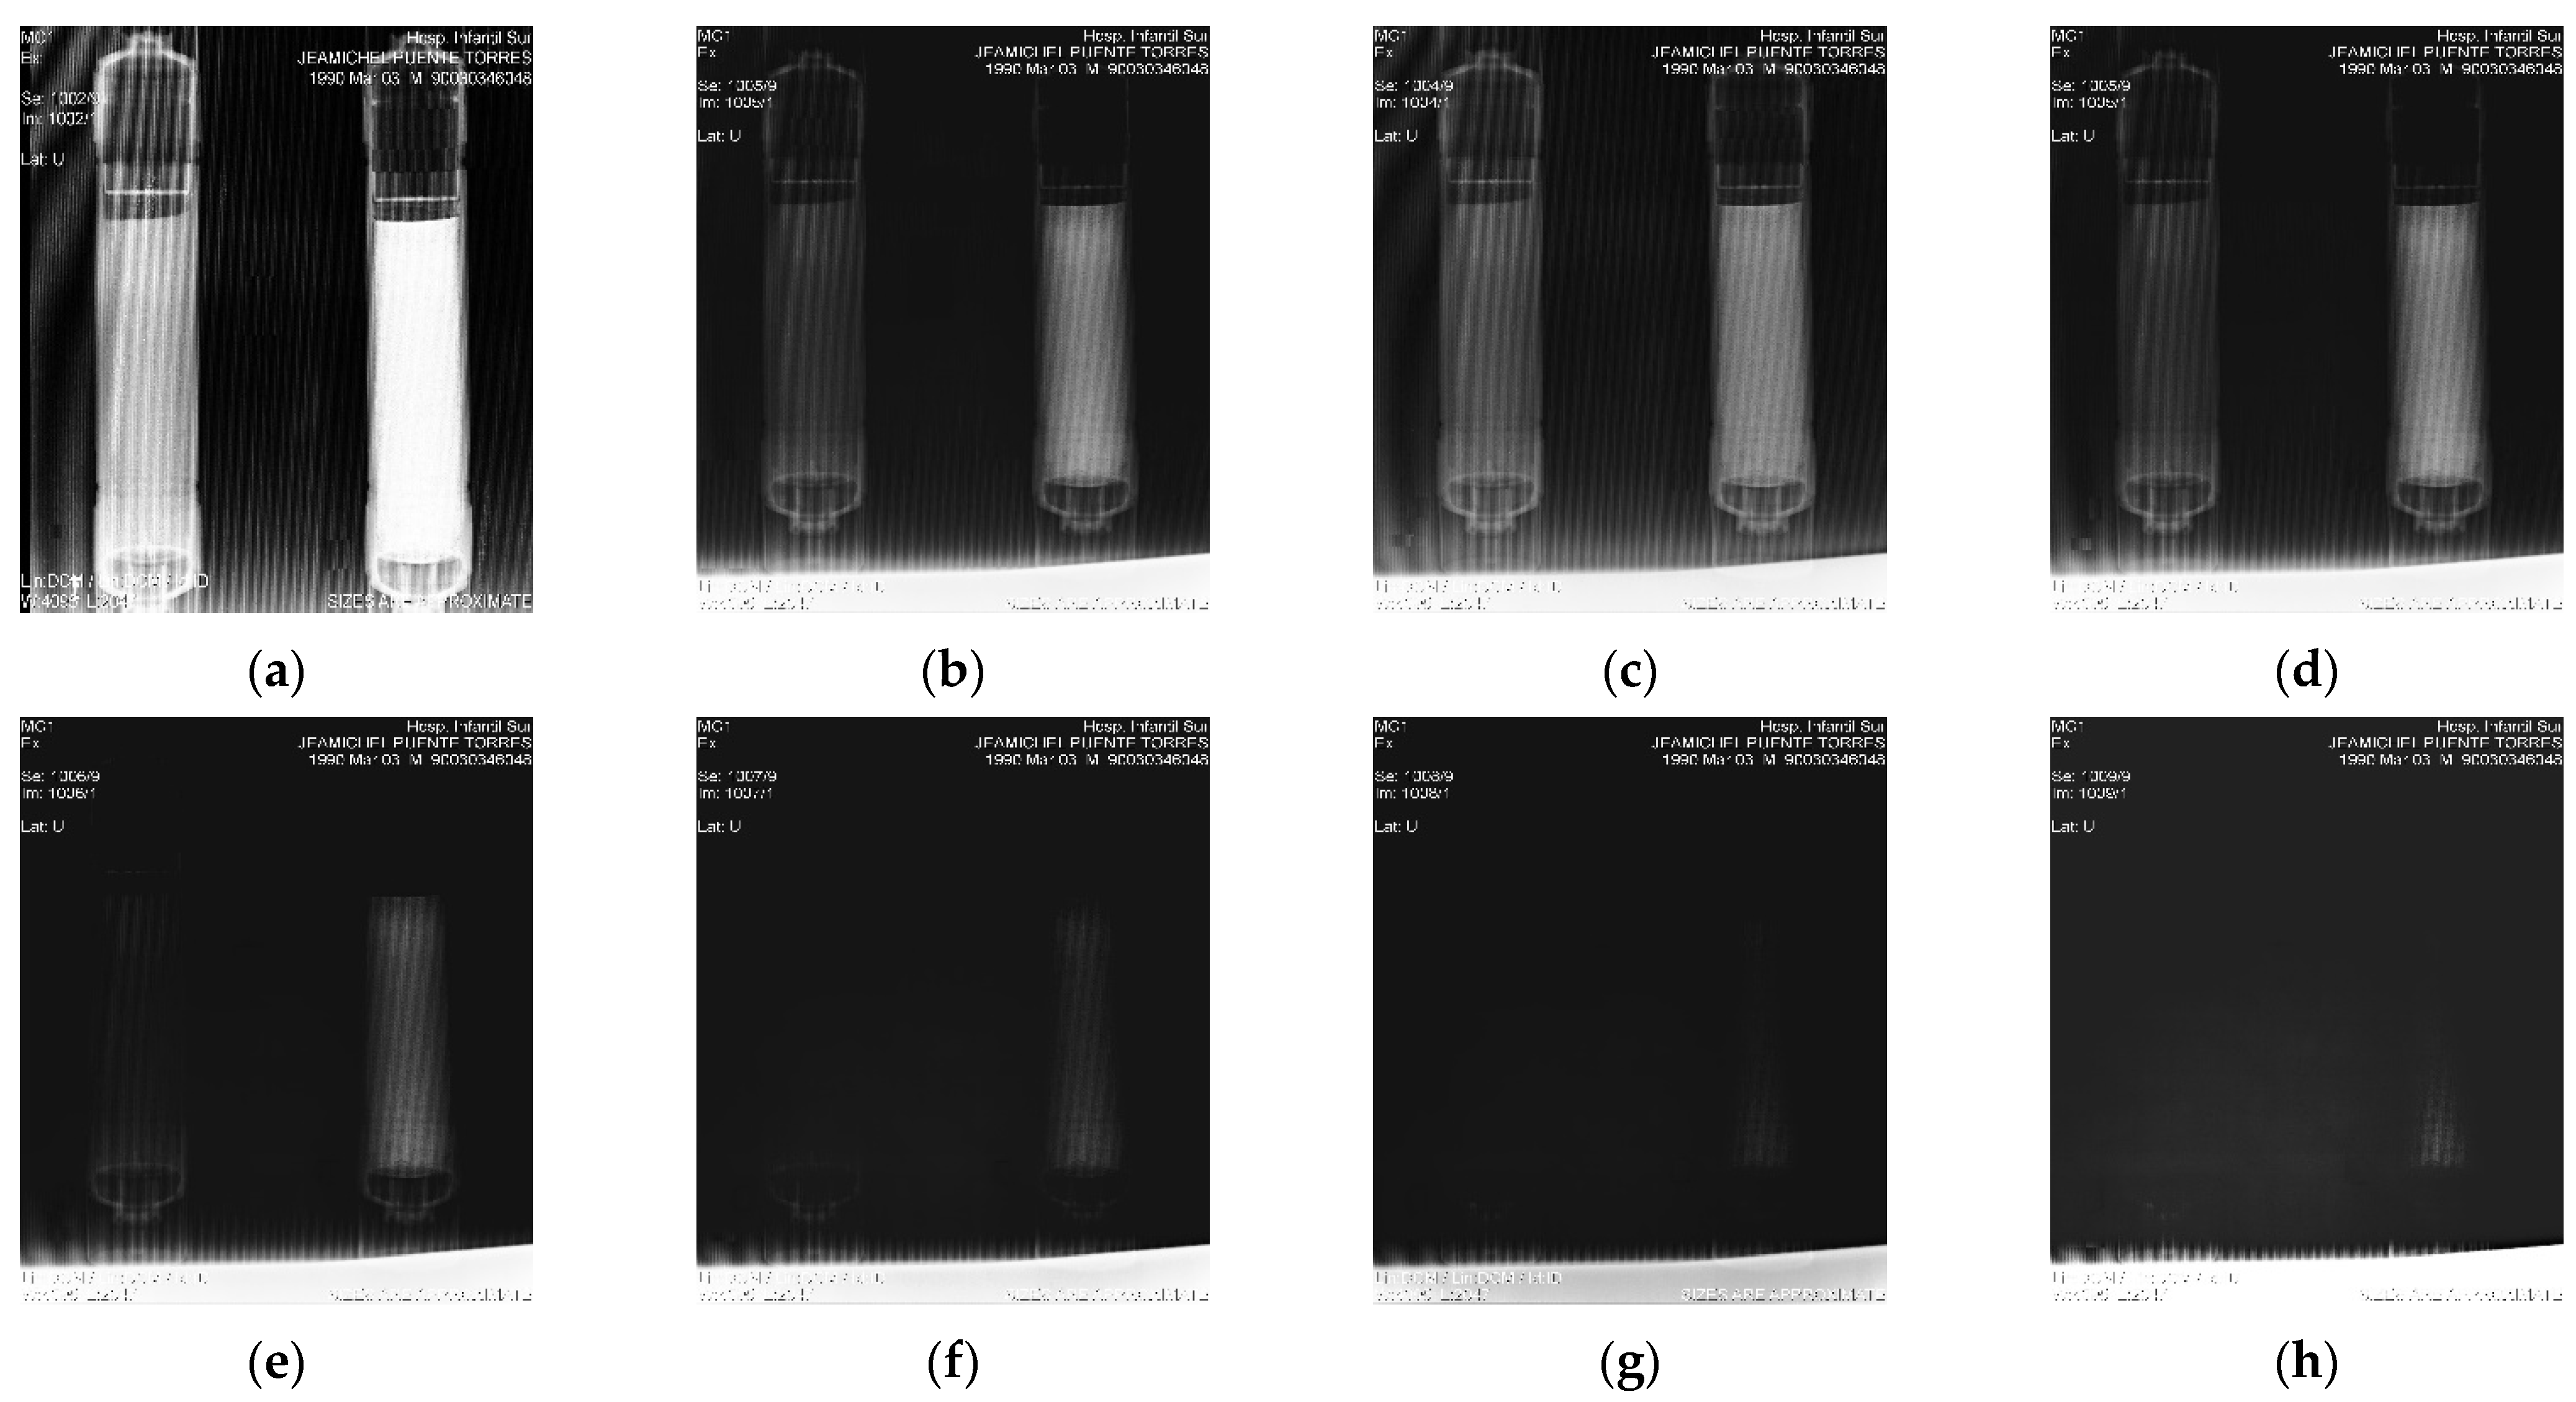
Figure 5 depicts XRA images from the entire GAC-Used filter (right side of each image) and an entire filter filled with GAC-Virgin (left side of each image) at different irradiation energies.
According to the proposed model (Equation (16)), the shape of the filter has a significant influence on the photonic absorption process, regardless of the exhaustion differences between filters. From Figure 5, significant differences in brightness (reflected in GSI levels) between GAC-Used and GAC-Virgin can be noticed. Again, no significant difference can be observed between layers in the used filter at lower energies, confirming the results obtained by TGA (S.M, Section S3.1), EA (Table 1), XRF (S.M., Section S3.2), SEM (S.M., Section S3.4), and XRA method 1.
Obtained differences in grey-scale intensity at different energies at the edges of the used filter (Figure 5) could be related with slight modifications in initial photonic intensity at the extremes of the filter (top and bottom). The same phenomena can also be observed in the GAC-Virgin filter between top and bottom layers in the energy range between 60 and 80 keV (not visible for GAC-Used).
In Figure 5a–h, the GAC-Used filter (right) presents more brightness in comparison with the GAC-Virgin (left) filter, indicating significant differences in photonic absorption between both cylindrical filters, which is related to a drastic change in elemental composition (Table 1), especially an increased oxygen content in GAC-Used.
The increased O content will change the effective Z value of the GAC matrix and therefore its photonic absorption. An increased O content can be considered as a measure of the oxidation degree of the GAC by the feed water. In addition, BET measurements (S.M., Section S3.3) point to a small decrease in the surface area of GAC-Used compared to GAC-Virgin.
SEM analysis (S.M., Section S3.4) revealed a smooth surface with small and medium cavities for GAC-Virgin. In contrast, deterioration of the GAC-Used layer samples is observed, confirming clear differences in porosity (Figure S4) as the result of oxidation by the feed water. According to Figure 5, a decrease in the brightness of GAC-Used and GAC-Virgin filters is noticed when the energy increases: an increase in energy causes a decrease in the grey-scale level obtained, due to a proportional increase in the penetration power of the incident photonic beam, making the differentiation by contrast very difficult (darker images) [14,20]. Some images (b–h) in Figure 5 appear to be rather identical, but this is partly misleading and certainly subjective. The difference between the different images (Figure 5) becomes only clear from a numerical point of view when analyzing the images using the dedicated XRA software (see Section 2.3.2). Hereafter, a correct conclusion can be made
Obtained GSI values from XRA method 2 were correlated with apothem (a) variations in both GAC-Used and GAC-Virgin filters, specifically for irradiation energies within the range of 50 keV to 80 keV. For all selected energies, an initial photonic intensity of 40 mAs was applied in all experiments. Table 2 presents the GSI (a), (S) values (see Figure 3), and the energy applied for each filter. At lower energies (40 keV), the penetrating power decreases, and only a few photons reach the detector, resulting in XRA images with very high brightness values (see Figure 5a). Below 40KeV and from 80 keV, the produced XRA images exhibit very low brightness values for both filters (see Figure 5f–g). Consequently, the difference in GSI values between the two filters is not significant at these low and high energy levels, and, thus, the results are omitted in Table 2.
According to Table 2, GSI values depict a decreasing trend from the centre of both filters to the extreme edge.
In order to discuss the results of Table 2 in more detail and more clearly, Figure S5 is included in S.M., depicting the correlation between the GSI values (from XRA method 2) and the apothem ( a ) variations for both GAC filters.
The correlation parameters between GSI values obtained applying XRA method 2 and apothem variations in the GAC-Used filter ( G S I U s e d ) and the GAC-Virgin ( G S I V i r g i n ) filter are presented in Table 3.
According to Table 3, strong correlation coefficients, reaching a 99% goodness of fit, can be found between GSI and (a) when an optimal energy of 70 keV (40 mAs) for the incident photonic beam is used. Acceptable correlation coefficients between GSI and (a) are observed at 50 keV, 60 keV, and 80 keV for both the GAC-Used filter and the GAC-Virgin filter (except for the GAC-Virgin filter at 80 keV).
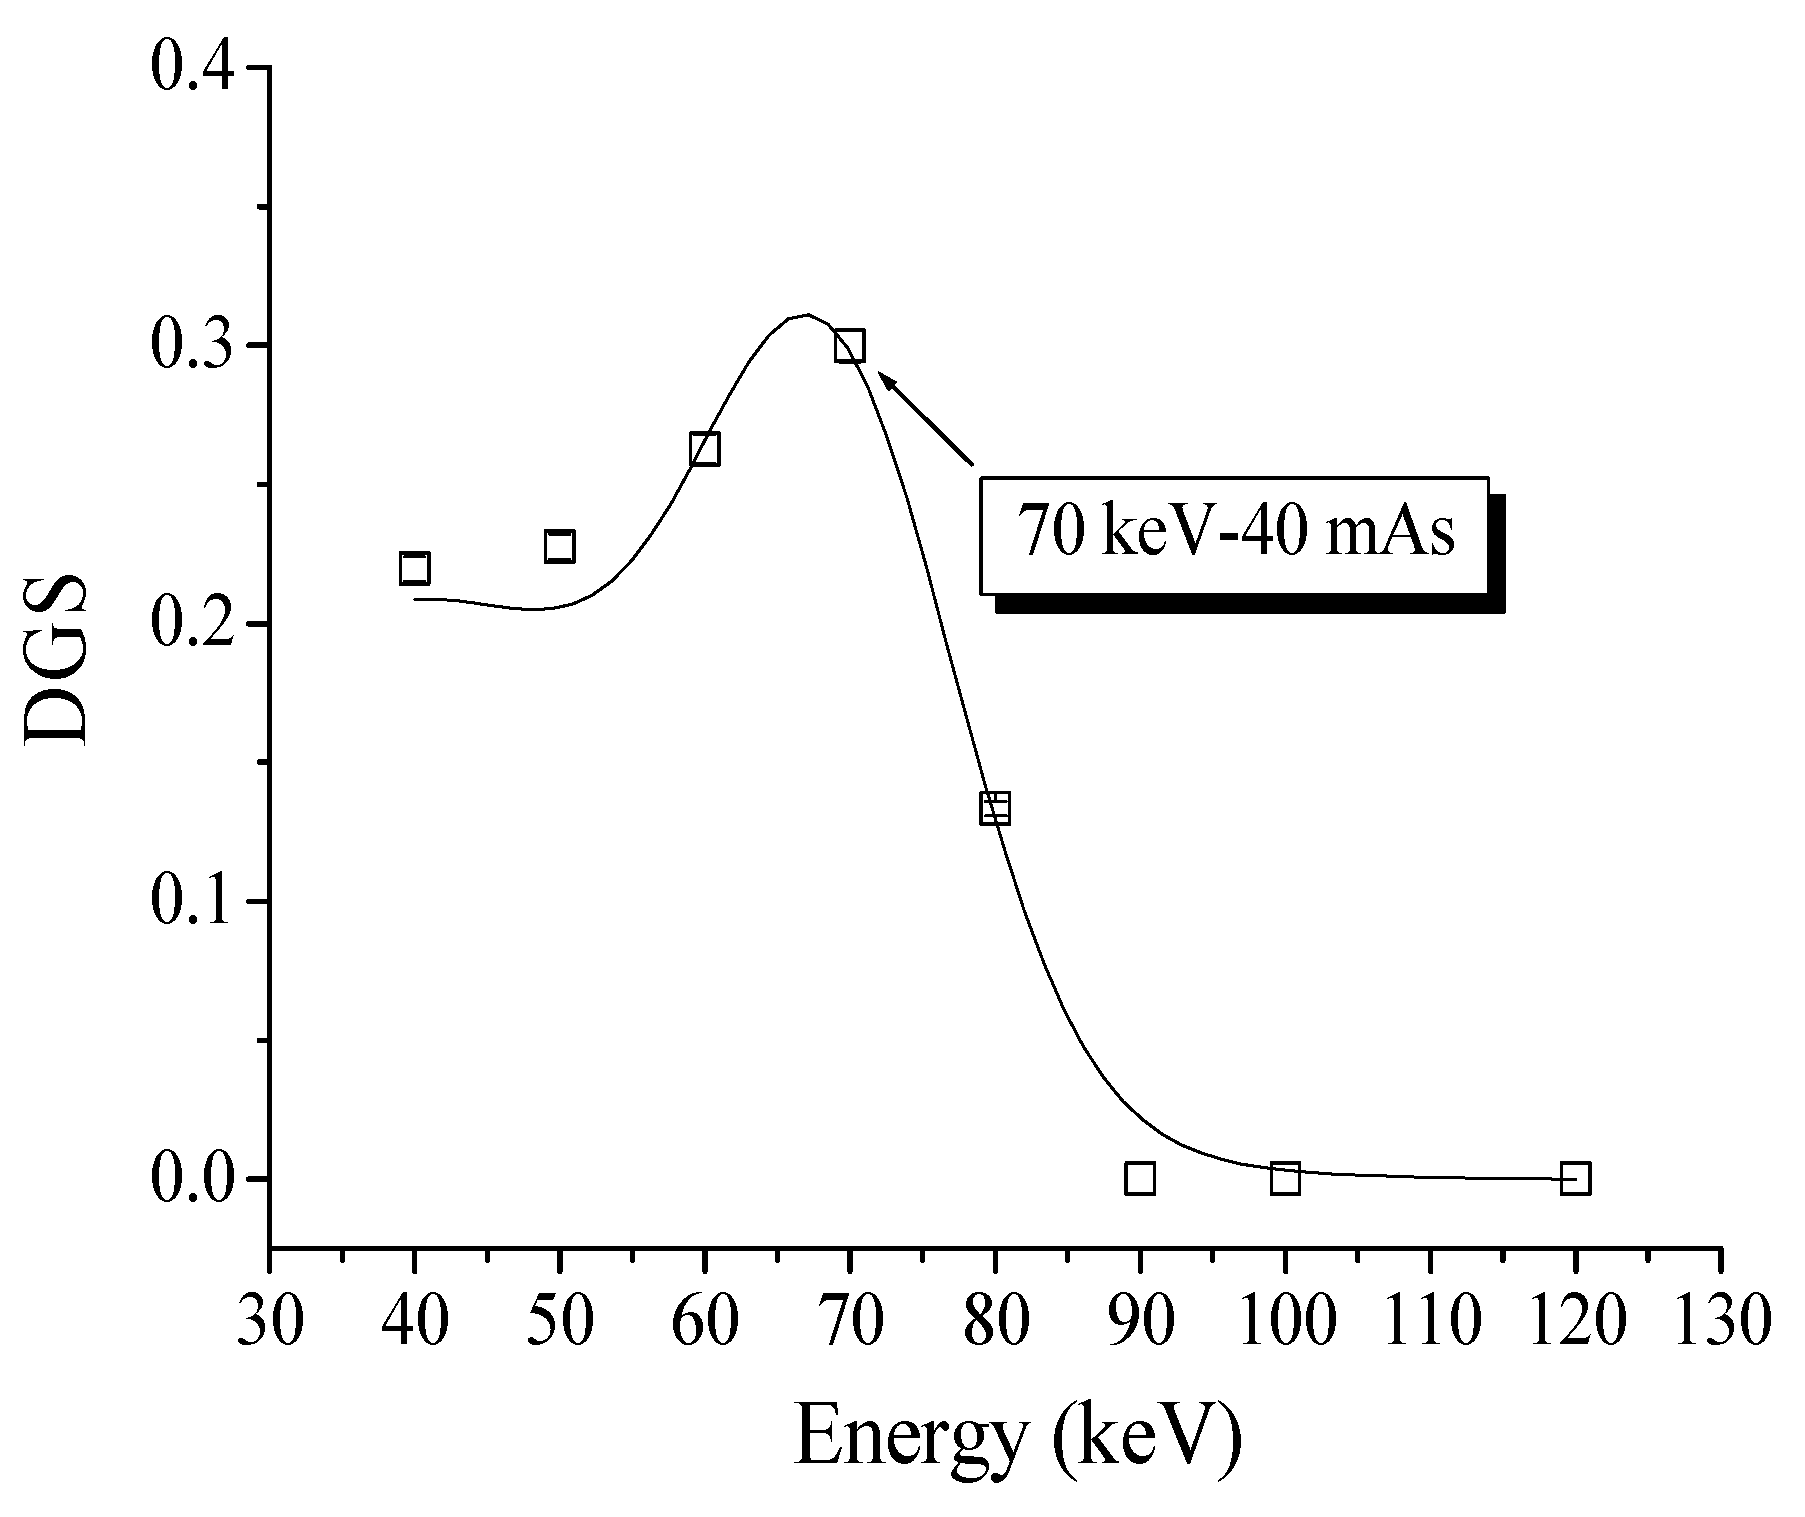
Figure 6 shows the differences in grey-scale intensity (DGS) values calculated for each irradiation energy to determine the maximum DGS value between extreme samples to optimize the irradiation energy and sample thickness, achieving the best possible sensitivity for XRA method 2.
From Figure 6, the maximum DGS value around 0.3 was obtained at 70 keV-40 mAs. It can be concluded based on Equation (16) that the higher the diameter of the cylindrical filter to be analyzed, the higher the energy needed to achieve proper sensitivity values using XRA method 2.
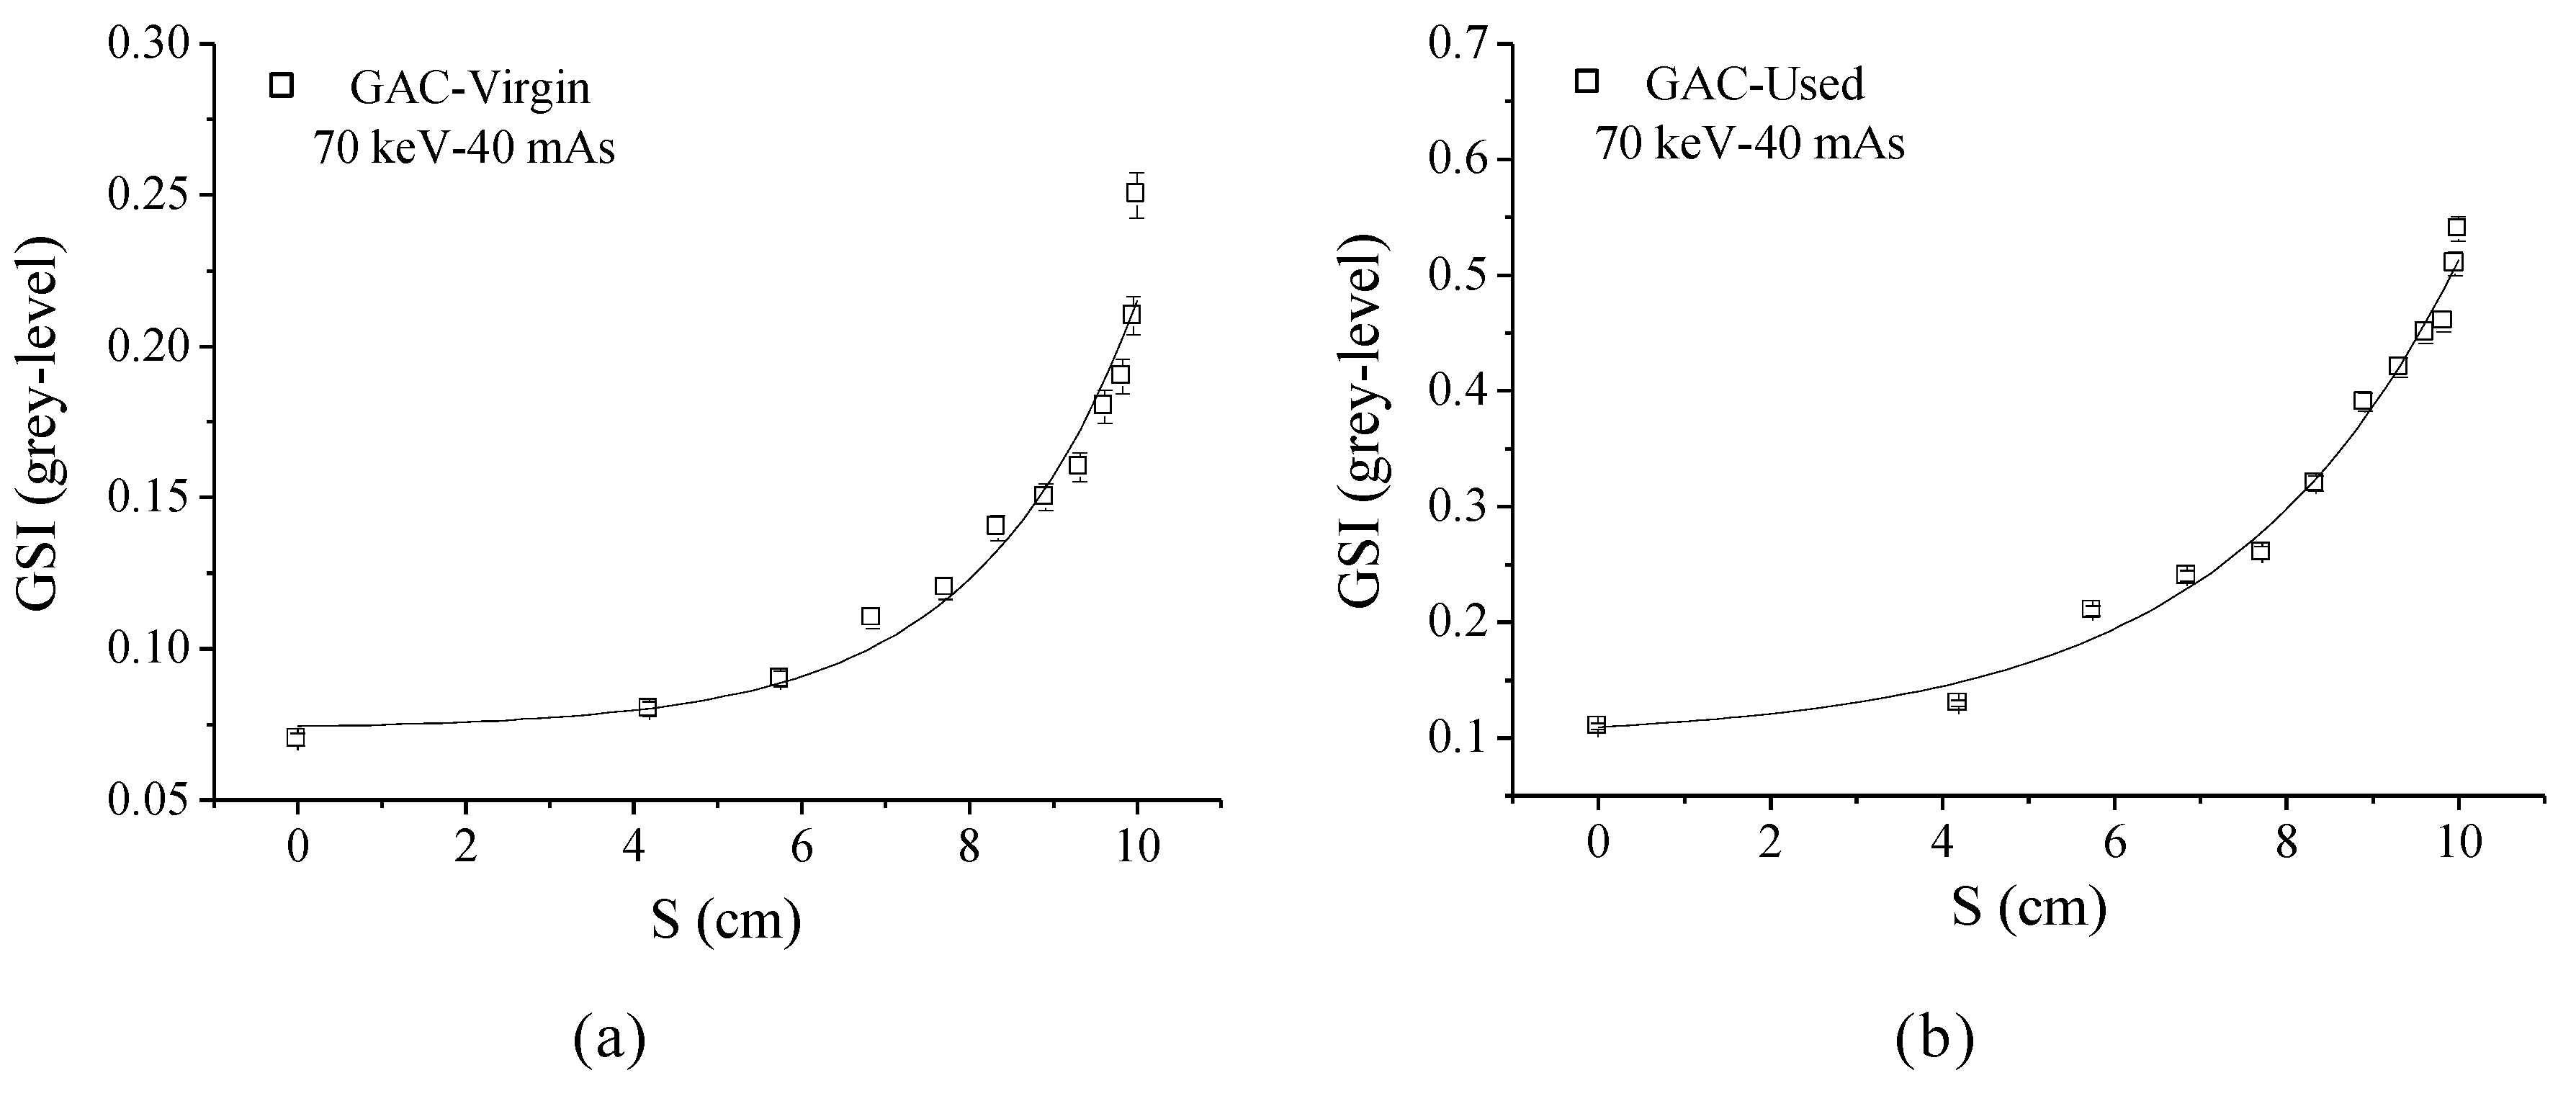
In order to evaluate the effectiveness of the XRA method 2 for the description of the photonic absorption process, correlation plots between GSI and S   are displayed in Figure 7 for the GAC-Used and the GAC-Virgin filters using the optimal experimental conditions (70 keV-40 mAs).
Table 4 shows the fitting correlation parameters between GSI and S found for both filters at an irradiation energy of 70 keV-40 mAs with very good regression coefficients (R2) of approximately 99%.
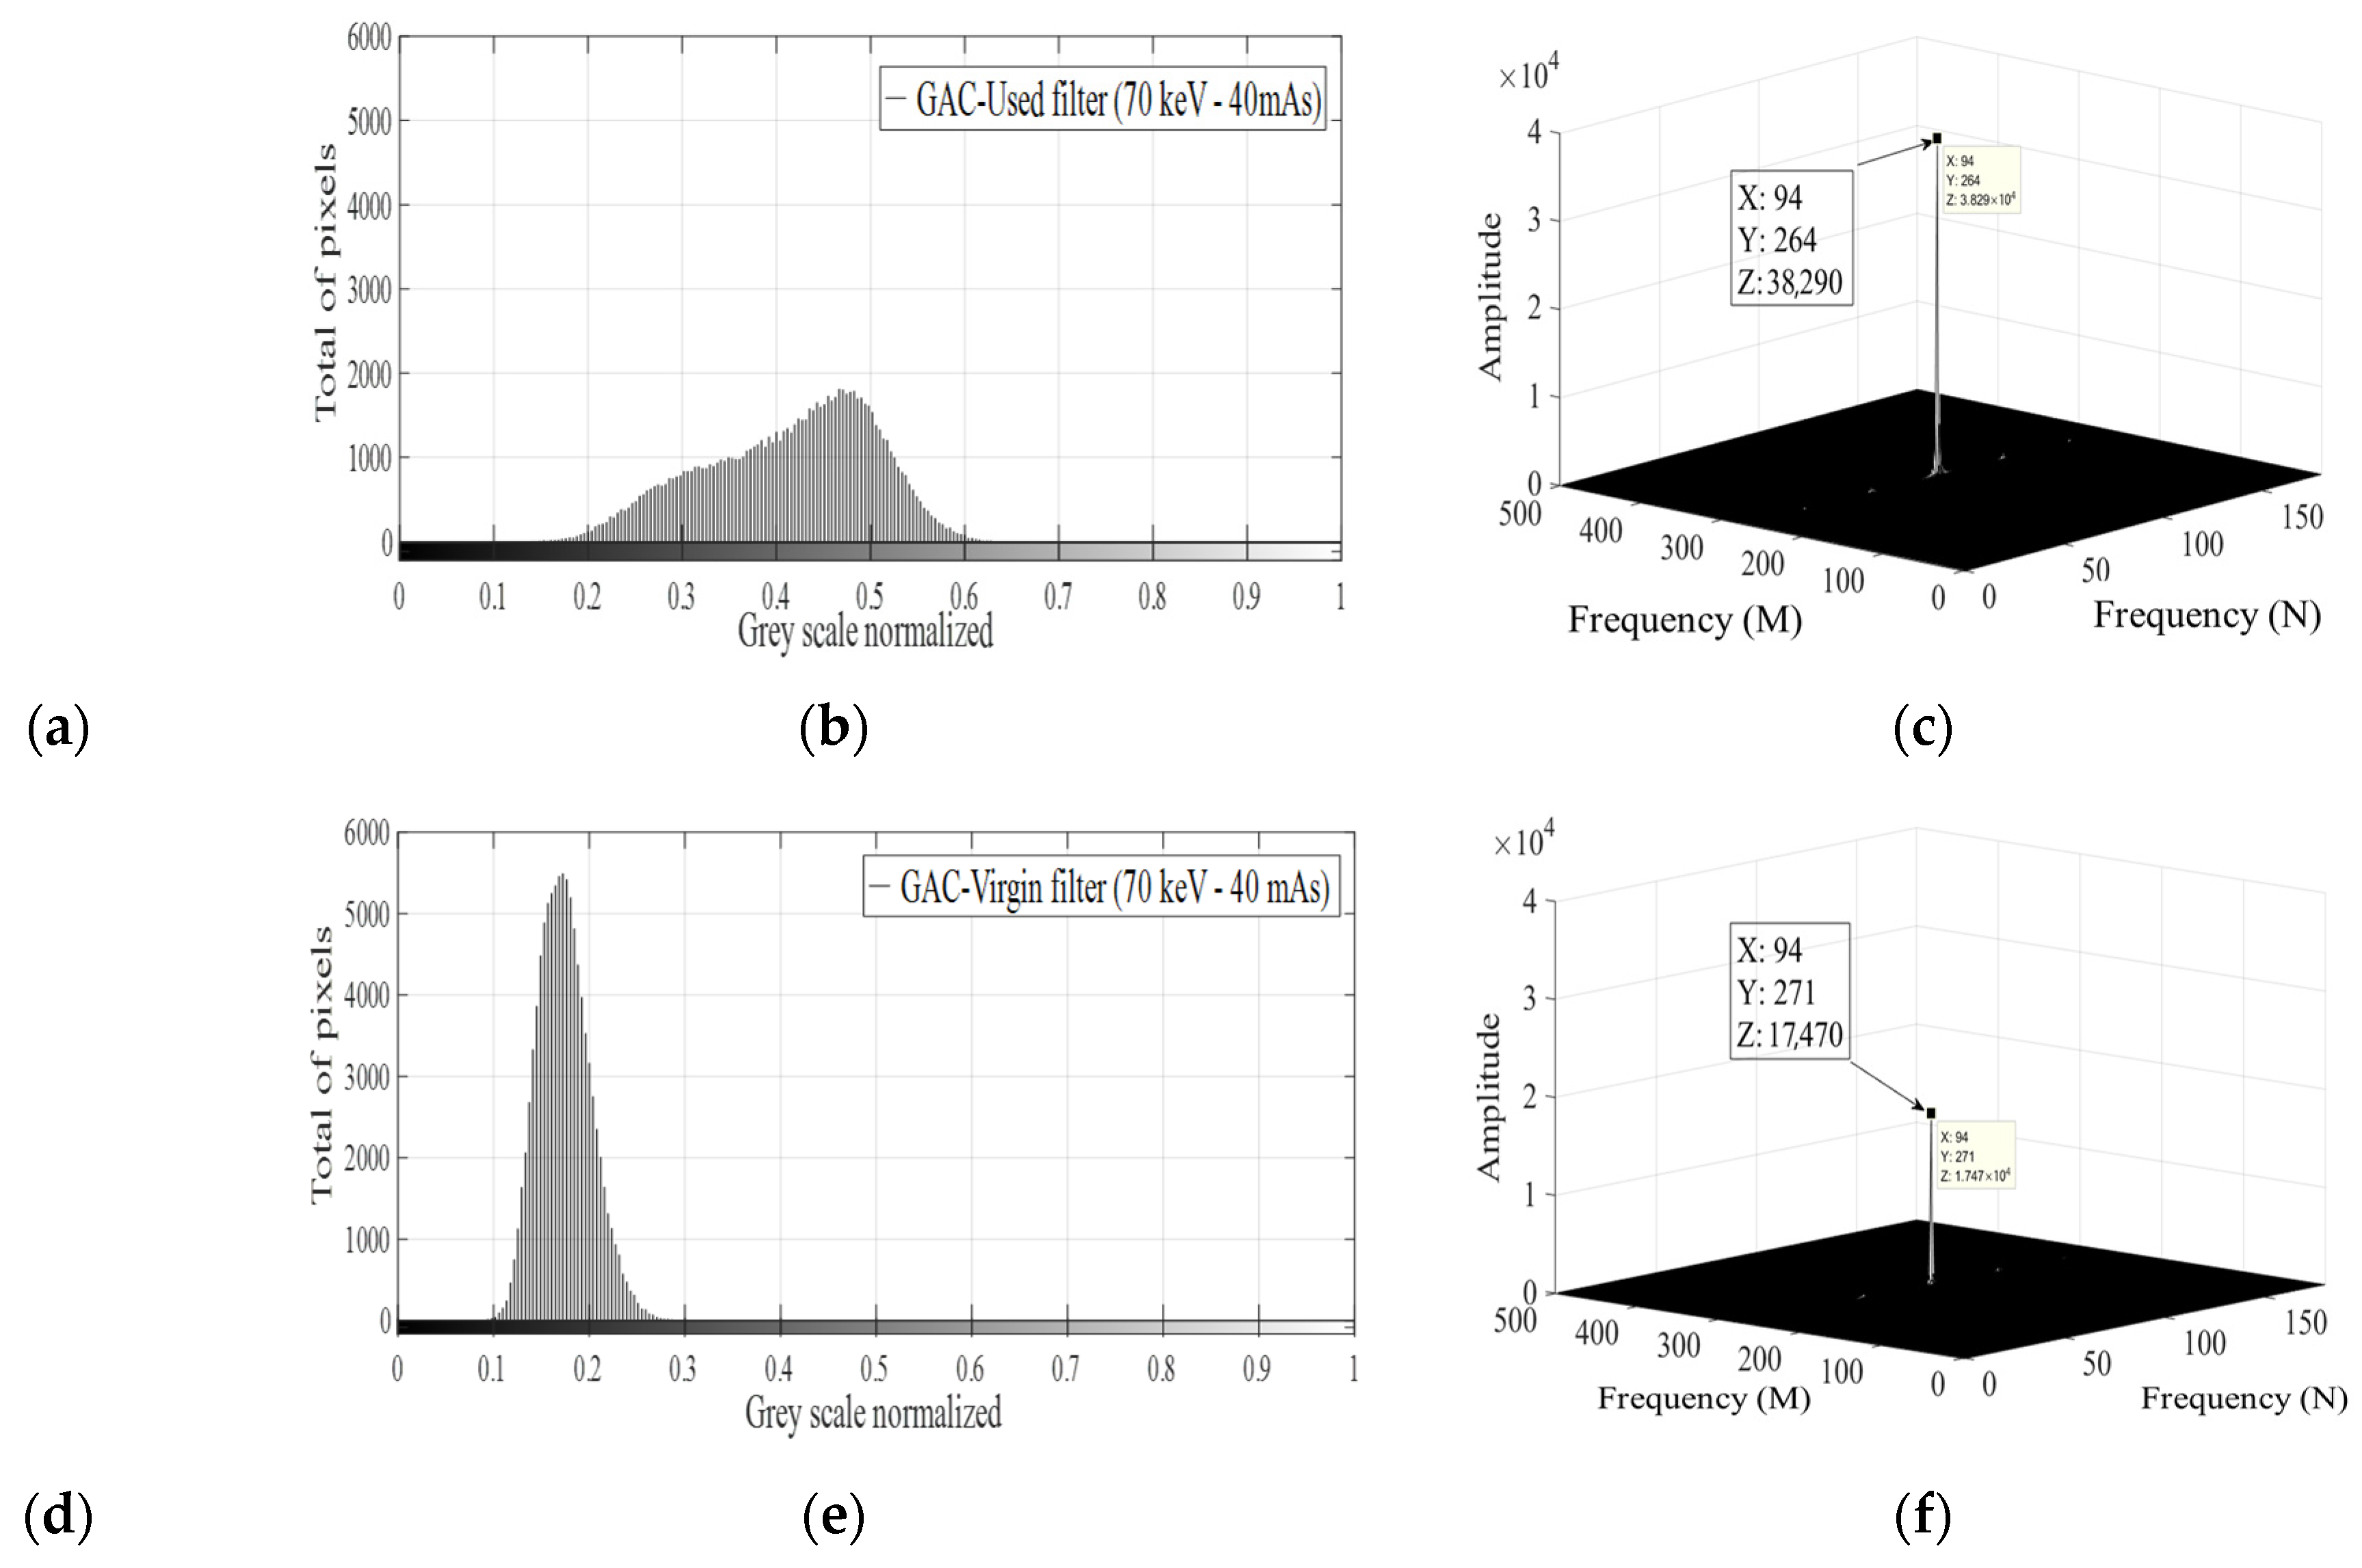
Figure 7a,b demonstrate that almost all the photons are absorbed at the centre of the filter when the S parameter maximizes, producing higher GSI values in the normalized grey scale. Figure 8 depicts XRA images, the image histogram, and frequency spectra from the entire GAC-Used and GAC-Virgin filter when applying XRA method 2.
From Figure 8, significant differences can be noticed between image histograms and frequency spectra from the GAC-Used filter and GAC-Virgin filter. The image histogram from the GAC-Used filter (Figure 8b) depicts a broad peak of a relative low number of pixels around 0.45 in the normalized grey scale, consistent with a higher photonic absorption process in this filter and therefore a higher GSI value in comparison with the GAC-Virgin filter.
On the other hand, the image histogram from the GAC-Virgin filter (Figure 8e) shows a narrow peak with a maximum number of pixels around 0.18 in the normalized grey scale consistent with a lower photonic absorption process for this filter, showing relatively lower GSI values (closer to ¨0¨). The direct component of the frequency spectra (2D-DFT) of both filters reinforces the obtained results from image histograms, showing a significant higher peak for the GAC-Used filter in comparison with the GAC-Virgin filter.
While XRA method 1 yields similar results and conclusions (see Figure 4), the novel non-invasive XRA method 2 was developed to provide more detailed information about the oxidation state of the entire filter without the need for time-consuming and destructive sampling, unlike XRA method 1, which requires extensive damage to the filter for sampling, making it unusable in the water treatment system.
In addition, XRA method 2 preserves the integrity of the filter, allowing it to remain in use. This significant advantage enables comprehensive insights into the filter’s condition, as demonstrated by the distinct GSI values between GAC-Used and GAC-Virgin filters, correlating with their oxidation and deterioration levels.
Therefore, the development of XRA method 2 addresses the limitations of XRA method 1 by eliminating the need for invasive sampling, which can be labour-intensive and disruptive. This new method allows for continuous, real-time monitoring of the GAC filter’s performance throughout its operational life in a hospital-grade water treatment unit. By accurately determining the oxidation and deterioration degree of GACs, in other words, its exhaustion degree, XRA method 2 provides a reliable and efficient alternative for ensuring optimal filter performance and longevity.

4.5. Relation Between XRA Method 2 and the GAC Free Chlorine Removal Capacity

Breakthrough curves from the GAC-Used filter were analyzed to gather information about the free chlorine removal capacity of the GAC sample using scaled columns. GAC-VExh provides a controlled reference point for comparison with GAC-UExh from the hospital setting (Section 2.2). This comparison is crucial for validating the effectiveness of XRA method 2, correlating the obtained data from breakthrough curves with the actual oxidation and deterioration states of the GAC filters, and estimating their remaining lifespan [21,22].
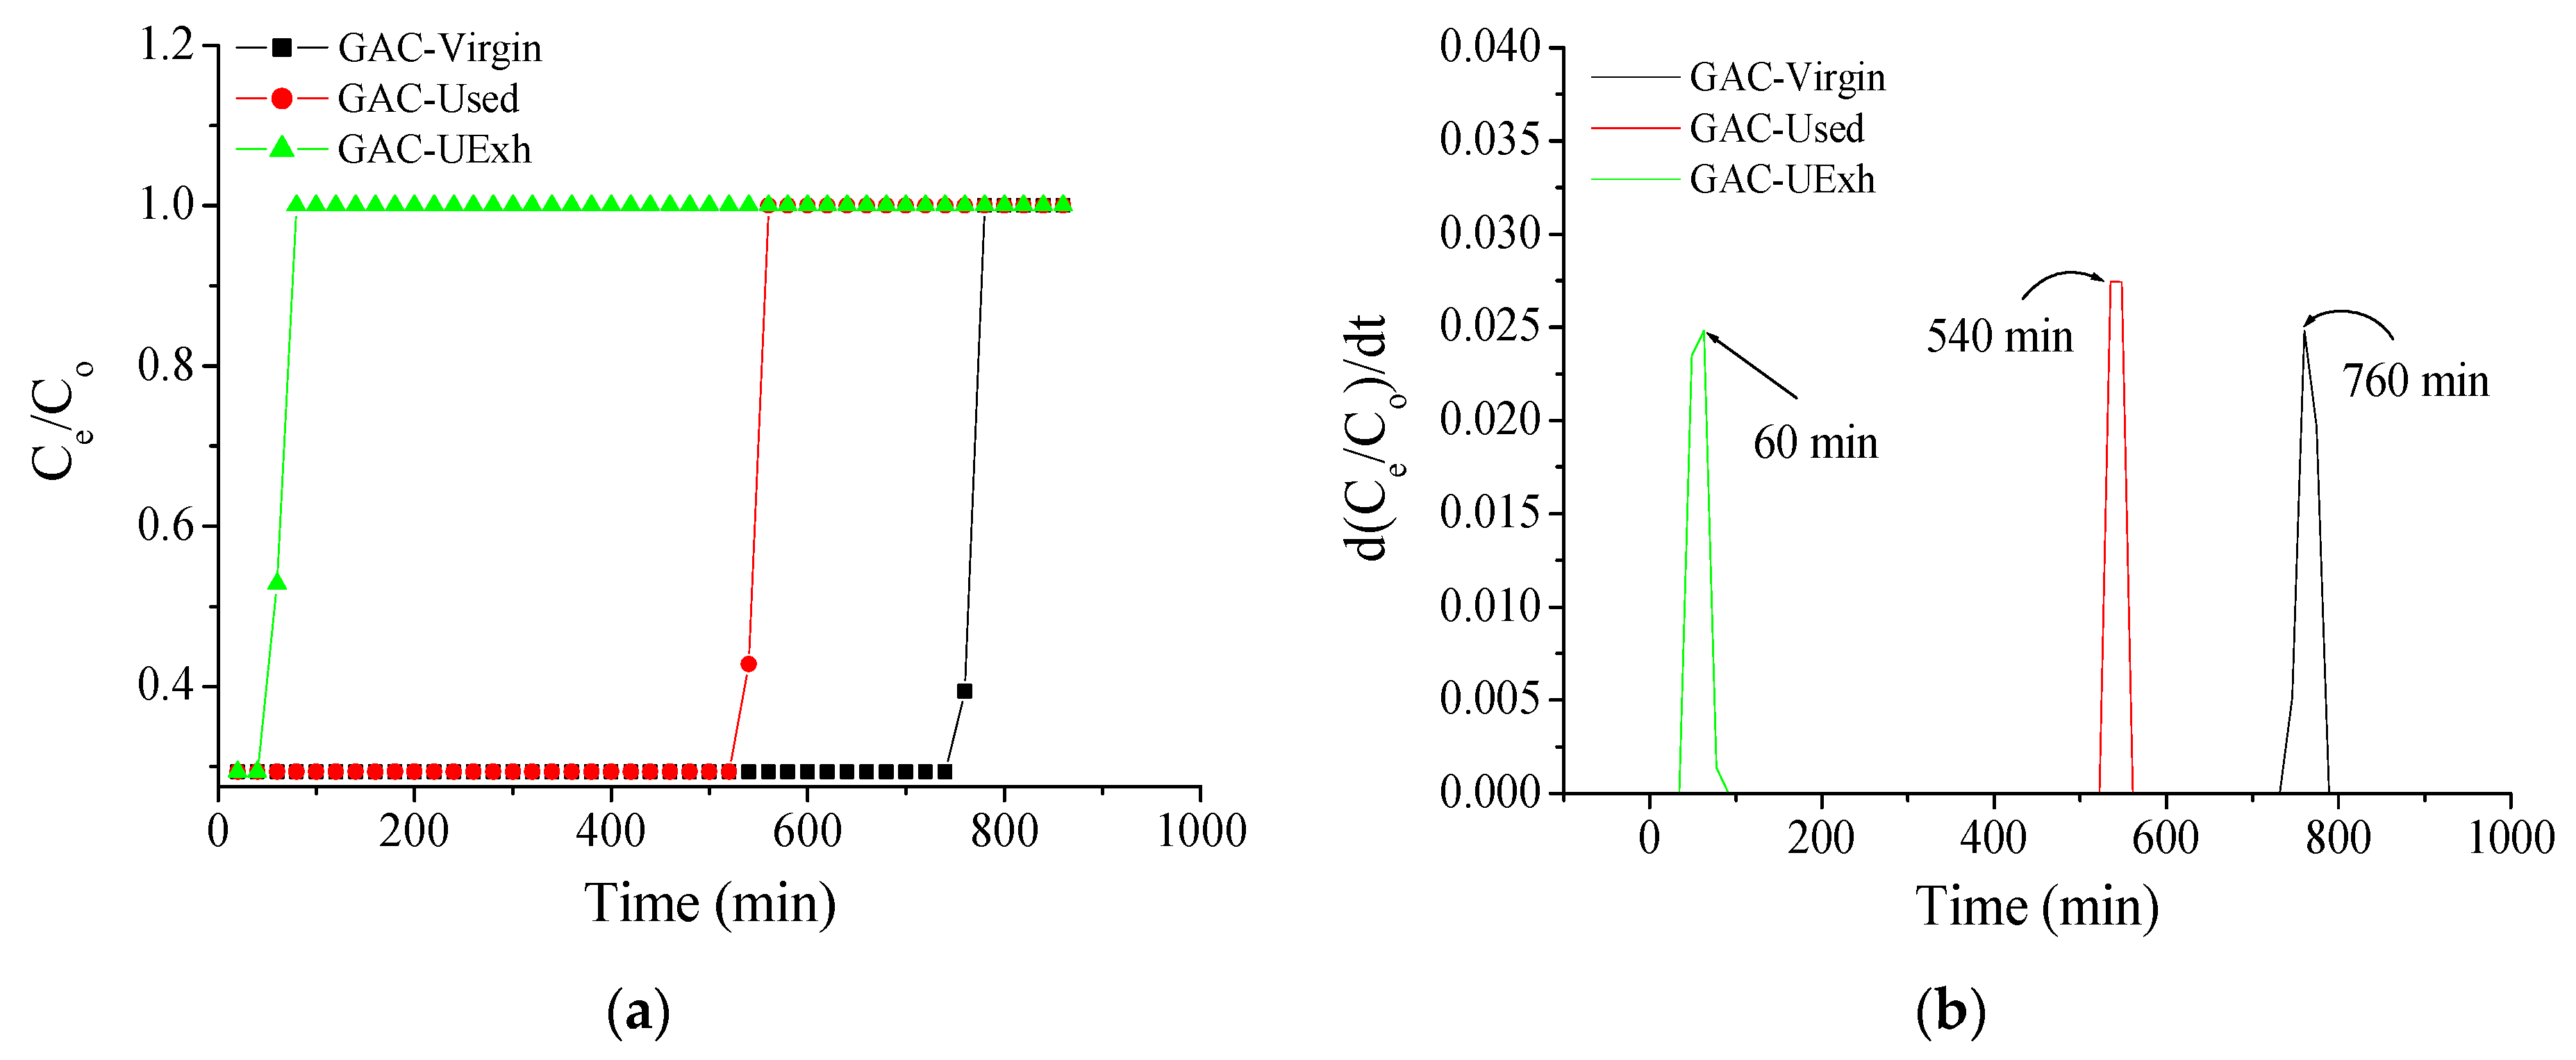
Figure 9a,b depict obtained breakthrough curves as well as the breakthrough times for the GAC-Virgin filter, GAC-Used filter, and GAC-UExh filter after the free chlorine removal experiments until saturation of GAC-Used.
The area under the breakthrough curves was used as a numeric indicator of the GAC filter free chlorine removal capacity using Equation (17). The breakthrough time used as reference for determining the exhaustion level for the GAC-Virgin filter was approximately 760 min. From Figure 9a,b, significant differences in free chlorine removal capacity between analyzed GAC filters can be noticed with the following ranking: GAC-Virgin > GAC-Used > GAC-UExh. For the GAC-Used filter, it must be pointed out that the exhaustion level was only determined based on EC measurements in the hospital water purification system being not the optimal method since it is still effective in free chlorine removal.
Table 5 reports the calculated values of the area under the breakthrough curves and the free chlorine removal capacity according to Equation (17).
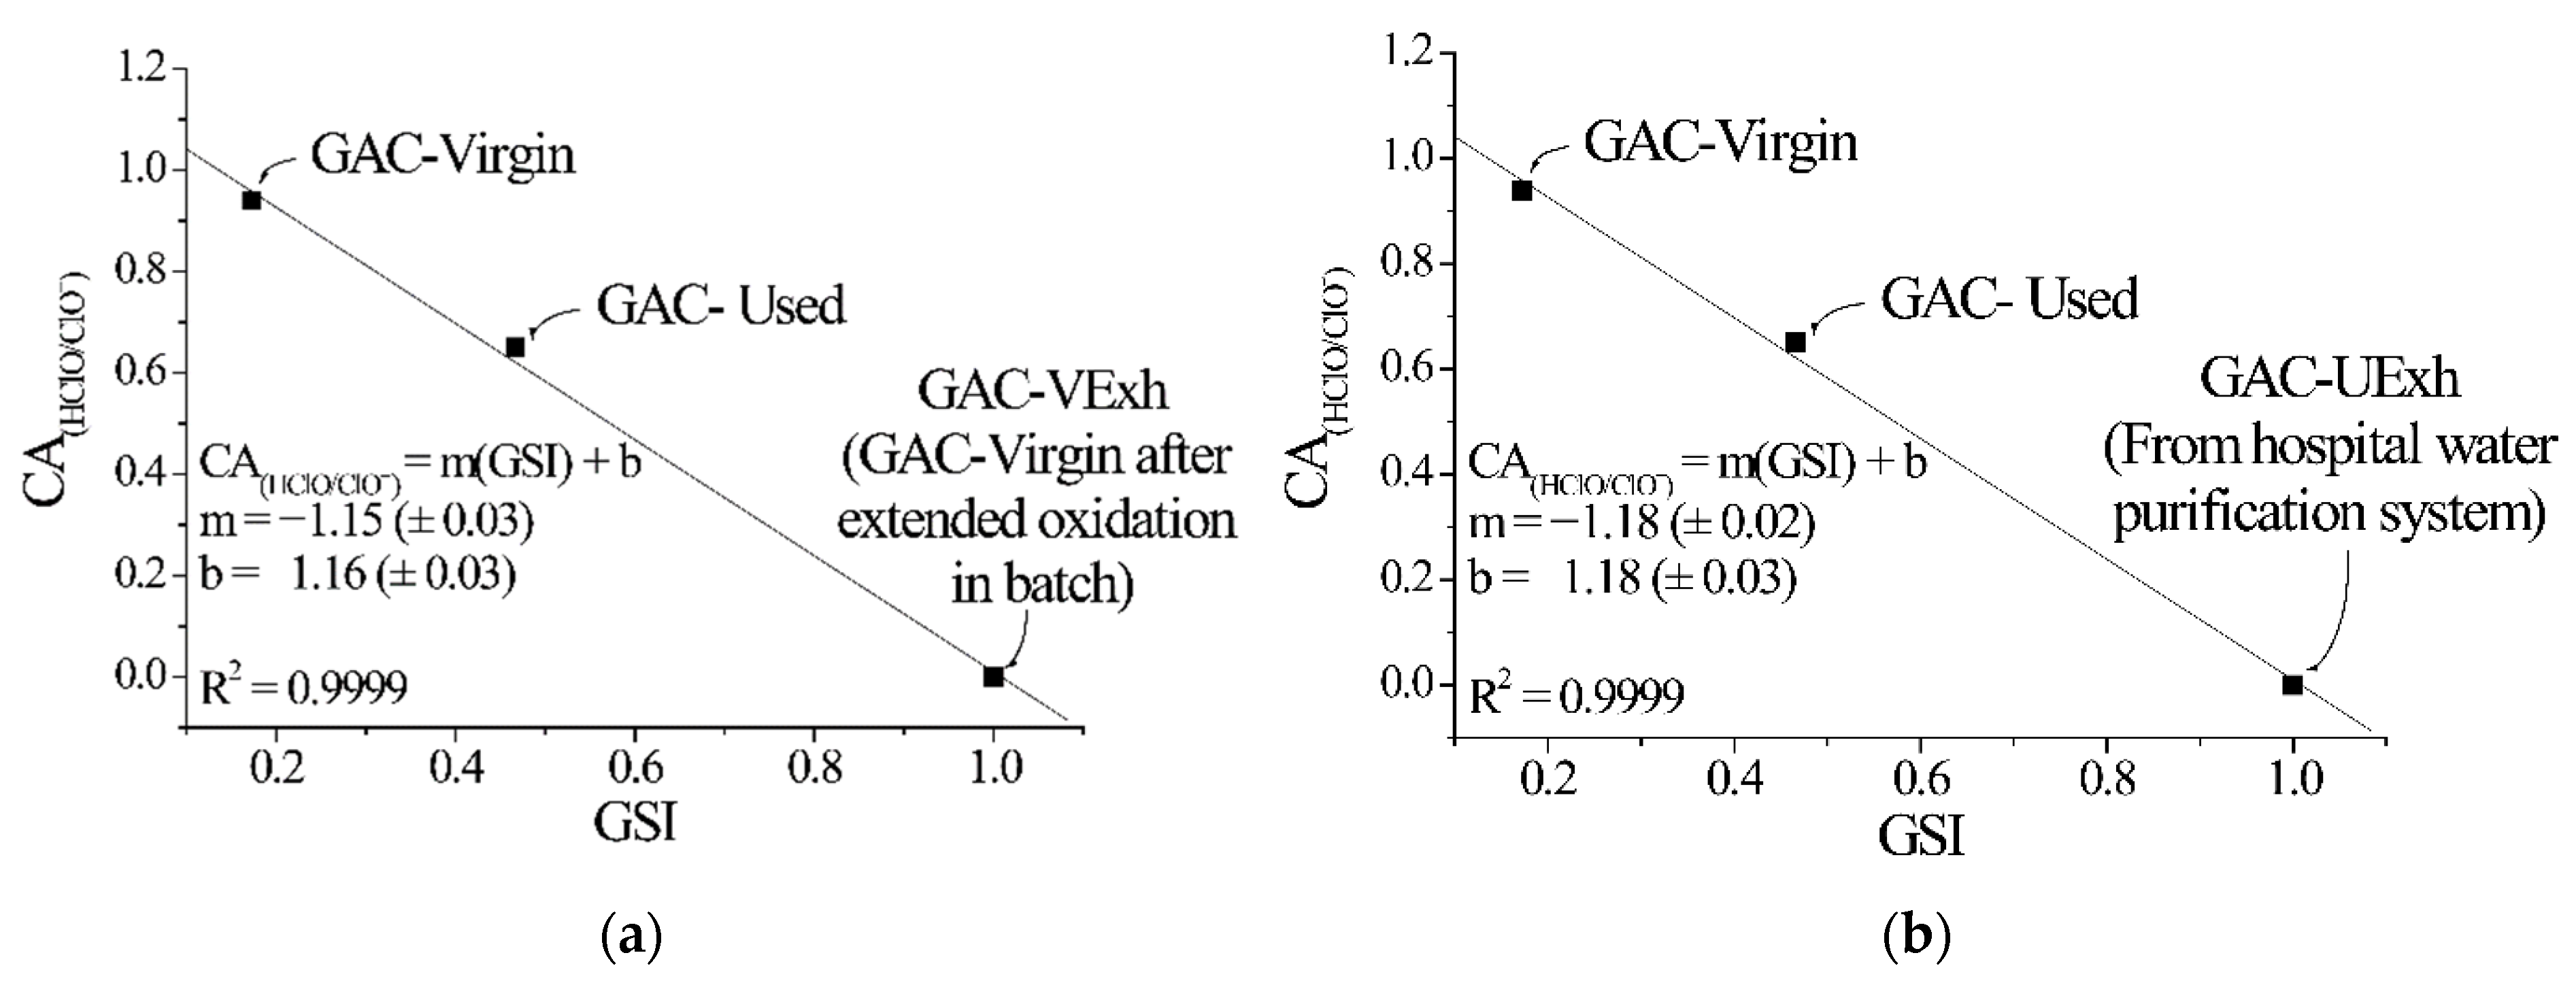
The GSI levels for the GAC-Virgin filter and GAC-Used filter were 0.1725 and 0.4667, respectively, utilizing XRA method 2. The GSI value of GAC-UExh is close to ¨1¨ in the normalized grey scale [13,14]. Figure 10 depicts the free chlorine removal capacity obtained from breakthrough curves plotted against the GSI values derived from the application of XRA method 2 for the GAC-Virgin, GAC-Used, and GAC-UExh.
The CA (HClO/ClO) capacity (0.94) and GSI value (0.99) of GAC-VExh was calculated according to Equation (S1) (see S.M., Section S2.5) and XRA method 1. Some differences in exhausted characteristics between GAC-VExh and GAC-UExh can be expected due to its different history treatment, and, thus, some small differences in the GSI value can be obtained. Therefore, an average value of both linear equations could be used. This comparison was conducted to assess the performance of the novel XRA method 2 for the entire filter from different filtration histories.
This demonstrates that XRA method 2 can predict the free chlorine removal capacity during the operation of the water purification system, using GSI values and expressing C A H C l O / C l O (%) as
C A H C l O / C l O ( % ) = m · G S I + b · 100
for GSI > 0.1645.
Equation (18) provides an indication of the dechlorinating capacity (in %) of the entire GAC filter during operation, relative to the GAC-Virgin sample, using GSI values. A GSI value below 0.1645 indicates a 100% free chlorine removal capacity, while GSI values around 0.99 signify a complete loss of this capacity [14,20].
Therefore, XRA method 2 introduces a more accurate and reliable criterion for replacing the GAC filter compared to the current EC measurements. Additionally, the entire GAC-Used filter is analyzed, rendered it further available in the treatment. Another significant outcome of this research is the more precise determination of the free chlorine removal capacity using XRA method 2, which will extend the GAC filter’s lifespan and be cost-effective (see S.M, Section S1), directly indicating their oxidation/deterioration degree and monitoring their removal capacity for adsorbates.

5. Conclusions

A novel X-ray absorption analysis (XRA) method has been proposed and optimized to deliver detailed information about the oxidation and deterioration degree of GAC filters used in hospital water purification systems. This method also assists in predicting the remaining lifetime of the filter in a cost-effective manner. Applicable to entire cylindrical GAC filters, the method is based on digital radiographic images, grey-scale intensity levels, and a modified mathematical model. The grey-scale intensity is influenced by the relationship between the filter’s radius and apothem, the initial photonic beam intensity, and the linear absorption coefficient of the analyzed filter. Optimal experimental conditions are 70 keV-40 mAs. Notably, this novel XRA method does not require subsamples, preserving the filter for continued use.
The proposed XRA method stands out as a non-invasive technique that maximizes the filter’s usability after each XRA monitoring session, unlike previously described XRA methods and other conventional analytical techniques. This innovative method is a valuable tool for monitoring the performance of cylindrical GAC filters, providing a direct indication of their oxidation and deterioration degree. Additionally, it aids in predicting the filter’s remaining lifespan and estimating its dechlorinating capacity.

Supplementary Materials

The following supporting information can be downloaded at https://www.mdpi.com/article/10.3390/c11020030/s1, Figure S1: General set-up of an ultrapure water production system (min. pressure and water flow: 1–3 kg/cm2 and 1.9 L/min). Block 1: Sediment filter. Block 2: GAC filter (from Hyundai enterprise). Block 3: Nano membrane. Block 4: Reverse Osmosis (RO) membrane. Block 5: Mixed-bed ion exchange cartridges.; Figure S2: Calibration curve of absorbance (A) as a function of different NaClO concentrations (in mg free Cl2/L).; Figure S3: Mass loss in wt. % of GAC-Top, GAC-Bottom and GAC-Virgin samples as a function of temperature, (a) 25 °C to 600 °C (N2 atmosphere) and (b) 25°C to 900 °C, with 600 °C to 900 °C (O2) atmosphere).; Figure S4: (a) SEM image GAC-Top, (b) GAC-Bottom and (c) GAC-Virgin.; Figure S5: Correlation graphs between GSI and a variations for the GAC-Virgin filter and GAC-Used filter between 50 keV and 80 keV.; Table S1: Semi-quantitative analysis of the inorganic fraction of the different layers in the GAC filter (on dry basis). Refs. [21,22] are cited.

Author Contributions

Conceptualization, validation, software, formal analysis, data curation, writing original draft: J.P.T.; methodology: J.P.T., T.H. and T.M.P.; investigation: J.P.T. and G.R.; resources, project management, supervison: J.Y., P.A. and D.V.; writing—review and editing: H.C.S., J.Y., R.C., P.A. and D.V. All authors have read and agreed to the published version of the manuscript.

Funding

This research was funded by: UHasselt BOF funding program: grant number BOF23KV01 and VLIR-IUC-UOS funding program: grant number: Universidad de Oriente CU2019IUC030A105-77143.

Data Availability Statement

Data can be received by mailing the corresponding author.

Acknowledgments

The authors would like to thank Hasselt University BOF funding, especially the BOF-Incoming mobility -BOF23KV01 scholarship for Jeamichel Puente Torres. The authors would like to thank the Programme VLIR-IUC-UOS—Universidad de Oriente CU2019IUC030A105-77143 between Belgium and Cuba for providing funding and granting the support of the current study and future studies.

Conflicts of Interest

The authors declare no conflicts of interest.

References

  1. Bansal, R.C.; Goyal, M. Activated Carbon Adsorption; CRC Press: Boca Raton, FL, USA, 2005. [Google Scholar]
  2. Hsieh, C.-T.; Teng, H. Influence of mesopore volume and adsorbate size on adsorption capacities of activated carbons in aqueous solutions. Carbon 2000, 38, 863–869. [Google Scholar] [CrossRef]
  3. Ying, W. Proceedings of the 44th Purdue Industrial Waste Conference, West Lafayette, IN, USA, 9–11 May 1989; Lewis Publishers: Chelsea, MI, USA, 1989. [Google Scholar]
  4. DeSilva, F.J. Activated Carbon Filtration; Water Quality Products: Arlington Heights, IL, USA, 2000; p. 16. [Google Scholar]
  5. Tran, H.N.; You, S.J.; Hosseini-Bandegharaei, A.; Chao, H.P. Mistakes and inconsistencies regarding adsorption of contaminants from aqueous solutions: A critical review. Water Res. 2017, 120, 88–116. [Google Scholar] [CrossRef]
  6. Lim, M.; Delehomme, C.; Capece, J. Removal of Residual Chlorine from Drinking-Water by Solar Radiation (UV) and Activated Carbon Filtration; Intelligentsia International, Inc.: LaBelle, FL, USA, 2008. [Google Scholar]
  7. Magee, V. The application of granular active carbon for dechlorination of water supplies. In Proceedings of the Society of Water Treatment Examination, Chorleywood, UK, 12–14 June 1956. [Google Scholar]
  8. Abdul-Ahad, M.Y. Design Criteria of an Activated Carbon Bed for Dechlorination of Water. Iraqi J. Chem. Pet. Eng. 2008, 9, 41–49. [Google Scholar] [CrossRef]
  9. Adachi, A.; Kimata, S.; Noguchi, M.; Okano, T. Decomposition of monochloramine from water with rice bran. J. Health Sci. 2002, 48, 126–129. [Google Scholar] [CrossRef]
  10. Soice, N.P.; Pellegrino, J.; Kavanagh, J.; Riley, R.L. Oxidative degradation of polyamide reverse osmosis membranes: Studies of molecular model compounds and selected membranes. J. Appl. Polym. Sci. 2003, 90, 1173–1184. [Google Scholar] [CrossRef]
  11. Adachi, A.; Okano, T. Generation of cyanide ion by the reaction of hexamine and losartan potassium with sodium hypochlorite. J. Health Sci. 2008, 54, 581–583. [Google Scholar] [CrossRef]
  12. Puente Torres, J.; Crespo Sariol, H.; Yperman, J.; Brito Sauvanell, Á.; Carleer, R.; Navarro Campa, J. A novel X-ray radiography approach for the characterization of granular activated carbons used in the rum production. J. Anal. Sci. Technol. 2018, 9, 1–15. [Google Scholar] [CrossRef]
  13. Puente Torres, J.; Crespo Sariol, H.; Yperman, J.; Adriaensens, P.; Carleer, R.; Peacok, T.M.; Brito Sauvanell, Á.; Thijssen, E.; Reggers, G.; Haeldermans, T.; et al. X-ray absorption as an alternative method to determine the exhausting degree of activated carbon layers in water treatment system for medical services. Talanta 2019, 205, 120058. [Google Scholar] [CrossRef] [PubMed]
  14. Puente Torres, J.; Crespo Sariol, H.; Mariño Peacok, T.; Brito Sauvanell, Á.; Cuyvers, G.; Reggers, G.; Samyn, P.; Vandamme, D.; Yperman, J.; Adriaensens, P.; et al. Chemical Regeneration of Activated Carbon Used in A Water Treatment System for Medical Services. Adv. Environ. Eng. Res. 2023, 4, 1–28. [Google Scholar] [CrossRef]
  15. Puente Torres, J.; Crespo Sariol, H.; Mariño Peacok, T.; Yperman, J.; Adriaensens, P.; Carleer, R.; Brito Sauvanell, Á. X-Ray absorption (XRA): A new Technique for the characterization of Granular Activated Carbons. Materials 2021, 14, 91. [Google Scholar] [CrossRef] [PubMed]
  16. D 2867-04; ASTM, Standard Test Methods for Moisture in Activated Carbon. ASTM International: West Conshohocken, PA, USA, 2011.
  17. Johns, H.E.; Cunningham, J.R. The Physics of Radiology; Charles C. Thomas: Springfield, IL, USA, 1983. [Google Scholar]
  18. Hossain, S.; Cook, D.; Chow, C.W.K.; Hewa, G.A. Development of an optical method to monitor nitrification in drinking water. Sensors 2021, 21, 7525. [Google Scholar] [CrossRef] [PubMed]
  19. Danial, L.H. Current Technology of Chlorine Analysis for Water and Wastewater; Technical Information Series-Booklet No. 17; Hach Company: Loveland, CO, USA, 1995. [Google Scholar]
  20. Mariño Peacok, T.; Crespo Sariol, H.; Sánchez Roca, Á.; Puente Torres, J.; Gryglewicz, G.; Yperman, J. Efficiency evaluation of thermally and chemically regenerated activated carbons used in a water cleaning system by acoustic emission analysis. J. Porous Mater. 2021, 28, 451–469. [Google Scholar] [CrossRef]
  21. Turlapati, V.Y.; Kumar, S.; Singh, R.K.; Sharma, M. Analysis of micropore size distribution using Dubinin’s theory of volume filling-Effect of particle size on pore characterization of organic-rich Indian shales. J. Nat. Gas Sci. Eng. 2022, 106, 104746. [Google Scholar] [CrossRef]
  22. Harp, D.L.; Hach, C.C. Current Technology of Chlorine Analysis for Water and Wastewater; Technical Information Series-Booklet No. 22; Hach Company: Loveland, CO, USA, 2003. [Google Scholar]
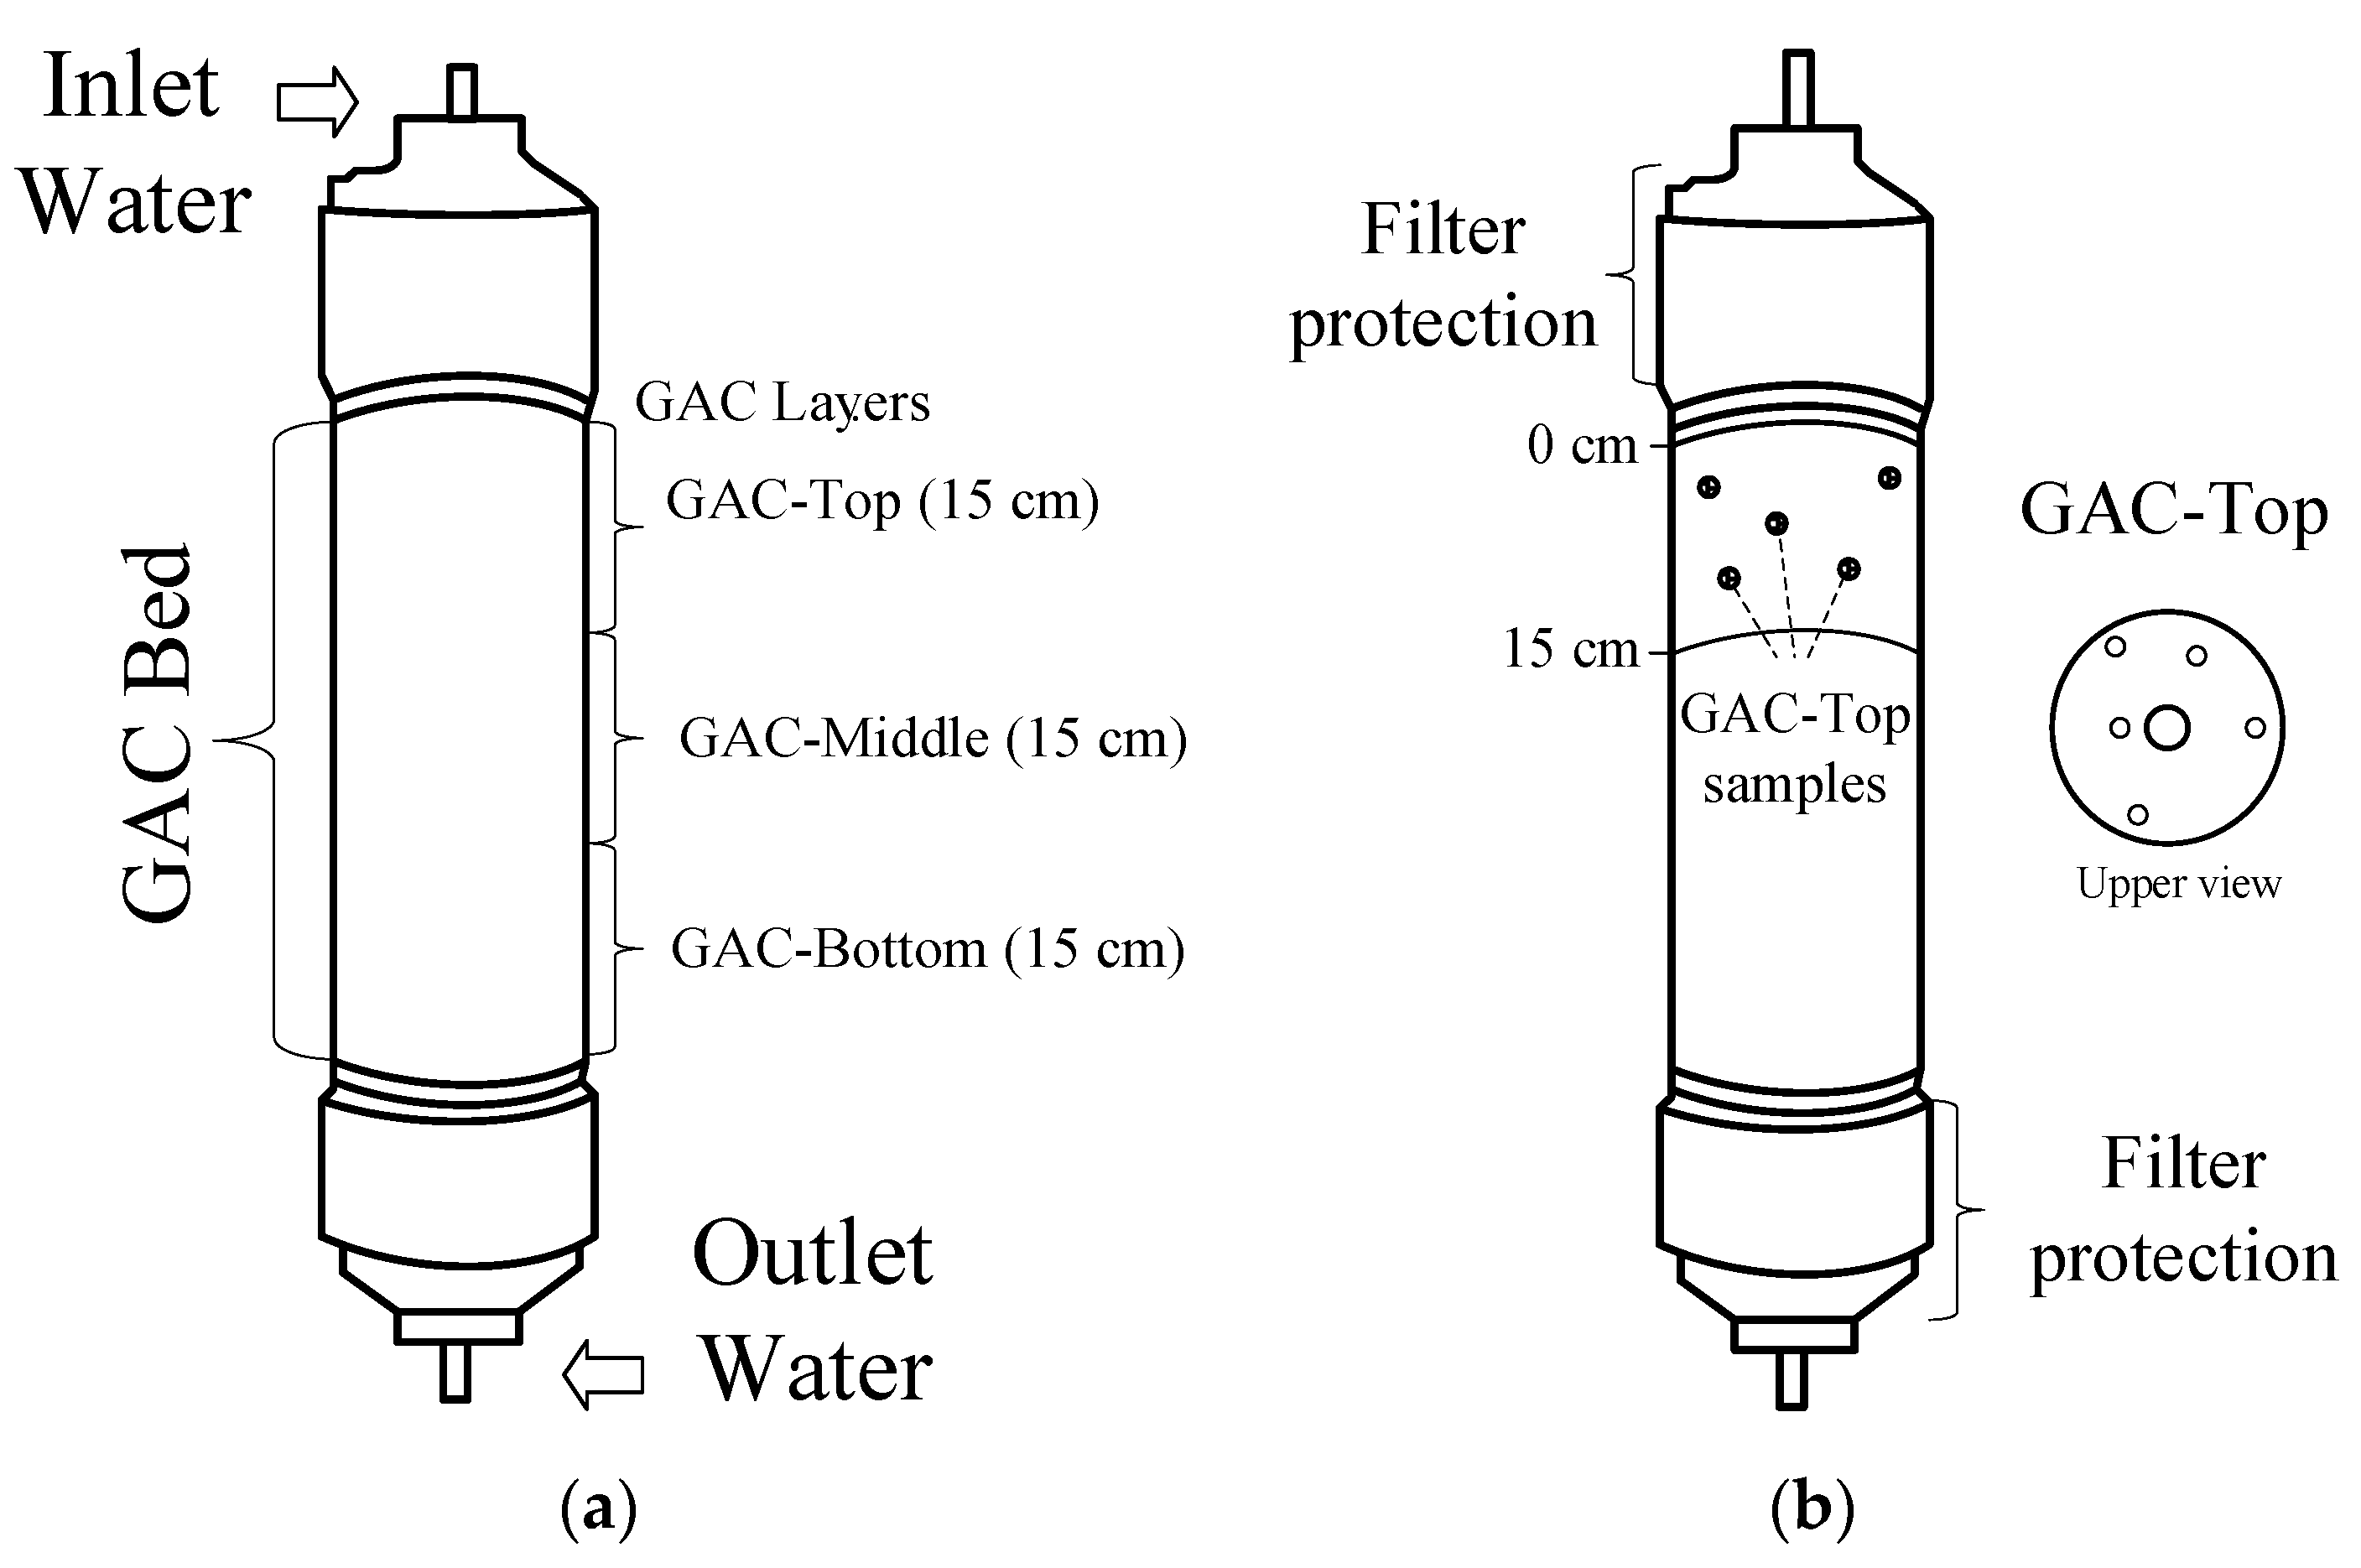
Figure 1. Schematic diagram of the water treatment filter (from Hyundai enterprise) and the sample locations at different layer regions in the GAC bed (a) and the sampling process (b). Adapted from the study of [13].
Carbon 11 00030 g001
Figure 2. Scheme of experimental XRA set-up. Adapted from the study of [12]. Block 1: Cylindrical GAC filter from the water treatment system. Block 2: X-ray apparatus. Block 3: Photosensitive detector. Block 4: Digital conversion unit. Block 5: Computer.
Carbon 11 00030 g002
Figure 3. Frontal view of the Hyundai GAC filter for a hospital water purification system.
Carbon 11 00030 g003
Figure 4. Digital radiographic images (a), image histograms (b), and image frequency spectra (c) of three GAC-Used layer samples and GAC-Virgin (XRA method 1).
Carbon 11 00030 g004
Figure 5. XRA images of the filter filled with GAC-Virgin (left in each image) and GAC-Used (right in each image) at different irradiation energies by XRA method 2, (a) 40 keV, (b) 50 keV, (c) 60 keV, (d) 70 keV, (e) 80 keV, (f) 90 keV, (g) 100 keV, and (h) 120 keV.
Carbon 11 00030 g005
Figure 6. Differences in grey-scale intensities (DGS) obtained for GAC-Used and the GAC-Virgin filters at different irradiation energies.
Carbon 11 00030 g006
Figure 7. Correlation graphs between GSI and S for GAC-Virgin (a) and GAC-Used (b) filters at 70 keV-40 mAs.
Carbon 11 00030 g007
Figure 8. Digital radiographic image, image histogram, and frequency spectrum of GAC-Used filter (ac); digital radiographic image, image histogram, and frequency spectrum GAC-Virgin filter (df) (XRA method 2).
Carbon 11 00030 g008
Figure 9. Breakthrough curves for GAC-Virgin, GAC-Used, and GAC-UExh filter (a), derivative function of the breakthrough curves with breakthrough times (b).
Carbon 11 00030 g009
Figure 10. Correlation graphs between CA(HClO/ClO) and GSI for a GAC-Virgin filter, GAC-Used filter, and GAC-VExh. (a) Additionally, a CA(HClO/ClO) value of 0.97 is obtained for the GAC-UExh (b).
Carbon 11 00030 g010
Table 1. (a): N, C, H, and O content of the GAC samples (in wt. %). (b): N, C, H, and O content of the GAC-Virgin sample after extended free chlorine exposure (in wt. %).
(a)
NSDCSDH SDOSD
GAC-Virgin0.440.0193.540.620.810.072.220.57
GAC-Bottom0.570.0276.410.462.140.0717.890.41
GAC-Middle0.540.0175.920.742.230.1118.310.76
GAC-Top0.560.0276.630.011.040.0218.780.25
(b)
NSDCSDH SDOSD
GAC-VExh0.460.0386.440.030.910.019.210.04
With SD: standard deviation.
Table 2. S , a   and GSI parameters found at different irradiation energies (50–80 keV range).
50 keV 60 keV70 keV80 keV
a S G S I ( U s e d ) G S I ( V i r g ) G S I ( U s e d ) G S I ( V i r g ) G S I ( U s e d ) G S I ( V i r g ) G S I ( U s e d ) G S I ( V i r g )
5.000.000.110.070.120.130.110.070.100.07
4.544.190.150.090.250.150.130.080.110.07
4.095.750.190.100.280.170.210.090.130.07
3.646.850.250.100.340.170.240.110.150.08
3.187.720.340.110.350.190.260.120.160.08
2.738.340.350.130.350.210.320.140.190.08
2.278.910.400.130.370.210.390.150.200.08
1.829.320.410.150.390.210.420.160.210.08
1.369.620.420.120.410.220.450.180.220.08
0.919.830.430.150.420.250.460.190.230.08
0.459.960.520.120.440.270.510.210.250.10
0.0010.00.530.180.570.330.540.250.320.12
With the following:   G S I ( U s e d ) : grey-scale intensity for the GAC-Used filter;   G S I ( V i r g ) : grey-scale intensity for the GAC-Virgin filter; and a   and S in cm.
Table 3. Fitting parameters found for apothem ( a ) variations and GSI values (XRA) for the GAC-Used filter and the GAC-Virgin filter.
50 keV-40 mAs
Evaluated ParameterGSI0e(GSI0)me(m)R2
G S I V i r g i n 0.1600.008−0.0100.0020.86
G S I U s e d 0.5500.006−0.0800.0020.98
60 keV-40 mAs
Evaluated ParameterGSI0e(GSI0)me(m)R2
G S I V i r g i n 0.2900.009−0.0300.0030.95
G S I U s e d 0.5100.020−0.0600.0080.93
70 keV-40 mAs
Evaluated ParameterGSI0e(GSI0)me(m)R2
G S I V i r g i n 0.2300.004−0.0300.0010.99
G S I U s e d 0.5600.001−0.0800.0030.99
80 keV-40 mAs
Evaluated ParameterGSI0e(GSI0)me(m)R2
G S I V i r g i n 0.0900.004−0.0070.0010.79
G S I U s e d 0.2800.008−0.0400.0030.97
G S I = m a + G S I 0 (with e(i) the error on parameter i).
Table 4. Fitting correlation parameters between GSI and S for both filters at optimized conditions (70 keV-40 mAs).
Evaluated ParameterGSI0e(GSI0)me(m)te(t)R2
G S I V i r g i n 7 · 10 2 1   ·   10 3 7 · 10 4 1   ·   10 5 2.0 4   ·   10 1 0.99
G S I U s e d 1 · 10 1 1   ·   10 3 1 · 10 2 5   ·   10 3 3.03   ·   10 1 0.99
G S I = m e S / t + G S I 0 (with e(i) the error on parameter i).
Table 5. Area under breakthrough curves ( A C ) and free chlorine removal capacity ( C A H C l O / C l O ) (%).
GAC-Sample A C C A H C l O / C l O
GAC-Virgin522.01.00
GAC-Used338.00.65
GAC-UExh30.520.06
Disclaimer/Publisher’s Note: The statements, opinions and data contained in all publications are solely those of the individual author(s) and contributor(s) and not of MDPI and/or the editor(s). MDPI and/or the editor(s) disclaim responsibility for any injury to people or property resulting from any ideas, methods, instructions or products referred to in the content.