Abstract
The geoenergy industry has challenging demands on cements used as downhole materials. Once placed in the annular space, the cement sheath must be very low permeability and mechanically durable. Its characteristics are strongly influenced by its microstructure. A holistic approach, including combined mineralogical, physical, and mechanical investigations, provides a better understanding of how these characteristics interplay. Class G cement was investigated and compared to cement formulations containing carbon black or silica fu me, trying to tailor its performance. The addition of carbon black and silica fume has some effect on the modal and chemical phase composition and results in a much denser microstructure. Furthermore, porosity is reduced while the pore size distribution remains similar. Samples containing carbon black have a reduced Young’s modulus, indicating a more plastic behavior. The addition of silica fume increased both mechanical strength and permeability. However, comparable results can also be achieved by carefully tuning the water/cement ratio of the initial slurry.
1. Introduction
Today, cement, in various compositions, is one of the most consumed construction materials, also finding application in the geoenergy industry. In oil, gas, H2-storage, carbon sequestration, and geothermal wells, cement, most commonly Portland-type cements, is applied to fill the so-called annular space between the steel casing and the surrounding rock formations, providing not just mechanical strength for the borehole infrastructure but also ensuring tightness against migrating fluids. This is crucial for ensuring the safe and environmentally friendly production of hydrocarbons, the underground storage of H2 and CO2, or the extraction of geothermal energy [1]. On the one hand, to provide tightness, also called zonal isolation, the installed cement sheaths need to have very low permeability, even at higher pressure-temperature conditions of up to 200 MPa and 150 °C, as realized in the subsurface formations encountered in the geoenergy industry. Zonal isolation is the exclusion of fluids such as water; e.g., groundwater in one zone, from oil or gas in another zone [2,3,4,5]. On the other hand, due to the geothermal gradient and potential movements of the subsurface, e.g., earthquakes or induced seismicity, the cement sheath must also be mechanically durable and withstand a wide range of thermal and mechanical loads [5,6,7]. These characteristics are important in a cement sheath to operate a well safely and economically during its lifetime.
The physical and mechanical properties of hardened cement sheaths are dependent on their microstructure [8]. Cement sheaths exhibit a complex and, due to the hydration process, somewhat dynamic microstructure, which highly depends on the slurry formulation and the curing conditions [9,10]. Mineralogical investigations can provide additional information and help to better understand the characteristics of cement sheaths and their physical and mechanical suitability and durability [11,12,13,14]. In recent years, a lot of effort has been made to improve cement sheaths for geoenergy wells [7,15,16]. Often, additives or supplementary cementitious materials (SCMs) are added to the cement slurry to enhance certain properties [17,18,19,20]. Commonly used SCMs and additives are silica fume, fly ash, ground granulated blast furnace slag, and limestone powder [21]. However, ongoing research has led to the emergence of novel additives, such as carbon black, which show promising potential for enhancing certain properties of the cement sheath [22,23]. Chemically pure, non-reactive nanoparticles of carbon black are added to decrease the porosity of the cement sheath and prevent gas migration through the cement slurry during the placement and curing of the mixture in the wellbore, thus acting as a fluid-migration blocking additive. Fluid-migration blocking additives are very important for well integrity because, during the placement and curing of the cement slurry, downhole fluids might migrate upwards, causing channels, fissures, or cracks in the later hardened cement sheath. Thus resulting in a poor cementing job and an increased risk of well integrity failure. However, the influence of carbon black on the microstructure and especially on the properties of the hardened cement sheath has yet to be fully resolved [23].
Silica fume, which is composed of nanoparticles of amorphous SiO2, is a so-called pozzolanic material, inducing a pozzolanic reaction within the cement slurry [24,25]. This chemical reaction between the pozzolan and Ca2+ or calcium hydroxide (Ca(OH)2) in the presence of water means that the addition of silica fume reduces the portlandite content in the cement sheath and increases the calcium silicate hydrate (C-S-H) content. This leads to advanced mechanical performance and a modified microstructure [19,26,27,28,29]. However, it is also known that the addition of silica fume increases the desiccation of the curing cement slurry because of the increased water consumption of the pozzolanic reaction, therefore enhancing the risk of autogenous shrinkage of the cement sheath [30,31].
Other benefits of adding additives to the cement slurry include economic and environmental aspects. By adding low-cost additives such as carbon black, the total costs of cementing during the construction of the well can be lowered [22]. Moreover, another beneficial aspect is the reduction of greenhouse gases. It is commonly known that the cement industry is one of the major contributors to greenhouse gas emissions, resulting from the calcination during the manufacturing process of the raw materials needed for cement. One ton of cement releases roughly an equivalent amount of CO2 into the atmosphere [32,33]. By substituting cement with, for example, silica fume, a by-product from the production of elemental silicon and its alloys, the amount of cement can be reduced.
Therefore, understanding how the physical and mechanical properties of geoenergy well cement sheaths can be tailored in an optimal way is of utmost importance. As physical and mechanical properties are also dependent on the mineralogical phase composition of the hardened cement sheath, studies need to be complemented by mineralogical investigations. An inclusive approach combining in-depth mineralogical studies with mechanical and physical investigations of downhole cements is a rather novel approach, but vital to better understanding their mechanical and physical performance.
In this study, we present the results of integrated mineralogical and microstructural investigations together with the physical and mechanical characterization of geoenergy well cement sheaths. The purpose of this study is to investigate the impact of incorporating carbon black and silica fume as additives in cement slurries on the phase composition, microstructure, and resultant physical and mechanical properties of geoenergy well cement sheaths. By comprehensively analyzing these changes through advanced techniques such as scanning electron microscopy, mercury intrusion porosimetry, nitrogen gas adsorption, and mechanical strength testing, we aim to establish a clear correlation between the microstructural modifications and the enhanced or diminished performance of the cement. The significance of this study lies in its potential to improve the reliability and durability of well cementing in geoenergy applications. Understanding how specific additives affect the microstructure and mechanical properties of the cement can lead to the development of optimized cement formulations. An interdisciplinary approach with mineralogical methods and mechanical and physical characterizations allows an integrated and holistic evaluation. In this paper, we present comprehensive data from scanning electron microscopy, mercury intrusion porosimetry, nitrogen gas adsorption, and permeability measurements. Additionally, the uniaxial compressive strength (UCS) and tensile strength of the investigated cement sheaths were determined, and mineral chemical investigations using an electron microprobe were performed.
2. Materials and Methods
2.1. Sample Materials
In total, four different cement sheath mixtures were investigated. A high sulfate-resistant Class G cement, which is an ordinary Portland cement according to API Spec 10A [34] with a gypsum and aluminate (C3A) content lower than 3 mass%, was used. Sample G-1 was mixed with the recommended water to the cement (w/z) ratio of the manufacturer, G-2 was mixed with a reduced water content, G-1-CB had added carbon black of the quality N326, G-1-SF had added silica fume with a purity of 97 mass% amorphous SiO2 (particle size below 1 µm). For samples G-1-CB and G-1-SF, a sulfonated organic polymer acting as a dispersant was added to achieve a mixable slurry. All samples were mixed according to and with equipment compliant with API Spec 10A. The exact mixture formulations for each sample are listed in Table 1. After mixing, the cement slurries were poured into cylindrical molds (2.54 cm in diameter, 5.08 cm in length) made out of brass and left for curing for 28 days in a water bath at room temperature (~22 °C). After 28 days, the cylinders containing the cured cements were demolded and further processed as needed for the follow-up investigations. For all mineralogical and some physical properties investigations (Mercury Intrusion Porosimetry (MIP), N2 adsorption), the cylinders were cut into 5-mm slices, placed in 99.9% isopropanol for 24 h for solvent exchange to prevent further hydration, and finally dried at 40 °C until constant mass was achieved. After drying and additional further preparation steps (e.g., milling to obtain analytical fine powder for X-ray diffraction (XRD), Simultaneous Thermal Analysis (STA), and N2 adsorption), the samples were stored in a desiccator to limit the carbonation of the powders. For permeability testing, the initial cylinders were dried at 40 °C until they reached a constant mass. For uniaxial compressive strength (UCS) testing, the initial cylinders were demolded after 28 days and immediately tested according to ASTM C39. Tensile strength cylinders with a 5.08 cm diameter and 2.54 cm length were cast, cured, and demolded in the same way as the samples for UCS were. Tensile strength was then determined according to ASTM C496.

Table 1.
Exact mixture formulation of the four investigated samples, BWOC = by weight of cement.
2.2. Scanning Electron Microscopy (SEM)
The dried slices were crushed into small pieces using a hand mortar, and SEM image acquisition on a fresh fractured surface was carried out using a TESCAN CLARA field emission (FE) microscope located at the Chair of Functional Materials and Materials Systems, Montanuniversität Leoben, Austria, equipped with TESCAN Essence Image Snapper software, version 1.0.8.0, allowing for the capture and stitching of high-resolution images. Both backscattered (BSE) and secondary (SE) electron images were obtained. The acceleration voltage was set at 10 kV and the beam current at 1 nA. To obtain a conducting surface and minimize charging effects, the samples were coated with gold using a Cressington Sputter Coater 108 Auto with a 30 s sputtering time.
2.3. X-ray Diffraction (XRD)
To obtain the powdered sample material needed for XRD measurements, the dried sample slices were first ground and then milled using a hand mortar until an analytically fine powder was achieved. A hand mortar was used to ensure a delicate sample preparation and avoid the additional amorphization of certain phases in the hardened paste. Apart from preparation and measurement, the powders were stored in a desiccator to limit carbonation. The measurements were carried out with a Panalytical XPert 3 Powder Diffractometer located at the Chair of Petroleum Geology, Montanuniversität Leoben, Austria, operating at 40 kV and 40 mA, using Cu Kα (1.5 Å) as a radiation source at a step size of 0.004° per second in the 2θ range of 2.5°–70°. The qualitative identification of the phases was carried out manually by comparing the interlayer distance (d) values of the major peaks with the database table presented in [35].
2.4. Simultaneous Thermal Analysis (STA)
For STA, the dried sample slices of the cement sheaths were ground and milled using a hand mortar to obtain an analytically fine powder. Between all sample preparation steps and the measurement, the samples were stored in a desiccator to prevent carbonation of the samples. A combined measurement of thermogravimetry (TG) and differential scanning calorimetry (DSC) was carried out using a TG-DSC Apparatus STA 449 C from Netzsch located at the Chair of Process Technology and Industrial Environmental Protection, Montanuniversität Leoben, Austria. TG is a method in which the change in mass of a material during progressive heating is recorded as a function of temperature. Changes in mass are a result of degradation, the removal of water (e.g., dehydration), and the oxidation of components within the material. DSC is a thermo-analytical technique in which the difference in the amount of heat required to increase the temperature of a sample is measured as a function of temperature, allowing for differentiation between exothermal and endothermal reactions recorded via TG. For hardened cement pastes, three major weight losses can be differentiated during an STA experiment [7,35]:
- up to 350 °C: dehydration of C-S-H and AFm, AFt (aluminium-iron sulphates)
- 400–550 °C: dehydroxylation of portlandite (Ca(OH)2)
- above 600 °C: decarbonation of CaCO3
Roughly 25 mg of powdered sample material was placed in a cylindrical corundum crucible (6.8 mm diameter) and heated up to 1400 °C at a rate of 10 °C/min under constant argon flow (42 mL/min) to provide an inert atmosphere and prevent carbonation of the samples.
Due to the dehydroxylation of portlandite in a well-defined temperature interval, the portlandite content of the investigated sample can be calculated using the following Equation (1):
where Ca(OH)2 is the measured mass fraction of portlandite and LCa(OH)2 and LCaCO3 are the weight losses attributed to portlandite and carbonates in their respective decomposition temperature domains and Mx the molar mass of substance x. The weight loss of carbonates was accounted for under the assumption that all carbonates present in the sample result from the carbonation of portlandite during the sample preparation, which supposedly cannot be fully prevented. The C-S-H content is quite difficult to calculate from STA results due to the fact that, in the temperature range, sulfate-bearing phases such as monosulfate or ettringite decompose, and the molar mass of C-S-H is also unknown due to the unknown ratio of Ca and Si ions and water content [35]. In this study, the C-S-H + AFm content was calculated under the assumption that no ettringite should be present after 28 days of curing due to hydration kinetics [36] and the AFm content should be below 3% due to the low concentration of gypsum and aluminate (C3A) in the used class G cement [7]. Furthermore, no hydrogarnet is assumed to be present due to the minor amount of C3A since it was not detected with XRD. Based on these assumptions, the C-S-H + AFm content was calculated using Equation (2):
where C-S-H measured is the mass fraction of C-S-H and AFm under the assumption that the majority is indeed C-S-H and only minor amounts of AFm contribute. Also, the molar mass of C-S-H was assumed to be 180 for Ca-rich C-S-H, which is typically found in hydrated Portland cement pastes. Both, portlandite and C-S-H + AFm content were calculated from the TG graphs using the stepwise method [35].
Ca(OH)2, measured = LCa(OH)2 × MCa(OH)2/MH2O + LCaCO3 × MCa(OH)2/MCO2
C-S-H measured = LC-S-H × MC-S-H/MH2O
2.5. Electron Probe Micro Analysis (EPMA)
EPMA measurements were carried out to investigate the mineral chemical composition of the C-S-H matrix of the samples, mainly the Ca/Si ratio and the influence of added silica fume. To obtain the well-polished and flat surface required for EPMA measurements, a special preparation technique was needed. The surface of the dried sample slices was briefly manually dry ground on sandpaper with grain sizes of 1000 µm and, after that, vacuum impregnated in a low-viscosity resin (EPO-TEK 301). The resin was cured for 3 days at room temperature. Afterwards, the upper-most part of the resin was carefully removed by hand with a grinding disc to free the initial sample surface. Here, extreme caution was taken to not remove too much of the sample material. Then, the sample surface was lapped for several minutes using SiC with a grain size of 1000. After that, automated polishing using a Tegramin 30 grinding and polishing machine from Struers, was performed. In total, four polishing steps using a monocrystalline diamond paste spray of 9, 6, 3, and 1 µm with polishing discs from Struers, namely MicroTex 900 for the first two steps and MD Dur for the last two steps, were performed. Each polishing step took about 3–4 min with the polishing disc rotating at 120 rpm and a force of 20 N applied to the samples. After each polishing step, the samples were cleaned in an ultrasonic bath.
The polished samples were carbon coated with a 15 nm thin layer to ensure a conductive surface and allow wavelength dispersive spectrometry (WDS) analysis of the material. A JEOL superprobe JXA 8200 located at the Chair of Resource Mineralogy, Montanuniversität Leoben, Austria, equipped with 5 spectrometers and a tungsten cathode, was used. The acceleration voltage and beam current were set at 15 kV and 10 nA with a beam diameter of 1 µm. Further measurement parameters, the measured elements, and the used crystals and minerals for standardization of the respective elements, are reported in Table 2. The measurement points were selected within the middle grey matrix areas, obtaining total values for the oxides of 72–78 mass% due to the inability of the device to measure elements as light as oxygen or hydrogen. For every measurement, background correction and ZAF correction were applied, and the detection limit (D.L.) for each measured element was calculated with Equation (3) automatically by the software.

Table 2.
Measurement conditions of EPMA.
With z and m being factors for confidence levels and calculation in mass%, respectively, and Ibg and tbg being the intensity of the background in counts per second and the time of background counting.
The obtained mass% values were transferred into mole% using the molecular weight of the elements and their respective oxides, followed by normalization to 100%. The mole ratios were then calculated and plotted. Based on these values, arithmetic mean values were determined.
2.6. Mercury Intrusion Porosimetry (MIP)
MIP measurements are often applied to investigate the pore size distribution and porosity of hardened cement pastes and cementitious materials due to their broad and relatively simple applicability and wide range of pore size detectability. Particularly when it comes to the comparison of different cementitious materials, MIP delivers meaningful results. However, it is also important to note that the so-called ink bottle effect and accessibility problems can result in an underestimation of macropores (e.g., pores larger than 50 nm according to the IUPAC classification), and the characterization of cementitious materials is not always straight-forward [35,37].
In this study, MIP measurements were conducted at the Chair of Geology, Friedrich-Alexander-Universität Erlangen. A Quantachrome Poremaster for Windows Data Report, version 8.00, was used. The mercury surface tension was 0.485 N/m and the contact angle to the pore surface was 140°. The samples were treated as described in Section 2.1, then the dried slices were crushed, and approximately 1.3 g of fractured pieces were placed in the sample chamber and analyzed by increasing the pressure gradually up to a maximum pressure of 410 MPa. Using the Washburn equation [38], the pore size distribution from pores of sizes of mm down to 3 nm was obtained. Additionally, total porosity, density, and surface area were recorded.
2.7. N2 Adsorption at 77 K
Low pressure gas sorption experiments were executed with an Autosorb iQ3 gas sorption analyzer from Anton Paar Quanta Tec located at the Chair of Physics, Montanuniversität Leoben, using N2 of ultra-high purity (99.999%) as adsorbate. The samples were cast and treated as described in Section 2.1. Then, the dried slices were milled with a hand mortar to obtain a fine powder suitable for analytics. Before the actual measurement, 0.4 g of the powdered sample was outgassed under vacuum (10−6 mbar) for 24 h at 40 °C. To reduce the dead volume of the sample cell, which was automatically evaluated before each run using helium (99.999% purity), non-porous glass filling rods were placed inside the sample cells alongside the sample powder. N2 adsorption/desorption isotherms were recorded at 77 K in a relative pressure (P/P0) range from 10−3 to 0.99. The pore volume, pore size distribution from 3 nm to 100 nm, using the Barrett-Joyner-Halenda (BJH) method, and surface area using the multi-point BET method, of the samples were obtained. The porosity of the samples was calculated based on the measured pore volume by N2 adsorption and skeletal density (e.g., ratio of the mass of the solid material to the sum of the volume of the solid material) of the samples determined using Helium Pycnometry using the following Equation (4):
In contrast to MIP measurements, gas sorption is only able to detect pores of up 200 nm. However, since a significant number of pores in cement sheaths are below this value and the macropores (>50 nm, IUPAC classification) obtained by MIP are often underestimated, it is a vital tool for enhanced porosity investigation and quality control of MIP measurements [35,38].
2.8. Permeability Measurements
N2 gas permeability was determined to occur at 2.54 cm in diameter and 5.08 cm in length in the cylindrical samples at ambient temperature. A Gasperm Steady State Gas Permeameter from Vinci Technologies, located at the Chair of Applied Geophysics, Montanuniversität Leoben, Austria, was used with low flow and high-pressure measurement conditions and a radial confining pressure of 0.8 MPa. For each cement sheath formulation, three cylindrical samples were measured, and, for each cylinder, the N2 gas flow was constantly increased manually until a constant flow was established. After achieving constant flow for the first time, the flow was then increased four more times, recording the pressure every time the flow became constant again. Considering the non-Darcy flow in tight cement sheaths, the effect of gas slippage was accounted for through Klinkenberg correction, while Forschheimer permeability was considered irrelevant, noting the very small scale of pore sizes (<100 nm) in cement sheaths. Permeability was calculated by the corresponding software from Vinci Technologies for every constant gas flow and corresponding pressure, assuming laminar flow of the gas within the sample, resulting in five constantly increasing permeability values obtained per cylinder. Linear regression was performed to observe if a clear linear correlation between increased gas flow (e.g., permeability) and increased pressure could be observed. The total permeability of the sample obtained was calculated by taking the mean arithmetic value of the five permeability values of each cylinder and the three cylinders for each cement sheath formulation.
2.9. Uniaxial Compressive Strength (UCS) and Tensile Strength
For investigating the mechanical properties of the cement sheaths, uniaxial compressive and tensile strengths were investigated using a Quasar 200 machine from Galdabini located at the Chair of Drilling and Completion Engineering, Montanuniversität Leoben, Austria. The samples were prepared as described in Section 2.1. The mode of the measurement was axial displacement control (API RP 10B) with a speed of 0.5 mm/min until the samples failed. The load and deformation of the samples were recorded and converted into stress and strain. Three measurements for each cement sheath formulation were carried out to account for the reproducibility of the data. The average value plus standard deviation was calculated and is reported in Section 3.3. Additionally, the stress/strain curve was displayed for evaluating the mechanical behavior of the sample and for calculating Young’s modulus.
3. Results and Interpretation
3.1. Mineralogical Investigations
3.1.1. Scanning Electron Microscopy (SEM)
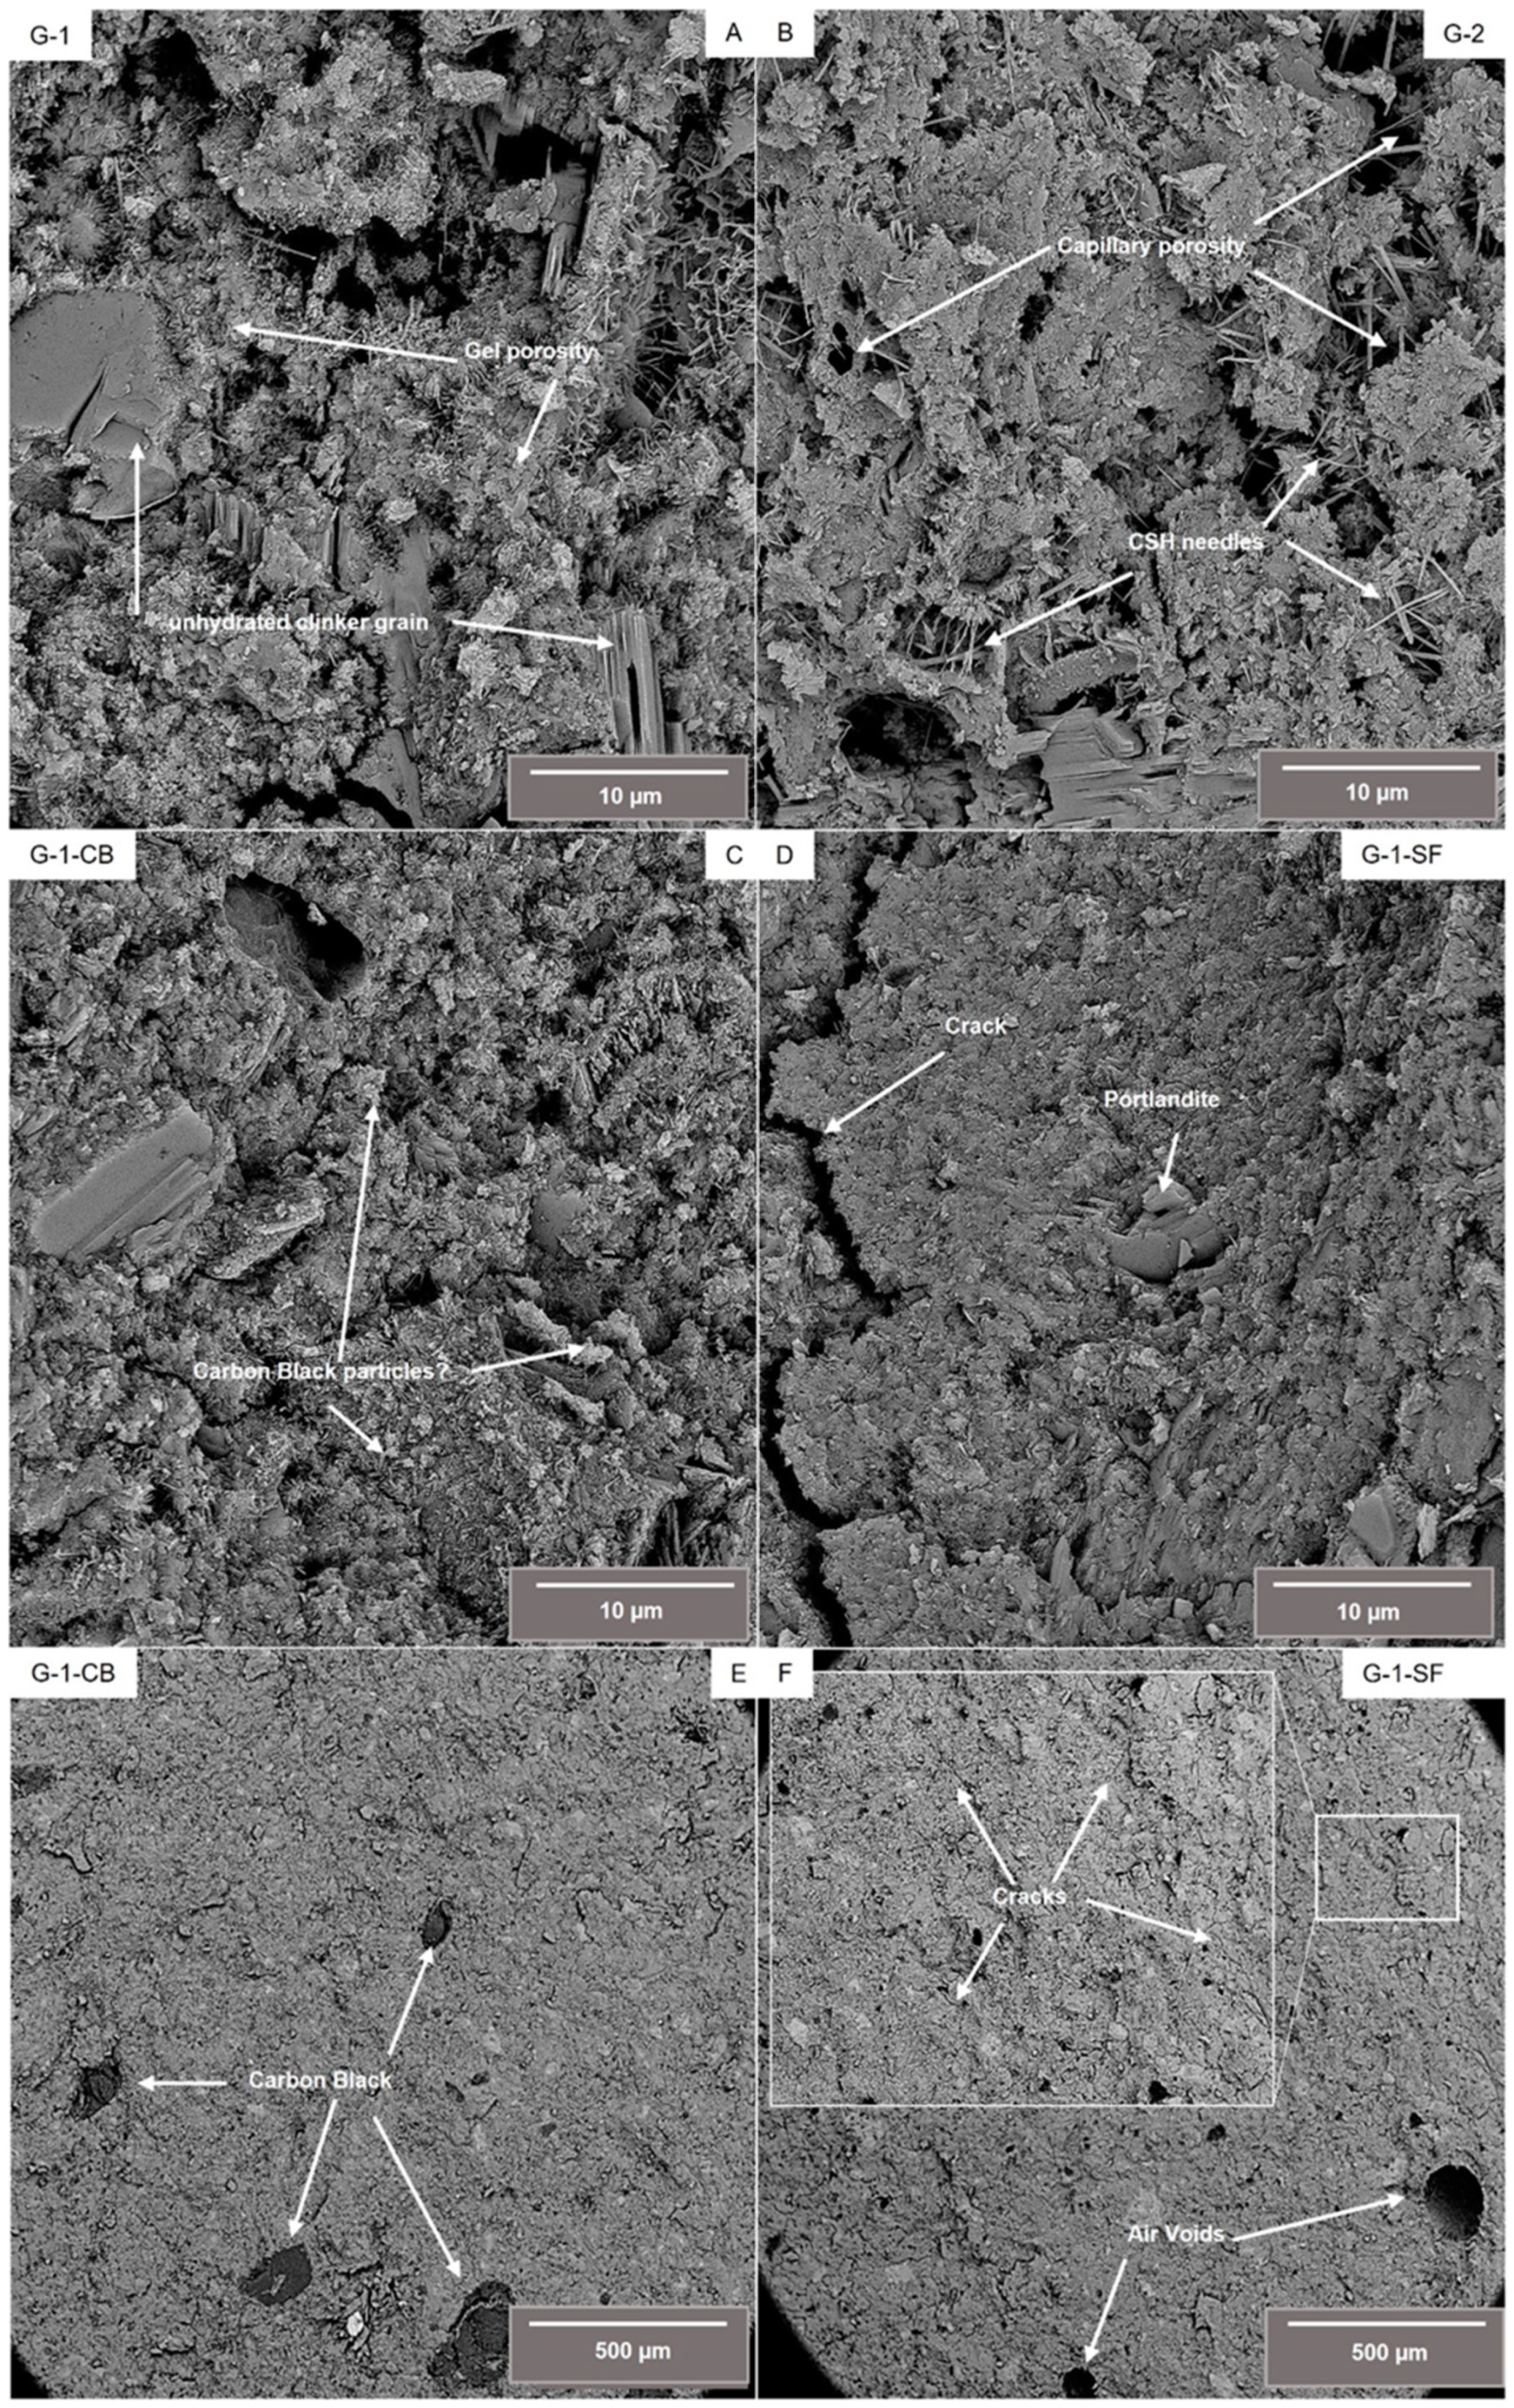
Figure 1 shows back scatter electron (BSE) images of a fractured surface of the four investigated cement sheaths. Figure 1A–D display details at higher magnification, E and F show an overview of samples G-1-CB and G-1-SF at lower magnification. Sample G-1 (Figure 1A) shows the typical microstructure of a class G cement sheath. Thin, needle-like structures can be identified as C-S-H phases. Also, larger particles of non-hydrated clinker phases are visible. Sample G-2 (Figure 1B) shows a similar microstructure. Needles of C-S-H and non-hydrated clinker phases are clearly visible. Compared to G-1, the C-S-H phases tend to be more acicular, with the development of slightly larger and thicker needles. However, aggregates of C-S-H of granular, undefined shape are also present in both samples, making up the majority of the cement sheath matrix. Samples G-1-CB and G-1-SF show a denser microstructure. Especially in G-1-SF, the development of C-S-H needles seems to be suppressed. The majority of the C-S-H form a dense, granular microstructure. Occasionally, larger euhedral crystals of portlandite with hexagonal platy morphology can be observed in all samples. From SEM images, one can also draw first conclusions about the porosity and pore size. G-1 and G-2 show capillary porosity between C-S-H needles and non-hydrated clinker grains, as well as gel porosity within the C-S-H matrix. Both capillary and gel porosity are terms from cement and concrete science describing pores with sizes of 2.5 nm up to 10 µm for capillary porosity and 0.5 nm up to 10 nm for gel porosity. Samples G-1-CB and G-1-SF, however, show a clearly denser microstructure. Especially in G-1-SF, capillary porosity is scarce.
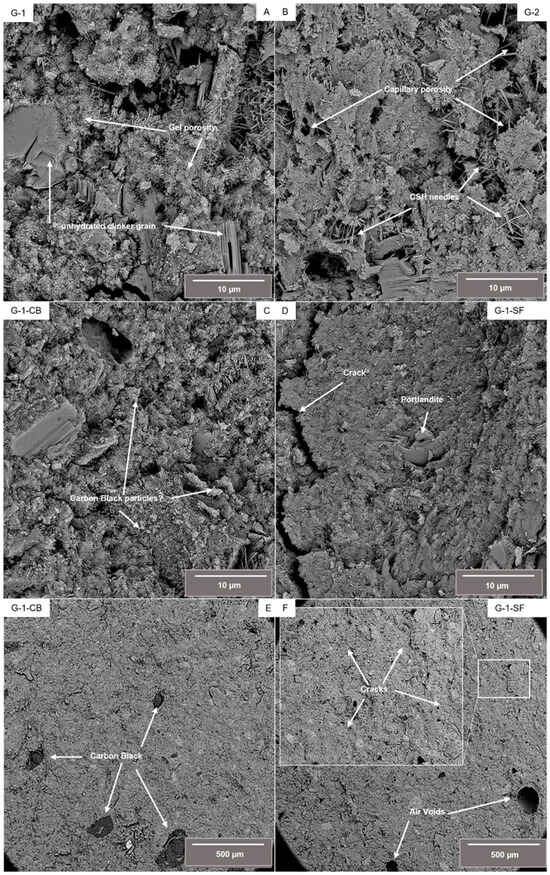
Figure 1.
Backscatter electron (BSE) images of the investigated samples at higher magnification (A–D) as well as an overview of samples G-1-CB and G-1-SF at lower magnification, illustrating the occurrence of agglomerated carbon black particles (E) and cracks (F).
As can be seen in Figure 1E, the added carbon black is not homogeneously distributed within the cement slurry. Even though the used carbon black (N326) was very fine grained with a grain size in the nm range, apparently some larger agglomerated particles did form. It is known from the literature that the addition of carbon black to cement slurries can be tricky due to the hydrophobic character of carbon black [22,23,39]. A surfactant was used to overcome this issue (Table 1). To obtain an improved distribution of carbon black within the slurry, further experiments perfecting the mixture formulation seem to be needed. Maybe the creation of a suspension of carbon black ahead of time, which is then later added to the slurry, can lead to a better distribution within the cement slurry. These, up to several hundred µm, large carbon black particles could act as weak points within this cement sheath, potentially deteriorating mechanical and physical properties.
Sample G-1-SF shows significantly more air voids, e.g., large, round-shaped pores with sizes up to several hundred micrometers (Figure 1F). These voids are formed during the mixing of the slurry due to the entrapment of air. This observation is a good indicator regarding the fluid-migration-blocking property of this mixture, which is crucial for cements used in the geoenergy industry [2,40]. During the placement of the cement slurry within the borehole, fluid migration might cause the up-well movement of fluids through the cement slurry, resulting in the formation of channels, fissures, or cracks, limiting the mechanical and physical resistance of the cement sheath against the forces initially placed. Obviously, the addition of silica fume decreases the permeability of the slurry, limiting its ability to outgas air and trapping it. Additionally, the sample with the added silica fume shows promoted crack formation. Occasionally, FE-SEM investigation has indicated that all samples have some small (~1 µm) microcracks. However, sample G-1-SF shows significantly more of these microcracks, which are homogeneously distributed over the investigated fractured surface (Figure 1F). This might indicate the much more brittle mechanical behavior of this cement sheath mixture (Section 3.3). Although the addition of silica fume resulted in a much denser-looking microstructure with suppressed capillary porosity, indicating a decreased matrix permeability, the bulk permeability of the hardened cement sheath compared to the decreased permeability of the cement slurry might be significantly increased due to the crack formation.
In summary, it can be concluded that high-resolution FE-SEM is a powerful tool by which to obtain a first, quick overview of the characteristics of the microstructure and a first qualitative estimation regarding porosity, pore sizes, and even permeability behavior. However, it is impossible to make reasonable, quantitative assumptions about these properties based on BSE or SE images. Furthermore, one has to consider that the investigation of a fractured surface might not be representative due to the fact that a fractured surface always develops in a weakened area of the sample; therefore, interpretation has to be cautious.
3.1.2. X-ray Diffraction (XRD)
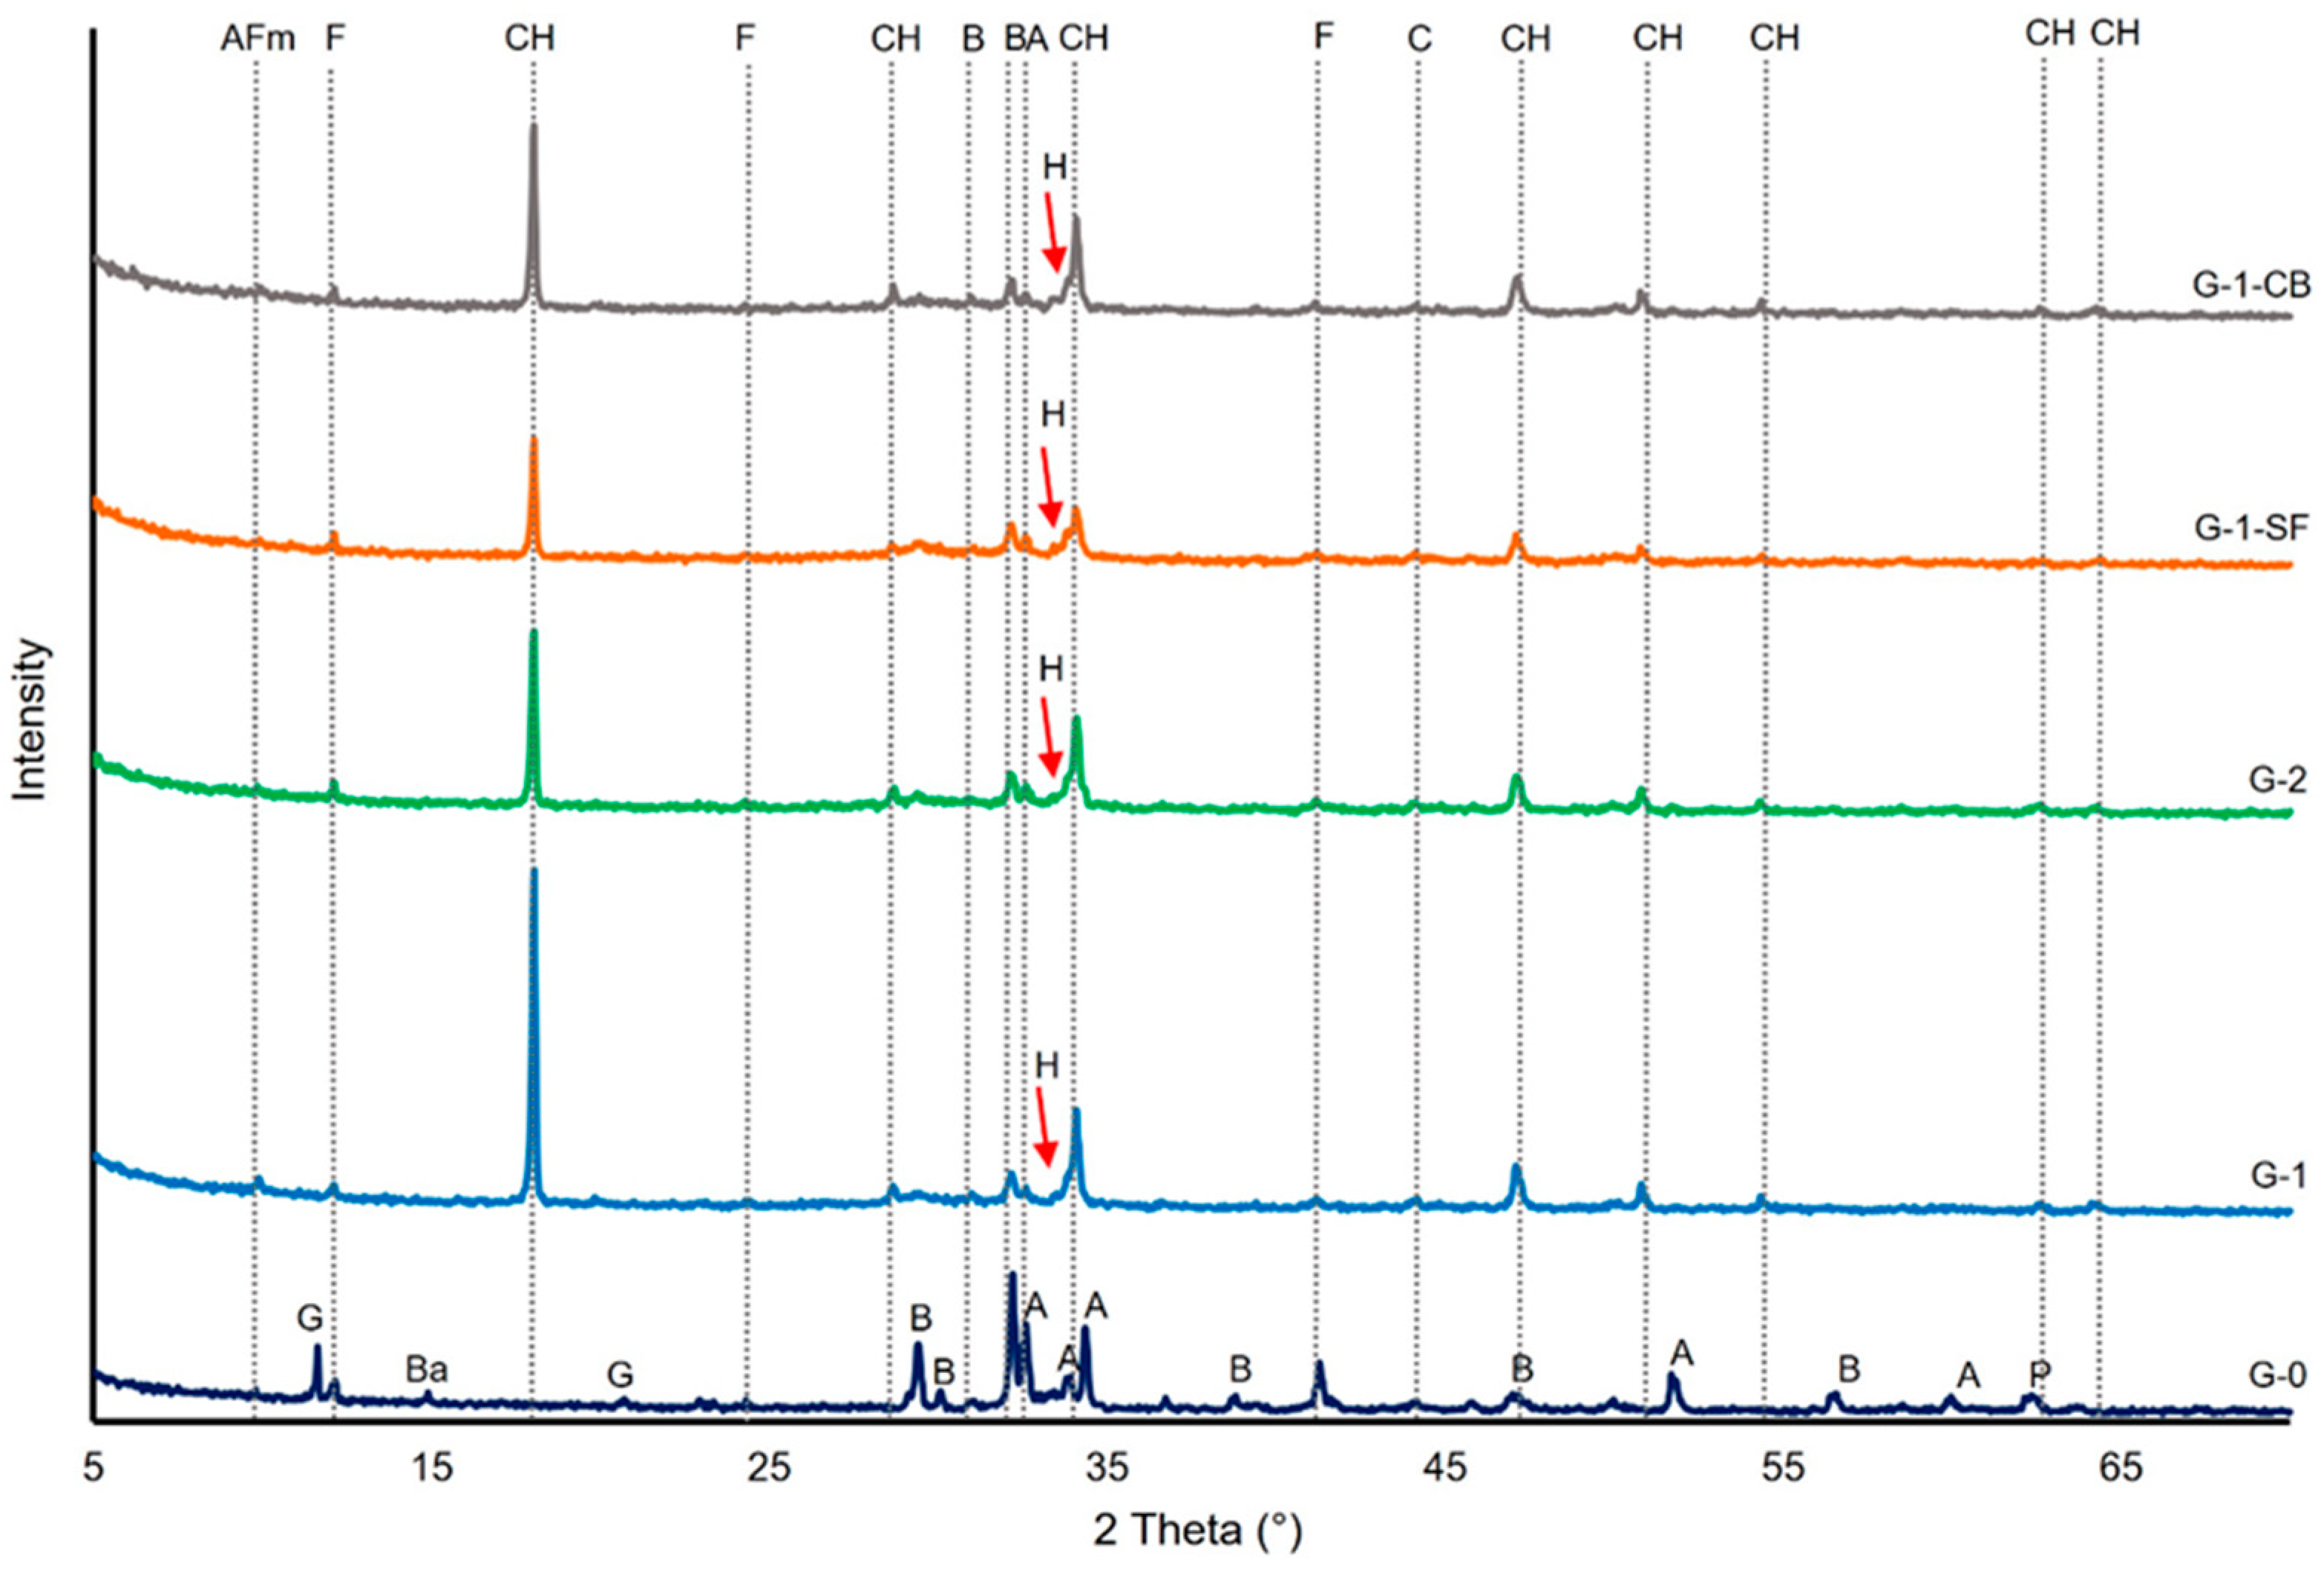
Figure 2 shows the powder diffraction patterns of tested cement sheaths and the original non-hydrated cement (G-0). The main peaks of the major phases present in the initial cement and cement sheath are marked. The main crystalline phase formed during the hydration of the cement paste is portlandite (CH). The formation of monosulfoaluminate (AFm) can be clearly seen in sample G-1, with the major peak of this phase at a 2θ angle of ~9.8°. In the three other cement sheaths, this peak is not so clearly developed. Especially in sample G-1-SF, it seems to be missing, indicating that the addition of silica fume suppresses the formation of AFm. However, ettringite, a crystalline tri-sulfate phase usually forming in the early hydration states of cement pastes and later transforming into AFm, was also not detected by XRD. This absence can be explained by the curing duration of 28 days. After this time span and the low amounts of gypsum and aluminate (C3A) in the initial cement class G, all the formed ettringite should have transformed into AFm [36]. Thus, it is unclear in which phases the sulfur is incorporated in sample G-1-SF. C-S-H has been discussed as a potential phase that can incorporate SO3− ions either between the layers of the C-S-H crystal structure or substituting for silicon ions [41,42,43].
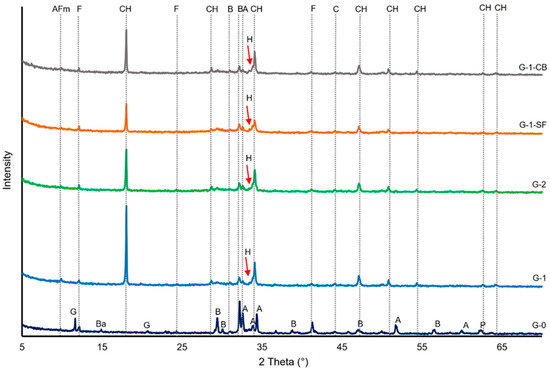
Figure 2.
X-ray diffractograms of the investigated cement sheaths and the initial cement (G-0). AFm: Monosulfoaluminate, CH: Portlandite, Ba: Badellite, A: Alite, B: Belite, C: Calcite, F: Ferrite, G: Gypsum, H: Hibschite, P: Periclase.
The residual clinker phases detected by XRD are ferrite (C4AF) and belite (C2S). This is in accordance with the relative slower hydration reactions of these two clinker phases compared to alite (C3S) and aluminate (C3A). Compared to the XRD pattern of the initial clinker (G-0), alite peaks disappeared in contrast to a few peaks of ferrite and belite (Figure 2). The formation of hibschite, a hydrated variety of grossular, can be assumed, as indicated by the non-symmetric part on the left side of the third portlandite reflection peak. Since portlandite is assumed to be a highly crystalline phase, a symmetric reflection peak would be expected, as can be seen for all the other portlandite refection peaks (Figure 2). By comparing the intensities of the portlandite reflection peaks, an estimation of the quantitative proportions can be drawn. G-1 seems to have the highest portlandite content, and G-1-SF the lowest. Other common hydration products, especially C4AF, such as hydrogarnet, despite the indication of hibschite, could not be detected, maybe due to their absence or poor crystalline structure. In general, no striking difference in the qualitative phase composition of the four cement sheath samples due to the addition of chemically non-reactive carbon black and pozzolanic silica fume was observed. The slightly elevated, plateau-like area in the 2θ range of ~27° and 35° is due to the amorphous C-S-H phases [35].
3.1.3. Simultaneous Thermogravimetric Analysis (STA)
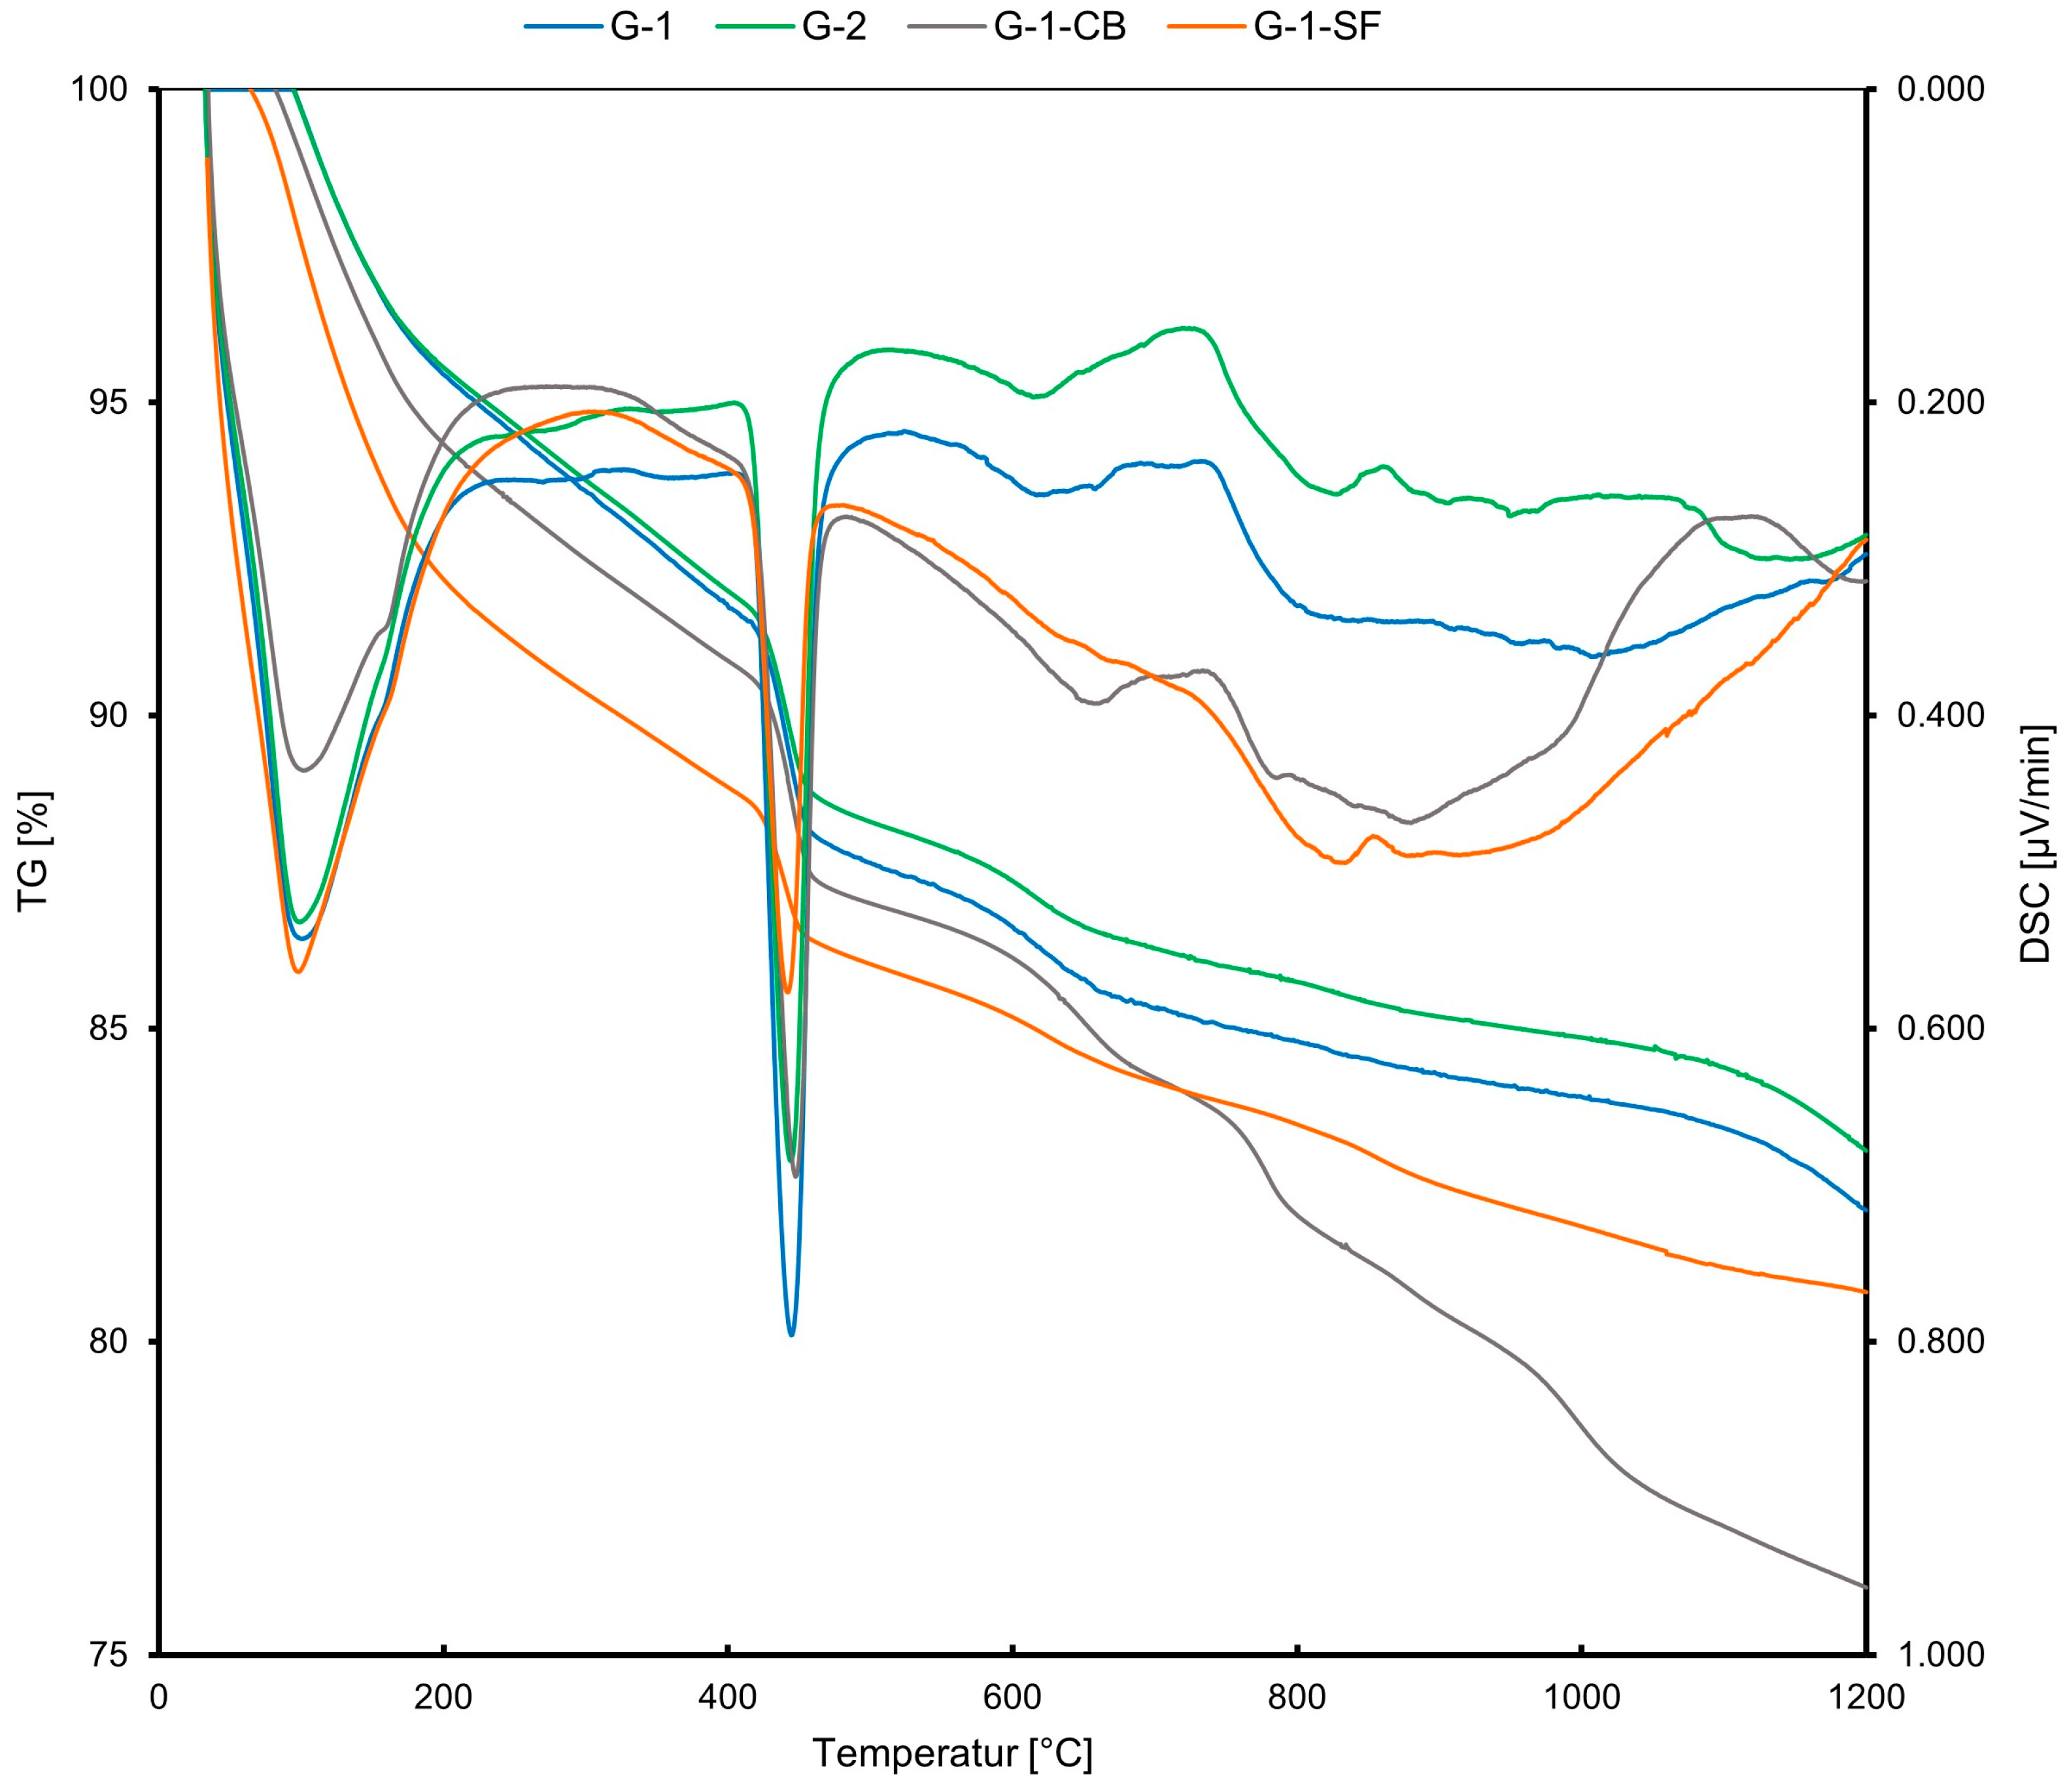
The results obtained from STA are presented in Figure 3. The x-axis shows an increasing temperature during the experiment. The y-axes, on the left side, show the thermogravimetric weight loss (TG) in mass% and, on the right side, the differential scanning calorimetry (DSC) in µV/mg, indicating an exothermal or endothermal reaction for the observed weight loss. Table 3 summarizes the quantitative phase contents obtained from STA. All four samples show very similar behavior during heating. However, the calculated quantitative portions of portlandite and C-S-H differ (Table 3). The curves show four rapid weight losses. The first loss in a temperature range of 100–200 °C is mainly due to the dehydration of C-S-H and AFm, or ettringite. However, since the cement pastes were cured for 28 days, all ettringite should have transformed into AFm due to the kinetics of the hydration reactions [36]. The AFm content should also be minor due to the low gypsum and aluminate portions in the initial class G cement (Table 1) and the determined phase composition of hydrated cement class G from other studies [7]. Therefore, it was concluded that the majority of this low-T weight loss can be accounted for by C-S-H. The second major weight loss at 450–500 °C is due to the dehydroxylation of portlandite. A third and fourth weight loss can be observed at 650 °C and 800 °C. These are due to the release of CO2 from carbonates. The third peak is caused by the decarbonation of allotropic forms of calcite, namely vaterite and aragonite, while the fourth peak is due to the decarbonation of well-crystallized calcite [44,45]. The existence of carbonates in cement sheaths can be explained by the carbonation of the samples during preparation and storage. Especially when the cement pastes are milled, the powder is likely to react with the CO2 in the atmosphere, resulting in minor carbonation. In the literature, different explanations have been given for whether portlandite, C-S-H, or both react with CO2 to form carbonates [44,45,46,47]. Some studies have suggested that both phases undergo carbonation simultaneously, while others indicate that portlandite is carbonated first. Despite this discussion, a consensus has been reached that, at the onset of carbonation, the carbonation of portlandite is dominant.
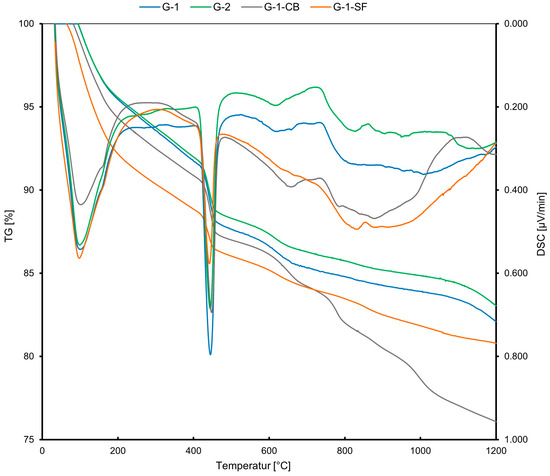
Figure 3.
STA curves displaying the weight loss of the samples (TG in %) and the exothermic or endothermic character of the reaction (DSC).

Table 3.
Quantitative contents (mass%) of portlandite, C-S-H (+AFm), and carbonates as obtained by STA.
Concerning our case, the G-1-SF sample has a lower portlandite content (Table 3) due to the added silica fume, which acts as pozzolanic material, forming C-S-H from portlandite and silica fume. Also, the weight loss due to the release of CO2 is lower compared to the other samples (Figure 3), indicating a lower carbonate content compared to the other three samples. This strengthens the conclusion that portlandite plays a more prolonged role during the early carbonation of cements. However, it is clearly visible from the TG data that the samples underwent some carbonation, which is nearly inevitable during preparation and storage [35].
In samples G-1, G-2, and G-1-SF, the fourth weight loss peak is very minor compared to sample G-1-CB, indicating a higher calcite content and maybe a higher degree of carbonation in the sample with added carbon black. Also, a fifth peak at ~1000 °C developed in this sample. This peak is due to the release of CO, which comes from an equilibrium reaction with CO2 when carbon is present at high temperatures (Boudouard Reaction).
G-1 and G-2 show similar weight loss in the 100–200 °C temperature range, indicating a similar quantitative amount of C-S-H + AFm. G1-CB and especially G-1-SF show a significantly higher weight loss in this range, indicating higher C-S-H + AFm content. Since the added carbon black is assumed to be chemically non-reactive during the hydration of the cement paste, the observation of a slightly increased C-S-H content for sample G-1-CB compared to G-1 and G-2 is not fully understood. The addition of carbon black should reduce the total amount of cement clinker phases in the initial slurry and, therefore, one would expect a lower C-S-H content in the cement sheath. This leaves room for speculation and further investigation. The DSC curve shows a less pronounced first peak (at about 100 °C) compared to the other three samples (Figure 3). Maybe carbon black causes an exothermic reaction at this temperature, reducing the endothermic dehydration peak of C-S-H and contributing to the increased TG loss.
3.1.4. Electron Probe Micro Analysis (EPMA)
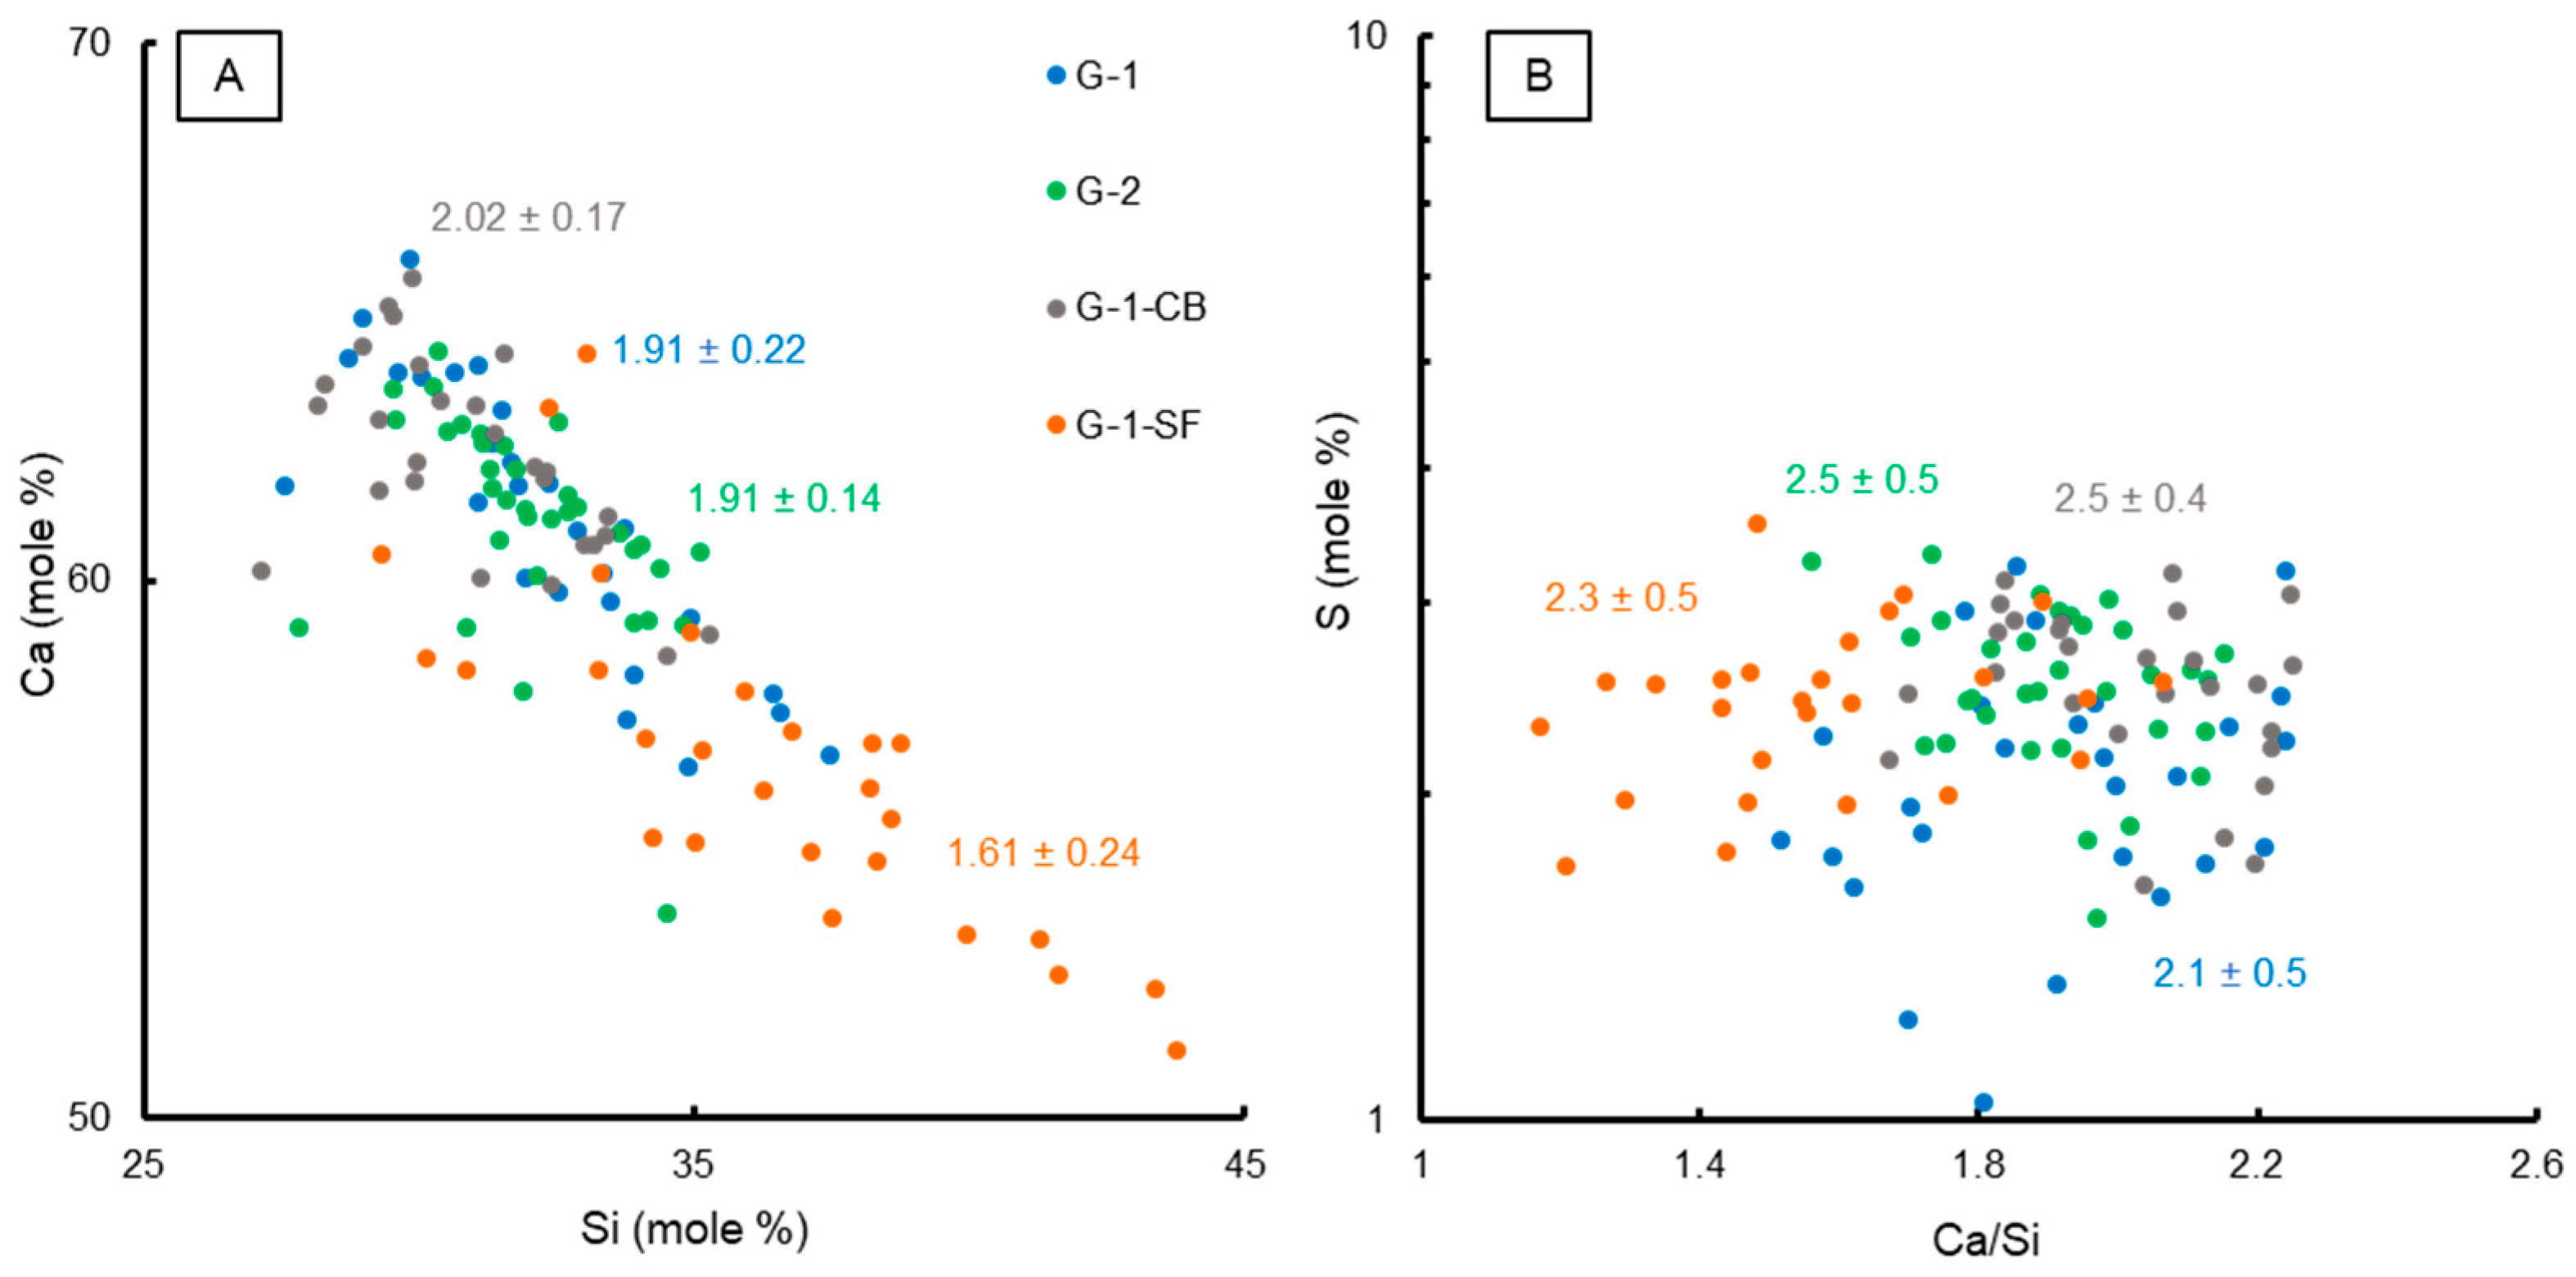
The results of the chemical EPMA analyses are summarized in Figure 4. In total, 20–30 measurement points were carefully selected within the C-S-H matrix area for each sample. The mole fractions of Ca vs. Si are plotted in Figure 4A, illustrating the change of Ca/Si by adding silica fume to the cement paste mixture, indicating not just a change in the quantitative portion of the C-S-H (Table 3), but also a change in the mineral chemical composition of the C-S-H phase. Additionally, the mean average Ca/Si ratio of all measurements plus the standard deviation are given on the graph. Sample G-1-SF clearly shows a lower average Ca/Si ratio of 1.61 compared to the other three samples, which have Ca/Si ratios of 1.91 to 2.02 for G-1, G-2, and G-1-CB. These values are slightly higher than the average reported value of 1.75 for pure C-S-H [10,42,48,49], but are still in the range reported by various studies of Ca/Si ratios [15,42]. Also, one has to consider that the investigated C-S-H phases are not pure calcium silicon hydrate; other elements such as Al and Mg or even sulfate anions are likely to be incorporated, influencing the measured Ca/Si ratio.
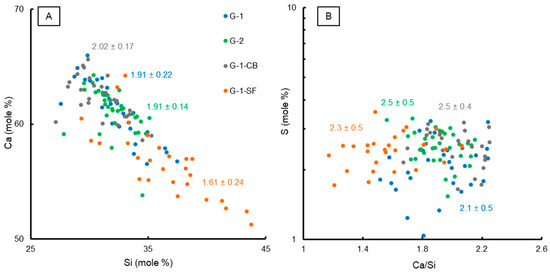
Figure 4.
Binary plots showing chemical characteristics of C-S-H phases based on EPMA analyses. (A) Ca vs. Si (mole %) with the calculated mean Ca/Si ratios. (B) Ca/Si vs. S content (mole %) with the mean S value of the C-S-H matrix for each sample.
A lower Ca/Si ratio usually means a higher density of the C-S-H phase with a high polymerization of silicate ions, potentially increasing the mechanical strength, although this effect is not yet fully understood [50]. However, EPMA data clearly show that the addition of silica fume changes the mineral chemistry of the most important phase when it comes to the mechanical strength of cement sheaths. Additionally, FE-SEM imaging supports the development of a denser microstructure in sample G-1-SF (Figure 1).
Sample G-1-CB shows a slightly increased Ca/Si ratio compared to G-1 and G-2. Since carbon black is assumed to be chemically non-reactive, this observation is surprising, as is the increased C-S-H content determined by STA (Section 3.1.3). Maybe the presence of nanoparticles of carbon black physically hinders the growth of C-S-H crystallites, not just affecting the morphology (Figure 1), but also the chemical composition. A higher Ca/Si ratio means a less dense structure of the C-S-H phase with a lower degree of silicon ion polymerization [15,50].
In Figure 4B, the Ca/Si ratio is plotted against the mole fraction of S together with the mean mole fraction of S plus the standard deviation of all measurements. Sample G-1 shows a slightly lower S content compared to the other three samples. G-1 also shows a clearly developed AFm peak in the XRD pattern (Figure 2) compared to the other three samples. This could indicate that, in the samples with a changed mix formulation, the formation of sulfur-bearing phases (e.g., AFm) could be hindered or limited, leading to the enhanced incorporation of sulfate in the C-S-H phase, potentially substituting silicon [43]. However, these are only vague indications. As can be seen from Figure 4B, many EPMA analyses of G-1 yield a very similar S content to the other three samples. Only a few measurements yield lower contents. Further investigations on the atomic scale of C-S-H using TEM could help to confirm these observations.
3.2. Physical Properties
3.2.1. Porosity and Pore Size Distribution
Determining the porosity and pore size distribution of cement pastes is not straight-forward, as various evaluation methods (e.g., MIP, gas adsorption, or drying methods) can yield different results [35]. Differences are due not only to the effects of sample preparation, but also to the complex cement microstructure. Cement pastes are characterized by an enormous pore size range, from the nm scale to the mm scale. Evaluating the entire pore size distribution is rather complicated and is mainly carried out by MIP, which has limitations at the nm scale. However, the pore space in the nm range, e.g., the gel porosity, is also very important, since it makes up a large part of the porosity and strongly influences the microstructure of the major phase in cement pastes, the C-S-H. Therefore, additional N2 adsorption/desorption at 77 K measurements were performed in this study to attain a more complete insight into the range of nanopore sizes.
Mercury Intrusion Porosimetry (MIP)
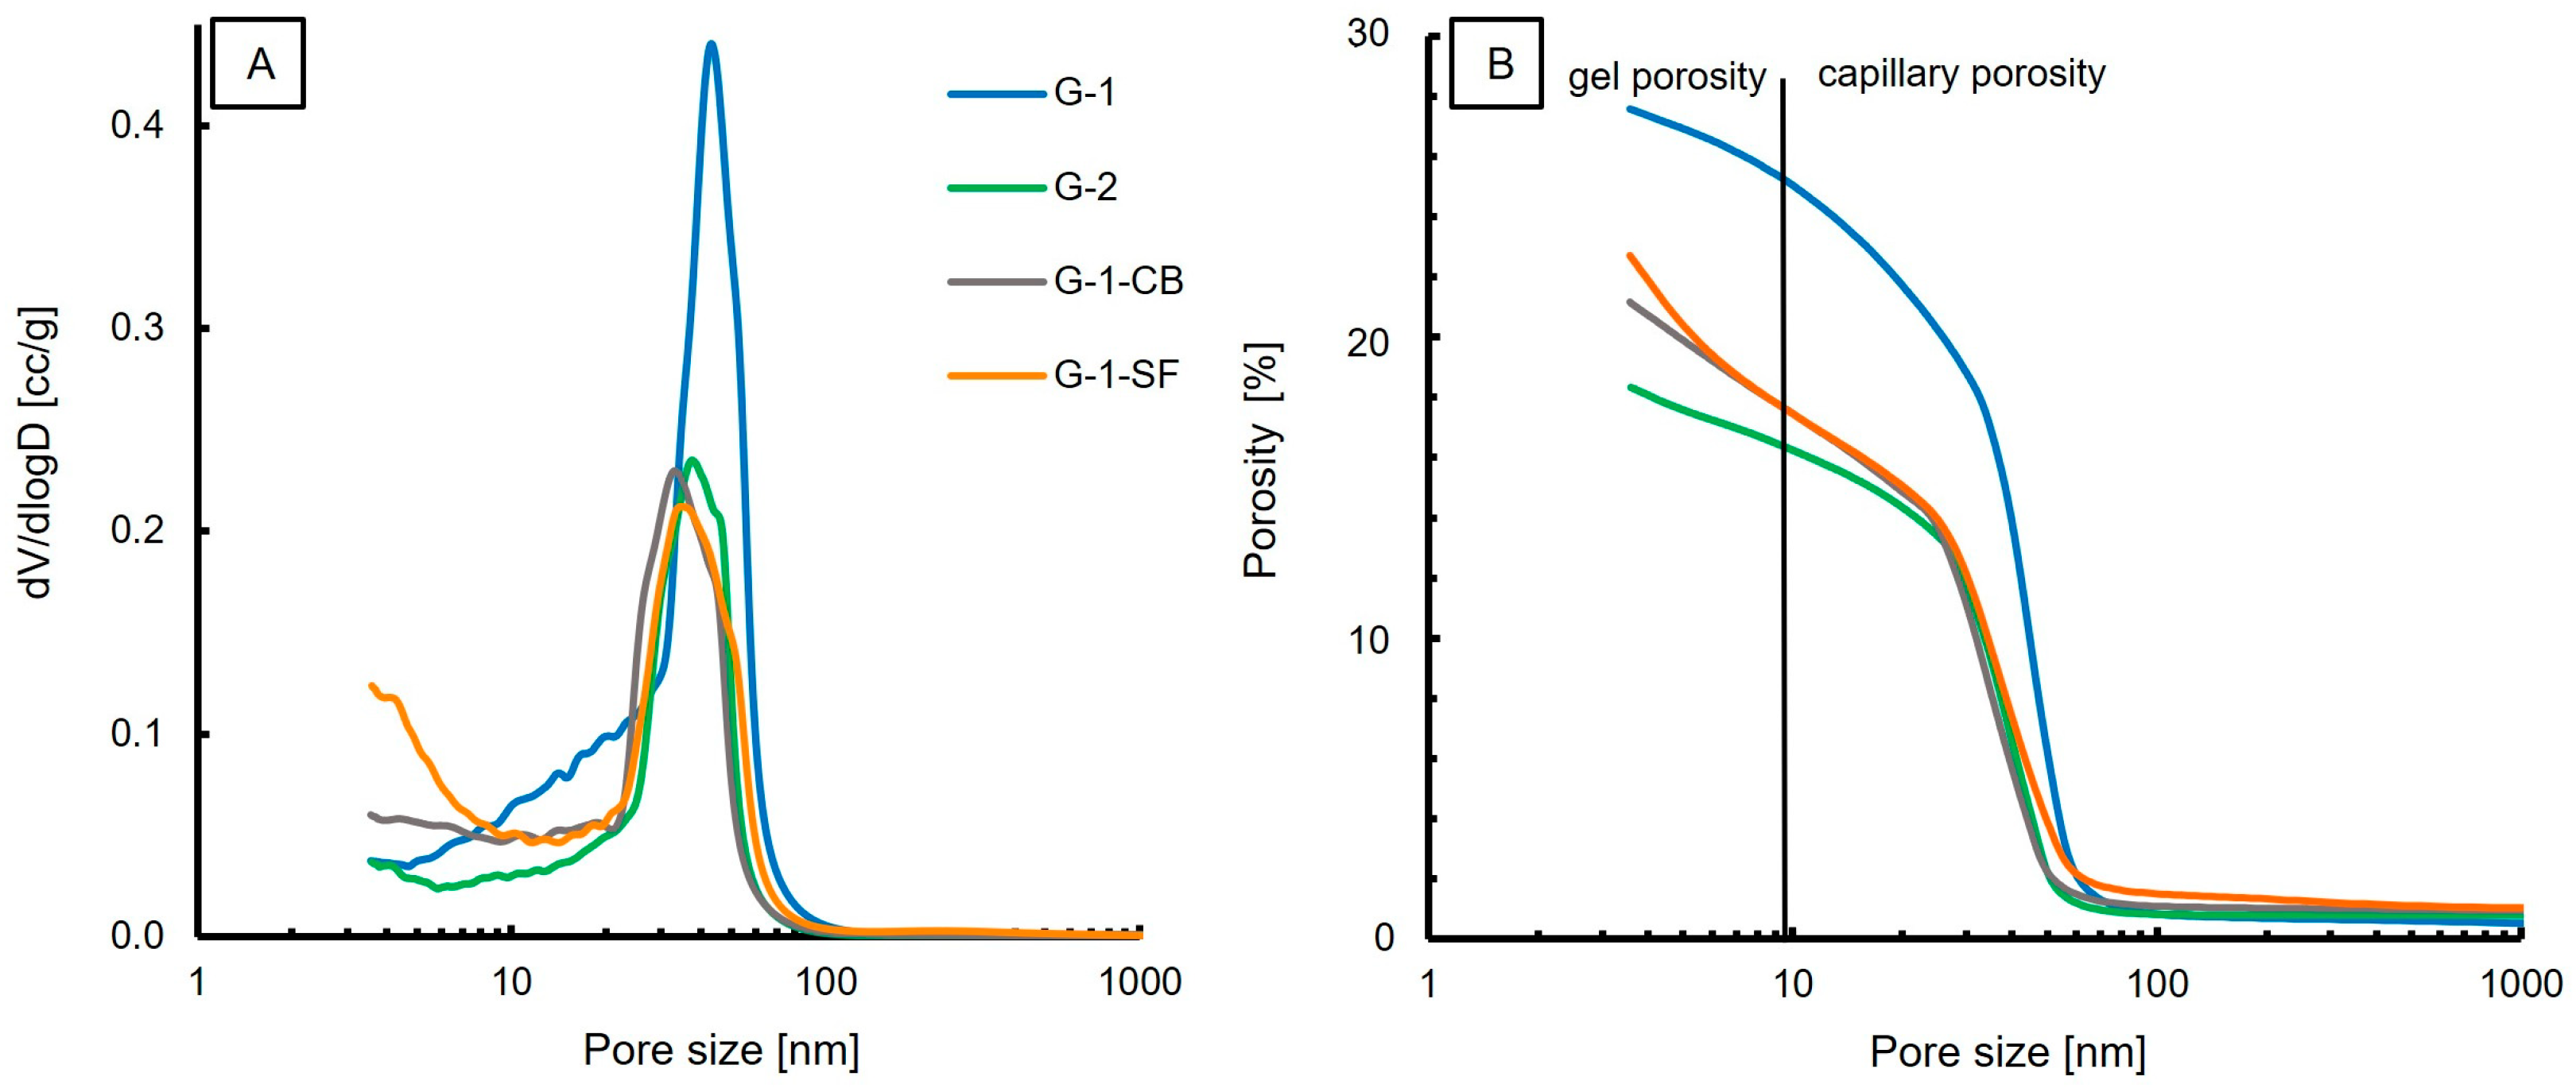
The cumulative porosity and pore size distribution obtained by MIP measurements are presented in Figure 5. The measured total porosity, density, and surface area are presented in Table 4. The results show one dominant class of pore size in all four samples, with pore sizes ranging from 20 nm to 60 nm with a mean diameter of 43 nm, 39 nm, 34 nm, and 37 nm for G-1, G-2, G-1-CB, and G-1-SF, respectively. This shows that the reduction of the water/cement ratio and the addition of carbon black and silica fume did decrease the mean pore size diameter slightly. Sample G-1-SF shows a possible second population, with pore sizes smaller than 5 nm (Figure 5A). This second population is missing in the other three samples. The dominating pore population is in the range of 20–60 nm and can be classified as capillary porosity [35,38,51]. Therefore, this study confirms that mercury intrusion porosimetry is a suitable method to measure the capillary porosity of cement pastes [7].
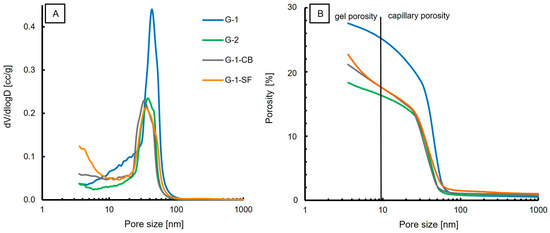
Figure 5.
MIP results; (A) Pore size distribution with one dominating population in the range of 30–60 nm. (B) Porosity vs. Pore size.

Table 4.
Physical parameters of the investigated cement sheaths obtained by MIP, N2 adsorption, and permeability measurements. The porosity for the N2 adsorption experiment was calculated using the determined pore volume and skeletal density obtained from He-pycnometry.
Minor amounts of the total porosity are attributed to gel porosity (Figure 5B); the dominant porosity is capillary porosity. However, MIP might underestimate the volume of bigger pores in a material [35] as these larger pores might only be accessible through small pore throats (i.e., the ink-bottle effect), resulting in the dimension of the pore throats being the reported pore size.
The amount of gel porosity is comparable for G-1, G-2, and G-1-CB. Sample G-1-SF shows a higher value of gel porosity (Figure 5B). This is supported by the obtained surface area values (Table 4); G-1-SF shows the largest surface area of 39 m2/g. Typically, the surface area increases with decreasing grain size. G-1 and G-1-CB have similar surface area values. Sample G-2 yields the smallest surface area (19 m2/g). G-2 also has the lowest total porosity, at 17.59%. The addition of carbon black and silica fume did decrease the porosity by about 6% and 4%, respectively, compared to the total porosity of 26% of G-1.
N2 Adsorption at 77 K
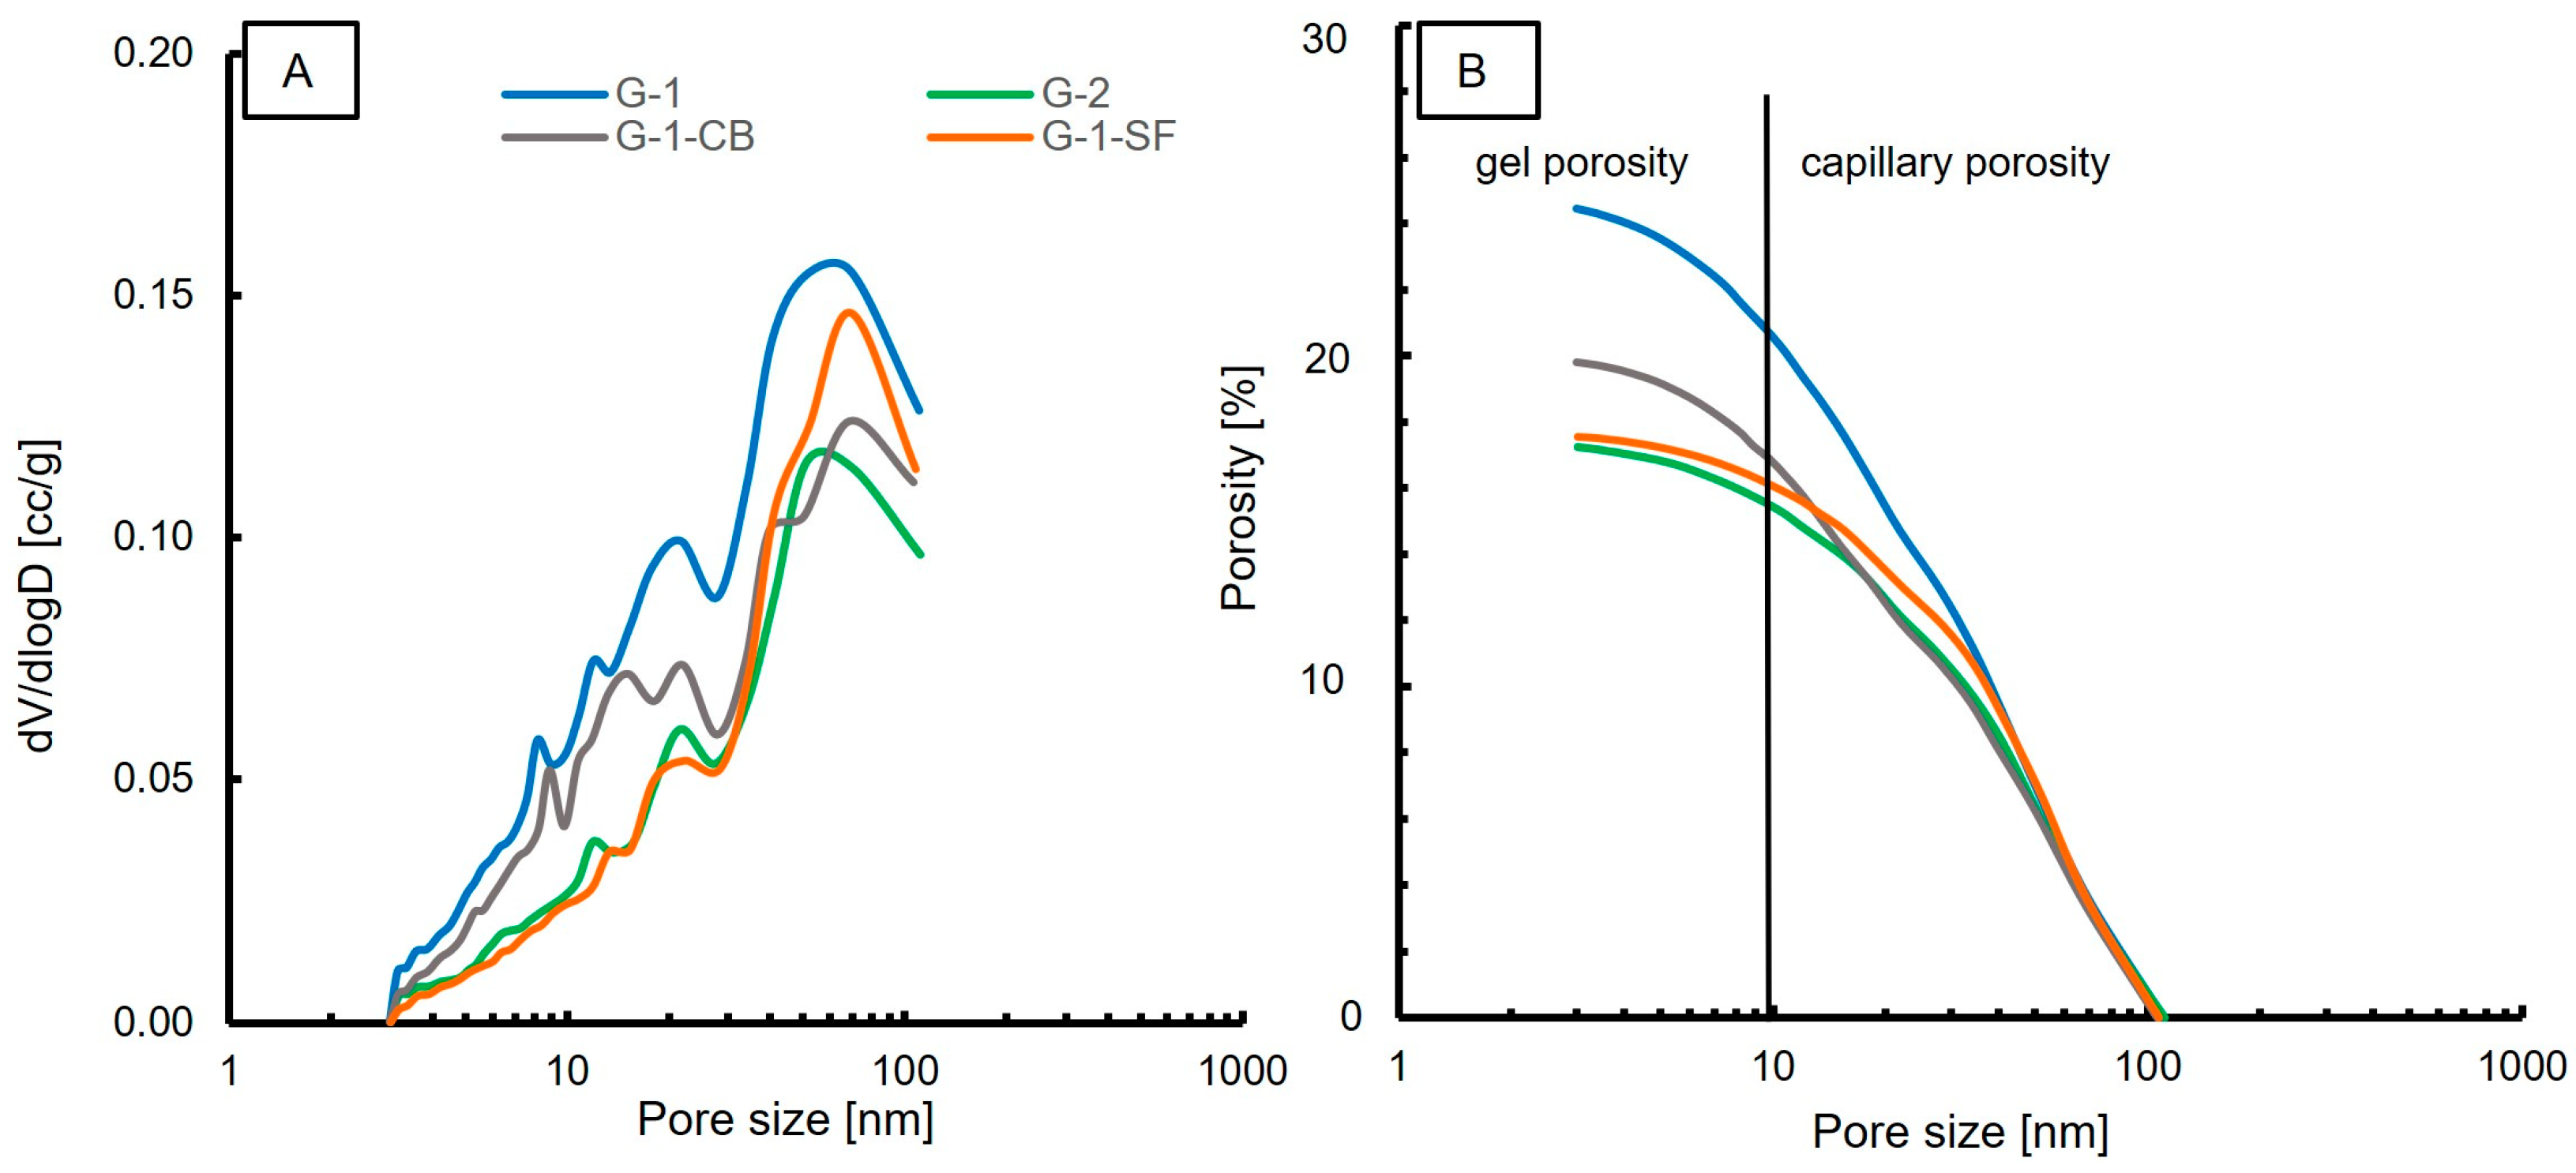
In contrast to MIP measurements, nitrogen adsorption/desorption measurements at 77 K can accurately determine the volume of the nanopores (<100 nm). Causes for differences in the porosity and pore size distribution measurements of these two methods have been discussed in the literature [52,53,54]. The dominant pore diameter for each sample, porosity, and surface area are reported in Table 4. Figure 6A shows the pore size distribution. In general, a similar trend compared to the MIP results is observed. One dominant population in the range of 50–70 nm is observed in all samples. This pore size range is slightly larger compared to the MIP measurements, but is in accordance with the MIP results. Additionally, at about 20 nm, a second, minor pore population is clearly visible in all samples. The smallest pore size obtained by N2 adsorption is around 3 nm. However, one has to mention that, due to the limitations of the employed BJH method, it is not possible to detect pores that are significantly smaller than 3 nm. Also, the observation of decreasing pore volume by changing the slurry formulation is in accordance with MIP results. The measured porosity values are slightly lower compared to the MIP values (Table 4). However, both methods list G-1 as the sample with the highest porosity, with values of 25.9% and 24.5%, respectively. G-2 shows the lowest porosity values, with 17% for each method. Sample G-1-SF shows significant differences in the obtained porosity values. MIP yielded a porosity of 22%, whereas nitrogen adsorption yielded only 17.5%.
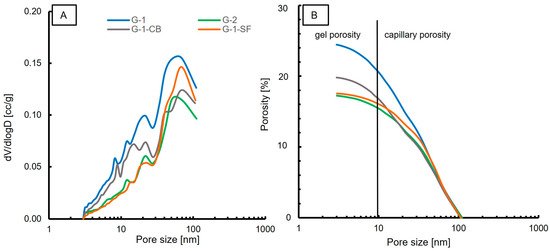
Figure 6.
Results of N2 adsorption experiments. (A) Pore size distribution; (B) Porosity vs. Pore size.
Figure 6B displays the porosity versus the pore size. Similar to MIP, the majority of measured porosity values fall in the range of capillary porosity. Roughly 8–10% of the total porosity is attributed to gel porosity. G-2 and G-1-SF show a lower gel porosity content compared to samples G-1 and G-1-CB. This is in contrast to what MIP indicated. The obtained surface area values are lower for all samples compared to the MIP results, but the same trend is observed for samples G-1, G-1-CB, and G-2. The results of G-1-SF are contradictory. It shows the lowest surface area of all four samples in the N2 adsorption experiment, whereas MIP indicated the highest surface area.
Also, the indication of a second population in G-1-SF with a pore size of 3 nm as displayed by MIP (Figure 5A) is not confirmed in the N2 adsorption experiment. To explain this discrepancy, one has to consider the different working principles and interaction mechanisms of the two techniques, as well as the employed models for data analysis. Other factors could be the sample preparation and sample drying process. For MIP, small, fractured pieces were analyzed, whereas for N2 adsorption, a grinded powder was used. We can speculate that mechanical forces applied during milling in a hand mortar caused a reduction of the smallest pores. Also, the drying process may have led to a change in microstructure, since it is known that temperature has a significant influence on cement paste microstructures [7]. However, the drying temperatures for both methods were the same at 40 °C, so we exclude this explanation.
3.2.2. Permeability
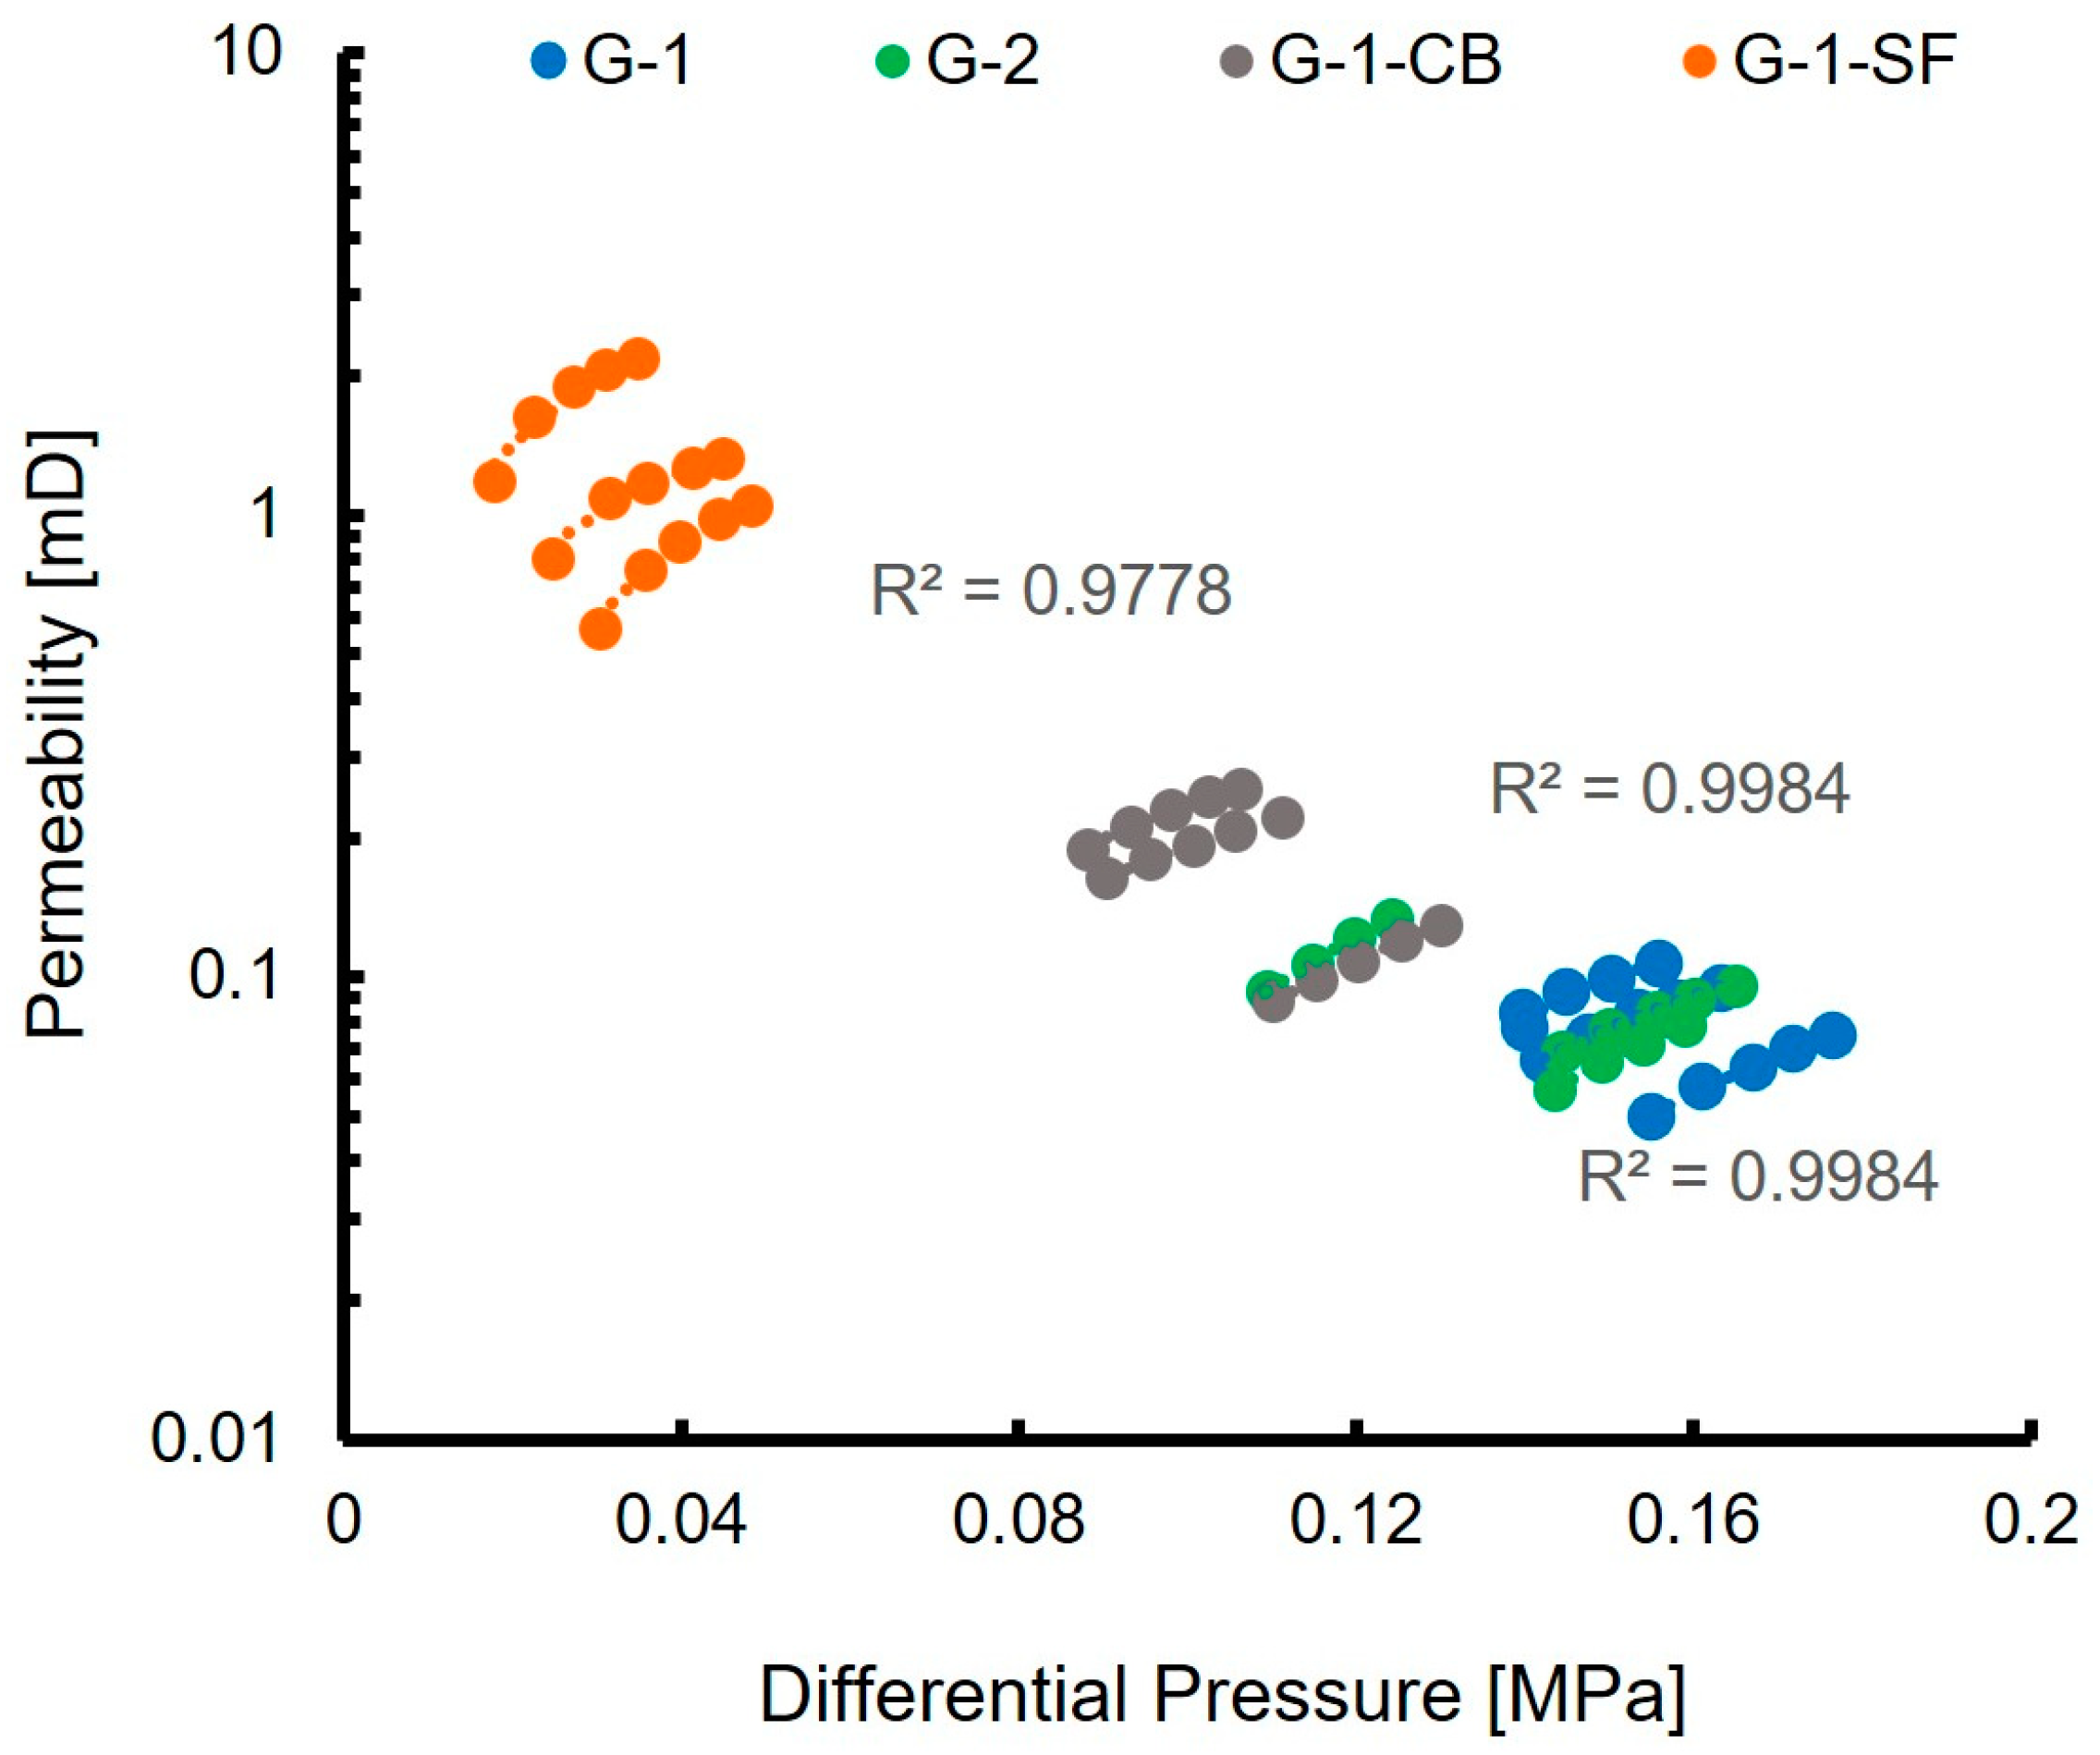
The measured nitrogen gas permeability of the investigated cement sheaths is reported in Table 4. G-1 and G-2 show a very similar permeability of 0.08 and 0.09 mD, respectively, which is in accordance with values reported in other studies [16]. G-1-CB shows a slightly higher permeability of 0.18 mD, G-1-SF shows a significantly higher permeability of 1.26 mD.
Figure 7 displays the raw data obtained during the permeability measurements. It illustrates the applied differential pressure of the measuring device plotted against the permeability calculated by the software. For each sample, five permeability values were recorded, while the applied differential pressure of the permeating nitrogen gas was increased (Section 2.8). As can be seen, the linear correlation fits nearly perfectly with correlation values of R2 higher than 0.9. This acts as a quality control for the measurement and allows for the calculation of the mean permeability values, presented in Table 4.
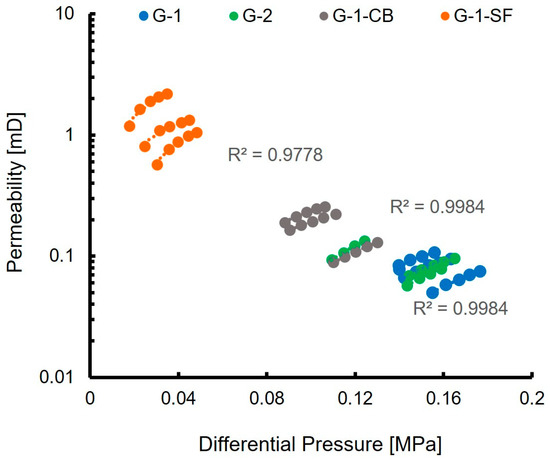
Figure 7.
Results of nitrogen permeability measurements. The nominal minimum permeability the equipment is able to measure is 0.01 mD.
One aspect of the initial idea of adding carbon black and silica fume to the cement slurry was to reduce the permeability of the hardened cement sheath. Carbon black was added with the intention of filling the pore space and reducing it, thereby lowering the ability of gases to permeate through. As pointed out, silica fume additionally causes pozzolanic reactions, increasing the amount of C-S-H phases and also changing the microstructure of the cement paste (see Section 3.1 and Section 3.2). The increased permeability of G-1-SF observed in this study can be explained by the formation of shrinkage cracks due to the higher water consumption caused by the pozzolanic reaction and the mechanically more brittle behavior of the sample (Section 3.3). This effect has been documented before [19,27,55,56]. The agglomeration of aggregated carbon black particles (Figure 1) might cause heterogeneity within the cement paste, also affecting its physical and mechanical performance.
3.3. Mechanical Properties
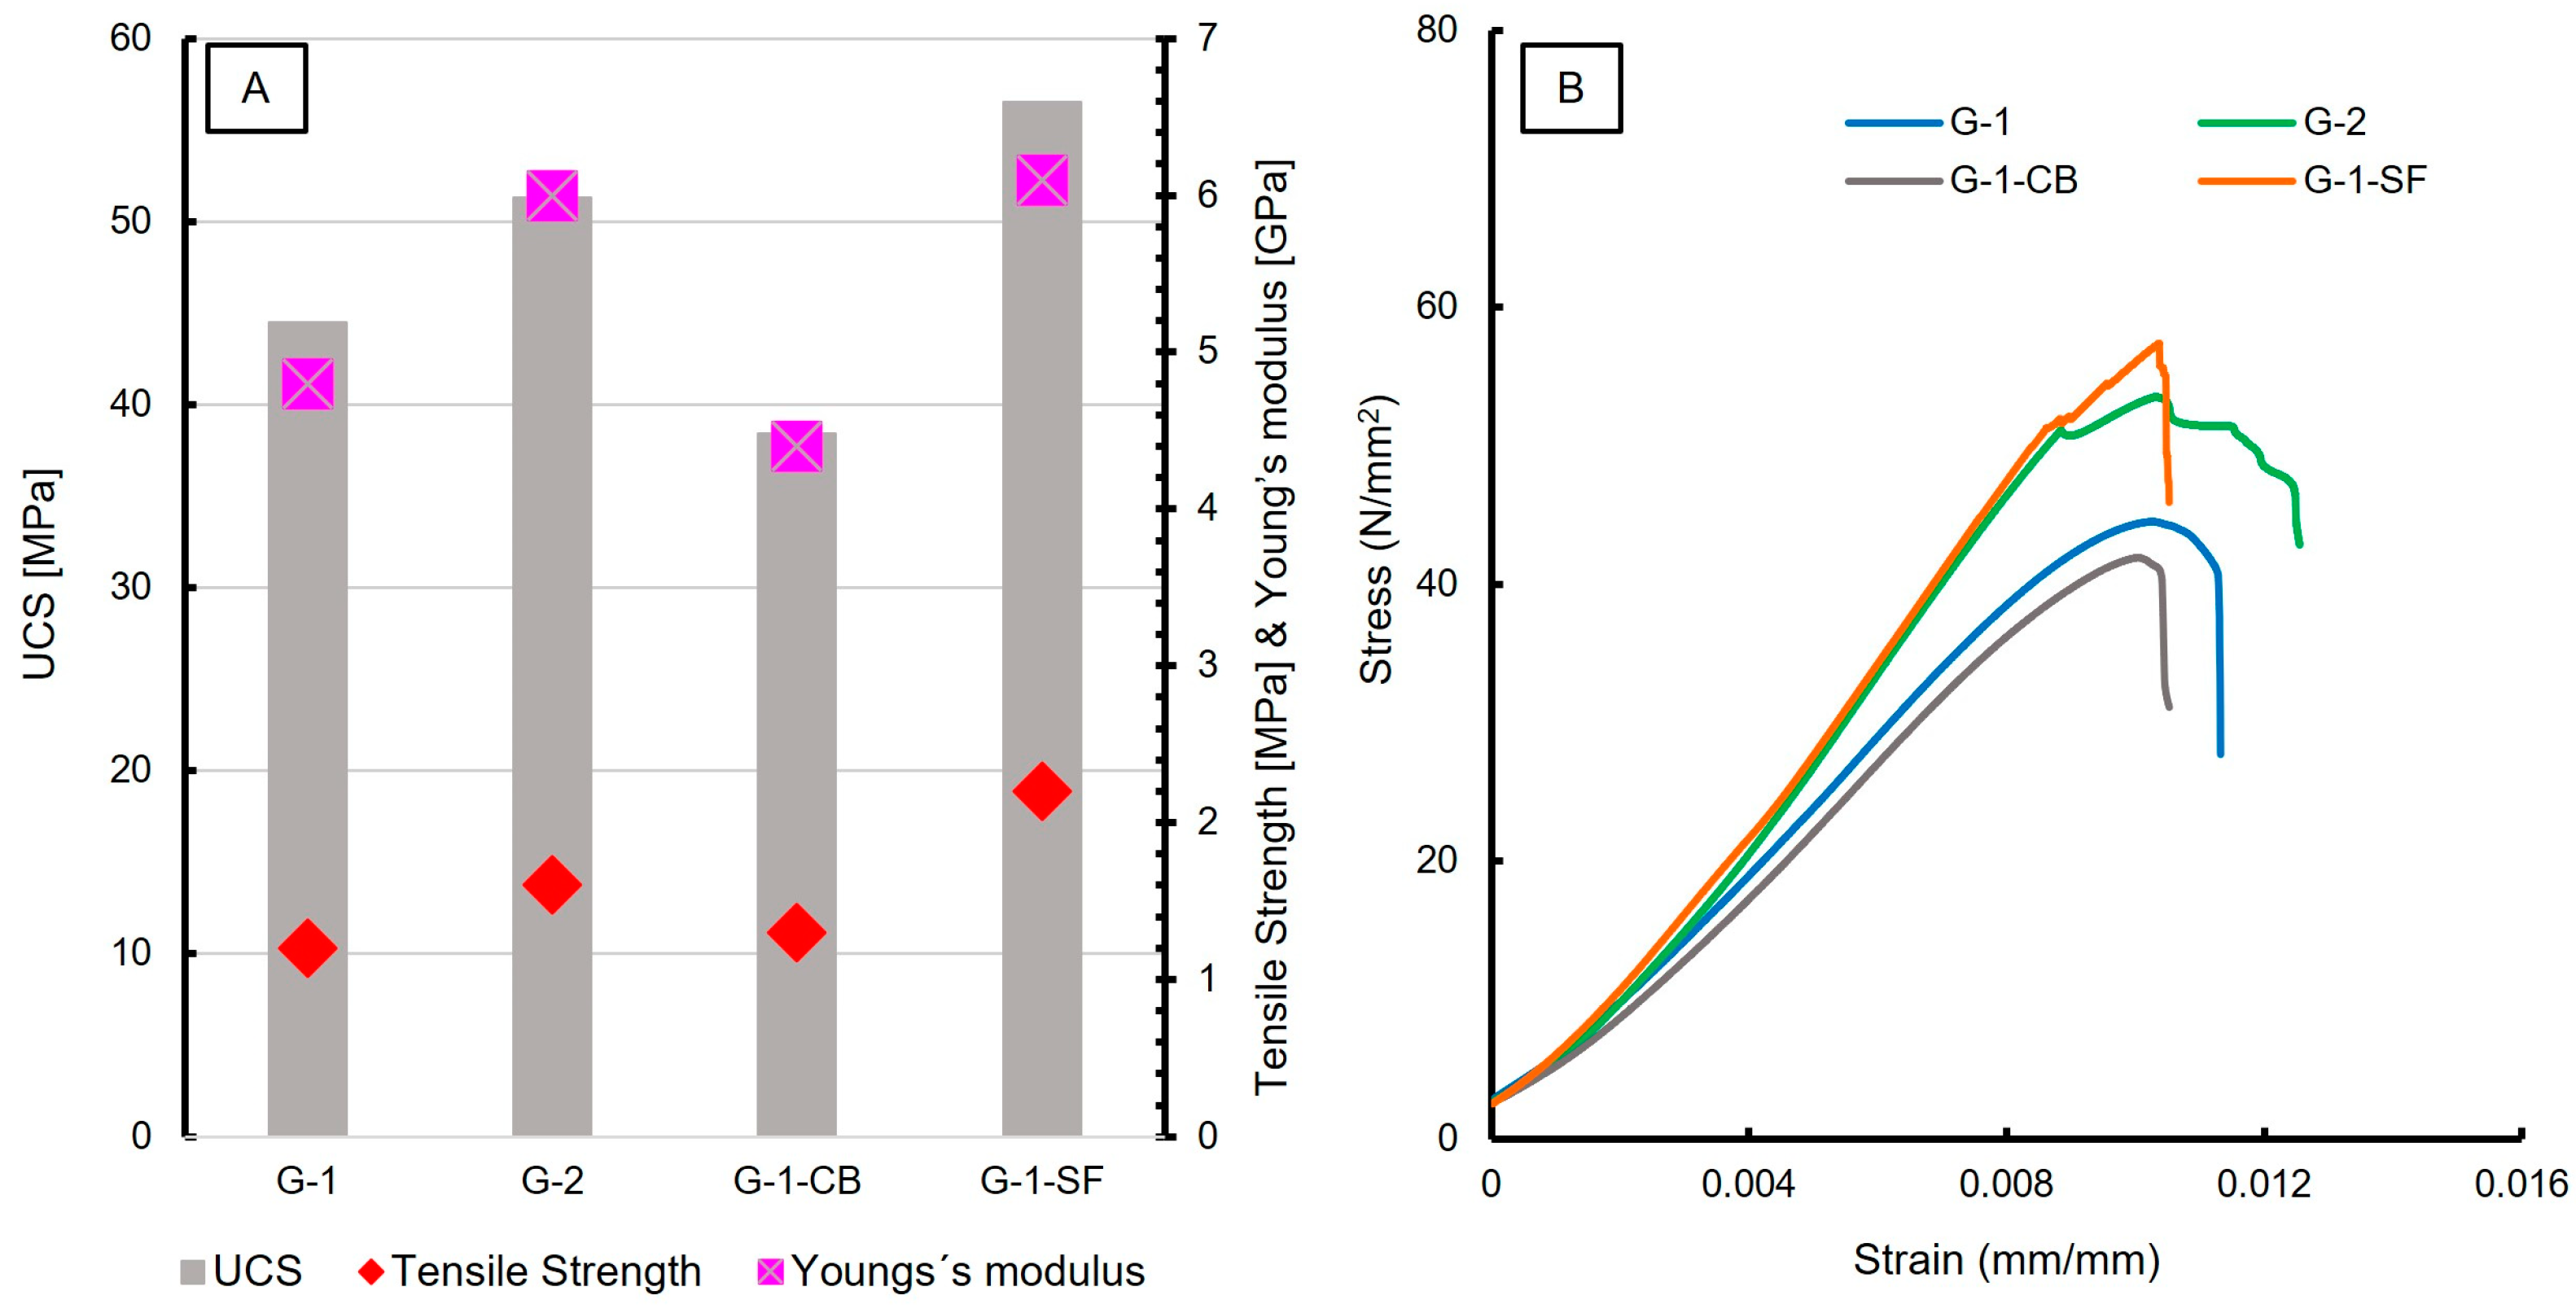
The results of uniaxial compressive strength (UCS) and tensile strength testing are reported in Table 5. In total, three measurements of each slurry formulation were carried out. An increase in the UCS was observed for G-2 and G-1-SF (Figure 8A), corresponding to the reduction of the w/c ratio and the addition of silica fume, respectively. This can be explained by the reduced porosity, which was also documented with SEM and is reflected in the physical properties (Figure 1, Table 4). The increased number of C-S-H phases in sample G-1-SF is another major cause for the increase in UCS values, since this phase is mainly responsible for late strength development in cement sheaths. G-1-CB shows decreased UCS compared to G-1, while its tensile strength increases slightly. G-1-CB shows reduced porosity and slightly increased C-S-H content compared to G-1; why the UCS value is reduced is not fully understood. One hypothesis could be that the reduction is caused by the prolonged formation of low-density C-S-H relative to high density C-S-H phases. This is supported by the higher Ca/Si ratio obtained by EPMA measurements (Section 3.1.4; Figure 4) and the lower Young’s modulus (Table 5). Such a correlation between the development of low-density C-S-H and the deterioration of concrete stiffness (e.g., effective reduction of Young’s modulus) has been observed before [57]. Another possible explanation could be the presence of large, aggregated carbon black particles (Figure 1E), creating weak spots within the sample.

Table 5.
Results of mechanical testing.
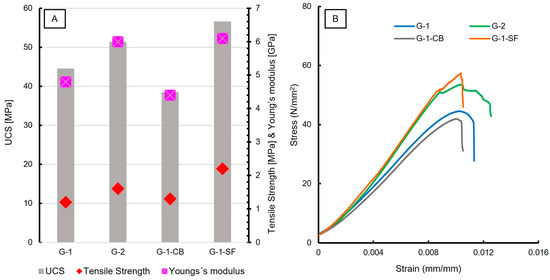
Figure 8.
(A) Diagram showing results of UCS, Tensile Strength, and Young’s modulus measurements; (B) stress—strain curves of the investigated cement sheaths. Young’s modulus was calculated from the initial slope of the linear part of the stress—strain curves.
Figure 8B shows the stress vs. strain curves of UCS testing, displaying the mechanical behavior. G-1 and G-1-CB show a very similar behavior, as do G-2 and G-1-SF. All four samples show a quasi-linear rise in the beginning, indicating the elastic area where the Young’s modulus values were calculated. After reaching maximum stress, G-1 and G-1-CB show somewhat plastic behaviors, with a vaulted curve before failure, displayed in a rapid and steep decline in stress. G-2 and G-1-SF show two linear areas. The first one makes up the majority of the curve up to a stress of 52 N/mm2 followed by a small but sharp decrease and a shorter second linear trend before the material fails. This indicates the compression of pore space with a short failure. Once the compressible pore space is reduced, the sample still holds mechanical strength, which increases further. However, for G-2, the second linear part of the curve has a very flat rise compared to G-1-SF. Also, the behavior of G-2 at maximum strain looks like vaulted steps. This can be interpreted as plastic behavior as well. G-1-SF, however, shows a very rapid decline after the second linear increase, indicating the very brittle behavior of the sample. Both G-2 and G-1-SF show very similar values for the Young’s modulus at around 6 GPa. The very brittle behavior of G-1-SF might also be an explanation for the increased crack formation observed by SEM studies of this sample. G-1-CB shows the lowest Young’s modulus, with a value of 4.4 GPa. When combined with the increased tensile strength, carbon black seems to be an additive that increases the ductile behavior of cement sheaths. This can be very beneficial in a geoenergy well to resist any bending or lateral forces once the infrastructure is in place. Otherwise, too brittle behavior might have negative consequences, resulting in failure of the applied cement sheath and endangering well integrity.
4. Discussion
Due to the variety of methods applied, careful and adequate sample preparation was of utmost importance to obtain reliable and reproducible results. Since different mixture formulations were compared, unintended artifacts or sample manipulations during sample preparation and storage are not considered to have a severe influence on the findings of this study, bearing in mind that all samples were treated the same way. However, concerning the investigation of physical properties, the addition of additives could hinder the removal of water during the solvent exchange, drying, or degassing of the samples. This could influence the results of porosity obtained by N2 adsorption. Especially, sample G-1-SF showed significant differences concerning pore size, porosity, and surface area obtained by the two methods applied (Table 4).
The addition of silica fume clearly affects the microstructure of the C-S-H phase. This has been observed before [20,27,58]. Due to the small particle size and high surface area of silica fume, the hydration kinetics of the cement paste are enhanced at an early stage, promoting C-S-H nucleation. Also, the rate of capillary water consumption is increased, affecting the hydration process of the C-S-H due to the lack of water-filled space for C-S-H growth. This could explain the observed change in crystallite morphology (Figure 1) and the promoted granular C-S-H shape compared to the C-S-H needles present in samples G-1 and G-2. Similar conclusions can be drawn for the microstructure of sample G-1-CB. Even though the added carbon black is assumed to be chemically inert, it might physically block the free water-filled space, preventing the growth of a needle-like C-S-H microstructure and reducing porosity.
Mineral chemical analysis (Figure 4A) showed that the Ca/Si ratio of the C-S-H matrix decreased due to the addition of silica fume and increased slightly in sample G-1-CB. Previous studies found that the Ca/Si ratio directly correlates with increased polymerization of the silicate chains, constituting the layers inside the nanometric units of C-S-H [42,59,60]. It was revealed previously [42,57] that there are two forms of C-S-H, namely low density or inner product and high density or outer product with dissimilar mechanical properties. However, the way the Ca/Si ratio or the degree of polymerization affects the mechanical properties is not fully understood due to the difficulties to decouple this effect from other parameters such as bulk chemistry, porosity, degree of hydration, C-S-H content, portlandite content, and the intermixing of these phases [50]. The results of our study suggest that an increase in Ca/Si ratio leads to a decrease in UCS (Figure 4A; Figure 8). This could offer a potential explanation for the contradictory observation of sample G-1-CB, which shows slightly increased C-S-H content but decreased UCS and Young’s modulus values. Yet, one has to consider that the mechanical properties investigated in this study are bulk parameters of the entire cement sheath. Therefore, conclusions about the mechanical behavior of a single phase, even though C-S-H is considered the most significant phase in cement sheaths when it comes to mechanical strength, have to be made delicately. Perhaps further investigations of, for example, nanoindentation experiments [61] combined with high-resolution in-situ chemical analysis (e.g., FE-EPMA), could contribute to a more ultimate conclusion. Samples G-1 and G-2 show the same Ca/Si ratio; however, G-2 has elevated UCS. This can be explained by the decreased porosity of the sample due to the lower water content in the mix formulation.
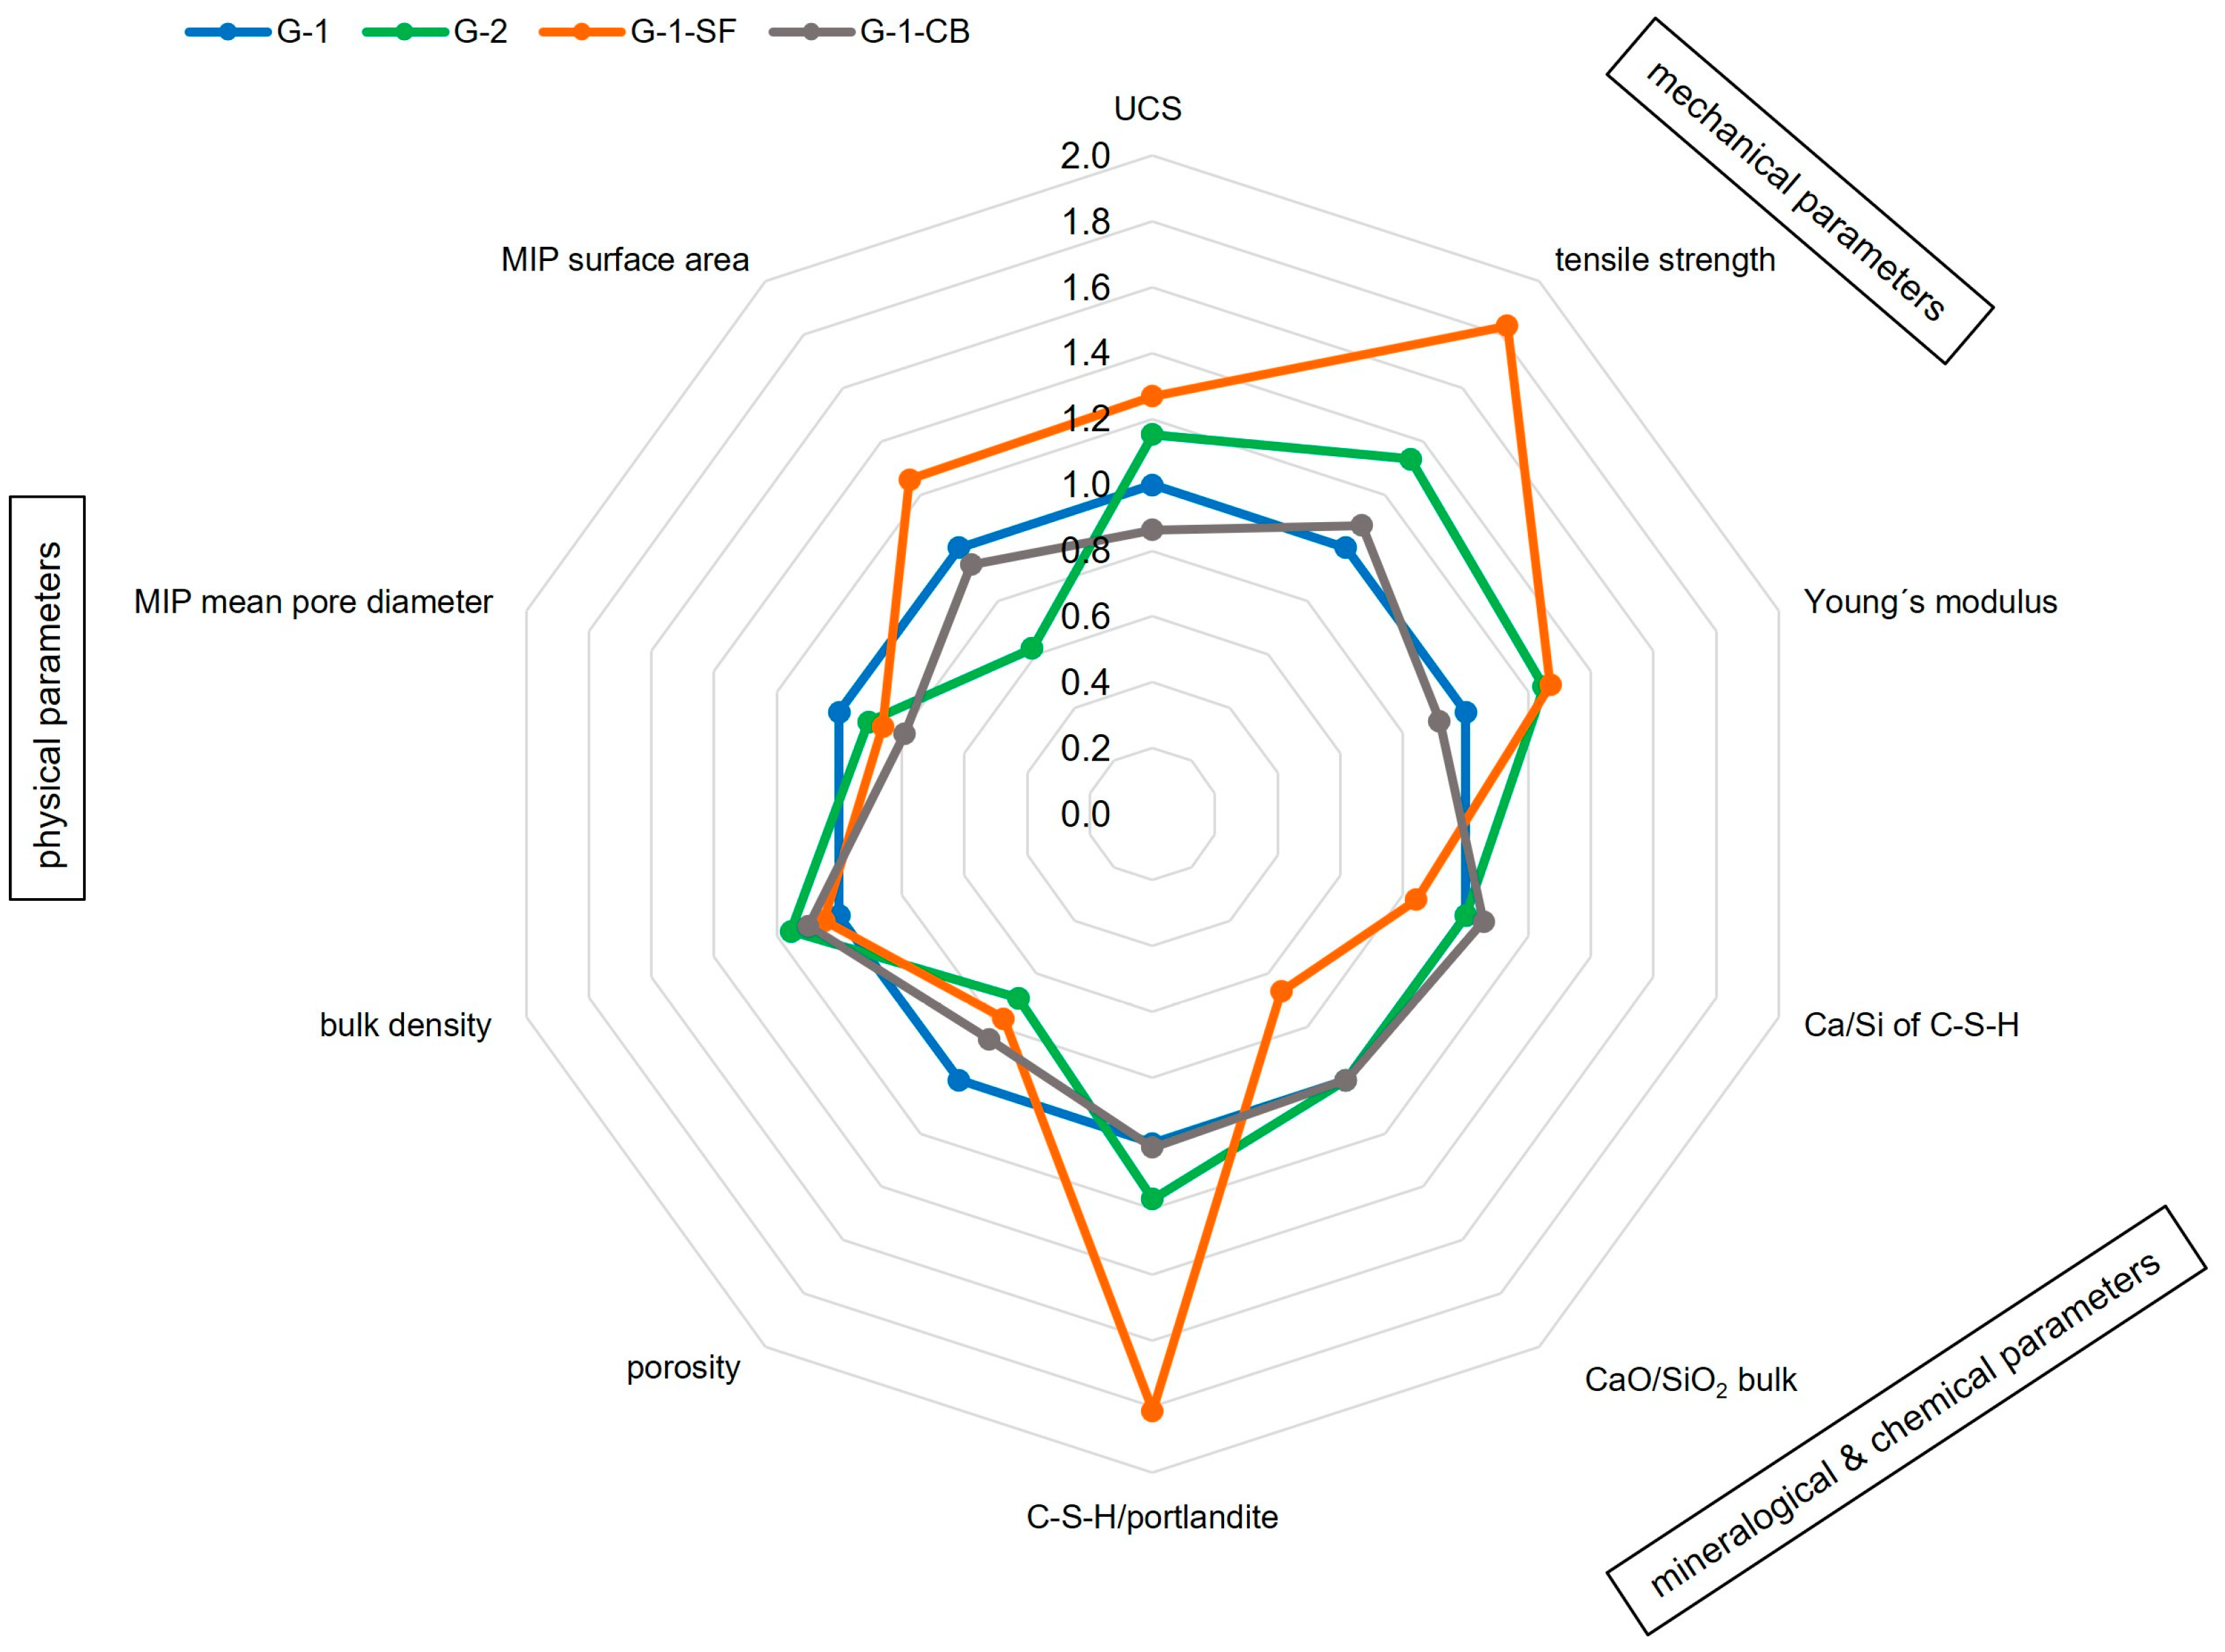
Our study highlights the complexity of cement sheaths and their characterization, considering that the before-mentioned factors have a mutual influence. Only a holistic and interdisciplinary approach with the application of a wide spectrum of different methods can lead to a reasonable interpretation of the results. Figure 9 illustrates the most important findings of this study and their interplay. It can be seen that samples with increased mechanical strength (G-2, G-1-SF) also have a higher C-S-H content (e.g., a higher ratio of C-S-H/portlandite), increased bulk density, decreased porosity, and smaller mean pore diameters. Additionally, the C-S-H in G-1-SF has a decreased Ca/Si ratio. G-1-CB, of which C-S-H has the highest observed Ca/Si ratio, also has reduced porosity, but its UCS and Young’s modulus have decreased. However, tensile strength did increase. In general, for the geoenergy industry, an additive that increases tensile strength and reduces the Young’s modulus of the cement sheath is highly valuable. When placed in the annular space, it is less brittle and therefore more resistant against lateral forces within the well. To increase the tensile strength of a material, some sort of bonding/adhesion must appear.
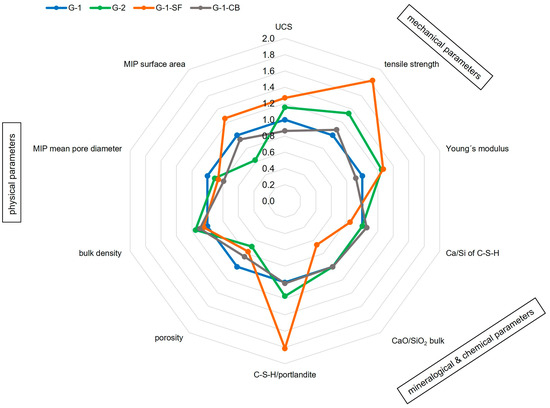
Figure 9.
Illustration of the interplay of various parameters obtained in this study that affect well integrity. The parameters are displayed as ratios compared to baseline sample G-1; a value greater than 1 means an increase in the parameter compared to G-1, a value lower 1 implies a decrease.
The surfactant used for samples G-1-CB and G-1-SF to make the formulation mixable could also have an influence on the mechanical properties. However, since only small amounts of surfactant were added (Table 1), its influence is assumed to be negligible. Also, the amount of carbon black added to the mix formulation, as well as the quality, grain size, or degree of agglomeration of carbon black particles, might have an influence on the hardened cement sheath [23]. As shown in Figure 8B, the addition of silica fume makes the cement sheath more brittle. Thus, adding too much silica fume might have negative consequences for the tensile strength of the cement sheath. Silica fume might also have negative effects on the viscosity of the cement slurry. Too high amounts of silica fume make the slurry very viscose, which would lead to a slurry that is no longer pumpable in the field during the cementing of a geoenergy well.
Though the porosity was reduced by adding additives or reducing the w/c ratio (Table 4), the permeability was not tailored beneficially by these measures. But permeability is also dependent on the connectivity, shape, and tortuosity of the pores. Since porosity did decrease in samples G-1-CB and G-1-SF, the assumption can be drawn that matrix permeability for samples containing carbon black or silica fume did decrease. However, due to the higher brittleness and, therefore, the increased occurrence of fractures or heterogeneous distribution of the additive within the sample, higher bulk permeability was observed. Since lower porosity and especially lower pore sizes mean higher capillary forces, it is generally harder for fluids to permeate through the cement. However, future research focusing on permeability aspects within this context is necessary.
5. Conclusions
Four cement sheath samples for geoenergy wells with different mix formulations were characterized regarding mineralogical, physical, and mechanical properties, as well as their interplay. Two samples contained the additives carbon black and silica fume. One sample had a reduced w/c ratio. The addition of carbon black and silica fume led to a visible (under the SEM) change in the microstructure and had some effect on the modal and chemical phase composition.
Adding silica fume increases the content of C-S-H phases and reduces the portlandite content. The disappearance of the specific AFm sulfate phase indicates minor changes in the mineralogical phase composition. EPMA measurements indicate increased S incorporation into the C-S-H phase and a decreased Ca/Si ratio. Additionally, the addition of silica fume results in a much denser and more granular microstructure of the C-S-H matrix, suppressing the formation of phases with acicular morphology. Moreover, the mechanical strength increased, but a more brittle behavior of the cement sheath was also observed.
The addition of carbon black results in a higher Ca/Si ratio of the C-S-H phase, indicating the prolonged stability of the low-density C-S-H phases within this sample. Also, UCS and Young’s modulus decreased, but tensile strength increased. This observed change in mechanical behavior can be beneficial for geoenergy well cement sheaths to withstand lateral stress.
Changing the w/c ratio of the cement slurry mixture does not visibly change the microstructure, but leads to a decrease in porosity and an increase in mechanical strength. Permeability was highest in the cement sheath containing silica fume, likely due to the formation of microcracks. These cracks are potentially caused by shrinkage during the curing of the sample due to the higher amount of water required for the pozzolanic reaction. Additionally, the observed increase in brittle mechanical behavior might lead to enhanced crack formation.
The findings of this study highlight the complexity of cement sheaths and their challenging characterization. Only a holistic and interdisciplinary approach with the application of mineralogical methods allows for an integrated evaluation of their physical and mechanical behaviors.
Author Contributions
Conceptualization, T.S.; methodology, T.S.; investigation, T.S. and N.K.; resources, A.N. and N.K.; writing—original draft preparation, T.S., A.N. and N.K.; writing—review and editing, A.N., N.K., K.R. and J.G.R.; supervision, K.R. and J.G.R. All authors have read and agreed to the published version of the manuscript.
Funding
This research activity has received funding from Montanuniversität Leoben, Austria, and is part of the Strategic Core Research Area SCoRe A+ Hydrogen and Carbon.
Data Availability Statement
Data available upon request.
Acknowledgments
The authors would like to thank Friedrich Kittinger for performing TGA experiments, David Misch, Lukas Skerbisch and Gerhard Hawranek for providing assistance during SEM investigations.
Conflicts of Interest
The authors declare that they have no known competing financial interests or personal relationships that could have appeared to influence the work reported in this paper.
References
- Nelson, E.B. Well Cementing, 1st ed.; Elsevier Science: Amsterdam, The Netherlands, 1990. [Google Scholar]
- Carter, G.; Slagle, K. A Study of Completion Practices to Minimize Gas Communication. J. Pet. Technol. 1972, 24, 1170–1174. [Google Scholar] [CrossRef]
- Levine, D.C.; Thomas, E.W.; Bezner, H.P.; Tolle, G.C. Annular Gas Flow After Cementing: A Look at Practical Solutions. In Proceedings of the SPE Annual Technical Conference and Exhibition, Las Vegas, NV, USA, 23–26 September 1979. [Google Scholar]
- Cheung, P.R.; Beirute, R.M. Gas Flow in Cements. J. Pet. Technol. 1985, 37, 1041–1048. [Google Scholar] [CrossRef]
- Bois, A.-P.; Vu, M.-H.; Ghabezloo, S.; Sulem, J.; Garnier, A.; Laudet, J.-B. Cement Sheath Integrity for CO2 Storage—An Integrated Perspective. Energy Procedia 2013, 37, 5628–5641. [Google Scholar] [CrossRef]
- Ghabezloo, S.; Sulem, J.; Guédon, S.; Martineau, F.; Saint-Marc, J. Poromechanical behaviour of hardened cement paste under isotropic loading. Cem. Concr. Res. 2008, 38, 1424–1437. [Google Scholar] [CrossRef]
- Bahafid, S.; Ghabezloo, S.; Duc, M.; Faure, P.; Sulem, J. Effect of the hydration temperature on the microstructure of Class G cement: C-S-H composition and density. Cem. Concr. Res. 2017, 95, 270–281. [Google Scholar] [CrossRef]
- Verbeck, G.J. Structures and Physical Properties of Cement Paste. Proc. Int. Symp. 1968, 13, 1–32. [Google Scholar]
- Kjellsen, K.O.; Detwiler, R.J.; Gjørv, O.E. Pore structure of plain cement pastes hydrated at different temperatures. Cem. Concr. Res. 1990, 20, 927–933. [Google Scholar] [CrossRef]
- Taylor, H.F.W. Cement Chemistry, 2nd ed.; Thomas Telford Ltd.: London, UK, 2003. [Google Scholar]
- Kjellsen, K.O.; Detwiler, R.J.; Gjørv, O.E. Backscattered electron imaging of cement pastes hydrated at different temperatures. Cem. Concr. Res. 1990, 20, 308–311. [Google Scholar] [CrossRef]
- Famy, C.; Brough, A.; Taylor, H. The C-S-H gel of Portland cement mortars: Part I. The interpretation of energy-dispersive X-ray microanalyses from scanning electron microscopy, with some observations on C-S-H, AFm and AFt phase compositions. Cem. Concr. Res. 2003, 33, 1389–1398. [Google Scholar] [CrossRef]
- Scrivener, K.L. Backscattered electron imaging of cementitious microstructures: Understanding and quantification. Cement Concrete Compos. 2004, 26, 935–945. [Google Scholar] [CrossRef]
- Stutzman, P.E. 3. Microscopy of Clinker and Hydraulic Cements. In Applied Mineralogy of Cement & Concrete; Broekmans, M.A., Pöllmann, H., Broekmans, M.A., Eds.; De Gruyter: Berlin, Germany, 2012; pp. 101–146. [Google Scholar]
- Krakowiak, K.J.; Thomas, J.J.; Musso, S.; James, S.; Akono, A.-T.; Ulm, F.-J. Nano-chemo-mechanical signature of conventional oil-well cement systems: Effects of elevated temperature and curing time. Cem. Concr. Res. 2015, 67, 103–121. [Google Scholar] [CrossRef]
- Qin, J.; Pang, X.; Cheng, G.; Bu, Y.; Liu, H. Influences of different admixtures on the properties of oil well cement systems at HPHT conditions. Cem. Concr. Compos. 2021, 123, 104202. [Google Scholar] [CrossRef]
- Zyganitidis, I.; Stefanidou, M.; Kalfagiannis, N.; Logothetidis, S. Nanomechanical characterization of cement-based pastes enriched with SiO2 nanoparticles. Mater. Sci. Eng. B 2011, 176, 1580–1584. [Google Scholar] [CrossRef]
- Cuesta, A.; Santacruz, I.; De la Torre, A.G.; Dapiaggi, M.; Zea-Garcia, J.D.; Aranda, M.A. Local structure and Ca/Si ratio in C-S-H gels from hydration of blends of tricalcium silicate and silica fume. Cem. Concr. Res. 2021, 143, 106405. [Google Scholar] [CrossRef]
- Yajun, J.; Cahyadi, J.H. Effects of densified silica fume on microstructure and compressive strength of blended cement pastes. Cem. Concr. Res. 2003, 33, 1543–1548. [Google Scholar] [CrossRef]
- Liao, W.; Sun, X.; Kumar, A.; Sun, H.; Ma, H. Hydration of Binary Portland Cement Blends Containing Silica Fume: A Decoupling Method to Estimate Degrees of Hydration and Pozzolanic Reaction. Front. Mater. 2019, 6, 78. [Google Scholar] [CrossRef]
- Juenger, M.C.G.; Siddique, R. Recent advances in understanding the role of supplementary cementitious materials in concrete. Cem. Concr. Res. 2015, 78, 71–80. [Google Scholar] [CrossRef]
- Calloni, G.; Moroni, N.; Miano, F. Carbon Black: A Low Cost Colloidal Additive for Controlling Gas-Migration in Cement Slurries. In Proceedings of the SPE International Symposium on Oilfield Chemistry, San Antonio, TX, USA, 14–17 February 1995. [Google Scholar]
- Zhang, Q.; Luan, C.; Yu, C.; Huang, Y.; Zhou, Z. Mechanisms of carbon black in multifunctional cement matrix: Hydration and microstructure perspectives. Constr. Build. Mater. 2022, 346, 128455. [Google Scholar] [CrossRef]
- Snellings, R.; Mertens, G.; Elsen, J. Supplementary Cementitious Materials. Rev. Mineral. Geochem. 2012, 74, 211–278. [Google Scholar] [CrossRef]
- Massazza, F. Pozzolana and Pozzolanic Cements. In Lea’s Chemistry of Cement and Concrete; Elsevier: Amsterdam, The Netherlands, 1998; pp. 471–635. [Google Scholar]
- Lu, P.; Sun, G.; Young, J.F. Phase Composition of Hydrated DSP Cement Pastes. J. Am. Ceram. Soc. 1993, 76, 1003–1007. [Google Scholar] [CrossRef]
- Muller, A.; Scrivener, K.; Skibsted, J.; Gajewicz, A.; McDonald, P. Influence of silica fume on the microstructure of cement pastes: New insights from 1H NMR relaxometry. Cem. Concr. Res. 2015, 74, 116–125. [Google Scholar] [CrossRef]
- Mueller, D.T.; Dillenbeck, R.L. The Versatility of Silica Fume as an Oilwell Cement Admixture. In Proceedings of the SPE Production Operations Symposium, Oklahoma City, OK, USA, 7–9 April 1991. [Google Scholar]
- Bhanja, S.; Sengupta, B. Influence of silica fume on the tensile strength of concrete. Cem. Concr. Res. 2005, 35, 743–747. [Google Scholar] [CrossRef]
- Lura, P.; Jensen, O.M.; van Breugel, K. Autogenous shrinkage in high-performance cement paste: An evaluation of basic mechanisms. Cem. Concr. Res. 2003, 33, 223–232. [Google Scholar] [CrossRef]
- Jensen, O.; Hansen, P.F. Autog enous Deformation and Change of the Relative Humidity in Silica Fume-Modified Cement Paste. Mater. J. 1996, 93, 539–543. [Google Scholar]
- Barcelo, L.; Kline, J.; Walenta, G.; Gartner, E. Cement and carbon emissions. Mater. Struct. 2014, 47, 1055–1065. [Google Scholar] [CrossRef]
- Amato, I. Green cement: Concrete solutions. Nature 2013, 494, 300–301. [Google Scholar] [CrossRef]
- American Petroleum Institute, API SPEC 10A. 2022. Available online: https://shop.standards.ie/en-ie/standards/api-spec-10a-2019-add-2-2022-96776_saig_api_api_3182225/ (accessed on 5 July 2024).
- Scrivener, K.; Snellings, R.; Lothenbach, B. (Eds.) A Practical Guide to Microstructural Analysis of Cementitious Materials; CRC Press: Boca Raton, FL, USA; Taylor & Francis Group: London, UK, 2016. [Google Scholar]
- Lea, F.M.; Hewlett, P.C. Lea’s Chemistry of Cement and Concrete; Elsevier: Amsterdam, The Netherlands, 1998. [Google Scholar]
- Diamond, S. Mercury porosimetry: An Inappropriate Method for the Measurement of Pore Size Distributions in Cement-Based Materials. Cem. Concr. Res. 2000, 30, 1517–1525. [Google Scholar] [CrossRef]
- Aligizaki, K.K. Pore Structure of Cement-Based Materials; CRC Press: Boca Raton, FL, USA, 2005. [Google Scholar]
- Li, X.; Li, M. Multifunctional self-sensing and ductile cementitious materials. Cem. Concr. Res. 2019, 123, 105714. [Google Scholar] [CrossRef]
- Sutton, D.L.; Faul, R.; Sabins, F. Annular gas flow theory and prevention methods described. Oil Gas J. 1984, 82, 50. [Google Scholar]
- Richardson, I.G.; Groves, G.W. Microstructure and microanalysis of hardened cement pastes involving ground granulated blast-furnace slag. J. Mater. Sci. 1992, 27, 6204–6212. [Google Scholar] [CrossRef]
- Richardson, I.G. The calcium silicate hydrates. Cem. Concr. Res. 2008, 38, 137–158. [Google Scholar] [CrossRef]
- Lamberet, S. Durability of Ternary Binders Based on Portland Cement, Calcium Aluminate Cement and Calcium Sulfate; EPFL: Lausanne, Switzerland, 2005. [Google Scholar]
- Šauman, Z. Carbonization of porous concrete and its main binding components. Cem. Concr. Res. 1971, 1, 645–662. [Google Scholar] [CrossRef]
- Morandeau, A.; Thiéry, M.; Dangla, P. Investigation of the carbonation mechanism of CH and C-S-H in terms of kinetics, microstructure changes and moisture properties. Cem. Concr. Res. 2014, 56, 153–170. [Google Scholar] [CrossRef]
- Branch, J.; Kosson, D.; Garrabrants, A.; He, P. The impact of carbonation on the microstructure and solubility of major constituents in microconcrete materials with varying alkalinities due to fly ash replacement of ordinary Portland cement. Cem. Concr. Res. 2016, 89, 297–309. [Google Scholar] [CrossRef]
- Sevelsted, T.F.; Skibsted, J. Carbonation of C–S–H and C–A–S–H samples studied by 13 C, 27 Al and 29 Si MAS NMR spectroscopy. Cem. Concr. Res. 2015, 71, 56–65. [Google Scholar] [CrossRef]
- Allen, A.J.; Thomas, J.J.; Jennings, H.M. Composition and density of nanoscale calcium-silicate-hydrate in cement. Nat. Mater. 2007, 6, 311–316. [Google Scholar] [CrossRef]
- Chatterji, S. CaO/SiO2 mole ratio of calcium silicate hydrate in fully hydrated tricalcium silicate paste. Cem. Concr. Res. 1980, 10, 783–787. [Google Scholar] [CrossRef]
- Sebastiani, M.; Moscatelli, R.; Ridi, F.; Baglioni, P.; Carassiti, F. High-resolution high-speed nanoindentation mapping of cement pastes: Unravelling the effect of microstructure on the mechanical properties of hydrated phases. Mater. Des. 2016, 97, 372–380. [Google Scholar] [CrossRef]
- Jennings, H.M.; Thomas, J.J.; Rothstein, D.; Chen, J.J. Cements as Porous Materials. In Handbook of Porous Solids; Schth, F., Sing, K.S.W., Weitkamp, J., Eds.; Wiley-VCH Verlag GmbH: Weinheim, Germany, 2002; pp. 2971–3028. [Google Scholar]
- Hansen, W.; Almudaiheem, J. Pore Structure of Hydrated Portland Cement Measured by Nitrogen Sorption and Mercury Intrusion Porosimetry. MRS Proc. 1986, 85, 105. [Google Scholar] [CrossRef]
- Midgley, H.; Illston, J. Some comments on the microstructure of hardened cement pastes. Cem. Concr. Res. 1983, 13, 197–206. [Google Scholar] [CrossRef]
- Valckenborg, R.M.E.; Pel, L.; Hazrati, K.; Kopinga, K.; Marchand, J. Pore water distribution in mortar during drying as determined by NMR. Mater. Struct. 2001, 34, 599–604. [Google Scholar] [CrossRef]
- Bhanja, S.; Sengupta, B. Modified water–cement ratio law for silica fume concretes. Cem. Concr. Res. 2003, 33, 447–450. [Google Scholar] [CrossRef]
- Maruyama, I.; Teramoto, A. Temperature dependence of autogenous shrinkage of silica fume cement pastes with a very low water–binder ratio. Cem. Concr. Res. 2013, 50, 41–50. [Google Scholar] [CrossRef]
- Constantinides, G.; Ulm, F.-J. The effect of two types of C-S-H on the elasticity of cement-based materials: Results from nanoindentation and micromechanical modeling. Cem. Concr. Res. 2004, 34, 67–80. [Google Scholar] [CrossRef]
- Muller, A.C.A.; Scrivener, K.L.; Gajewicz, A.M.; McDonald, P.J. Densification of C–S–H Measured by 1 H NMR Relaxometry. J. Phys. Chem. C 2013, 117, 403–412. [Google Scholar] [CrossRef]
- Chiang, W.-S.; Ferraro, G.; Fratini, E.; Ridi, F.; Yeh, Y.-Q.; Jeng, U.-S.; Chen, S.-H.; Baglioni, P. Multiscale structure of calcium- and magnesium-silicate-hydrate gels. J. Mater. Chem. A 2014, 2, 12991. [Google Scholar] [CrossRef]
- Cappelletto, E.; Borsacchi, S.; Geppi, M.; Ridi, F.; Fratini, E.; Baglioni, P. Comb-Shaped Polymers as Nanostructure Modifiers of Calcium Silicate Hydrate: A 29Si Solid-State NMR Investigation. J. Phys. Chem. C 2013, 117, 22947–22953. [Google Scholar] [CrossRef]
- Renuka, V.; Venkateswara Rao, S.; Tadepalli, T. Nanoindentation technique in characterizing cementitious materials—A review. Mater. Today Proc. 2023, in press. [Google Scholar] [CrossRef]
Disclaimer/Publisher’s Note: The statements, opinions and data contained in all publications are solely those of the individual author(s) and contributor(s) and not of MDPI and/or the editor(s). MDPI and/or the editor(s) disclaim responsibility for any injury to people or property resulting from any ideas, methods, instructions or products referred to in the content. |
© 2024 by the authors. Licensee MDPI, Basel, Switzerland. This article is an open access article distributed under the terms and conditions of the Creative Commons Attribution (CC BY) license (https://creativecommons.org/licenses/by/4.0/).

