

Flnc: Machine Learning Improves the Identification of Novel Long Noncoding RNAs from Stand-Alone RNA-Seq Data

 and
and 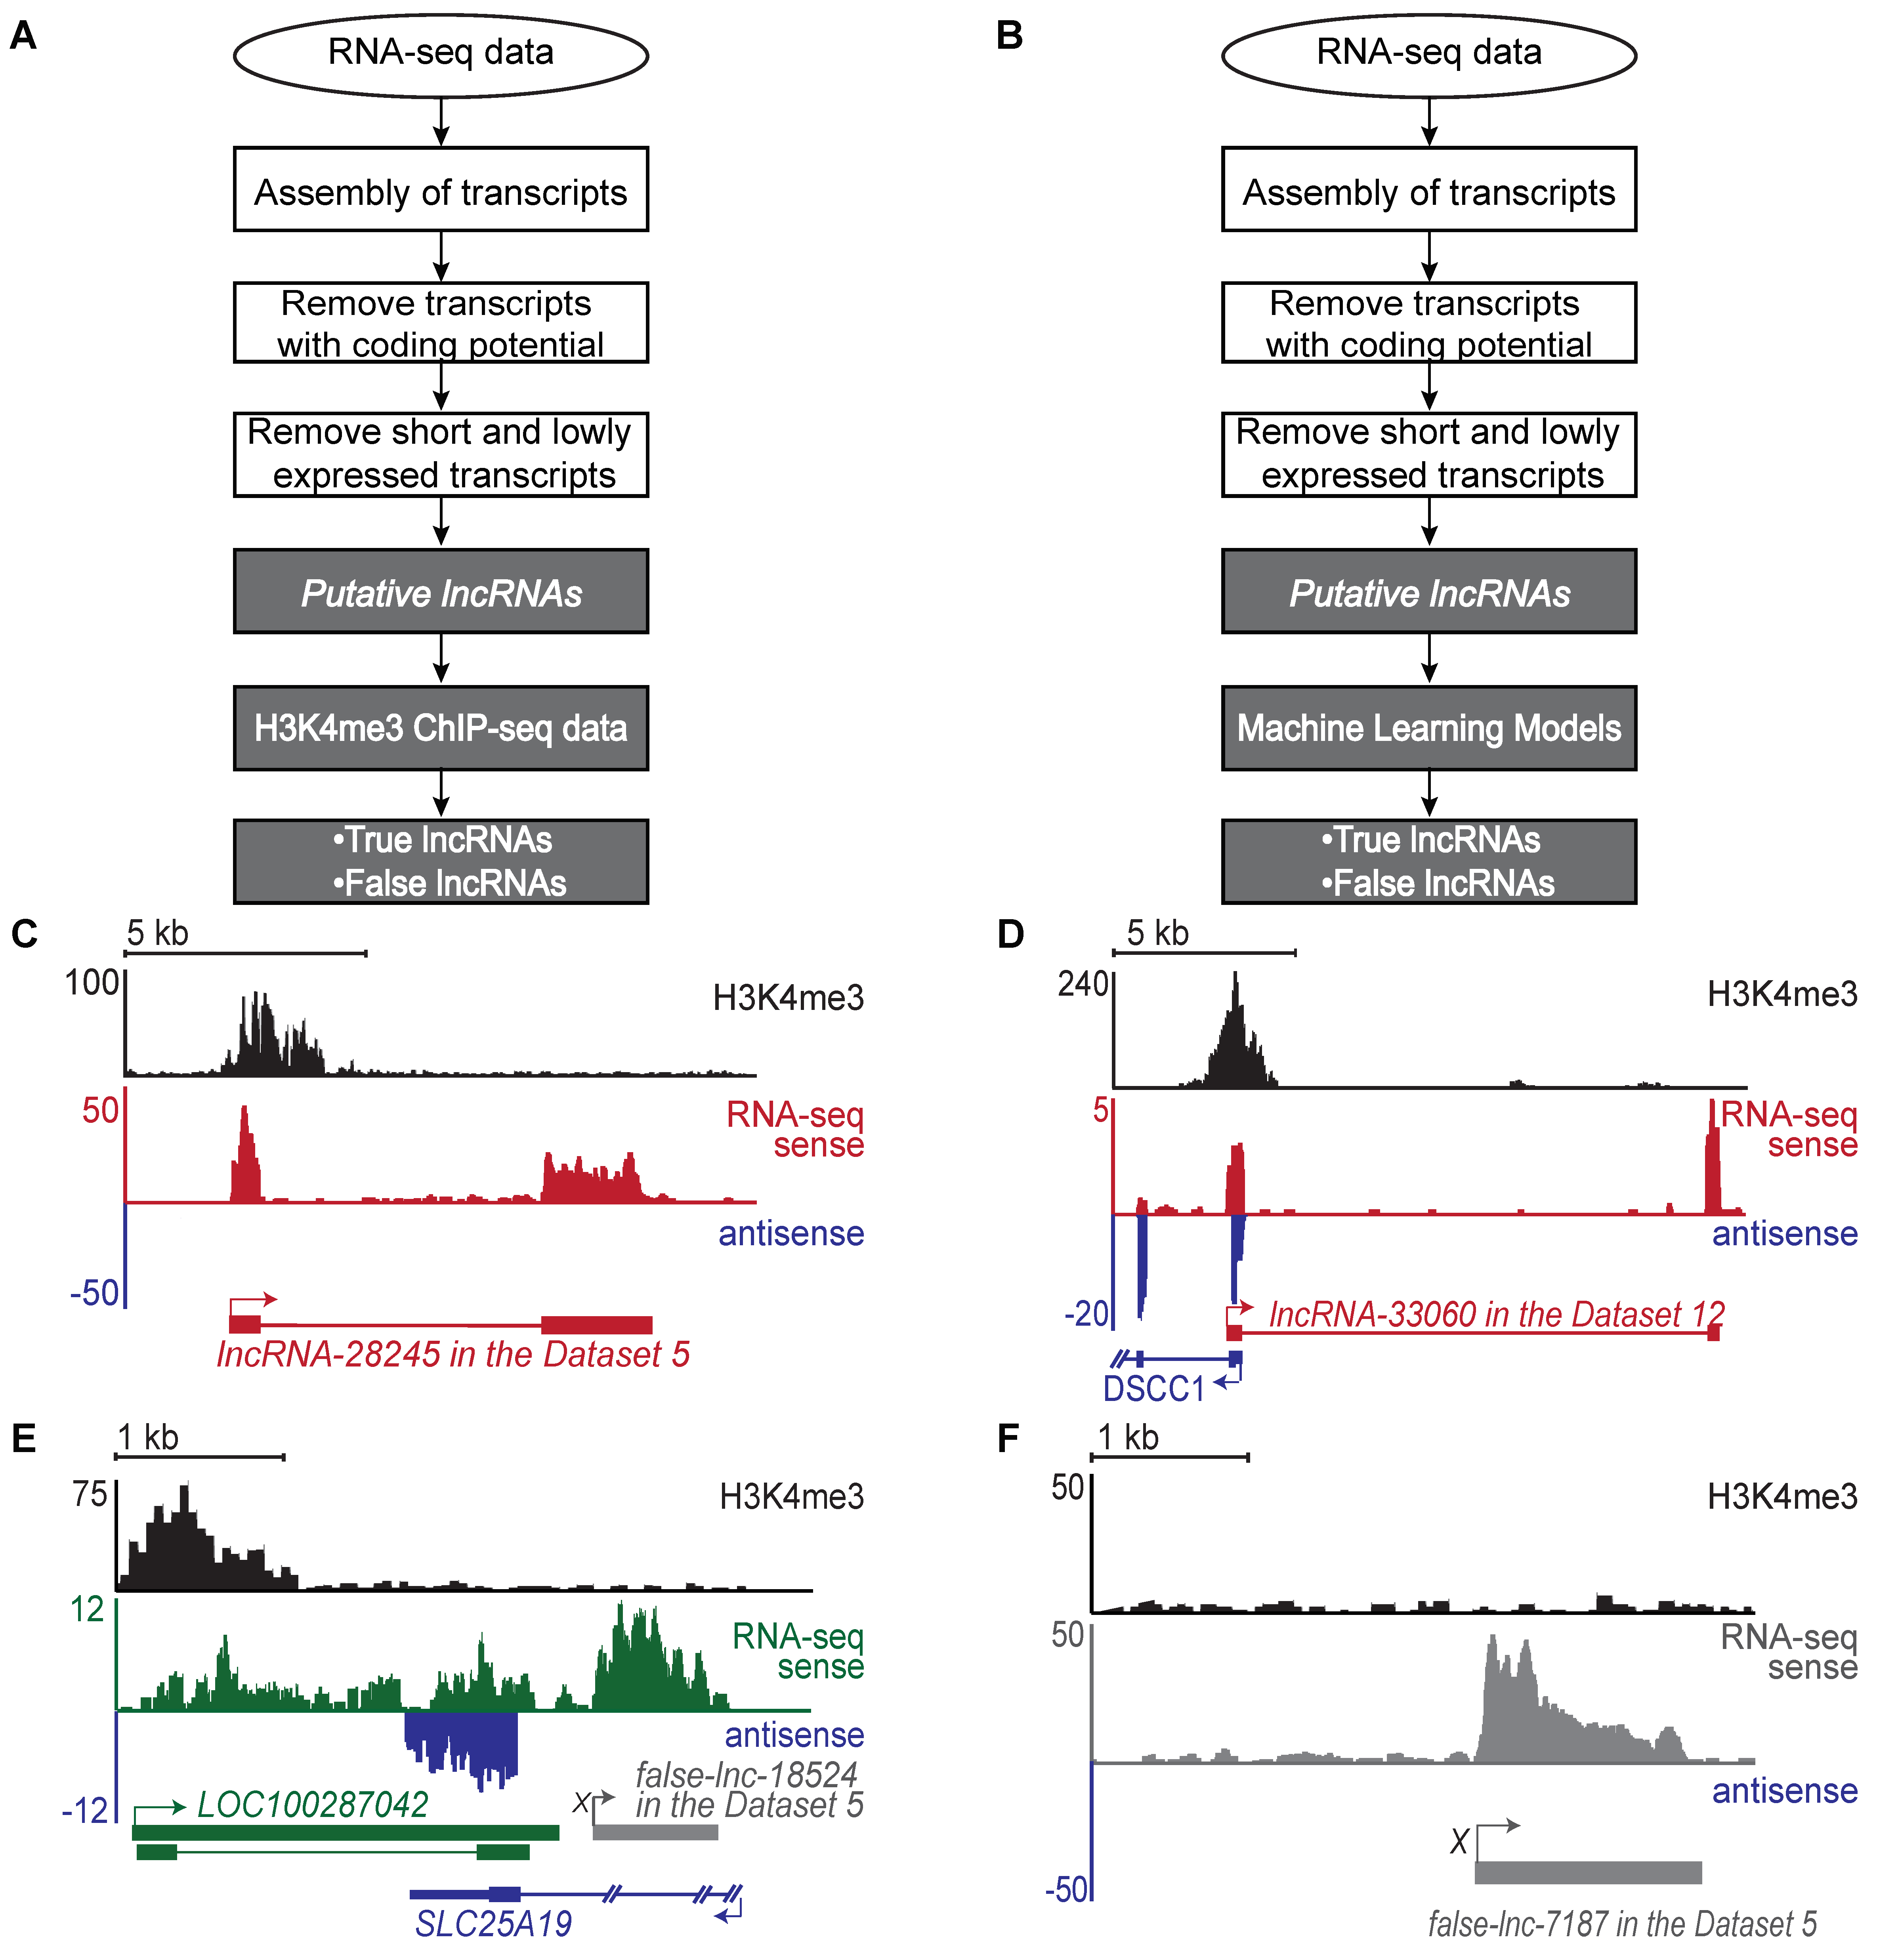
Abstract
1. Introduction
2. Results
2.1. Generation of a Benchmark Dataset of True and False lncRNAs
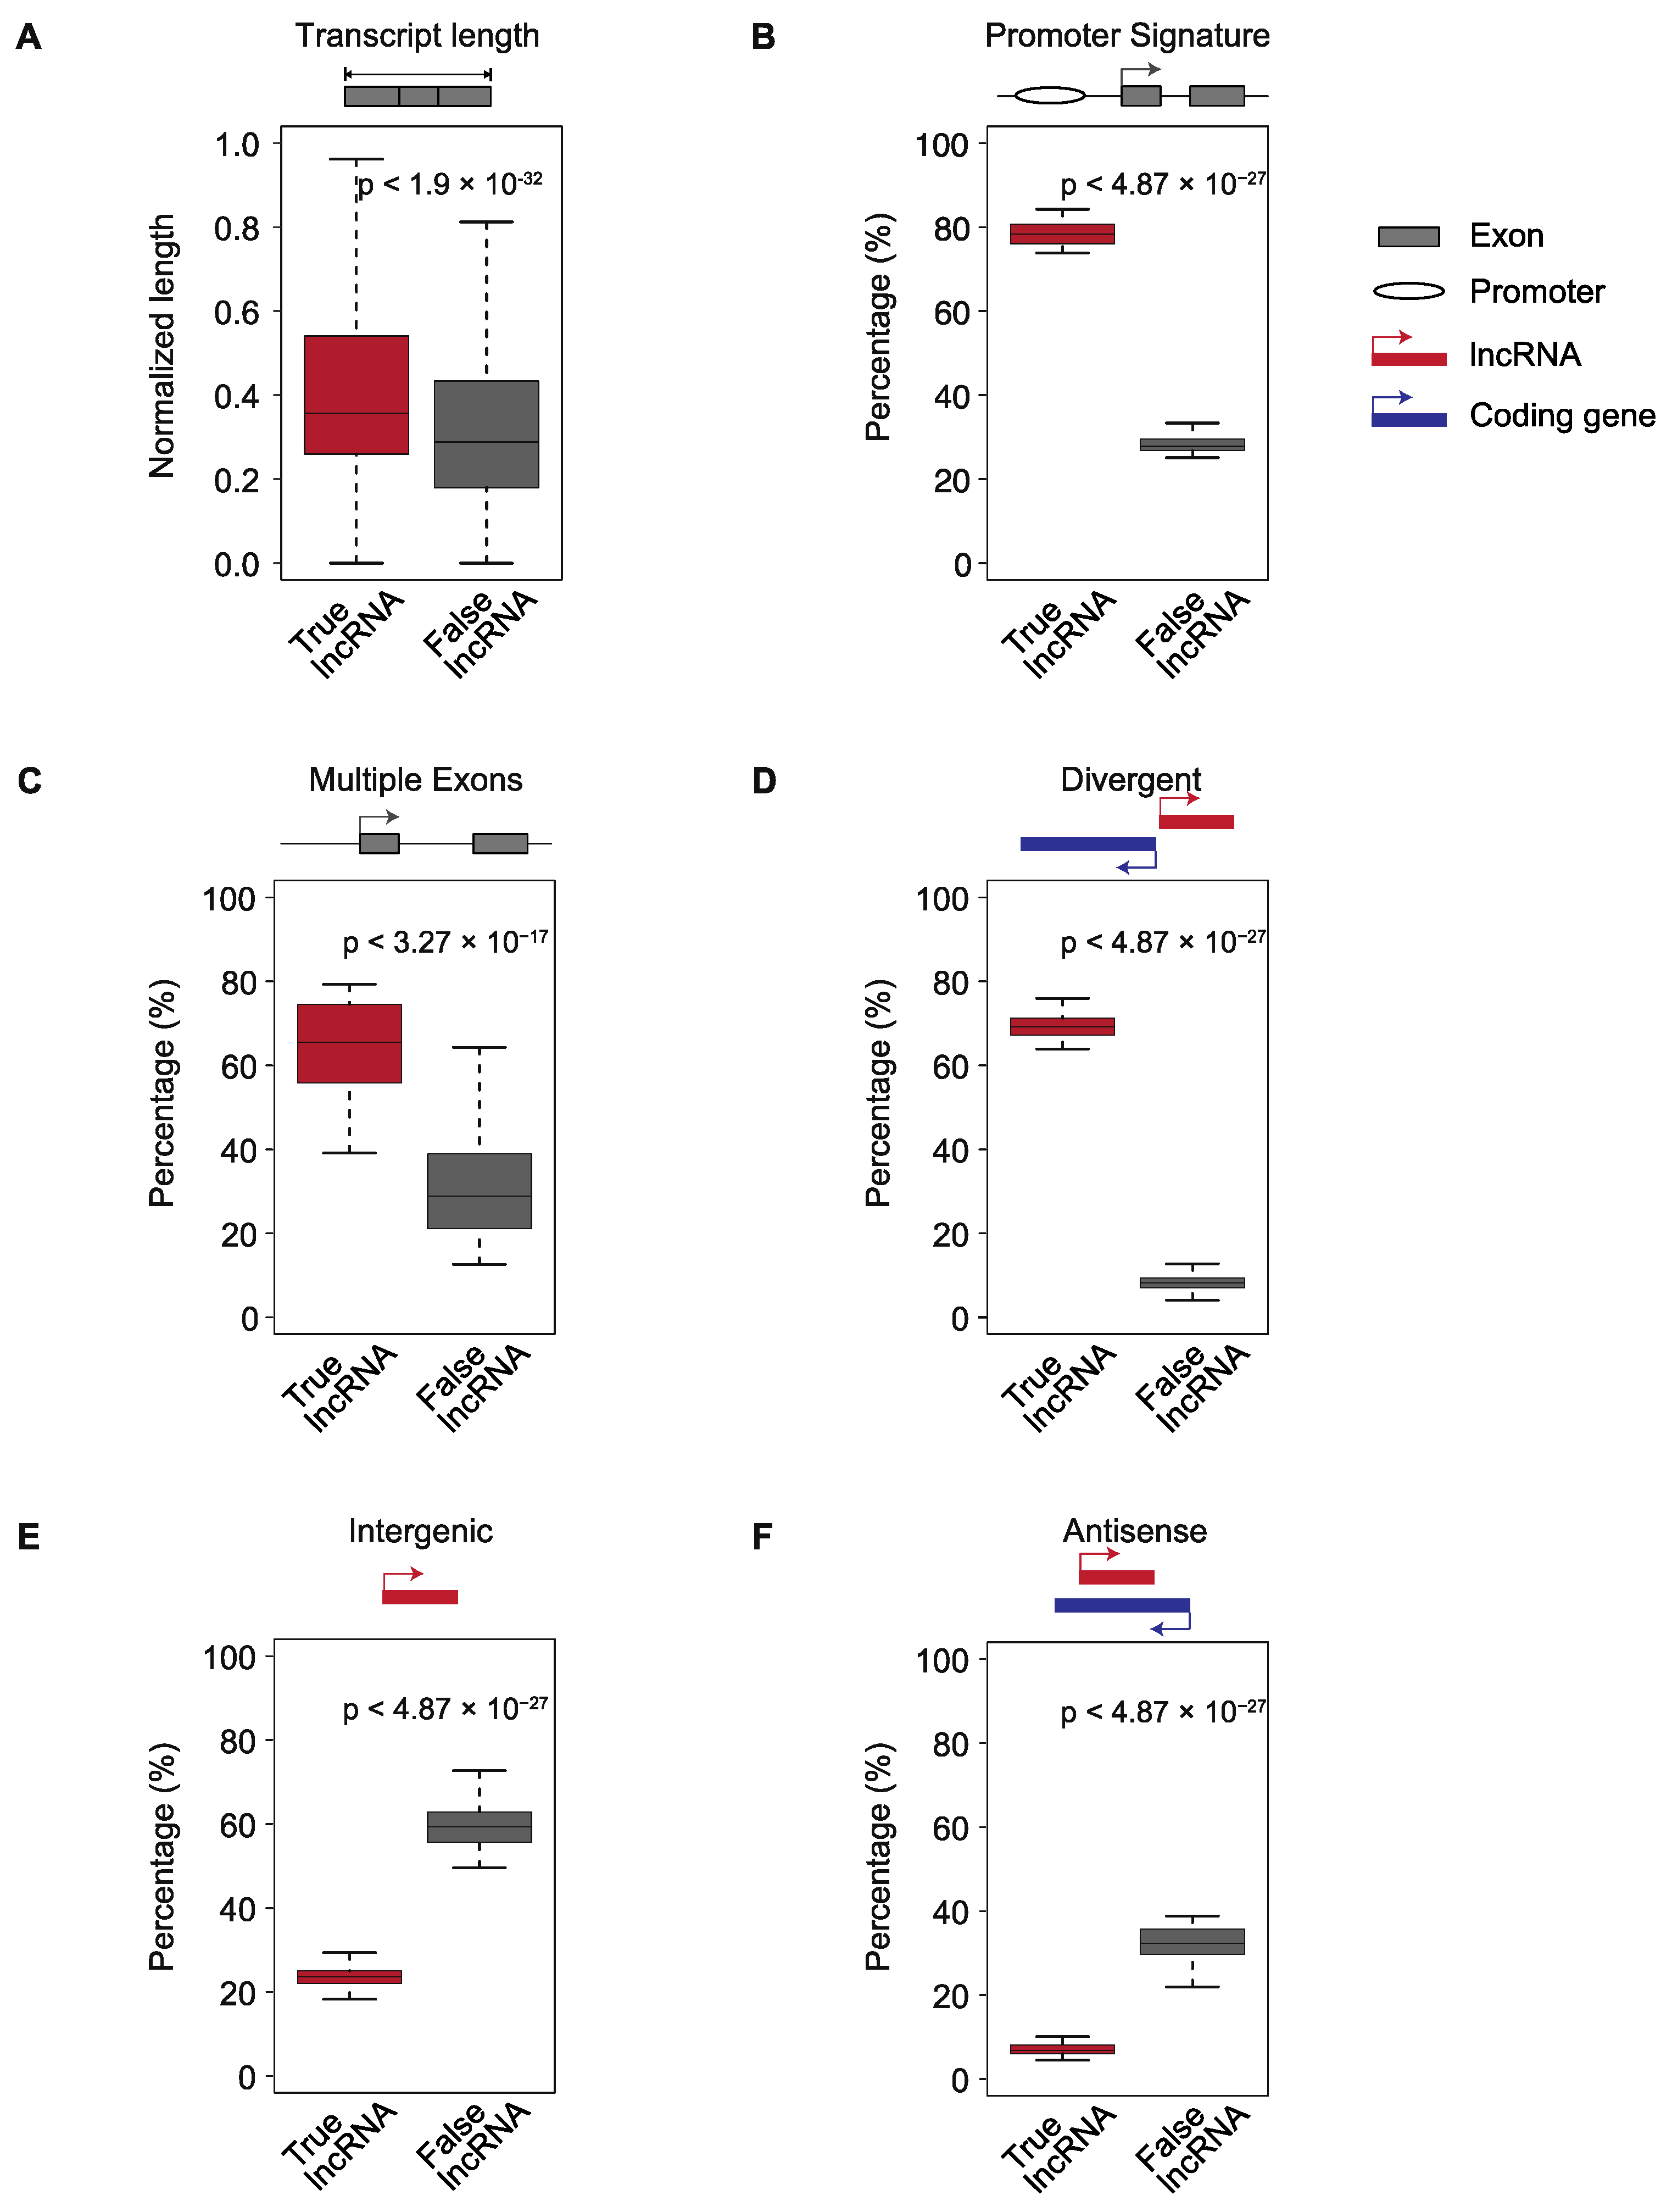
2.2. Four Genomic Features Can Be Used to Distinguish True and False lncRNAs
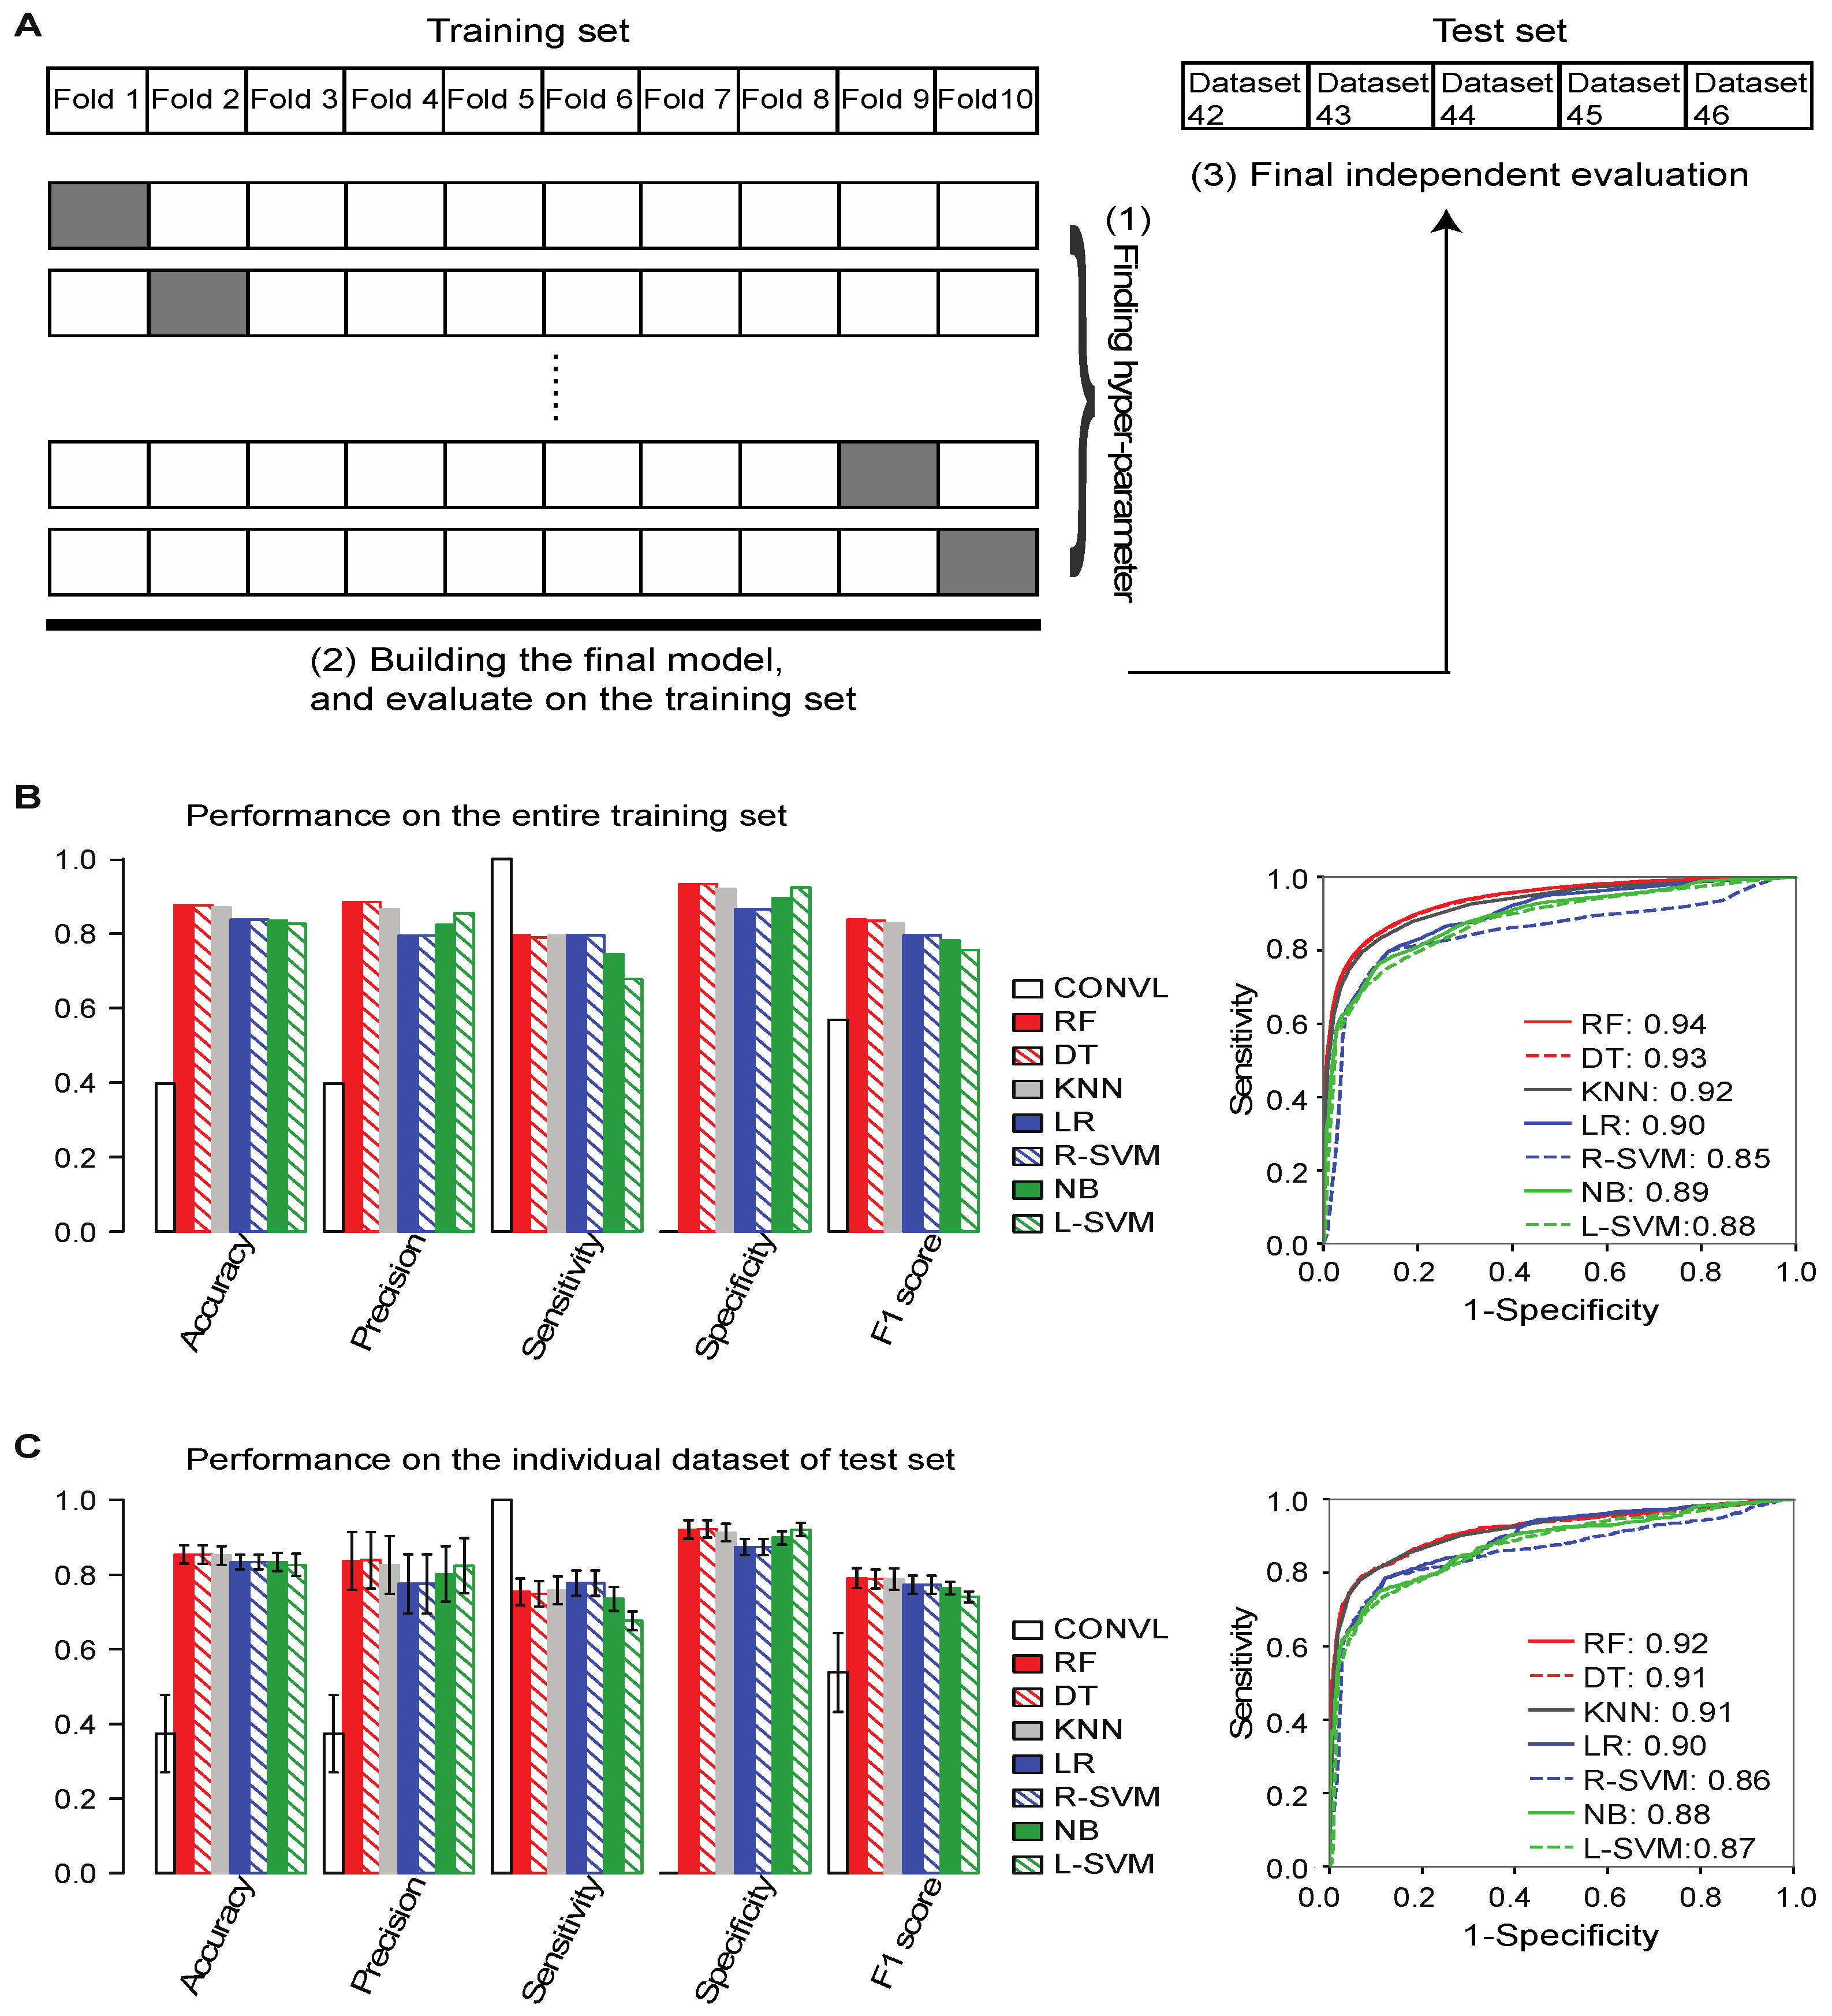
2.3. Training ML Models to Distinguish between True and False lncRNAs
2.4. Flnc Identifies True lncRNAs with up to 87% Prediction Precision
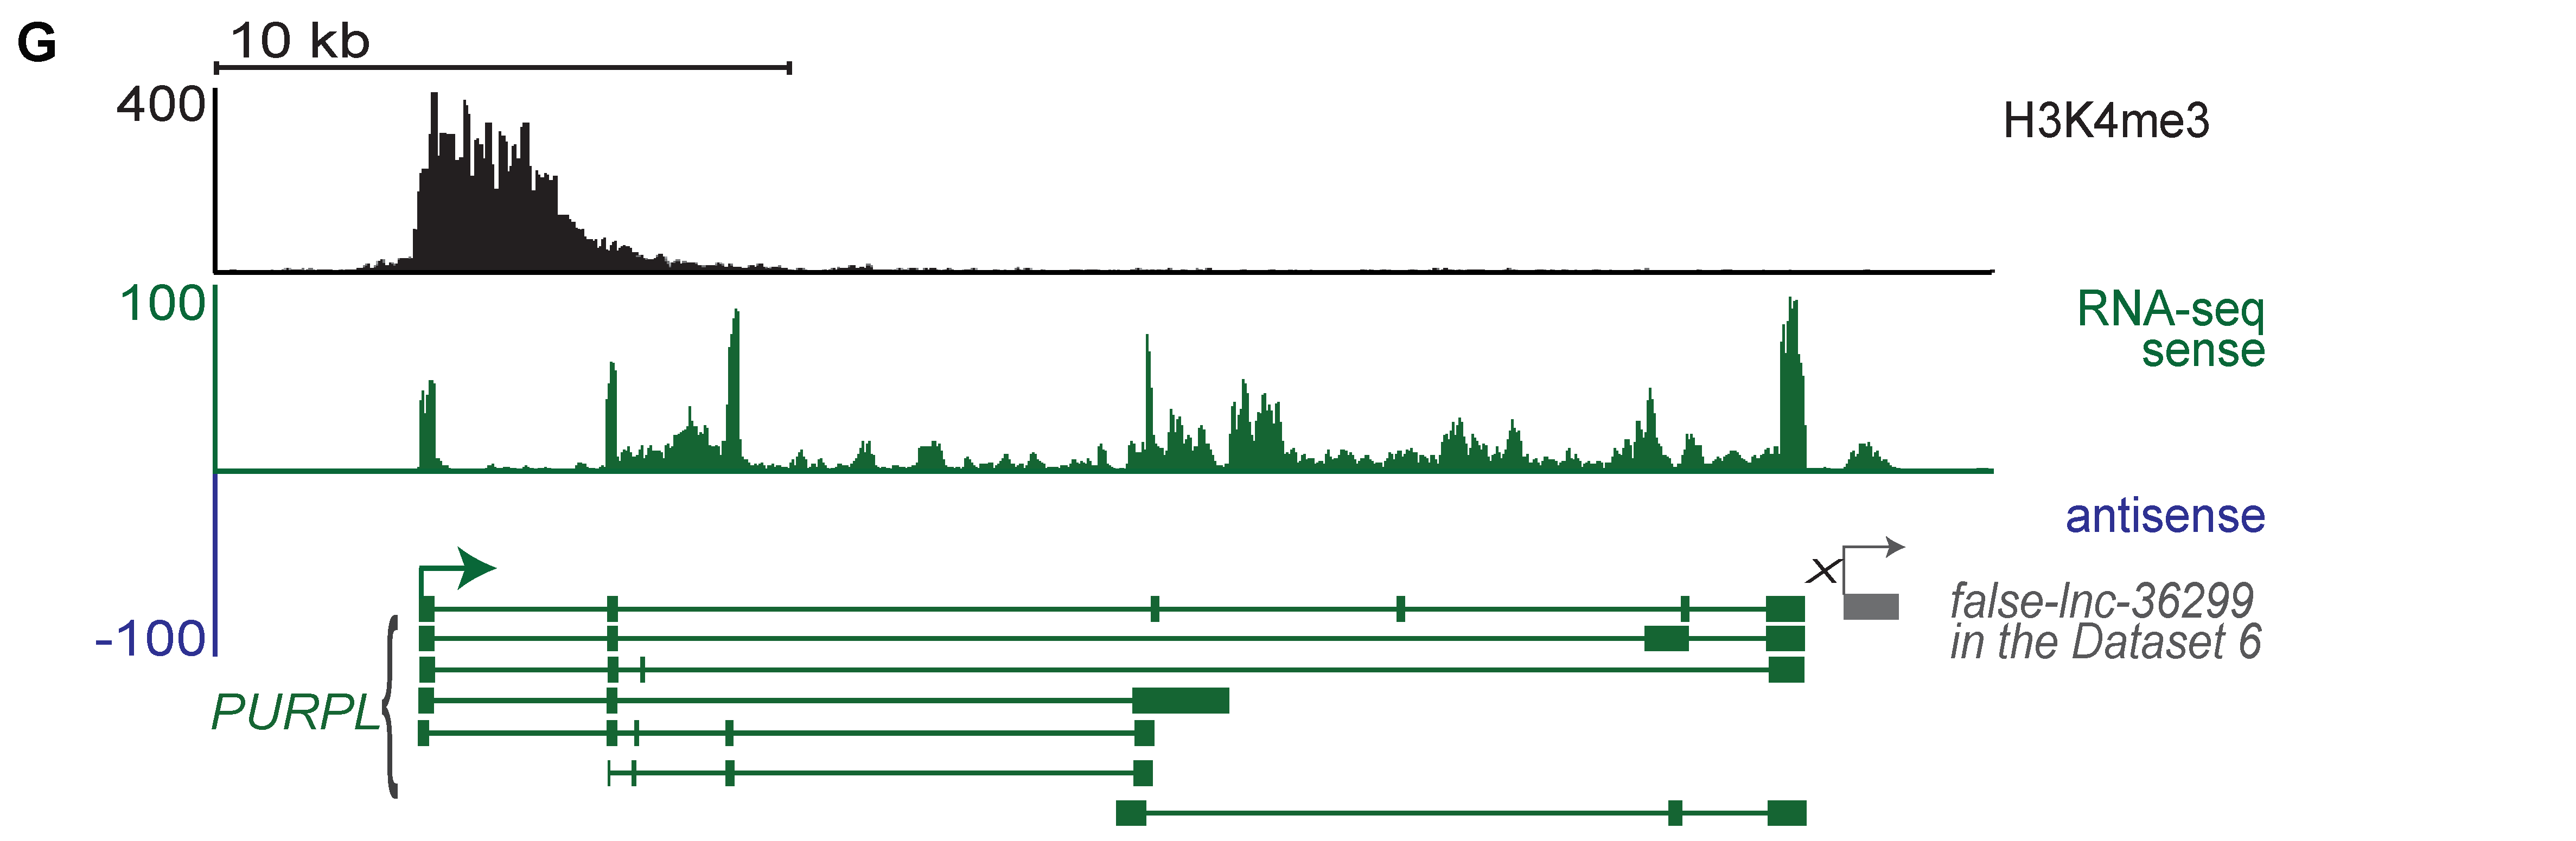
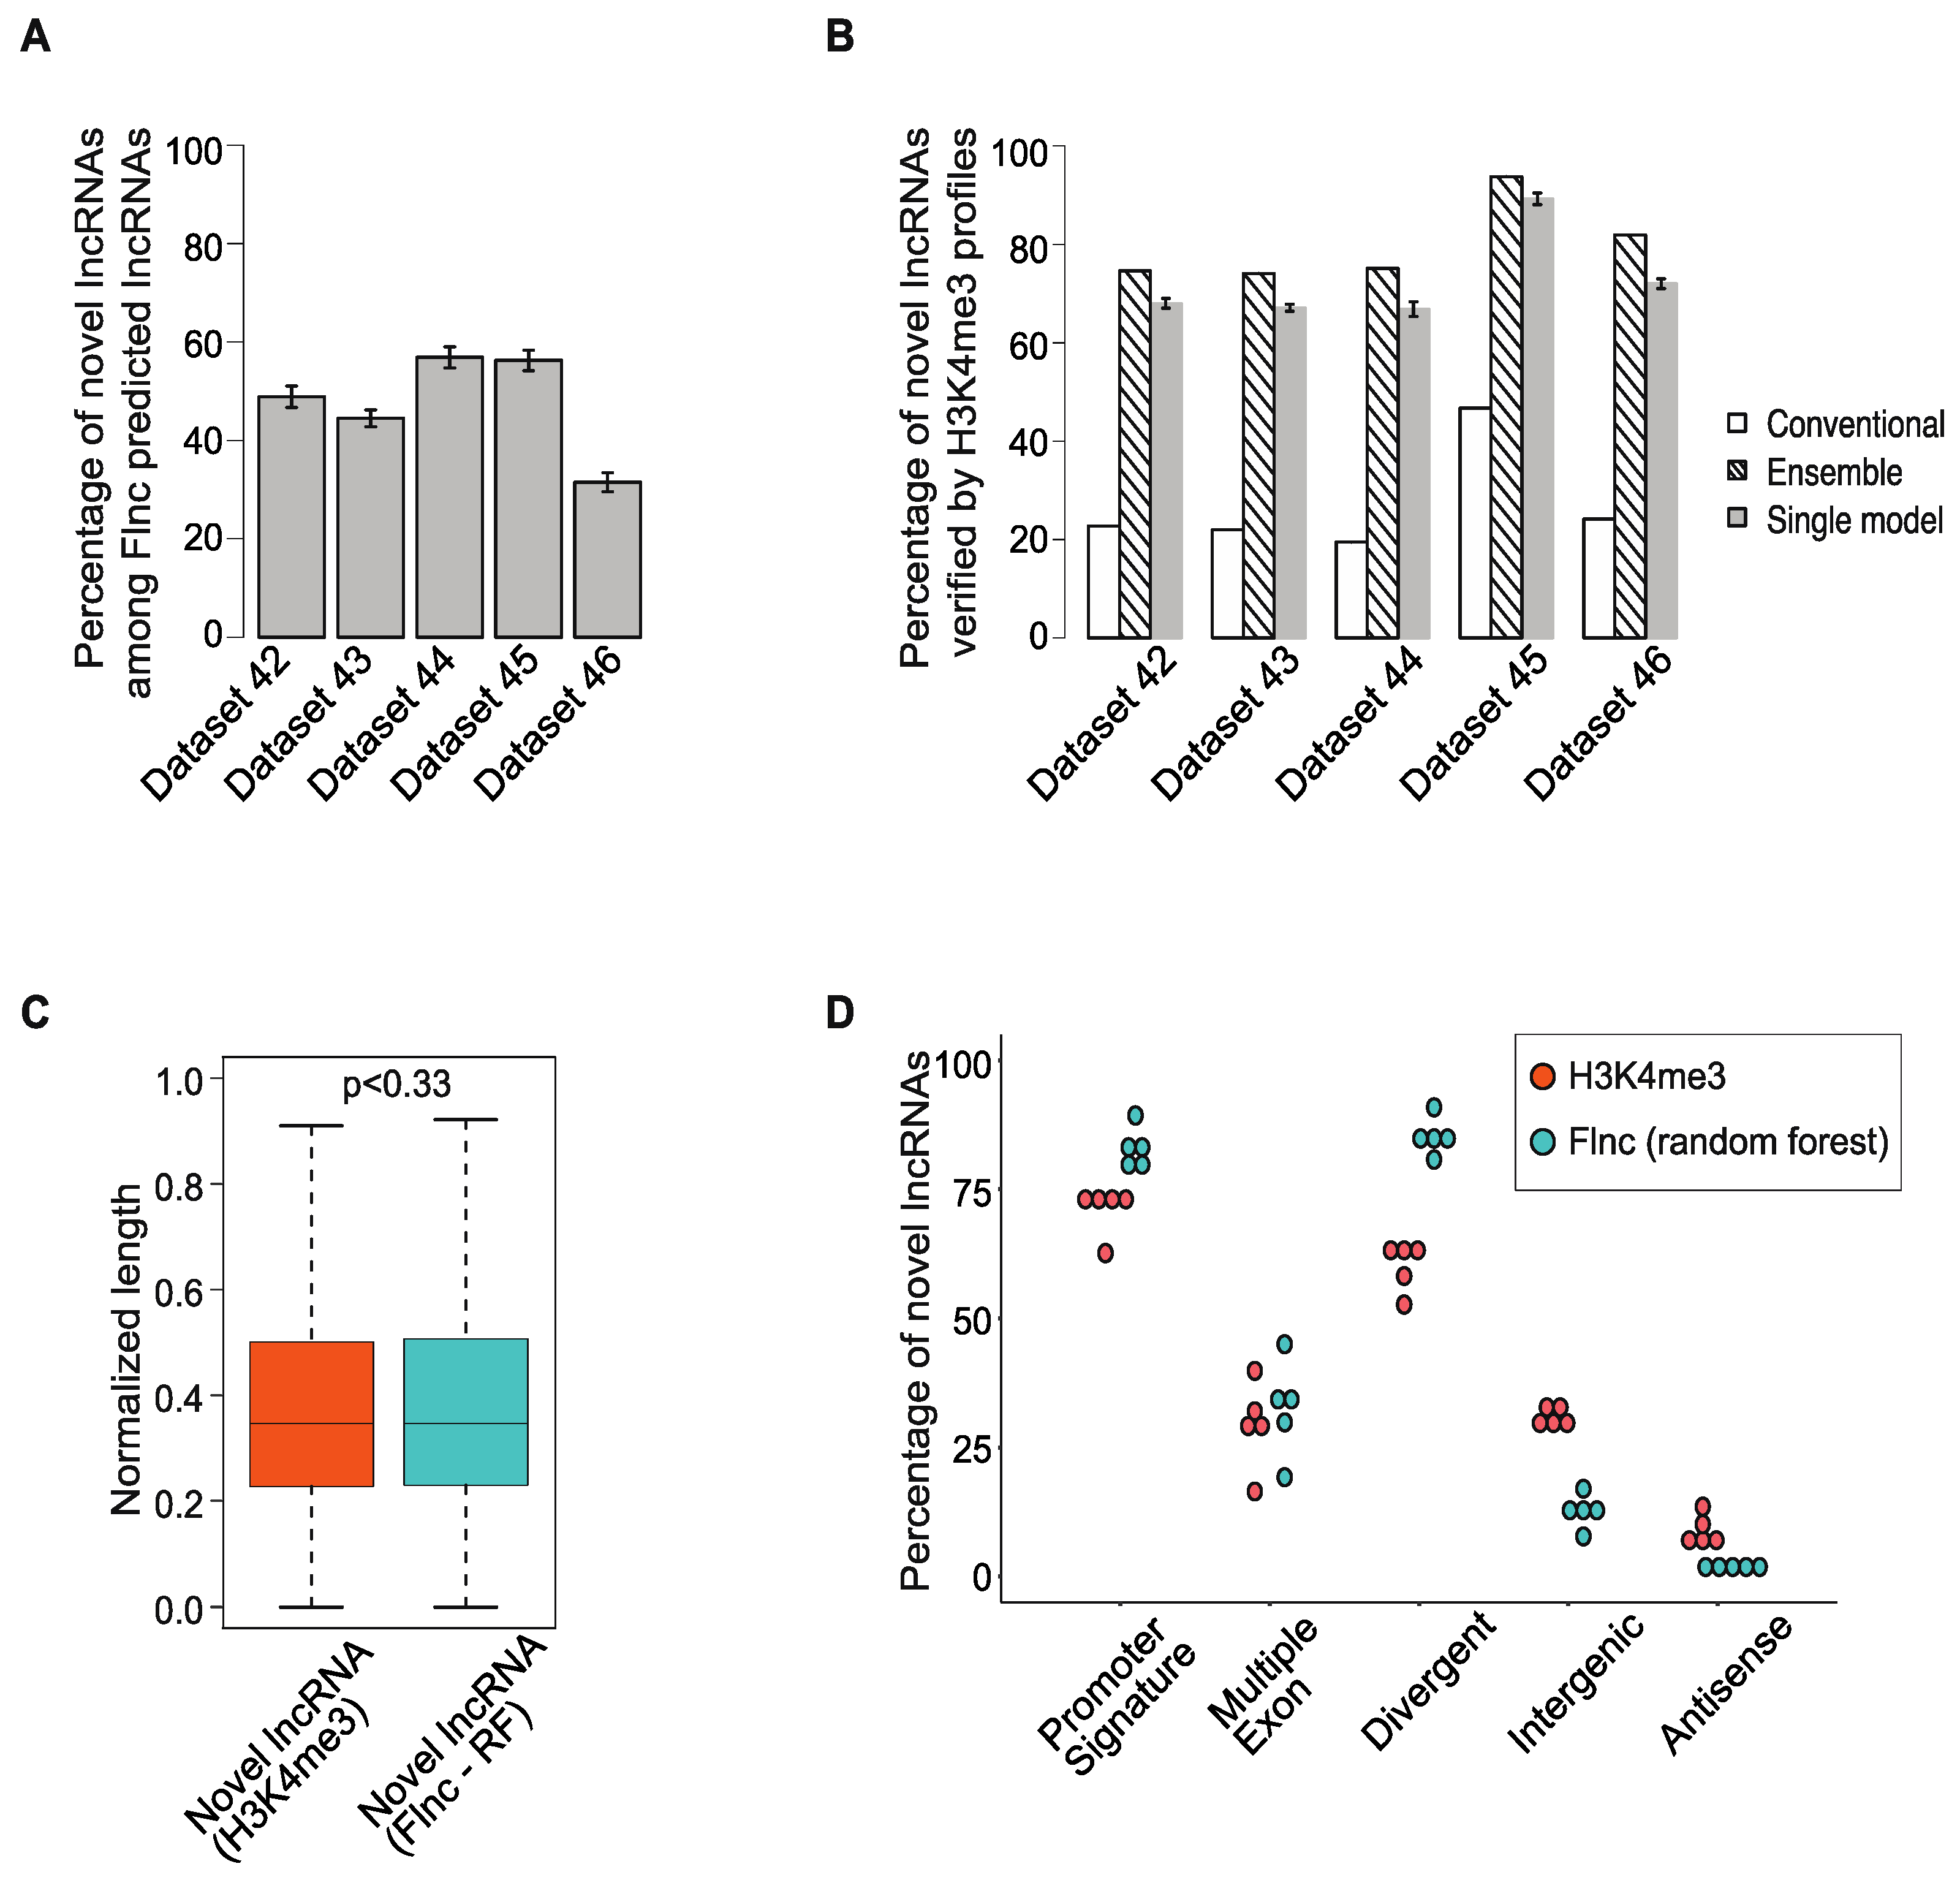
2.5. Many lncRNAs Identified by Flnc Are Novel and Are Supported by H3K4me3 Profiles
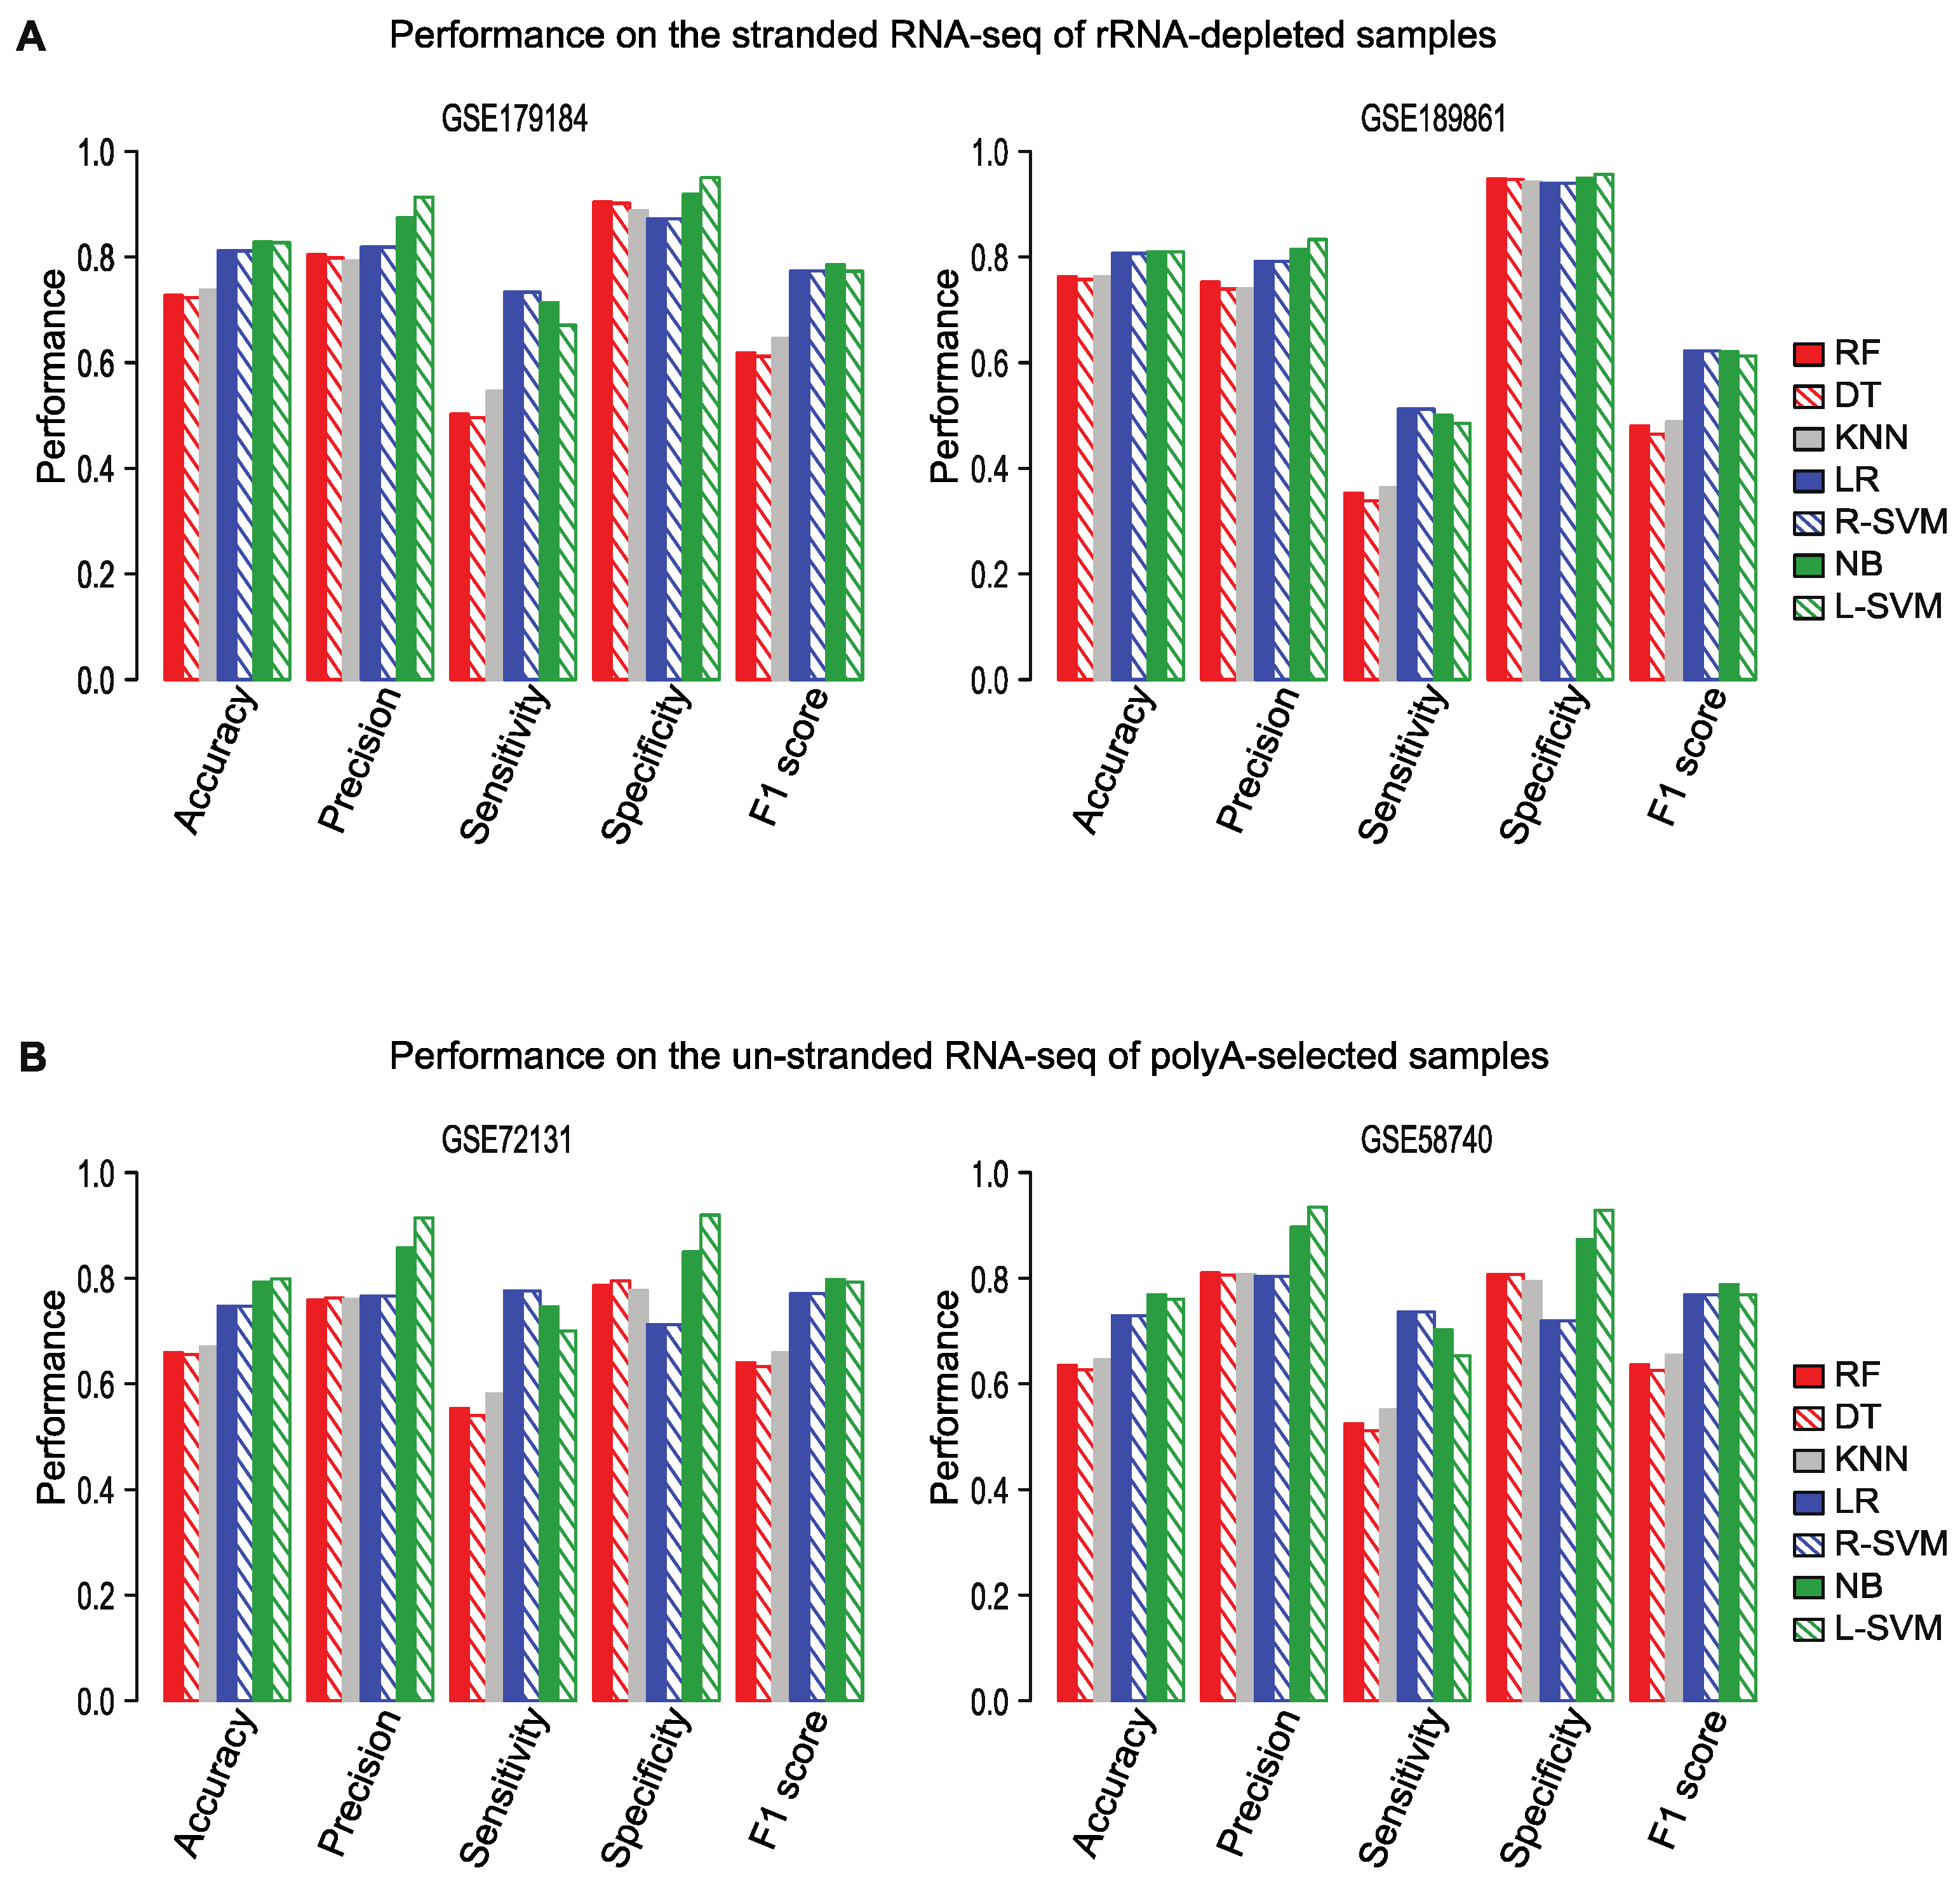
2.6. Flnc Predicts True lncRNAs in Multiple Types of RNA-Seq Samples
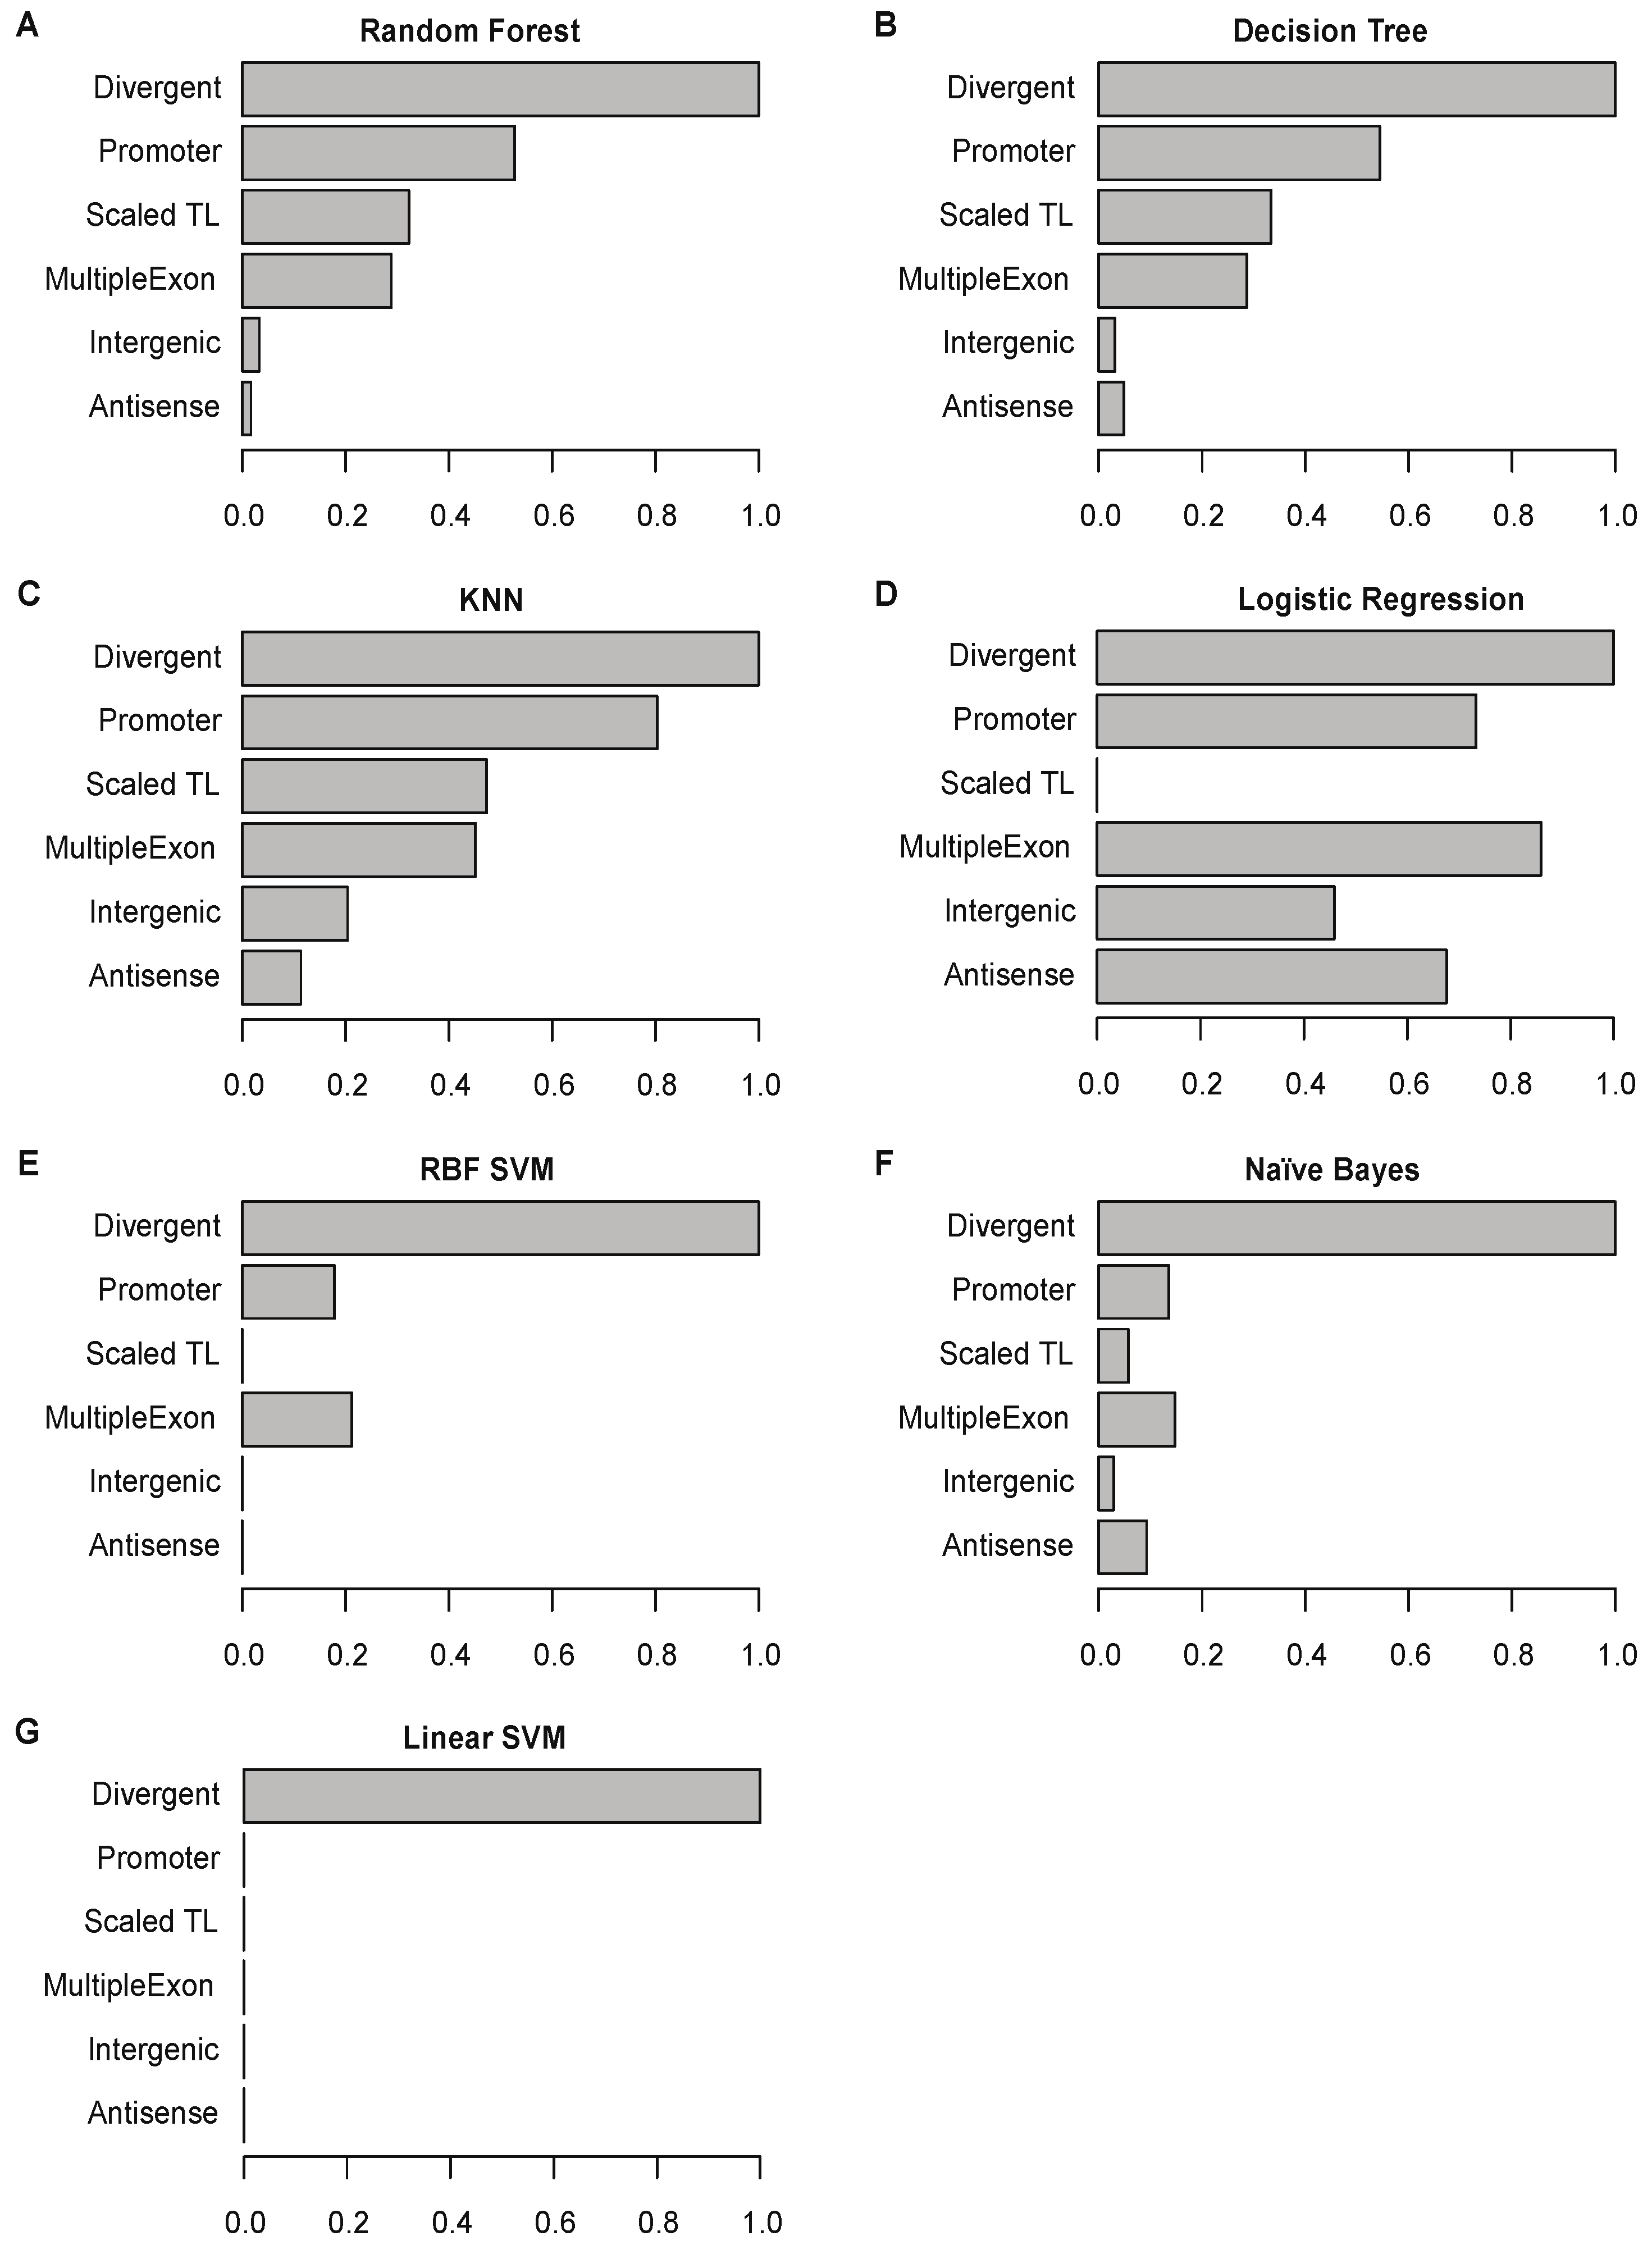
2.7. Divergent Transcription Is the Most Important Feature for Predicting True lncRNAs
2.8. Flnc Achieves Similar Performance at the lncRNA Gene Locus Level as at the Transcript Level
3. Conclusions and Discussion
4. Material and Methods
4.1. Collection of Sequencing Datasets to Generate Benchmark lncRNAs
4.2. Identification of Putative lncRNAs
4.3. Identification of H3K4me3 Peaks Using H3K4me3 ChIP-Seq Data
4.4. Identification of True and False lncRNAs Based on H3K4me3 ChIP-Seq Data
4.5. Normalization of Transcript Lengths
4.6. Identification of Promoter Regions
4.7. Classification of Putative lncRNAs by Genomic Location
4.8. Calculation of the Exon Numbers of Putative lncRNAs
4.9. Measurement Feature Importance
4.10. Collection of Other RNA-Seq Datasets and Matched H3K4me3 ChIP-Seq Data
Supplementary Materials
Author Contributions
Funding
Institutional Review Board Statement
Data Availability Statement
Acknowledgments
Conflicts of Interest
References
- Dunham, I.; Kundaje, A.; Aldred, S.F.; Collins, P.J.; Davis, C.A.; Doyle, F.; Epstein, C.B.; Frietze, S.; Harrow, J.; Kaul, R.; et al. An integrated encyclopedia of DNA elements in the human genome. Nature 2012, 489, 57–74. [Google Scholar]
- Statello, L.; Guo, C.J.; Chen, L.L.; Huarte, M. Gene regulation by long non-coding RNAs and its biological functions. Nat. Rev. Mol. Cell Biol. 2021, 22, 96–118. [Google Scholar] [CrossRef]
- Daneshvar, K.; Pondick, J.V.; Kim, B.-M.; Zhou, C.; York, S.R.; Macklin, J.A.; Abualteen, A.; Tan, B.; Sigova, A.A.; Marcho, C.; et al. DIGIT Is a Conserved Long Noncoding RNA that Regulates GSC Expression to Control Definitive Endoderm Differentiation of Embryonic Stem Cells Endoderm Differentiation of Embryonic Stem Cells. Cell Rep. 2016, 17, 353–365. [Google Scholar] [CrossRef] [PubMed]
- Daneshvar, K.; Ardehali, M.B.; Klein, I.A.; Hsieh, F.K.; Kratkiewicz, A.J.; Mahpour, A.; Cancelliere, S.O.L.; Zhou, C.; Cook, B.M.; Li, W.; et al. lncRNA DIGIT and BRD3 protein form phase-separated condensates to regulate endoderm differentiation. Nat. Cell Biol. 2020, 22, 1211–1222. [Google Scholar] [CrossRef]
- Cabili, M.N.; Trapnell, C.; Goff, L.; Koziol, M.; Tazon-Vega, B.; Regev, A.; Rinn, J.L. Integrative annotation of human large intergenic noncoding RNAs reveals global properties and specific subclasses. Genes Dev. 2011, 25, 1915–1927. [Google Scholar] [CrossRef]
- Li, G.; Kryczek, I.; Nam, J.; Li, X.; Li, S.; Li, J.; Grove, S.; Vatan, L.; Zhou, J.; Du, W.; et al. LIMIT is an immunogenic lncRNA in cancer immunity and immunotherapy. Nat. Cell Biol. 2021, 23, 526–537. [Google Scholar] [CrossRef]
- Guo, C.J.; Ma, X.K.; Xing, Y.H.; Zheng, C.C.; Xu, Y.F.; Shan, L.; Zhang, J.; Wang, S.; Wang, Y.; Carmichael, G.G.; et al. Distinct Processing of lncRNAs Contributes to Non-conserved Functions in Stem Cells. Cell 2020, 181, 621–636.e22. [Google Scholar] [CrossRef] [PubMed]
- Quinn, J.J.; Chang, H.Y. Unique features of long non-coding RNA biogenesis and function. Nat. Rev. Genet. 2016, 17, 47–62. [Google Scholar] [CrossRef] [PubMed]
- de Goede, O.M.; Nachun, D.C.; Ferraro, N.M.; Gloudemans, M.J.; Rao, A.S.; Smail, C.; Eulalio, T.Y.; Aguet, F.; Ng, B.; Xu, J.; et al. Population-scale tissue transcriptomics maps long non-coding RNAs to complex disease. Cell 2021, 184, 2633–2648.e19. [Google Scholar] [CrossRef] [PubMed]
- Huarte, M. The emerging role of lncRNAs in cancer. Nat. Med. 2015, 21, 1253–1261. [Google Scholar] [CrossRef]
- Fernandes, J.C.R.; Acuña, S.M.; Aoki, J.I.; Floeter-Winter, L.M.; Muxel, S.M. Long non-coding RNAs in the regulation of gene expression: Physiology and disease. Non-Coding RNA 2019, 5, 17. [Google Scholar] [CrossRef]
- Zhang, X.; Wang, W.; Zhu, W.; Dong, J.; Cheng, Y.; Yin, Z.; Shen, F. Mechanisms and Functions of Long Non-Coding RNAs at Multiple Regulatory Levels. Int. J. Mol. Sci. 2019, 20, 5573. [Google Scholar] [CrossRef]
- Hezroni, H.; Koppstein, D.; Schwartz, M.G.; Avrutin, A.; Bartel, D.P.; Ulitsky, I. Principles of Long Noncoding RNA Evolution Derived from Direct Comparison of Transcriptomes in 17 Species. Cell Rep. 2015, 11, 1110–1122. [Google Scholar] [CrossRef]
- Du, Z.; Fei, T.; Verhaak, R.G.W.; Su, Z.; Zhang, Y.; Brown, M.; Chen, Y.; Liu, X.S. Integrative genomic analyses reveal clinically relevant long noncoding RNAs in human cancer. Nat. Struct. Mol. Biol. 2013, 20, 908–913. [Google Scholar] [CrossRef]
- Frankish, A.; Diekhans, M.; Jungreis, I.; Lagarde, J.; Loveland, J.E.; Mudge, J.M.; Sisu, C.; Wright, J.C.; Armstrong, J.; Barnes, I.; et al. Gencode. Nucleic Acids Res. 2021, 49, D916–D923. [Google Scholar] [CrossRef]
- Fang, S.; Zhang, L.; Guo, J.; Niu, Y.; Wu, Y.; Li, H.; Zhao, L.; Li, X.; Teng, X.; Sun, X.; et al. NONCODEV5: A comprehensive annotation database for long non-coding RNAs. Nucleic Acids Res. 2018, 46, D308–D314. [Google Scholar] [CrossRef]
- Volders, P.-J.; Anckaert, J.; Verheggen, K.; Nuytens, J.; Martens, L.; Mestdagh, P.; Vandesompele, J. LNCipedia 5: Towards a reference set of human long non-coding RNAs. Nucleic Acids Res. 2019, 47, D135–D139. [Google Scholar] [CrossRef] [PubMed]
- Zhou, C.; York, S.R.; Chen, J.Y.; Pondick, J.V.; Motola, D.L.; Chung, R.T.; Mullen, A.C. Long noncoding RNAs expressed in human hepatic stellate cells form networks with extracellular matrix proteins. Genome Med. 2016, 8, 31. [Google Scholar] [CrossRef] [PubMed]
- Guttman, M.; Garber, M.; Levin, J.Z.; Donaghey, J.; Robinson, J.; Adiconis, X.; Fan, L.; Koziol, M.J.; Gnirke, A.; Nusbaum, C.; et al. Ab initio reconstruction of cell type-specific transcriptomes in mouse reveals the conserved multi-exonic structure of lincRNAs. Nat. Biotechnol. 2010, 28, 503–510. [Google Scholar] [CrossRef] [PubMed]
- Grabherr, M.G.; Haas, B.J.; Yassour, M.; Levin, J.Z.; Thompson, D.A.; Amit, I.; Adiconis, X.; Fan, L.; Raychowdhury, R.; Zeng, Q.; et al. Trinity: Reconstructing a full-length transcriptome without a genome from RNA-Seq data. Nat. Biotechnol. 2013, 29, 644–652. [Google Scholar] [CrossRef]
- Trapnell, C.; Williams BPertea, G.; Mortazavi, A.; Kwan, G.; van Baren, M.J.; Salzberg, S.L.; Wold, B.J.; Pachter, L. Transcript assembly and quantification by RNA-Seq reveals unannotated transcripts and isoform switching during cell differentiation. Nat. Biotechnol. 2010, 28, 511–515. [Google Scholar] [CrossRef]
- Pertea, M.; Pertea, G.M.; Antonescu, C.M.; Chang, T.C.; Mendell, J.T.; Salzberg, S.L. StringTie enables improved reconstruction of a transcriptome from RNA-seq reads. Nat. Biotechnol. 2015, 33, 290–295. [Google Scholar] [CrossRef] [PubMed]
- Liu, R.; Dickerson, J. Strawberry: Fast and accurate genome-guided transcript reconstruction and quantification from RNA-Seq. PLoS Comput. Biol. 2017, 13, e1005851. [Google Scholar] [CrossRef]
- Liu, J.; Yu, T.; Jiang, T.; Li, G. TransComb: Genome-guided transcriptome assembly via combing junctions in splicing graphs. Genome Biol. 2016, 17, 213. [Google Scholar] [CrossRef]
- Wang, L.; Park, H.J.; Dasari, S.; Wang, S.; Kocher, J.-P.; Li, W. CPAT: Coding-Potential Assessment Tool using an alignment-free logistic regression model. Nucleic Acids Res. 2013, 41, e74. [Google Scholar] [CrossRef] [PubMed]
- Wang, G.; Yin, H.; Li, B.; Yu, C.; Wang, F.; Xu, X.; Cao, J.; Bao, Y.; Wang, L.; Abbasi, A.A.; et al. Characterization and identification of long non-coding RNAs based on feature relationship. Bioinformatics 2019, 35, 2949–2956. [Google Scholar] [PubMed]
- Li, A.; Zhang, J.; Zhou, Z. PLEK: A tool for predicting long non-coding RNAs and messenger RNAs based on an improved k-mer scheme. BMC Bioinform. 2014, 15, 311. [Google Scholar] [CrossRef]
- Tong, X.; Liu, S. CPPred: Coding potential prediction based on the global description of RNA sequence. Nucleic Acids Res. 2019, 47, e43. [Google Scholar] [CrossRef] [PubMed]
- Danis, J.; Széll, M. VELUCT, a long non-coding RNA with an important cellular function despite low abundance. J. Thorac. Dis. 2017, 9, 3638–3640. [Google Scholar] [PubMed]
- Ulitsky, I.; Shkumatava, A.; Jan, C.H.; Sive, H.; Bartel, D.P. Conserved Function of lincRNAs in Vertebrate Embryonic Development despite Rapid Sequence Evolution. Cell 2011, 147, 1537–1550. [Google Scholar] [PubMed]
- Washietl, S.; Findeiß, S.; Müller, S.A.; Kalkhof, S.; von Bergen, M.; Hofacker, I.L.; Stadler, P.F.; Goldman, N. RNAcode: Robust discrimination of coding and noncoding regions in comparative sequence data. RNA 2011, 17, 578–594. [Google Scholar] [CrossRef]
- Ruan, X.; Li, P.; Chen, Y.; Shi, Y.; Pirooznia, M.; Seifuddin, F.; Suemizu, H.; Ohnishi, Y.; Yoneda, N.; Nishiwaki, M.; et al. In vivo functional analysis of non-conserved human lncRNAs associated with cardiometabolic traits. Nat. Commun. 2020, 11, 45. [Google Scholar] [CrossRef] [PubMed]
- Qiao, F.-H.; Tu, M.; Liu, H.-Y. Role of MALAT1 in gynecological cancers: Pathologic and therapeutic aspects (Review). Oncol. Lett. 2021, 21, 333. [Google Scholar] [CrossRef]
- Guenther, M.G.; Levine, S.S.; Boyer, L.A.; Jaenisch, R.; Young, R.A. A Chromatin Landmark and Transcription Initiation at Most Promoters in Human Cells. Cell 2007, 130, 77–88. [Google Scholar] [CrossRef]
- Sigova, A.A.; Mullen, A.C.; Molinie, B.; Gupta, S.; Orlando, D.A.; Guenther, M.G.; Almada, A.E.; Lin, C.; Sharp, P.A.; Giallourakis, C.C.; et al. Divergent transcription of long noncoding RNA / mRNA gene pairs in embryonic stem cells. Proc. Natl. Acad. Sci. USA. 2013, 110, 2876–2881. [Google Scholar] [CrossRef]
- Luo, W.; Bentley, D. A Ribonucleolytic Rat Torpedoes RNA Polymerase II. Cell 2004, 119, 911–914. [Google Scholar] [CrossRef][Green Version]
- Eaton, J.D.; West, S. An end in sight? Xrn2 and transcriptional termination by RNA polymerase II. Transcription 2018, 9, 321–326. [Google Scholar] [CrossRef]
- Babarinde, I.A.; Hutchins, A.P. The effects of sequencing depth on the assembly of coding and noncoding transcripts in the human genome. BMC Genom. 2022, 23, 4487. [Google Scholar] [CrossRef]
- Keel, B.N.; Oliver, W.T.; Keele, J.W.; Lindholm-Perry, A.K. Evaluation of transcript assembly in multiple porcine tissues suggests optimal sequencing depth for RNA-Seq using total RNA library. Anim. Gene 2020, 17–18, 200105. [Google Scholar] [CrossRef]
- Chang, Z.; Wang, Z.; Li, G. The impacts of read length and transcriptome complexity for de ovo assembly: A simulation study. PLoS ONE 2014, 9, e94825. [Google Scholar]
- Solovyev, V.; Salamov, A. The Gene-Finder computer tools for analysis of human and model organisms genome sequences. Proc. Int. Conf. Intell. Syst. Mol. Boil. 1997, 5, 294–302. [Google Scholar]
- Chen, J.; Shishkin, A.A.; Zhu, X.; Kadri, S.; Maza, I.; Guttman, M.; Hanna, J.H.; Regev, A.; Garber, M. Evolutionary analysis across mammals reveals distinct classes of long non-coding RNAs. Genome Biol. 2016, 17, 19. [Google Scholar] [CrossRef]
- Yang, Y.; Zhou, R.; Zhu, S.; Li, X.; Li, H.; Yu, H.; Li, K. Systematic Identification and Molecular Characteristics of Long Noncoding RNAs in Pig Tissues. BioMed Res. Int. 2017, 2017, 6152582. [Google Scholar] [CrossRef]
- Li, H.; Durbin, R. Fast and accurate short read alignment with Burrows—Wheeler transform. Bioinformatics 2009, 25, 1754–1760. [Google Scholar] [CrossRef]
- Li, H. Aligning sequence reads, clone sequences and assembly contigs with BWA-MEM. arXiv 2013, arXiv:1303.3997. [Google Scholar]
- Edgar, R.; Domrachev, M.; Lash, A.E. Gene Expression Omnibus: NCBI gene expression and hybridization array data repository. Nucleic Acids Res. 2002, 30, 207–210. [Google Scholar] [CrossRef]
- Kim, D.; Langmead, B.; Salzberg, S.L. HISAT: A fast spliced aligner with low memory requirements. Nat. Methods 2015, 12, 357–360. [Google Scholar] [CrossRef]
- Zhang, Y.; Liu, T.; Meyer, C.A.; Eeckhoute, J.; Johnson, D.S.; Bernstein, B.E.; Nusbaum, C.; Myers, R.M.; Brown, M.; Li, W.; et al. Model-based analysis of ChIP-Seq (MACS). Genome Biol. 2018, 9, R137. [Google Scholar] [CrossRef]
- Chen, K.; Chen, Z.; Wu, D.; Zhang, L.; Lin, X.; Su, J.; Rodriguez, B.; Xi, Y.; Xia, Z.; Chen, X.; et al. Broad H3K4me3 is associated with increased transcription elongation and enhancer activity at tumor-suppressor genes. Nat. Genet. 2015, 47, 1149–1157. [Google Scholar] [CrossRef]
- Dincer, A.; Gavin, D.P.; Xu, K.; Zhang, B.; Dudley, J.T.; Schadt, E.E.; Akbarian, S. Deciphering H3K4me3 broad domains associated with gene-regulatory networks and conserved epigenomic landscapes in the human brain. Transl. Psychiatry 2015, 5, e679. [Google Scholar] [CrossRef]
- Liu, R.; States, D.J. Consensus Promoter Identification in the Human Genome Utilizing Expressed Gene Markers and Gene Modeling. Genome Res. 2002, 12, 462–469. [Google Scholar] [CrossRef][Green Version]
- Harrow, J.; Frankish, A.; Gonzalez, J.M.; Tapanari, E.; Diekhans, M.; Kokocinski, F.; Aken, B.L.; Barrell, D.; Zadissa, A.; Searle, S.; et al. GENCODE: The reference human genome annotation for the ENCODE project. Genome Res. 2012, 22, 1760–1774. [Google Scholar] [CrossRef]
- Quinlan, A.R.; Hall, I.M. BEDTools: A flexible suite of utilities for comparing genomic features. Bioinformatics 2010, 26, 841–842. [Google Scholar] [CrossRef]
- Pertea, G.; Pertea, M. GFF Utilities: GffRead and GffCompare. F1000Research 2020, 9, 1–19. [Google Scholar] [CrossRef]
- Altmann, A.; Toloşi, L.; Sander, O.; Lengauer, T. Permutation importance: A corrected feature importance measure. Bioinformatics 2010, 26, 1340–1347. [Google Scholar] [CrossRef]


Publisher’s Note: MDPI stays neutral with regard to jurisdictional claims in published maps and institutional affiliations. |
© 2022 by the authors. Licensee MDPI, Basel, Switzerland. This article is an open access article distributed under the terms and conditions of the Creative Commons Attribution (CC BY) license (https://creativecommons.org/licenses/by/4.0/).
Share and Cite
Li, Z.; Zhou, P.; Kwon, E.; Fitzgerald, K.A.; Weng, Z.; Zhou, C. Flnc: Machine Learning Improves the Identification of Novel Long Noncoding RNAs from Stand-Alone RNA-Seq Data. Non-Coding RNA 2022, 8, 70. https://doi.org/10.3390/ncrna8050070
Li Z, Zhou P, Kwon E, Fitzgerald KA, Weng Z, Zhou C. Flnc: Machine Learning Improves the Identification of Novel Long Noncoding RNAs from Stand-Alone RNA-Seq Data. Non-Coding RNA. 2022; 8(5):70. https://doi.org/10.3390/ncrna8050070
Chicago/Turabian StyleLi, Zixiu, Peng Zhou, Euijin Kwon, Katherine A. Fitzgerald, Zhiping Weng, and Chan Zhou. 2022. "Flnc: Machine Learning Improves the Identification of Novel Long Noncoding RNAs from Stand-Alone RNA-Seq Data" Non-Coding RNA 8, no. 5: 70. https://doi.org/10.3390/ncrna8050070
APA StyleLi, Z., Zhou, P., Kwon, E., Fitzgerald, K. A., Weng, Z., & Zhou, C. (2022). Flnc: Machine Learning Improves the Identification of Novel Long Noncoding RNAs from Stand-Alone RNA-Seq Data. Non-Coding RNA, 8(5), 70. https://doi.org/10.3390/ncrna8050070