
Argonaute 2 Expression Correlates with a Luminal B Breast Cancer Subtype and Induces Estrogen Receptor Alpha Isoform Variation

 ,
, 

Abstract
:1. Introduction
2. Results
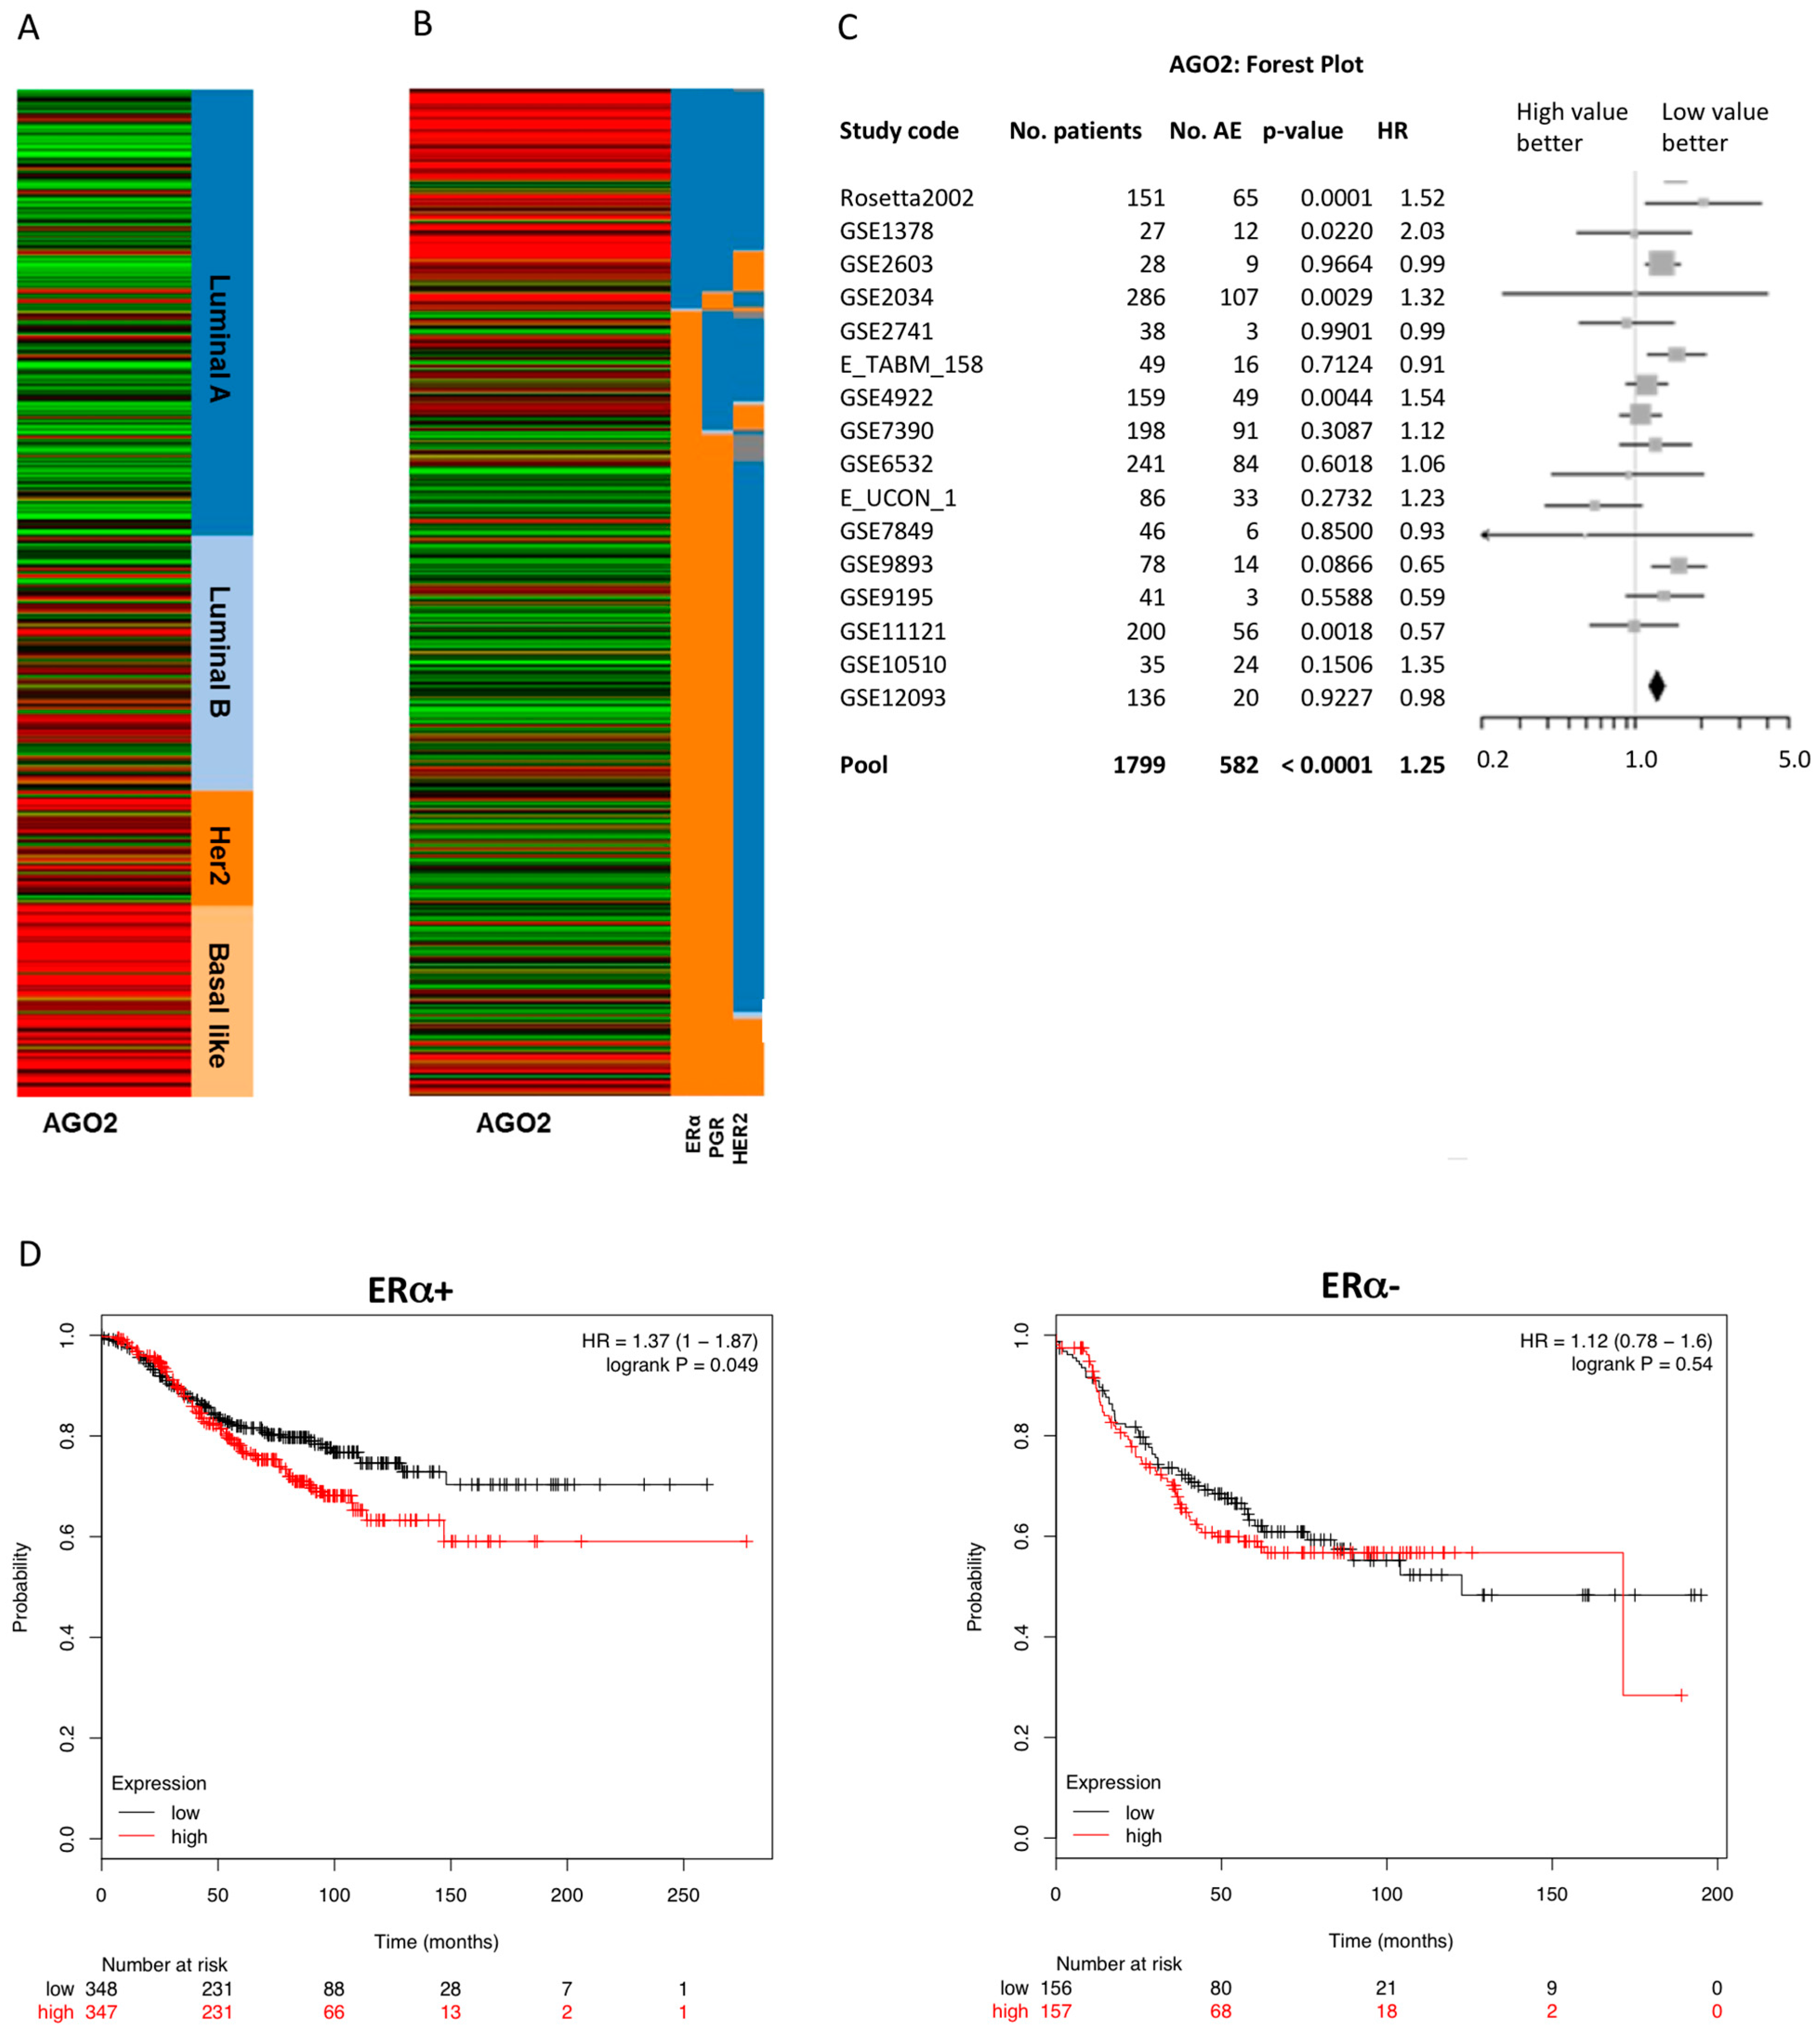
2.1. Enhanced Expression of AGO2 Is Associated with an ERα− and Luminal B Breast Cancer Phenotype
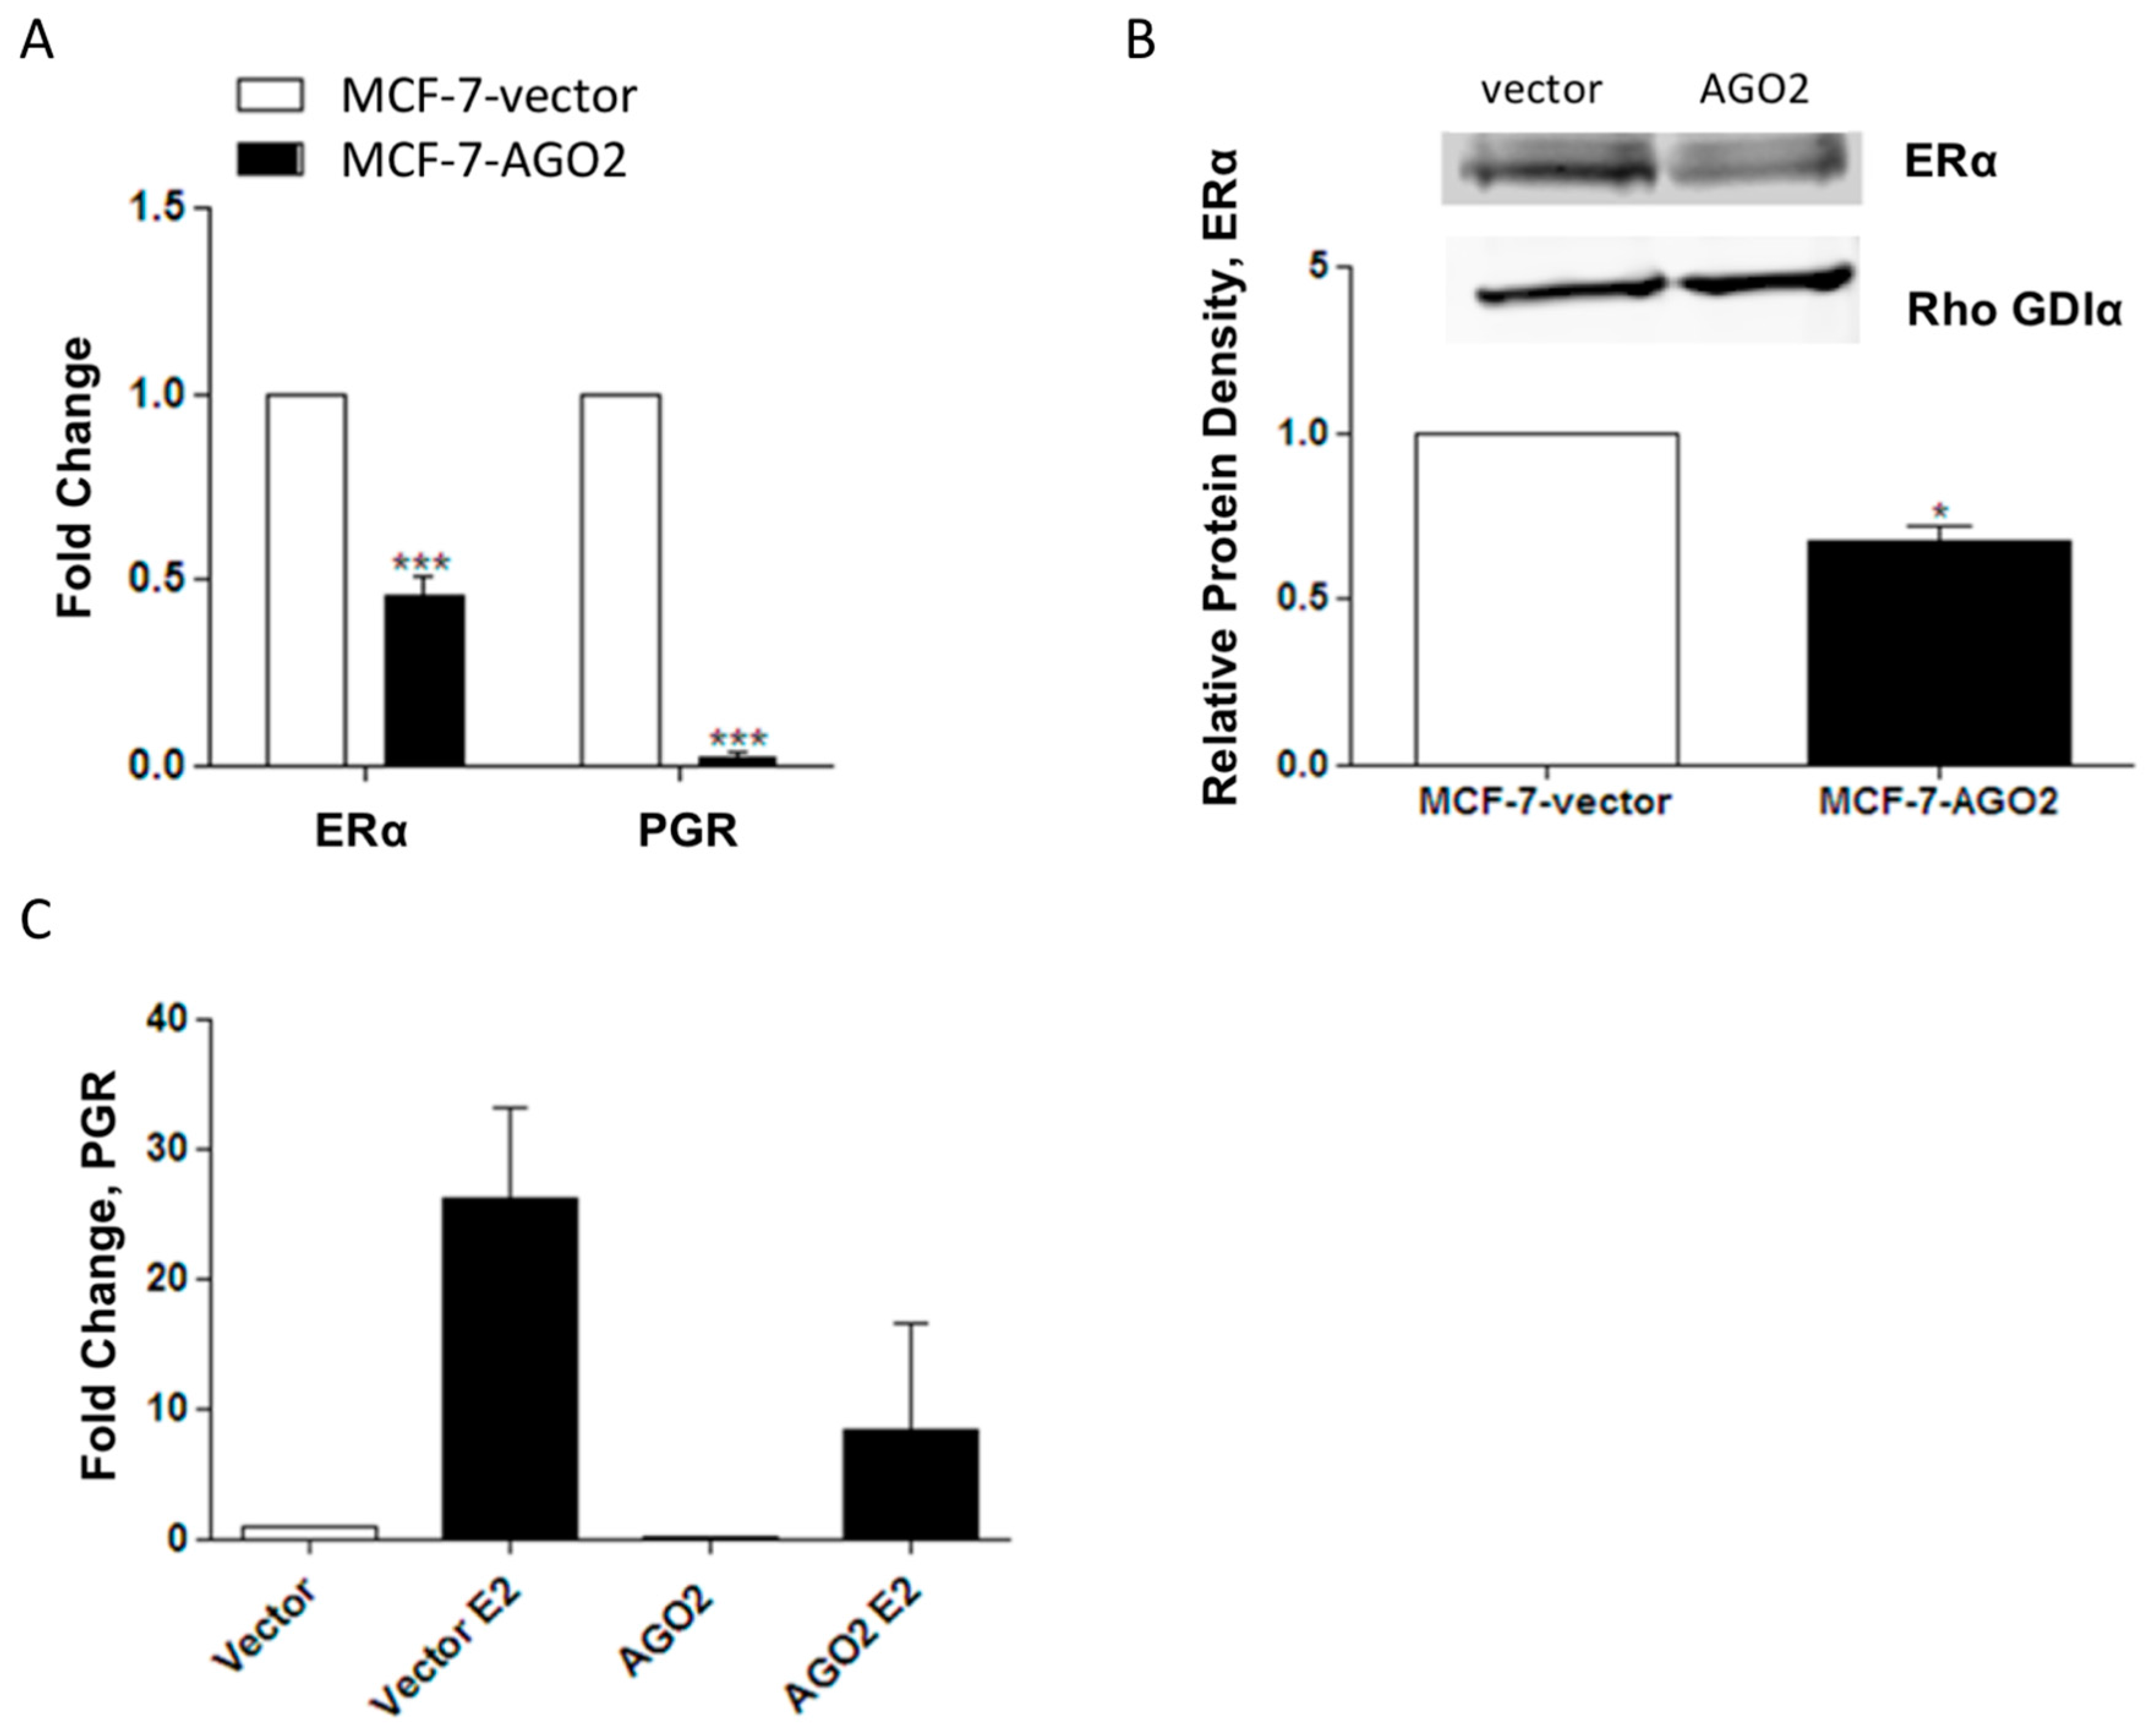
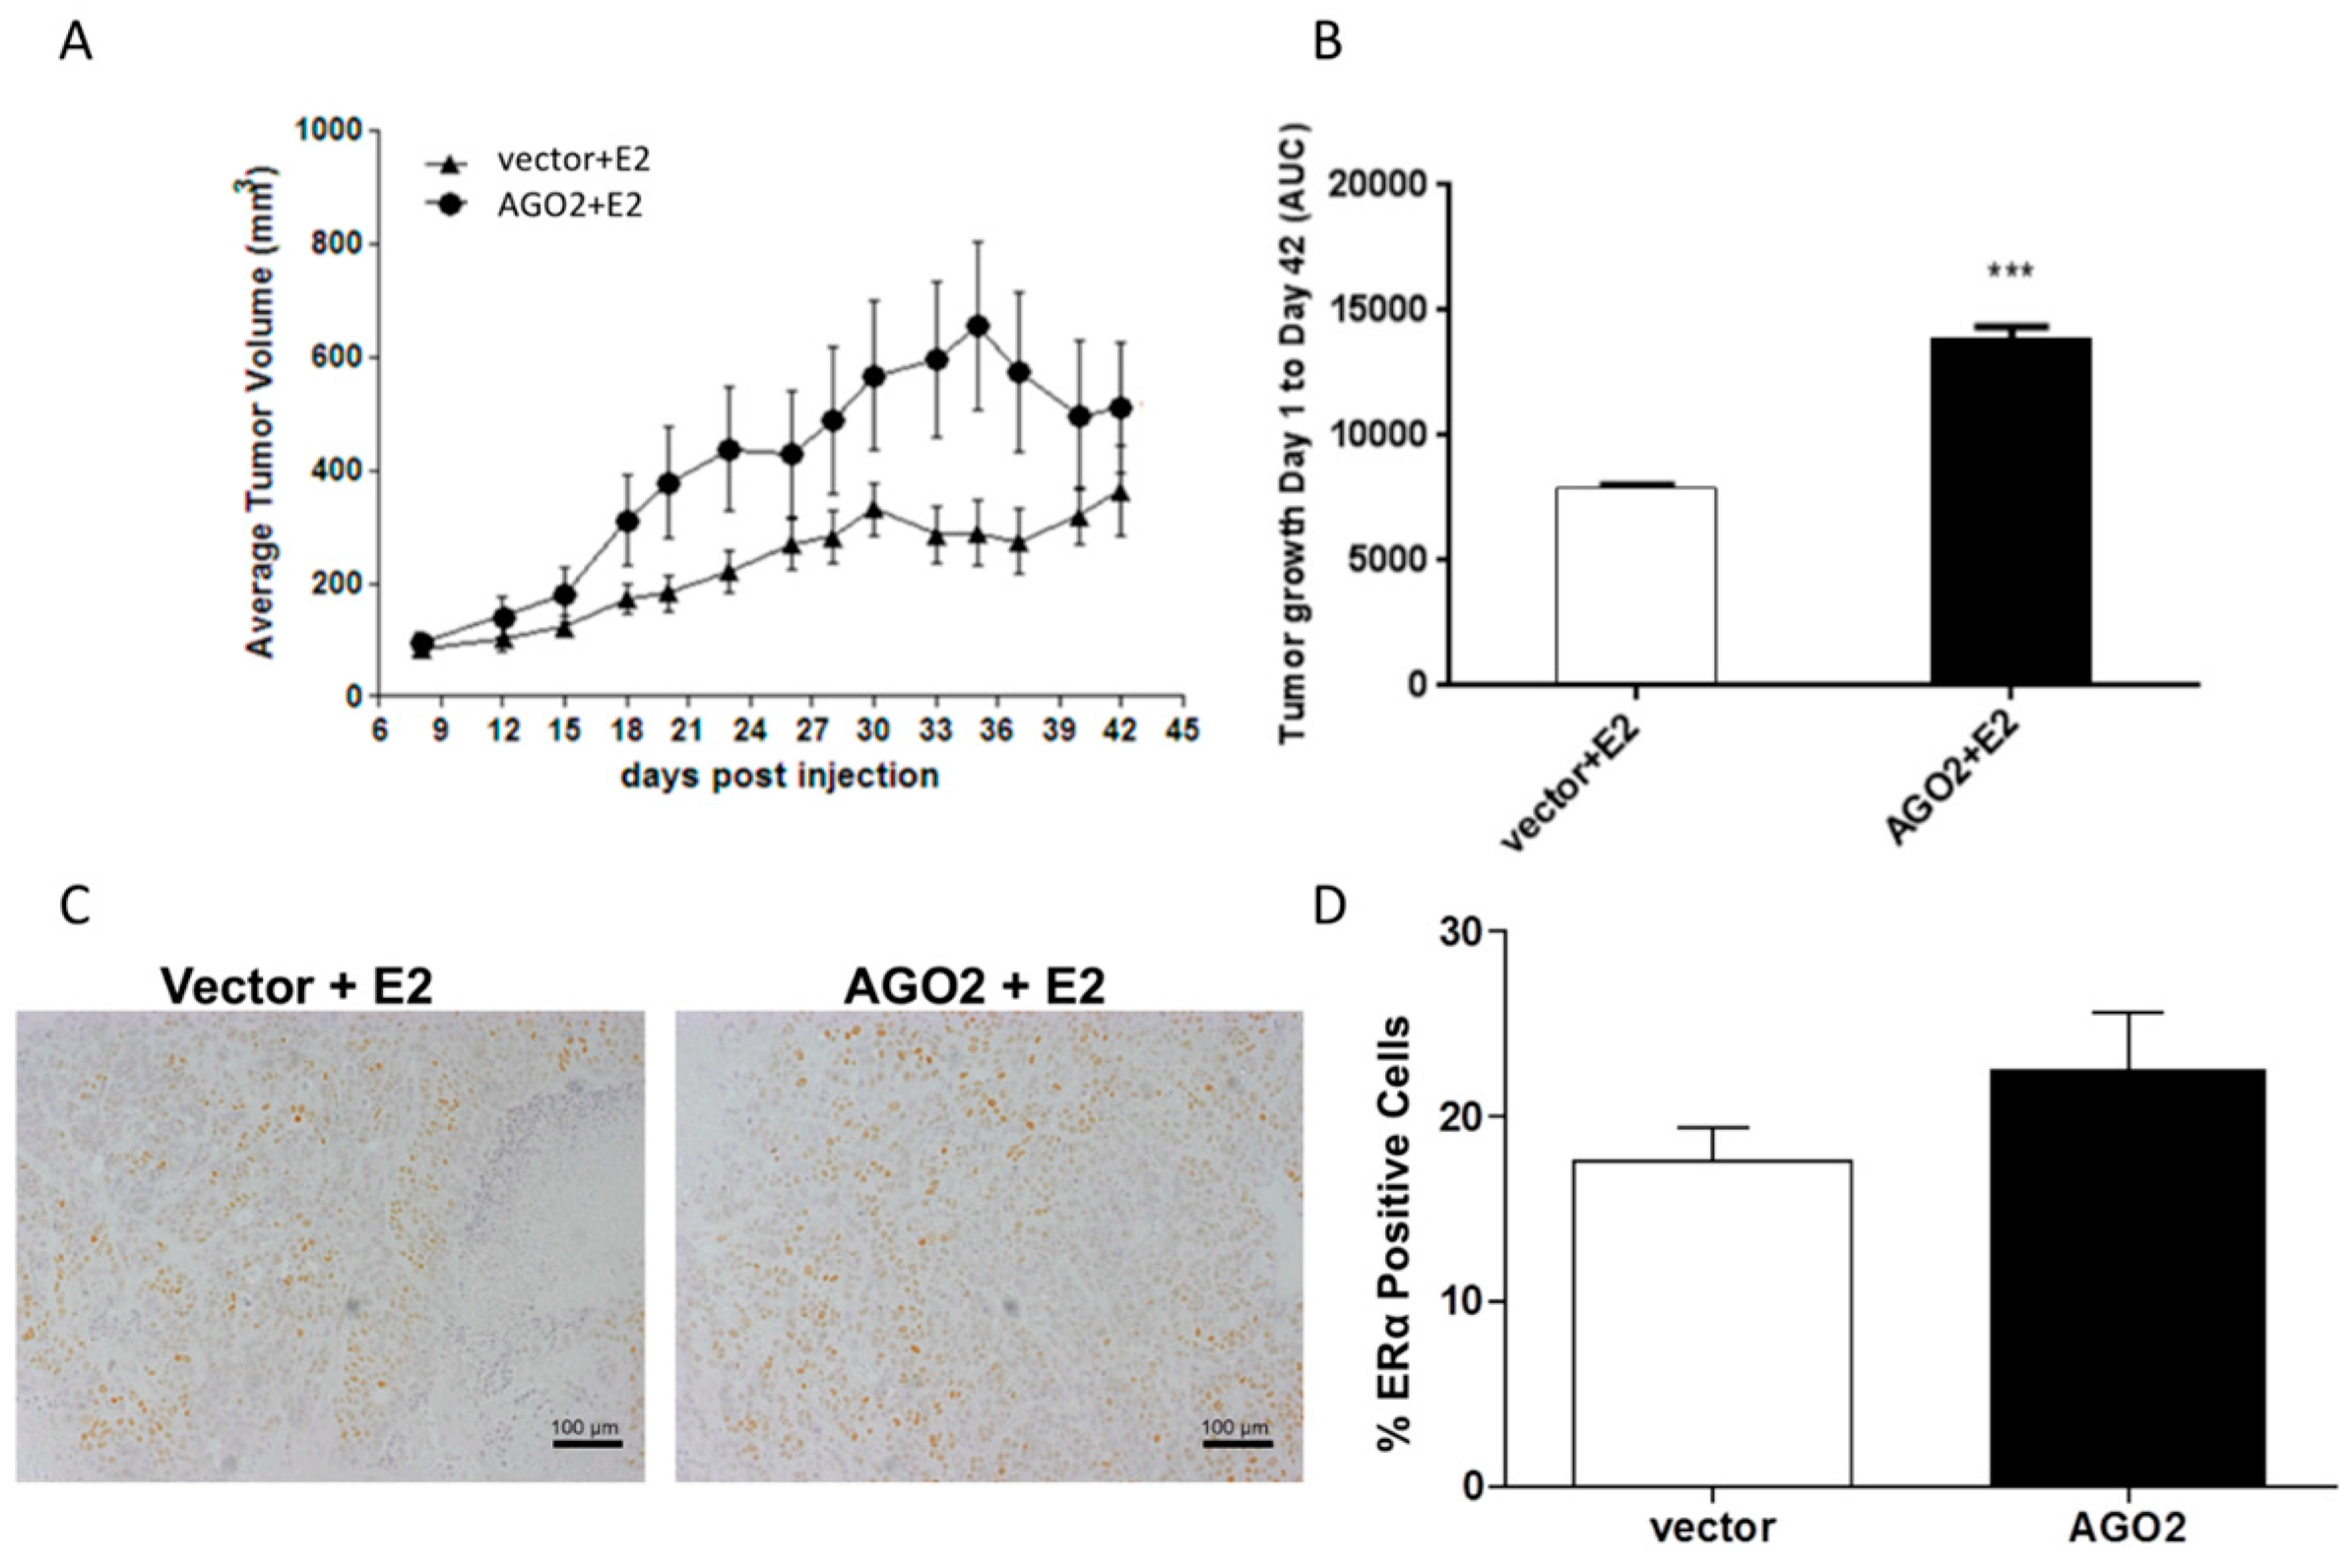
2.2. Overexpression of AGO2 Represses Estrogen Signaling through Inhibition of ERα in Vitro but Does Not Diminish E2-Stimulated Tumorigenesis in Vivo
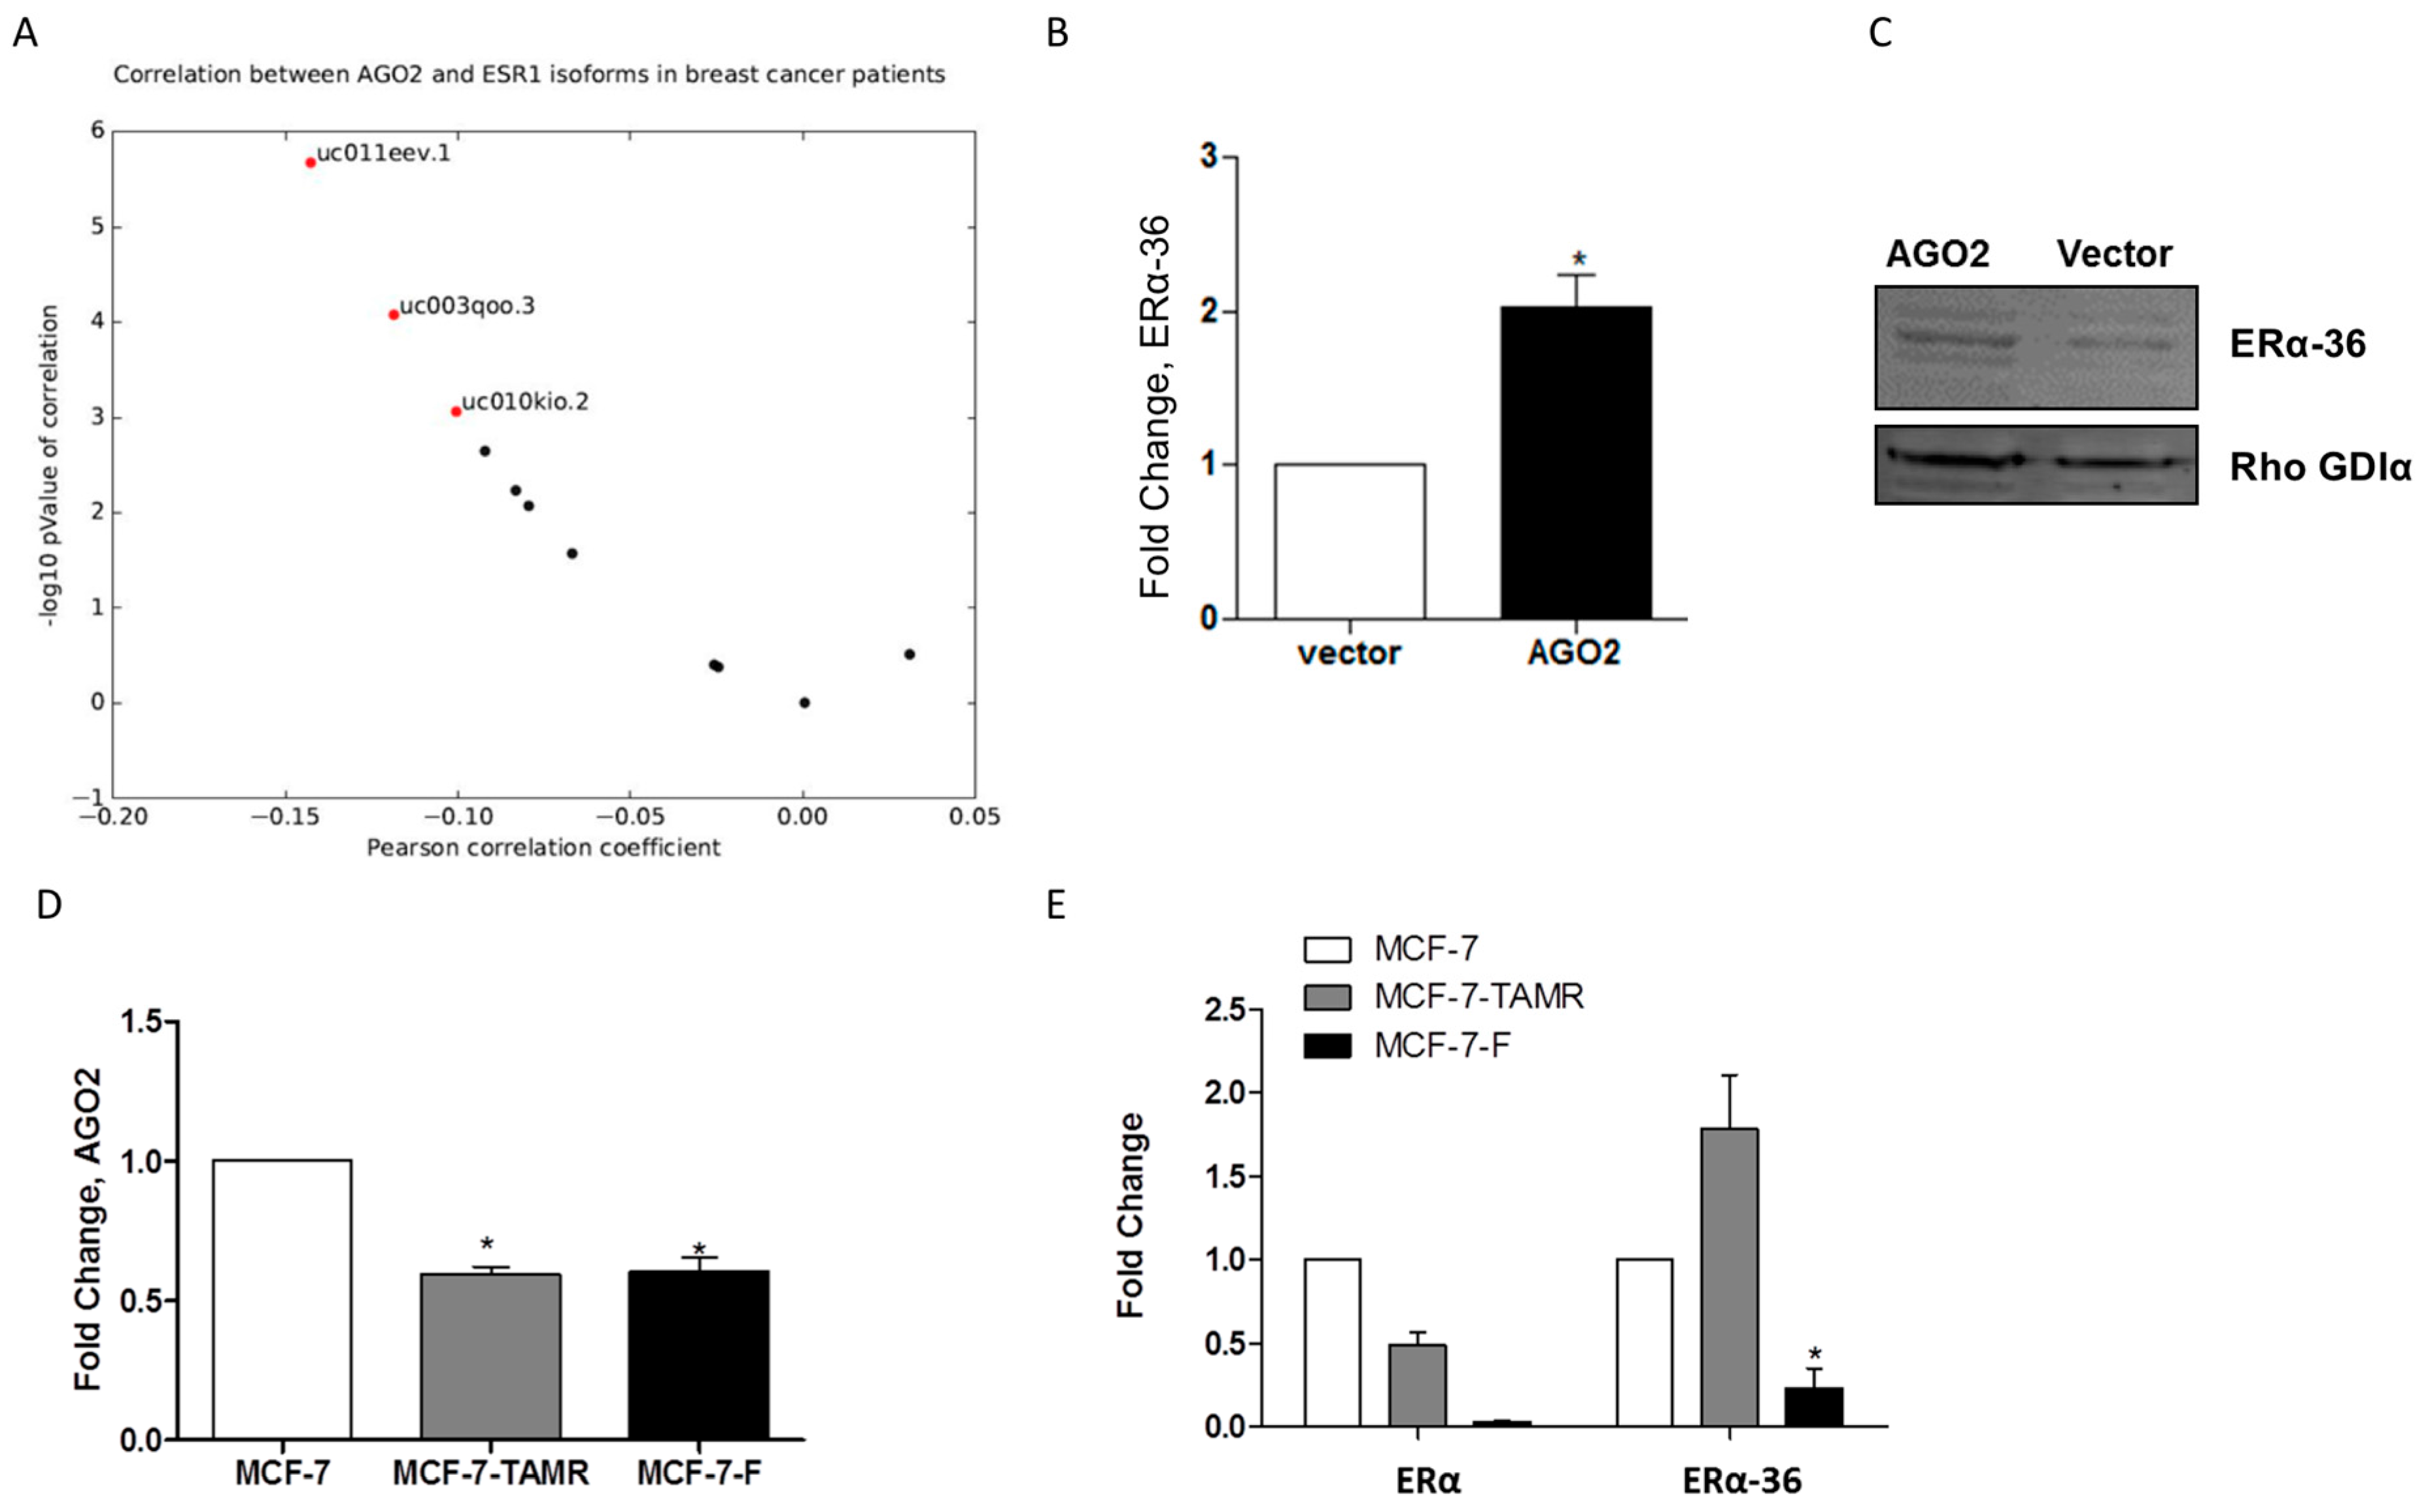
2.3. AGO2 Expression Selectively Increases ERα-36 Isoform Expression
3. Discussion
4. Materials and Methods
4.1. Cells and Reagents
4.2. Transfection of MCF-7 Cell Line
4.3. RNA Extraction and Quantitative Real Time RT-PCR
4.4. Western Blot
4.5. Animal Studies
4.6. Immunohistochemistry (IHC)
4.7. MicroRNA PCR Array
4.8. Data Sources
Supplementary Files
Supplementary File 1Acknowledgments
Author Contributions
Conflicts of Interest
Abbreviations
| AF | activation function |
| AGO2 | argonaute 2 |
| EGFR | epidermal growth factor receptor |
| ERα | estrogen receptor |
| HER2/neu | V-Erb-B2 Erythroblastic Leukemia Viral Oncogene Homolog 2 |
| MAPK | mitogen activated protein kinase |
| mTOR | mammalian target of rapamycin |
| miRNAs | microRNAs |
| PGR | progesterone receptor |
References
- U.S. Cancer Statistics Working Group. United States Cancer Statistics: 1999–2013 Incidence and Mortality Web-Based Report; U.S. Department of Health and Human Services: Atlanta, GA, USA, 2016.
- Cui, X.; Schiff, R.; Arpino, G.; Osborne, C.K.; Lee, A.V. Biology of progesterone receptor loss in breast cancer and its implications for endocrine therapy. J. Clin. Oncol. 2005, 23, 7721–7735. [Google Scholar] [CrossRef] [PubMed]
- Ali, S.; Coombes, R.C. Endocrine-responsive breast cancer and strategies for combating resistance. Nat. Rev. Cancer 2002, 2, 101–112. [Google Scholar] [CrossRef] [PubMed]
- Flouriot, G.; Brand, H.; Denger, S.; Metivier, R.; Kos, M.; Reid, G.; Sonntag-Buck, V.; Gannon, F. Identification of a new isoform of the human estrogen receptor-alpha (hER-α) that is encoded by distinct transcripts and that is able to repress hER-αactivation function 1. EMBO J. 2000, 19, 4688–4700. [Google Scholar] [CrossRef] [PubMed]
- Li, C.I.; Daling, J.R.; Malone, K.E. Incidence of invasive breast cancer by hormone receptor status from 1992 to 1998. J. Clin. Oncol. 2003, 21, 28–34. [Google Scholar] [CrossRef] [PubMed]
- Li, L.; Haynes, M.P.; Bender, J.R. Plasma membrane localization and function of the estrogen receptor α variant (ER46) in human endothelial cells. Proc. Natl. Acad. Sci. USA 2003, 100, 4807–4812. [Google Scholar] [CrossRef] [PubMed]
- Bjornstrom, L.; Sjoberg, M. Mechanisms of estrogen receptor signaling: Convergence of genomic and nongenomic actions on target genes. Mol. Endocrinol. 2005, 19, 833–842. [Google Scholar] [CrossRef] [PubMed]
- Wang, Z.; Zhang, X.; Shen, P.; Loggie, B.W.; Chang, Y.; Deuel, T.F. A variant of estrogen receptor-α, hER-α 36: Transduction of estrogen- and antiestrogen-dependent membrane-initiated mitogenic signaling. Proc. Natl. Acad. Sci. USA 2006, 103, 9063–9068. [Google Scholar] [CrossRef] [PubMed]
- Shi, L.; Dong, B.; Li, Z.; Lu, Y.; Ouyang, T.; Li, J.; Wang, T.; Fan, Z.; Fan, T.; Lin, B.; et al. Expression of ER-α36, a novel variant of estrogen receptor α, and resistance to tamoxifen treatment in breast cancer. J. Clin. Oncol. 2009, 27, 3423–3429. [Google Scholar] [CrossRef] [PubMed]
- Lin, S.L.; Yan, L.Y.; Zhang, X.T.; Yuan, J.; Li, M.; Qiao, J.; Wang, Z.Y.; Sun, Q.Y. ER-α36, a variant of ER-α, promotes tamoxifen agonist action in endometrial cancer cells via the MAPK/ERK and PI3K/Akt pathways. PLoS ONE 2010, 5, e9013. [Google Scholar] [CrossRef] [PubMed]
- Adams, B.D.; Furneaux, H.; White, B.A. The micro-ribonucleic acid (miRNA) miR-206 targets the human estrogen receptor-α (ER-α) and represses ER-α messenger RNA and protein expression in breast cancer cell lines. Mol. Endocrinol. 2007, 21, 1132–1147. [Google Scholar] [CrossRef] [PubMed]
- Cittelly, D.M.; Das, P.M.; Spoelstra, N.S.; Edgerton, S.M.; Richer, J.K.; Thor, A.D.; Jones, F.E. Downregulation of miR-342 is associated with tamoxifen resistant breast tumors. Mol. Cancer 2010, 9, 317. [Google Scholar] [CrossRef] [PubMed]
- Ward, A.; Balwierz, A.; Zhang, J.D.; Kublbeck, M.; Pawitan, Y.; Hielscher, T.; Wiemann, S.; Sahin, O. Re-expression of microRNA-375 reverses both tamoxifen resistance and accompanying EMT-like properties in breast cancer. Oncogene 2013, 32, 1173–1182. [Google Scholar] [CrossRef] [PubMed]
- Adams, B.D.; Claffey, K.P.; White, B.A. Argonaute-2 expression is regulated by epidermal growth factor receptor and mitogen-activated protein kinase signaling and correlates with a transformed phenotype in breast cancer cells. Endocrinology 2009, 150, 14–23. [Google Scholar] [CrossRef] [PubMed]
- Blenkiron, C.; Goldstein, L.D.; Thorne, N.P.; Spiteri, I.; Chin, S.F.; Dunning, M.J.; Barbosa-Morais, N.L.; Teschendorff, A.E.; Green, A.R.; Ellis, I.O.; et al. Microrna expression profiling of human breast cancer identifies new markers of tumor subtype. Genome Biol. 2007, 8, R214. [Google Scholar] [CrossRef] [PubMed]
- Grelier, G.; Voirin, N.; Ay, A.S.; Cox, D.G.; Chabaud, S.; Treilleux, I.; Leon-Goddard, S.; Rimokh, R.; Mikaelian, I.; Venoux, C.; et al. Prognostic value of Dicer expression in human breast cancers and association with the mesenchymal phenotype. Br. J. Cancer 2009, 101, 673–683. [Google Scholar] [CrossRef] [PubMed]
- Khoshnaw, S.M.; Rakha, E.A.; Abdel-Fatah, T.M.; Nolan, C.C.; Hodi, Z.; Macmillan, D.R.; Ellis, I.O.; Green, A.R. Loss of Dicer expression is associated with breast cancer progression and recurrence. Breast Cancer Res. Treat. 2012, 135, 403–413. [Google Scholar] [CrossRef] [PubMed]
- Yan, M.; Huang, H.Y.; Wang, T.; Wan, Y.; Cui, S.D.; Liu, Z.Z.; Fan, Q.X. Dysregulated Expression of Dicer and Drosha in Breast Cancer. Pathol. Oncol. Res. 2012, 18, 343–348. [Google Scholar] [CrossRef] [PubMed]
- Goldman, M.; Craft, B.; Swatloski, T.; Ellrott, K.; Cline, M.; Diekhans, M.; Ma, S.; Wilks, C.; Stuart, J.; Haussler, D.; et al. The UCSC Cancer Genomics Browser: Update 2013. Nucleic Acids Res. 2013, 41, D949–D954. [Google Scholar] [CrossRef] [PubMed]
- Sanborn, J.Z.; Benz, S.C.; Craft, B.; Szeto, C.; Kober, K.M.; Meyer, L.; Vaske, C.J.; Goldman, M.; Smith, K.E.; Kuhn, R.M.; et al. The UCSC Cancer Genomics Browser: Update 2011. Nucleic Acids Res. 2011, 39, D951–D959. [Google Scholar] [CrossRef] [PubMed]
- Vaske, C.J.; Benz, S.C.; Sanborn, J.Z.; Earl, D.; Szeto, C.; Zhu, J.; Haussler, D.; Stuart, J.M. Inference of patient-specific pathway activities from multi-dimensional cancer genomics data using PARADIGM. Bioinformatics 2010, 26, i237–i245. [Google Scholar] [CrossRef] [PubMed]
- Zhu, J.; Sanborn, J.Z.; Benz, S.; Szeto, C.; Hsu, F.; Kuhn, R.M.; Karolchik, D.; Archie, J.; Lenburg, M.E.; Esserman, L.J.; et al. The UCSC Cancer Genomics Browser. Nat. Methods 2009, 6, 239–240. [Google Scholar] [CrossRef] [PubMed]
- Creighton, C.J. The molecular profile of luminal B breast cancer. Biologics 2012, 6, 289–297. [Google Scholar] [CrossRef] [PubMed]
- Jezequel, P.; Campone, M.; Gouraud, W.; Guerin-Charbonnel, C.; Leux, C.; Ricolleau, G.; Campion, L. bc-GenExMiner: An easy-to-use online platform for gene prognostic analyses in breast cancer. Breast Cancer Res. Treat. 2012, 131, 765–775. [Google Scholar] [CrossRef] [PubMed]
- Jezequel, P.; Frenel, J.S.; Campion, L.; Guerin-Charbonnel, C.; Gouraud, W.; Ricolleau, G.; Campone, M. bc-GenExMiner 3.0: New mining module computes breast cancer gene expression correlation analyses. Database 2013, 2013, bas060. [Google Scholar] [CrossRef] [PubMed]
- Duan, F.; Simeone, S.; Wu, R.; Grady, J.; Mandoiu, I.; Srivastava, P.K. Area under the curve as a tool to measure kinetics of tumor growth in experimental animals. J. Immunol. Methods 2012, 382, 224–228. [Google Scholar] [CrossRef] [PubMed]
- Fan, M.; Yan, P.S.; Hartman-Frey, C.; Chen, L.; Paik, H.; Oyer, S.L.; Salisbury, J.D.; Cheng, A.S.; Li, L.; Abbosh, P.H.; et al. Diverse gene expression and DNA methylation profiles correlate with differential adaptation of breast cancer cells to the antiestrogens tamoxifen and fulvestrant. Cancer Res. 2006, 66, 11954–11966. [Google Scholar] [CrossRef] [PubMed]
- Heyn, H.; Engelmann, M.; Schreek, S.; Ahrens, P.; Lehmann, U.; Kreipe, H.; Schlegelberger, B.; Beger, C. Microrna miR-335 is crucial for the BRCA1 regulatory cascade in breast cancer development. Int. J. Cancer 2011, 129, 2797–2806. [Google Scholar] [CrossRef] [PubMed]
- Smith, I.E.; Dowsett, M. Aromatase inhibitors in breast cancer. N. Engl. J. Med. 2003, 348, 2431–2442. [Google Scholar] [PubMed]
- Struckhoff, A.P.; Bittman, R.; Burow, M.E.; Clejan, S.; Elliott, S.; Hammond, T.; Tang, Y.; Beckman, B.S. Novel ceramide analogs as potential chemotherapeutic agents in breast cancer. J. Pharmacol. Exp. Ther. 2004, 309, 523–532. [Google Scholar] [CrossRef] [PubMed]
- Antoon, J.W.; Lai, R.; Struckhoff, A.P.; Nitschke, A.M.; Elliott, S.; Martin, E.C.; Rhodes, L.V.; Yoon, N.S.; Salvo, V.A.; Shan, B.; et al. Altered death receptor signaling promotes epithelial-to-mesenchymal transition and acquired chemoresistance. Sci. Rep. 2012, 2, 539. [Google Scholar] [CrossRef] [PubMed]
- Anbalagan, M.; Moroz, K.; Ali, A.; Carrier, L.; Glodowski, S.; Rowan, B.G. Subcellular localization of total and activated Src kinase in African American and Caucasian breast cancer. PLoS ONE 2012, 7, e33017. [Google Scholar] [CrossRef] [PubMed]


| # | Population and Event Criteria 1 | p Value | HR | 95% CI | Good Prognosis RNA Level | No. Patients | ||
|---|---|---|---|---|---|---|---|---|
| 1 | N- | ERm | AE | <0.0001 | 1.25 | 1.15–1.36 | Low | 1799 |
| 2 | Nm | ERm | MR | <0.0001 | 1.21 | 1.12–1.30 | Low | 2565 |
| 3 | Nm | ERm | AE | <0.0001 | 1.16 | 1.10–1.24 | Low | 3300 |
| 4 | N− | ER+ | AE | <0.0001 | 1.30 | 1.17–1.45 | Low | 1388 |
| 5 | Nm | ER+ | MR | <0.0001 | 1.26 | 1.14–1.39 | Low | 1929 |
| 6 | N− | ER+ | MR | <0.0001 | 1.33 | 1.17–1.52 | Low | 1146 |
| 7 | N− | ERm | MR | <0.0001 | 1.24 | 1.12–1.37 | Low | 1492 |
| 8 | Nm | ER+ | AE | <0.0001 | 1.18 | 1.09–1.28 | Low | 2483 |
| 9 | N+ | ERm | MR | 0.0549 | 1.13 | 1.00–1.29 | Low | 842 |
| 10 | N+ | ER+ | MR | 0.1156 | 1.14 | 0.97–1.34 | -- | 652 |
| 11 | N− | ER | AE | 0.1564 | 1.13 | 0.95–1.33 | -- | 390 |
| 12 | Nm | ER | AE | 0.4186 | 1.05 | 0.94–1.17 | -- | 774 |
| 13 | N+ | ER | AE | 0.4618 | 0.93 | 0.77–1.13 | -- | 226 |
| 14 | N+ | ER | MR | 0.5316 | 0.92 | 0.72–1.19 | -- | 173 |
| 15 | Nm | ER | MR | 0.6938 | 1.03 | 0.89–1.18 | -- | 601 |
| 16 | N+ | ER+ | AE | 0.7713 | 0.98 | 0.86–1.11 | -- | 815 |
| 17 | N− | ER | MR | 0.8048 | 1.02 | 0.84–1.24 | -- | 330 |
| 18 | N+ | ERm | AE | 0.8467 | 1.01 | 0.91–1.12 | -- | 1058 |
© 2016 by the authors; licensee MDPI, Basel, Switzerland. This article is an open access article distributed under the terms and conditions of the Creative Commons Attribution (CC-BY) license (http://creativecommons.org/licenses/by/4.0/).
Share and Cite
Conger, A.K.; Martin, E.C.; Yan, T.J.; Rhodes, L.V.; Hoang, V.T.; La, J.; Anbalagan, M.; Burks, H.E.; Rowan, B.G.; Nephew, K.P.; et al. Argonaute 2 Expression Correlates with a Luminal B Breast Cancer Subtype and Induces Estrogen Receptor Alpha Isoform Variation. Non-Coding RNA 2016, 2, 8. https://doi.org/10.3390/ncrna2030008
Conger AK, Martin EC, Yan TJ, Rhodes LV, Hoang VT, La J, Anbalagan M, Burks HE, Rowan BG, Nephew KP, et al. Argonaute 2 Expression Correlates with a Luminal B Breast Cancer Subtype and Induces Estrogen Receptor Alpha Isoform Variation. Non-Coding RNA. 2016; 2(3):8. https://doi.org/10.3390/ncrna2030008
Chicago/Turabian StyleConger, Adrienne K., Elizabeth C. Martin, Thomas J. Yan, Lyndsay V. Rhodes, Van T. Hoang, Jacqueline La, Muralidharan Anbalagan, Hope E. Burks, Brian G. Rowan, Kenneth P. Nephew, and et al. 2016. "Argonaute 2 Expression Correlates with a Luminal B Breast Cancer Subtype and Induces Estrogen Receptor Alpha Isoform Variation" Non-Coding RNA 2, no. 3: 8. https://doi.org/10.3390/ncrna2030008
APA StyleConger, A. K., Martin, E. C., Yan, T. J., Rhodes, L. V., Hoang, V. T., La, J., Anbalagan, M., Burks, H. E., Rowan, B. G., Nephew, K. P., Collins-Burow, B. M., & Burow, M. E. (2016). Argonaute 2 Expression Correlates with a Luminal B Breast Cancer Subtype and Induces Estrogen Receptor Alpha Isoform Variation. Non-Coding RNA, 2(3), 8. https://doi.org/10.3390/ncrna2030008