Article

Novel Pour Point Depressants for Crude Oil Derived from Polyethylene Solution in Hexane and Coal Fly Ash

1
Department of Oil and Gas Business, M. Auezov South Kazakhstan University, 486000 Shymkent, Kazakhstan
2
Laboratory of Mechanochemical Processes and Materials Science, Institute of Combustion Problems, 050012 Almaty, Kazakhstan
3
Faculty of Chemistry and Chemical Technology, Al-Farabi Kazakh National University, 050040 Almaty, Kazakhstan
*
Author to whom correspondence should be addressed.
Fluids 2024, 9(6), 121; https://doi.org/10.3390/fluids9060121
Submission received: 17 April 2024 / Revised: 18 May 2024 / Accepted: 21 May 2024 / Published: 23 May 2024

Abstract

:
Oil transportation becomes much more complicated due to the solidification of paraffins in them at low temperatures and the resulting increase in oil viscosity. To solve this problem, special additives as pour point depressants (PPDs) are used to prevent the agglomeration of paraffin crystals. In this work, 15 PPDs were obtained and tested, consisting of a solution of polyethylene in hexane and also, in some cases, from magnetic nanoparticles (MNPs) extracted from coal fly ash. The most effective result was observed with a mixture of 0.25% polyethylene in hexane and 2% MNPs, which managed to lower the oil’s pour point from 18 °C to −17 °C.

1. Introduction

One of the serious problems during the storage and transportation of highly paraffinic oil is the crystallization of paraffins—high molecular weight hydrocarbons (n-alkanes, C18–C30)—at low temperatures [1]. This circumstance leads to a sharp increase in oil viscosity and a significant decrease in fluidity, which makes its transportation almost impossible [2,3]. To solve this problem, so-called pour point depressants (PPDs) are used. By interacting with paraffin crystals in oil, these additives modify their surface in such a way that large aggregates of paraffin particles are practically not formed or are formed in much smaller quantities than in the absence of additives [4]. Most modern PPDs are based on polymers, including ethylene-vinyl acetate copolymers, polymethacrylates, and other synthetic polymers [5,6,7,8,9,10,11,12].
In recent years, magnetic nanoparticles (NPs) have attracted special attention as potential PPDs [13,14,15,16]. Due to the magnetic properties of these NPs, they can be controlled and directed using external magnetic fields. This allows for more efficient distribution in the oil matrix, improving interaction with paraffin crystals. In some cases, magnetic NPs can be used for local heating under the influence of an external magnetic field; in turn, an increase in temperature promotes the melting of paraffin crystals and a decrease in oil viscosity [17].
The use of a combination of polymers with NPs, for example, in the form of a colloidal system, is promising for crude oil’s pour point depression [14,18,19,20,21]. The polymer matrix provides uniform distribution and stabilization of NPs in the oil, and prevents their agglomeration and sedimentation. This ensures that the PPDs remain effective over a long time. The polymer can form hybrid structures that better “capture” paraffin crystals, reducing their ability to form blocks. Furthermore, polymer matrices with NPs have high thermal and mechanical stability [22].
The combination of ethylene-vinyl acetate/Fe3O4 NPs was successfully tested as PPDs for Daqing waxy crude oil [23]. The combination of ethylene-vinyl acetate/SiO2 NPs with the same particle size showed a much worse result than the combination with Fe3O4; this fact is obviously related to the magnetic properties of the latter.
A number of works are devoted to the use of polyethylene to obtain effective PPDs. High- and low-density polyethylene have been used as PPDs due to their favorable melting properties and interaction with wax crystals [24]. Combining polyethylene with other polymers, such as ethylene vinyl acetate or polymethacrylates, as well as functionalizing polyethylene with maleic anhydride, increased the efficiency of PPDs [24,25]. Recently, Kamal and co-workers obtained and tested new PPDs by dissolving polyethylene waste in toluene upon heating and subsequently introducing magnetic NPs into the solution [26]. The resulting PPDs proved to be effective in relation to heavy and light Egyptian oil. Using polyethylene waste to obtain PPDs seems very promising from an ecological point of view. Using waste polyethylene to produce PPDs leads to a significant reduction in the volume of plastic waste. Recycling such waste into valuable products reduces the need for the extraction and processing of oil as a source of primary raw materials for new polymers [27].
In this study, we developed PPDs based on polyethylene dissolved in hexane, as well as magnetic nanoparticles extracted from coal fly ash (CFA). Hexane dissolves polyethylene very well, and it is cheaper and less toxic than toluene [28]. CFA waste is produced in the world in an amount of about 750 million tons, with the content of magnetospheres in them varying in the range from 0.5 to 18% [29,30,31]. NPs are considered dangerous components of CFA waste due to their small size and high reactivity [32,33]. NPs can easily enter the environment, air, water, and soil, where they pose a potential threat to living organisms. Therefore, the extraction of NPs from CFA waste and their subsequent use is ecologically justified. To our knowledge, this is the first study dedicated to the use of magnetic NPs from CFA waste for the preparation of PPDs.

2. Materials and Methods

2.1. Materials

The crude oil sample was sourced from the Akshabulak oil field (Kazakhstan). The density of the sample was measured using the pycnometer method. The wax content was assessed following the SY/T 7550-2004 standard [34] procedure. The appearance of the oil sample is shown in Figure 1.
Plastic bags were used as a source of polyethylene (PE).
Hexan (99%) was purchased from Sigma-Aldrich (St. Louis, MO, USA).
CFA waste as a source of magnetic nanoparticles (MNPs) was collected from the CHPP-2 power plant in Almaty (Kazakhstan).

2.2. Obtaining MSPs from Coal Fly Ash

A coal fly ash sample was subjected to magnetic separation using a magnetic separator “SMS-20-PM 1” (Itomak, Novosibirsk Oblast, Russia) under the magnetic field of 0.15 Tesla. The collected magnetic fraction (MF) was then sieved on the laboratory vibrating sieve DY-200 and the fraction <40 µm was used in further experiments. A total of 100 mg of MF was added to 300 mL of deionized water in centrifuge tubes and ultrasonically dispersed for 30 min by using an ultrasonic wand (Sigma-Aldrich, 500 W). After 3 h, the supernatant fraction (further denoted as MSPs) was collected and analyzed.

2.3. Preparation of the Potential Pour Point Depressants (PPDs)

Solutions of PE in hexane (PES), as well as mixtures of PES with MNPs, were used as additives for pour point depression of crude oil samples.
In the preparation of the PES, a mechanical grinder was used to reduce the PE plastic into uniformly small pieces, ensuring consistent dissolution in the solvent. The concentrations of PE plastics were maintained at 0.25, 0.5, 1, 1.5, and 2%, with the ground PE plastic accurately weighed to achieve each targeted concentration. The mixture of the PE plastic and hexane was heated on a heat plate equipped with a magnetic stirrer, ensuring uniform heating and mixing. The temperature was carefully monitored and maintained just below the boiling point of hexane, around 67 °C, to prevent vaporization. The reaction was conducted in a four-neck reaction flask. A nitrogen atmosphere was used during the reaction to prevent oxidative degradation of PE and unwanted reactions. After the reaction, a system for the recovery and purification of hexane was implemented. The prepared hexane mixtures with different polyethylene additive concentrations were then added to the crude oil.
MNPs were added to the obtained hot solutions in two concentrations (1.0 and 2.0%) to obtain PPDs. A total of 15 PPD samples were prepared, their composition is shown in Table 1. The formulas, given in Table 1, have been selected on the basis of those shown to be effective in [26].

2.4. Evaluating Tests of Pour Point

Prior to assessing the pour point, the oil samples underwent conditioning at 60 °C for 2.5 h and were then allowed to cool. The pour points for both the treated and untreated crude oil were measured in accordance with the ASTM Standard D-97 [35].

2.5. Rheological Measurements

The viscosity of both the untreated and treated crude oil was determined using a Rheotec RUV 2(2) viscometer. (Poulten Selfe & Lee Limited, PSL Rheotek, Burnham-on-Crouch, Essex, UK). Samples of untreated and treated crude oil were heated to a specific temperature before being utilized in experiments to measure the fluid’s viscosity. The cooling rate was 0.5 °C/min.

2.6. Viscosity Curve Test

PPD was added to crude oil at different concentrations (0 (blank), 150, 200, and 250 ppm); the obtained mixture was slowly cooled from 60 to 40, 30, 20, and 10 °C and the viscosity curves were measured at these temperatures. The share rate was increased from 5 to 200 s−1 over 5 min.

2.7. Elemental Analysis

The determination of the elemental composition of MNPs was carried out through atomic absorption spectrometry (AAS) using an AA-6200 spectrometer (Shimadzu, Kyoto, Japan). Before assessing the Fe, Al, and Si content in the resulting solution, the sample underwent a preliminary decomposition process with concentrated nitric acid at temperatures ranging from 90 to 95 °C and under a pressure of 10 atm.

2.8. Determination of Particle Size

The determination of particle size distribution for MNPs was conducted using dynamic light scattering (DLS) technique. The measurements were performed with a Zetasizer Nano ZS (Malvern Instruments, Malvern, UK), which employs a He-Ne laser (λ = 633 nm) as the light source. Prior to analysis, samples were dispersed in deionized water and the dispersions were then sonicated for 15 min at 25 °C. The instrument’s software automatically calculated the particle size distribution by analyzing the intensity of light scattered by the MNPs at different angles. The data were presented as volume-weighted distributions, from which the mean particle diameter was derived.

2.9. Photomicrographic Analysis

The photomicrographs depicting the wax crystal morphology of both the undoped and doped crude oil samples with the prepared additives were captured using a polarizing microscope, the YEGREN XSP-126L ((Yegren Optics, Anyang, Henan, China), with magnification capabilities ranging from 40× to 1600×. The temperature of the oil samples tested on the microscope slide was meticulously regulated by a cooling thermostat attached to the setup. All images were taken at a magnification of 500×.

2.10. Differential Scanning Calorimetry

Experiments on differential scanning calorimetry of the blank oil sample and samples doped with PPDs were performed using a thermo-balanced instrument DSC 2+ (Mettler Toledo, Greifensee, Switzerland).

3. Results and Discussion

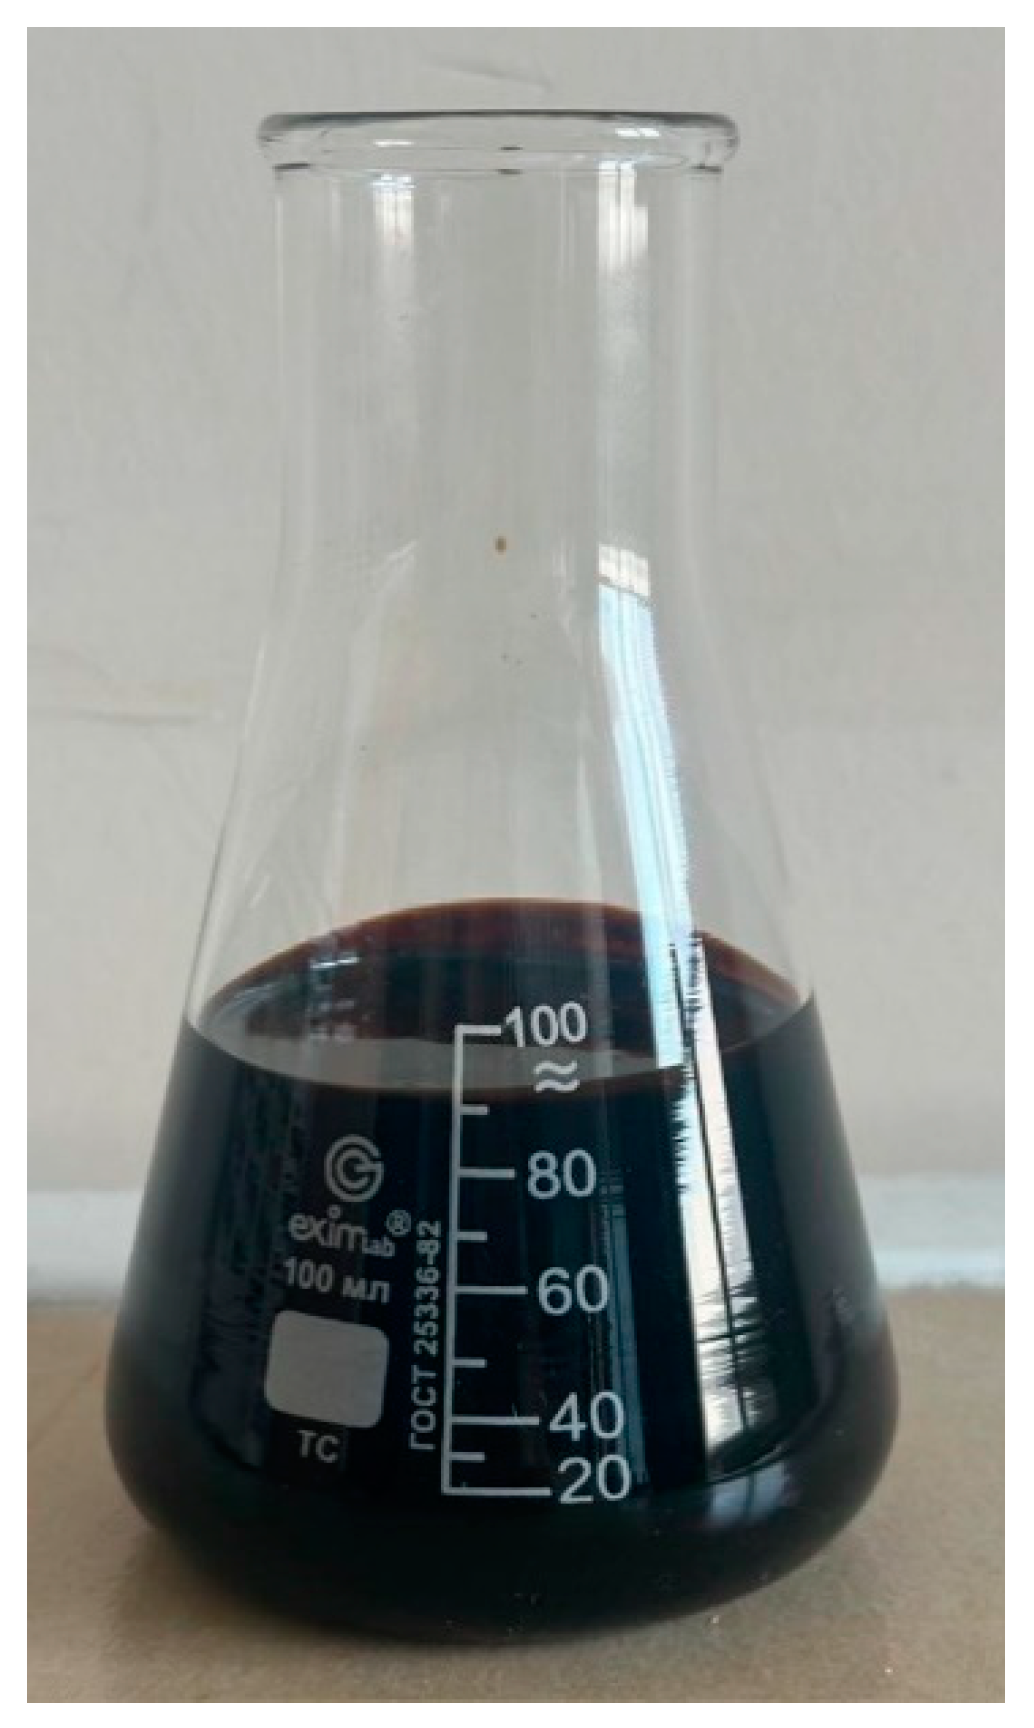
3.1. Characterization of Crude Oil Sample

The characteristics of the crude oil sample were assessed, and the findings on density, wax content, pour point, and kinematic viscosity are presented in Table 2.

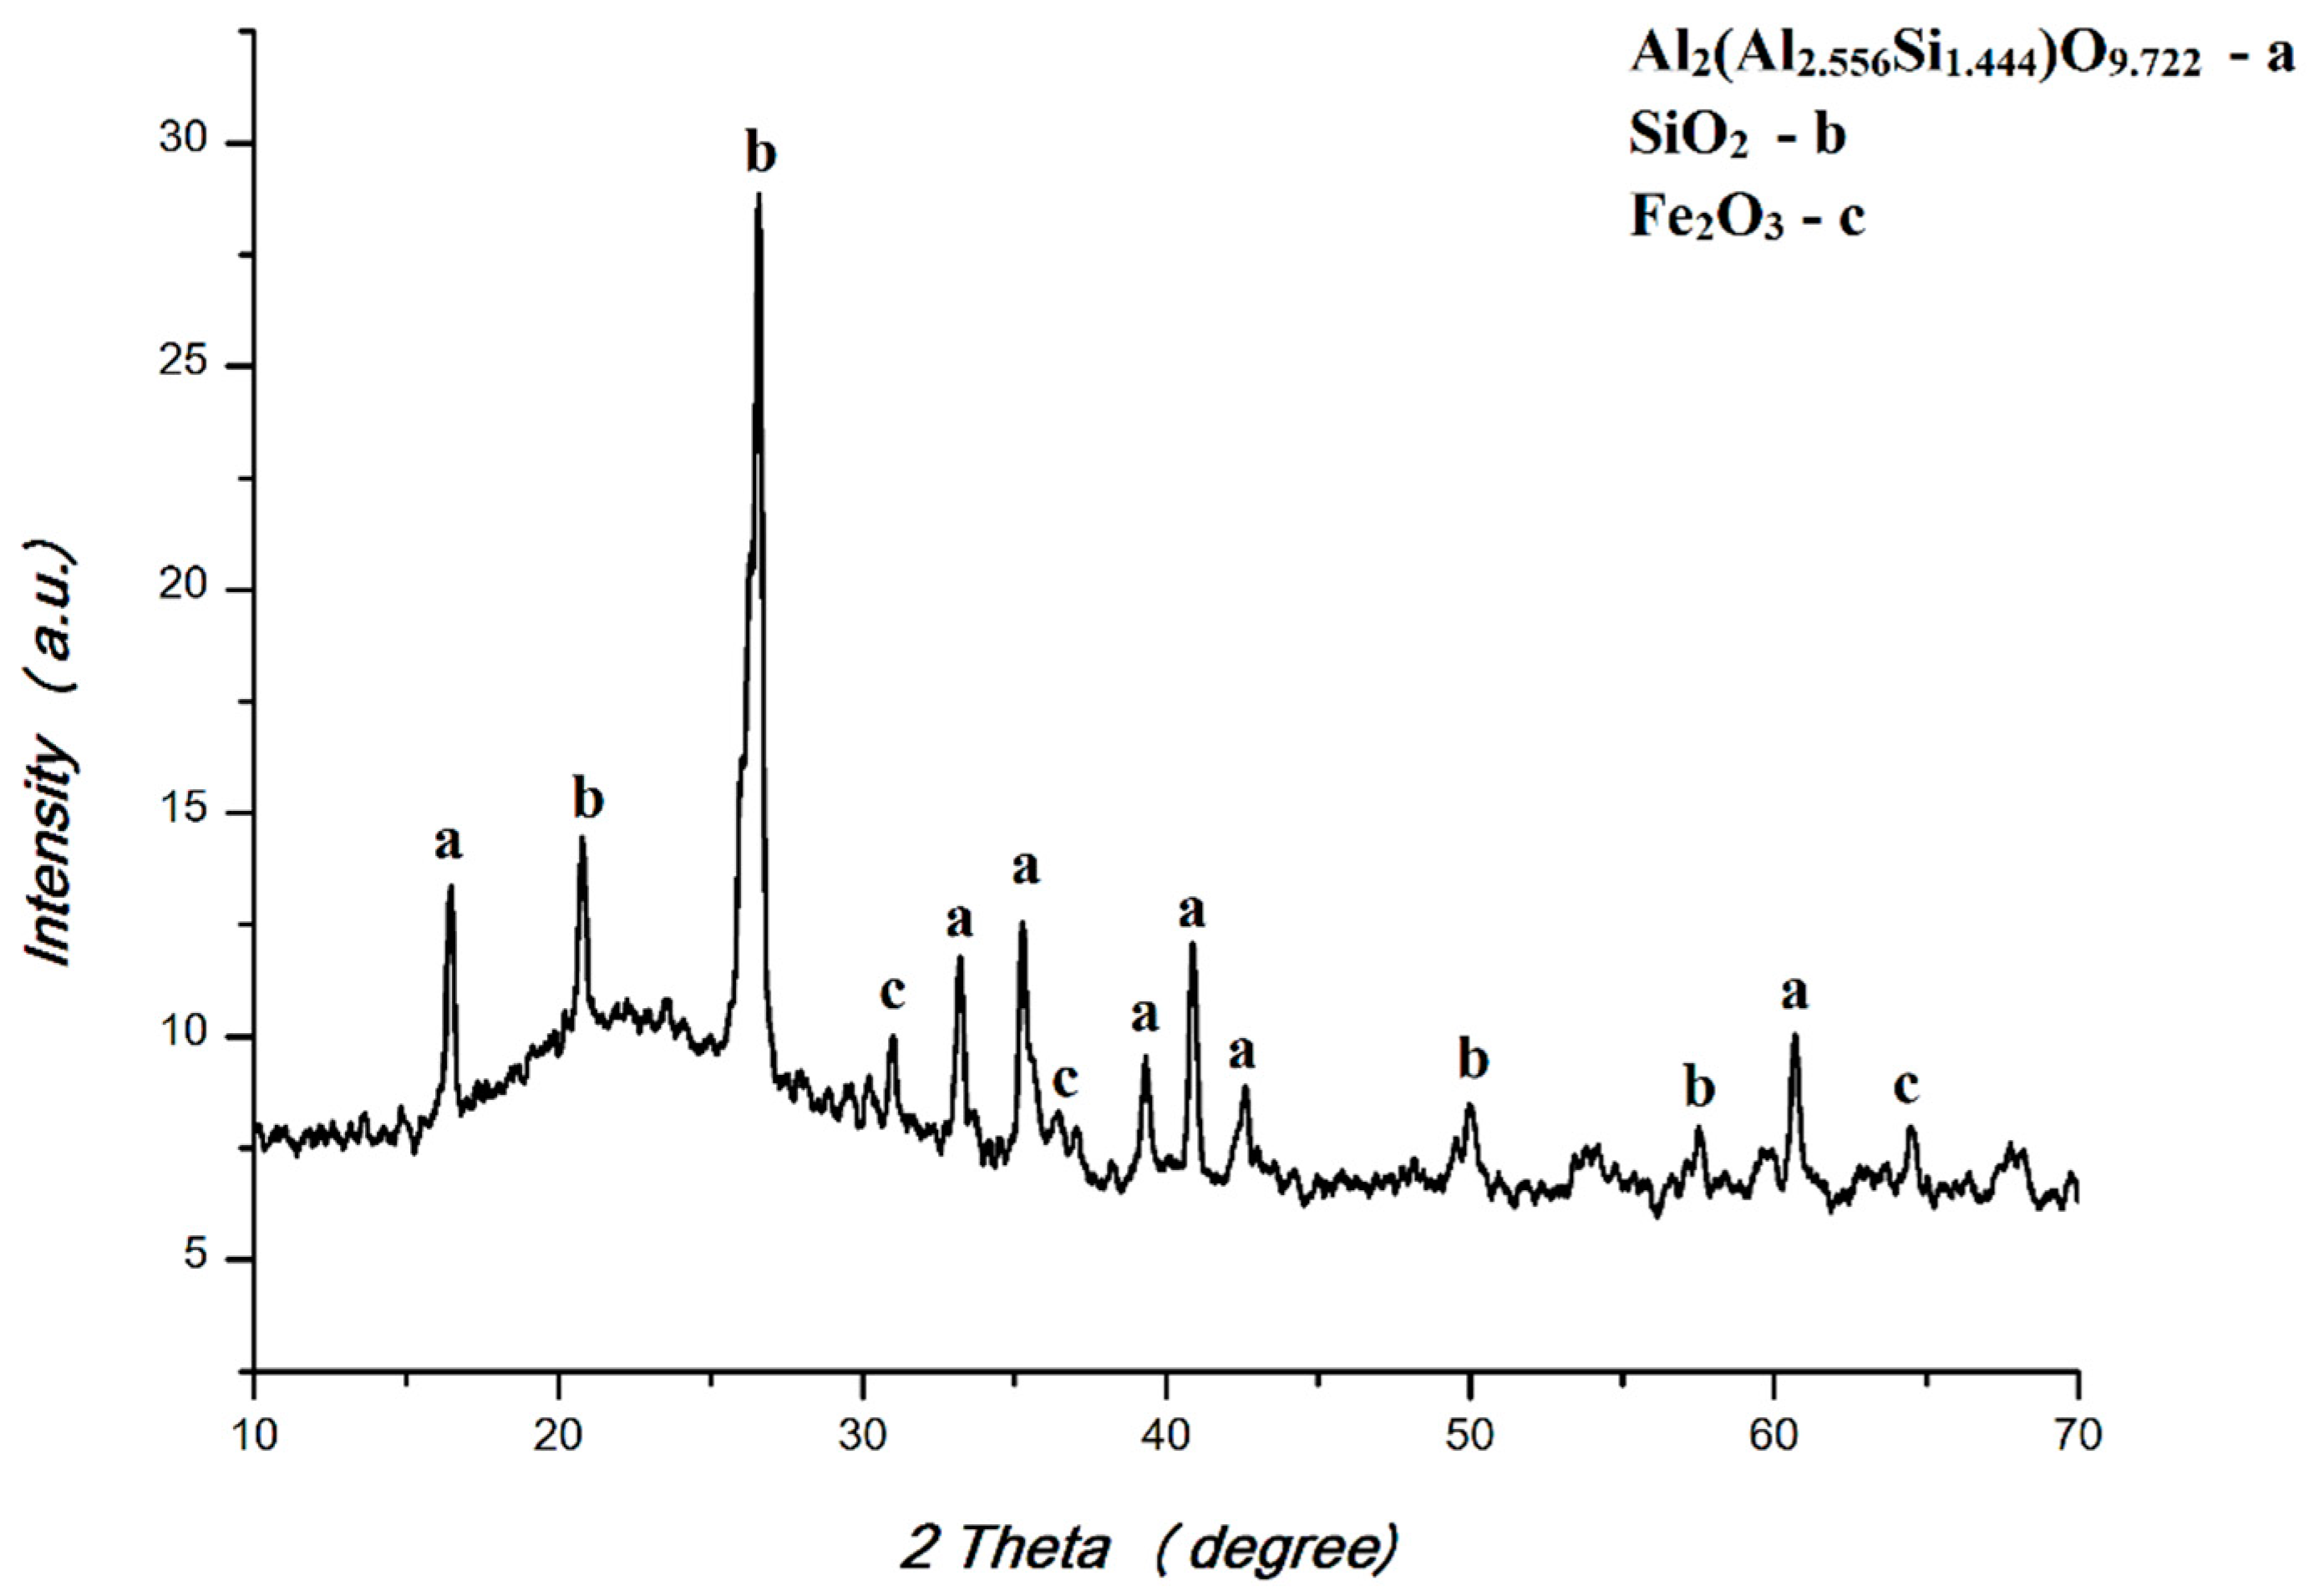
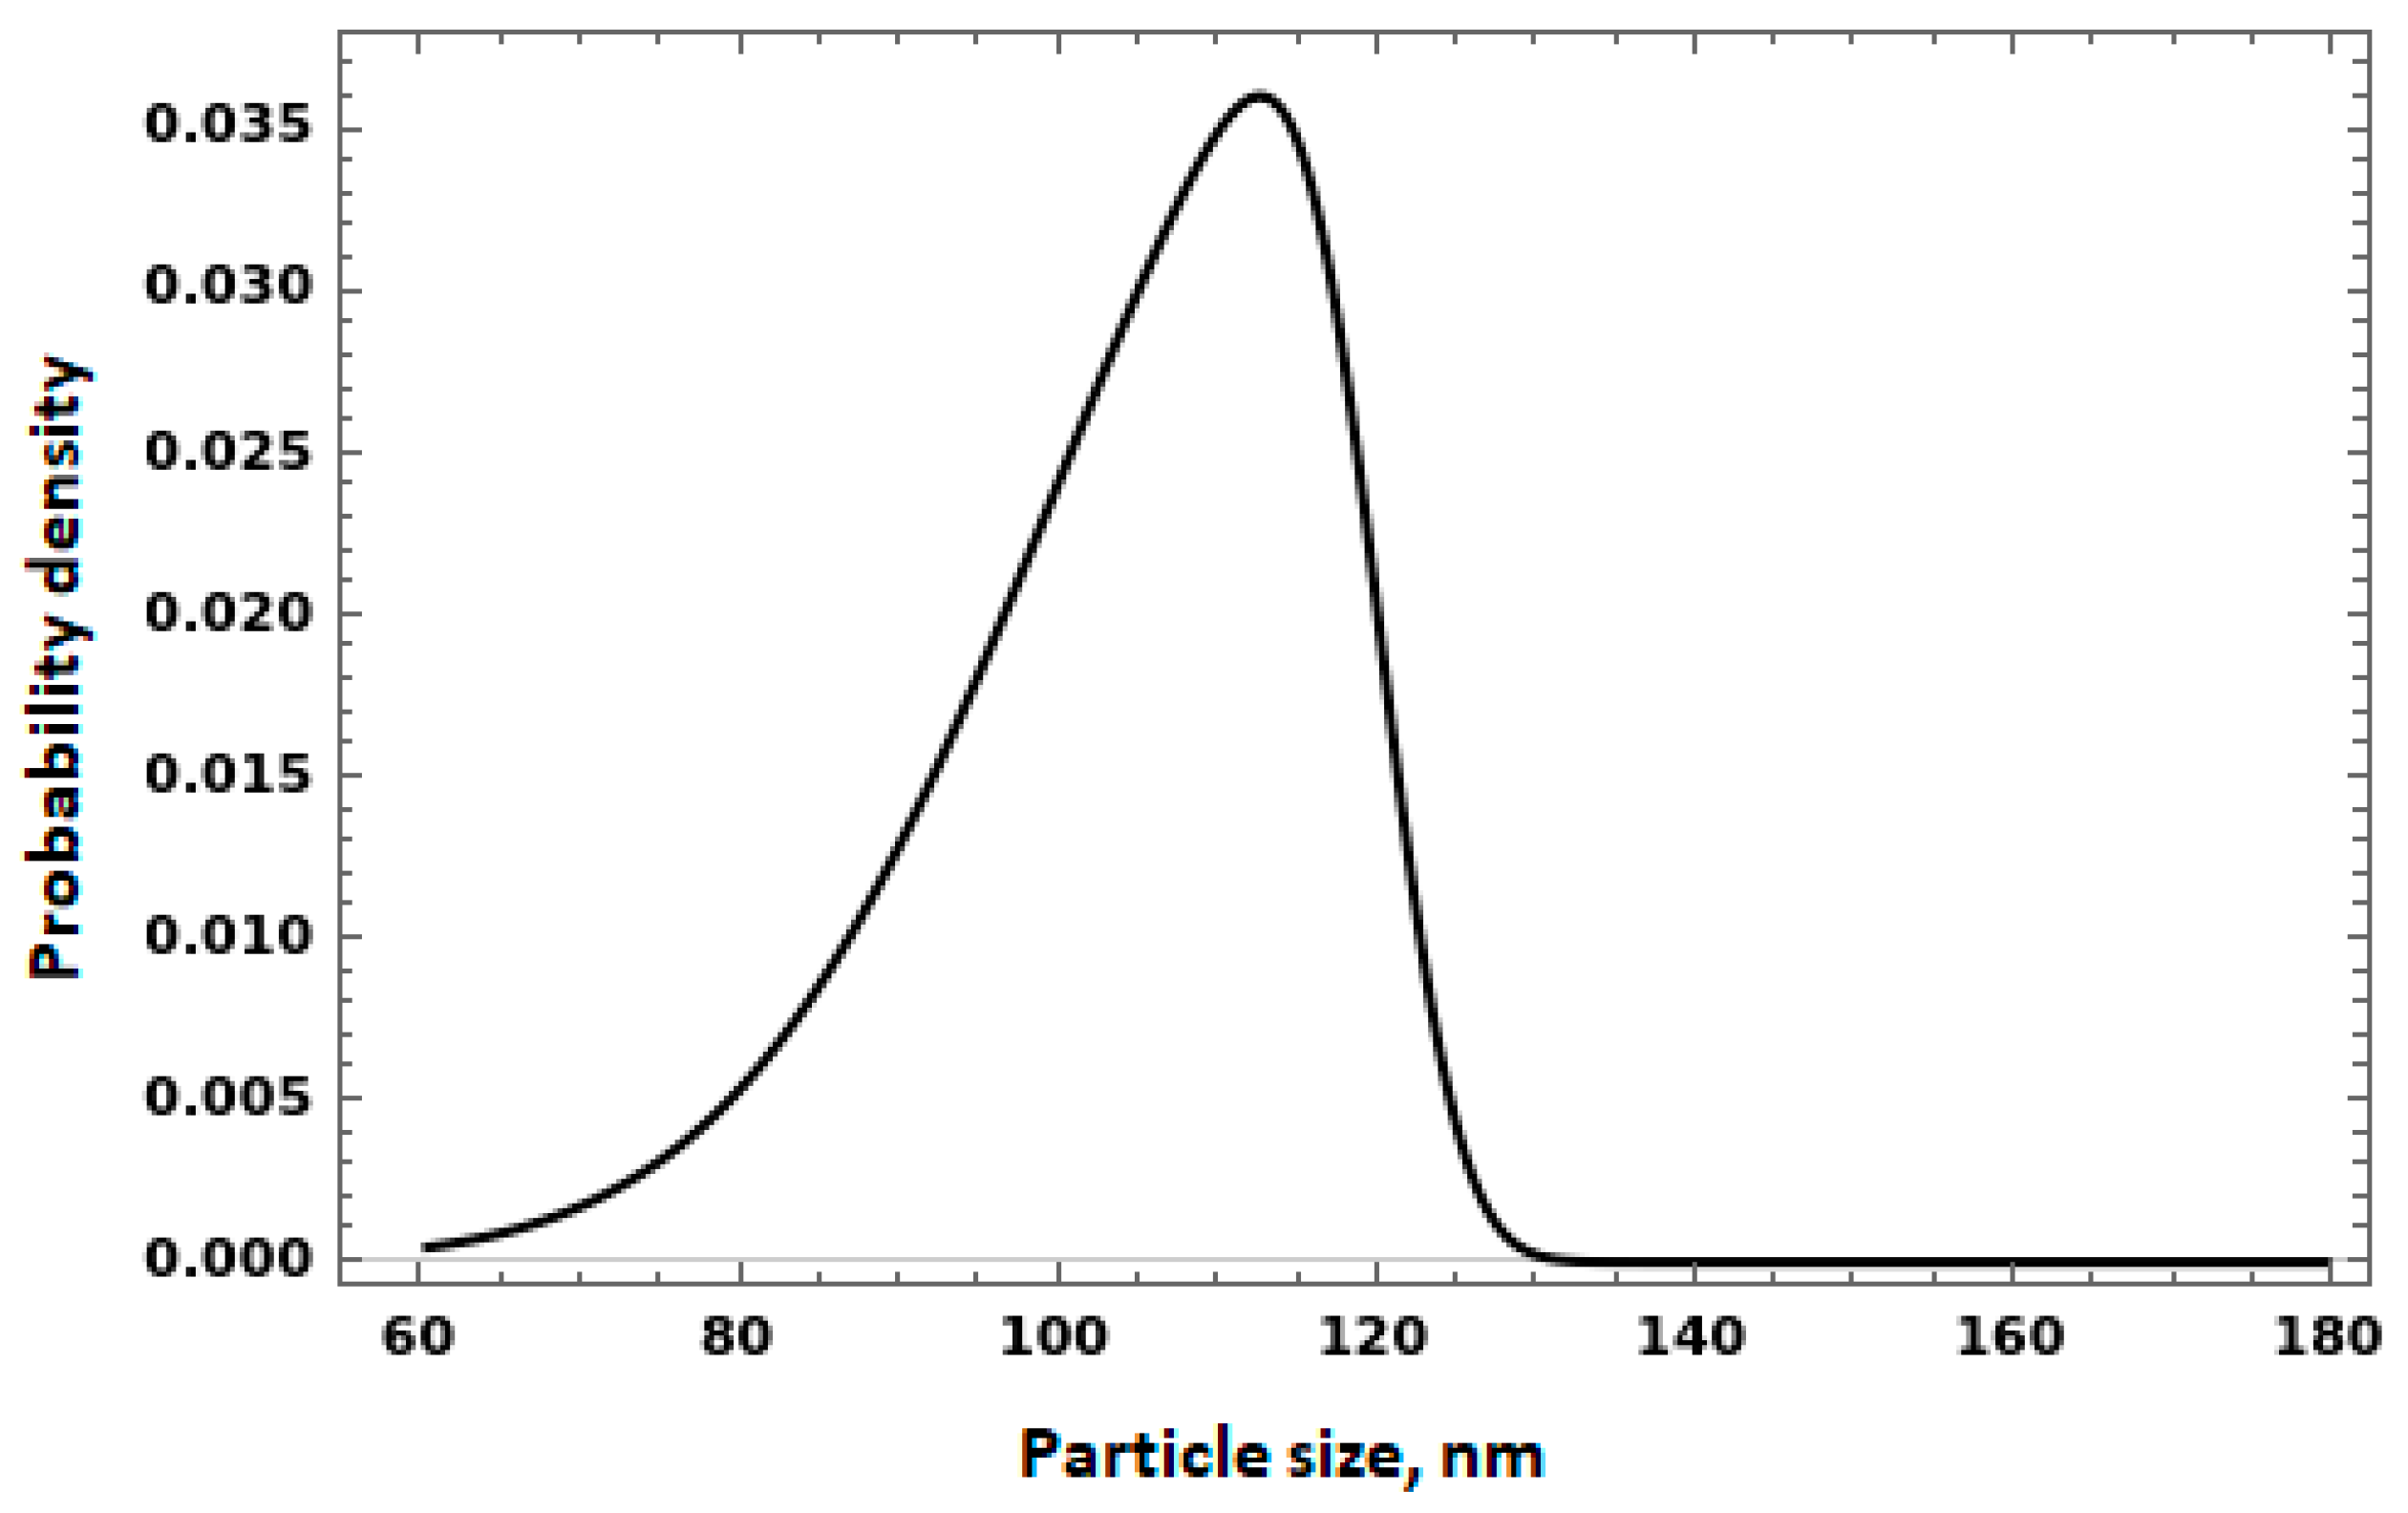
3.2. Characterization of Coal Fly Ash MNPs

The elemental composition of MNPs was as follows, wt.%: Fe—35.1, Al—5.9, and Si—7.6. As presented in Figure 2, the main phases in MNPs were mullite, quartz, and magemmite.
The size distribution curve of MNPs recovered from coal fly ash and dispersed in deionized water is presented in Figure 3.
The curve is a skewed distribution, indicating a deviation from a symmetrical distribution. The average particle size is centered around 120 nanometers (nm), with a standard deviation of 20 nm, suggesting a moderate spread of particle sizes around the mean. The negative skewness of the distribution implies that a larger number of particles are smaller than the average size, with fewer particles on the larger end of the size spectrum. The presence of a long tail on the left side of the distribution curve further indicates that while most particles are concentrated around the smaller size range, there is a gradual decrease in frequency as particle size increases, with very few particles reaching the upper size limit.

3.3. Evaluation of Prepared Pour Point Depressants

Figure 4 shows the pour point values in the absence (blank) and presence of additives, the composition of which is given in Table 1. It can be noted that all 15 additives used reduced the pour point, but the degree of their influence was different.
Initially, without MNPs, as the concentration of PES increased from 0.25% to 2.00%, the pour point of crude oil first decreased, reaching its lowest at 1.00% PES (−6 °C), and then significantly increased at higher concentrations (1.50% and 2.00% PES showed pour points of 1 °C and 9 °C, respectively). This suggests that there was an optimal concentration of PES (around 1.00%) beyond which its effectiveness as a PPD decreased.
With the addition of 1% MNPs to the PES solutions, the pour points across all PES concentrations were further lowered compared to PES alone. The lowest pour point observed was −14 °C with 0.25% PES + 1% MNPs. This indicates that MNPs enhanced the PPD effectiveness of PES, possibly through better dispersion or interaction with crude oil components.
Increasing the concentration of MNPs to 2% with PES solutions further improved pour point depression, with the lowest pour point reaching −17 °C at 0.25% PES + 2% MNPs. This suggests a synergistic effect between PES and higher concentrations of MNPs, leading to more significant pour point depression.
The decrease in the effectiveness of PPDs when using relatively high concentrations of PES is likely attributable to the solvation power of the solvent. At lower concentrations, the solvent can effectively solvate the PE particles, dispersing them uniformly throughout the crude oil. This uniform dispersion allows the PE to interfere with the formation of wax crystals, which are responsible for increasing the pour point of crude oil. The PE molecules can coat the wax crystals or prevent their growth, thereby lowering the pour point and improving the flow characteristics of the oil.
As the concentration of PES increases beyond an optimal level (0.5% in our case), the solvation power of the solvent becomes insufficient to maintain all of the added PE in a uniformly dispersed state. When the solvation capacity is exceeded, the excess PES starts to aggregate or precipitate out of the solution, leading to a less effective distribution of the PPD within the crude oil. These aggregates can themselves act as nucleation sites for wax crystal formation or simply contribute to an increase in the viscosity of the oil, both of which can negate the pour point depression effect and raise the pour point.

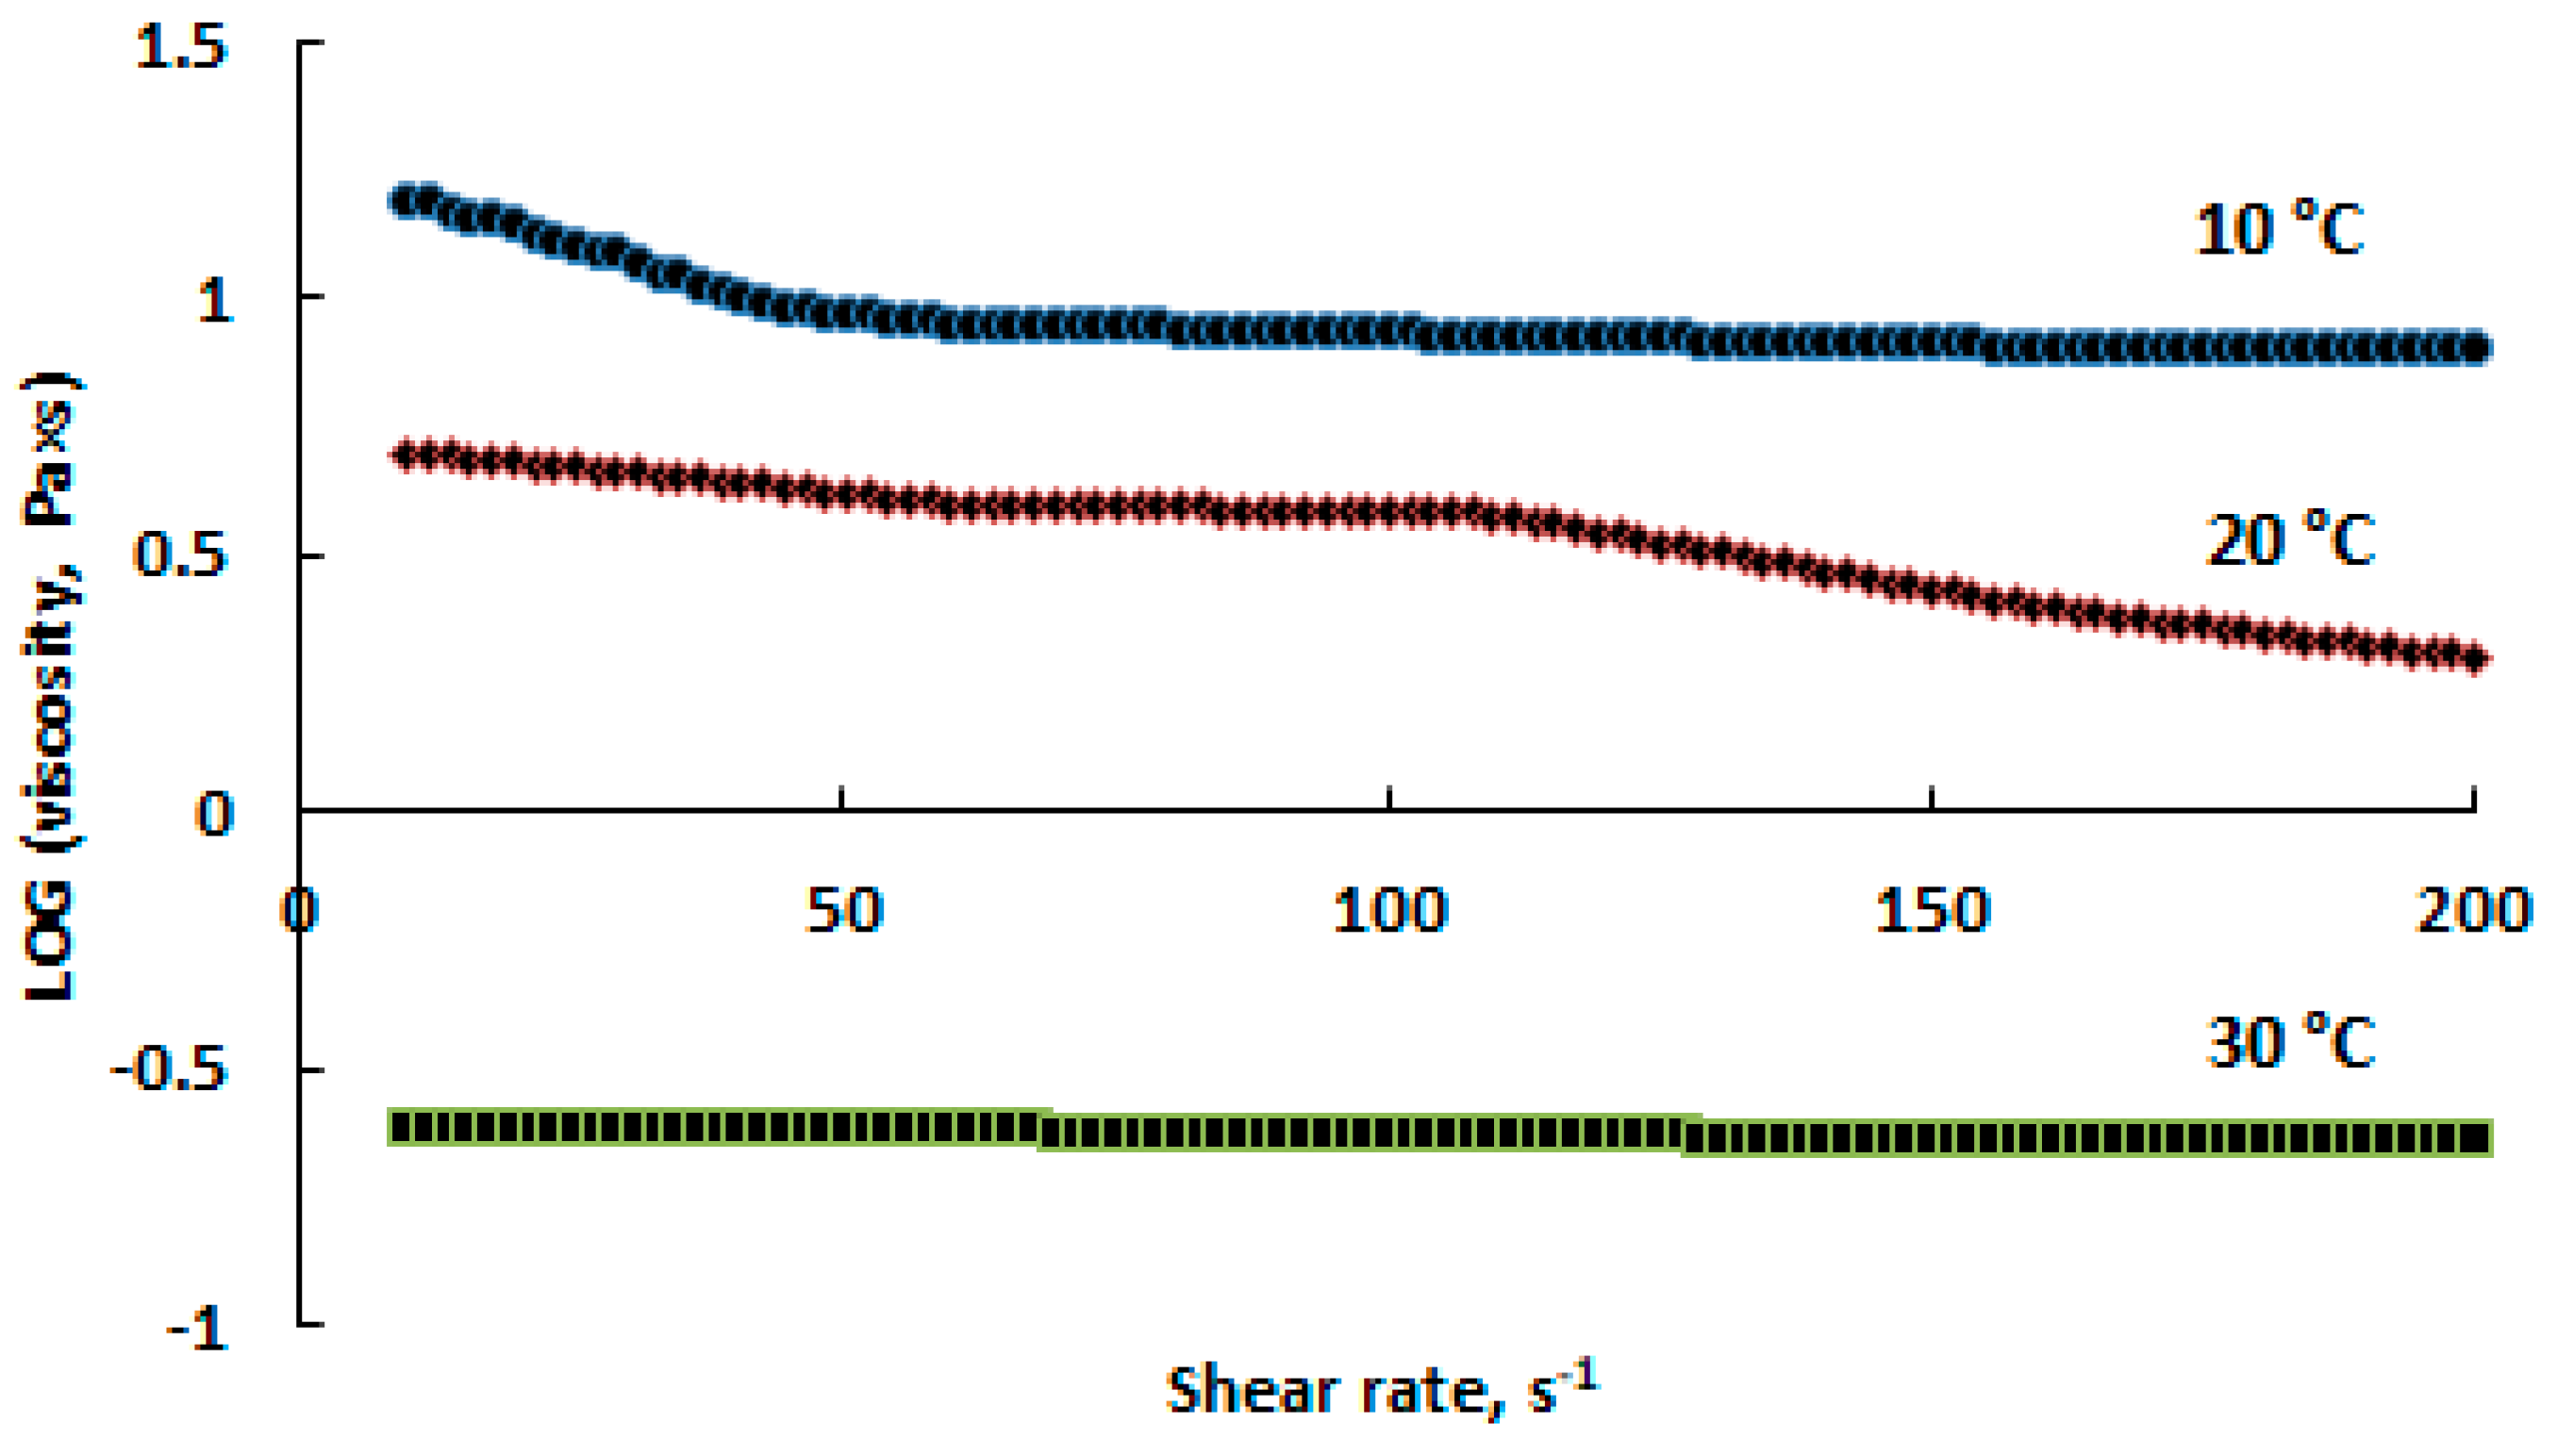
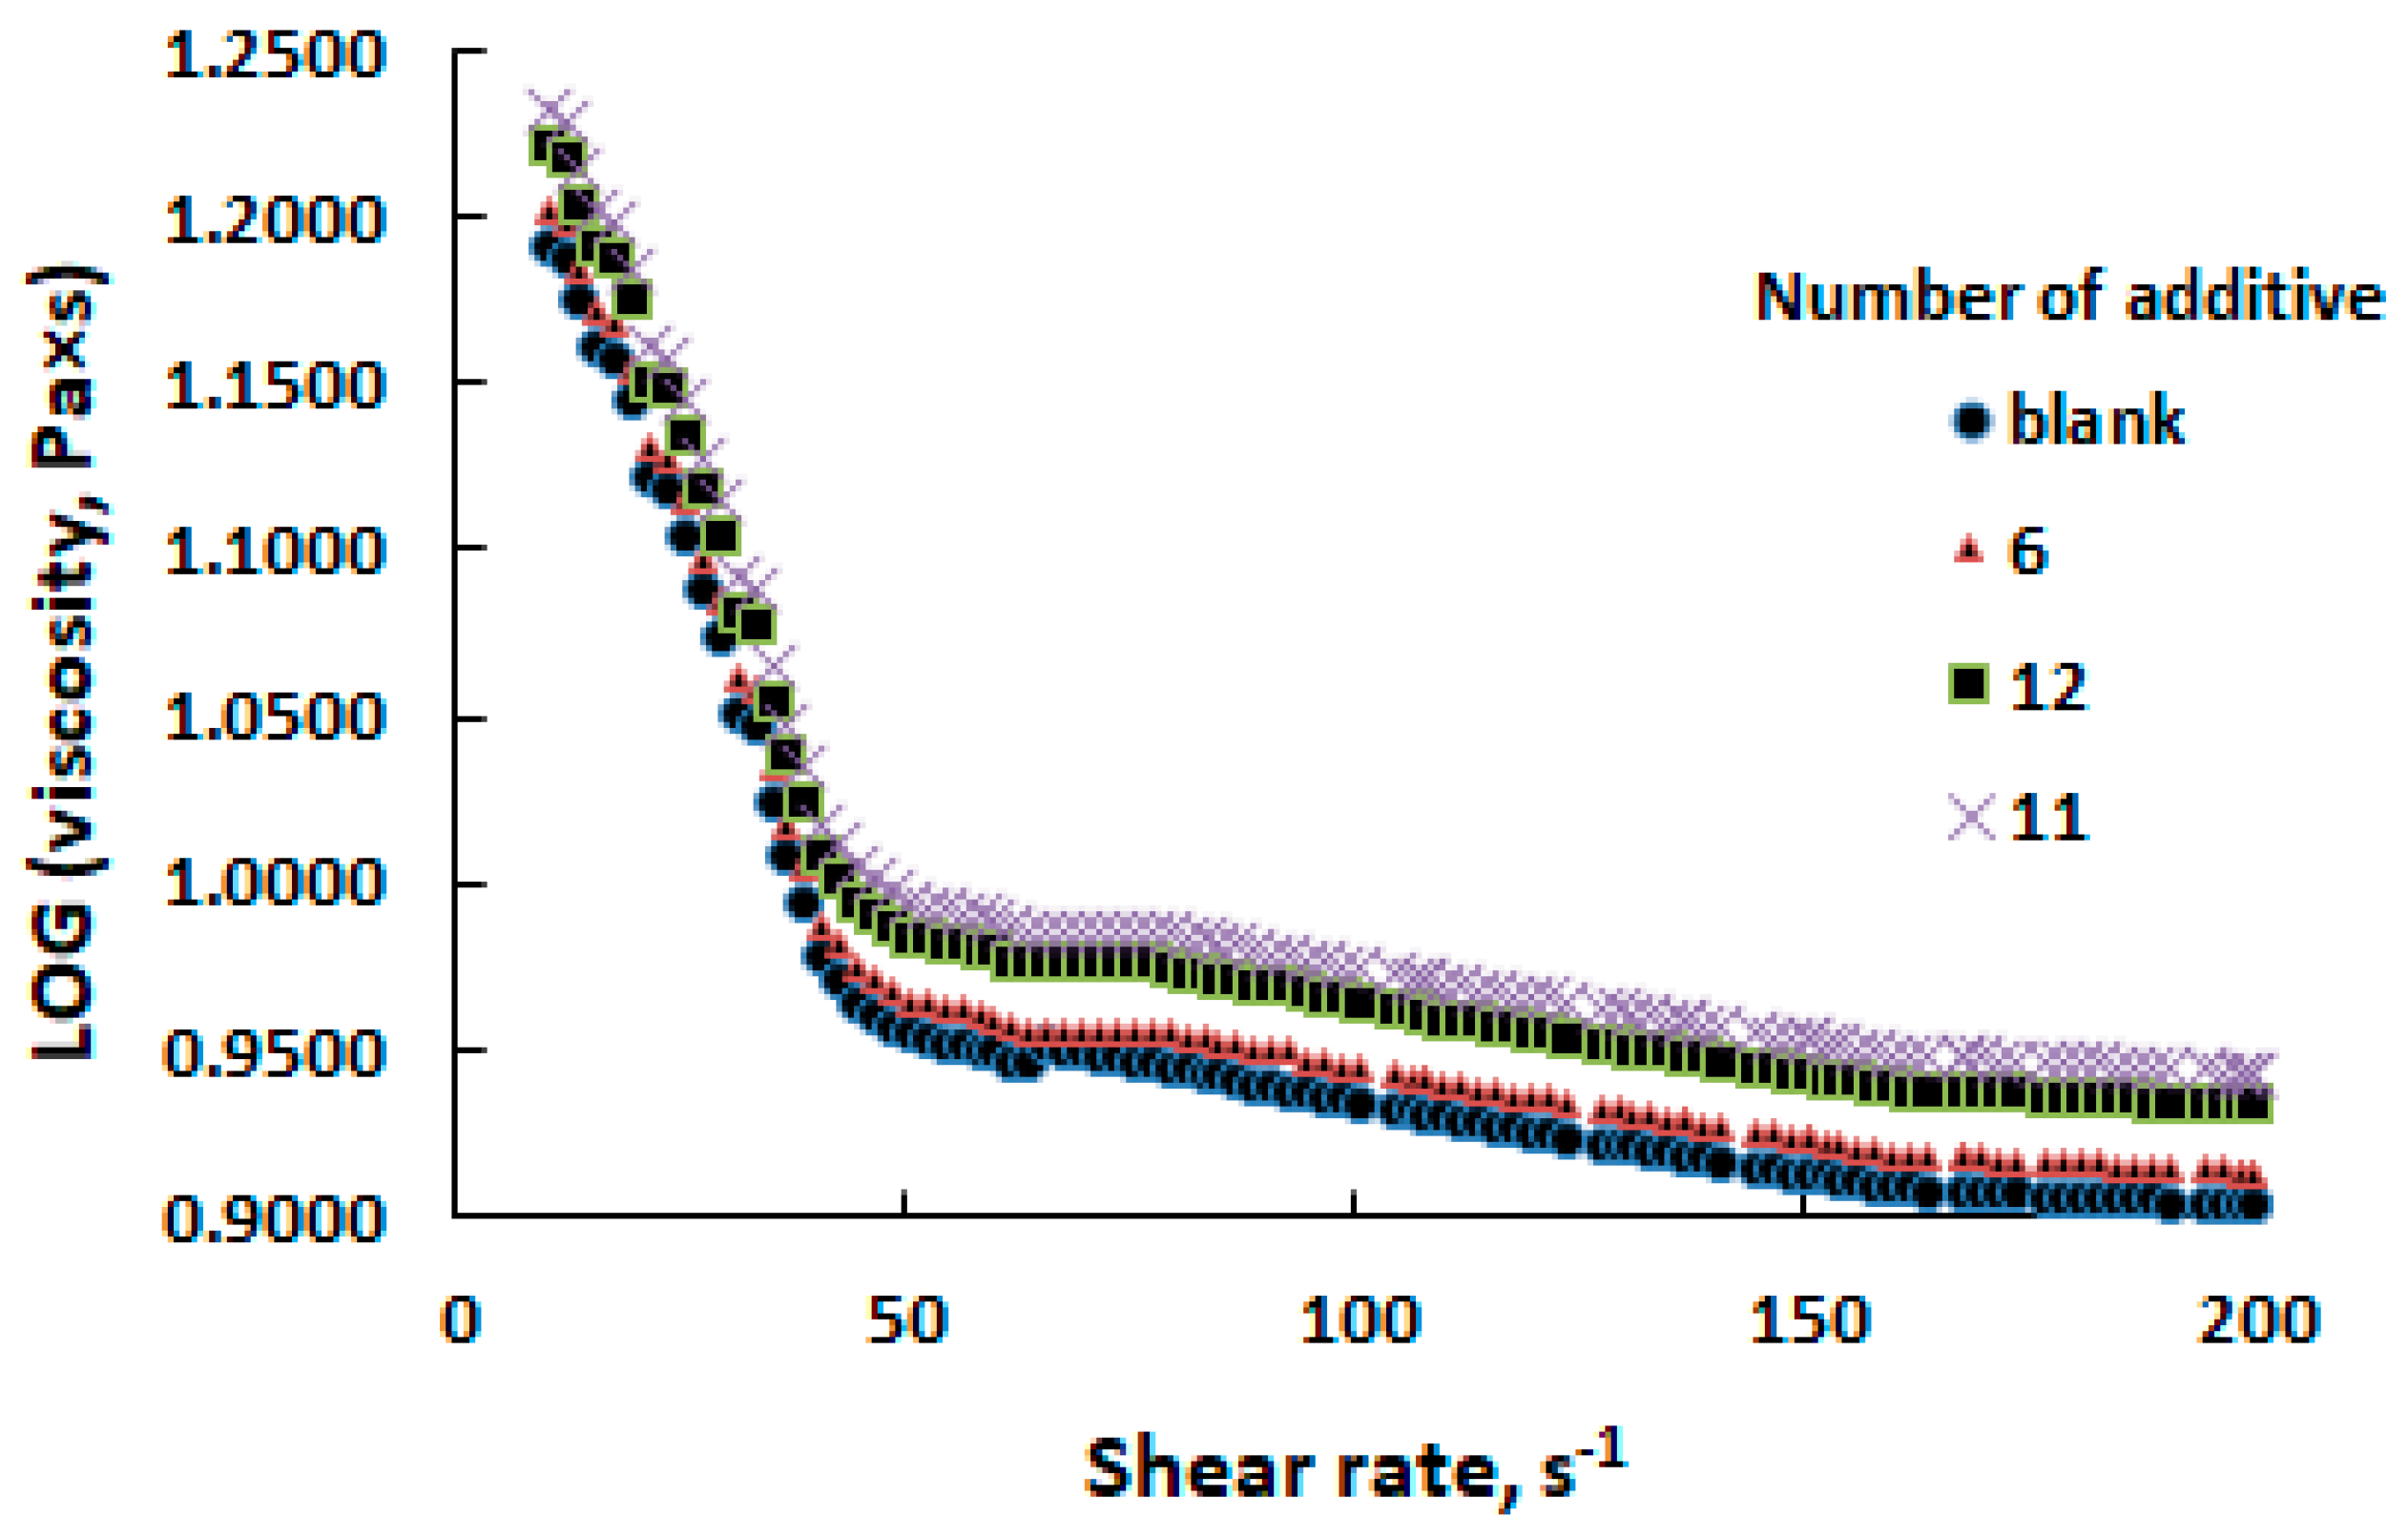
3.4. Viscosity Curve Test

Viscosity curves of crude oil at 10, 20, and 30 °C are presented in Figure 5.
At temperatures above WAT (30 °C), the dynamic viscosity of oil practically does not change with the variation in shear rate; the logarithm of viscosity (Pa × s) is in the range from −0.62 to −0.61, which corresponds to a viscosity of 0.240–0.245 Pa × s. The oil behaves as a Newtonian fluid. At temperatures significantly below WAT (10 °C), the shear rate significantly affects the viscosity of oil: it decreases by 1.6 times from 15.52 Pa × s at 10 s−1 to 9.8 Pa × s at 40 s−1; thereafter, the rate of decrease slows down, and the viscosity reaches 7.9 Pa × s at 200 s−1. The behavior of the curve is most interesting at a temperature slightly exceeding WAT (20 °C). The viscosity values and their corresponding logarithms indicate a nuanced transition in the oil’s rheological behavior. As the shear rate increases from 10 s−1 to over 100 s−1, the viscosity exhibits a gradual decline, reflecting the oil’s sensitivity to shear at temperatures near WAT. The data highlight a critical zone around 20 °C, where the oil’s viscosity starts to decrease more significantly with increasing shear rate, suggesting the onset of non-Newtonian, shear-thinning behavior.
It was deemed crucial to investigate the impact of the resultant PPDs on oil viscosity at temperatures lower than the pour point. Three additives, namely number 6, number 11, and number 12, exhibiting the most promising outcomes in pour point reduction were selected for scrutiny. The findings of this study are presented in Figure 6.
All additives induced higher log-viscosity values across all shear rates when compared to the blank. The curve of sample #11, which contained a mixture of 0.25% polyethylene in hexane with 2% MNPs, demonstrated the steepest increase, indicating the greatest influence on the oil’s internal structure. It consistently exhibited higher viscosity readings at corresponding shear rates. Sample #12 followed, showing a less pronounced but still notable rise in viscosity. The curve for sample #6, while also above the blank, reflected the least increase among the additives. As the shear rate increased, the differences in viscosity between the samples diminished, suggesting that the shear-induced alignment of oil molecules may counteract the structuring effects of the additives. At lower shear rates, the distinction between the curves was more pronounced, especially for sample #11, which hints at its robust impact on the oil’s low-temperature flow properties.
Thus, among the PPDs tested, sample #11, which contained 0.25% PE in hexane and 2% MNPs, showed the most substantial increase in viscosity, followed by samples number 12 and number 6. As we showed earlier, it was in this order that the influence of additives on reducing pour point weakened: #11 > #12 > #6.

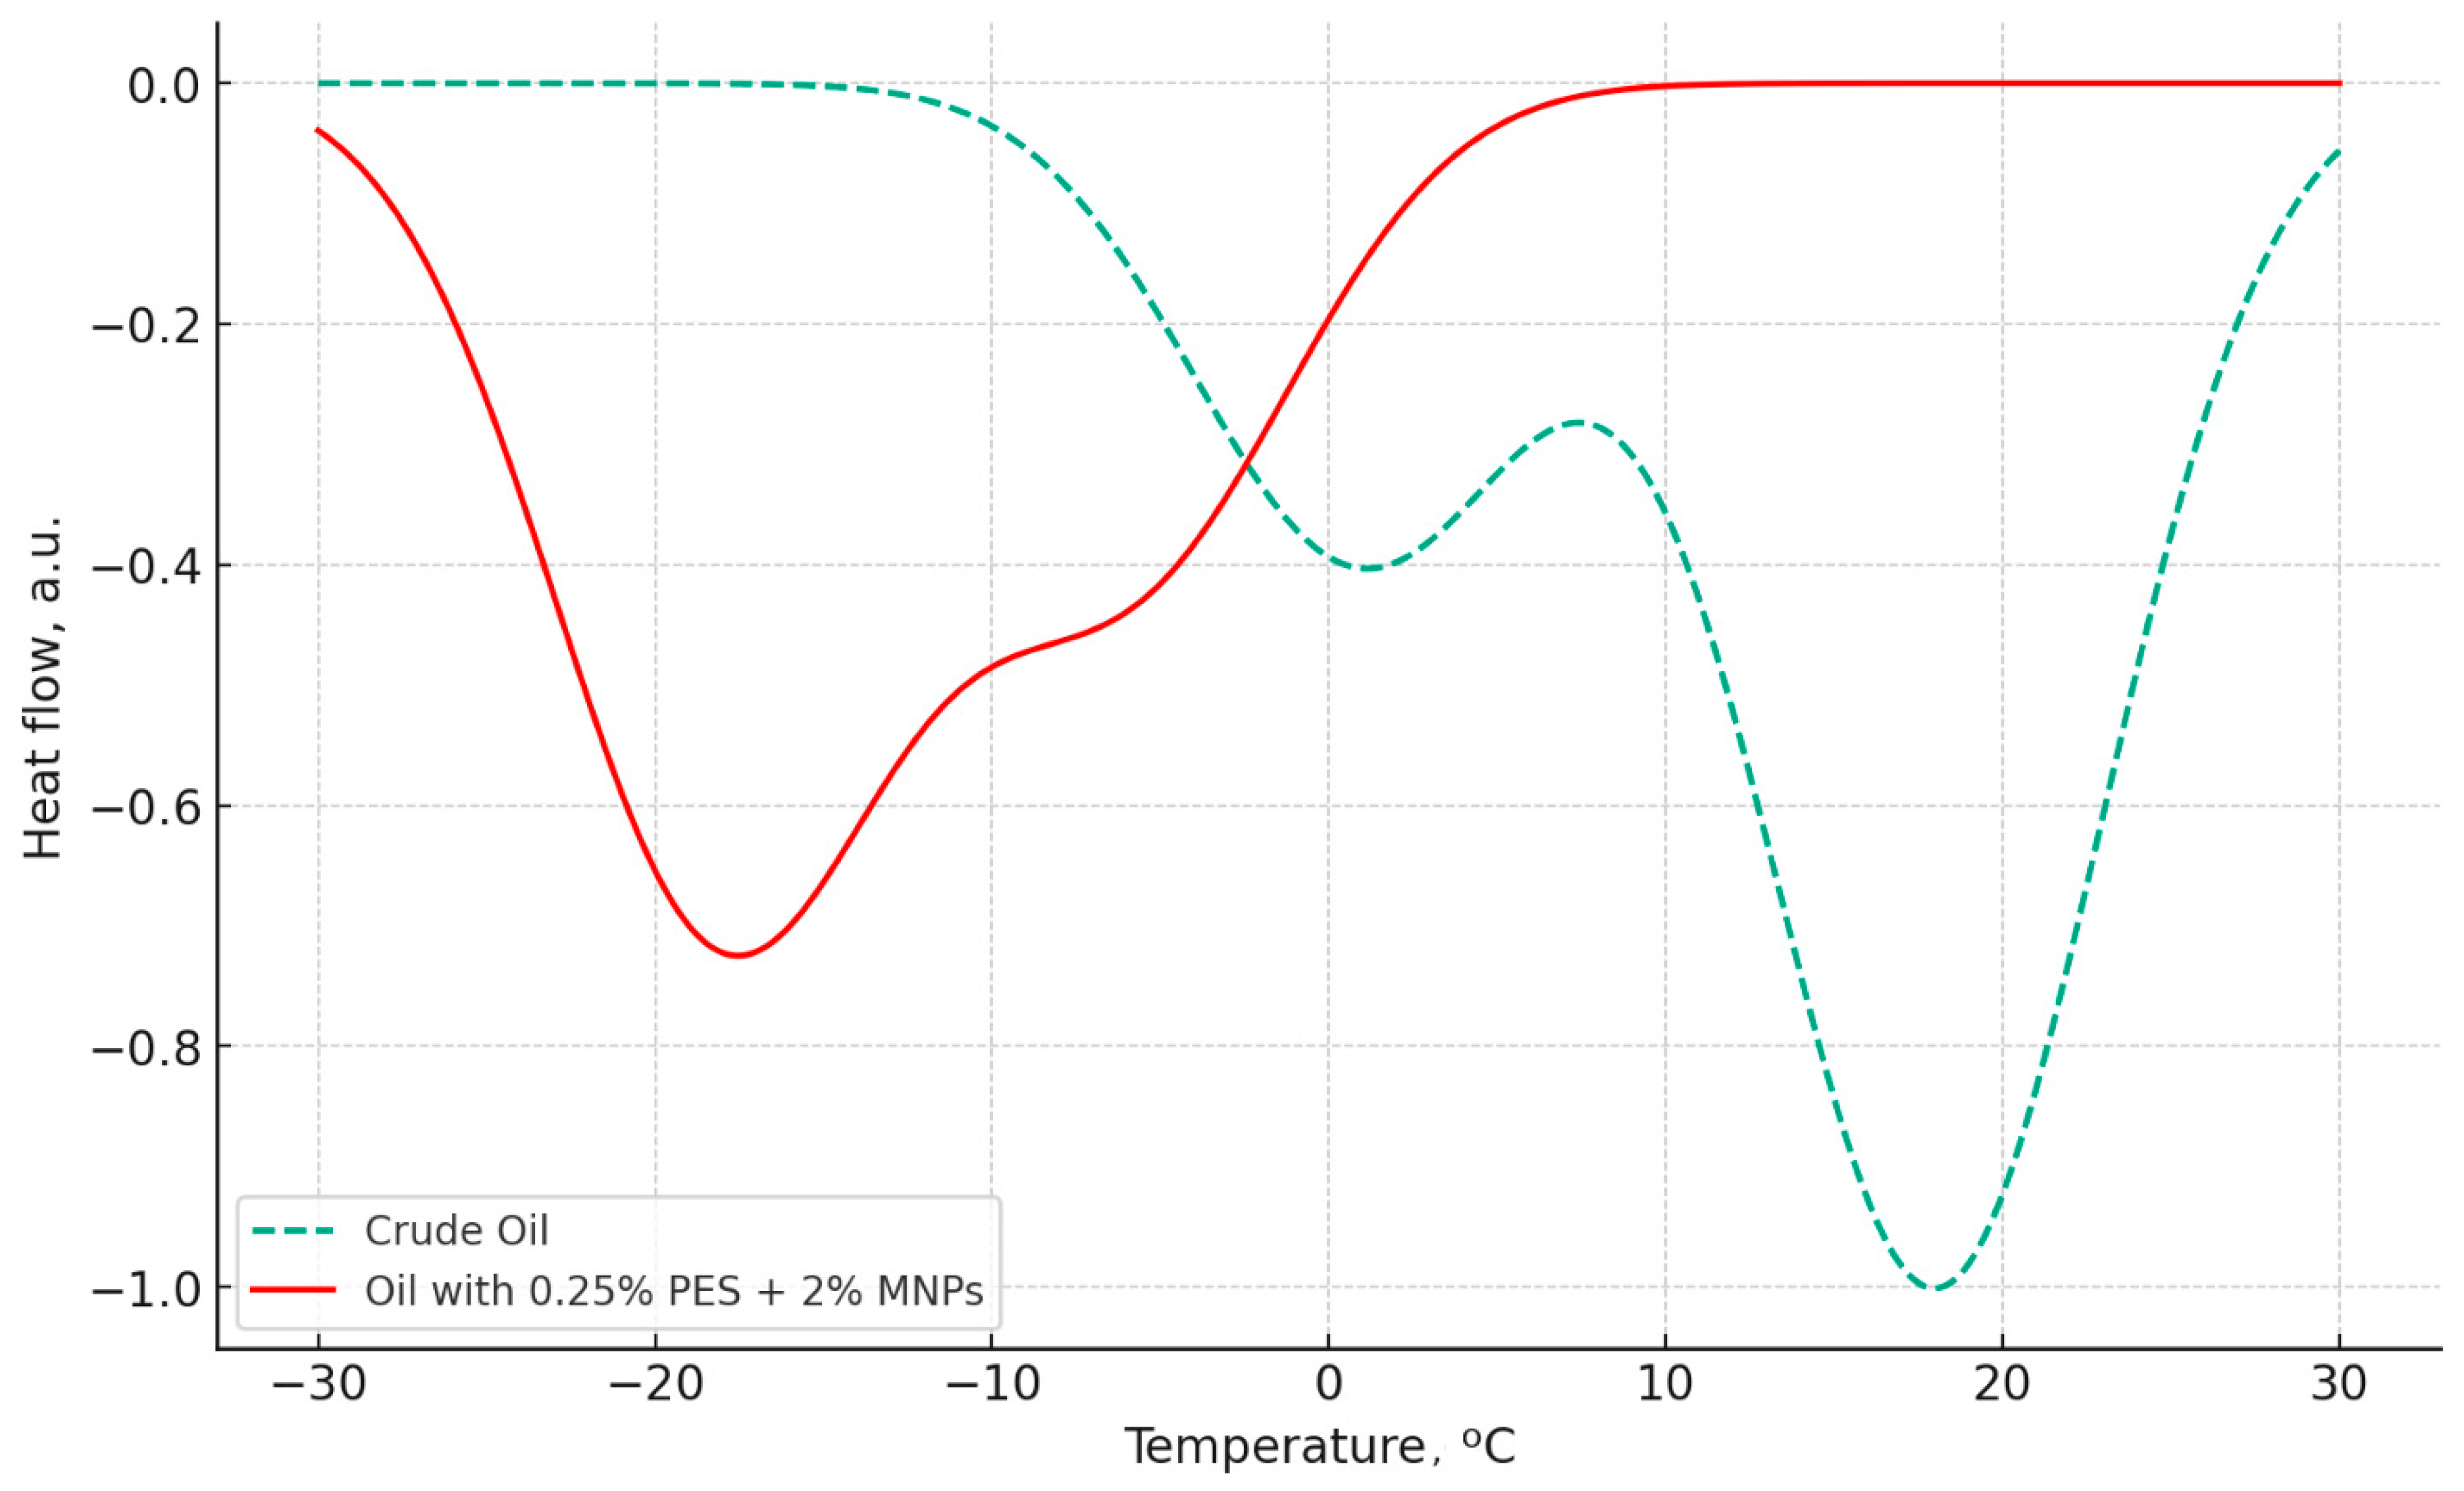
3.5. Differential Scanning Calorimetry

Figure 7 presents the differential scanning calorimetry (DSC) curves of crude oil and oil in the presence of 0.25% polyethylene in hexane (0.25% PES) + 2% MNPs (additive 11).
Each curve exhibits two endothermic peaks. For the crude oil without additives, the peaks were observed at 18 °C and 1 °C, with the peak at 18 °C being higher. This indicates that a significant portion of the paraffins present in the oil crystallize at 18 °C, leading to freezing and reduced fluidity. Some components of the oil remain dissolved and only freeze around 0 °C. The presence of the additive shifts the temperature of both peaks toward the negative range: the higher peak is observed from −17 to −19 °C, and the lower peak appears from −5 to −7 °C. This shift signifies that the additive significantly inhibits the crystallization process of paraffins in the oil, enhancing its fluidity at low temperatures. Furthermore, the DSC results align with the data from Figure 4, showing that the presence of additive 11 shifts the freezing point of the oil from 18 °C to −17 °C.
The reduction in the height of both peaks on the curve for oil in the presence of the additive, compared to the untreated oil, is informative. This could mean that the additive decreases the number of crystals forming upon cooling or alters their morphology, making the crystals less prone to aggregation and the formation of large structures, thereby improving the oil’s fluidity at low temperatures. Additionally, in the presence of the additive, smaller and less ordered crystals form, reducing the overall enthalpy of melting and, consequently, the height of the endothermic peaks.
In blank crude oil without additives, the oil tends to form larger, more ordered crystals when it begins to freeze. These larger crystals release more heat during their formation, resulting in higher and sharper peaks on the DSC curve. In contrast, PPDs can interfere with the crystallization process by coating the paraffin molecules or inhibiting their alignment and aggregation, leading to the formation of smaller, less ordered crystals. These smaller crystals produce less heat upon formation, which is reflected in lower and broader peaks on the DSC curve.

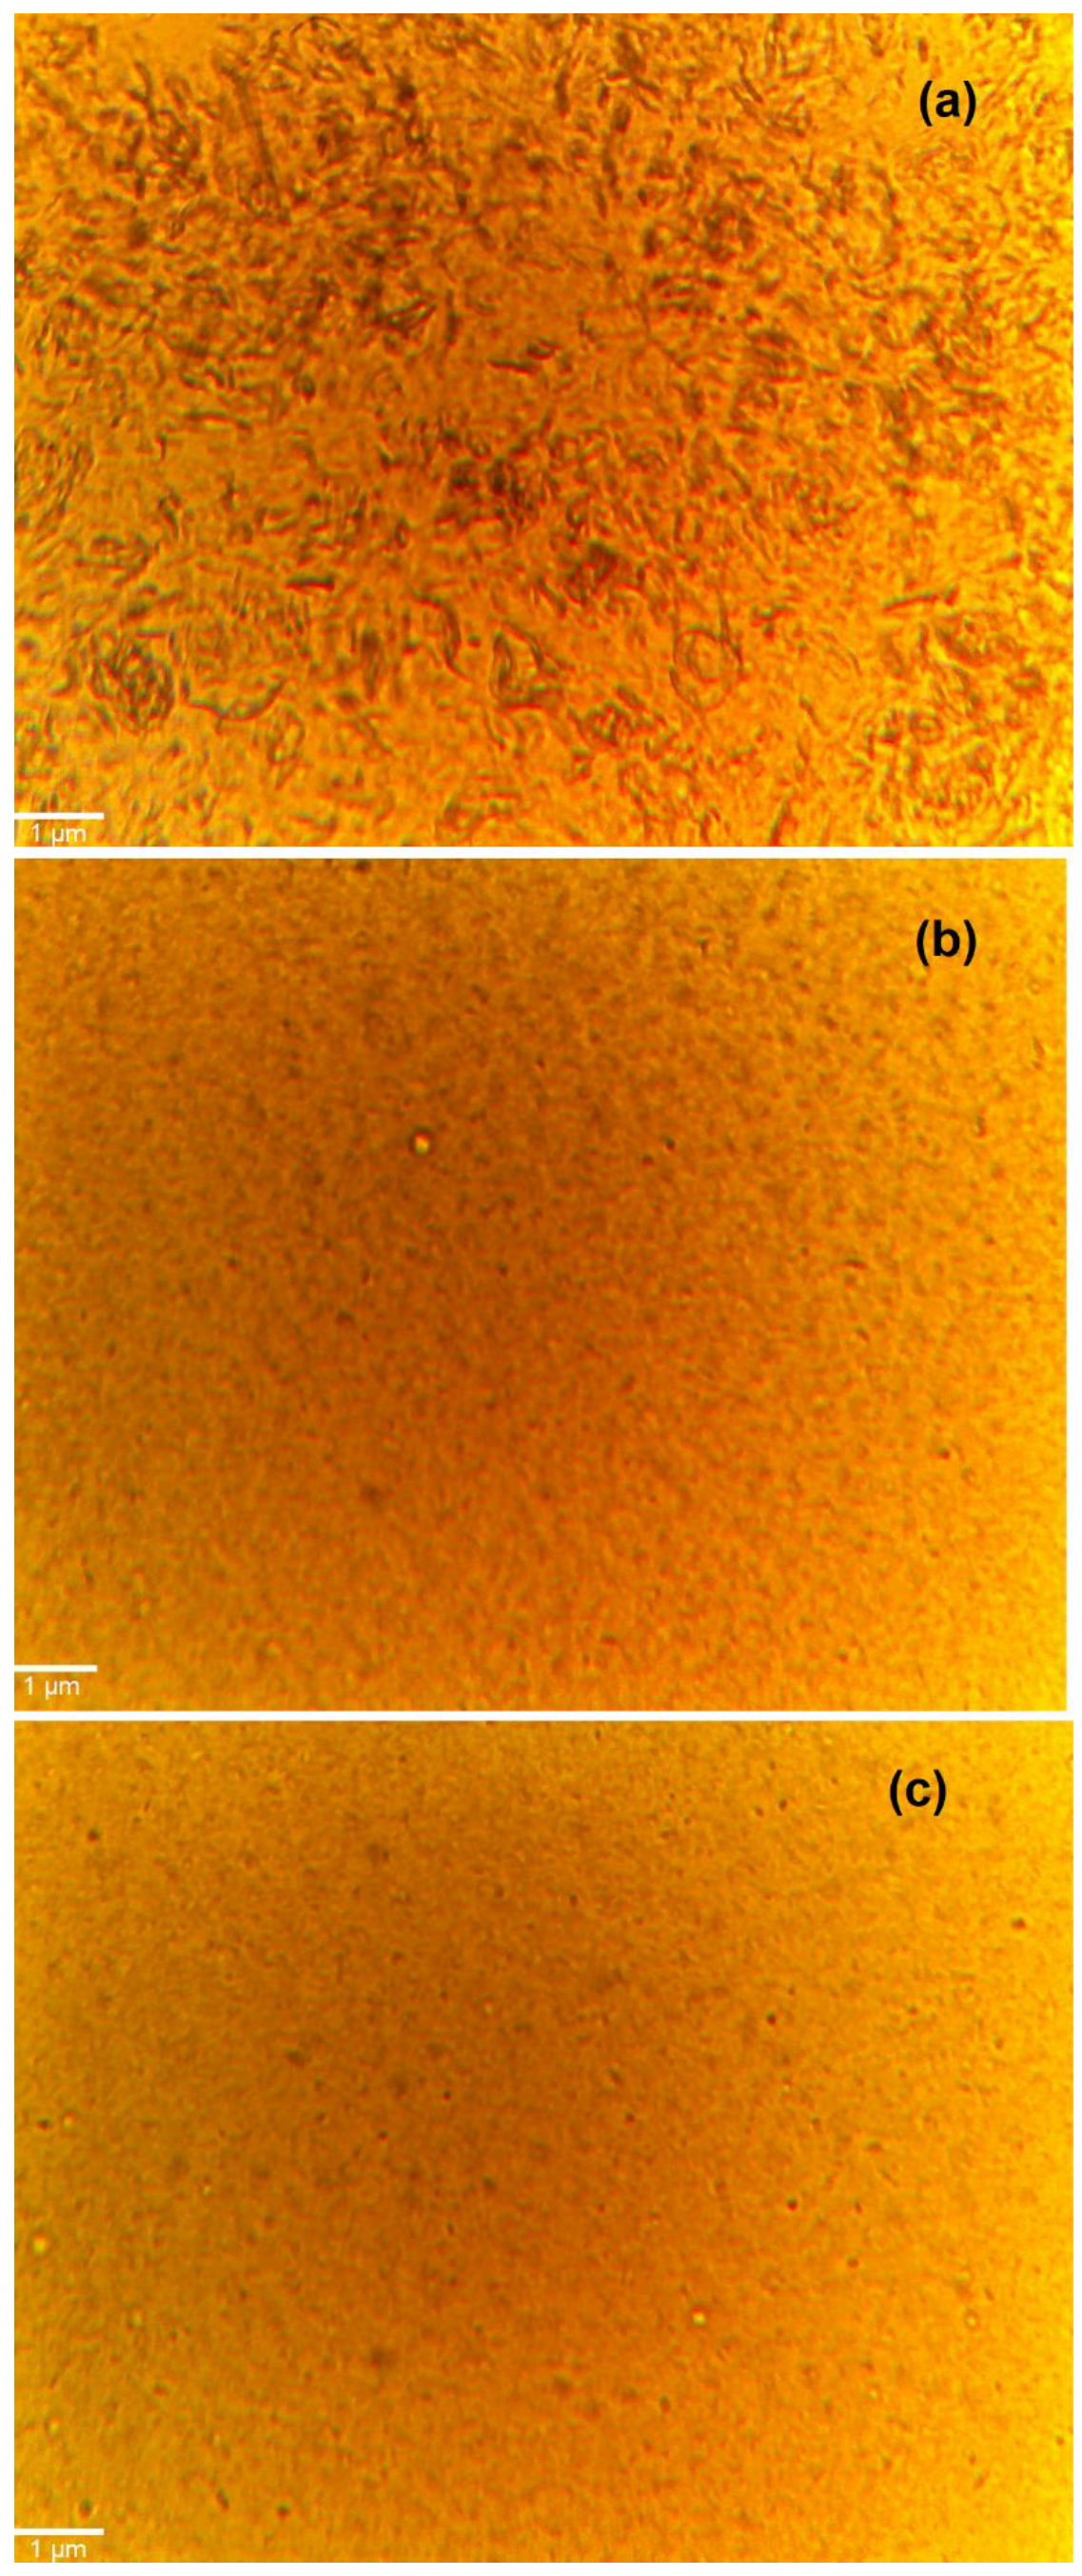
3.6. Microscopic Observations

Figure 8a–c show optical microscopy images of crude oil, undoped and doped with PPDs. The image of the oil without PPDs (a) is characterized by the presence of large, elongated paraffin crystals, which form large, visually noticeable aggregates.
The addition of 0.25% PE in hexane + 1% MNPs leads to a sharp reduction in the size of the paraffin crystals, as well as to a more uniform distribution throughout the volume of the oil. Switching the additive to another one, which showed the greatest reduction in the pour point in previous experiments (0.25% PE in hexane + 2% MNPs), slightly alters the scenario but intensifies the mentioned effect, making the paraffin crystals even smaller and ensuring their more complete distribution throughout the volume of the oil.

3.7. Mechanism of Action: Polyethylene/MNPs as PPDs for Crude Oil

Upon cooling the oil, polyethylene molecules embed into the crystalline lattice of paraffins or adsorb onto their surfaces, thereby preventing the growth of paraffin crystals into large aggregates. This leads to the formation of small crystals, which affect the fluidity of the oil to a lesser degree. Magnetic nanoparticles act as crystallization centers for paraffins, facilitating the formation of even smaller paraffin crystals than when only polyethylene is acting. Furthermore, due to their magnetic nature, these nanoparticles can interact with each other, creating additional structural constraints for the growth of paraffin crystals. Thus, the combination of polyethylene and magnetic nanoparticles creates a synergistic effect: polyethylene prevents the formation of large paraffin aggregates, thereby improving the fluidity of the oil at low temperatures, while magnetic nanoparticles contribute to further reducing the size of paraffin crystals and ensuring their uniform distribution in the oil. In turn, hexane provides a homogeneous medium for mixing polyethylene and magnetic nanoparticles before their introduction into the oil. This facilitates the uniform distribution of these components throughout the volume of the oil.

4. Conclusions

This study investigated the use of polyethylene dissolved in hexane, combined with magnetic nanoparticles (MNPs) from coal fly ash waste, to create pour point depressants (PPDs) for crude oil. Fifteen PPD samples were prepared and tested; among these, five samples were solutions of polyethylene in hexane (ranging from 0.25 to 2.0%), and the remaining ten were combinations of MNPs in these solutions. The most effective depressant consisted of 0.25% polyethylene in hexane + 2% MNPs; its use was able to reduce the pour point of oil from 18 °C (untreated oil) to −17 °C.

Author Contributions

Conceptualization, K.N.; methodology, M.Z. and T.K.; investigation, Z.N., A.B., G.B. and K.K.; resources, K.N. and R.N.; writing—original draft preparation, R.N. and T.K.; writing—review and editing, K.N.; visualization, A.B. and K.K.; project administration, R.N.; funding acquisition, K.N. and R.N. All authors have read and agreed to the published version of the manuscript.

Funding

This study was funded by the Science Committee of the Ministry of Science and Higher Education of the Republic of Kazakhstan (grants no. AP14869314 and BR21882017).

Data Availability Statement

The data supporting the results can be made available from the corresponding author upon request.

Conflicts of Interest

The authors declare no conflicts of interest.

References

  1. Steckel, L.; Nunes, R.C.; Rocha, P.C.; Ramos, A.C.; Alvares, D.R.; Lucas, E.F. Pour point depressant: Identification of critical wax content and model system to estimate performance in crude oil. Fuel 2022, 307, 121853. [Google Scholar] [CrossRef]
  2. Adams, J.J.; Tort, F.; Loveridge, J.; Bolton, N.; Forney, J. Physicochemical Approach to Pour Point Depressant Treatment of Waxy Crudes. Energy Fuels 2023, 37, 6432–6449. [Google Scholar] [CrossRef]
  3. Yao, B.; Li, C.; Yang, F.; Sun, G.; Xia, X.; Ashmawy, A.M.; Zeng, H. Advances in and perspectives on strategies for improving the flowability of waxy oils. Energy Fuels 2022, 36, 7987–8025. [Google Scholar] [CrossRef]
  4. Sharma, S.; Mahto, V.; Sharma, V.P. Effect of flow improvers on rheological and microscopic properties of indian waxy crude oil. Ind. Eng. Chem. Res. 2014, 53, 4525–4533. [Google Scholar] [CrossRef]
  5. Zhang, X.; Li, N.; Wei, Z.; Han, S.; Dai, B.; Lin, H. Synthesis of nano-hybrid polymethacrylate-carbon dots as pour point depressant and combined with ethylene-vinyl acetate resin to improve the cold flow properties of diesel fuels. Energy 2022, 253, 124186. [Google Scholar] [CrossRef]
  6. Elkatory, M.R.; Hassaan, M.A.; Soliman, E.A.; Niculescu, V.-C.; Raboaca, M.S.; El Nemr, A. Influence of poly (benzyl oleate-co-maleic anhydride) pour point depressant with di-stearyl amine on waxy crude oil. Polymers 2023, 15, 306. [Google Scholar] [CrossRef]
  7. Yuan, D.; Liu, Q.; Zhang, W.; Liu, R.; Jiang, C.; Chen, H.; Yan, J.; Gu, Y.; Yang, B. Synthesis and Performance Testing of Maleic Anhydride–Ene Monomers Multicomponent Co-Polymers as Pour Point Depressant for Crude Oil. Polymers 2023, 15, 3898. [Google Scholar] [CrossRef]
  8. Nikolaev, A.; Plotnikova, K. Study of the Rheological Properties and Flow Process of High-Viscosity Oil Using De-pressant Additives. Energies 2023, 16, 6296. [Google Scholar] [CrossRef]
  9. Chen, J.; Cui, L.; Xu, B.; Lin, H.; Han, S. Influence of polymers with surfactant properties as pour point depressants on the cold flow properties of diesel fuel. Colloids Surf. A Physicochem. Eng. Asp. 2023, 677, 132390. [Google Scholar] [CrossRef]
  10. Sun, B.; Su, B.; Zhao, Y.; Xu, B.; Xue, Y.; Lin, H.; Han, S. Synthesis of methacrylate–vinyl acetate–N-phenylmethylpropionamide terpolymers as pour point depressants and combined with methyl palmitoleate to improve the cold flowability of waste cooking oil biodiesel blends. J. Mol. Liq. 2022, 368, 120796. [Google Scholar] [CrossRef]
  11. Marenov, B.T.; Nadirov, K.S.; Zhantasov, M.K.; Nadirov, R.K. Ethylene-vinyl acetate copolymer/crude gossypol compositions as pour point depressants for waxy oil. Int. J. Chem. Eng. 2020, 2020, 4195382. [Google Scholar] [CrossRef]
  12. Nadirov, K.S.; Zhantasov, M.K.; Marenov, B.T.; Bimbetova, G.Z.; Orynbasarov, A.K.; Shukhanova, Z.K.; Otarbayev, N.S.; Nadirova, Z.K.; Iztleuov, G.M.; Zhantasova, D.M. Obtaining High-Paraffin-Content Oil Depressants. Chem. Eng. Technol. 2021, 44, 310–317. [Google Scholar] [CrossRef]
  13. Huang, H.-R.; Wang, W.; Peng, Z.-H.; Li, K.; Ding, Y.-F.; Yu, W.-J.; Gan, D.-Y.; Wang, C.-S.; Xue, Y.-H.; Gong, J. Synergistic effect of magnetic field and nanocomposite pour point depressant on the yield stress of waxy model oil. Pet. Sci. 2020, 17, 838–848. [Google Scholar] [CrossRef]
  14. Mao, J.; Kang, Z.; Yang, X.; Lin, C.; Zheng, L.; Zuo, M.; Mao, J.; Dai, S.; Xue, J.; Ouyang, D. Synthesis and performance evaluation of a nanocomposite pour-point depressant and viscosity reducer for high-pour-point heavy oil. Energy Fuels 2020, 34, 7965–7973. [Google Scholar] [CrossRef]
  15. Wang, C.; Liu, Y.; Hu, S.; Lv, X.; Zhao, B.; Ma, Q.; Zhou, S. Experimental study of the effects of a magnetic field/magnetic field-ferromagnetic nanocomposite pour point depressant on wax deposition. RSC Adv. 2024, 14, 6234–6245. [Google Scholar] [CrossRef]
  16. Huang, H.; Li, K.; Wang, D.; Liang, P.; Yang, J.; Ding, Y.; Gong, J. Further discussion of nanocomposite pour point depressants on the influence of paraffin wax crystallization: A novel small angle x-ray diffraction study. Cryst. Growth Des. 2022, 22, 6870–6878. [Google Scholar] [CrossRef]
  17. Gao, S.; Yang, Y.; Falchevskaya, A.S.; Vinogradov, V.V.; Yuan, B.; Liu, J.; Sun, X. Phase Transition Liquid Metal Enabled Emerging Biomedical Technologies and Applications. Adv. Sci. 2023, 2306692. [Google Scholar] [CrossRef]
  18. Zhong, X.; Chen, J.; An, R.; Li, K.; Chen, M. A state-of-the-art review of nanoparticle applications with a focus on heavy oil viscosity reduction. J. Mol. Liq. 2021, 344, 117845. [Google Scholar] [CrossRef]
  19. Sharma, R.; Deka, B.; Mahto, V.; Vuthaluru, H.; Li, C.-Z. Investigation into the flow assurance of waxy crude oil by application of graphene-based novel nanocomposite pour point depressants. Energy Fuels 2019, 33, 12330–12345. [Google Scholar] [CrossRef]
  20. Yang, F.; Paso, K.; Norrman, J.; Li, C.; Oschmann, H.; Sjöblom, J. Hydrophilic nanoparticles facilitate wax inhibition. Energy Fuels 2015, 29, 1368–1374. [Google Scholar] [CrossRef]
  21. Sharma, R.; Mahto, V.; Vuthaluru, H. Synthesis of PMMA/modified graphene oxide nanocomposite pour point de-pressant and its effect on the flow properties of Indian waxy crude oil. Fuel 2019, 235, 1245–1259. [Google Scholar] [CrossRef]
  22. Ko, S.; Huh, C. Use of nanoparticles for oil production applications. J. Pet. Sci. Eng. 2018, 172, 97–114. [Google Scholar] [CrossRef]
  23. Yu, H.; Sun, Z.; Jing, G.; Zhen, Z.; Liu, Y.; Guo, K. Effect of a magnetic nanocomposite pour point depressant on the structural properties of Daqing waxy crude oil. Energy Fuels 2019, 33, 6069–6075. [Google Scholar] [CrossRef]
  24. He, X.; Zheng, S.; Huang, G.; Rong, Y. Solution grafting of maleic anhydride on low-density polyethylene: Effect on crystallization behavior. J. Macromol. Sci. Part B 2012, 52, 1265–1282. [Google Scholar] [CrossRef]
  25. Yang, F.; Zhao, Y.; Sjöblom, J.; Li, C.; Paso, K.G. Polymeric wax inhibitors and pour point depressants for waxy crude oils: A critical review. J. Dispers. Sci. Technol. 2014, 36, 213–225. [Google Scholar] [CrossRef]
  26. Kamal, R.S.; Shaban, M.M.; Raju, G.; Farag, R.K. High-density polyethylene waste (hdpe)-waste-modified lube oil nanocomposites as pour point depressants. ACS Omega 2021, 6, 31926–31934. [Google Scholar] [CrossRef]
  27. Okan, M.; Aydin, H.M.; Barsbay, M. Current approaches to waste polymer utilization and minimization: A review. J. Chem. Technol. Biotechnol. 2018, 94, 8–21. [Google Scholar] [CrossRef]
  28. Kawai, T.; Yasugi, T.; Mizunuma, K.; Horiguchi, S.; Ikeda, M. Comparative evaluation of blood and urine analysis as a tool for biological monitoring of n-hexane and toluene. Int. Arch. Occup. Environ. Health 1993, 65, S123–S126. [Google Scholar] [CrossRef]
  29. Yao, Z.; Xia, M.; Sarker, P.; Chen, T. A review of the alumina recovery from coal fly ash, with a focus in China. Fuel 2013, 120, 74–85. [Google Scholar] [CrossRef]
  30. Vassilev, S.V.; Menendez, R.; Borrego, A.G.; Diaz-Somoano, M.; Martinez-Tarazona, M.R. Phase-mineral and chemical composition of coal fly ashes as a basis for their multicomponent utilization. 3. Characterization of magnetic and char concentrates. Fuel 2004, 83, 1563–1583. [Google Scholar] [CrossRef]
  31. Yang, J.; Zhao, Y.; Zyryanov, V.; Zhang, J.; Zheng, C. Physical–chemical characteristics and elements enrichment of magnetospheres from coal fly ashes. Fuel 2014, 135, 15–26. [Google Scholar] [CrossRef]
  32. Dwivedi, S.; Saquib, Q.; Al-Khedhairy, A.A.; Ali, A.-Y.S.; Musarrat, J. Characterization of coal fly ash nanoparticles and induced oxidative DNA damage in human peripheral blood mononuclear cells. Sci. Total Environ. 2012, 437, 331–338. [Google Scholar] [CrossRef] [PubMed]
  33. Akinyemi, S.A.; Gitari, W.M.; Petrik, L.F.; Nyakuma, B.B.; Hower, J.C.; Ward, C.R.; Oliveira, M.L.; Silva, L.F. Environmental evaluation and nano-mineralogical study of fresh and unsaturated weathered coal fly ashes. Sci. Total Environ. 2019, 663, 177–188. [Google Scholar] [CrossRef] [PubMed]
  34. SY/T 7550-2004; Determination of Crude Oil in the Wax, Resin and Asphaltene Content. Chinese Standard: Singapore, 2004.
  35. ASTM Standard D-97; Standard Test Method for Pour Point of Petroleum Products. ASTM: West Conshohocken, PA, USA, 2022.
Figure 1. Crude oil sample.
Fluids 09 00121 g001
Figure 2. XRD patterns of MNPs recovered from coal fly ash.
Fluids 09 00121 g002
Figure 3. Size distribution curve of MNPs recovered from coal fly ash.
Fluids 09 00121 g003
Figure 4. Observed pour point values for crude oil samples in presence of PPD additives.
Fluids 09 00121 g004
Figure 5. Viscosity curves of crude oil sample at different temperatures.
Fluids 09 00121 g005
Figure 6. Viscosity curves of the crude oil sample at 10 °C in the presence of PPDs.
Fluids 09 00121 g006
Figure 7. DSC analysis comparing untreated oil and oil treated with PPDs.
Fluids 09 00121 g007
Figure 8. Polarized optical microscopy images of crude oil samples at 10 °C: (a) undoped sample, (b) 0.25% PE in hexane + 1% MNPs, and (c) 0.25% PE in hexane + 2% MNPs.
Fluids 09 00121 g008
Table 1. Composition of prepared PPDs.
Sample #PPDs Composition
10.25% PE in hexane (0.25% PES)
20.5% PE in hexane (0.5% PES)
31.0% PE in hexane (1.0% PES)
41.5% PE in hexane (1.5% PES)
52.0% PE in hexane (2.0% PES)
60.25% PE in hexane (0.25% PES) + 1% MNPs
70.5% PE in hexane (0.5% PES) + 1% MNPs
81.0% PE in hexane (1.0% PES) + 1% MNPs
91.5% PE in hexane (1.5% PES) + 1% MNPs
102.0% PE in hexane (2.0% PES) + 1% MNPs
110.25% PE in hexane (0.25% PES) + 2% MNPs
120.5% PE in hexane (0.5% PES) + 2% MNPs
131.0% PE in hexane (1.0% PES) + 2% MNPs
141.5% PE in hexane (1.5% PES) + 2% MNPs
152.0% PE in hexane (2.0% PES) + 2% MNPs
Table 2. Characteristics of crude oil sample.
CharacteristicValue
density at 25 °C, g/cm30.8531
dynamic viscosity at 25 °C, mPa × s185.9
wax content, wt %19.1
pour point, °C18
Disclaimer/Publisher’s Note: The statements, opinions and data contained in all publications are solely those of the individual author(s) and contributor(s) and not of MDPI and/or the editor(s). MDPI and/or the editor(s) disclaim responsibility for any injury to people or property resulting from any ideas, methods, instructions or products referred to in the content.

