Abstract
Curved free shear layers emerge in many engineering problems involving complex flow geometries, such as the flow over a backward-facing step, flows with wall injection in a boundary layer, the flow inside side-dump combustors, or wakes generated by vertical axis wind turbines, among others. Previous studies involving centrifugal instabilities have mainly focused on wall-flows where Taylor instabilities between two rotating concentric cylinders or Görtler vortices in boundary layers are generated. Curved free shear layer flows, however, have not received sufficient attention, especially in the nonlinear regime. The present work investigates the development of centrifugal instabilities in a curved free shear layer flow in the nonlinear compressible regime. The compressible Navier–Stokes equations are reduced to the nonlinear boundary region equations (BREs) in a high Reynolds number asymptotic framework, wherein the streamwise wavelength of the disturbances is assumed to be much larger than the spanwise and wall-normal counterparts. We study the effect of the freestream Mach number , the shear layer thickness , the amplitude of the incoming disturbance A, and the relative velocity difference across the shear layer on the development of these centrifugal instabilities. Our parametric study shows that, among other things, the kinetic energy of the curved shear layer flow increases with increasing and A decreases with increasing . It was also found that increasing the disturbance amplitude of the incoming disturbance leads to significant growth in the mushroom-like structure’s amplitude and renders the secondary instability structures more prominent, indicating increased mixing for all Mach numbers under consideration.
1. Introduction
The stability of curved shear layer flows depends on the velocity difference across the shear layer and the radius of the curvature. For a free shear layer with no curvature, known as a plane shear layer, the Kelvin–Helmholtz instability is the dominant mechanism [1]. In this case, the two-dimensional disturbances are more unstable than their three-dimensional counterpart [2], and the Kelvin–Helmholtz instability introduces predominantly spanwise-oriented vortices. Rayleigh [3] proved that the presence of an inflection point in the basic velocity profile is a necessary condition for the Kelvin–Helmholtz instability. On the other hand, for a curved mixing layer flow with an inflectional velocity profile, the Kelvin–Helmholtz instability mechanism is still present, along with centrifugal instabilities in the form of streamwise-oriented Görtler-type vortices (Jackson and Grosch [4] showed that compressibility further weakens the Kelvin–Helmholtz instability mechanism in high-speed curves mixing layers). As a practical application of these centrifugal instabilities in high-speed flows, we can mention supersonic mixing between the oxidizer and the fuel in high-powered scramjet engines. It was found that the mixing in scramjet engines is a very complex and important phenomenon because inefficient mixing can lead to partial burning, which will ultimately affect the engine efficiency significantly. One way to increase the mixing is to insert a thin splitter plate into the mixing layer, which causes rapid variation of velocity in proximity to the solid boundary. Under these conditions, supersonic curved mixing layers can easily develop because of the curvature stemming from the drop in the pressure across the layer (Lin and Stephen [5]).
Görtler vortices appear inside a boundary layer flow along a concave surface due to the imbalance between radial pressure gradients and centrifugal forces (e.g., Görtler [6], Hall [7], Swearingen and Blackwelder [8]). For highly curved walls, for example, vortex formation occurs more rapidly and can significantly alter the mean flow causing the laminar flow to transition into turbulence. Under certain conditions, Görtler vortices can be efficient precursors to transition. The growth rate of these counter-rotating streamwise vortical structures depends on the surface curvature and the receptivity of the boundary layer to freestream disturbances and surface imperfections.
Several previous theoretical and numerical studies covered centrifugal instabilities in incompressible curved free shear layer flows. Plesniak et al. [9,10] conducted extensive experimental measurements investigating curved two-stream mixing layers to show how centrifugal effects yield streamwise vortices, with tripped and untripped initial boundary layers. The untripped case within this suite of experiments resulted in higher streamwise vorticity in the unstable case. In the tripped case, streamwise vorticity was not produced in the downstream mixing layers. The main effect of tripping was to reduce the growth of the unstable case. Hu et al. [11] and Liou [12] focused on the effect of the curvature on the inflectional Rayleigh modes, which they found to be minimal, although the curvature excites an unstable three-dimensional disturbance with the amplitude increasing as the streamwise wavenumber decreases. The analytical and numerical study of Otto et al. [13] showed that the unstable modes largely depend on surface curvature. They also employed numerical simulations to solve the parabolic equations, assuming that the wavenumber and Görtler number are both of order one. They found that as the difference between the freestream speeds increased, the layer became more susceptible to centrifugal instabilities. Otto and Cole [14] studied the development of centrifugal instabilities in curved shear layers in the linear regime, showing that the evolution of the modes is strongly dependent on the initial disturbances and that the downstream behavior approaches a common structure. Sarkies and Otto [15] showed that centrifugal instabilities can develop in curved compressible shear layers and that there are several similarities with the incompressible counterpart, such as the effect of changing the curvature or the velocity difference across the shear layer. Lin and Stephen [5] investigated a curved compressible mixing layer focusing on the wake effect that was triggered by a splitter plate inserted into the stream. The linear Görtler mode was analyzed using the Gaussian model, the composite wake flow model, and the numerical model, and it was shown that the modes could exist within both the stable and the unstable curved compressible mixing layers (see also Lin [16]).
In the present work, we directly predict and analyze the development of nonlinear centrifugal instabilities in high-speed compressible curved free shear layer flows via an efficient numerical algorithm based on the nonlinear boundary region equations (NBREs)—a parabolized version of the Navier–Stokes equations under the assumption that the streamwise wavenumber associated with the disturbances is much smaller than the cross-flow wavenumbers. The main objective is to show that this mathematical model can be utilized to efficiently predict nonlinear centrifugal instabilities in curves shear layers. The study considers the effects of a wide range of supersonic Mach numbers, the amplitude of the freestream disturbance, A, the shear layer thickness, , and the velocity difference across the shear layer, , on the development and growth of these centrifugal instabilities. The study shows that, among other things, the kinetic energy level of the curved shear layer flow increases with increasing and A while it increases with decreasing . Increasing the disturbance amplitude A induces larger instability structures, as expected, which may be beneficial for enhancing mixing. It was also found that the location of the maximum energy moves farther downstream as the freestream Mach number increases.
2. Problem Formulation and Numerical Algorithm
2.1. Scalings
All dimensional spatial coordinates are normalized by the spanwise wavelength , while the dependent variables are normalized by their respective freestream values, except pressure, which is normalized by the dynamic pressure:
where is the spanwise wavelength of the disturbances, are the velocity components, the density, is pressure, temperature, dynamic viscosity, and thermal conductivity. All quantities with ∞ at the subscript represent conditions at infinity.
The Reynolds number based on the spanwise wavelength, Mach number, and Prandtl number is defined as follows:
where , and are the freestream dynamic viscosity, speed of sound, and thermal conductivity, respectively, and is the specific heat at constant pressure. We define the global Görtler number as
where is the radius of the curvature.
2.2. Boundary Region Equations: A Parabolized Form of the Navier–Stokes Equations
If the streamwise wavenumbers of the disturbances evolving inside the shear layer are much larger than the wavenumbers corresponding to the cross-flow directions, then the Navier–Stokes equations can be transformed into a parabolic set of equations in the framework of high Reynolds number asymptotics.
For a fully compressible Newtonian flow, the Navier–Stokes equations with non-dimensional variables are considered here in the vector form:
where is the vector of conservative variables,
, , and are the flux vectors, including both the inviscid and viscous terms,
is density, p is pressure, T is temperature, u, v, and w are the velocity components, and E is the total energy. The shear stress components are as follows:
and the heat fluxes are as follows:
where k is thermal conductivity and is the Prandtl number. The dynamic viscosity, , and thermal conductivity, k, are linked to the temperature using a power law, which is given here in dimensionless form,
where (Ricco and Wu [17]), , , and for air.
We rescale the streamwise distance and time co-ordinates at which the vortex system forms by the following variables: , and the time as . In this region, the cross-flow velocity component is small compared to the streamwise velocity component, and pressure variations are negligible. Appropriate dominant balance considerations suggest that the dependent variables in this region must also be rescaled as follows:
Working out the order-of-magnitude analysis of the Navier–Stokes equations, we obtain the parabolic set of equations, which we refer to as the nonlinear compressible boundary region equations (NCBREs):
where is the velocity vector and is the cross-flow nabla operator:
The effect of the wall curvature is contained in the term involving the global Görtler number in the second-momentum equation.
A small artificial disturbance is imposed at the inflow boundary in the following form:
where A is a small amplitude. The equation for the inflow disturbance (21) does not satisfy the continuity equation, but since the amplitude is small, its effect on the base flow is considered negligible. is the spanwise wavelength of the centrifugal instabilities, and represents the extent of the disturbance in the y direction. In the present work, is kept constant at 0.8 cm. Es-Sahli et al. [18] elaborately studied the effect of on the development of centrifugal instabilities in curved free shear layers. Periodic conditions are imposed in the spanwise direction, and extrapolation conditions are imposed at the top and bottom boundaries. The equations are solved using the algorithm from Es-Sahli et al. [19] and previously developed by Sescu and Thompson [20]. We slightly adjust the algorithm to accommodate the free shear layer setting. The model employs second- and fourth-order finite-difference schemes to discretize the spatial derivatives in the flow-normal and spanwise directions, respectively. A staggered arrangement is employed in the flow-normal direction to prevent decoupling between the velocity and pressure. The numerical model utilizes a first-order finite-difference marching scheme in the streamwise direction and converges the equations using a nonlinear time relaxation method.
3. Results
In this section, we present and discuss results from numerical simulations. The flow domain is split into ‘fast’ and ‘slow’ streams, both having velocities and , respectively, which we define as and , where is the relative velocity difference (here, we set this difference at four levels, , , , and ). The temperature in the fast stream is set to , while in the slow stream is set to . In our parametric study, we consider three Mach numbers in the fast stream of , , and , respectively (the lowest velocity in the slow stream will correspond to a Mach number of ). We also consider three values for the shear layer thickness at the inflow boundary corresponding to , , and , where the velocity variation between the fast and slow streams is modeled via a hyperbolic tangent function , with representing the location of the shear layer. A similar function is used to model the variation of the temperature in the shear layer, with the same thickness, although in reality, the thickness of the thermal layer may be slightly different.
The Reynolds number, , based on the faster freestream and the spanwise wavelength of the disturbance and the global Görtler number, , are maintained constant for all cases, at and , respectively (the kinematic viscosity and the curvature of the wall were varied to achieve constant and for all simulations). The grid is uniform in the spanwise direction taking into account that the flow is periodic in this direction, while in the radial direction, the grid is stretched towards the top and bottom far-field boundaries. The marching in the streamwise direction is achieved by means of an explicit Euler method, with equally-spaced discretization. At the inflow boundary, centrifugal instabilities are excited by the non-dimensional artificial disturbance in Equation (21) imposed on the base flow at the inflow boundary, with the amplitude set at .
The kinetic energy distribution of the vortex is calculated as follows:
where , , and are the spanwise-mean components of velocity, and and are the coordinates of the boundaries in the spanwise direction (note that the energy here is scaled by ). In Equation (22), we use and ∞ as the limits of the second integral, but in our calculations, we evaluate the integrals from the bottom to the upper boundary.
We perform a grid convergence analysis to ensure the grid resolution is appropriate. In Figure 1, we plot the vortex energy for different grid counts: 960,000 grid points for grid 1; 1,440,000 grid points for grid 2; 2,260,000 grid points for grid 3; 3,480,000 grid points for grid 4; and 4,800,000 grid points for grid 5. It shows that the curves corresponding to the last two grid counts (grid 4 and grid 5) are very close to each other. As a result, grid 4 is adopted for all simulations in the parametric study that follows.
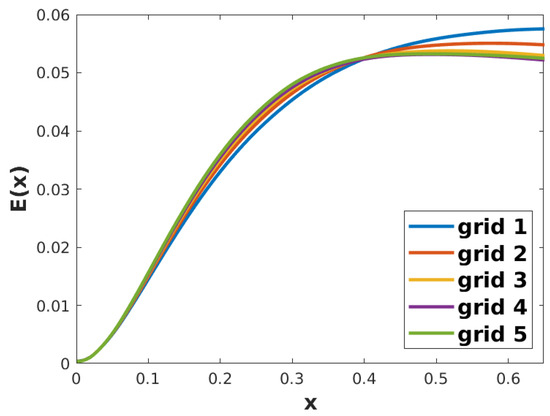
Figure 1.
Vortex energy distribution for different grid counts; , , .
Figure 2, Figure 3 and Figure 4 present consecutive contour plots depicting the magnitude of cross-flow velocity for different Mach numbers and velocity differences , with the shear layer thickness set to . The color scheme represents the flow velocity, with white at the top indicating the fast stream and black at the bottom indicating the slow stream. These contour plots illustrate the progression of the centrifugal instabilities in the streamwise direction; we hypothesize that the incoming disturbance is sufficiently high to allow the centrifugal instabilities to take over the Kelvin–Helmholtz-type instabilities (this mathematical model is not capable of predicting Kelvin–Helmholtz-type instabilities because the problem is steady and the system of equations is parabolic). To characterize the shape of the centrifugal instabilities, we identify two types of structures: “primary” and “secondary”. The primary flow structure refers to the mushroom-like formation that evolves as the main instability, as exemplified by the panel of the first row of Figure 2. On the other hand, the secondary structures are elongated features that emerge from the edges of the primary flow structure, as seen, for example, in the panel of the second row in Figure 3.
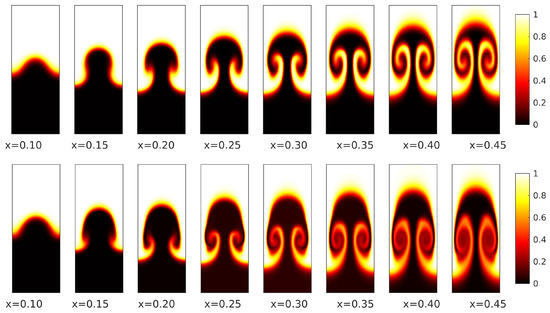
Figure 2.
Contour plots of the streamwise velocity at different streamwise locations for and : top—; bottom—.
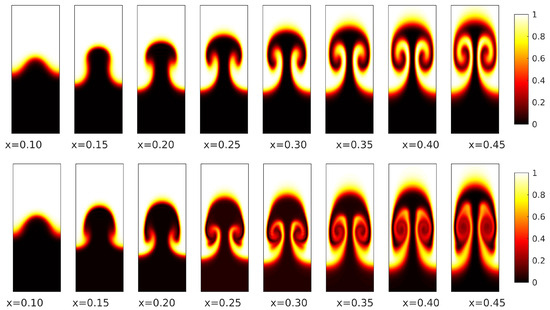
Figure 3.
Contour plots of the streamwise velocity at different streamwise locations for and : top—; bottom—.
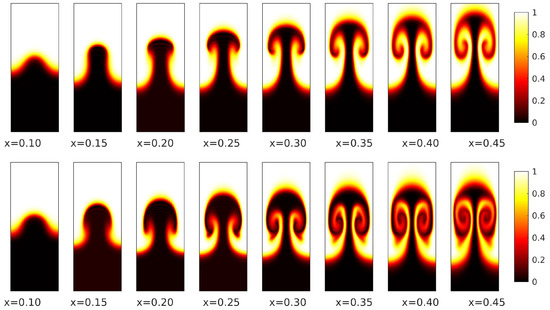
Figure 4.
Contour plots of the streamwise velocity at different streamwise locations for and : top—; bottom—.
By comparing the first and second rows in Figure 2, Figure 3 and Figure 4, we notice that increasing the velocity difference across the shear layer, , accelerates the development of mushroom-like primary structures and makes the secondary structures more prominent. The color transition from black to white seen in the bottom rows of each of these figures suggests that the mixing in the shear layer is more predominant when the velocity difference across the shear layer is higher. Comparing the centrifugal instabilities at the same streamwise coordinate across various Mach numbers, we observe a delay in the growth of the mushroom-like structures as increases. We also observe that the flow structures become thinner as the Mach number increases. For instance, in the panel of the first row in Figure 2, for which , the mushroom structure has already begun to develop, whereas in the corresponding panel of Figure 4, where , the mushroom shape has not yet developed. This finding suggests that, for high Mach number free shear layer flows, the same mixing efficiency is achieved further downstream.
To quantify the thermal effects of these instabilities, vertical profiles of temperature disturbance , where is the spanwise-mean component of temperature , through the center of the mushroom shape are included in Figure 5, Figure 6 and Figure 7. The profiles are compared to each other for different shear layer thicknesses and different velocity difference levels across the shear layer. They all show that increasing the thickness of the shear layer increases the temperature disturbance and that this increase is slightly less significant at high Mach numbers. As expected, increasing the velocity difference across the shear layer increases the amplitude levels of the temperature disturbance at all Mach numbers. Also, the vertical extent of these disturbances seems to increase with increasing the velocity difference, especially towards the slow stream (for example, in Figure 5, the top boundary of the disturbance is roughly in for all velocity differences, while the bottom boundary is roughly in for and in for ).
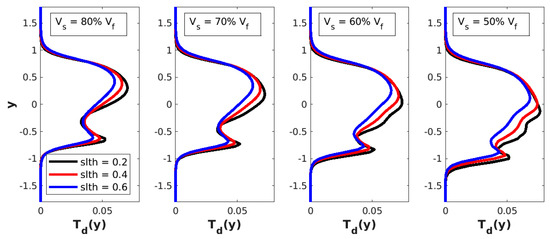
Figure 5.
Profiles of temperature disturbance for the case.
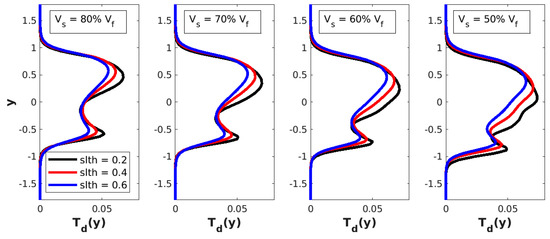
Figure 6.
Profiles of temperature disturbance for the case.
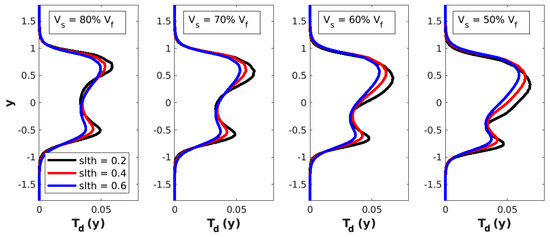
Figure 7.
Profiles of temperature disturbance for the case.
In Figure 8, Figure 9 and Figure 10, we plot the energy for different values of and in Figure 11 we plot the same energy for different values of . The disturbance energy increases with increasing as it is highest for and decreases as is reduced for all considered cases. Moreover, the streamwise location of the energy saturation (the point at which the energy starts to level off) moves farther downstream as decreases, especially for higher Mach numbers (see Figure 10). On the other hand, as seen in Figure 11, increases with decreasing , which may be explained by the presence of viscous effects which are more predominant in thicker shear layers. In this figure, we superpose the smallest (solid line) and the highest (dashed line) velocity difference levels, indicating that the trend is the same for both (the other two velocity difference levels fall in between). We must point out that the energy reduction due to the increase in the shear layer thickness is rather significant, perhaps because the variation of the shear layer thickness is substantial (the largest is three times greater than the smallest ).

Figure 8.
Vortex energy distribution of different parametric settings for the case.

Figure 9.
Vortex energy distribution of different parametric settings for the case.

Figure 10.
Vortex energy distribution of different parametric settings for the case.

Figure 11.
Effect of the shear layer thickness variation on the vortex energy distribution for (solid lines) and (dashed lines): (a) ; (b) ; (c) .
4. Conclusions
We investigated the nonlinear development of centrifugal instabilities in a compressible curved free shear layer flow using the numerical solution to the boundary region equations, a parabolized version of the Navier–Stokes equations. Our focus was on understanding the characteristics of these centrifugal instabilities, which exhibit similarities to Görtler vortices that develop in the boundary layer flows over concave surfaces. The study encompasses variations in the free stream Mach number (), the relative velocity difference between the two streams of the shear layer (), the shear layer thickness (), and the amplitude of the inflow disturbance (A).
Upon closer examination of the kinetic energy plots for the case in Figure 8, we observe that increases with increasing and increases with decreasing across all the considered Mach numbers. However, the increase in shear layer thickness has an insignificant effect on energy reduction, with a mere drop in E resulting from a increase in , as evident in Figure 11. Furthermore, increasing the amplitude of the inflow disturbance slightly boosts the kinetic energy, with less than a increase in E observed for a increase in A. Interestingly, a larger magnitude of A hampers the influence of the relative velocity difference. The energy curves corresponding to different values exhibit a considerably reduced gap when comparing the and cases. Similar trends were observed in the parametric study of centrifugal instability development for the and cases.
Examining the contour plots of cross-flow velocity magnitude in Figure 2, Figure 3 and Figure 4 for , we find that increasing the disturbance amplitude leads to significant growth in the mushroom-like structure’s amplitude and renders the secondary structures more visible, indicating increased mixing for all Mach numbers under consideration. When comparing different Mach numbers at the same cross-flow plane location, we observe a slower development of mushroom-like structures as increases, suggesting that achieving the same mixing efficiency would require longer shear layers for higher Mach numbers. Consequently, numerical simulations for higher Mach number cases would incur higher computational costs due to the need for larger grid sizes to maintain comparable mixing efficiency.
Author Contributions
Conceptualization, O.E.-S., A.S. and Y.H.; methodology, O.E.-S.; validation, O.E.-S., A.S. and Y.H.; formal analysis, O.E.-S.; investigation, O.E.-S. and A.S.; writing—original draft preparation, O.E.-S., A.S. and Y.H.; writing—review and editing, O.E.-S., A.S. and Y.H. All authors have read and agreed to the published version of the manuscript.
Funding
This research received no external funding.
Data Availability Statement
The data presented in this study are available on request from the corresponding author.
Conflicts of Interest
The authors declare no conflicts of interest.
References
- Michalke, A. On spatially growing disturbances in an inviscid shear layer. J. Fluid Mech. 1965, 23, 521. [Google Scholar] [CrossRef]
- Squire, H.B. On the stability of three-dimensional disturbances of viscous flow between parallel walls. Proc. R. Soc. Lond. Ser. A 1933, 142, 621. [Google Scholar]
- Rayleigh, L. On the stability, or instability of certain fluid motions. Proc. Lond. Math. Soc. 1880, 11, 57. [Google Scholar] [CrossRef]
- Jackson, T.L.; Grosch, C.E. Inviscid spatial stability of a compressible mixing layer. J. Fluid Mech. 1989, 208, 609. [Google Scholar] [CrossRef]
- Lin, L.; Stephen, S.O. Centrifugal instabilities in curved compressible wakes. Phys. Fluids 2009, 21, 104103. [Google Scholar] [CrossRef]
- Görtler, H. Instabilita-umt laminarer Grenzchichten an Konkaven Wanden gegenber gewissen dreidimensionalen Storungen. J. Appl. Math. Mech. (ZAMM) 1941, 21, 250–252. [Google Scholar] [CrossRef]
- Hall, P. Taylor-Görtler vortices in fully developed or boundary-layer flows: Linear theory. J. Fluid Mech. 1982, 124, 475–494. [Google Scholar] [CrossRef]
- Swearingen, J.D.; Blackwelder, R.F. The growth and breakdown of streamwise vortices in the presence of a wall. J. Fluid Mech. 1987, 182, 255–290. [Google Scholar] [CrossRef]
- Plesniak, M.W.; Mehta, R.D.; Johnson, J.P. Curved two-stream turbulent mixing layers: Three-dimensional structure and streamwise evolution. J. Fluid Mech. 1994, 270, 1–50. [Google Scholar] [CrossRef]
- Plesniak, M.W.; Mehta, R.D.; Johnson, J.P. Curved two-stream turbulent mixing layers revisited. Exp. Therm. Fluid Sci. 1996, 13, 190–205. [Google Scholar] [CrossRef]
- Hu, F.Q.; Otto, S.R.; Jackson, T.L. On the stability of a curved mixing layer. In Transition, Turbulence and Combustion; Hussaini, M.Y., Gatski, T.B., Jackson, T.L., Eds.; Springer: Dordrecht, The Netherlands, 1994; pp. 107–116. [Google Scholar]
- Liou, W.W. Linear instability of curved free shear layers. Phys. Fluids 1994, 6, 541–549. [Google Scholar] [CrossRef]
- Otto, S.R.; Jackson, T.L.; Hu, F.Q. On the spatial evolution of centrifugal instabilities within curved incompressible mixing layers. J. Fluid Mech. 1996, 315, 85–103. [Google Scholar] [CrossRef]
- Otto, S.R.; Cole, T.R. Görtler vortices in curved mixing layers and their effect on the inherent instabilities. In Proceedings of the 14th Australasian Fluid Mechanics Conference, Adelaide, Australia, 10–14 December 2001. [Google Scholar]
- Sarkies, J.M.; Otto, S.R. Görtler vortices in compressible mixing layers. J. Fluid Mech. 2001, 427, 359–388. [Google Scholar] [CrossRef]
- Lin, L. Centrifugal Instability of Wake Dominated Curved Compressible Mixing Layers. Ph.D. Thesis, The University of Birmingham, Birmingham, UK, 2008. [Google Scholar]
- Ricco, P. Response of a Compressible Laminar Boundary Layer to Freestream Turbulence. Ph.D. Thesis, University of London, London, UK, 2006. [Google Scholar]
- Es-Sahli, O.; Sescu, A.; Afsar, M. Nonlinear centrifugal instabilities in curved free shear layers. In Proceedings of the AIAA Scitech 2020 Forum, Orlando, FL, USA, 6–10 January 2020. [Google Scholar]
- Es-Sahli, O.; Sescu, A.; Afsar, M.; Hattori, Y. Investigation of Görtler vortices in high-speed boundary layers via an efficient numerical solution to the non-linear boundary region equations. Theor. Comput. Fluids Dyn. 2021, 36, 237–249. [Google Scholar] [CrossRef]
- Sescu, A.; Thompson, D. On the Excitation of Görtler Vortices by Distributed Roughness Elements. Theor. Comput. Fluids Dyn. 2015, 29, 67–92. [Google Scholar] [CrossRef]
Disclaimer/Publisher’s Note: The statements, opinions and data contained in all publications are solely those of the individual author(s) and contributor(s) and not of MDPI and/or the editor(s). MDPI and/or the editor(s) disclaim responsibility for any injury to people or property resulting from any ideas, methods, instructions or products referred to in the content. |
© 2024 by the authors. Licensee MDPI, Basel, Switzerland. This article is an open access article distributed under the terms and conditions of the Creative Commons Attribution (CC BY) license (https://creativecommons.org/licenses/by/4.0/).