Abstract
Bend sections are ubiquitous in natural sandy river systems. This study employs Computational Fluid Dynamics–Discrete Phase Model (CFD-DPM) methodology to analyze particle transport dynamics in U-bend channel flows, focusing on the distinctions between partially vegetated (Case No.1) and non-vegetated (Case No.2) scenarios. The research aims to unravel the intricate relationships among bending channel-induced secondary flow, vegetation blockage, and particle aggregation, employing both quantitative and qualitative approaches. (I) The key findings reveal that vegetation near the inner walls of curved channels markedly diminishes the intensity of secondary circulation. This reduction in circulation intensity is observed not only within vegetated areas but also extends to adjacent non-vegetated zones. Additionally, the study identifies a close correlation between vertical vortices and particle distribution near the channel bed. While particle distribution generally aligns with the vortices’ margin, dynamic patch-scale eddies near vegetation patches induce deviations, creating wave-like patterns in particle distribution. (II) The application of the Probability Density Function (PDF) provides insights into the radius-wise particle distribution. In non-vegetated channels, particle distribution is primarily influenced by secondary flow and boundary layers. In contrast, the presence of vegetation leads to a complex mixing layer, altering the particle distribution pattern and maximizing PDF values in non-vegetated free flow subzones. (III) Furthermore, the research quantifies spatial–temporal sediment heterogeneity through PDF variance. The findings demonstrate that variance in non-vegetated channels increases towards the outer wall in bending regions. Vegetation-induced turbulence causes higher variance, particularly in the mixing layer subzone, underscoring the significance of eddy size in sediment redistribution. (IV) The study of vertical concentration profiles in vegetated U-bend channels offers additional insights, while secondary flow in non-vegetated channels facilitates upward sediment transport and vegetation presence, although increasing the Turbulent Kinetic Energy (TKE), restricts channel space, and impedes secondary flow, thereby reducing vertical particle suspension. Sediment concentrations are found to be higher in the lower layers of vegetated bends, contrary to the pattern in non-vegetated bends. These findings highlight the complex interplay between vegetation, secondary flow, and sediment transport, illustrating the reduced effectiveness of secondary flow in promoting vertical particle transportation in bending channels due to the vegetation obstruction.
1. Introduction
Meandering rivers are ubiquitous in the lowland of our planet, and the curved sections of those rivers provide spaces of the diverse ecosystems and human society [1,2]. Meandering channels have special dynamic growth processes compared to the straight, braided, or anastomosing channels. The lateral migration of the bending section results from the erosion of the outer bank, as well as the concurrent sedimentation in the inner bank. Many researchers believe that aquatic vegetation can improve channels’ stability due to its sediment retention function and by physically strengthening the channel banks [1,3,4,5,6,7]. Furthermore, Lelpi et al. drew a significant conclusion that the anthropogenic removal of the vegetation cover in the meanders of rivers can speed up the migration rate to an order of magnitude compared to that of a vegetated meander channel [1]. The presence of vegetation plays an essential role not only in the morphology development for the long term but also in the instantaneous suspended sediment dispersion in the short term [8,9]. However, there are a very few investigations on the mechanism of the combined effects of riparian vegetation in bending channels on the dispersion of suspended sediments. Hence, this study aims to investigate the interactions between the vegetation, the U-bend channel, and the suspended sediment transportation.
Previous studies [10,11,12] have achieved good understanding of the turbulent flow in U-bend bare (non-vegetated) channel flow, which is characterized by a mainstream flow and a secondary flow (helical flow). The secondary flow is composed of the main circulation cell and one or more small circulation cells close to the outer space of the cross-section. The main circulation cell is generated from the non-equilibrium between the centrifugal force and the transverse pressure gradient, while the outer-band cell is formed from the Reynolds stress distribution [10,11,12]. As compared to the bare U-bend channel case, the presence of the vegetation patch (VP) in the meander region or bending channel significantly changes the flow field of the channel [10,13,14,15,16]. Although fruitful conclusions on flow–vegetation–sediment interactions were achieved for a straight channel, study of the flow–vegetation–sediment interactions in a U-bend channel is rare [17,18].
To study the flow characteristics of a partially vegetated U-bend channel flow, a 3D Unsteady Reynolds-Averaged Navier–Stokes (URANS) numerical method with the isotropic k − ε turbulent model was adopted by [16]. Huai et al. concluded that the presence of vegetation diminishes the main circulation cell in the vegetation region and significantly decreases the magnitude of the bed shear stress [16]. Their study provides a good pre-knowledge for the suspended particles’ transport in the partially vegetated U-bend channel flow to be studied here. Termini conducted an experimental analysis of the effects of vegetation on flow structures and the bed shear stress in high-curvature bends [19]. After comparing the flow structures in the vegetated bending channel to that of the bare (non-vegetation) bending channel, Termini concluded that the presence of the vegetation stems disturbed the growth of the secondary flow and redistributed the highest bed shear stress away from the outer bank. Mera et al. used the anisotropy invariant technique to identify strong three-dimensional turbulent structures in the interface between the main channel and the floodplain by means of analyzing the physical experimental data of a real compound meandering River Mero [20]. Termini and Leonardo followed up with their experiments and focused on the investigation of turbulent structures and coherent motion in high-curvature channels with submerged vegetation. They highlighted the contribution of turbulence to the lateral diffusion [21]. In particular, the turbulent ejection events dominate the outer bank region at the apex section, which could cause the incipient of sediment. Farzadkhoo et al. studied the effects of vegetation density and the relative flow depths on the pollutant (passive scalar) transport in a compound meandering channel [22]. They found that both the maximum Turbulent Kinetic Energy (TKE) and the maximum dimensionless longitudinal dispersion coefficient occurred at the apex of the bend region for all vegetation densities.
Nevertheless, to date, previous studies [23,24,25,26] have been conducted for fully or partially vegetated channel flow focused on the momentum or the passive scalar transport in meander or bending waterways. Researchers have gradually unveiled the nonlinear interactions among the main flow, secondary flow, blockage of VP, and even coupled pollutant transport events. Unfortunately, there are very limited numerical studies focused on the discrete suspended sediment transport in partially vegetated bending channel flow, accounting for the discrete nature of particles and the time lag between the particles’ motion to the flow swirls because of the inertia of the particles.
The dispersion of particles in vegetated waterways can be simulated using an Eulerian (Scalar transport) or Lagrangian method (DPM, DEM, Random Walk Model, etc.) coupled with a flow field solver. The Eulerian method has been widely used in previous works. For instances, Cheng et al. and Lopez and Garcia studied vegetated sandy flow by modelling particle parcels as concentration of a passive scalar and solving a concentration convection–diffusion equation [27,28]. Huai et al. and Li et al. used a simplified one-dimensional concentration convection–diffusion equation to predict vertical concentration profiles [29,30]. However, all of those studies needed to select a correct diffusion coefficient due to the nature of the Eulerian method. This may introduce inaccuracies into the system. Thus, most previous works usually assumed that the sediment diffusion coefficient is the same as the turbulent eddy diffusion coefficient, which means the particles are very small and follow exactly the swirls in the flow. The authors of this paper share the view of [18,31] that the Eularien method can work well for fine sediment (Stk << 1) but may introduce errors for coarse-grain (or tiny-grain with Stk > 1) dispersion calculations. This is mainly because the time lag between the particles’ motion and the flow is not accounted for. The definition of the Stk number (Stokes number) is given in Equation (1).
where is the density of the particle, is the density of fluids, and Rep is the Reynolds number of a particle based on the diameter of the particle.
By contrast, the Discrete Phase Method (DPM), as one of the Lagriangan methods, predicts the motion of particles while accounting for the discrete nature of particles. The motion of each particle is governed by Newton’s Second Law. For each particle, the total forces exerted by flow, other particles, and walls are determined using a priori known formulae accounting for the effects of the boundary layer of each particle. Then, the displacement and velocity of each particle is derived by the temporal integrations of the acceleration. One big advantage of the DPM is that the errors induced by the diffusion coefficient selection required for the Eulerian approach are avoided [32,33,34]. Therefore, the DPM can better predict the interactions between the particle and turbulent structures in the partially vegetated U-bend channel flow.
Owing to the computationally expensive feature of the DPM, most previous studies employing the DPM investigated the particle-laden flow in a relatively simple geometry or with a low number of particles [32,33,35]. Yet, Wang et al. effectively employed the DPM in a high-fidelity simulation to study particle transportation in a partially vegetated straight channel, enhancing our understanding of vegetated sandy flow [36]. The present study is a follow-up study of the vegetated sandy flow, trying to reveal the diffusion mechanisms of discrete suspended sediments in a vegetated U-bend channel flow. The relationship between the preferential gathering locations of particles and the turbulent structures produced by the vegetation canopy and the helical flow is qualitatively and quantitatively studied. Numerous vertical concentration profiles are compared for vegetated and non-vegetated cases in order to explore the effects of a VP close to the inner (convex) bank. In this paper, the methodology, geometry, case study parameters, and validation are demonstrated in Section 2. Section 3 presents the simulation results and discusses the effects of the vegetation on diminishing the strength of helical flow, as well as the relationship between the particles’ locations and flow structures. The radius-wise and vertical distribution of particles are quantified by the Probability Density Function (PDF) and the variance of PDF to reveal the non-uniformity of particles in the spatial-temporal domain. The conclusions are drawn in Section 4.
2. Methodology
2.1. Numerical Method and Settings
The present study is conducted using the Eulerian–Lagrangian numerical framework. The flow is governed by Navier–Stokes Equations (2) and (3) and the turbulence effects are resolved by the Unsteady Reynolds-Averaged Navier–Stokes (URANS) model, . This is because the turbulence model is known to better reproduce the turbulence in the inner part of the boundary layers. Also, the model demonstrates good performance in handling flows that involve separation and conditions with adverse pressure gradients in the vegetation region, as compared to the standard turbulence model. It also requires much fewer computational resources than the LES model and RSM model [37]. An individual particle’s motion is predicted by Newtons’ second law. The Discrete Phase Method (DPM) is used to predict the particles’ motion. This is a two-way coupled multiphase system, and the interactions between the particles are ignored because of the low volume fraction of the particles, less than 0.1% of the fluid volume [38]. Interactions between the flow and particles are considered by adding the source term in the right-hand side of the momentum equation. The government equations of the particles are given as Equations (4) and (5). There is no initial sediment channel bed, and all particles are released from the inlet boundary. The physical mechanisms of particles’ incipient motion and vertical suspension are naturally simulated by this multiphase system. The free surface of water is captured by the Volume of Fraction (VOF) method. The inlet discharge rate is controlled as 0.03 m3/s and the water depth of the outlet is set as 0.148 m. The diameter of the particles is 100 μm, and the density of particle is 1.08 g/cm3, referring to the experiments of [39,40]. The inlet boundary condition of the particles’ concentration profile is given based on the [41], and the particles are removed when passing through the outlet of the U-bend channel.
where is the fluid volume fraction in each cell, is the fluid density, is the velocity of a fluid cell, p is the pressure produced by two phases, is the viscous stress tensor, and is the interaction force between the fluid and ith particle.
In the present investigation, the particulate system is modeled as ideal spheres, with the size of each particle being consistently less than the mesh size of the fluid phase. The particle dynamics are divided into two components: linear translation and angular rotation. These two aspects of particle movement are governed by Equations (4) and (5).
The variables , , , and represent the particle’s translational velocity, angular velocity, forces of interaction with the fluid, and the force of gravity, respectively. The terms and denote the contact forces and torques applied from particle j or a wall to particle i. represents the non-contact forces exerted on particle i by particle k or other sources. It is essential to elucidate the dynamic interplay between the fluid and particle phases in Equation (6).
The terms Fd, F∇p, F∇·τ, Fvm, FB, Fsaff, and FMag represent the drag, pressure gradient, viscous forces, virtual mass forces, Basset force, Saffman force, and Magnus force, respectively. The specific expressions for these forces are detailed in [42]. In this study, we focus on the drag, effective gravity, pressure gradient, Saffman force, and virtual mass force, while other forces are disregarded due to their minimal impact on the particle system. The particles’ motion is computed using a Lagrangian solver, which is governed by ordinary differential equations, Equations (4) and (6), to update the velocity and position of the particles at each time step.
In the fluid solver, the governing equations are discretized using the finite volume method. Time advancement is carried out with a second-order backward scheme. For the convective terms, a second-order upwind scheme, specifically Gauss linearUpwindV, is applied, while second-order central difference schemes, Gauss linear, are utilized for handling divergence and gradient operations. The PISO method is employed to complete the iteration cycle within each time step. The flow simulations achieve convergence when the residuals for all equations fall below 1 × 10⁻⁶.
2.2. Geometry and Mesh
The geometry and flow boundary conditions adopted in the present study are identical to those of the U-bend channel with a vegetation patch in Huai’s case [16]. The vegetation distribution and the vegetation density are the same as in Huai’s case. Thus, the numerical simulation can be validated with the physical experimental results. The channel width is 1.0 m, and the width of the vegetation patch (Bv) is 0.25 m. The inner radius of the bending section is 1.5 m. The inlet section and the outlet section are 5 m and 4 m, respectively. The length of the vegetation patch is 2 m in the straight sections of the inlet and outlet channel. Those vegetation stems are treated as emergent rigid cylinder array, where the diameter of the vegetation stems is 6 mm, and they are uniformly distributed with a streamwise and spanwise (or radius-wise) interval of 0.05 m.
The geometry mesh of the U-bend case is depicted in Figure 1c,d. The mesh is refined in the vegetation region to capture the detailed flow characteristics, while wall functions are utilized to approximate the boundary layer around the vegetation stems and channel walls. The length scale of the first layer of mesh around each plant is 0.5 mm. This study is a continuation of our previous investigation on U-bend channel flow [10], where the total mesh count for the vegetated U-bend channel was set at 10.5 million.
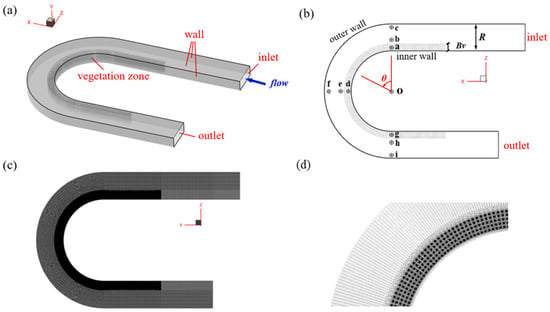
Figure 1.
The geometry and mesh of partially vegetated U-bend channel flow simulation. (a) A three-dimensional view of the U-bend channel flow. (b) Top view of the partially vegetated channel. The origin of the polar coordinate is set at point O, and the points a~g represent the locations of the vertical velocity sample positions used to validate the velocity profile. The angle, , is defined to describe the location of the cross-section in the following sections. (c) Top view of the mesh. (d) A zoomed-in view of the upper section of the mesh in the bending region.
2.3. Case Studies
To examine the impact of vegetation patches (VPs) on the transport of suspended particles in U-bend channels, a comparison is made between a partially vegetated U-bend channel case (Case No.1) and a non-vegetated U-bend channel case with a bare channel bed (Case No.2). Apart from the presence of the vegetation stripe, the inlet flow rate of 0.03 m3/s, the release of suspended sediments, and the outlet water depth of 0.148 m remain consistent in both cases.
2.4. Validations
In this section, the transportation of suspended sediments in vegetated U-bend channel simulation results are validated directly and indirectly.
- (i)
- Validations of velocity
The simulation results of velocity profiles are compared to the experimental findings by [16], as depicted in Figure 2. The comparison reveals good agreement between the numerical and physical results, indicating the satisfactory performance of the selected turbulence model, k − ω SST. The XYZ coordinates are oriented as shown in Figure 1a, with the origin located at point O, as displayed in Figure 1b. Furthermore, in the bend section of the channel, polar coordinates are also employed for presentation in the subsequent sections of this paper, with the origin of the polar coordinates also situated at point O. It is defined that R/Bv = 0 represents the inner wall, and R/Bv = 4 represents the outer wall.
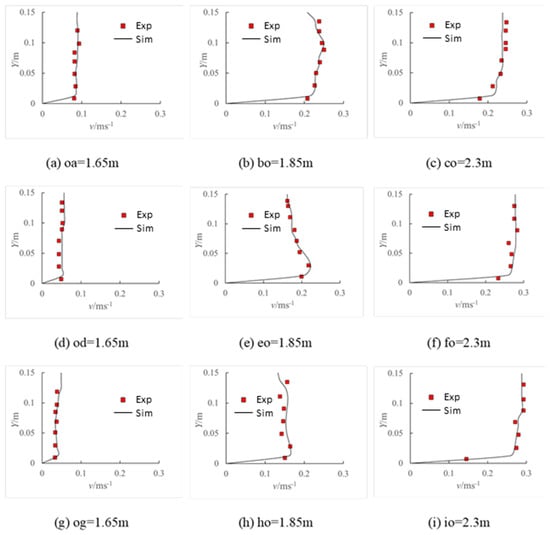
Figure 2.
Comparisons of vertical velocity profiles between the current simulation results and experimental findings from [16]. The Y coordinates are oriented as depicted in Figure 1a, with the origin at point O, as shown in Figure 1b. The locations of the sample point are indicated in Figure 1b, where the distances oa, bo, co, od, eo, fo, og, ho, and io are identified. These figures are Reprinted/adapted with permission from [16].
- (ii)
- Validation of particle deposition
To validate the predictive capability of the current CFD-DPM model for simulating the motion of individual particles, the settling velocities of single-sphere particles with two different diameters are compared to the analytical results by [43] and experimental results by [44]. Figure 3 demonstrates that the numerical results for balanced settling or deposition velocities agree well with the literature data after the acceleration process.
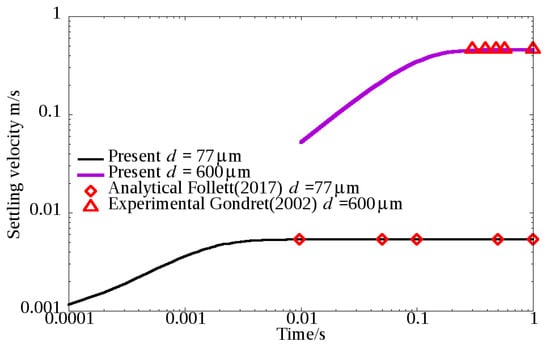
Figure 3.
Comparison of vertical settling velocity between the predictions of current CFD-DPM model and experimental findings from [43,44].
3. Results and Discussions
3.1. Diminishing the Strength of Helical Flow through Vegetation Patch
The presence of vegetation patches near the inner bank of curved river channels has a notable effect on reducing the intensity of secondary circulation, which is a key characteristic of water flow in such channels. Secondary flow within curved rivers plays a crucial role in the radial movement of suspended sediment particles. To quantitatively analyze the influence of vegetation patches on the strength of secondary circulation, the circulation intensity is defined as the integral of vortices over the cross-sectional subzones located at the curved channel.
To further analyze the impact of vegetation on circulation intensity at different positions within a cross-section, a cross-section is divided into three subzones: the non-vegetated mixing-free subzone (2 < R/Bv < 4), the mixing layer subzone (1 < R/Bv < 2), and the vegetated subzone (0 < R/Bv < 1). The vegetated subzone refers to the area sheltered by vegetation, as shown in Figure 1b, and points a,d,g are located in this subzone. The mixing layer subzone is the transitional area between the vegetated and non-vegetated regions, where the Kelvin–Helmholtz vortex dominates, and the points b, e, and h are located in this subzone, as shown in Figure 1b. The non-vegetated mixing-free subzone is the area not covered by vegetation and is less influenced by the Kelvin–Helmholtz vortex, and the points c, f, and i are in this subzone, as displayed in Figure 1b. Note that R/Bv = 0 represents the inner wall, and R/Bv = 4 represents the outer wall. The specific definitions of IV1 and IV2 are provided in Equations (7) and (8).
where is the vector of the vorticity, is the normal vector of the cross-section, is the area of vegetated subzone (0 < R/Bv < 1) within the cross-section, and is the area of non-vegetated mixing-free subzone (2 < R/Bv < 4) within the cross-section. IV1 refers to the area integrated of normal vorticity in the vegetated subzone. IV2 refers to the area integration of normal vorticity in the non-vegetated mixing-free subzone. Note that for Case No.2, IV1 and IV2 denote the integration of the same location of Case No.2 for the convenience of the comparison to IV1 and IV2 of Case No.1.
Figure 4a shows that for both Case No.1 and Case No.2, as the flow enters the curved segment, the intensity of the bend circulation gradually increases, reaching a peak and then diminishing in the vegetation planted region (0 < R/Bv < 1, where R/Bv = 0 represents the inner wall and R/Bv = 1 represents the edge of VP). We find that under the shielding effect of vegetation, the intensity of the internal secondary circulation of Case No.1 within the vegetated subzone is significantly reduced, only 7.6% of that in Case No.2. Under the partial vegetation coverage of Case No.1, the peak of IV1 occurs slightly earlier compared to Case No.2, which exhibits a later peak but with greater intensity. This can be partially explained by the mean flow rate in the vegetation subzone, of which the dramatic decrease weakens the helical flow among the stems.
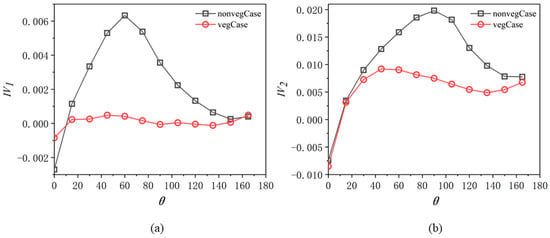
Figure 4.
Variation in IV1 and IV2 to different s, as defined in Equations (7) and (8) and illustrated in Figure 1b for the definitions of IV1, IV2, and respectively. (a) Area-integrated vortices (IV1) in the vegetation region within the channel cross-sections (0 < R/Bv < 1). (b) Area-integrated vortices (IV2) in the non-vegetated mixing-free subzone within the bending channel cross-sections (2 < R/Bv < 4).
Figure 4b indicates that for both Case No.1 and 2, as the flow enters the curved segment, the intensity of the IV2 gradually increases, reaches a peak, and then declines (2 < R/Bv < 4, where R/Bv = 4 refers to the outer wall). We note that the same scenario happens in the vegetation free subzone in Case No.1; the peak occurs earlier than that of Case No.2 but is smaller in magnitude. In contrast, under the non-vegetated bend condition IV2, the peak occurs later but with a greater intensity, up to twice that of the vegetated condition. These findings suggest that placing vegetation near the inner wall of curved river channels still has a significant weakening effect on the secondary flow circulation intensity in the non-vegetated free flow subzones. This might because the vegetation patch (VP) squeezes or narrows the secondary flow developing space, although the mean flow rate is higher in the non-vegetated free flow subzone of the partially vegetated case, and further explorations are still needed.
3.2. Relationship between the Particle Distribution and Turbulent Structures
- (i)
- Instantaneous vortices
As displayed in Figure 5a,b in Case No.2, the distribution of the Y component of vorticities (vertical component) is significantly affected by the bending side walls. The bending channel causes a shift in the main flow and alters the development of the boundary layer from the walls, resulting in the formation of high-value regions of vertical vorticity. In Case No.2, most particles are entrained towards the inner side wall through the main stream. Near the riverbed, the instantaneous gathering of suspended sediment is highly related to the distribution of the Y component of the vorticity, particularly in the regions indicated in the box in Figure 5c. This implies that the vorticity plays a crucial role in determining the re-location of particles as they move from the inlet to the bend region.
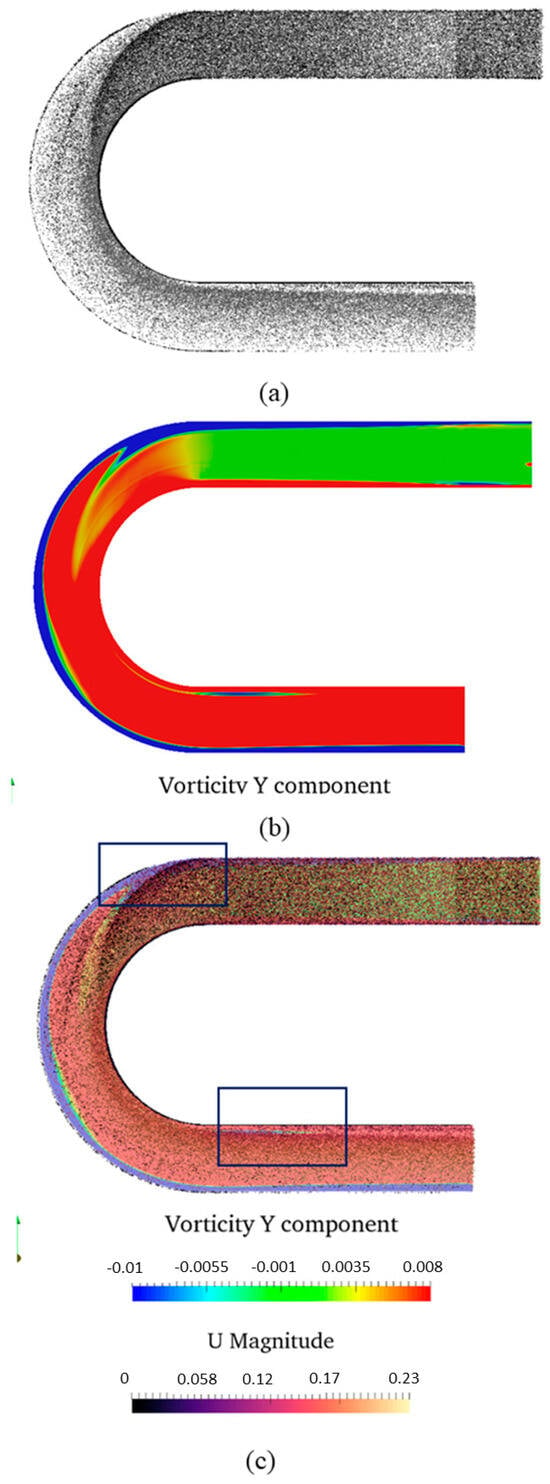
Figure 5.
The relationship between the particles’ distribution and vertical vorticity component in Case No.2. (a) An overview of the particles’ distribution in Case No.2. (b) The distribution of vertical vorticity near the bed region. (c) A combined view of the particles’ distribution and vertical vorticity.
As the water passes the bending apex and flows out of the curved section, the water tends to separate from the inner wall of the curved section and creates a zone of negative vorticity, which is shown in Figure 5c as the small blue region in the lower highlighted box. This region also coincides with the boundary where the particles are relocated, aligning with the margin of the Y component of the vertical vorticity component.
According to the observations in Figure 6a,b, the presence of vegetation stems hinders the flow in the vegetated area in Case No.1. This causes a difference in velocities between the vegetated and non-vegetated regions, resulting in the formation of a mixing layer. The generation of this mixing layer is associated with high values of vertical vorticity. Similar to the non-vegetated U-bend channel flow (Case No.2), the boundaries of particle parcels remain closely linked to the vertical vorticity (Y component). However, in the apex region, the distribution of particles roughly corresponds to the edges of vortices, as depicted in the boxed region in Figure 6c. It is noteworthy that this finding is consistent with our previous discovery in a partially vegetated straight channel flow [36].
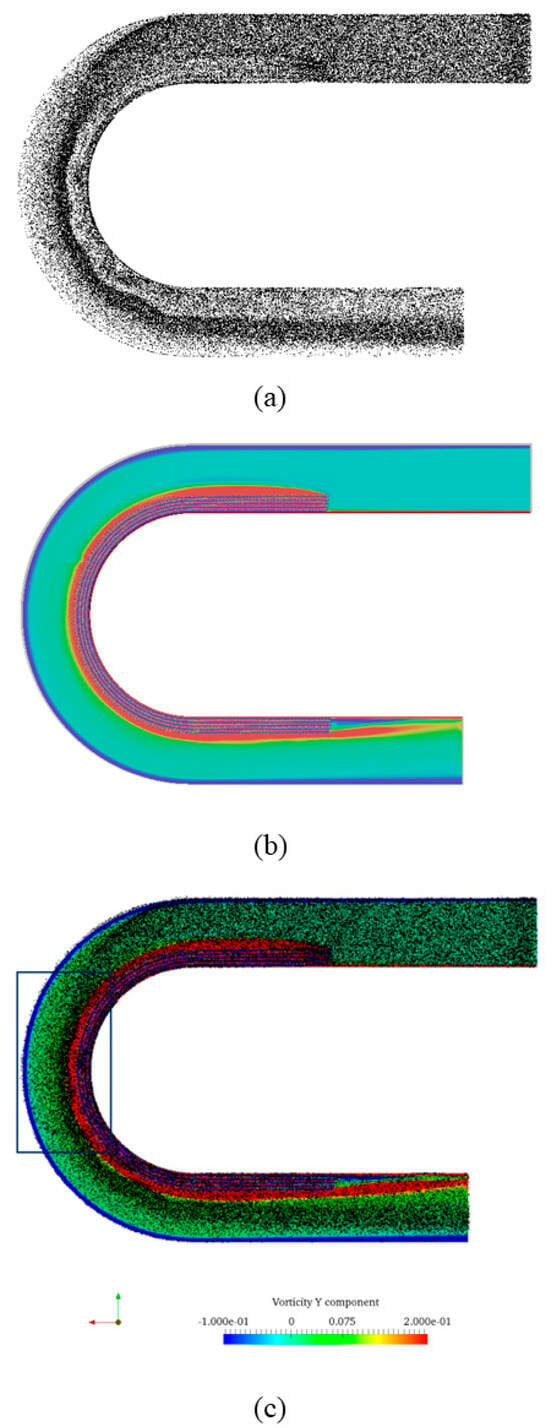
Figure 6.
The relationship between the particle distribution and vertical vorticity component in Case No.1. (a) A overview of the particles’ distribution in Case No1. (b) The distribution of the vertical vorticity in Case No.1 near the channel flow. (c) A combined view of the particles’ distribution and vertical vorticity in Case No.1.
- (ii)
- Turbulent structures
In Case No.1, the particles are transported by the patch-scale eddies generated by the mixing layer. The turbulent structures, as shown in Figure 7a using the Q-criterion, indicate the presence of these eddies. The definition of the Q-criterion is given as Equation (9). The Q-criterion have been used to visualize important vertical structures in these partially vegetated channels. These patch-scale eddies originate from the leading edge of the vegetated patch (VP) and evolve in size as they move along the interface between the vegetated and non-vegetated regions. These larger eddies exhibit continuous rotation while being attached to the edges of the VP, progressing downstream. The movement of these patch-scale eddies is crucial in determining the trajectory of particles. It is important to note that the edges of many of these larger eddies penetrate the vegetated areas, leading to the exchange of sediment between vegetated and non-vegetated regions. This is the reason why the wave-like pattern of the particle parcels does not perfectly align with the outer edge of the vorticity distribution.
where u is the velocity vector. T is the transpose operation of a matrix.
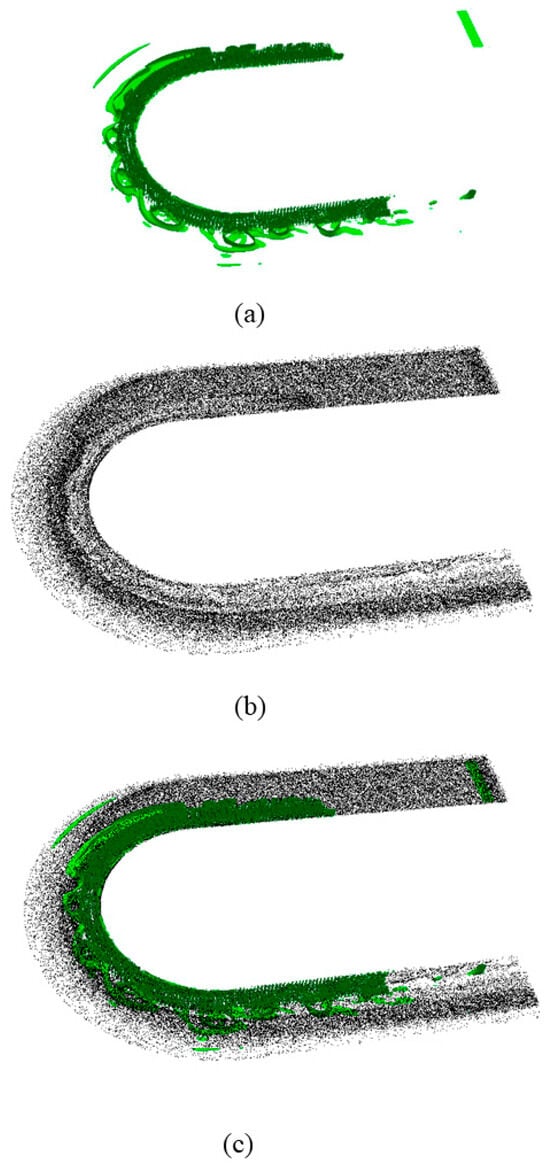
Figure 7.
The relationship between the particle distribution and vortex structures in Case No.1. (a) The distribution of the vortex structures (Q-criterion 50 s−1) in Case No.1. (b) An overview of the particle distribution in Case No.1. (c) A combined view of the particles’ distribution and vortex structures in Case No.1.
In the vegetated region, the stem-diameter length scale turbulent eddies, including the feet-generated eddies and the horizontal wakes of stems, play an important role in the vertical motion of particles and spanwise dispersion of particles in the sparse vegetated region [10]. As shown in Figure 7a–c, the length scale of the turbulent structures is much smaller than that in the vegetated region, hence causing much stronger dispersion effects.
3.3. Probability Density Function of Particles’ Distribution in Spanwise
The Probability Density Function (PDF) is defined to quantify the radius-wise distribution of the particles, which is similar to our previous study [36]. A radius-wise domain z ∊ [0, 4Bv] is marked as M regions uniformly. For the ith region, the spanwise range is where is defined by Equation (10). The definition of PDF in the ith region is given as Equation (11) and i ranges from 1 to M.
where Bv is the spanwise length scale of the VP, as shown in Figure 1b, is the time-averaged number of particles in the ith region. denotes the PDF.
As shown in Figure 8a,b, the radius-wise distribution of particles is dominated by the secondary flow and the boundary layers developing from the side walls in Case No.2. Before the flow moves into the bending section, the radius-wise distribution is relatively uniform in the far wall region, as shown in Figure 8a. As the flow moves downstream, the particles tend to gather in the inner wall’s region, as caused by the secondary flow in the U-bend channel flow. Interestingly, the radius-wise distribution of the particles shifts rapidly among the range 0° < < 75°, and the PDF reaches the most uneven PDF at = 90°. Then, as increases, the general shapes of the PDFs keep the decreasing slope from the inner wall to the outer wall continuously. Yet, there is an increase in the minimum values at R/Bv = 3.8 near the wall. Meanwhile, the PDF increases in the interval 0.2 < R/Bv < 3.8, reaching a maximum at the exit of the bend.
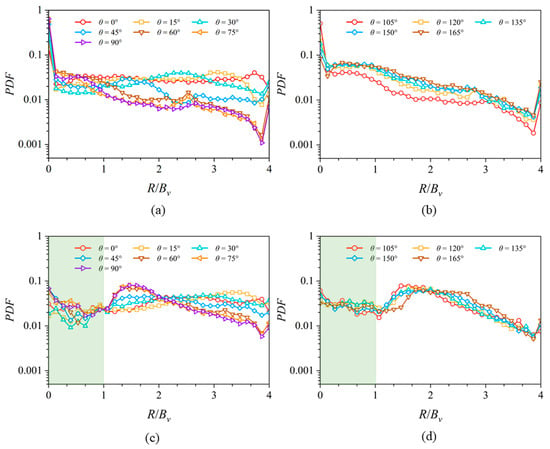
Figure 8.
Probability density functions of particles plotted in radius-wise direction along various locations. (a,b) The PDF in the non-vegetated channel flow in Case No.2. (c,d) The PDF in the partially vegetated channel flow in Case No.1. R/Bv = 0 refers to the inner wall, R/Bv = 1 refers to the edge of the VP, and R/Bv = 4 refers to the outer wall. The green shade represents the vegetated subzone within a cross section.
By contrast, as shown in Figure 8c,d, the radius-wise distribution of particles in Case No.1 is much more complicated than that of Case No.2. This is because of the combined effects of the mixing layer developing along the interface between the vegetated and non-vegetated regions, the secondary flow, and the boundary layers developed from the side walls. As seen in Figure 8c,d, the PDF’s level in the vegetated region, 0 < R/Bv < 1, (green subzone) is much less than in the neighboring region, of 1 < R/Bv < 2. This is opposite to that of the partially vegetated straight channel case [9,36]. In the straight channel case, the PDF in the spanwise (radius-wise) mixing layer is clearly smaller than that in the non-vegetated region, because the larger patch-scale eddies deplete particles out of the region [9,36]. However, the gathering of particles, in the partially vegetated U-bend channel, is still affected by the secondary flow. The secondary flow tends to locate the particles closer to the inner wall. Interestingly, as shown in Figure 8a,b, the general decreasing trend of PDF in the range 0.2 < R/Bv < 4 in the non-vegetated U-bend channel in Case No.2 and the similar trend of PDF in the range 2 < R/Bv < 4 in the vegetated U-bend channel in Case No.1 re-confirm this understanding of the inner-wall’s particle migration effects of the secondary flow.
In the following paragraphs, the effects of vegetation are analyzed by comparing the PDF at the same location. As shown in Figure 1, the U-bend channel consists of an inlet straight section, a curved section, and an outlet straight section. After entering the inlet of a straight channel section, the flow passes through an area partially covered with VP. A mixing layer develops at the interface between the vegetated and non-vegetated subzones, resulting in a lower PDF in this mixing layer (non-vegetated) area of 1 < R/Bv < 1.5, as compared to the PDF of 2 < R/Bv < 3. The particles’ depletion mechanism caused by the patch-scale eddies in a partially vegetated channel flow was carefully discussed in our previous work [36]. The present URANS simulation result of particles’ depletion in the mixing layer is consistent with our previous large eddy simulation (LES) results for a single straight channel flow, as illustrated by Figure 9a, and in both the LES and URANS cases the particles’ depletion occurs in the vegetation side mixing layer.
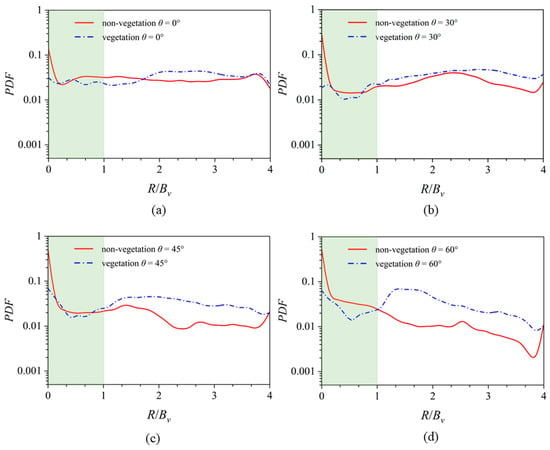
Figure 9.
The comparisons of PDFs in the non-vegetated U-bend channel flow (Case No.2) and partially vegetated U-bend channel flow (Case No.1) at = 0°, 30°, 45°, and 60° PDFs of the particle that are plotted in the radius-wise direction, as are shown in subfigures (a–d). R/Bv = 0 refers to the inner wall, R/Bv = 1 refers to the edge of the VP, and R/Bv = 4 refers to the outer wall.
At the entrance to the bend ( = 0°), the PDF distribution is relatively uniform for the vegetated U-bend case, as shown in Figure 9. In comparison, the PDF distribution is lower in the vegetated area 0.2 < R/Bv < 0.7 than that of the non-vegetated U-bend case due to the obstructive effect of vegetation. By contrast, in the cross-section of = 30°, the PDF starts to incline outwards because the secondary flow transports particles from the outer bend to the inner bend in the 0.1 < R/Bv < 3.8 region of the non-vegetated U-bend in Case No.2, as well as the region of 1.5 < R/Bv < 3.8 in the vegetated U-bend in Case No.1.
In Case No.1 with increases, the mean value of PDF does not rise considerably in the region of 0 < R/Bv < 1 due to the shelter effects of vegetation, as shown in Figure 10. On the contrary, there is a clear increase in PDF in Case No.2 in the same region. In the transitional region of the mixing layer (1 < R/Bv < 2), the movement of sediment is influenced by two factors: secondary flows and patch-scale eddies. The interaction of these factors results in complex sediment dynamics. The patch-scale eddies have the tendency to expel sediment from this region, while the secondary flow induced by the U-bend channel acts as a transport mechanism, pushing particles towards the inner wall. These two effects exert opposing forces on the sediment movement, creating a delicate balance between them. In terms of sediment distribution, the secondary flow in the current bend curvature case has a stronger effect of moving sediment inwards compared to the outwards effect of the mixing layer dispersing sediment.
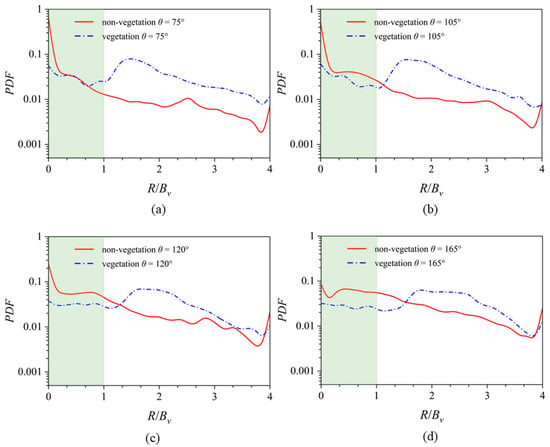
Figure 10.
The comparisons of PDFs in the non-vegetated U-bend channel flow (Case No.2) and partially vegetated U-bend channel flow (Case No.1) at = 75°, 105°, 120°, and 165° PDFs of the particle that are plotted in the radius-wise direction, as are shown in subfigures (a–d). R/Bv = 0 refers to the inner wall, R/Bv = 1 refers to the edge of the VP, and R/Bv = 4 refers to the outer wall.
However, in areas 2 < R/Bv < 4, the sediment is not affected by the mixing layer and, therefore, the distribution trend is similar as in the non-vegetated bend in Case No.2. The relative inner location has a higher PDF in the bare channel region, as displayed in Figure 10.
In the vegetated U-bend channel in Case No.1 and with the increase in , the size of a high PDF value region increases. This demonstrates that the current vegetation patch (VP) plays an important role in sediment transport and in the morphology development in the short and long term.
3.4. Variance of PDF in Radius-Wise Direction
The presence of VP transforms the channel flow into highly anisotropic turbulent structures among the interface between the vegetated and the non-vegetated regions. De Marchis et al. also demonstrated that the particles are non-uniformly relocated along the interface of vortices’ interaction [33]. The normalized fluctuation intensity of the PDF profile in a particular region is highly correlated with the uneven distribution of particles. The high variance of the PDF illustrates that particles are entrained by the vortices and move as groups, exhibiting preferential concentrations in the periphery of large-scale eddies [33]. The definition of the variance is presented in Equation (12). The physical meaning of the variance of PDF indicates spatial and temporal heterogeneity of the sediment.
where is the PDF at spanwise zi location, is the time-averaged , and N is the PDF sample times of one specific region .
The spatial and temporal heterogeneity of the sediment in Case No.2 shows very interesting characteristics. The spatial–temporal heterogeneity of the sediment increases significantly from the inner bank to the outer bank, as illustrated in Figure 11a,b. After an evolving process in a range 15° < < 45°, the spatial–temporal heterogeneity of the sediment distribution remains a similar shape for sections 45° < < 165°. However, the scenario in Case No.1 is much different, where the distribution of the variance of the PDF in the radius direction can be divided into three subsections according to the physical characteristics. The variance of the subzone 0 < R/Bv < 1 in Case No.1 is much higher than that of Case No.2. This can be attributed to the presence of the vegetation stems which produces turbulence structures, including the feet-generated structures and the wakes of the stems, promoting the transportation of the particles [9]. Those turbulence structures with the stem length scale increase the variance in this region. The variance of the sub-region 1 < R/Bv < 2 in Case No.1 reaches the peak values for all the radius-wise ranges of the same , as shown in Figure 11c,d. Indicated by Figure 7a (Q-criterion), the VP length scale turbulence vortex is an effective way to transport the particles and highly increases the heterogeneity in this subzone. In the non-vegetated free flow subzone 2 < R/Bv < 4, as depicted in Figure 11d, the redistribution of particles is mainly controlled by the secondary flow region, without the influence of the mixing layer and the VP’s blockage. Thus, the variance of PDF shows a similar distribution (like Figure 11b), observed in both the vegetated and non-vegetated U-bend channel flow. The variance increases from the outer edge of the VP region to the outer wall in the range 2 < R/Bv < 4, for the range of from 45° to 165°, resembling the non-vegetated area in Case No.2, presented in Figure 11b.
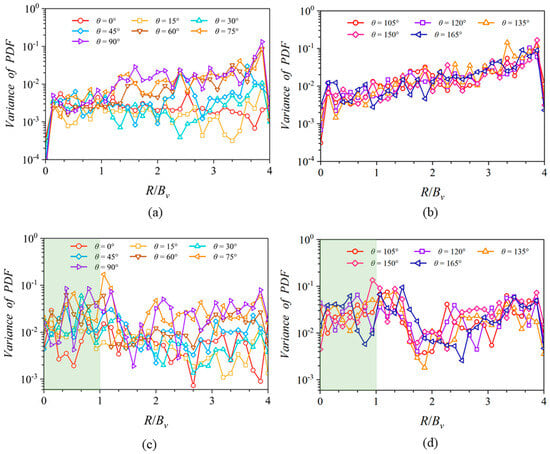
Figure 11.
The variance of PDF distribution in the radius-wise direction along various locations. (a,b) The variance of PDF in Case No.2. (c,d) The variance of PDF in Case No.1. R/Bv = 0 refers to the inner wall, R/Bv = 1 refers to the edge of the VP, and R/Bv = 4 refers to the outer wall.
Figure 12a,b presents a comparative analysis of the variance of PDF in Case No.1 and 2. For Case No.2, the temporal–spatial heterogeneity (i.e., variance) of the sediment particles exhibits relative uniformity, maintaining a consistently low level in the vegetated subzone. The distribution of the spatial heterogeneity appears largely unaffected by the secondary flow, which is not sufficiently developed at this particular cross-section. Notably, in the R/Bv = 3.8 location, adjacent to the wall, there is a discernible peak in variance. This peak is attributed to the development of the wall boundary layer, contributing to a non-uniform sediment distribution in the spatial domain. Conversely, in Case No.1, particularly at the inlet section of the bend, the presence of vegetation influences the variance of the PDF. Within the vegetated area and the mixing layer, the variance of the PDF progressively increases in response to the increment of the specified parameter .
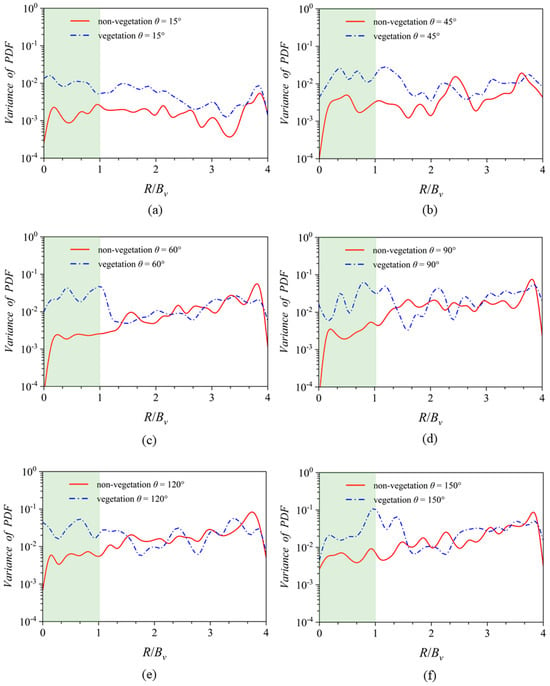
Figure 12.
The comparisons of variance of PDF distribution in Case No.1 and 2 along the radius-wise direction and for six locations ( = 15°, 45°, 60°, 90°, 120°, and 150°), as are shown in subfigures (a–f). R/Bv = 0 refers to the inner wall, R/Bv = 1 refers to the edge of the VP, and R/Bv = 4 refers to the outer wall. The green subzone denotes the location of VP.
In Figure 12c–e, the analysis reveals that the temporal–spatial non-uniformity within the vegetated subzone (0 < R/Bv < 1) surpasses that of the vegetation mixing layer region (1 < R/Bv < 2) in the 60° to 120° bending section. However, as the angle increases beyond 150°, the temporal–spatial non-uniformity in the sediment distribution reaches its peak within the mixing layer subzone (1 < R/Bv < 2). This is in contrast to both the vegetated subzone (0 < R/Bv < 1) and the non-vegetated free flow subzone (2 < R/Bv < 4) situated further from the mixing layer, as depicted in Figure 12f. The spatial and temporal heterogeneity of sediment distribution is significantly influenced by the length scale of turbulent eddies. Larger eddies exert a more pronounced effect on sediment redistribution. In the fully developed mixing layer region, the characteristic scale of eddies aligns with the VP width scale (0.5 Bv~Bv). In contrast, within the vegetated region, the eddy scale corresponds to the size of rigid vegetation stems (0.1 Bv~0.24 Bv). Consequently, as the increases, there is an amplification in the spatial and temporal heterogeneity of sediment distribution. This variation is primarily due to the differing sizes of the fully developed turbulent structures across various subzones. Notably, this amplification is positively correlated with the turbulence length scale, indicating a direct relationship between the scale of turbulence and the degree of sediment distribution heterogeneity.
Furthermore, the observed increase in variance within the non-vegetated free flow zone of the sediment (2 < R/Bv < 4), governed by the secondary circulation in the bend, presents a notable contrast to prior studies. These studies, specifically those by [9,10], focused on the spatially uneven sediment distribution in a partially vegetated straight channel flow. Unlike in straight channels, where an increase in spatial and temporal heterogeneity is noted within the mixing layer adjacent to the vegetation, the variance in the outer regions of the channel does not show a similar increase due to the absence of secondary flow. This distinction underscores the unique impact of secondary circulation on sediment distribution in curved channels as opposed to straight channels.
3.5. Vertical Concentration Profile in the Vegetated Region
Figure 13a,b reveals a notable phenomenon in the non-vegetated Case No.2. As the flow navigates through the U-bend section, the secondary flow progressively develops, transporting sediment particles from the channel bed to the upper layers. This leads to an evolving vertical concentration distribution, with a marked increase in normalized concentration within the upper layer (0.5 < h/H < 1.0). Note that H is the depth of the water, and h is the height of the location. The data trends, as illustrated in Figure 13a,b, indicate that layers with higher sediment concentrations ascend vertically with increasing. Specifically, within the 15° to 45° range, sediment peaks are more prevalent near the channel wall. In contrast, denser sediment concentrations are observed in the 0.2 < h/H < 0.5 layers when is between 45° and 105°. It is particularly noteworthy that, in the exit region of the bend (105° < < 165°), there is a substantial increase in sediment concentration in the upper layer (0.5 < h/H < 1). However, as shown in Figure 13c,d, although secondary flow is present, its intensity is markedly diminished by the presence of stems in the bending section. This reduction in the intensity of the secondary flow substantially weakens its vertical suspension effect on sediment particles.
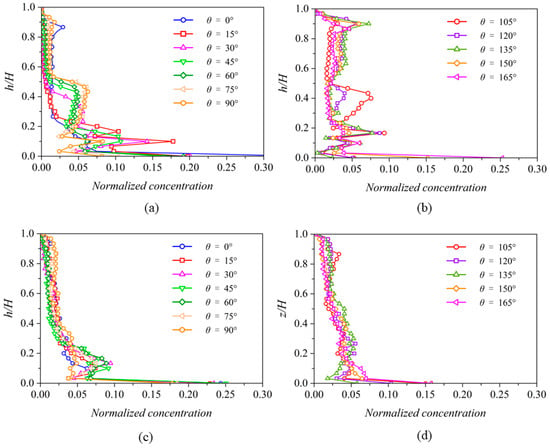
Figure 13.
The temporal–spatial-averaged concentration profiles in various locations. (a,b) The time-averaged concentration profiles in various locations in Case No.2. (c,d) The time-averaged concentration profiles in various locations in Case No.1.
Prior research has established that sparse vegetation (Cdah < 0.1, where Cd is the drag coefficient of a stem, ah is a dimensionless vegetation density parameter [45] in straight channels facilitates re-suspension of sediment particles [36,46], due to the presence of sparse vegetation that substantially increases the Turbulence Kinetic Energy (TKE) of the vertical flow field, and produces many regions where the vertical instantaneous flow velocity is greater than the hydrostatic sink velocity of sediment particles [9]. However, the sparse vegetation in the curved channel and near the inner bank has a dual effect on the movement of the sediment. On the one hand, it increases the TKE of the flow field and produces some transient velocity fields that are locally oriented upwards and are stronger than the sediment deposition velocity. On the other hand, the vegetation encroaches upon the channel space and narrows the channel space available for the secondary flow development. A comparative analysis of sediment concentration profiles in vegetated bends and non-vegetated bends in the later section of this paper reveals that the presence of vegetation hinders the upward sediment transport. This hindrance is primarily due to the dominant effect of secondary circulation over the sediment suspension facilitated by sparse vegetation.
Figure 14a illustrates that in the straight inlet of U-bend channels, vegetated areas enhance sediment suspension, resulting in greater normalized concentrations of 0.2 < h/H < 0.6 in the area than those in the non-vegetated U-bend of the inlet straight channel section. This conclusion is consistent with previous findings for straight channels [36]. As the flow progresses into the bend, secondary circulation develops rapidly. In Case No.2, this enhanced secondary flow leads to a notable increase in sediment particle concentration within the 0.2 < h/H < 0.5 range, as shown in Figure 14b,c. Conversely, in Case No.1, this specific interval does not exhibit a significant rise in sediment concentration. This indicates that within the bend section, approximately between =45° and 90°, the presence of vegetation acts as a deterrent to sediment re-suspension.
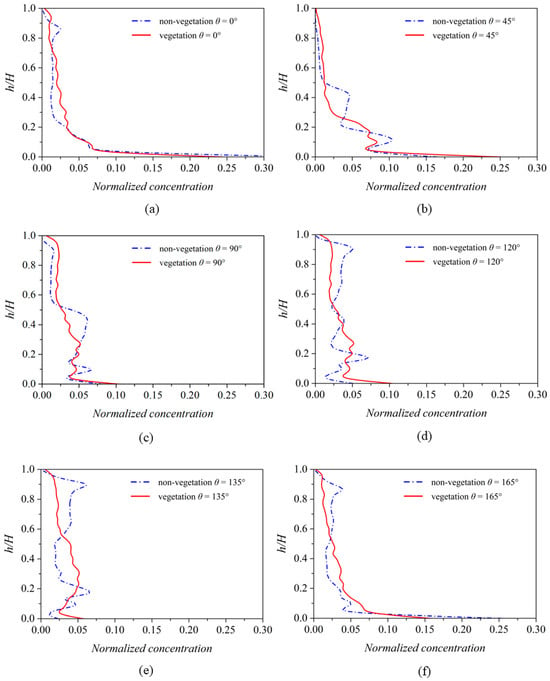
Figure 14.
(a–f) The comparison of vegetated and non-vegetated temporal–spatial-averaged concentration profiles at six different locations ( = 0°, 45°, 90°, 120°, 135°, and 165°).
As increases, the location of the areas of high sediment concentration gradually moves upwards, illustrated by Figure 14d–f, both in Case No.1 and 2, because of the secondary flow. However, due to the sheltering effect of the vegetated areas, the movement of the areas of high sediment concentrations in Case No.1 towards the upper layer is not obvious. In contrast, the concentration in the upper zone of 0.5 < h/H < 0.9 is significantly higher in the non-vegetated Case No.2 than in the zone of 0.2 < h/H < 0.5, in contrast to the vegetated Case No.1. In Case No.1, the concentration in the zone of 0.2 < h/H < 0.5 is higher than that in the zone of 0.5 < h/H < 0.9.
In summary, the presence of sparse VPs in the straight channel helps vertical entrainment of particles, and the secondary flow in the bending channel also promotes the vertical suspension of particles. However, the presence of VPs in the bending channel does not result in the same capability of vertical transportation of particles as in the bare U-bend channel. This is because the obstruction of secondary flow development though the local TKE also increases in this vegetated subzone of a bending channel.
4. Conclusions
This research employed the CFD-DPM to investigate particle transportation in both partially vegetated (Case No.1) and non-vegetated (Case No.2) U-bend channel flows. Through quantitative and qualitative analysis, the study elucidates the interplay between bending channel-induced secondary flow, vegetation blockage, and particle aggregation. The key conclusions are as follows:
- Vegetation near the inner walls of curved channels significantly weakens secondary circulation, reducing its intensity within vegetated areas and adjacent non-vegetated zones. The vertical vortices closely correlate with particle distribution near the channel bed. Particle distribution largely aligns with the vortices’ margin in both cases. However, due to dynamic patch-scale eddies, the particles exhibit a wavy pattern near the vegetation patch, deviating from the vortex edges.
- The Probability Density Function (PDF) reveals that, in non-vegetated flows, particle distribution is governed by secondary flow and boundary layers. Conversely, the presence of vegetation in Case No.1 creates a complex mixing layer, influencing particle distribution. The secondary flow tends to move particles closer to the inner channel wall, but the mixing layer has a depletion effect in the mixing layer region that is occupied by the patch-scale eddies. The maximum PDF values in Case No.1 appear in the non-vegetated free flow subzone adjacent to the mixing layer.
- Spatial–temporal sediment heterogeneity, as measured by PDF variance, differs notably between cases. In non-vegetated flows, variance increases towards the outer wall in the bending region. Vegetation-induced turbulence in vegetated cases leads to higher variance, particularly in the mixing layer subzone (1 < R/Bv < 2), showcasing the pivotal role of eddy size in sediment redistribution.
- Vertical concentration profiles reveal that secondary flow enhances upward sediment transport in non-vegetated channels. In contrast, vegetation increases Turbulence Kinetic Energy (TKE) but restricts channel space, thereby inhibiting secondary flow and vertical particle suspension. Sediment concentration is higher in lower layers of vegetated bends, a reversal of the pattern in non-vegetated bends. This underscores the complex dynamics between vegetation, secondary flow, and sediment transport, highlighting the reduced effectiveness of secondary flow in vertical particle transportation in bending channels due to vegetation obstruction.
Author Contributions
Conceptualization, M.W. and E.J.A.; Methodology, M.W.; Software, Q.Y.; Validation, M.W.; Formal analysis, M.W.; Investigation, M.W.; Resources, E.J.A.; Data curation, Y.X. and L.W.; Writing—original draft, M.W.; Writing—review & editing, Q.Y., Y.X., N.L., J.W., B.C. and E.J.A.; Visualization, L.W.; Supervision, E.J.A.; Funding acquisition, M.W., Q.Y., Y.X., N.L., J.W. and E.J.A. All authors have read and agreed to the published version of the manuscript.
Funding
The first, second, fourth, and fifth authors are financially supported by the National Key Research and Development Program of China [No. 2022YFC3006400, No. 2022YFC3006403] and the National Natural Science Foundation of China [No. U2340225, No. U2240203]. Computational time was provided by Turbulence Consortium under grant EP/R029326/1 from UK EPSRC, EPSRC Tier 2 CSD3 cluster. The support provided by the IWHR Talented Expert Program is also acknowledged. The third author is financially supported by Shanghai Sailing Program [No. 23YF1410200] and the Natural Science Foundation of Shanghai [No. 23ZR1420100].
Data Availability Statement
The original contributions presented in the study are included in the article, further inquiries can be directed to the corresponding author.
Acknowledgments
The authors appreciate the editors and anonymous reviewers for their great efforts on the manuscript.
Conflicts of Interest
Author Bo Cao was employed by the company Panjin Water Supply Engineering Co., Ltd. The remaining authors declare that the research was conducted in the absence of any commercial or financial relationships that could be construed as a potential conflict of interest.
References
- Lelpi, A.; Lapôtre, M.G.; Gibling, M.R.; Boyce, C.K. The impact of vegetation on meandering rivers. Nat. Rev. Earth Environ. 2022, 3, 165–178. [Google Scholar]
- Liu, M.; Huai, W.; Ji, B. Characteristics of the flow structures through and around a submerged canopy patch. Phys. Fluids 2021, 33, 035144. [Google Scholar] [CrossRef]
- Xu, Y.; Esposito, C.R.; Beltrán-Burgos, M.; Nepf, H.M. Competing effects of vegetation density on sedimentation in deltaic marshes. Nat. Commun. 2022, 13, 4641. [Google Scholar] [CrossRef] [PubMed]
- Zhu, L.; Chen, D.; Hassan, M.A.; Venditti, J.G. The influence of riparian vegetation on the sinuosity and lateral stability of meandering channels. Geophys. Res. Lett. 2022, 49, e2021GL096346. [Google Scholar] [CrossRef]
- Van Dijk, W.M.; Teske, R.; Van de Lageweg, W.I.; Kleinhans, M.G. Effects of vegetation distribution on experimental river channel dynamics. Water Resour. Res. 2013, 49, 7558–7574. [Google Scholar] [CrossRef]
- Rominger, J.T.; Lightbody, A.F.; Nepf, H.M. Effects of added vegetation on sand bar stability and stream hydrodynamics. Am. Soc. Civ. Eng. 2010, 136, 994–1002. [Google Scholar] [CrossRef]
- Millar, R.G. Influence of bank vegetation on alluvial channel patterns. Water Resour. Res. 2000, 36, 1109–1118. [Google Scholar] [CrossRef]
- Deitrick, A.R.; Hovendon, E.H.; Ralston, D.K.; Nepf, H. The influence of vegetation-generated turbulence on deposition in emergent canopies. Front. Mar. Sci. 2023, 10. [Google Scholar] [CrossRef]
- Wang, M.; Mi, S.; Avital, E.; Li, N.; Chen, Y.; Williams, J. A Study on the Influence of Submergence Ratio on the Transport of Suspended Sediment in a Partially Vegetated Channel Flow. Water Resour. Res. 2023, 59, e2022WR032876. [Google Scholar] [CrossRef]
- Wang, M.; Avital, E.; Korakianitis, T.; Williams, J.; Ai, K. A numerical study on the influence of curvature ratio and vegetation density on a partially vegetated U-bend channel flow. Adv. Water Resour. 2021, 148, 103843. [Google Scholar] [CrossRef]
- Kashyap, S.; Constantinescu, G.; Rennie, C.D.; Post, G.; Townsend, R. Influence of channel aspect ratio and curvature on flow, secondary circulation, and bed shear stress in a rectangular channel bend. J. Hydraul. Eng. 2012, 138, 1045–1059. [Google Scholar] [CrossRef]
- Blanckaert, K.D.V.H.; De Vriend, H.J. Secondary flow in sharp open-channel bends. J. Fluid Mech. 2004, 498, 353–380. [Google Scholar] [CrossRef]
- Zhang, Q.L.; Jing, H.F.; Li, C.G.; Wang, W.H.; Zhang, W.S. Flow characteristics in curved open channel with partial suspended vegetation. J. Mt. Sci. 2022, 19, 2715–2728. [Google Scholar] [CrossRef]
- Shi, Z.R.; Ai, C.F.; Jin, S. 3-D numerical simulation of curved open channel confluence flow with partially non-submerged rigid vegetation. J. Hydrodyn. 2021, 33, 992–1006. [Google Scholar] [CrossRef]
- Yang, Z.H.; Bai, F.P.; Huai, W.X.; Li, C.G. Lattice Boltzmann method for simulating flows in open-channel with partial emergent rigid vegetation cover. J. Hydrodyn. 2019, 31, 717–724. [Google Scholar] [CrossRef]
- Huai, W.X.; Li, C.G.; Zeng, Y.H.; Qian, Z.D.; Yang, Z.H. Curved open channel flow on vegetation roughened inner bank. J. Hydrodyn. 2012, 24, 124–129. [Google Scholar] [CrossRef]
- Huai, W.; Yang, L.; Wang, W.J.; Guo, Y.; Wang, T.; Cheng, Y.G. Predicting the vertical low suspended sediment concentration in vegetated flow using a random displacement model. J. Hydrol. 2019, 578, 124101. [Google Scholar] [CrossRef]
- Zhong, D.; Zhang, L.; Wu, B.; Wang, Y. Velocity profile of turbulent sediment-laden flows in open-channels. Int. J. Sediment Res. 2015, 30, 285–296. [Google Scholar] [CrossRef]
- Termini, D. Experimental analysis of the effect of vegetation on flow and bed shear stress distribution in high-curvature bends. Geomorphology 2016, 274, 1–10. [Google Scholar] [CrossRef]
- Mera, I.; Franca, M.J.; Anta, J.; Peña, E. Turbulence anisotropy in a compound meandering channel with different submergence conditions. Adv. Water Resour. 2015, 81, 142–151. [Google Scholar] [CrossRef]
- Termini, D.; Di Leonardo, A. Turbulence structure and implications in exchange processes in high-amplitude vegetated meanders: Experimental investigation. Adv. Water Resour. 2018, 120, 114–127. [Google Scholar] [CrossRef]
- Farzadkhoo, M.; Keshavarzi, A.; Hamidifar, H.; Javan, M. Sudden pollutant discharge in vegetated compound meandering rivers. Catena 2019, 182, 104155. [Google Scholar] [CrossRef]
- Chao, Z.; Shi, D.; Zheng, J. Experimental research on temperature–Dependent dynamic interface interaction between marine coral sand and polymer layer. Ocean. Eng. 2024, 297, 117100. [Google Scholar] [CrossRef]
- Hamidifar, H.; Keshavarzi, A.; Rowiński, P.M. Influence of rigid emerged vegetation in a channel bend on bed topography and flow velocity field: Laboratory experiments. Water 2019, 12, 118. [Google Scholar] [CrossRef]
- Li, C.G.; Xue, W.Y.; Huai, W.X. Effect of vegetation on flow structure and dispersion in strongly curved channels. J. Hydrodyn. Ser. B 2015, 27, 286–291. [Google Scholar] [CrossRef]
- Baek, K.O.; Seo, I.W.; Jeong, S.J. Evaluation of dispersion coefficients in meandering channels from transient tracer tests. J. Hydraul. Eng. 2006, 132, 1021–1032. [Google Scholar] [CrossRef]
- Cheng, C.; Song, Z.Y.; Wang, Y.G.; Zhang, J.S. Parameterized expressions for an improved Rouse equation. Int. J. Sediment Res. 2013, 28, 523–534. [Google Scholar] [CrossRef]
- López, F.; García, M. Open-channel flow through simulated vegetation: Suspended sediment transport modeling. Water Resour. Res. 1998, 34, 2341–2352. [Google Scholar] [CrossRef]
- Huai, W.; Yang, L.; Guo, Y. Analytical solution of suspended sediment concentration profile: Relevance of dispersive flow term in vegetated channels. Water Resour. Res. 2020, 56, e2019WR027012. [Google Scholar] [CrossRef]
- Li, D.; Yang, Z.; Sun, Z.; Huai, W.; Liu, J. Theoretical model of suspended sediment concentration in a flow with submerged vegetation. Water 2018, 10, 1656. [Google Scholar] [CrossRef]
- Graf, W.H.; Cellino, M. Suspension flows in open channels; experimental study. J. Hydraul. Res. 2002, 40, 435–447. [Google Scholar] [CrossRef]
- Sun, R.; Xiao, H. SediFoam: A general-purpose, open-source CFD–DEM solver for particle-laden flow with emphasis on sediment transport. Comput. Geosci. 2016, 89, 207–219. [Google Scholar] [CrossRef]
- De Marchis, M.; Milici, B.; Sardina, G.; Napoli, E. Interaction between turbulent structures and particles in roughened channel. Int. J. Multiph. Flow 2016, 78, 117–131. [Google Scholar] [CrossRef]
- Ji, C.; Munjiza, A.; Avital, E.; Xu, D.; Williams, J. Saltation of particles in turbulent channel flow. Phys. Rev. E 2014, 89, 052202. [Google Scholar] [CrossRef] [PubMed]
- Oh, J.; Tsai, C.W. A stochastic multivariate framework for modeling movement of discrete sediment particles in open channel flows. Stoch. Environ. Res. Risk Assess. 2018, 32, 385–399. [Google Scholar] [CrossRef]
- Wang, M.; Avital, E.; Chen, Q.; Williams, J.; Mi, S.; Xie, Q. A numerical study on suspended sediment transport in a partially vegetated channel flow. J. Hydrol. 2021, 599, 126335. [Google Scholar] [CrossRef]
- Fluent, A. Ansys Fluent Theory Guide; Ansys Inc.: Canonsburg, PA, USA, 2011; Volume 15317, pp. 724–746. [Google Scholar]
- Crowe, C.T.; Schwarzkopf, J.D.; Sommerfeld, M.; Tsuji, Y. Multiphase Flows with Droplets and Particles; CRC press: Boca Raton, FL, USA, 2011; p. 1058. [Google Scholar]
- Lu, S. Experimental Study on Distribution Law of Suspended Sediment in Water Flow of Rigid Plants (in 1125 Chinese); Hohai University: Nanjing, China, 2008. [Google Scholar]
- Li, Y.; Xie, L.; Su, T.C. Profile of suspended sediment concentration in submerged vegetated shallow water flow. Water Resour. Res. 2020, 56, e2019WR025551. [Google Scholar] [CrossRef]
- Rouse, H. Modern Concepts of the Mechanics of Turbulence; ASCE Transactions: New York, NY, USA, 1937. [Google Scholar]
- Fernandes, C.; Semyonov, D.; Ferra s, L.L.; No brega, J.M. Validation of the CFD-DPM solver DPMFoam in OpenFOAM through analytical, numerical and experimental comparisons. Granul. Matter 2018, 20, 64. [Google Scholar] [CrossRef]
- Follett, E.M.; Nepf, H.M. Sediment patterns near a model patch of reedy emergent vegetation. Geomorphology 2012, 179, 141–151. [Google Scholar] [CrossRef]
- Gondret, P.; Lance, M.; Petit, L. Bouncing motion of spherical particles in fluids. Phys. Fluids 2002, 14, 643–652. [Google Scholar] [CrossRef]
- Nepf, H.M. Flow and transport in regions with aquatic vegetation. Annu. Rev. Fluid Mech. 2012, 44, 123–142. [Google Scholar] [CrossRef]
- Luhar, M.; Rominger, J.; Nepf, H. Interaction between flow, transport and vegetation spatial structure. Environ. Fluid Mech. 2008, 8, 423–439. [Google Scholar] [CrossRef]
Disclaimer/Publisher’s Note: The statements, opinions and data contained in all publications are solely those of the individual author(s) and contributor(s) and not of MDPI and/or the editor(s). MDPI and/or the editor(s) disclaim responsibility for any injury to people or property resulting from any ideas, methods, instructions or products referred to in the content. |
© 2024 by the authors. Licensee MDPI, Basel, Switzerland. This article is an open access article distributed under the terms and conditions of the Creative Commons Attribution (CC BY) license (https://creativecommons.org/licenses/by/4.0/).