1. Introduction and Literature Review
Cooling hot surfaces is of significant concern in engineering applications. The most crucial aspect is how a hot surface can be cooled with minimum weight and low pressure drop if the liquid is the coolant. Forced convection is one of the heat transfer techniques that can achieve fast cooling. However, flow injected perpendicularly to a hot surface causes jet impingement. The flow can be laminar or turbulent. The interesting aspect of this model of cooling is that at the impact of the flow on the hot surface it deflects and swipes the heat from the remaining part of the surface. Jet impingement has been applied to different types of surfaces, whether flat surfaces or surfaces that contain grooves or obstacles. Other fluids are used, such as air, water, and nanofluid.
Plant et al. [
1] recently reviewed jet impingement cooling. They stated that this technique improves heat transfer. Their study covered different fluid types, including nanofluid, synthetic jet, jet array, and vortex jets. Saeid and Mohamad [
2] studied numerically the jet impingement cooling of a horizontal surface confined in a porous medium. The flow direction was perpendicular to the heated plate; thus, the external flow and the buoyancy force were opposite. Amongst the parameters that control cooling are the non-dimensional Rayleigh number, Péclet number, and the width and distance of the jet and the heated plate. Oscillation of the average number was observed numerically without its reaching a steady state. It was observed that narrowing the distance between the plane and the heated portion can increase the average Nusselt number. Lam and Prakash [
3] investigated a unique system whereby the impingement jet was applied at the side of a mass containing a porous layer. The heat sources were protruding inside the porous structure. The application for this design is not mentioned; thus, it is a purely numerical model investigation. It was noticed that as the Darcy number and Reynolds number increased, the average Nusselt number increased. An optimum configuration was determined for a Reynolds number of 1000, and thus it remained in the laminar regime.
Sivasamy et al. [
4] studied numerically mixed convection when a constant heat flux was applied at the bottom of a porous domain. In their analysis, the Péclet number varied between 1 and 1000, while the Rayleigh number varied between 10 and 100 for different jet diameters and distances between the jet and the heated plate. An increase in the average Nusselt number was noticeable when the distance between the jet and the hot plate decreased. It was mentioned that mixed convection may cause the average Nusselt number to be low due to the counteraction of the jet flow direction and the buoyancy force. Later, Buonomo et al. [
5] repeated the previous model, assuming the system was in local thermal non-equilibrium mode. Porosity effects on the average total Nusselt number were found to be weak.
Further, Wong and Saeid [
6,
7] investigated mixed convection in the presence of a porous medium. The numerical approach suggests that the average Nusselt number increases with the increase of the Rayleigh number. Yakkatelli et al. [
8] presented a study of fluid jet impingement on metal foam having a different porosity. Using smoke wire flow visualization, they studied the flow dynamics in detail. The flow dynamic is affected by jet exit to surface variation.
Later, Buonomo et al. [
9] conducted an experiment investigating the cooling process in a porous medium. Experimental results revealed that metal foam improved heat transfer when the jet impinged on the heated wall. The friction factor increased in the metal foam and decreased the pressure drop. The thickness of the porous structure has a direct effect on the cooling process. Additional researchers [
10,
11,
12,
13,
14,
15] used numerical modeling and revealed, in all the cases, the importance of porous media in enhancing heat removal in the presence of jet impingement. Besides water, nanofluid is used for the cooling process, demonstrating a better cooling fluid. Zahmatkesh and Naghedifar [
16] investigated the inclusion of an oscillatory jet due to the interaction of buoyancy and jet flow. They demonstrated that the final steady oscillatory flow depends on three parameters, mainly the Reynolds number, the Grashof number, and the Darcy number. In their investigation, nanofluid was used as the cooling fluid. Fu and Huang [
17] investigated the impingement jet numerically on porous blocks of different shapes. They concluded that heat removal was enhanced in the presence of the porous block.
Prakash et al. [
18] conducted a flow visualization to investigate the importance of the porous block on the jet flow pattern. Different parameters varied during the experiment, including the Reynolds number and the permeability and thickness of the porous structure. Later, de Lemos and Fisher [
19] and Graminho and de Lemos [
20] investigated numerically the importance of the porous block and demonstrated that the inclusion of the porous layer decreases the peak of the Nusselt number, which avoids cooling/heating at the stagnation point. Further investigations on jet impingement have been conducted [
21,
22,
23,
24,
25,
26], but all of them are numerical. However, the authors found no work dealing with jet impingement in the presence of a gyroid porous structure. With advanced 3D printing, designing a porous structure using triply periodic minimal surfaces (TPMSs) is now possible. The design can benefit from the observations made by researchers to develop a better porous structure.
This paper investigates the importance of jet impingement on a gyroid’s porous structure. We investigate two different flow directions—the first parallel to the heated surface, and the second perpendicular to the heated surface.
Section 2 presents the problem statement and its description. An experiment was conducted to check the accuracy of the finite element model, which is given in
Section 3 and
Section 4.
Section 5 presents the numerical finite element model.
Section 6 presents the thermohydraulic performance of metal foam and a TPMS structure with a porosity of 0.7 for two different flow directions, followed by
Section 7 describing the cases of TPMSs with porosities of 0.8 and 0.9. The conclusions are in
Section 8.
2. Problem Statement
Cooling of hot surfaces or hot liquids is in significant demand in engineering disciplines. Different constraints need to be addressed, including low pressure drops, type of material, and lower weight of the structure in use. Other fluids, such as distilled water, ethylene glycol, and a mixture of water and ethylene glycol, are proposed for cooling. In addition, researchers have proposed adding some metallic nanoparticles to the mixture to increase the thermal conductivity of the mixture. However, the presence of these nanoparticles can, amongst many disadvantages, plug a flow and segregate, leading to flow obstruction. The direction of the flow aimed at cooling hot surfaces is also important. Most of the work is with the flow parallel to the hot surfaces.
This paper investigates flow direction in TPMS structures with different porosity. These porous structures are subject to cooling using flow in parallel and perpendicular directions. Distilled water is the fluid used in this analysis. The porous structure is either a commercial metal foam manufactured by ERG Aerospace with a porosity of 0.91 and a permeability of 20 PPI or a TPMS structure with a porosity of 0.7, 0.8, or 0.9. The material for the commercial metal foam is aluminum 6061-T6, and for the TPMS porous structure AlSi10Mg.
Commercial COMSOL Multiphysics software version 6 is used and tested against experimental measurements to assess the model’s accuracy.
3. Comparison with Experimental Data Using a Metal Foam Porous Structure
ERG metal foam is a porous structure made of aluminum, having a porosity of 0.91 and a permeability of 20 PPI (2.38697 × 10
−7 m
2). Water is the fluid used for cooling hot surfaces through the metal foam. Previous studies by Bayomy and Saghir [
27] and Welsford et al. [
28] have shown that metallic foam can help extract heat in forced convection mode. The flow moving parallel to the hot surface wets the metal foam and extracts heat.
Figure 1 presents the experimental setup. A flow meter measures the flow, and a pump forces the flow to enter the test section. Thermocouples are located inside the aluminum block 1 mm below the interface between the metal foam and the heated block (see
Figure 1b).
Figure 2 shows the test section under study, including the metal foam. A finite element-based COMSOL Multiphysics model is used to solve the problem numerically. As shown in
Figure 3, an aluminum block is heated by applying a heat flux at the bottom of the block. At the top surface of the block, the ERG metal foam is located, and a thermal paste between the metal foam and the aluminum block is applied to provide good contact between the two structures. The flow enters from the inlet shown in
Figure 3, having an inlet velocity and an inlet temperature of T
in. Both parameters are measured experimentally and used in the numerical model as boundary conditions. The temperatures are measured 1 mm below the interface between the two structures, as shown in
Figure 1b. The test section (see
Figure 2) uses low-conductive Teflon material to reduce heat loss. Detailed information about the experiment can be found in references [
27,
28].
Figure 4 compares the experimental data measured and the numerical model calculation. Three different heat fluxes equal to 13.18 W/m
2, 10.4 W/m
2, and 8.41 W/m
2 are applied for two separate flow rates of 6.309 cm
3/s and 9.46 cm
3/s. The inlet fluid temperature is set equal to 18 °C. As shown in
Figure 4a, temperature distribution increases due to the cooling process. At the inlet, the fluid is maintained at an inlet temperature of Tin; as the flow progresses, its temperature increases; thus, towards the end, less heat is removed from the hot surface. As the heat flux increases, it is easy to observe a rise in the temperature. In general, as shown, good agreement is obtained between the measured and calculated methods.
Further,
Figure 4b presents a similar case but at a higher flow rate of 9.46 cm
3/s. This comparison shows that the model accurately predicts conditions using an ERG metal foam porous structure.
The problem is further investigated for additional flow rates of 11.35 cm
3/s and 13.88 cm
3/s.
Figure 5 presents the local Nusselt number for different heat fluxes at various flow rates.
Figure 5 shows the case when the flow rate is 11.35 cm
3/s. A decrease in the profile of the Nusselt number is evident as the thermal boundary layer increases. Cooling is more effective when the boundary layer is at its lowest thickness. The water’s physical properties are evaluated at different fluid temperatures to assess the accuracy of the estimation, and at constant pressure. As the flow rates increase further to a level of 13.88 cm
3/s, as shown in
Figure 5b, the Nusselt number magnitude increases further, thus resulting in more considerable heat extraction.
Figure 4 and
Figure 5 demonstrate that the numerical model is accurate, and that further prediction with metal foam as the porous structure is correct.
4. Comparison with Experimental Data Using a TPMS Porous Structure
The triply periodic minimal surface (TPMS) structure shows many advantages over the metal foam structure [
29]. Amongst these, one can design the type of structure and the porosity based on the required application. For instance, a gyroid TPMS has proven useful in heat exchangers and heat removal. In contrast, another family of triply periodic minimal surfaces known as Fisher–Koch S (FKS) structures are necessary for biomedical applications. Thus, three gyroid structures are used in the current study. The difference between them is the porosity, which is 0.7, 0.8, and 0.9, respectively. These structures have different surface areas of 8.4 × 10
3 cm
2, 4.9 × 10
3 cm
2 and 4.0 × 10
3 cm
2, respectively. Surface area is an important parameter to use when managing the performance of the TPMS structure; as the porosity increases, the void increases accordingly, and the structure’s surface area decreases. From the numerical side, solving the Darcy–Brinkman model is unnecessary. Instead, the structure is included in the modeling as a solid structure. Thus, only the Navier–Stokes equation is used in this analysis.
Figure 6 presents the three structures under investigation in the experimental setup and the equivalent three structures used in the numerical modeling. From the numerical point of view, the metal foam is replaced with this structure, which has a square base of 37.5 mm and a height of 12.7 mm.
Different flow rates were tested using the TPMS structure.
Figure 7 presents the temperature distribution and the Nusselt number for the three porosity cases when the flow rate equals 3.74 cm
3/s. Contrary to the metal foam, a uniform temperature distribution is observed. Good agreement between the experimental data and numerical models is observed. The difference between the two approaches is due to some heat loss from the experimental setup, which led to lower temperatures in some cases.
As the flow rate increases,
Figure 8 presents another set of comparisons for the temperature and the Nusselt number. Good agreement is obtained. By means of this comparison, the model was tested very well and showed good prediction of temperature distribution.
5. Flow Direction in the Presence of a Gyroid TPMS Structure
From the previous section, one can notice the model’s accuracy in predicting the temperature distribution for different flow rates. This model will be used in the remainder of the manuscript to investigate the importance of flow direction for cooling hot surfaces in the presence of a porous structure. In the remaining analysis, metal foam and a gyroid structure will be used. Using COMSOL software, the model is solved using the finite element technique. The Navier–Stokes equations combined with the continuity and energy equations were solved for this model.
5.1. Continuity Equation
The continuity formulation to secure a uniform flow is as follows.
where
is the velocity vector for the three flow directions around the x, y, and z directions.
5.2. Fluid Dynamics Formulation
The Navier–Stokes equations in vector form are shown in Equation (2), where the fluid density is
in kg/m
3 and the fluid dynamic viscosity is
in kg/m.s. The fluid pressure is p expressed in N/m
2 5.3. Heat Transfer Formulation
Equation (3) represents the heat conduction and convection formulation in vector form, where C
p is the fluid-specific heat and k is the fluid conductivity.
The aluminum block and the TPMS structure are solid materials in the model, and the heat conduction equation shown in Equation (4) is used. Here, k
s is the conductivity of the aluminum structure.
5.4. Boundary Conditions
As shown in
Figure 3, different boundary conditions are applied.
- (i)
At the inlet, five different flow rates are applied, which are 3.74 cm3/s, 7.86 cm3/s, 11.8 cm3/s, 15.73 cm3/s, and 19.85 cm3/s, respectively.
- (ii)
At the inlet, the temperature of the fluid when it enters the channel is at T = Tin, equal to 20 °C.
- (iii)
At the outlet, an open boundary is applied where the stresses are equal to zero.
- (iv)
Because the structure is Teflon, all external surfaces are assumed to be adiabatic and .
- (v)
The applied heat flux at the bottom of the aluminum block is q″ = 38,400 W/cm2.
5.5. Non-Dimensional Term
To estimate the amount of heat removed from the system, the local Nusselt number defined in Equation (5) is used.
In this formulation, k is the water conductivity, and D
H is the hydraulic diameter of the porous structure. The heat convection coefficient h is defined as follows:
In Equation (6), the heat flux is applied at the bottom of the aluminum block and has a value of 38,400 W/cm2. T is measured in the aluminum block 1 mm below the interface, and Tin is the inlet temperature.
The hydraulic diameter is defined as follows:
where H is the TMPS height equal to 11.72 mm, and L is the porous structure length in the flow direction and is equal to 37.5 mm. In our current case, the hydraulic diameter is equal to 17.858 mm. The Darcy friction factor of the flow domain f is defined as follows:
Here, the pressure difference between the inlet and the outlet is
.
is the inlet pressure at the tip of the cylinder, and
is the outlet pressure at the opposite direction, as shown in
Figure 3. Finally, the performance evaluation criterion (PEC) is a non-dimensional term that combines the thermal and hydraulic effects. The definition of the performance evaluation criterion (PEC) in the present study is as follows:
The above performance evaluation parameter is estimated for all cases to assess the best flow configuration and TPMS structure for cooling hot surfaces.
5.6. Mesh Sensitivity Analysis and Convergence Criteria
Even though the model was tested against experimental measurements, mesh sensitivity is essential to ensure accurate results. In the present study, the optimum mesh is found to have a 1,338,201 domain of tetrahedral elements, boundary elements, and edge elements. The segregated method is used in the calculation, and the convergence criteria are set for the three-velocity variable, the temperature, and the pressure. When the difference of all variables between two iterations is less than 1 × 10⁻⁶, the solution is assumed to have been reached via the residue.
Figure 9 shows the model when the flow is parallel to the hot surface and the mesh model.
Table 1 presents the different meshes adopted using COMSOL software.
Table 1 shows the total number of elements for each mesh level.
Flow direction may have an impact on cooling surfaces. Two different flow directions are investigated in this study. The first, designated as parallel flow, is represented by
Figure 10a. It is identical to the model used in the experimental setup. Within the parallel flow, two different porous structures are used. The first is a metal foam with a porosity of 0.91, like the one used in the experimental setup. In the second case, a TPMS structure (similar to the one used in the experiment) is inserted to replace the metal foam, as shown in
Figure 10. The porosity of the TPMS used in the analysis is 0.7, 0.8, and 0.9. In the second flow configuration, as shown in
Figure 10b, the flow is perpendicular to the metal foam or TPMS structure. Similar conditions to those in the parallel flow case will be investigated in detail.
Concerning the geometry under investigation, shown in
Figure 10, the inlet flow enters a 1 mm diameter cylinder and exits from a 1 mm diameter cylinder. As for the flow from the top, identified as flow impingement or perpendicular flow, the diameter of the inlet is identical to that in
Figure 10a. Two outlet flows are still present, each having a 0.5 cm diameter.
6. Thermohydraulic Performance of a Gyroid TPMS and Metal Foam for a Porosity of 0.7
The model is solved for five different flow rates, which are 3.74 cm
3/s, 7.86 cm
3/s, 11.8 cm
3/s, 15.73 cm
3/s, and 19.85 cm
3/s. The inlet temperature is set to Tin = 20 °C, and the heat flux applied at the bottom of the aluminum block is equal to 38,400 W/cm
2. The porosity of the TPMS structure is set at 0.7. Then, using the concept presented in
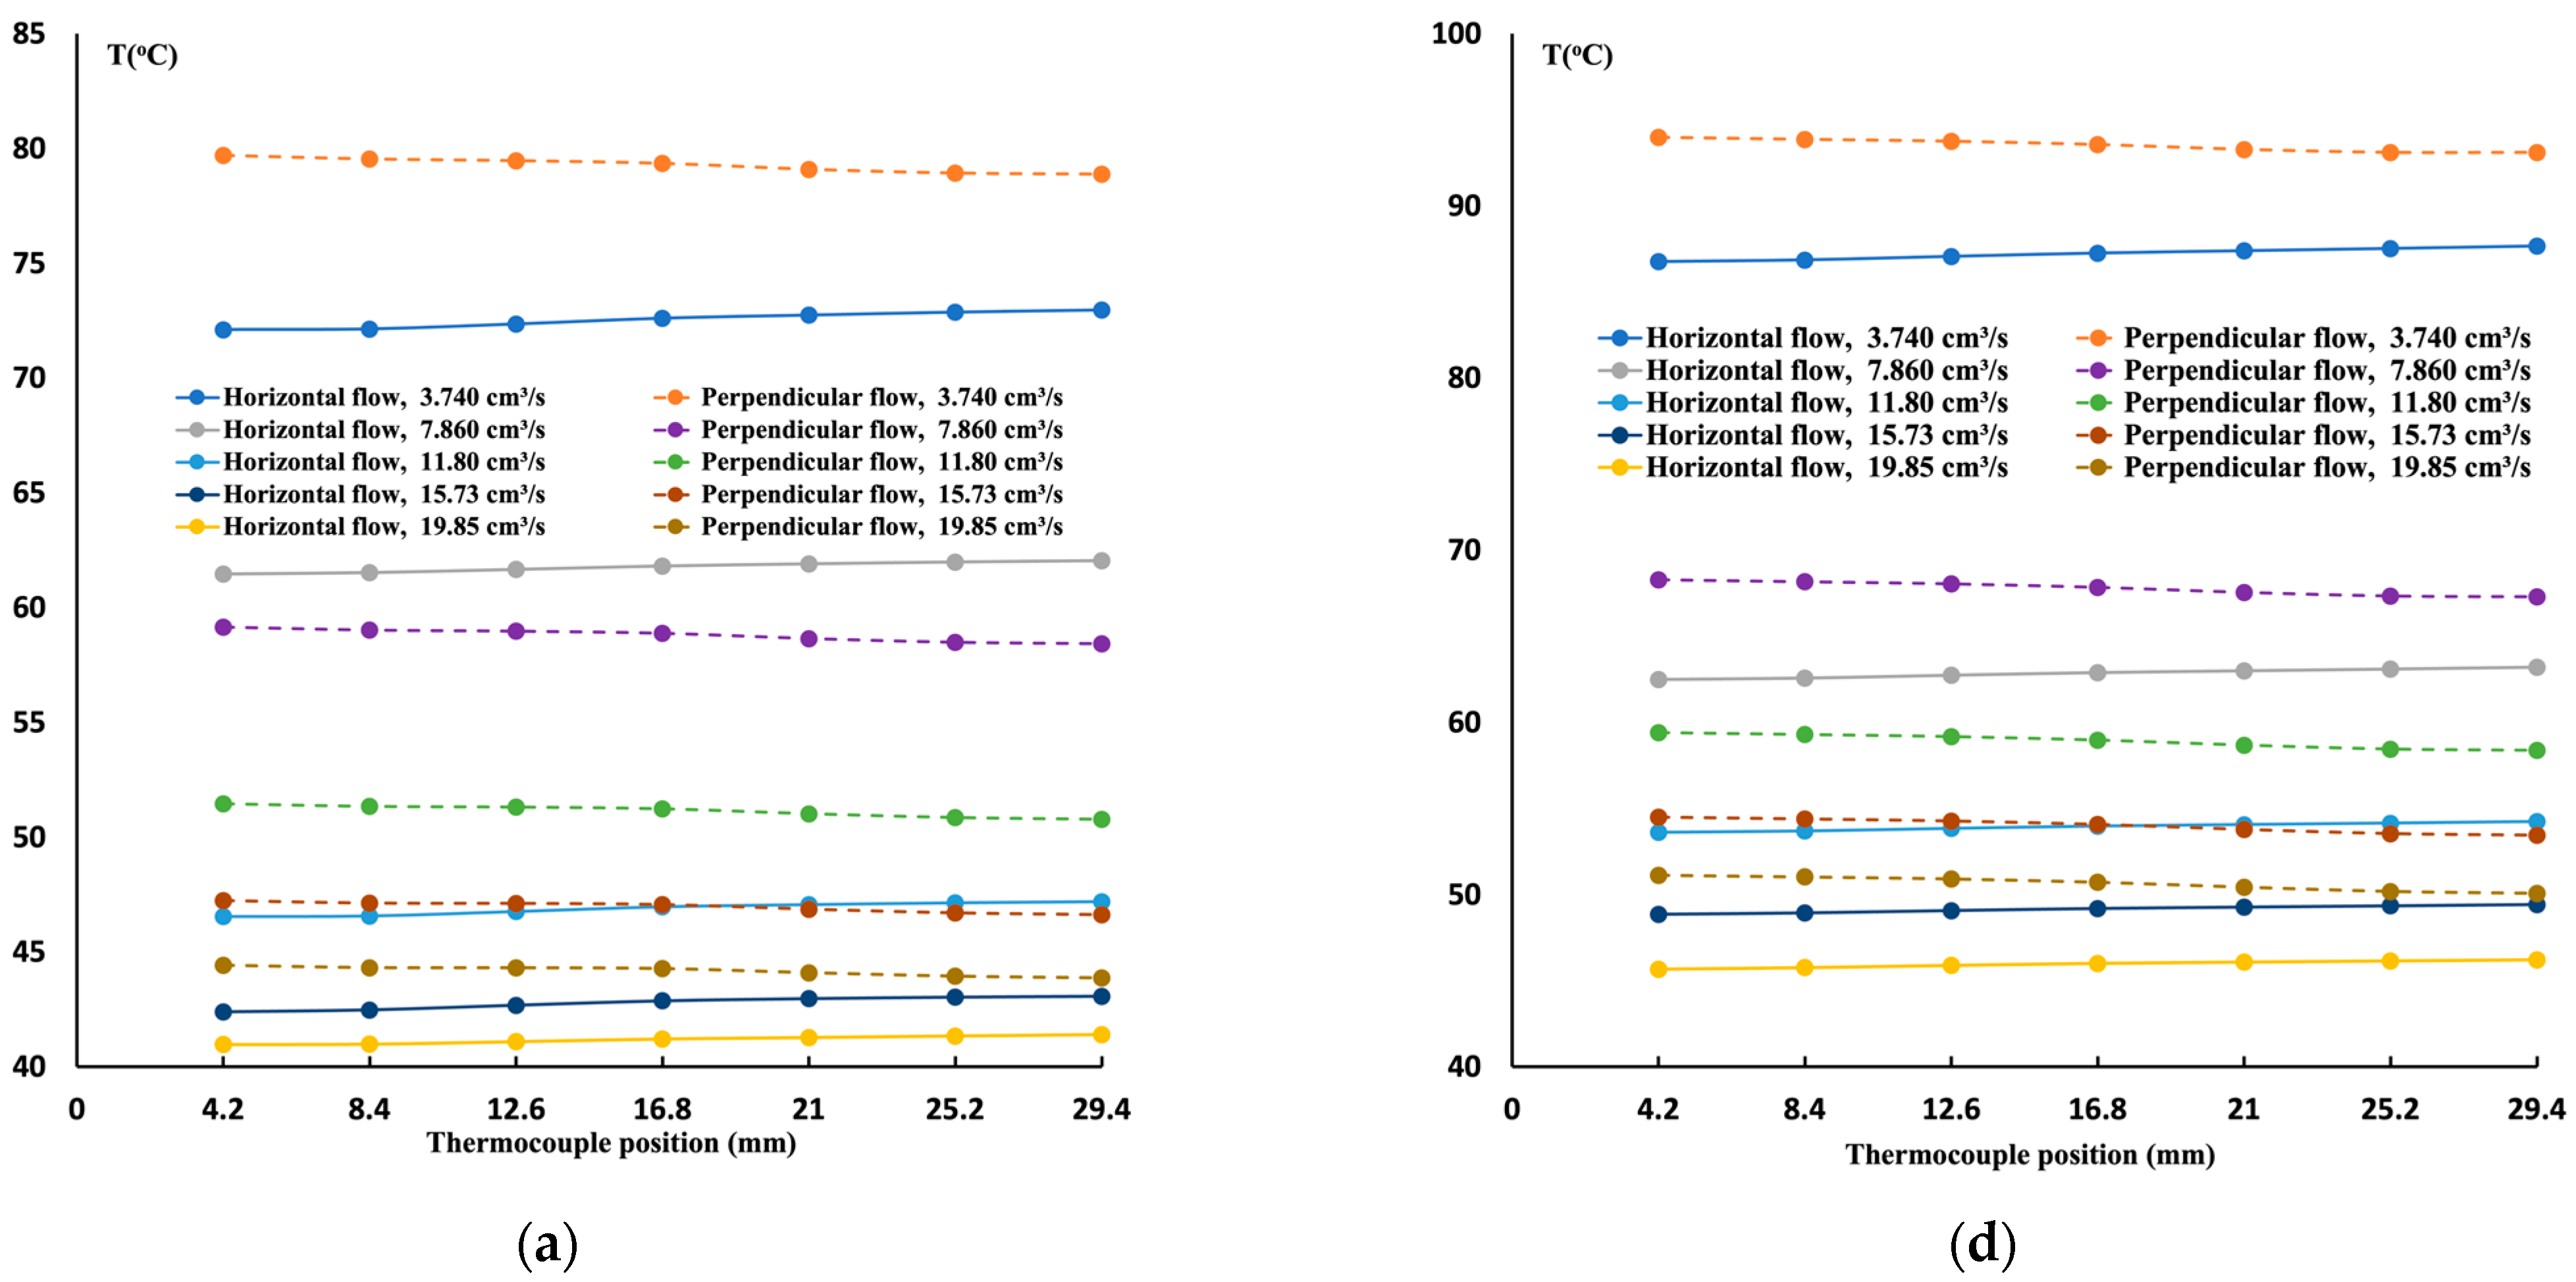
Figure 10b, the model is re-calculated with the flow perpendicular to the structure. Thus, two flow directions are examined.
Figure 11a shows the temperature distribution, evaluated 1 mm below the interface in all cases, using the TPMS structure for two different flow directions. Regardless of the flow direction, a uniform temperature distribution is observed. This reconfirmed previous work by Saghir et al. [
3] that indicates that TPMS structures can secure uniform cooling. However, it is observed that cooling when the flow is perpendicular to the TPMS structure is not as effective as in the parallel flow case. The rationale behind this observation is that the flow must penetrate the structure before reaching the hot plate. It is understood that the TPMS structure acts as a fin, but not enough heat is extracted to be cooled by the fluid. In addition, due to the structure formation of the gyroid, some flow may find no exit and need to be diverted in different directions. Thus, it is delayed in reaching the hot surface.
In this analysis, using the Darcy formulation, knowing the pressure drop between the inlet and the outlet, the permeability was calculated numerically, as shown in
Table 2. This permeability is used to solve the case where the TPMS structure is replaced with metal foam with a porosity of 0.7, and the permeability is obtained from the TPMS structure.
Figure 11d presents the temperature distribution measured at the same location as in
Figure 11a for the same heating and cooling conditions and using the metal foam structure properties for two different flow directions. It is evident from the results that a buildup of the boundary layer is apparent, and a linear increase in the temperature distribution is evident. Also, it is noticeable that parallel flow exhibits better cooling under the current conditions than perpendicular flow. The TPMS structure led to better cooling and lower temperature regardless of the flow direction.
Figure 11b,e present the variation of the local Nusselt number for all cases under consideration. A higher Nusselt number magnitude is obtained for the TPMS structure, and within the TPMS case, parallel flow confirms the best cooling flow direction. Furthermore, the friction factor is calculated numerically, and the performance evaluation criteria are estimated for all cases, as shown in
Figure 11c,f. The data in the red column are for the parallel flow case, and the data in the dotted column are for the perpendicular flow case. It is observed that when the flow is parallel, less pressure drop is attained, and more heat extraction is achieved. Thus, from this finding one can argue that the best cooling is when the flow is parallel to the heated surface. The flow can extract heat from the structure itself and the hot surface. The performance of the TPMS structure is more pronounced since there is no significant buildup of the boundary layer.
7. Thermohydraulic Performance of the TPMS for a Porosity of 0.8 and 0.9 for Different Flow Directions
In the previous section, it was shown that parallel flow in the presence of a TPMS structure is the best option for cooling hot surfaces. The modeling is repeated for a porosity of 0.8 and 0.9 for the TPMS structure only. As shown in
Figure 6, a larger void area is present as the porosity increases. The surface area is one of the most critical parameters to investigate in the TPMS. As indicated, the surface area of the gyroid TPMS with a porosity of 0.7, 0.8, and 0.9 is 8.4 × 10
3 cm
2, 4.9 × 10
3 cm
2, and 4.0 × 10
3 cm
2, respectively.
Figure 12 presents the two cases with a porosity of 0.8 and 0.9. There are two findings worth mentioning. First, it is confirmed that the parallel flow case assists in cooling the hot surface more efficiently than the perpendicular cooling condition. The reason is that the surface area decreases as the porosity increases. The second observation is that if one compares
Figure 12 and
Figure 11, it can be concluded that the gyroid with a porosity equal to 0.7 provides the best cooling mechanism when the flow is parallel to the hot surfaces. The uniform temperature distribution is evident in all cases, and the Nusselt number is higher for the TPMS which has a porosity of 0.7. However, as indicated earlier, the fluid occupies a more significant void because the porosity increases. Thus, the pressure drop is lower with higher porosity. This is why the performance evaluation criteria are higher for a porosity equal to 0.8. This observation has been mentioned by Saghir et al. [
29], and it is proven here again that it is valid. The gyroid with a porosity equal to 0.8 led to the highest performance evaluation criteria.
The previous section studied the thermohydraulic performance of a gyroid with porosities of 0.7, 0.8, and 0.9. One can extend these findings by examining the flow and thermal profile inside the gyroid structure.
Figure 13 presents the case when a gyroid of different porosity is subject to parallel flow conditions and at the highest flow rate. As shown in
Figure 13a, for a porosity of 0.7, one observes an extensive flow circulation in all directions. Sometimes, the flow hits an obstacle or dead end and follows another flow path.
On the one hand, this phenomenon can enhance heat removal but at the expense of the pressure drop.
Figure 13d shows the volume temperature distribution in the gyroid. The gyroid structure temperature is very low, indicating that the flow removed heat from this structure. Higher temperatures are observed at the structure’s base and in the aluminum block.
As the porosity increases to 0.8, the flow is less intensive; not too much flow recirculation is shown. Also, what is interesting is that due to this lesser amount of circulation, the temperature is lower in magnitude. This means better heat enhancement at this porosity level. One can observe a modest circulation, and backflow is shown. As the porosity increases to 0.9, the flow is like the flow in a channel, with less friction between the flow and the structure. At this porosity, the pressure drop is minimal. It is essential to demonstrate that there exists an optimum porosity where the heat enhancement is excellent and pressure drops are lower. Based on the findings, one may conclude that a TPMS gyroid structure with a porosity equal to 0.8 exhibits the highest performance criteria.


