1. Introduction
High-speed trains are among the fastest and most efficient modes of transportation, having established themselves as essential in modern society, and their speed and efficiency continue to improve. However, this increase in speed brings various challenges, such as an energy consumption increase, noise generation, and operational safety reduction. These issues are predominantly closely related to the aerodynamic characteristics of high-speed trains, making aerodynamic performance improvements crucial to their resolution.
The aerodynamic performance of high-speed trains is not defined by a single factor but manifests in various forms under different conditions. Among these, aerodynamic drag constitutes the majority of running resistance at speeds exceeding 300 km/h, and an increase in drag leads to higher energy consumption [
1]. When high-speed trains pass through tunnels, the micro-pressure waves generated at the tunnel exit can damage surrounding structures, which is related to passenger comfort within the tunnel. Due to the elongated shape of high-speed trains relative to their cross-sectional area, crosswinds can have severe impacts, such as causing derailments, making crosswind stability crucial for the operational safety of the trains. These external shapes, especially the nose shapes of the leading and trailing car, can largely influence the aerodynamic characteristics of high-speed trains. The optimization of the nose shape of high-speed trains is therefore considered the best method to enhance aerodynamic performance [
2].
In the research on the optimal aerodynamic design of high-speed trains, previous studies have primarily focused on single-objective optimization. However, recent studies have increasingly aimed to enhance multi-objective aerodynamic performance by optimizing train nose shapes. Kwon et al. optimized an axisymmetric nose shape to reduce aerodynamic drag and micro-pressure waves [
3]. Kwak et al. achieved an optimal design to reduce the overall aerodynamic drag of a front–rear symmetric train based on cross-sectional distribution for reducing micro-pressure waves [
4]. He et al. proposed an improved optimization algorithm and derived an optimal design to minimize the total aerodynamic drag and the absolute value of the lift on the trailing car [
5]. Sun et al. utilized an LSF-based FFD technique to create an optimal design that reduces aerodynamic drag and aero-acoustic noise [
6]. Wang et al. employed PDE-based parametric modeling to conduct a multi-objective nose optimization that minimizes the total aerodynamic drag and the absolute value of the lift on the rear car [
7]. Munoz-Paniagua and Garcia optimized the nose shape of high-speed trains concerning lateral stability under crosswind and passing-by conditions [
8]. Zhang et al. optimized the nose shape of a high-speed train with the objective functions of minimizing total aerodynamic drag, lift, and side force on the leading car under crosswind conditions [
9].
However, there are still few design cases that optimize energy efficiency, such as reducing vehicle resistance, considering actual railway operating conditions. In particular, in South Korea, approximately 63% of the land is mountainous, resulting in a higher proportion of tunnels in high-speed rail operation sections compared to other countries. Various aerodynamic issues that may arise when running through tunnels, such as micro-pressure waves and pressure fluctuations inside tunnels, must be considered when designing high-speed trains. Additionally, due to the climatic characteristics of South Korea, numerous typhoons pass through the Korean Peninsula during the summer, often accompanied by heavy rain and strong winds. Crosswind safety must therefore be considered in high-speed train design to mitigate the risk of a train overturning due to strong winds.
2. Methodology
2.1. Vehicle Modeling Function
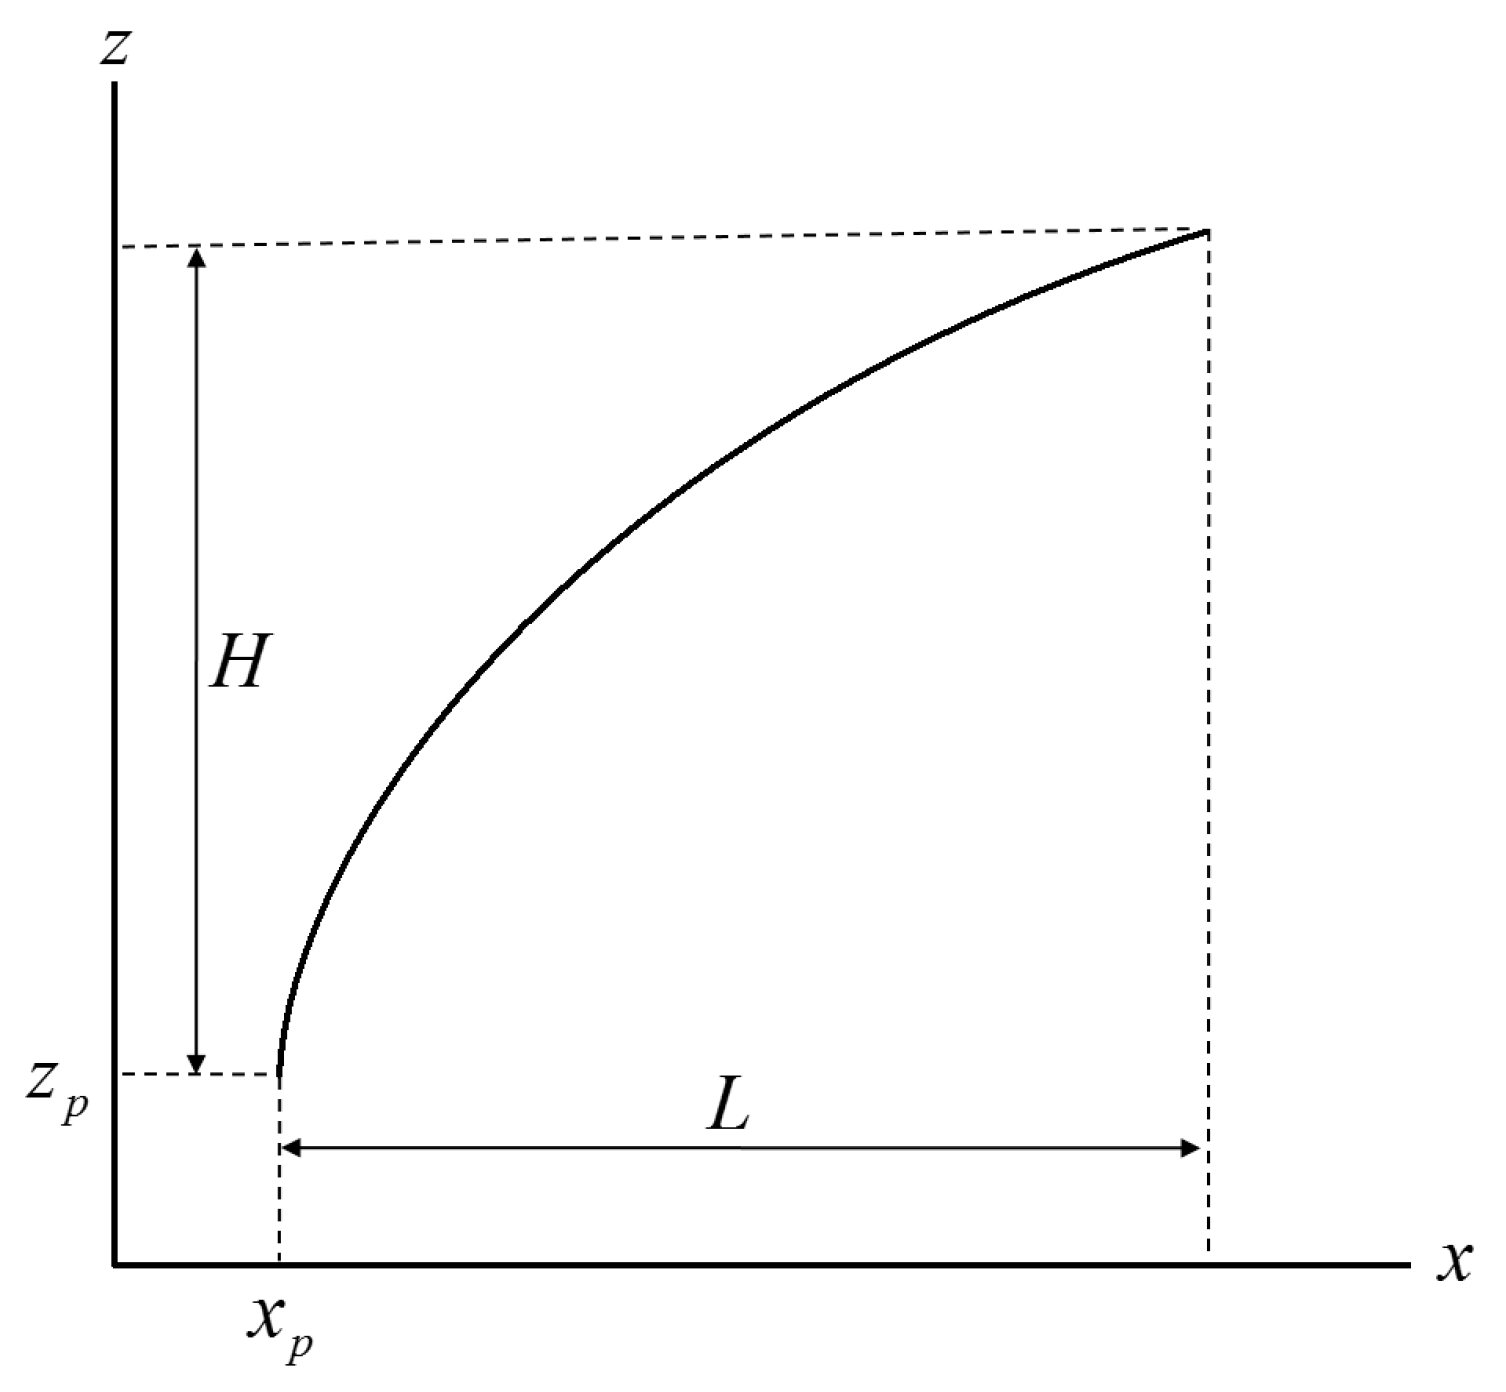
The vehicle modeling function that simulates the nose shape of high-speed trains is based on the fundamental curve expressed by Equation (1), as shown in
Figure 1. Given the starting point (x
p, z
p), width (L), and height (H), the shape is determined by coefficients that adjust the curvature. By combining multiple fundamental curves from the vehicle modeling function, it is possible to simulate the 2D cross-sectional shapes of a high-speed train nose, and based on these 2D cross-sectional shapes, the 3D shape can be constructed [
10,
11].
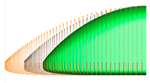
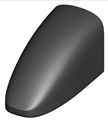
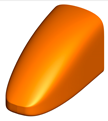
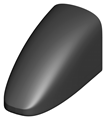
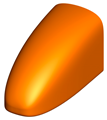
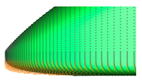
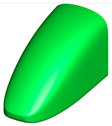
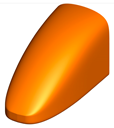
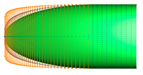
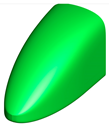
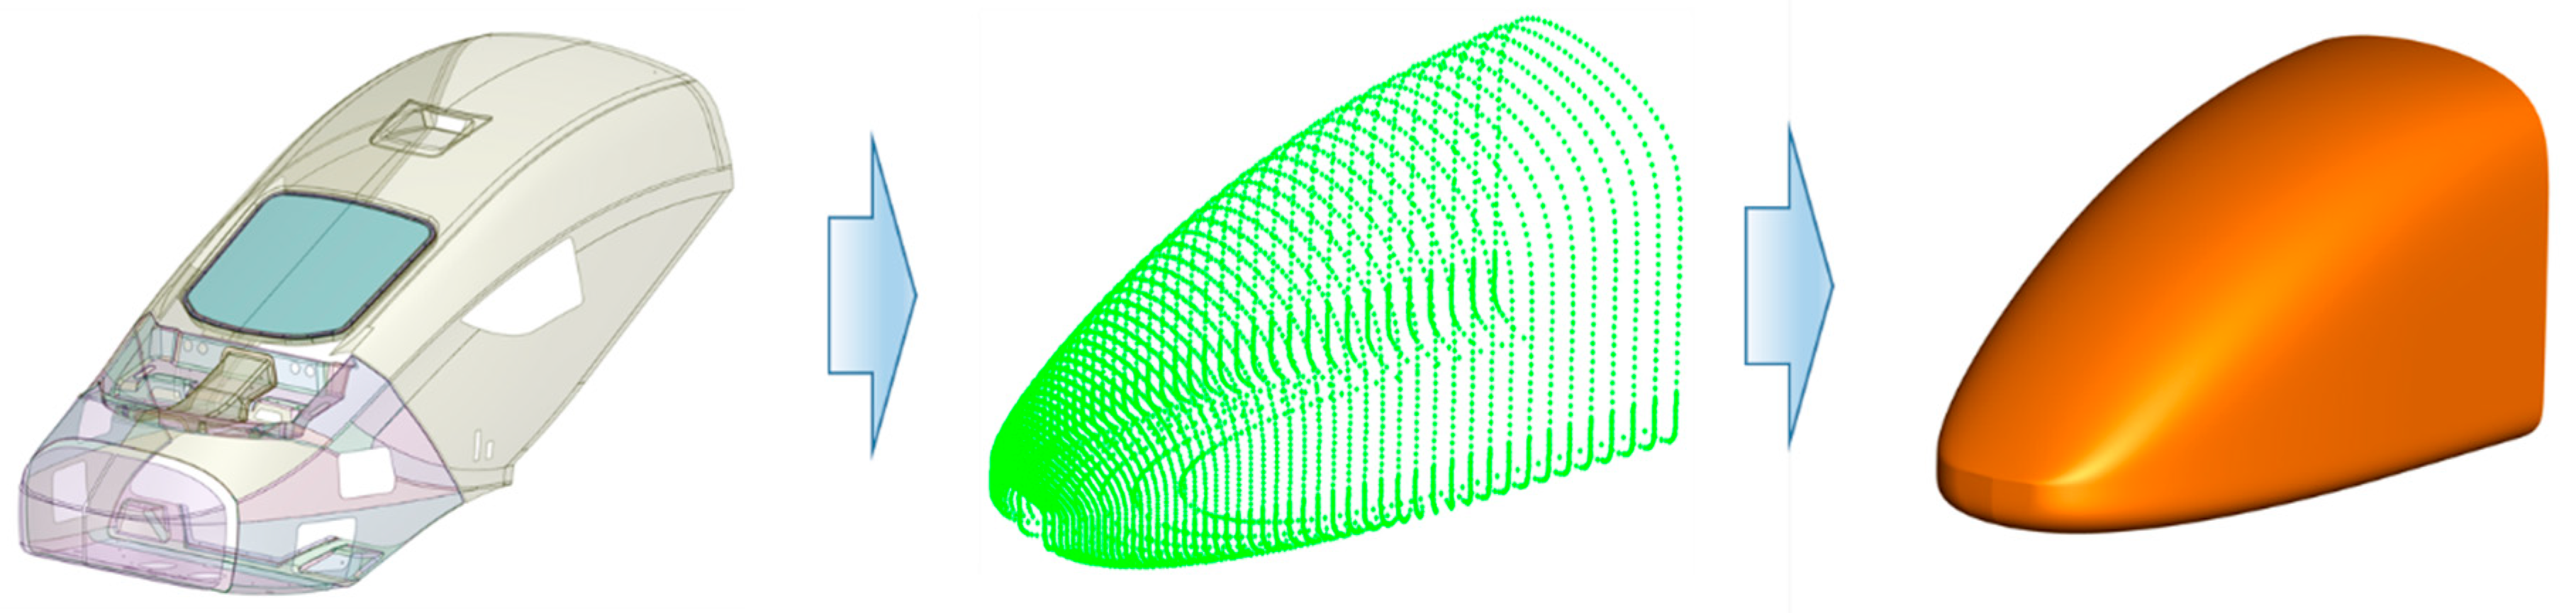
The process of constructing the 3D shape of the EMU-320 train using the vehicle modeling function is shown in
Figure 2. By varying the coefficients of the train shape function and performing iterative calculations, the coefficients that best simulate the actual 3D shape are derived. These derived coefficients are then used to construct the 3D shape, simplifying and parameterizing the EMU-320 shape. From an overall isometric projection perspective, the derived 3D basic shape relatively similarly simulates the actual shape. Due to the nature of parameterization, it is challenging to represent every geometric irregularity; so, the simulation is performed from an engineering perspective.
2.2. Numerical Method
The analysis model for evaluating aerodynamic drag and crosswind effects is a streamlined model of the EMU-320, consisting of three cars without bogies and pantographs, as shown in
Figure 3. The nose shape derived using the vehicle modeling function was applied to both the leading and trailing cars. To maximize the impact of the nose shape, other influencing factors were removed, and a streamlined model was used as the analysis model. The train model has a width of 3.14 m, a height of 3.67 m, and a total length of 75 m. The gap between the train model and the ground is 0.445 m, which is the sum of the distance between the train under floor and the rail upper surface plus the rail height, based on the Korean railway standard [
12].
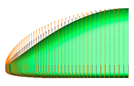
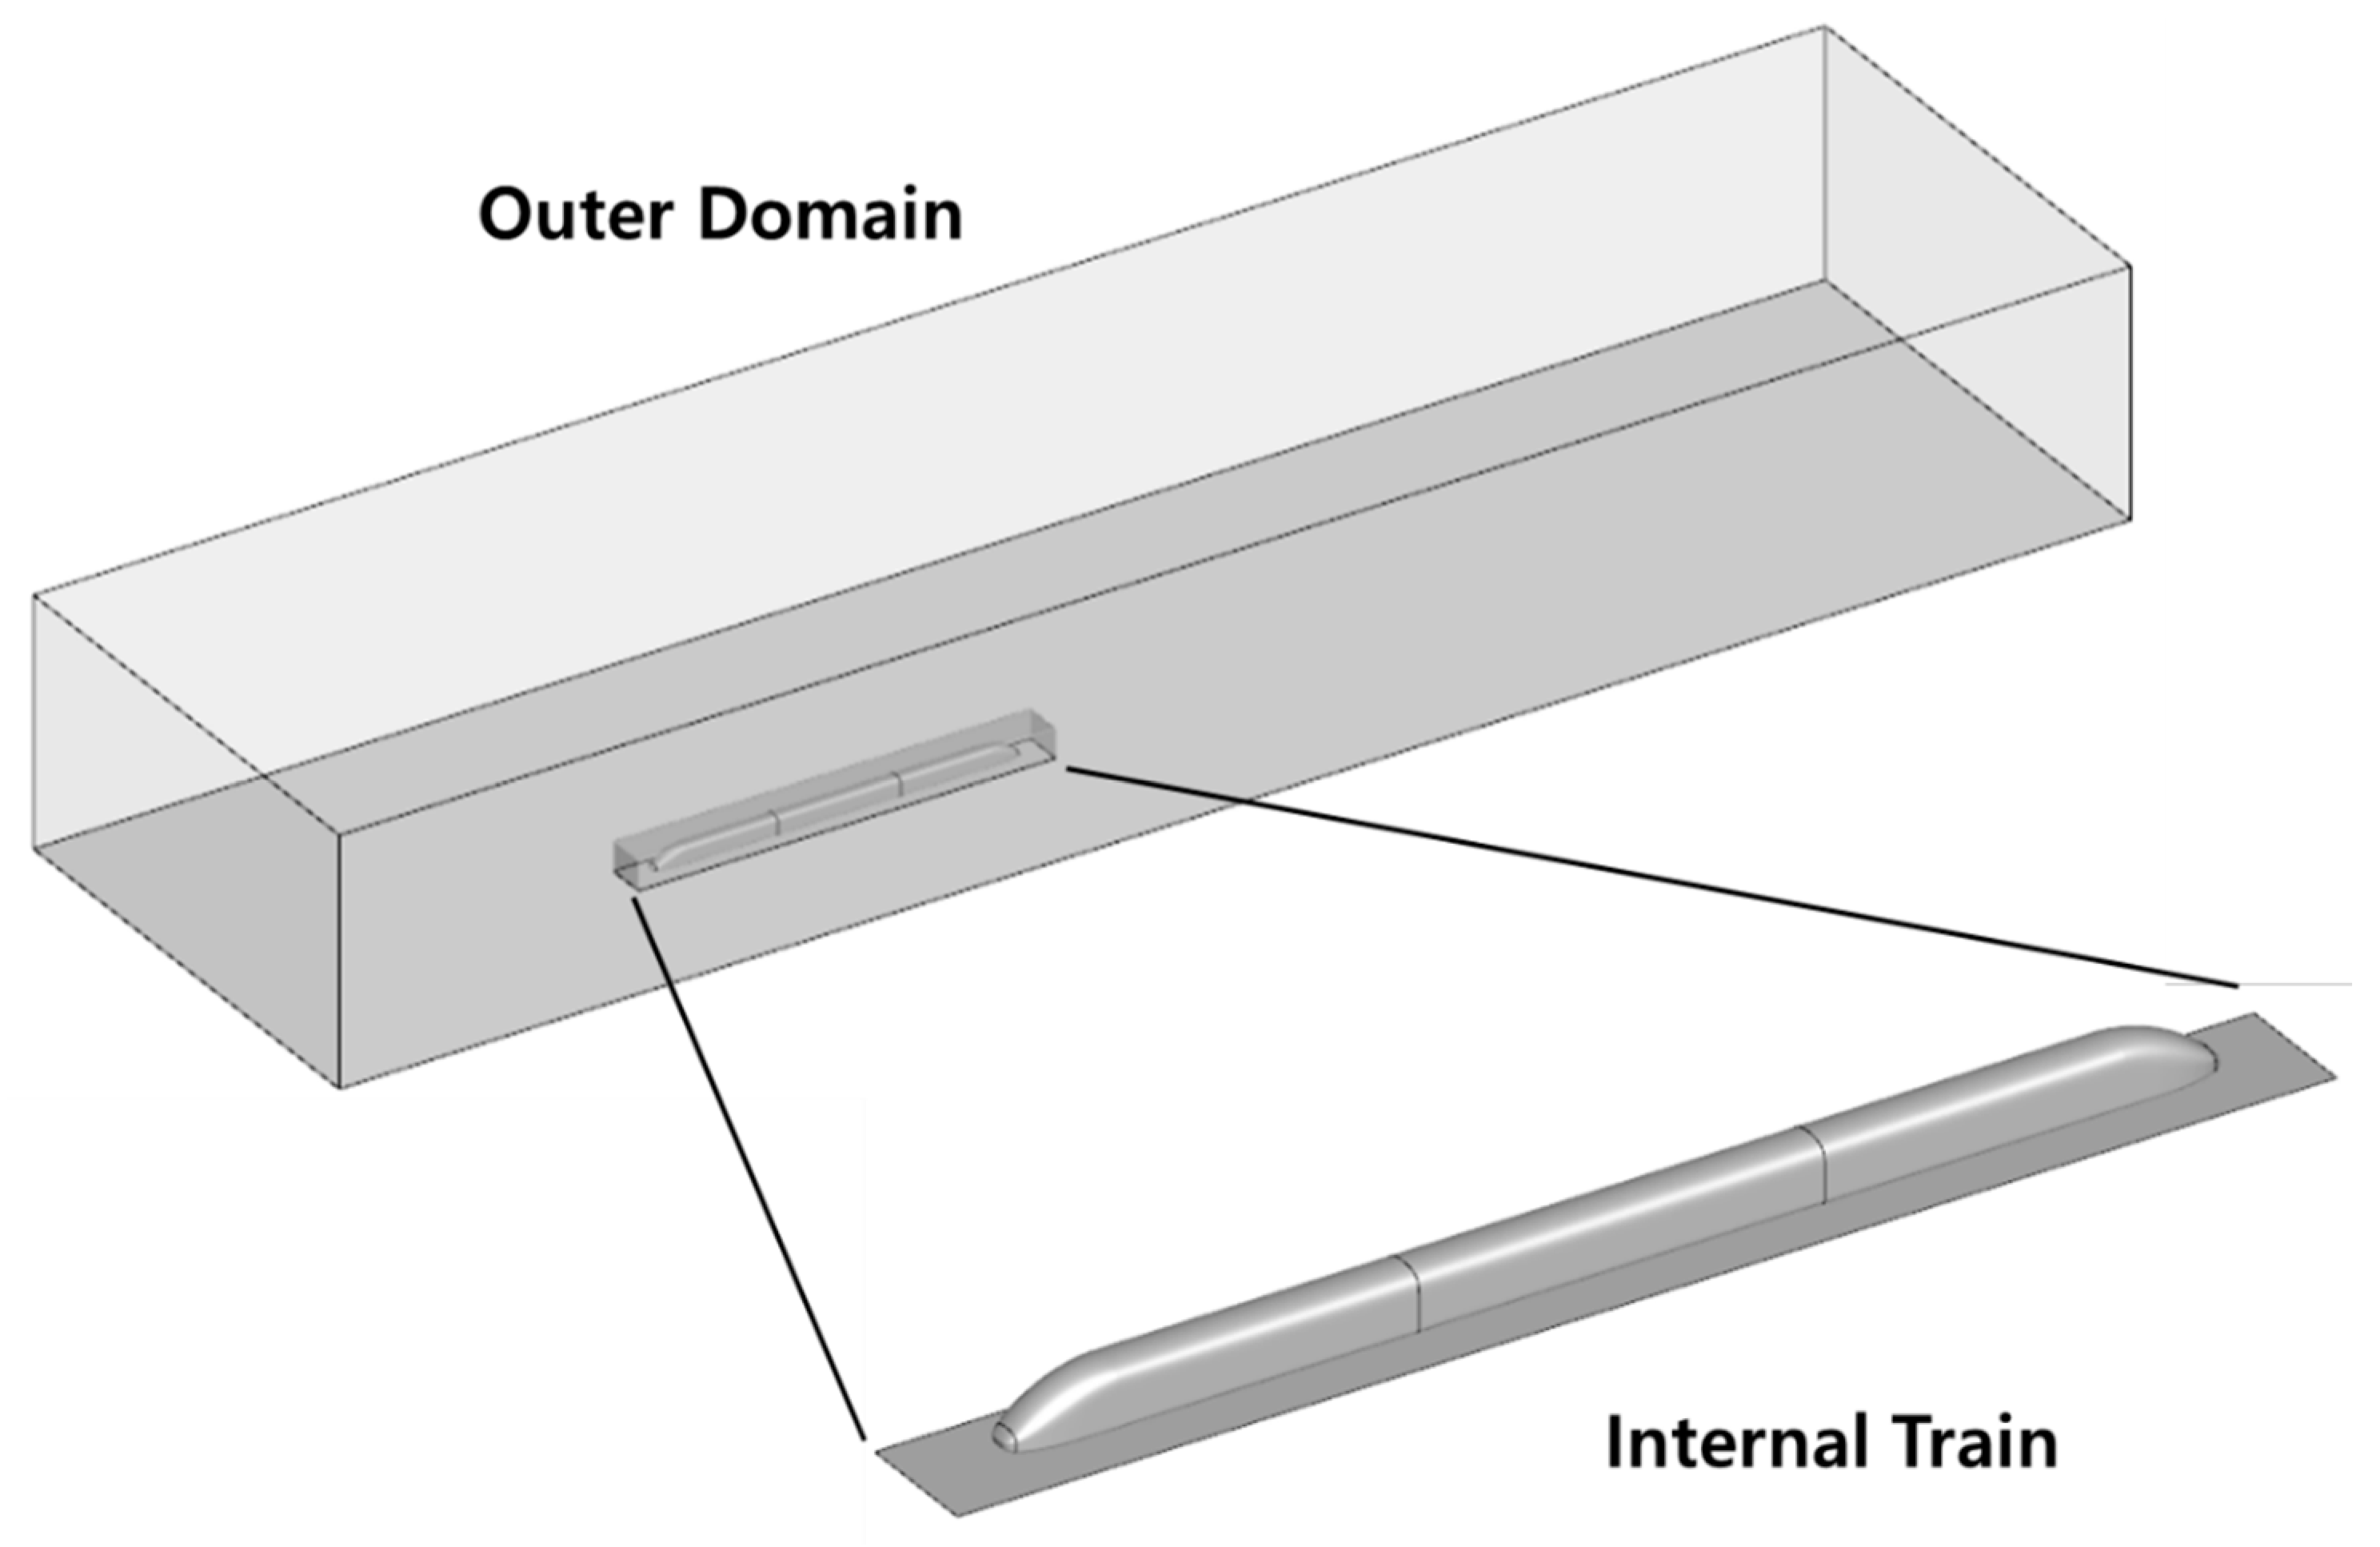
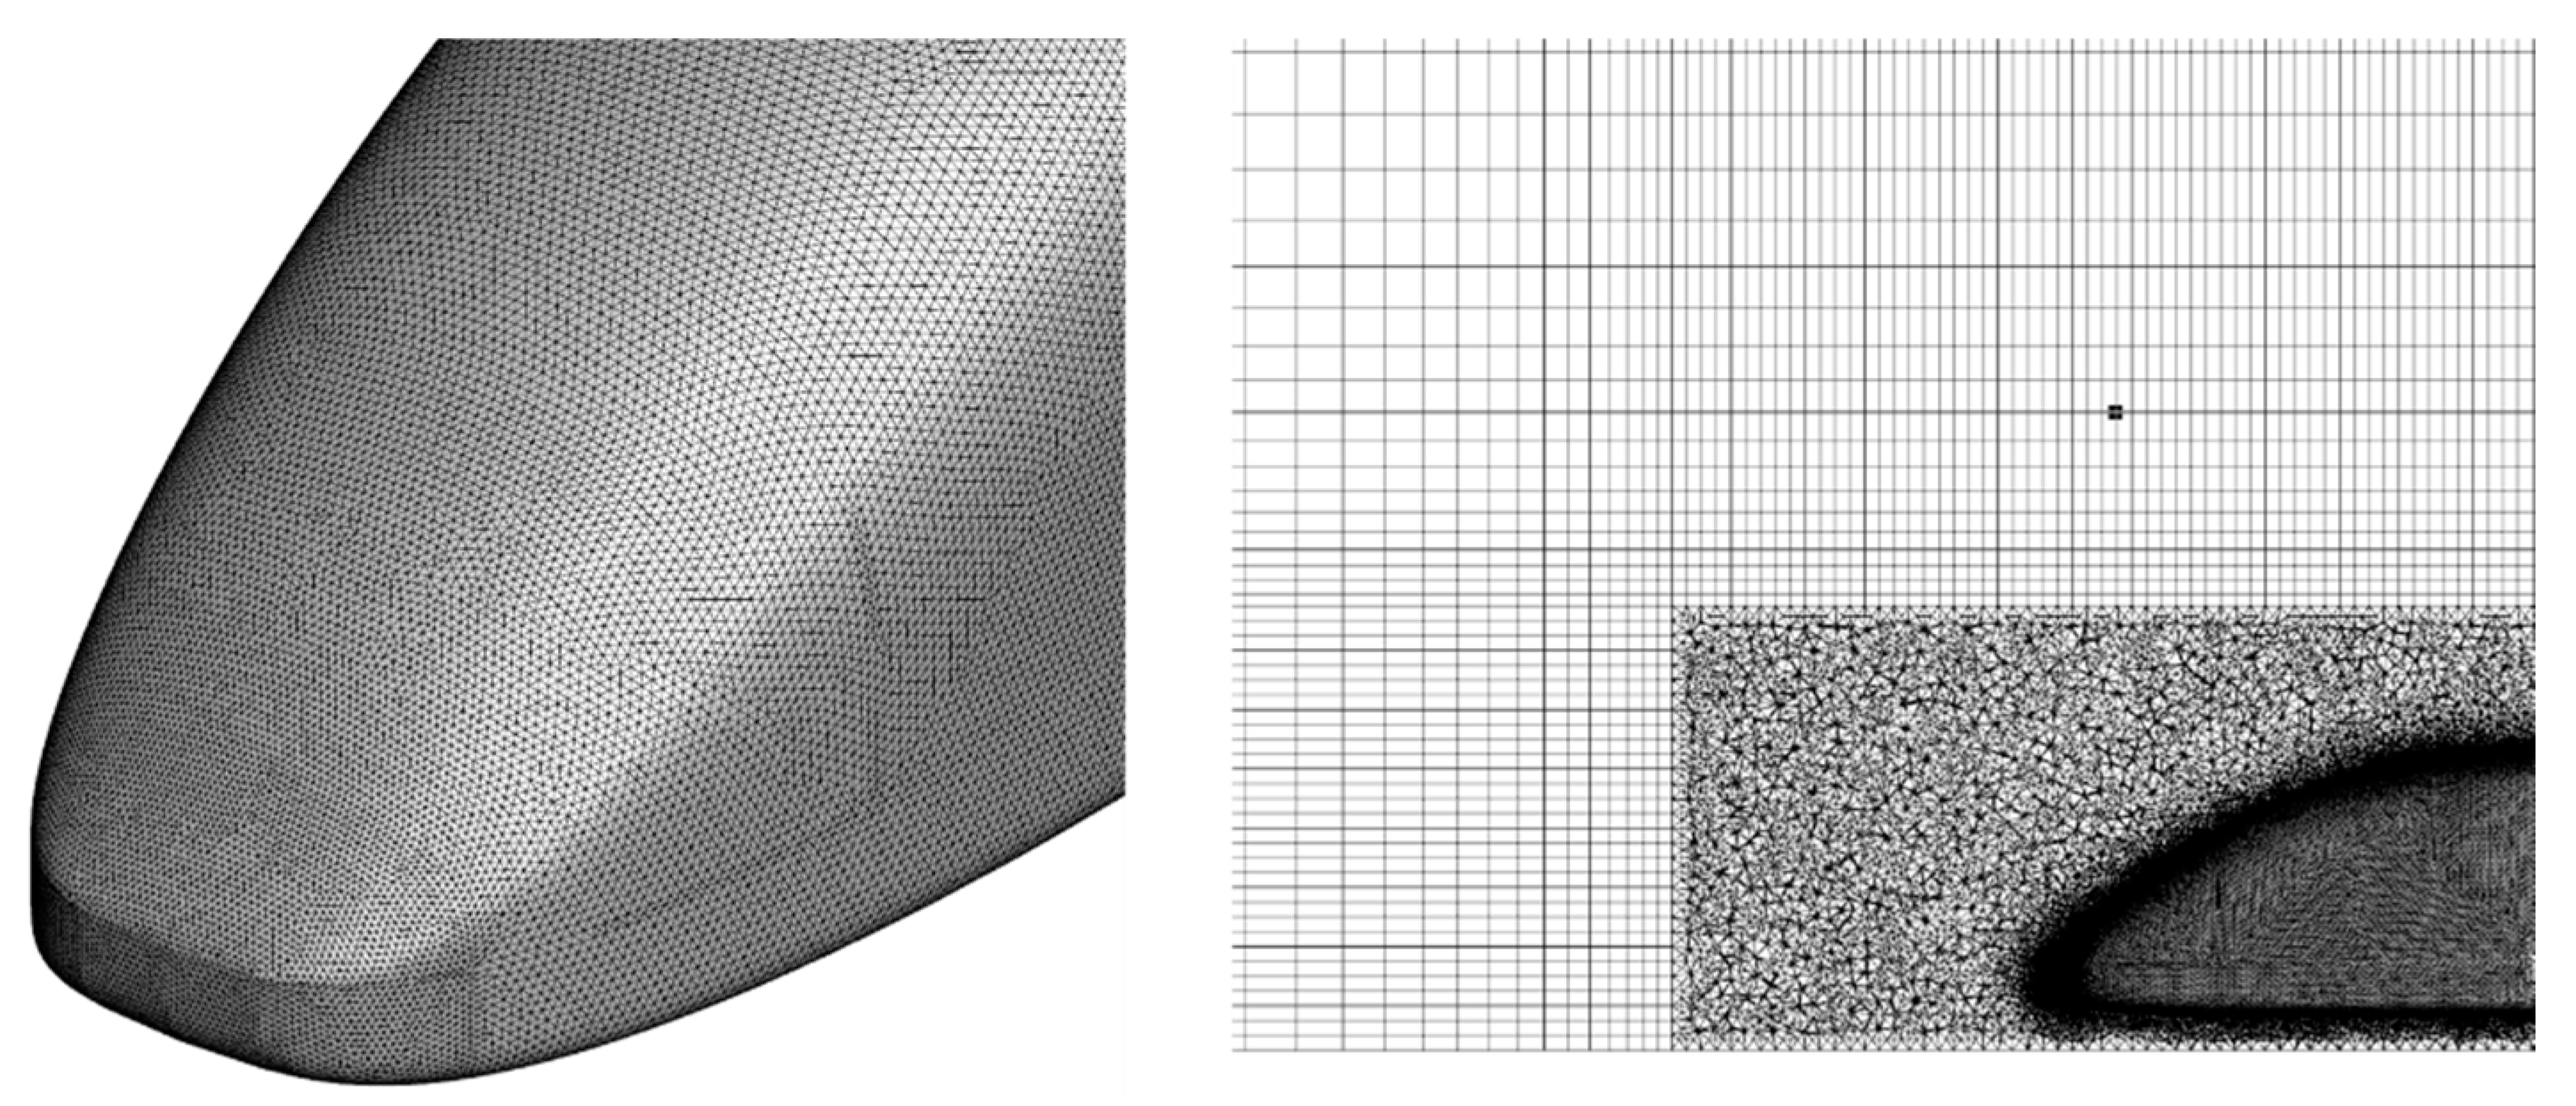
Figure 4 shows the mesh around the surface of the train model with the smallest grid on the nose surface measuring 30 mm. It also shows the mesh around the near field and far field for 3D numerical analysis. To improve the accuracy of the calculations, a dense mesh is required around the vehicle, while the far-field region, where flow changes are minimal, requires a mesh that balances efficiency and economy. In this study, the computational domain was thus divided into near-field and far-field regions, as shown in
Figure 4. For the near-field region, triangular meshes were used with the height of the first mesh layer from the train surface set at 0.2 mm, forming a total of 15 boundary prism layers. Subsequently, tetrahedral meshes were densely distributed in the near-field region. For the far-field region, a structured hexahedral mesh was used to generate the 3D mesh. The total number of 3D mesh elements constructed for each numerical case ranged from approximately 13 million to 14 million. y+ is at the O(1) level.
The commercial CFD solver ANSYS Fluent 2022 R2 is used for aerodynamic drag analysis and crosswind analysis. The governing equations are the three-dimensional compressible Navier–Stokes equations, as shown in Equation (2).
where
.
The turbulence model used was the
model, known for effectively combining the advantages of the
model and
models [
13]. Numerical simulations were conducted at the design maximum speed of the EMU-320, which is 352 km/h. The Reynolds number (Re) based on the train’s speed (V = 352 km/h) and height (h = 3.67 m) is
. For the comparison of aerodynamic drag, the drag coefficient, as shown in Equation (3), was used with a reference cross-sectional area of 10 m
2.
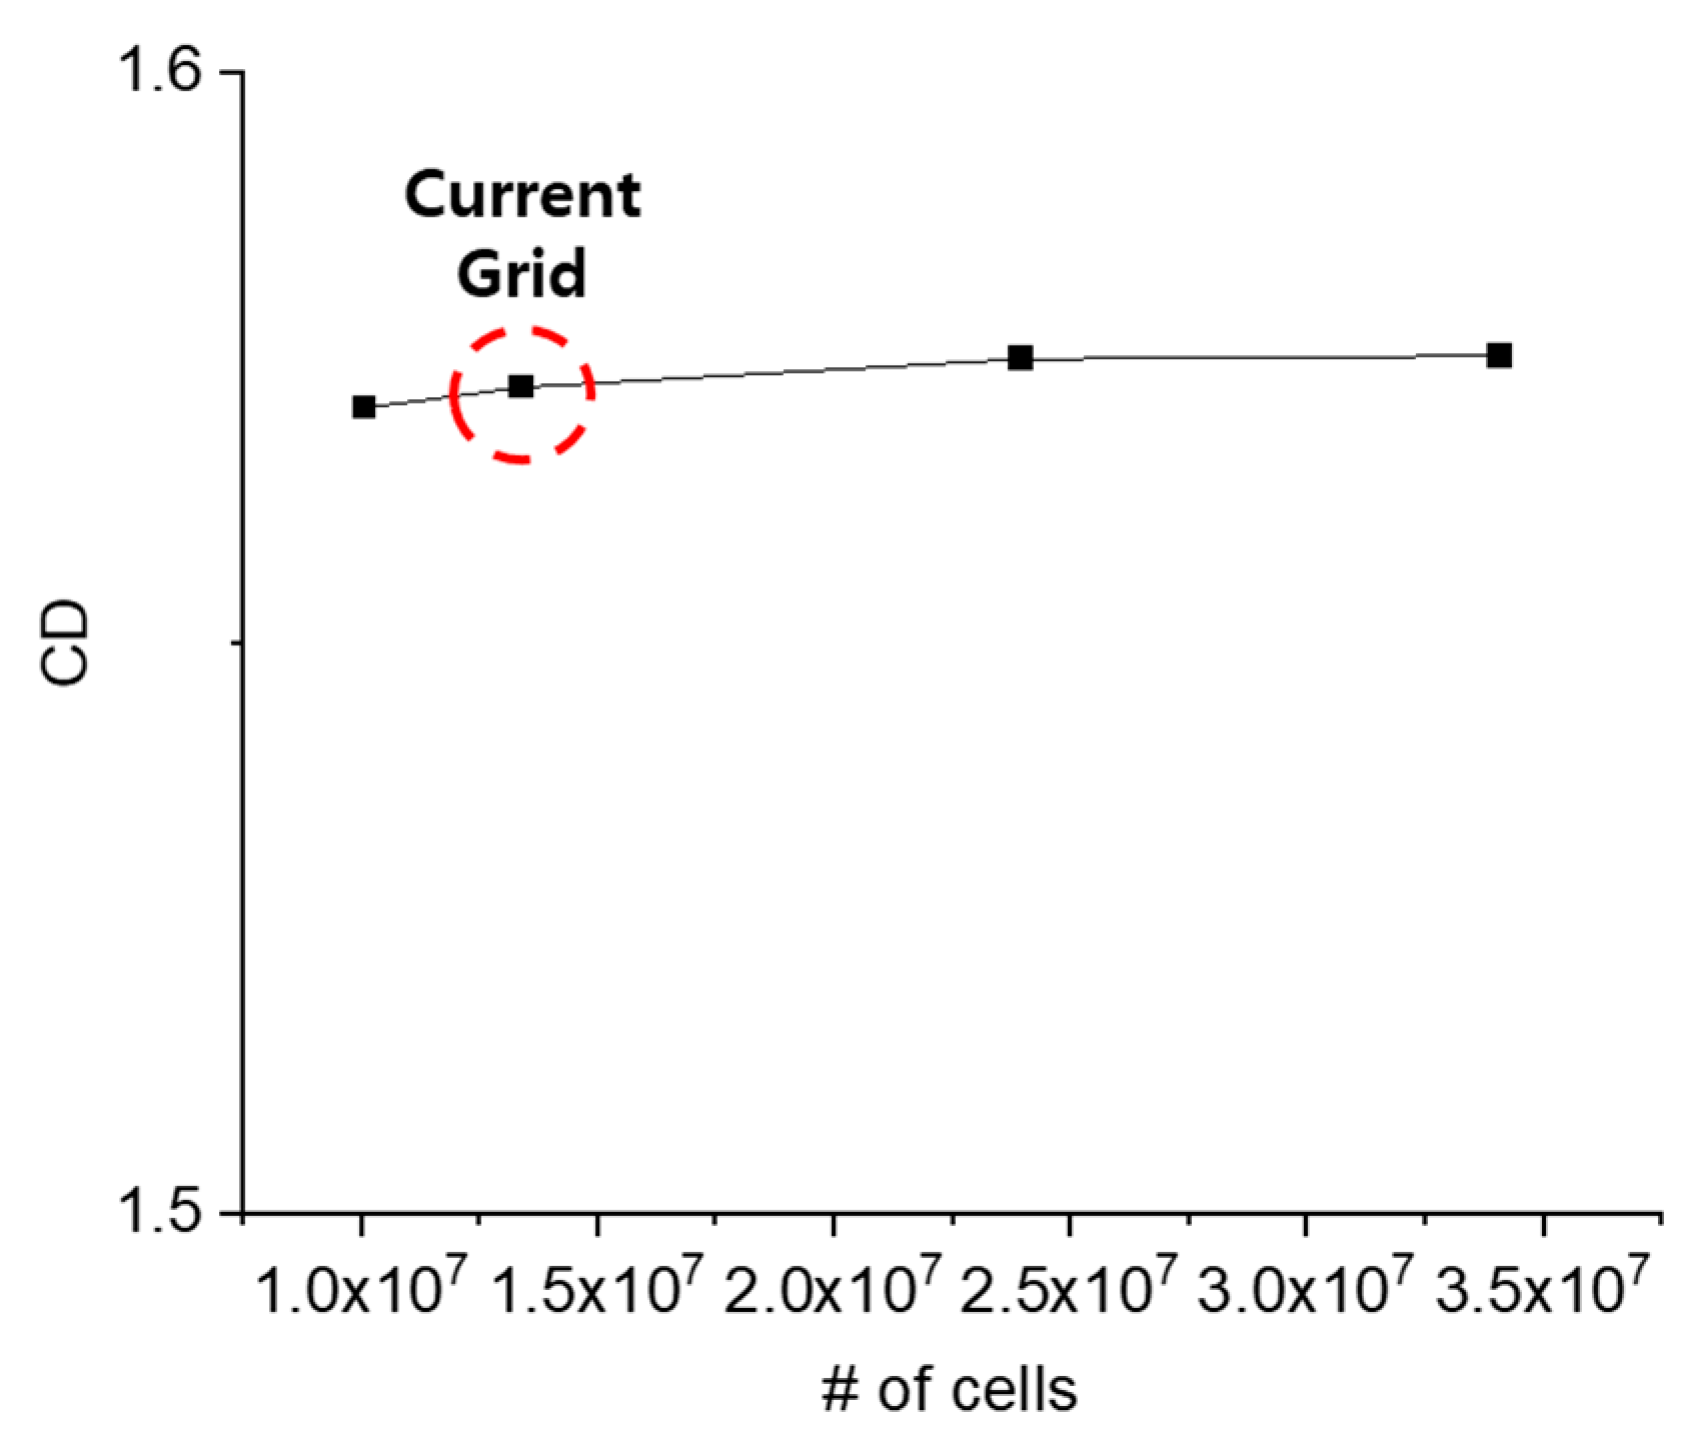
The grid convergence test was conducted as shown in
Figure 5. The C
D value remained constant regardless of the number of cells. Therefore, subsequent analyses were performed using the current grid.
To enhance the efficiency of numerical analysis under crosswind conditions, the flow was assumed to be the vector sum of the inlet flow velocity of 352 km/h (97.8 m/s) in the train’s running direction and a crosswind at an angle of 90 degrees with a speed of 45 m/s, which was determined considering the high-speed rail operation regulations and typhoon speeds. To compare crosswind safety, the side force coefficient, as shown in Equation (4), was used, with a reference cross-sectional area of 263 m
2.
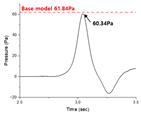
The numerical analysis for predicting micro-pressure waves was conducted using the method proposed by Kwon et al., employing the axisymmetric compressible Navier–Stokes equations derived in a general curvilinear coordinate system, as shown in Equation (5). This axisymmetric compressible analysis provides results close to those of three-dimensional numerical analysis for a high-speed train running in tunnel while offering superior computational efficiency. To enhance computational efficiency, the analysis was therefore performed using axisymmetric numerical methods [
14].
Q represents the conserved quantity vector, E and F are the flux vectors, and H denotes the axisymmetric source term.
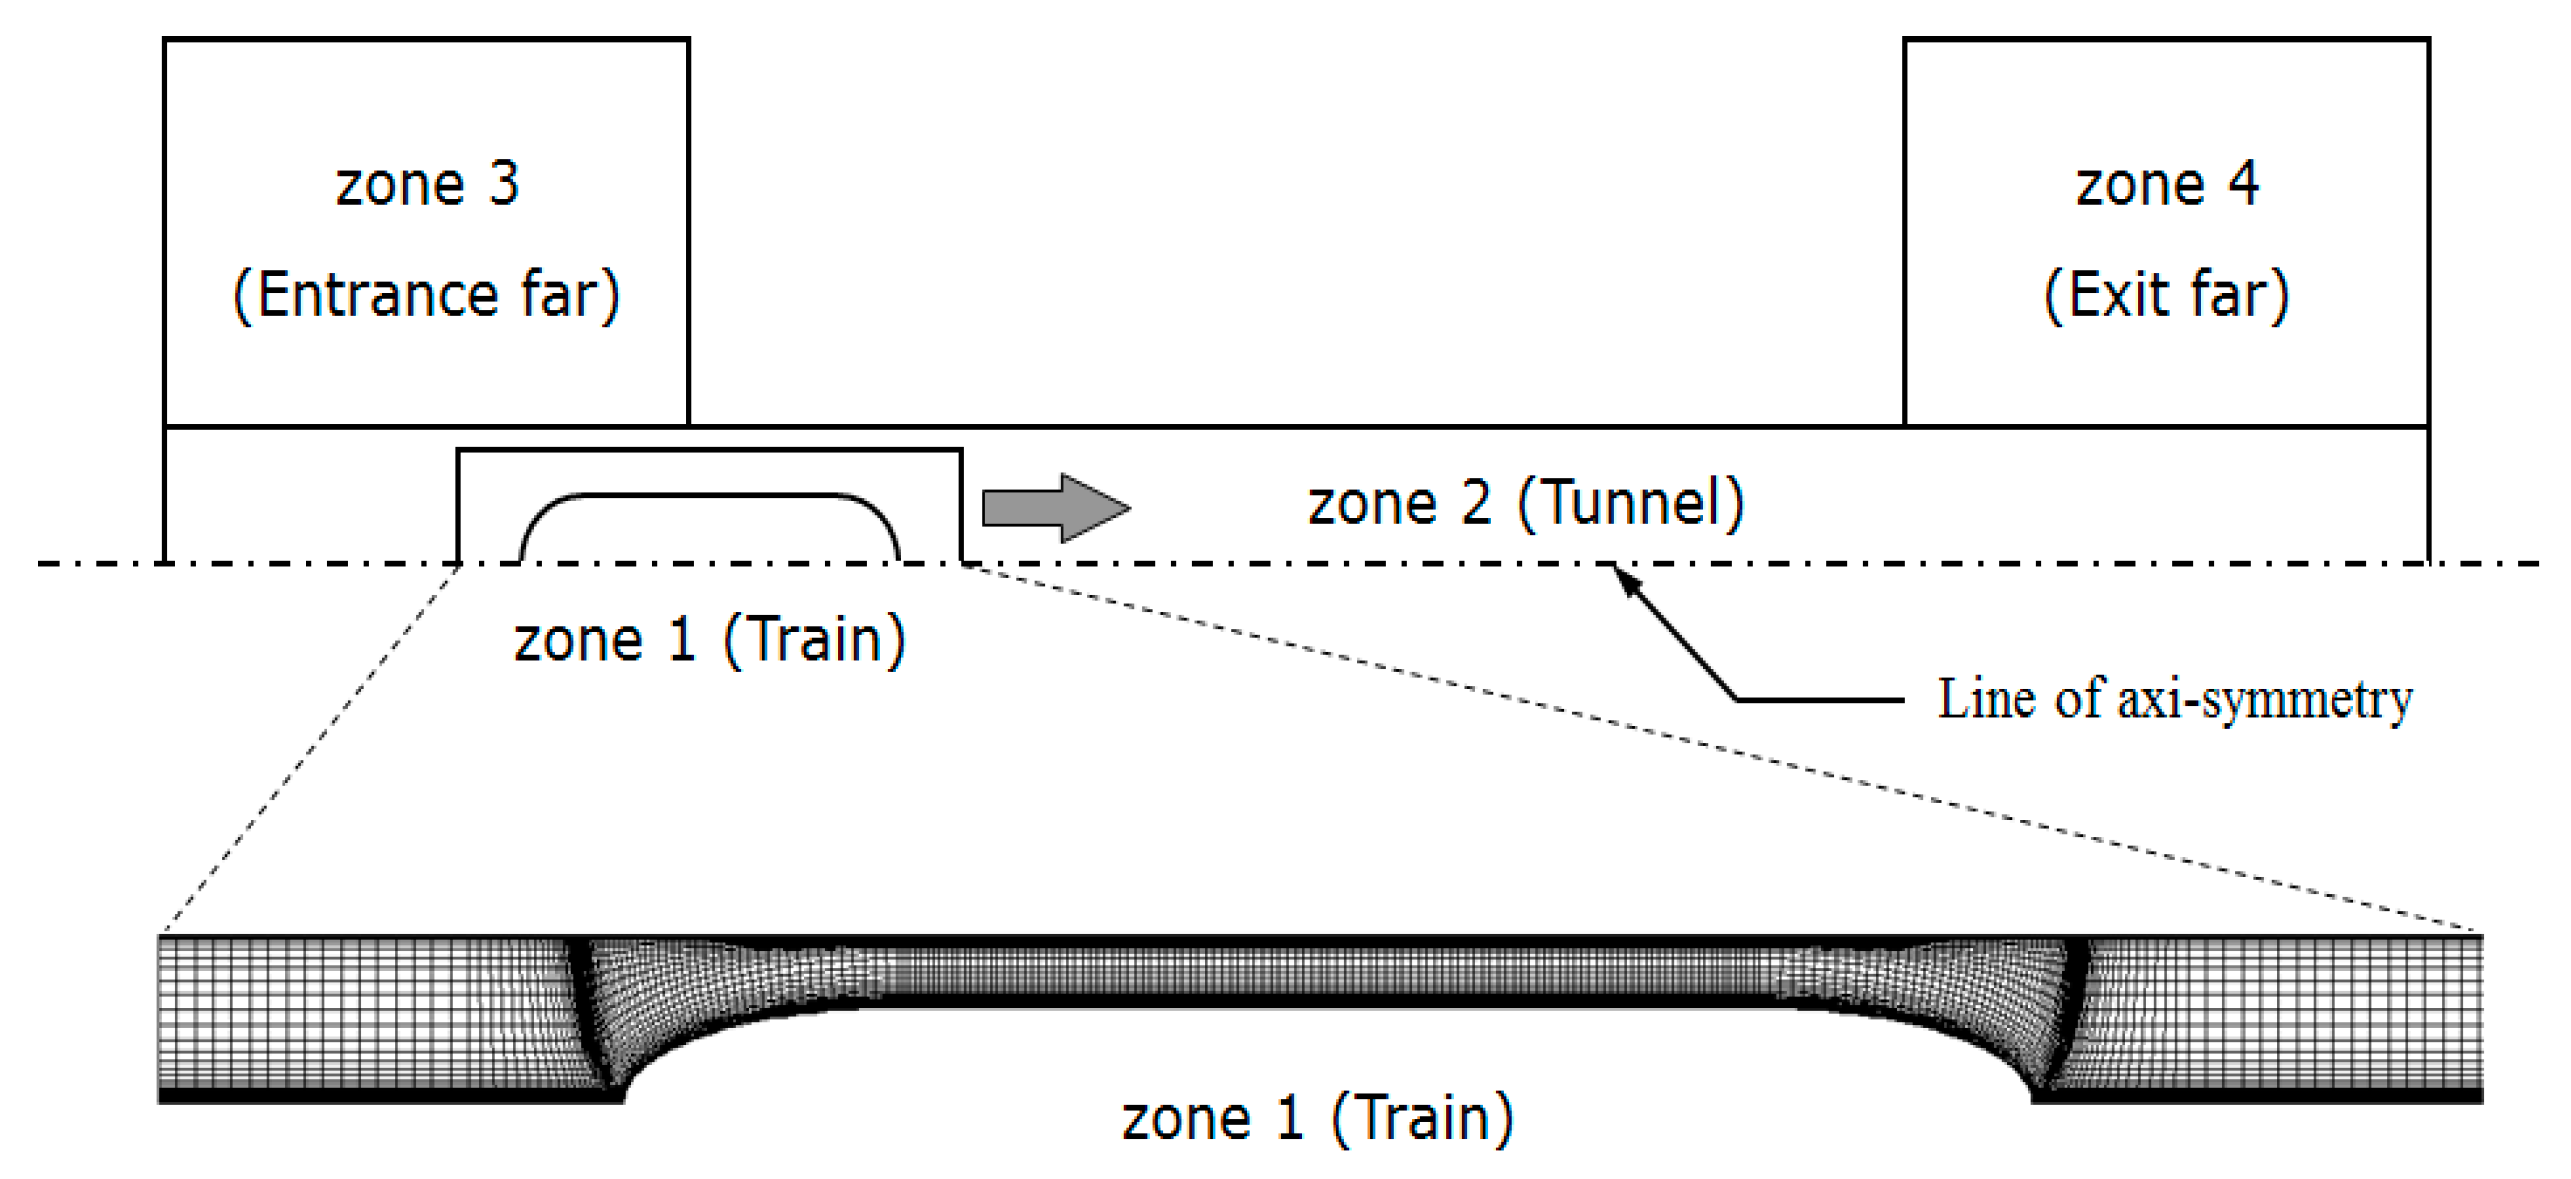
Figure 6 shows the grid system for the axisymmetric analysis. Zone 1 is the mesh around the train, which moves through Zone 2, representing the tunnel. Zones 3 and 4 are the meshes for the entrance and exit regions of the tunnel. The train mesh was applied with the cross-sectional distribution and length of the EMU-320 three-car model used in the 3D analysis. The tunnel mesh is configured with a length of 1 km and a cross-sectional area of 96.7 m
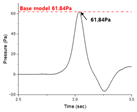
2, based on the Honam high-speed railway route specifications. From pressure fluctuation history at a point 25 m away from the tunnel exit, the first maximum value is extracted and it is used as a micro-pressure wave.
2.3. Two-Stage Optimization Process
By analyzing the basic shape, five design variables that significantly impact aerodynamic performance were selected: nose length, nose tip height, upper and lower surface curvature from a side view, and side surface curvature from a top view. Since the design process involves the nose shape of an actual operating train, the design space was set within the limits that do not violate the spatial allowance for internal equipment and the driver’s field of view. The variations within the design space for each design variable are shown in
Table 1, and due to the constraints of the actual operational vehicle shape, the design space is relatively small.
To derive the experimental points that constitute the design space, the Maximin Latin Hypercube method was used. The Maximin Latin Hypercube method is advantageous for experimental design using computational analysis, as it is known for distributing experimental points across the entire design space without overlap [
15]. Thirty experimental points were extracted to construct the design space.
The effects of each design variable on the corresponding objective functions are shown in
Figure 7. In design variable #5, the side surface curvature significantly affects aerodynamic drag; in design variable #1, the nose length predominantly influences micro-pressure waves; and in design variable #2, the nose tip height has a substantial impact on the side force coefficient. These factors are considered to play a dominant role in deriving the optimal shape.
The design optimization was conducted in two stages, as shown in
Figure 8. Among the three aerodynamic performance objectives, the reduction in aerodynamic drag, which is considered the most critical in the current train operation environment in South Korea, was prioritized and optimized in the first stage [
16]. Subsequently, using the result from the first-stage optimization as a constraint, a multi-objective optimization was performed in the second stage to reduce tunnel micro-pressure waves and improve crosswind safety. In the first stage of optimization, an artificial neural network model was used to construct a surrogate model [
17]. For the five design variables, a single-layer structure with eight hidden nodes was used. The Broyden–Fletcher–Goldfarb–Shanno (BFGS) algorithm was applied for the first-stage optimization method [
18]. In the second stage of optimization, a surrogate model was also constructed using an artificial neural network model. The same five design variables were used, with a two-layer structure consisting of 100 and 20 hidden nodes. The NSGA-II algorithm was applied for the optimization method at the second stage.
3. Results and Discussion
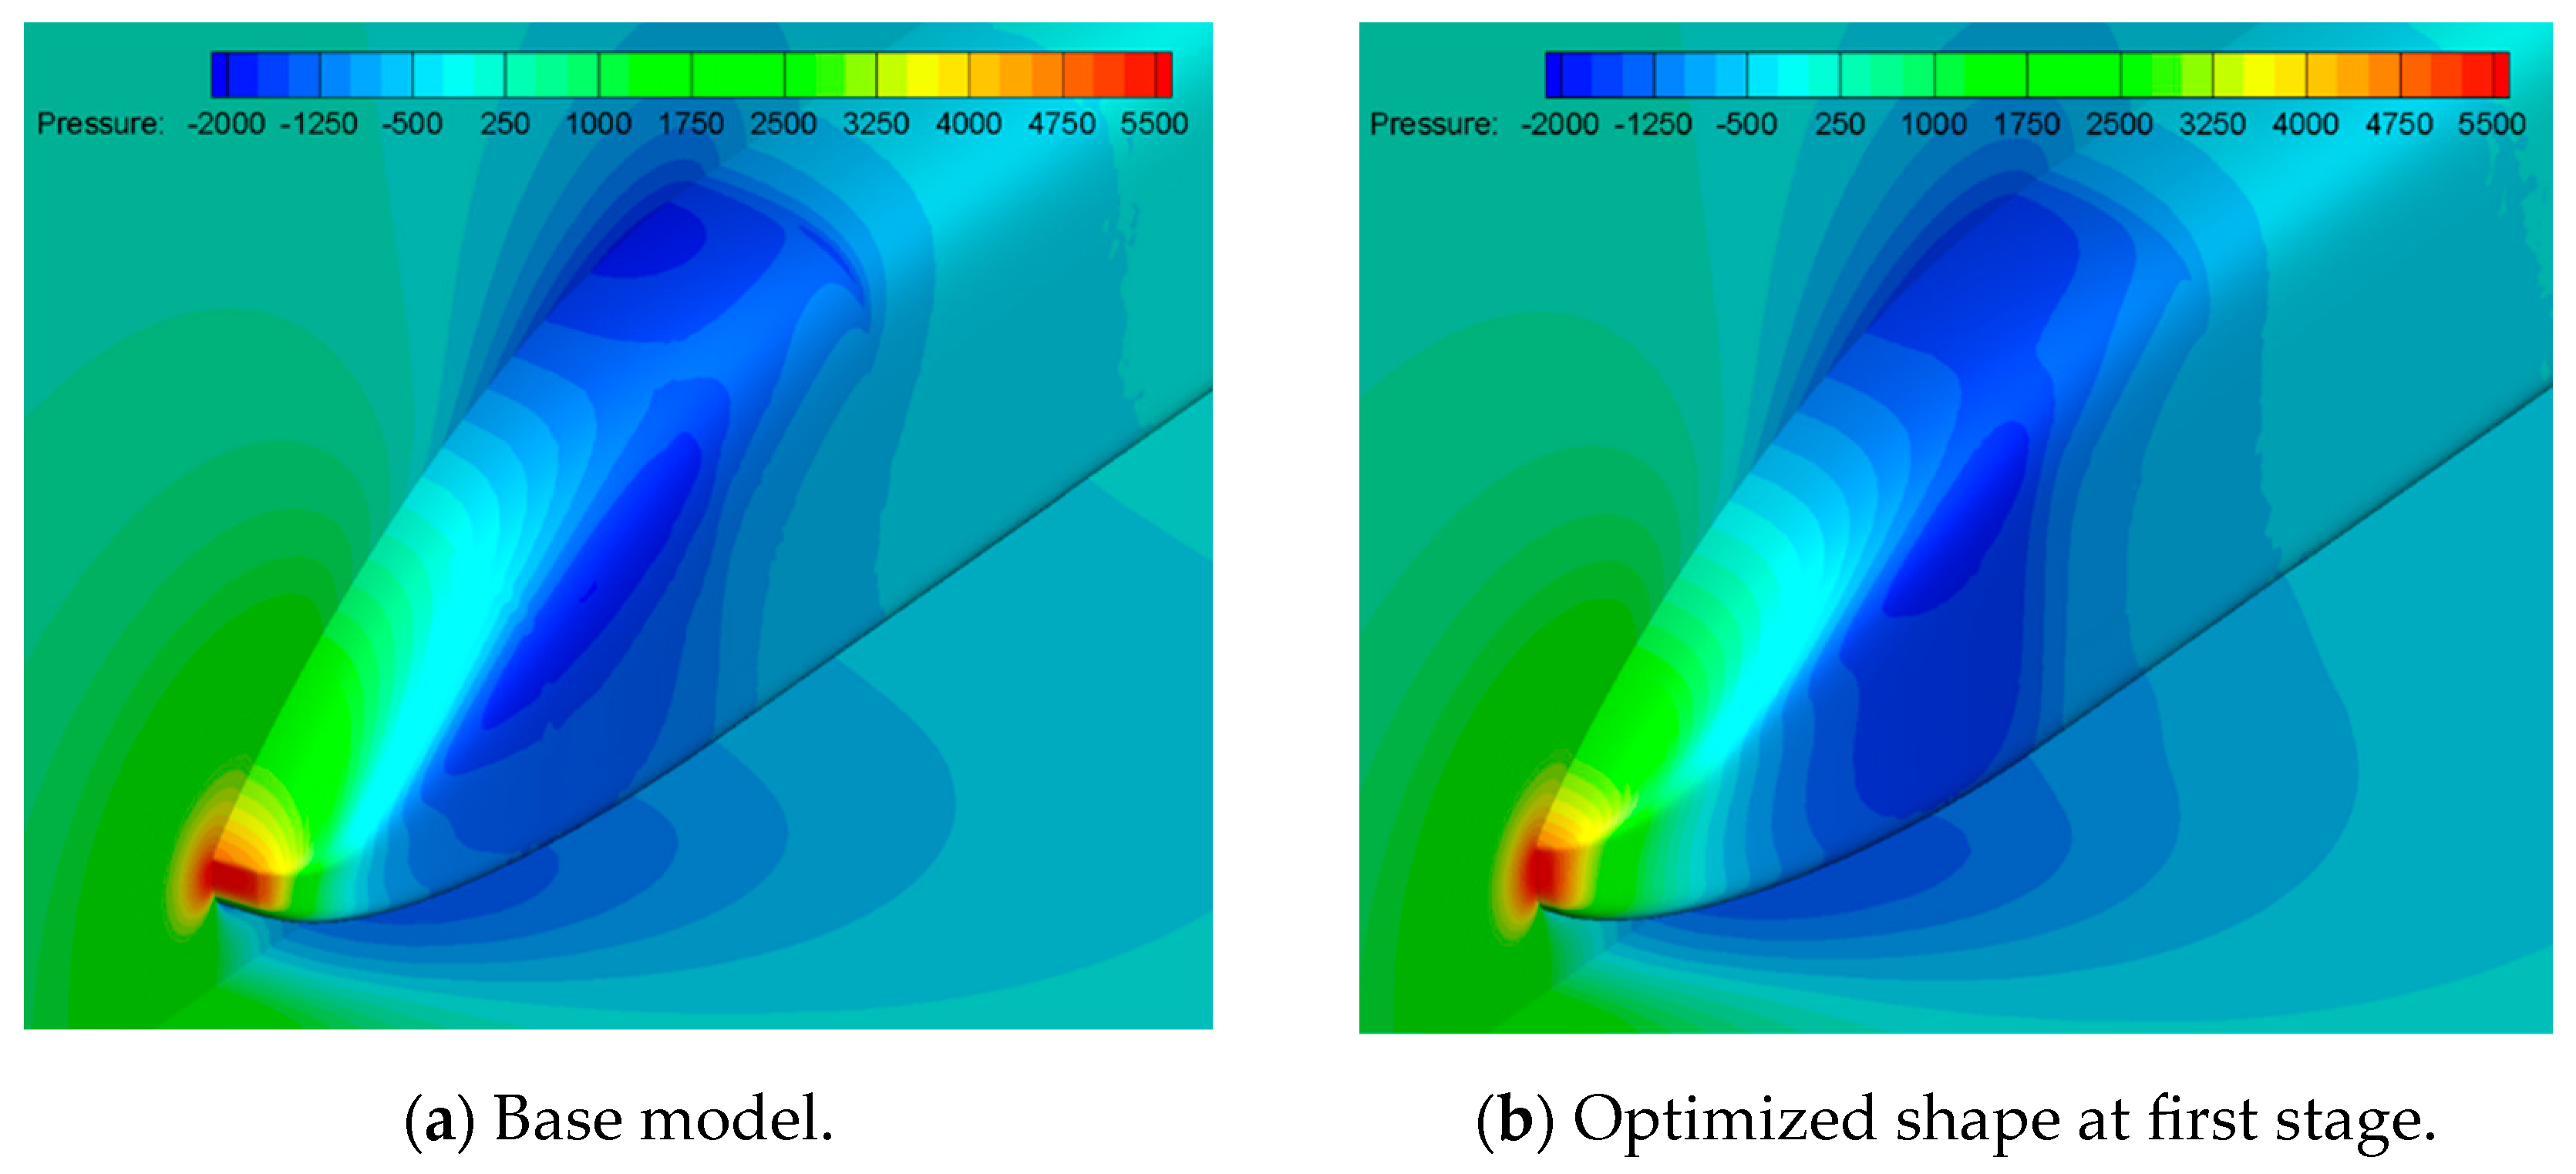
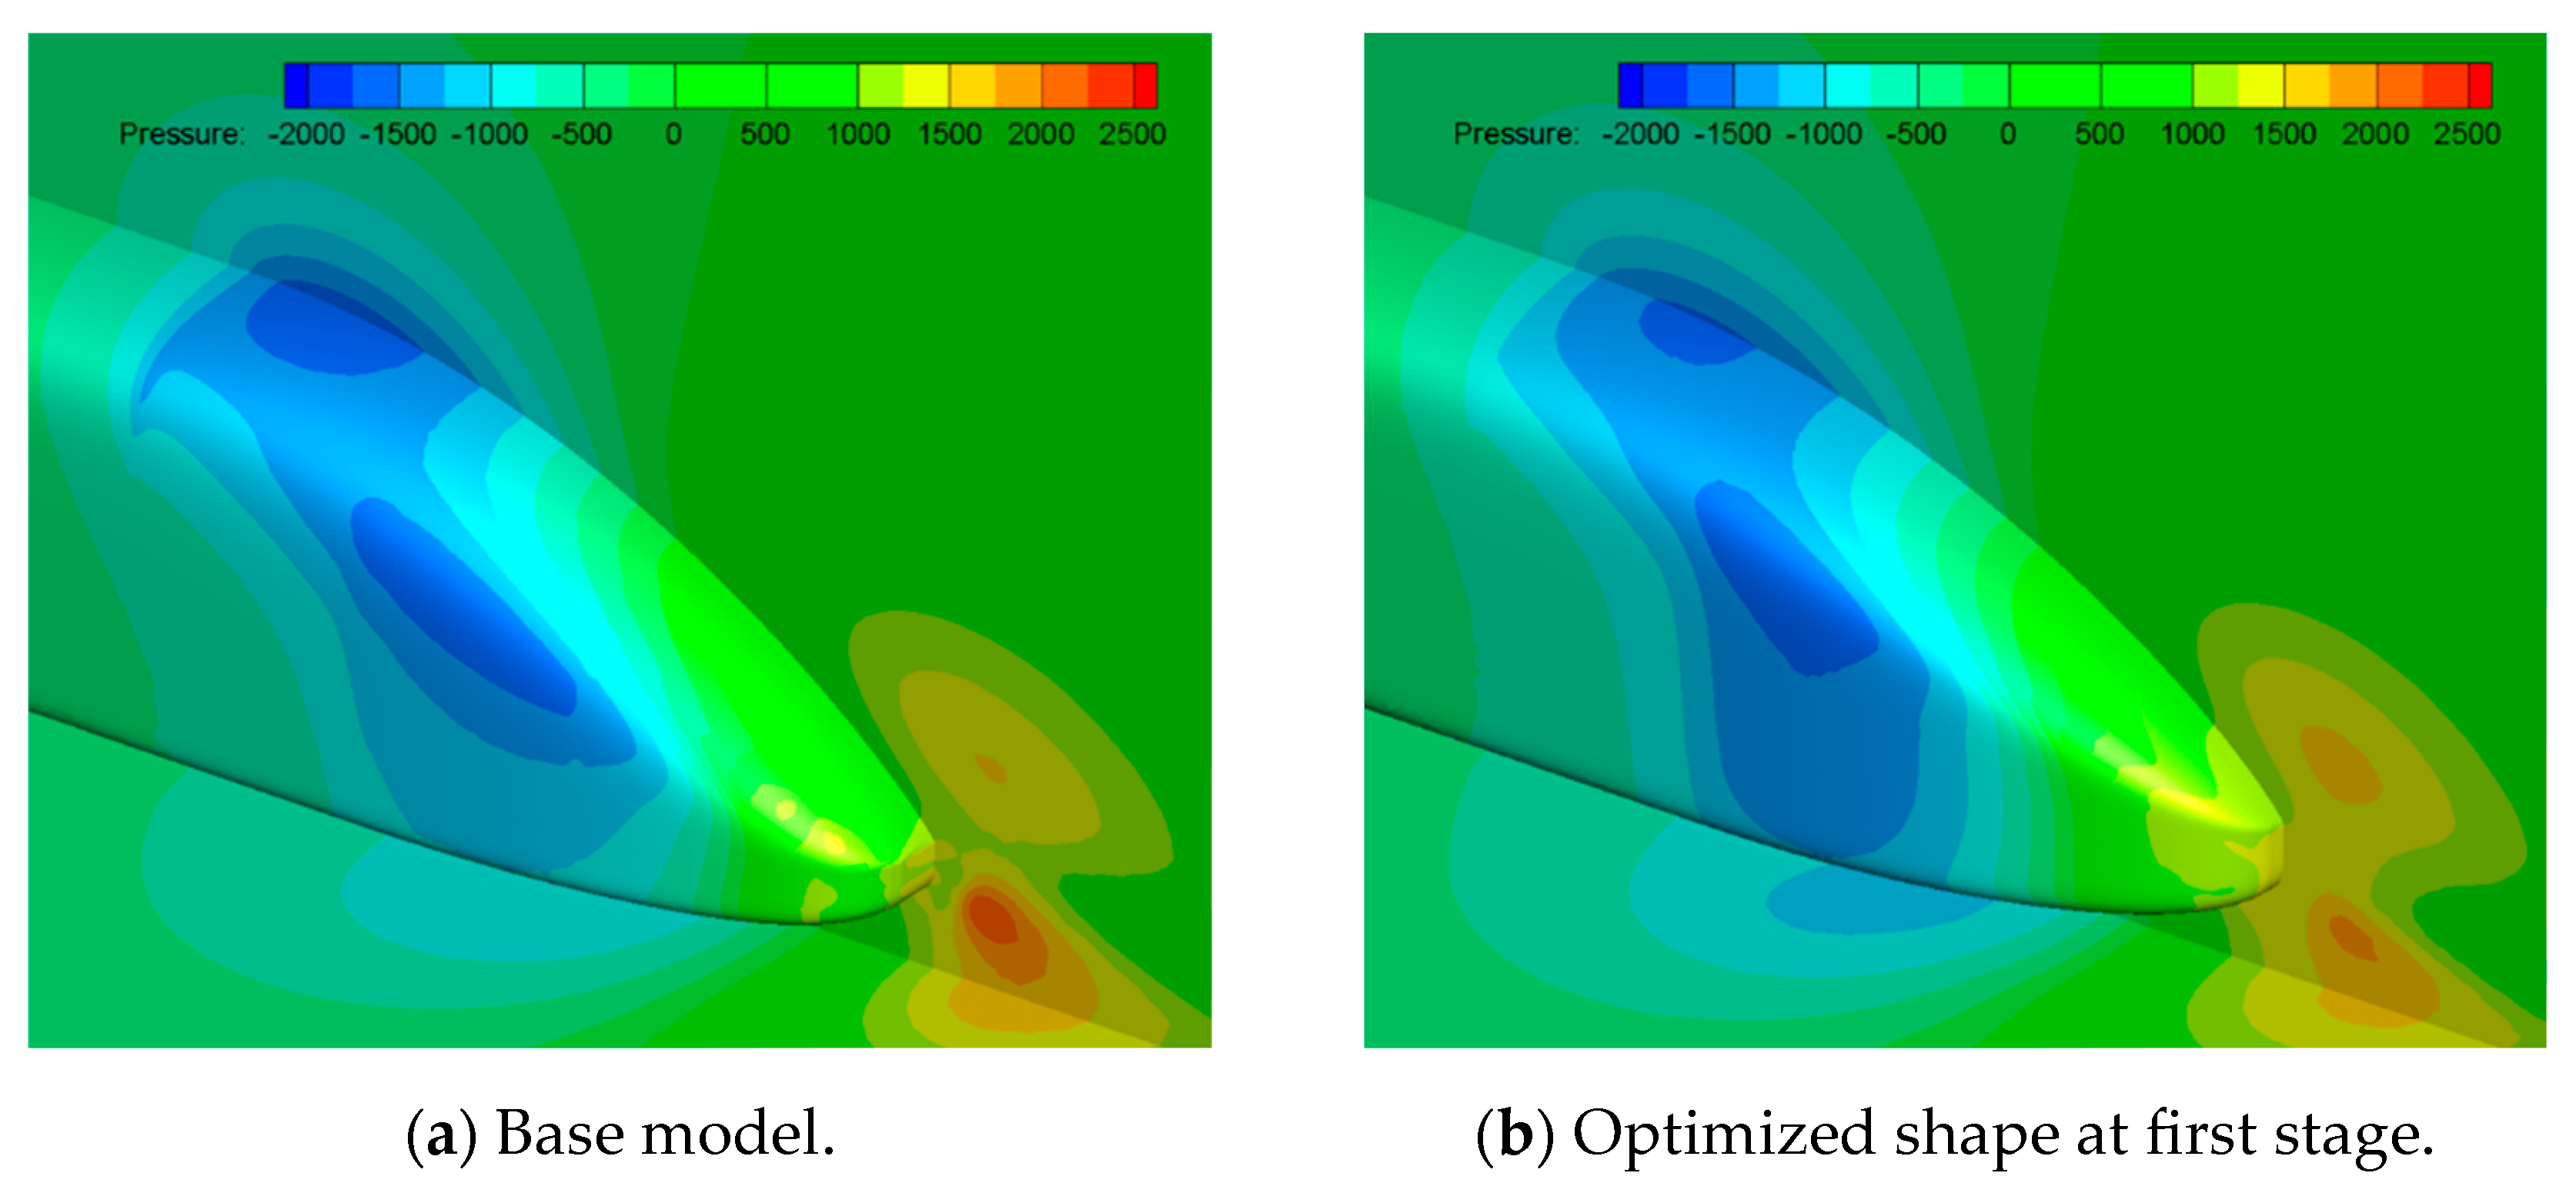
The aerodynamic drag coefficient of the optimized shape derived from the first-stage optimization was 0.1311, representing an approximate 8.7% reduction compared to the base model of 0.1436.
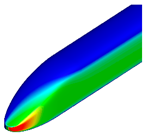
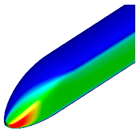
Figure 9 and
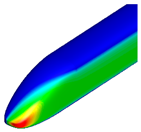
Figure 10 compare the pressure contours around the first and last cars. Around the first car, the transition from a blunt of the base model to a pointed front shape of the optimized shape resulted in a reduction in high-pressure regions, thereby decreasing aerodynamic drag. For the last car, a reduction in low-pressure regions was observed, leading to relatively faster pressure recovery. Additionally, the size of the vortices behind the train was found to be smaller compared to that of the base model.
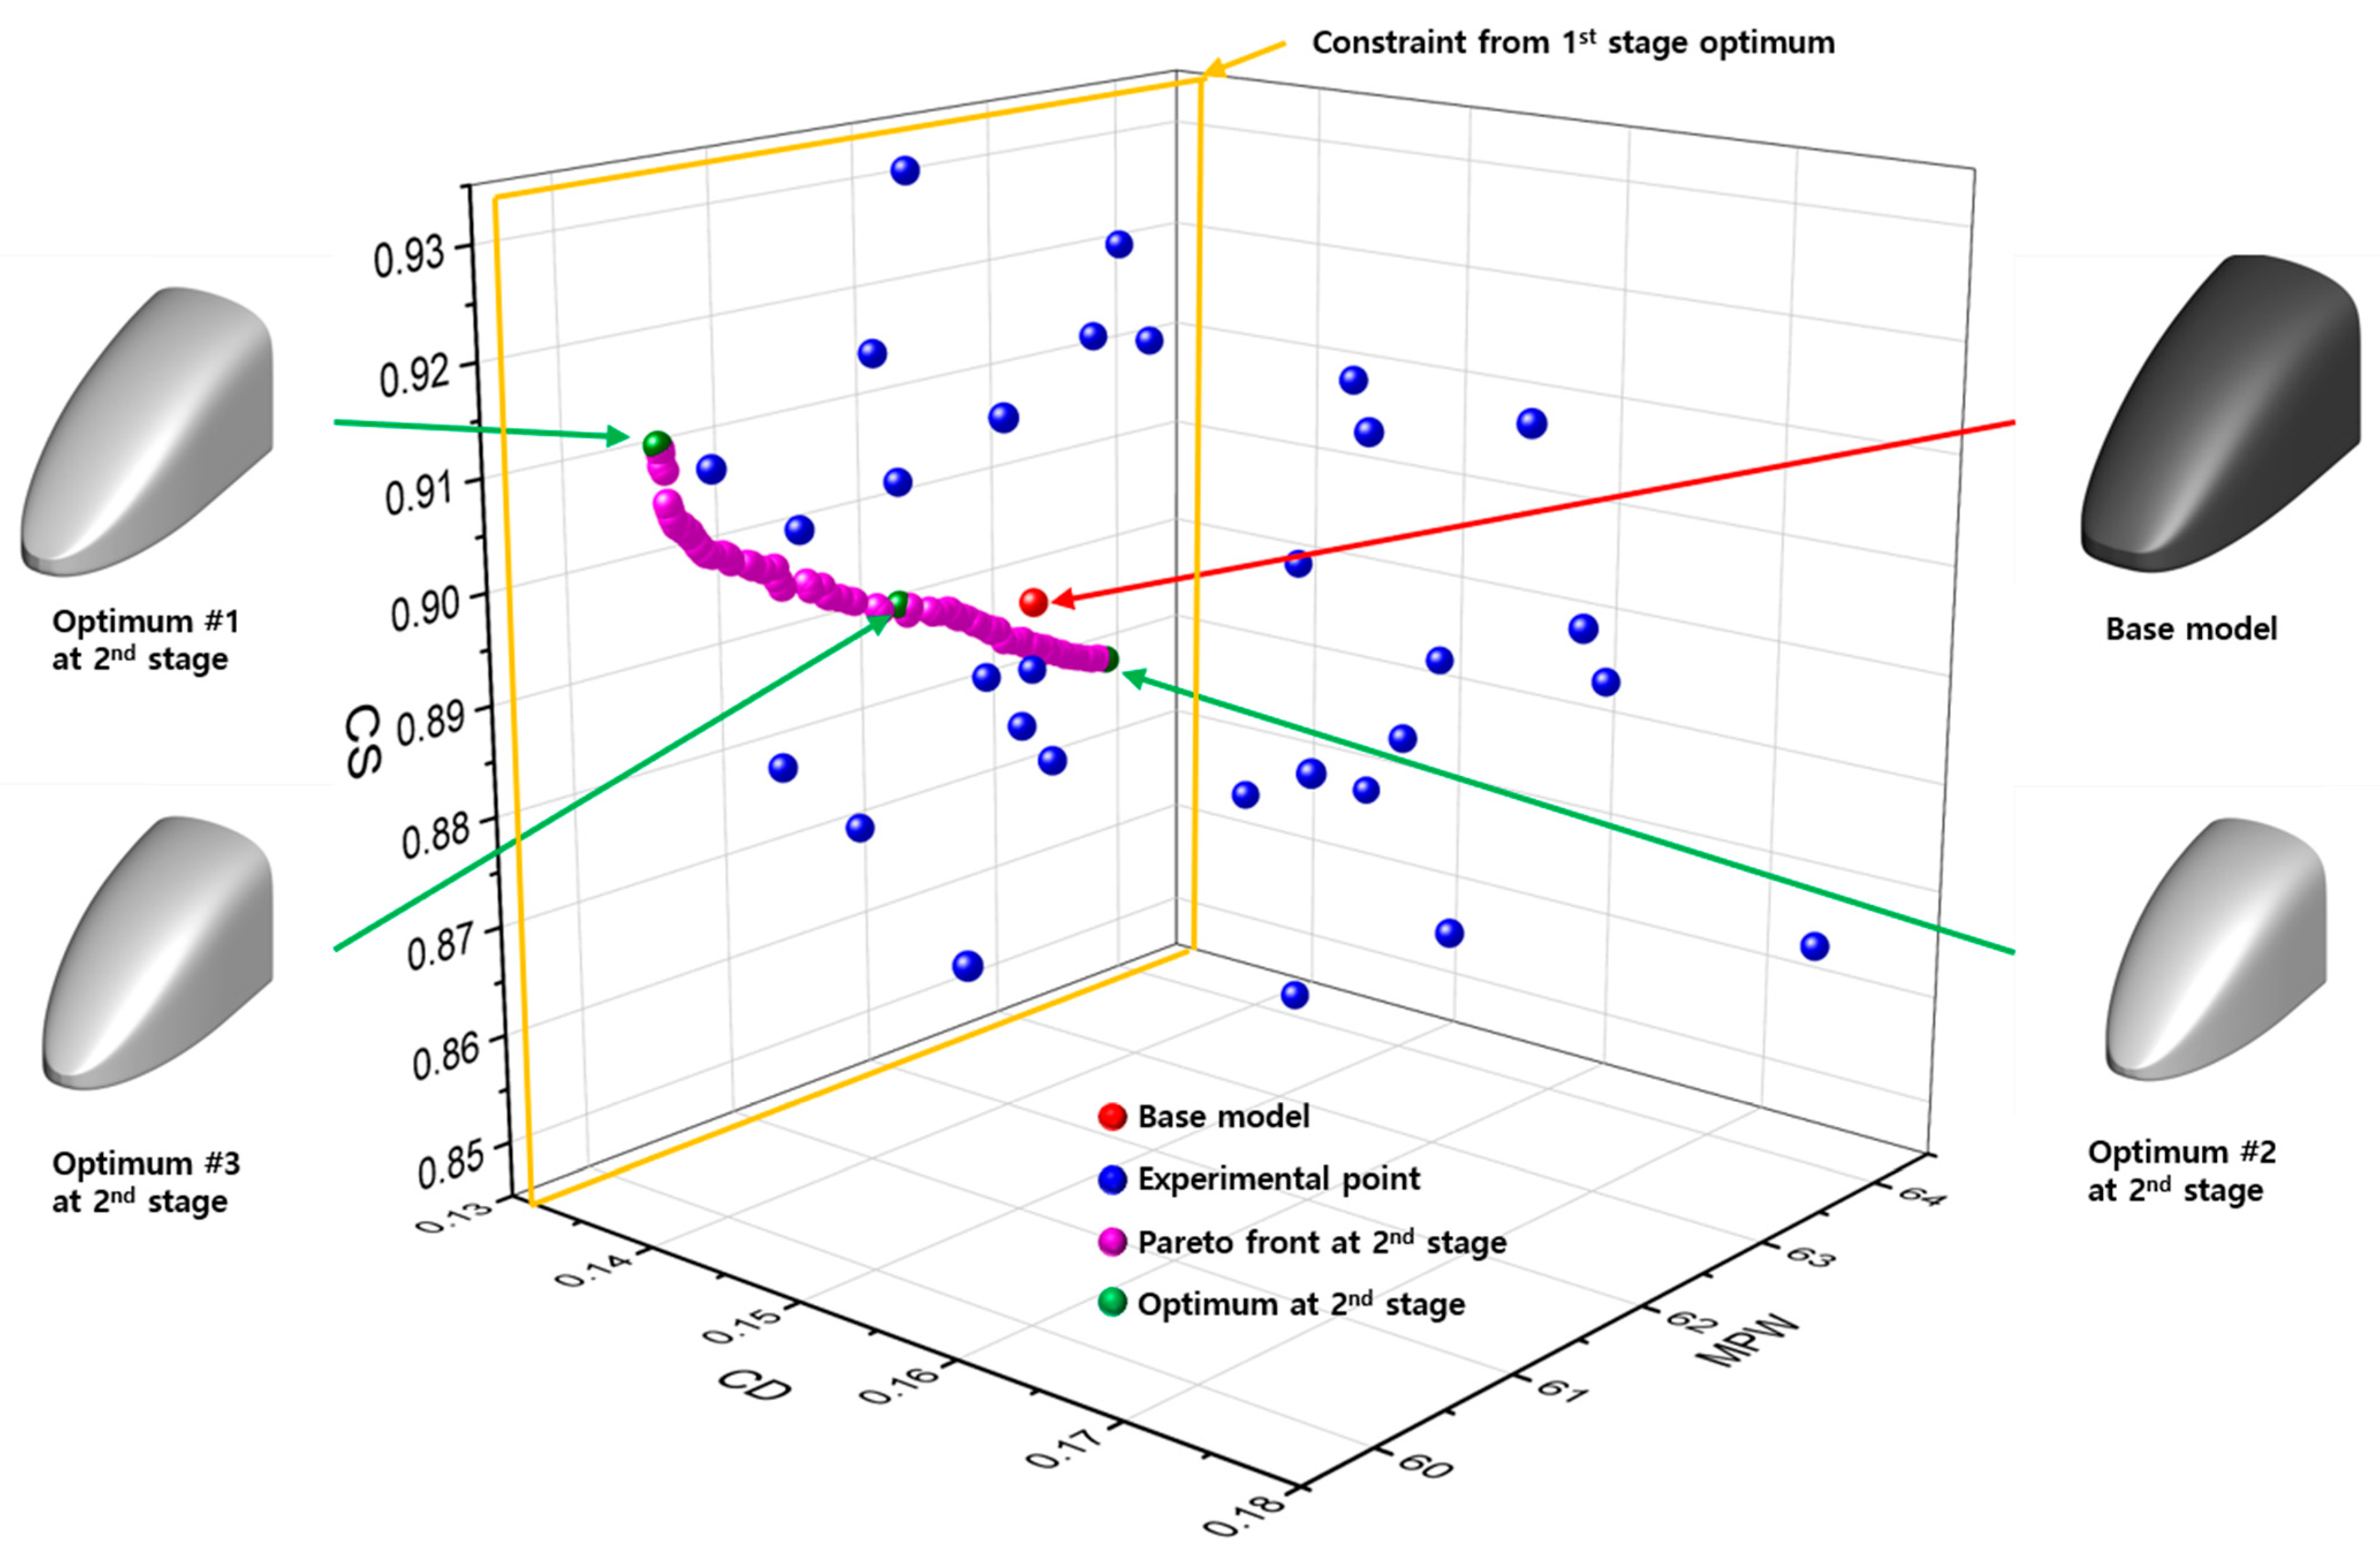
The Pareto front representing the set of multi-objective optimal solutions derived from the second-stage optimization and optimal shapes selected among them are shown in
Figure 11. Among these, two optimal shapes (#1 and #2) exhibited the highest reduction rates for each objective function. Additionally, one optimal shape (#3) from the Pareto front assigned an equal weighting factor for the two objective functions. These three optimal shapes were examined in detail.
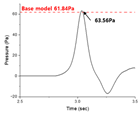
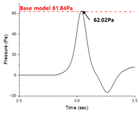
Optimized shape #1 exhibited the greatest reduction in micro-pressure waves, while optimized shape #2 showed the highest reduction in the side force coefficient. Optimized shape #3 demonstrated nearly equal variations in both micro-pressure waves and side force coefficient. As shown in
Table 2, optimized shape #1 achieved a 2.4% reduction in micro-pressure waves compared to the base model, although its side force coefficient increased by 1.8%. For optimized shape #2, the micro-pressure waves increased by 2.8%, but the side force coefficient decreased by 1.7%. Optimized shape #3 showed negligible changes in both micro-pressure waves and side force coefficient compared to the base model. However, all three shapes achieved a reduction in aerodynamic drag coefficient of over 7% compared to the baseline shape, thereby satisfying the constraints. Consequently, the multi-stage optimization proved to be effective in the context of weighted multi-objective optimization.
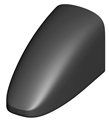
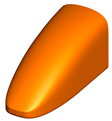
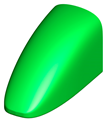
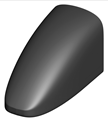
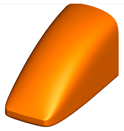
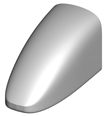
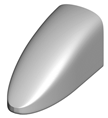
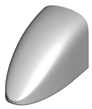
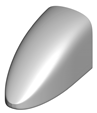
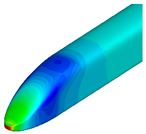
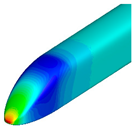
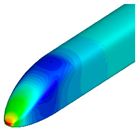
Table 3 compares the base model and three optimized shapes from the second-stage optimization in terms of their respective three-dimensional shape, pressure from aerodynamic analysis, micro-pressure wave, and pressure from crosswind analysis. Optimized shape #1 exhibited the longest nose length, while optimized shape #2 had the shortest. Optimized shape #3 showed a slight increase in nose length compared to the base model. It appears that longer nose lengths contribute to the reduction in micro-pressure waves, whereas shorter nose lengths enhance crosswind safety. All three optimal shapes demonstrated a more pointed nose tip compared to the base model.
Comparing the surface pressure in the aerodynamic drag analysis, all three optimized shapes exhibited reduced high-pressure regions due to their pointed forms, resulting in decreased aerodynamic drag compared to the base model. Similarly to the optimal shape derived from the first-stage optimization, the pointed shape led to a reduction in the high-pressure region around the first car and faster pressure recovery around the last car. Additionally, the size of the vortices generated behind the last car was reduced, contributing to the overall reduction in aerodynamic drag.
4. Conclusions
Considering the operational environment characteristics of high-speed trains in South Korea, an optimal train nose shape design was formulated with the objectives of reducing aerodynamic drag, minimizing tunnel micro-pressure waves, and enhancing crosswind safety. The EMU-320 nose shape was derived and applied as the base model for optimal design using a vehicle modeling function capable of appropriately simulating the three-dimensional shape of a high-speed train. Following the initial optimization stage aimed at reducing aerodynamic drag, the second stage of optimization was conducted, using the results of the first stage as constraints, to further reduce tunnel micro-pressure waves and enhance crosswind safety.
In the first-stage optimization, the aerodynamic drag was reduced by 8.7% due to the pointed nose shape. In the second-stage optimization, a Pareto front of optimal shapes was derived to reduce tunnel micro-pressure waves and improve crosswind safety, ensuring that the aerodynamic drag did not exceed the optimum achieved in the first step by more than 1.5%.
This demonstrates that the two-stage multi-objective optimization is effectively applicable for the optimal design of high-speed train shapes to meet the specified objectives.
Author Contributions
Conceptualization, S.Y.; Methodology, S.Y.; Validation, W.P.; Formal analysis, M.K. and H.K.; Writing—original draft, M.K. and H.K.; Supervision, S.Y.; Project administration, S.Y.; Funding acquisition, T.K. All authors have read and agreed to the published version of the manuscript.
Funding
This research was supported by a grant from the R&D Program of the Ministry of Land, Infrastructure, and Transport (Development of frontal hatch system for power distributed high-speed rail vehicles, RS-2022-KA165880), Republic of Korea.
Data Availability Statement
The original contributions presented in this study are included in the article. Further inquiries can be directed to the corresponding author.
Conflicts of Interest
The authors declare no conflict of interest.
References
- Peters, J.L. Optimizing aerodynamics to raise IC performance. In Railway Gazette International; DVV Media International Limited: London, UK, 1982; pp. 817–819. [Google Scholar]
- Kim, K.M.; Han, S.W. The changes of Shinkansen vehicles’ nose shape. J. Korean Soc. Railw. 2007, 10, 124–130. [Google Scholar]
- Kwon, H.B.; Kim, Y.S.; Lee, D.H.; Kim, M.S. Nose Shape Optimization of the High-speed Train to Reduce the Aerodynamic drag and Micro-pressure Wave. In Proceedings of the KSME Conference, Jeju, Republic of Korea, 27–29 June 2001; pp. 373–379. [Google Scholar]
- Kwak, M.H.; Yun, S.H.; Lee, Y.B.; Kwon, H.B.; Kim, K.H.; Lee, D.H. Optimum nose shape of a front-rear symmetric train for the reduction of the total aerodynamic drag. J. Mech. Sci. Technol. 2013, 27, 3733–3743. [Google Scholar] [CrossRef]
- He, Z.; Liu, T.; Liu, H. Improved particle swarm optimization algorithms for aerodynamic shape optimization of high-speed train. Adv. Eng. Softw. 2022, 173, 103242. [Google Scholar] [CrossRef]
- Sun, Z.; Zhang, Y.; Yang, G. Surrogate Based Optimization of Aerodynamic Noise for Streamlined Shape of High Speed Trains. Appl. Sci. 2017, 7, 196. [Google Scholar] [CrossRef]
- Wang, S.; Wang, R.; Xia, Y.; Sun, Z.; You, L.; Zhang, J. Multi-objective aerodynamic optimization of high-speed train heads based on the PDE parametric modeling. Struct. Multidiscip. Optim. 2021, 64, 1285–1304. [Google Scholar] [CrossRef]
- Munoz-Paniagua, J.; Garcia, J. Aerodynamic surrogate-based optimization of the nose shape of a high-speed train for crosswind and passing-by scenarios. J. Wind. Eng. Ind. Aerodyn. 2019, 184, 139–152. [Google Scholar] [CrossRef]
- Zhang, L.; Zhang, J.; Li, T.; Zhang, Y. A multi objective aerodynamic optimization design of a high-speed train head under crosswinds. Proc. Inst. Mech. Eng. Part F J. Rail Rapid Transit 2018, 232, 895–912. [Google Scholar] [CrossRef]
- Kulfan, B.M. A Universal Parametric Geometry Representation Method–CST. In Proceedings of the 45th AIAA Aerospace Sciences Meeting and Exhibit, Reno, NV, USA, 8–11 January 2007. [Google Scholar]
- Ku, Y.C.; Rho, J.H.; Yun, S.H.; Kwak, M.H.; Lee, D.H. A Study of Design Method for Train Nose Shape Using Configuration Function. In Proceedings of the 2008 Spring Conference of Korean Society for Railway, Daegu, Republic of Korea, 12 June 2008. [Google Scholar]
- KRS TR 0001-12®; Korean Railway Standards. Korea Railroad Research Institute: Uiwang, Republic of Korea, 2012.
- Rogers, S.E.; Kwak, D.C. Upwind differencing scheme for the time-accurate incompressible Navier-Stokes equations. AIAA J. 1990, 28, 253–262. [Google Scholar] [CrossRef]
- Kwon, H.B.; Kim, T.Y.; Lee, D.H.; Kim, M.S. Numerical simulation of unsteady compressible flows induced by a high-speed train passing through a tunnel. J. Rail Rapid Transit 2003, 217, 111–124. [Google Scholar] [CrossRef]
- Johnson, M.E.; Moore, L.M.; Ylvisaker, D. Minimax and maximin distance designs. J. Stat. Plan. Inference 1990, 26, 131–148. [Google Scholar] [CrossRef]
- Yun, S.H.; Kwak, M.H.; Park, C.S. ; Study of Shape Optimization for Aerodynamic Drag Reduction of High-speed. J. Korean Soc. Railw. 2016, 19, 709–716. [Google Scholar] [CrossRef]
- Jun, S.O.; Jeon, Y.H.; Kim, J.H.; Lee, D.H. Application of the robust and reliability-based design optimization to the aircraft wind design. J. Korean Soc. Aeronaut. Space Sci. 2006, 34, 24–32. [Google Scholar]
- Vanderplaats, G.N. Numerical Optimization Techniques for Engineering Design; Vanderplaats Research & Development Inc.: Colorado Springs, CO, USA, 1999. [Google Scholar]
| Disclaimer/Publisher’s Note: The statements, opinions and data contained in all publications are solely those of the individual author(s) and contributor(s) and not of MDPI and/or the editor(s). MDPI and/or the editor(s) disclaim responsibility for any injury to people or property resulting from any ideas, methods, instructions or products referred to in the content. |
© 2024 by the authors. Licensee MDPI, Basel, Switzerland. This article is an open access article distributed under the terms and conditions of the Creative Commons Attribution (CC BY) license (https://creativecommons.org/licenses/by/4.0/).


