Article

Lattice Boltzmann Model for Rarefied Gaseous Mixture Flows in Three-Dimensional Porous Media Including Knudsen Diffusion

1
Department of Mechanical Engineering, Polytechnique Montréal, Montréal, QC H3T 1J4, Canada
2
Research Center in Industrial Flow Processes, Polytechnique Montréal, P.O. Box 6079, Stn. CV, Montréal, QC H3C 3A7, Canada
*
Author to whom correspondence should be addressed.
Fluids 2024, 9(10), 237; https://doi.org/10.3390/fluids9100237
Submission received: 29 August 2024 / Revised: 26 September 2024 / Accepted: 2 October 2024 / Published: 9 October 2024
(This article belongs to the Special Issue Rarefied Gas Flows: From Micro-Nano Scale to Hypersonic Regime)

Abstract

:
Numerical modeling of gas flows in rarefied regimes is crucial in understanding fluid behavior in microscale applications. Rarefied regimes are characterized by a decrease in molecular collisions, and they lead to unusual phenomena such as gas phase separation, which is not acknowledged in hydrodynamic equations. In this work, numerical investigation of miscible gaseous mixtures in the rarefied regime is performed using a modified lattice Boltzmann model. Slip boundary conditions are adapted to arbitrary geometries. A ray-tracing algorithm-based wall function is implemented to model the non-equilibrium effects in the transition flow regime. The molecular free flow defined by the Knudsen diffusion coefficient is integrated through an effective and asymmetrical binary diffusion coefficient. The numerical model is validated with mass flow measurements through microchannels of different cross-section shapes from the near-continuum to the transition regimes, and gas phase separation is studied within a staggered arrangement of spheres. The influence of porosity and mixture composition on the gas separation effect are analyzed. Numerical results highlight the increase in the degree of gas phase separation with the rarefaction rate and the molecular mass ratio. The various simulations also indicate that geometrical features in porous media have a greater impact on gaseous mixtures’ effective permeability at highly rarefied regimes. Finally, a permeability enhancement factor based on the lightest species of the gaseous mixture is derived.

1. Introduction

Interest in small-scale fluid modeling has grown in the past decades with the development of microelectromechanical systems (MEMS), with a wide range of applications in various domains [1,2,3,4,5,6,7,8,9]. Studying fluid flow at a microscopic scale is also of great interest in unconventional shale gas reservoirs [10,11,12] or in porous heat shields for the aerospace industry [13,14,15,16,17]. However, the classical Navier–Stokes equations and its underlying assumptions break down at this scale [18] and are unable to correctly predict the fluid flow behavior. Discrete effects are no longer negligible and have an impact at the macroscopic scale. Among them, one can report non-zero fluid velocity in the vicinity of solid walls [19,20] and underestimation of the mass flow rate with the hydrodynamic equations compared to the experimental observations [21,22]. The invalidity of the continuum hypothesis occurs when the mean free path λ defining the mean distance traveled by a gas particle between two consecutive collisions approaches the characteristic length H of the domain, generally defined by the surrounding obstacles. Rarefaction is usually characterized by the Knudsen number, which relates these two quantities [23]:
Kn = λ / H .
Flow regimes are generally classified according to the following ranges of the Knudsen number [23]: hydrodynamic (or continuum) regime for Kn < 0.001, slip flow regime for 0.001 ≤ Kn < 0.1, transition flow regime for 0.1 ≤ Kn < 10, and molecular free regime for Kn ≥ 10. Thus, a flow regime is considered as rarefied as soon as it enters the slip flow regime (Kn ≥ 0.001).
Although extended Navier–Stokes equations can still be applied in the slip flow regime by capturing slip effects with a modified boundary condition [24,25,26,27,28], the non-equilibrium effects appearing at higher rarefied regimes require smaller-scale representation of the fluid.
Thanks to its mesoscopic nature, the Boltzmann equation is able to recover the whole range of rarefaction [29] and is capable of modeling the discrete effects when Kn increases. Among the different kinetic models, the lattice Boltzmann method (LBM) has proven its capabilities in simulating fluid flows in the rarefied regime [30,31,32,33,34,35,36]. By solving a simplified and discrete form of the Boltzmann equation, the standard LBM model has been adapted to account for the rarefied regime. The Knudsen number has been introduced in the collision operator to account for the decrease in intermolecular collision frequency [37,38,39]. Additionally, the convenient and linear BGK collision operator [40] has been replaced by the more stable multi-relaxation time (MRT) collision operator, which allows for additional tunable parameters to offset non-physical slip velocity [30,36,41,42]. Slip boundary conditions have been implemented [43,44] with respect to LB discretization and tuned to match the macroscopic slip models and experimental measurements [30,45,46]. In the transition flow regime, the non-linearity between the shear stress and rate of deformation [11,18,20] because of local non-equilibrium effects has been modeled by introducing a wall function to obtain a local and effective value of the dynamic viscosity. This depends either on the distance to the wall [47,48] or a mean value obtained by averaging the non-linearity over the cross-section of the flow [30,36,49,50].
A direct observation of the rarefied effects on fluid flow occurs in porous media, where the permeability value is no longer a constant value intrinsic to the porous media geometry properties but a dynamic one depending on the flow conditions. This particular behavior was first observed by Klinkenberg while measuring mass flow through glass beads [51]. The measurements showed that the permeability value of the gases decreased with mean pressure. These observations led to the derivation of an apparent permeability expression whose value was greater than the intrinsic permeability calculated in the hydrodynamic regime because of rarefied effects. Rarefied gas flow in porous media has been extensively studied within the LB framework to compute apparent permeability [42,46,52,53,54,55,56].
It is noteworthy that the vast majority of the studies mentioned above have been performed by considering pure gases. However, the gas phase contains more than one component, and the presence of different components (and thus different molecular masses and diameters) within the same phase modifies the collisional behavior of the gas particles, as interspecies collisions must be taken into account [57,58]. The statement of a gaseous mixture being homogeneous remains valid in the hydrodynamic regime. It can thus be treated as a pure component with mixture transport properties, and simulating each component individually would add unnecessary degrees of freedom. This behavior is caused by the magnitude of the friction force in the hydrodynamic regime, which is larger than the viscous shear force, so homogenization among the mixture occurs first before being transported by the pressure gradient [59]. However, the mixture becomes gradually heterogeneous in the rarefied regime, as each component flows in an almost independent fashion because of the decrease in molecular collisions and momentum exchange [59]. At a macroscopic scale, this leads to the separation of the gas phase, where each component follow a specific velocity. This phenomenon is particularly useful for micropumping [9] and porous microfiltration [7,60] applications and must be adequately addressed in the numerical model. Specifically, in porous media, the mixture composition influences the permeability enhancement factor [61,62,63].
Early work in single gas phase multicomponent modeling in the rarefied regime focused on pure diffusion problems. In the absence of shear forces, the Maxwell–Stefan diffusion equations are extended to take Knudsen diffusion into account. This leads to the dusty gas model (DGM), where the additional Knudsen diffusion coefficient was treated through an effective diffusion coefficient [64]. Paradis et al. [65] explored rarefied effects on reaction–diffusion flows in porous media. Guo et al. [66] studied the impact of geometrical features in microporous media on gas effective diffusivity. Zheng et al. [67] applied a higher-order LBM model in rarefied regimes to assess the impact of oxygen diffusion in porous catalyst layers. Another approach was developed by Ma et al. [68] through an additional collision operator accounting for Knudsen diffusion, and it has also been implemented to study reactive flows [69].
In the case of pressure-driven mixture flows, each component must be treated using active dynamics, i.e., the molar fraction of a given species is obtained by solving the species equation of conservation, since its concentration within the mixture has a direct impact on the mixture hydrodynamics. Using the active dynamics approach, Asinari et al. [70] developed an LB model with a global collision operator related to both dynamic viscosity as binary diffusion within the hydrodynamic regime. The two transport mechanisms are decoupled within the operator by using a multiple relaxation time (MRT) form [71], which enables them to tune both effects independently from each other and perform simulations at arbitrary Schmidt numbers. Unlike early approaches for pressure-driven mixture flows with binary diffusion [72,73,74], the indifferentiability principle is satisfied [70,75], i.e., the binary mixture model reduces to a single fluid if both components are identical. The model was later extended to the rarefied regimes by bringing the pure component adaptations to gaseous mixture modeling [76]. The gas phase separation phenomenon was investigated by looking at the deviation of the component concentrations compared to their hydrodynamic behavior [77]. Based on different numerical simulations, the gas phase separation phenomenon was mainly affected by the Knudsen number and the pressure ratio [50,77].
However, the phenomenon has not been assessed in terms of species flow rate. This is because the kinetic approach upon on which the LB model was built recovers the mixture’s macroscopic quantities but not necessarily the species’ ones [75]. Therefore, it may not be a suitable approach when investigating the individual species behavior.
Recently, an alternative LB model for pressure-driven gaseous mixtures has been developed for rarefied regimes [78]. The theoretical basis builds upon the local equilibrium based on the species macroscopic quantities [79]. The local equilibrium accounts for self-collisions (related to dynamic viscosity), whereas the interspecies molecular collisions leading to binary diffusion are integrated in the LB algorithm as an external force whose expression is based on the macroscopic Maxwell–Stefan diffusion equations [80]. The coupling between the species through an external force removes the limit of a binary mixture, and simulating an arbitrary number of components is straightforward [80]. In the LB framework, it translates into N distribution functions for an N-component gaseous mixture, and the hydrodynamic equations for each individual species are recovered through a modified Chapman–Enskog analysis [79]. With appropriate adaptations to the rarefied regime, numerical results exhibit similar results to the binary mixture approach [50,78]. The individual modeling of each species within the mixture also allows the gas phase separation phenomenon to be studied in terms of species mass flow ratio, showing that the degree of separation increases with the molecular mass ratio and rarefaction rate. However, an empirical coefficient still remains for the wall function approach because the reported data in the literature were only focused on pure component flows [49,50]. Also, Knudsen diffusion has not been considered within pressure-driven flows with binary diffusion. The increase in mass flow rate in the existing LB models is only attributed to slippage effects and the viscosity non-linear behavior within the Knudsen layer, but they do not consider Knudsen diffusion for pressure-driven flows with binary diffusion. However, this greatly contributes to the global flow rate as the regime becomes more rarefied [63,81] and should be incorporated in the numerical model.
Yet, for pure component flows, Knudsen diffusion has not been included when performing pressure-driven flows with the LBM. To the authors’ knowledge, the few mentions in the literature compute pressure-driven flow in the hydrodynamic regime followed by pure rarefied diffusion flow through porous media to compute the intrinsic permeability and effective diffusivity coefficient to estimate the apparent permeability value from the dusty gas model, respectively [52,82]. The main issue for pure component flows arises from the direct relationship between the self-diffusion coefficient and the dynamic viscosity with respect to the kinetic theory of gases [83,84]. Because the implemented adaptations for rarefied effects on the dynamic viscosity also affect self-diffusion, it may be complicated to dissociate the rarefied effects on viscous transport with diffusive transport and explicitly express the Knudsen diffusion in the LBM algorithm. Recently, an LB model was developed by Zhao et al. [53], built upon a modified Boltzmann equation with an additional term to account for self-diffusion. The computed apparent permeability showed good agreement with the different correlations for pure component flows up to the molecular free flow (up to Kn 60 ), where Knudsen diffusion is the dominant transport mechanism.
The present paper aims to extend the LB model developed using the individual species approach [78] to simulate mixture flows in the rarefied regime. The empirical aspect of the wall function due to multicomponent flows in the initial model is replaced with a deterministic method provided by a ray-tracing algorithm [85,86]. By separating the ray-tracing algorithm from the structured discretization schemes commonly used with the LBM, a more accurate mean free path, and thus rarefaction rate accounting for the local geometry can be calculated. As there is a clear decoupling between diffusive and viscous mechanisms in the case of mixture flows, Knudsen diffusion is taken into account in the external diffusion force by computing an effective binary diffusion coefficient. Slip boundary conditions for three-dimensional geometries are introduced. The rest of this paper is organized as follows. Section 2 details the numerical model for mixture flows in the rarefied regime with the latest modifications. Section 3 shows the numerical results for model validation. The numerical results are compared to experimental measurements of binary mixtures’ mass flow rates through long microchannels with trapezoidal and rectangular sections. Then, the species permeability enhancement factors are studied for a staggered arrangement of spheres. The influence of porosity, mixture composition, and rarefaction rate is investigated and followed by a discussion. Section 4 draws general conclusions based on the numerical results obtained.

2. Description of the Model

The present section extends a previous LB model for gaseous mixtures in the rarefied regime to three-dimensional domains. The different improvements made on the model are then discussed, including the implementation of a slip boundary condition, the use of a ray-tracing algorithm for the effective calculation of the viscosity coefficient, and the inclusion of Knudsen diffusion in the multicomponent model.

2.1. Individual Species-Based LB Model for Gaseous Mixtures

Following the early development of an individual species-based LB model for gaseous mixtures [80], the discrete Boltzmann equation formulation to describe the distribution function for a k-component fluid is as follows:
f i k ( x + ξ i δ t , t + δ t ) = f i k ( x , t ) + Ω k ( f i k ) + δ t S i k ,
where f i k is the k-component discrete distribution function related to a discrete velocity vector ξ i at position x . Discrete distribution functions collide and stream on structured grids referred as DnQm discretization schemes, with n denoting the dimensionality and m denoting the number of discrete velocities. For three-dimensional simulations, the D3Q19 discretization scheme is used [87] and is given in Figure 1. The velocity vector components are expressed in terms of the lattice speed c = δ x / δ t . In LBM simulations, the time and spatial steps δ x and δ t are usually unitary [50,88], so that c = 1 .
On the right-hand side of the equation, the collision operator Ω k defines the k-component collision operator describing molecular collisions between particles of the same component. Gas flows in the rarefied regime are simulated; thus, the D3Q19 multi-relaxation time (D3Q19-MRT) operator is implemented and writes as follows [87,89]:
Ω k ( f i k ) = j M 1 S k M i j f j k f j k , ( eq ) .
Because of the individual species-based approach, there are as many MRT operators as components in the gaseous mixture. The transformation matrix M projects the k-component distribution functions f i k into the k-moment space so that m i k = j M j i f i k , which is given in reference [90]. The relaxation matrix S is built as a diagonal matrix containing the different relaxation times:
S k = diag τ ρ k , τ e k , τ ϵ k , τ j k , τ q k , τ j k , τ q k , τ j k , τ q k , τ s k , τ π k , τ s k , τ π k , τ s k , τ s k , τ s k , τ m k , τ m k , τ m k 1 ,
where each relaxation time is related to a physical quantity described by the different moments [91].
The MRT operator allows the different physical moments to relax independently with one another. Among the relevant relaxation times for rarefied gas simulations, the stress tensor-related relaxation time τ s k is related to the k-component partial kinematic viscosity ν k as follows [50,76,78]:
τ s k = 0.5 + ν k c s 2 δ t ,
where c s = c / 3 is the LB speed of sound.
In addition, the energy flux-related relaxation time τ q k is adapted to offset numerical slip [30,33,36]:
τ q k = 8 1 / τ s k 8 2 1 / τ s k .
The rest of the relaxation times are tunable free parameters and are taken from [90] for optimal stability.
Equation (3) shows the relaxation of the discrete distribution functions f i k towards their equilibrium counterpart f i k , eq calculated with the following species macroscopic quantities [80]:
f i k , ( eq ) = ω i ρ k 1 + u k · ξ i c s 2 + u k · ξ i 2 2 c s 4 u k · u k 2 c s 2 .
The weights ω i in Equation (7) are associated with the discrete velocities as follows [87]: ω i = 1 / 3 for i = 0 , ω i = 1 / 18 for i = 1 3 , 10 12 , and ω i = 1 / 36 for i = 4 9 , 13 18 .
The last term in Equation (2) accounts for the source term in the LB equation, which is a discretized form of any applied external force F . The source term is included using Guo’s forcing scheme with respect to the MRT operator [80,92]:
S i k = j M 1 I 1 2 S i j ω j ξ j u k c s 2 + ξ j · u k ξ j c s 4 · F ,
where I is the 19 × 19 identity matrix.
With the individual species approach in the LBM, two external forces are included in the external force F . The first external force, identified as F B k , accounts for a pseudo-speed of sound to allow for simulations of species with different molecular masses on the same discretization scheme [80]:
F B k x = 1 m k m ref c s 2 ρ k ,
where m k and m ref are the k-th and reference molecular masses, respectively, and the partial density gradient vector ρ k is computed with the nearest neighbors isotropic finite difference [78,80,93].
In practical LBM simulations, the lighter component is the reference one, and the other quantities are rescaled accordingly with respect to the molecular mass ratio. From this rescaling, a species speed of sound c s k is derived as follows [78,80]:
c s k = c s ref m k m ref = c s m k m ref = c 3 m k m ref .
The second external force identified as F D k on a given species distribution function accounts for the interspecies friction force describing the binary diffusion phenomenon. By recovering the Maxwell–Stefan diffusion equation at the macroscopic level [79,80], it writes as follows:
F D k = p mix l = 1 , l k N χ k χ l D k l u k u l ,
where p mix is the mixture (or total pressure) and D k l is the binary diffusion coefficient between k and l particles.
The macroscopic quantities for each component are recovered by calculating the zeroth and first-order moments of the species distribution function [80]:
ρ k = i f i k
ρ k u k = i ξ i k f i k + 1 2 F k
with F k = F B k + F D k . The mixture quantities are obtained with a simple mixing rule [80]:
ρ mix = k ρ k , ρ mix u mix = k ρ k u k .
Finally, the partial and total pressure p k and p mix and recovered using the classical LB isothermal equation of state and the species speed of sound given in Equation (10):
p k = ρ k c s k 2 , p mix = k p k .
The macroscopic conservation equations for each species are recovered through a modified Chapman–Enskog analysis [79]:
𝜕 ρ k 𝜕 t + · ( ρ k u k ) = 0 , 𝜕 ρ k u k 𝜕 t + ρ k u k · u k = p k + · η k u k + u k T p mix l = 1 , l k N χ k χ l D k l u k u l ,
where η k is the k-component partial dynamic viscosity.

2.2. Transport Coefficients and Rarefaction Rate

Owing to the kinetic theory of gases, a relationship exists between the mean free path of a gas molecule and its dynamic viscosity [94]. In the case of gaseous mixtures, the mean free path reduces due to the presence of the molecules of the other components [83]. Therefore, the species mean free path is introduced as follows:
λ k = p k k B T π d k 2 2 + l k N p l k B T π d k l 2 m k m k l 1 ,
where k B is the Boltzmann constant and T is the gas temperature. The reduced molecular diameter d k l and mass m k l are expressed as a function of the individual species ones, d k and d l , respectively, and m k and m l are represented as follows:
d k l = d k + d l 2 , 1 m k l = 1 m k + 1 m l .
The mixture mean free path is also retrieved from the mixing rule [83]:
λ mix = k = 1 N χ k λ k .
At the same time, the dynamic viscosity of a pure component η 0 k using the rigid-sphere model of gas particles writes as follows [94]:
η 0 k = 5 16 π k B m k T π d k 2 ,
and the species and mixture dynamic viscosities η k and η mix are recovered using Wilke’s law for gaseous mixtures [59,78,95].
In a previous study [78], the reference Kn ref was based on the lighter species (of molecular mass m ref ) and leads to the following:
η 0 k = 5 2 16 χ k p mix π m k k B T 1 + 1 2 l = 1 , l k N χ l d k l 2 χ k d k 2 m k m k l Kn ref H ,
which can be applied to retrieve a Kn-related relaxation time for τ s k .
In the limiting case of a pure component, the partial dynamic viscosity reduces to the pure viscosity expression η 0 without the superscript “k”, as there is only one single component. Finally, Equation (20) can be approximated by the following widely used relationship [30,36,50,76,77]:
η 0 = p Kn H 2 m π k B T ,
by noticing that 5 2 π / 16 0.8 2 / π , ensuring the indifferentiability principle for the viscosity calculation.
The same theoretical derivation goes for the binary diffusion coefficient D k l with respect to the kinetic theory of gases leading to the following [78]:
D k l = 3 16 2 π k B T m k l χ k 2 d k d k l 2 + l = 1 , l k N χ l m k m k l Kn ref H .
More details on the derivation from the species mean free path in a mixture to the species and mixture transport coefficients may be found in the original article [78].

2.3. Effective Viscosity Calculation with a Ray-Tracing Approach

The failure of the linear stress–strain relationship in the Knudsen layer [18,20,85] at highly rarefied regimes is treated in the LBM by integrating a wall function Ψ to compute an “effective” mean free path λ e which takes the presence of solid walls into account [96,97]. Therefore, an “effective” dynamic viscosity η e is obtained with respect to the kinetic theory of gases and writes as follows [98]:
Ψ ( x , λ ) = λ e ( x ) λ = η e ( x ) η ,
where λ and η define the unbounded mean free path and dynamic viscosity, respectively, and 0 ψ ( x , λ ) 1 .
In this work, the effective mean free path is recovered through an integration procedure using a ray-tracing approach [85,86] and is extended to gaseous mixtures.
Considering a gas molecule traveling from the position x in the direction ( θ , ϕ ) by considering the spherical coordinate system (R, θ , ϕ ), it is possible to compute the distance to the wall R( θ , ϕ ) through a line segment, also called a “ray”. The probability p that a distance greater than R is traveled between two collisions is determined by a free path distribution ψ ( r ) :
p ( R ) = R ψ ( r ) d r , ψ ( r ) = 1 λ exp r λ ,
where r is the free path of the gas molecule. Along the free path of length r, the gas molecule may either collide with a solid wall ( r > R ( θ , ϕ ) ) or with another molecule prior to the wall ( r < R ( θ , ϕ ) ). The mean free path in the direction ( θ , ϕ ) becomes as follows:
λ ( R ( θ , ϕ ) ) = 0 R ( θ , ϕ ) r ψ ( r ) d r + R ( θ , ϕ ) R ( θ , ϕ ) ψ ( r ) d r .
When a ray does not cross a solid boundary, R = and λ ( R ( θ , ϕ ) = λ . The effective mean free path λ e ( x ) is recovered through a spherical integral using Equation (26) [99]:
λ e ( x ) = 0 2 π 0 π λ ( R ( θ , ψ ) ) g ( θ , ϕ ) sin ( ϕ ) d ϕ d θ ,
where g ( θ , ϕ ) = 1 / ( 4 π ) is the uniform angular distribution function [99].
The ray-tracing approach, being initially designed for single component flows, is adapted to gaseous mixtures by considering species wall functions Ψ k ( x , λ k ) based on species quantities:
Ψ k ( x , λ k ) = λ e k ( x ) λ k = η e k ( x ) η k .
The parameters listed below are set for all of the simulations performed in this work. The angular steps for θ and ϕ were both set to Δ θ = Δ ϕ = 2 π / 32 to calculate Equation (27) with the mid-point integration rule. A cutoff length of R = 10 λ k was chosen, after which R was set to infinity. More details on the development and verification of this approach can be found in the original article [85,86].

2.4. Knudsen Diffusion

Computing an effective and local viscosity value by considering the local geometry, as described in Section 2.3, reflects on the binary diffusion coefficient as well. To perform simulations in the rarefied regime with the same magnitude of viscous to diffusive effects, the mixture Schmidt number (Scmix) is introduced:
Sc mix = η mix ρ mix D k l .
Therefore, an effective binary diffusion coefficient D e k l can be obtained by keeping Sc mix constant throughout the domain (i.e., D e k l = D k l η mix / Sc mix ). However, the effective coefficient obtained still does not take Knudsen diffusion into account.
Knudsen diffusion is the transport mechanism when gas particles flow almost freely without any gas–gas collisions. The only collisions affecting the motion of the gas particles occur with the solid walls. In mixture flows, the diffusive transport mechanism is related to interspecies interactions, and its magnitude is inversely proportional to the pressure [80,94]. In highly rarefied regimes, the expression for the binary diffusion coefficient no longer holds true as interspecies collisions become rare, and the main diffusion mechanism is ruled by Knudsen diffusion. Therefore, the k-component effective binary diffusion coefficient D e k l must verify the following limiting values within the whole range of rarefaction:
lim Kn 0 D e k l = D k l , lim Kn D e k l = D K k .
where D K k is the Knudsen diffusion coefficient, which is expresses as follows:
D K k = H 3 8 k B T π m k .
An interpolation model for D e k l verifying the limit values is proposed by Dongari et al. [84]:
D e k l = D k l c + D K k c 1 c ,
with c varying between −2 and −1 according to reference [84], with comparable accuracy. In the current LBM model, c = 2 was chosen to best fit the reference results.

2.5. Slip Boundary Conditions for Arbitrary Geometries

Among the existing slip boundary conditions in the LBM, the combined bounce-back and specular reflection (CBBSR) has been preferred based on previous observations [78] to maintain the related boundary condition coefficients within 0 and 1. A discrete distribution function undergoing the CBBSR boundary condition is updated according to the following expression [11,44,100]:
f i , CBBSR k ( x , t + δ t ) = r k f i , BB k ( x , t ) + ( 1 r ) f i , SR k ( x , t ) ,
where r k is the boundary coefficient for the CBBSR scheme. Its value ranges from 0 to 1, and it defines the given proportion of the post-collision distribution function coming from bounce-back behavior (identified by f i , BB k ) or specular reflection behavior (identified by f i , SR k ). The different distribution functions are related to one another with respect to their discrete velocities as follows:
ξ i , CBBSR = ξ i , BB , ξ i , CBBSR · n = ξ i , SR · n , ξ i , CBBSR · t = ξ i , SR · t ,
where n and t are the normal and tangential vectors to the solid wall, respectively. Equation (34) shows that the boundary condition is strongly dependent on the wall orientation, and generalizing it to arbitrary geometries is not straightforward. From this observation, a general implementation of the CBBSR boundary condition is proposed. For ease of understanding, the implementation is explained using the D2Q9 discretization stencil, but the approach for three-dimensional geometries is similar.
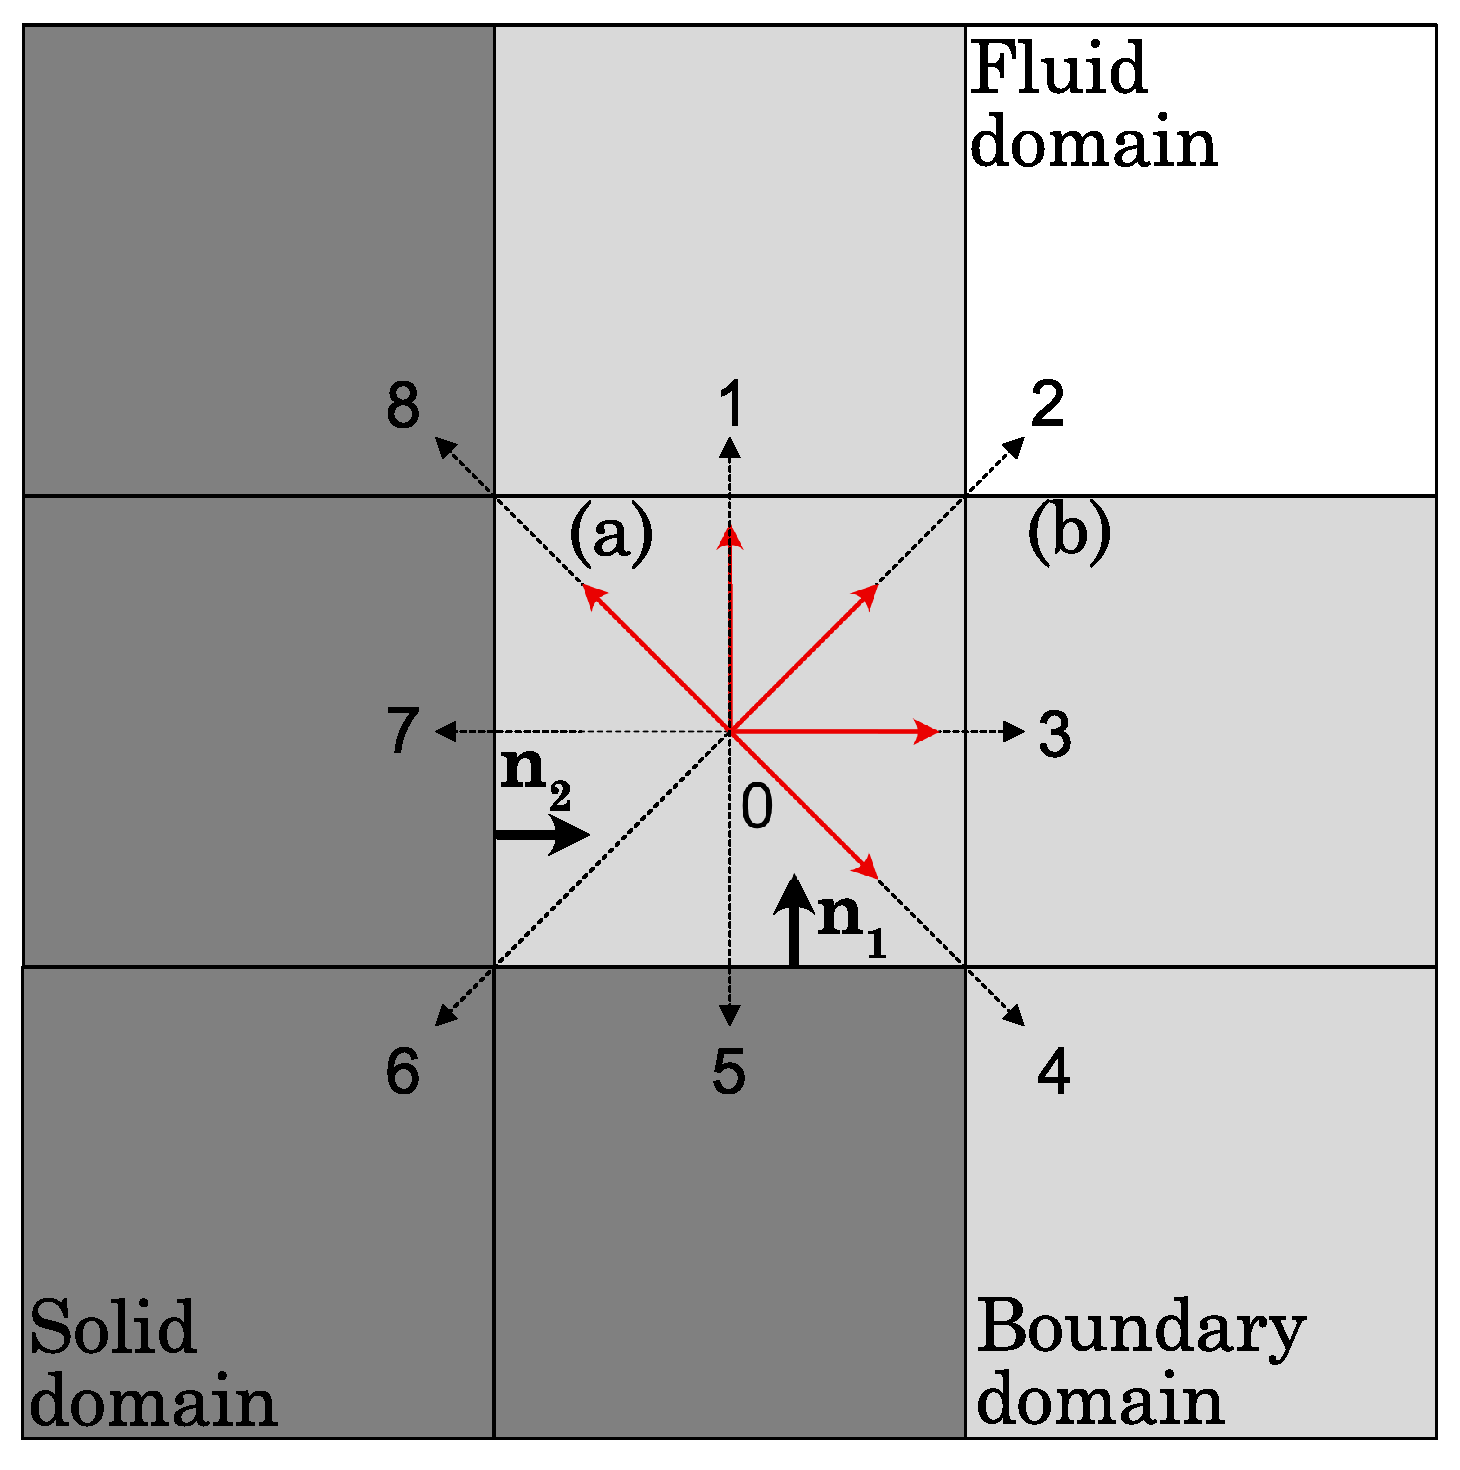
Figure 2 exhibits a simulation domain containing both fluid and solid nodes. Fluid nodes undergoing the CBBSR boundary condition are highlighted in light gray. The vectors of the surrounding solid nodes to the boundary fluid nodes are also displayed. Following the D2Q9 discretization stencil, the unknown distribution functions in the red color pointing towards the fluid domain are updated through the following steps:
  • The distribution functions pointing in the opposite direction to each solid wall are unknown and undergo CBBSR treatment given by Equation (33);
  • In the case where a fluid node has only a solid node in the diagonal direction, e.g., the “(b)” boundary fluid node (labeled in the top left corner in Figure 2), the unknown distribution function is updated with bounce-back treatment;
  • The unknown distribution functions that have been calculated several times because of the CBBSR boundary condition, e.g., for the “(a)” boundary fluid node, are averaged by the number of times it has been updated.
For the “(a)” boundary fluid node, the discrete functions f 1 k , f 2 k , and f 8 k follow Equation (33) because of n 1 , and the same goes for f 2 k , f 3 k , and f 4 k because of n 2 . As f 2 k is calculated twice, the post-CBBSR distribution functions are obtained using Equation (34):
f 1 , CBBSR k = f 5 k , f 2 , CBBSR k = r k f 6 k + ( 1 r k ) 2 f 4 k + f 8 k , f 3 , CBBSR k = f 7 k , f 4 , CBBSR k = r k f 8 k + ( 1 r k ) f 6 k , f 8 , CBBSR k = r k f 4 k + ( 1 r k ) f 6 k .
In rarefied regimes, the species slip velocity magnitude is described by the Maxwell macroscopic slip model [19,78]:
u s k = C k λ k 𝜕 u 𝜕 n wall ,
where C k is the k-component velocity slip coefficient, and 𝜕 u / 𝜕 n | wall is the velocity gradient tangential to the wall. As a first approximation, the species velocity slip coefficients C k are considered equal to the mixture velocity slip coefficient C mix and calculated with the linearized Boltzmann equation [78,101].
Finally, the rarefied coefficient r k is computed as follows [78]:
r k = C mix λ k C mix λ k + 3 ν k ,
where ν k = η k / ρ k is the k-component kinematic viscosity.

3. Numerical Results

Simulation results for different cases are displayed in this section. For the sake of simplicity, all the gaseous mixtures are only composed of two components ( N = 2 ) and restricted to monoatomic gases based on the available experimental data. Verification and validation of the model are first performed through microchannels in the rarefied regime. The inclusion of Knudsen diffusion and the relevancy of a geometry-based wall function are highlighted by comparing the numerical results with the previous developed models. The final case exhibits a simple porous media to investigate the geometrical effects on mixture flow and gas phase separation phenomena in the rarefied regime.

3.1. Model Verification

The numerical model is initially verified for an equimolar He-Ar mixture flow in a circular microchannel. For this aim, the species velocity profiles are compared to the analytical solutions developed by Kerkhof et al. [59], obtained by solving Equation (16) with a slip boundary condition. The molecular characteristics of interest are listed in Table 1.
The simulated flow is pressure driven by applying the Zou and He pressure boundary conditions [103] at the inlet and outlet of the domain to ensure a low pressure ratio to avoid compressibility effects: R p = p in mix / p out mix = 1.01 . The rarefaction rate is set to Kn mix = 0.1 , whereas the generalized CBBSR boundary condition described in Section 2.5 is applied at the fluid–solid interface. The wall function and Knudsen diffusion are both implemented. Finally, to avoid numerical defects that may occur in the rarefied regime, a regularization procedure [104] is initiated at the pre-collision step of the LBM algorithm. The microchannel is discretized by n x = 500 nodes along the x-direction where the pressure gradient is applied. The radius of the microchannel is discretized by R = 10 nodes.
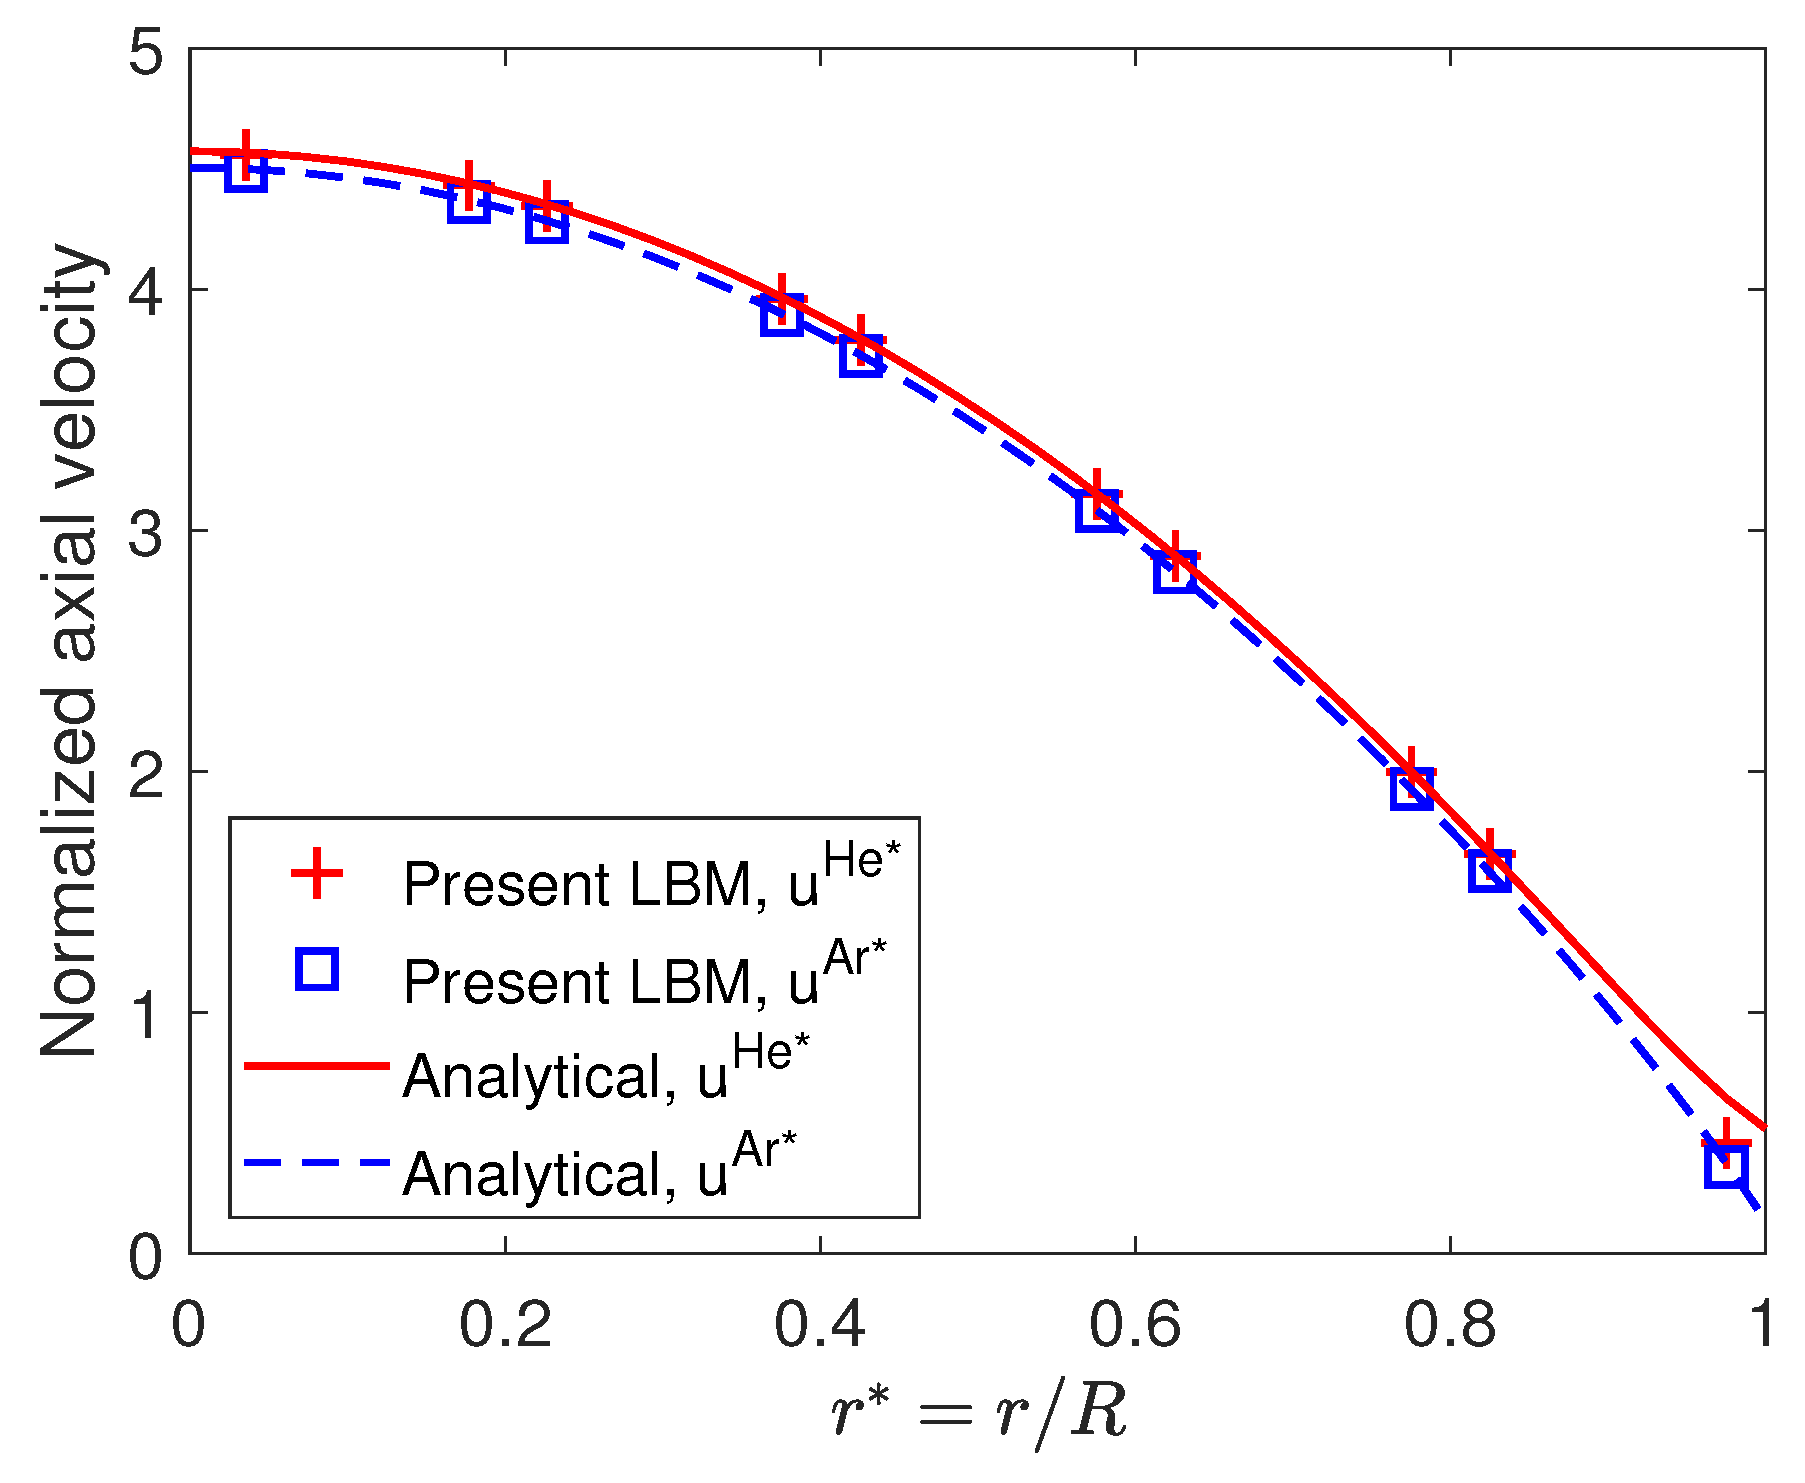
The normalized axial velocity profiles for He and Ar against the normalized radius r = r / R are displayed in Figure 3 against their analytical counterpart. The normalization of the velocities is given by the following expression:
u k = u k k B T 2 m mix p mix p mix ,
where m mix = χ He m He + χ Ar m Ar is the mixture molecular mass.
The numerical profiles are in good agreement with the analytical solution obtained with the extended macroscopic equations. The species velocity profiles are almost identical, indicating almost no separation phenomenon. In the vicinity of the walls, there is a slight deviation between the analytical solution and the numerical model because of the different modeling of the slip boundary condition [59]. However, the present numerical LBM is able to precisely capture the bulk velocities of each species.
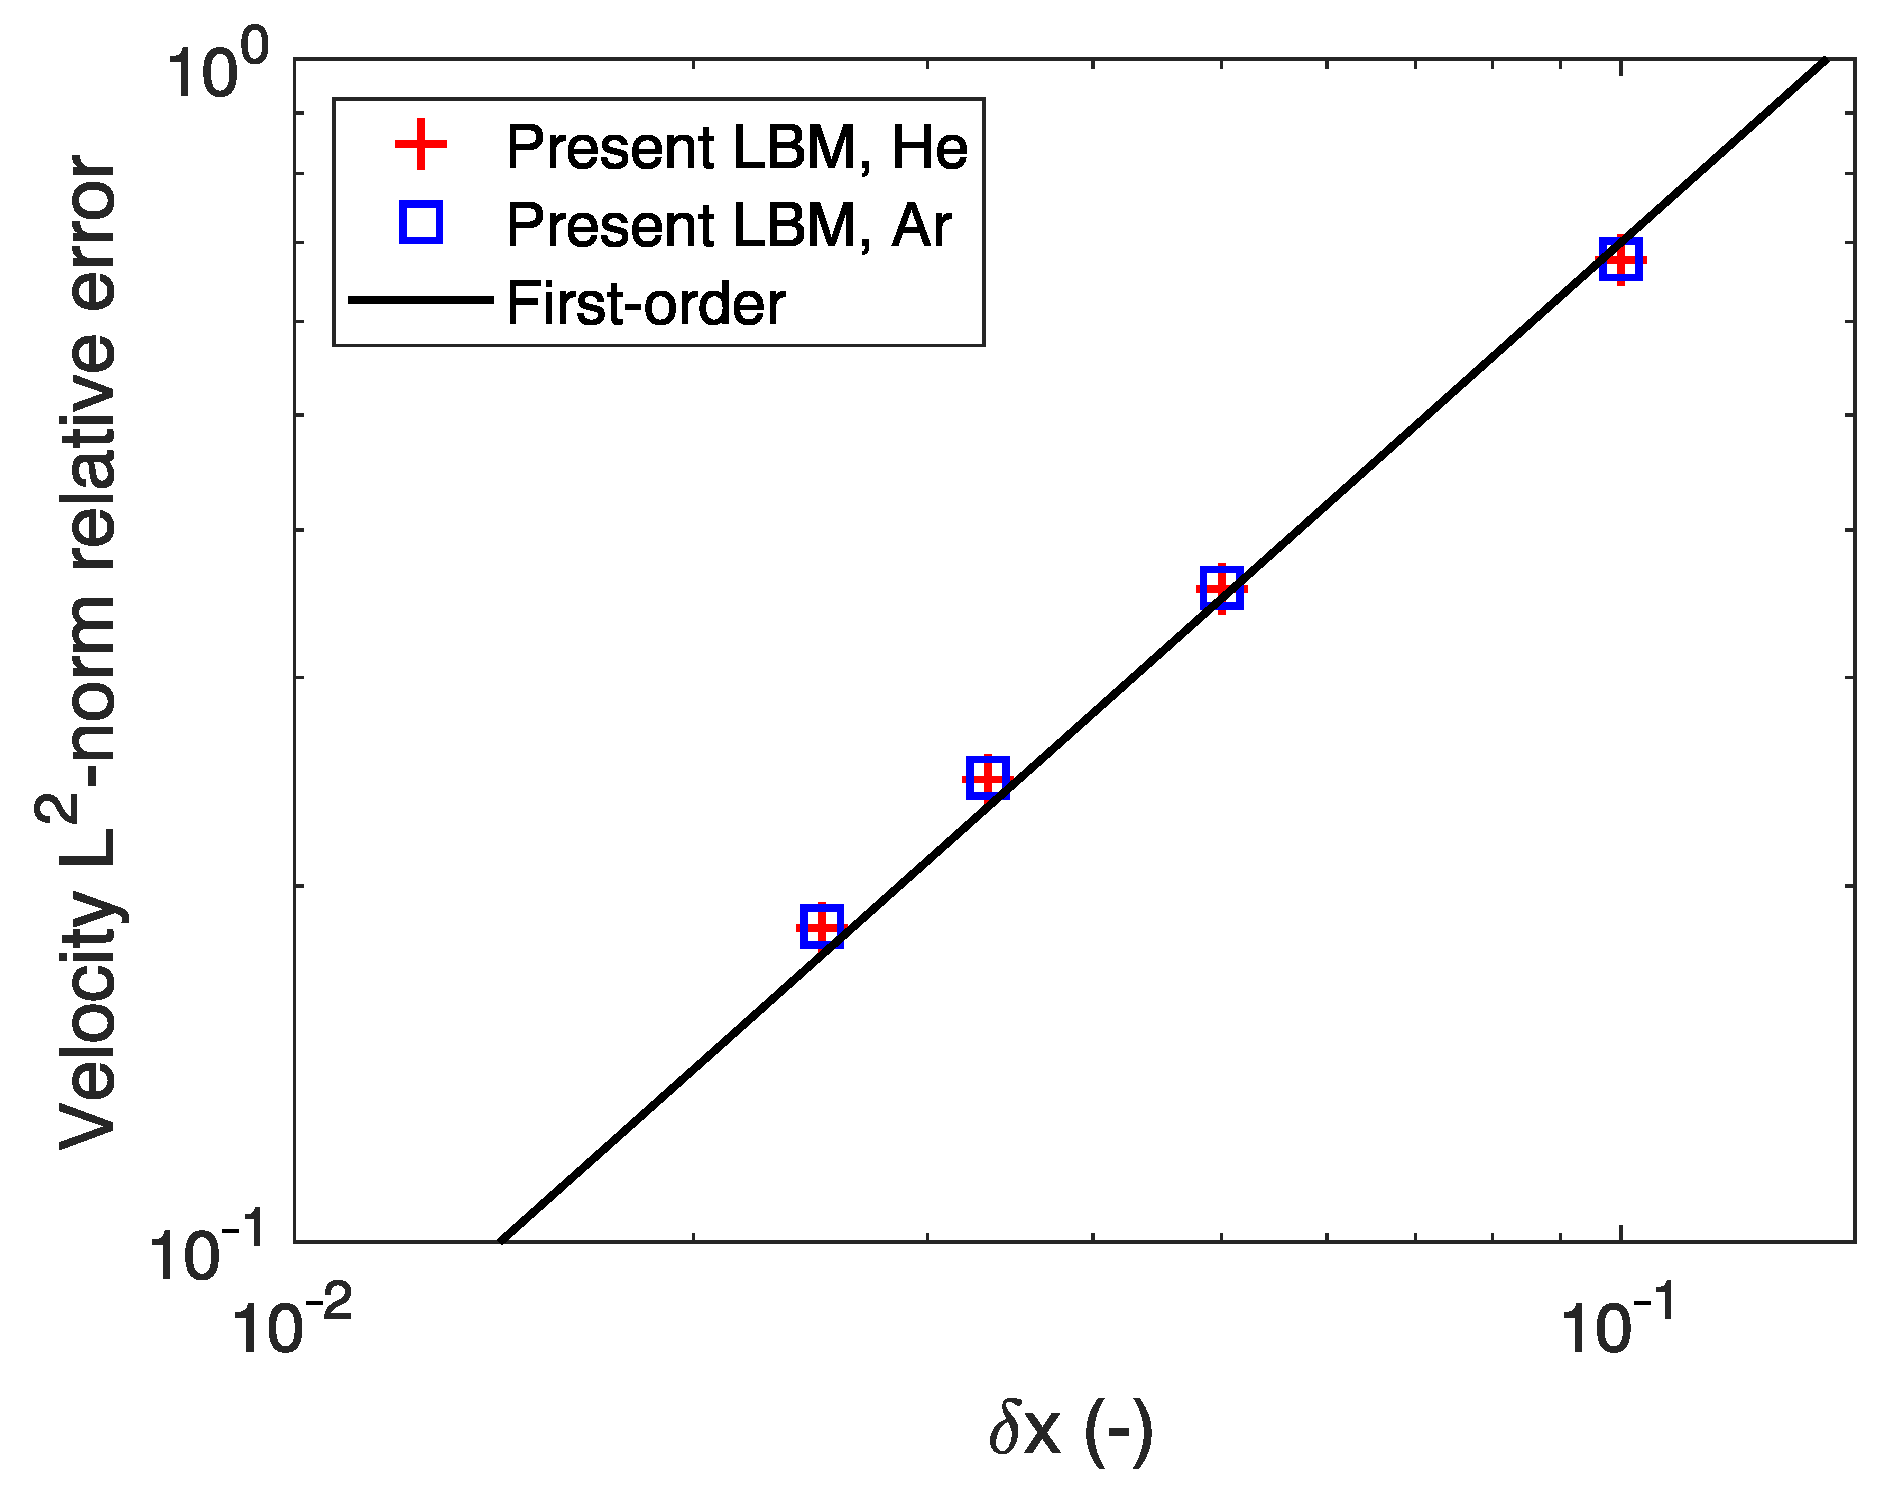
In addition, a convergence study is conducted to investigate the accuracy of the model. Different mesh sizes are used by discretizing the radius of the microchannel from 5 to 40 nodes and by rescaling the pressure ratio accordingly to keep the velocities constant. The relative error for the species velocity is computed with the L2-norm (see reference [33] for detailed methodology on the convergence study). Figure 4 gives the relative error for the species velocities at the different mesh sizes. The results exhibit a first-order convergence rate, consistent with the other observations in the literature when simulating flows in the rarefied regime [31,33].
The numerical model is thus able to properly recover the respective velocities of each species of the mixture and is consistent with the analytical solution in the slip flow regime. The next test case investigates the capabilities of the model at higher rarefied regimes.

3.2. Mixture Mass Flow Rate Calculation

A validation test case is performed in long microchannels with different cross-section shapes to assess the capabilities of the model at high Kn. The reference data are taken from the experimental measurements of Pitakarnnop et al. [105] for the rectangular cross-section and Szalmas et al. [106] for the trapezoidal one. In their work, the mixture flow rate is measured for various binary mixtures at different compositions using the constant volume method [106]. For this purpose, the outlet pressure p out mix is imposed at 2, 8, and 15 kPa, whereas the pressure ratio R p is varied. To validate the current numerical model, the mixture flow considered is an equimolar mixture of He-Ar. The dimensions of the rectangular and trapezoidal cross-sections are given in Table 2, and the length of the microchannels is 5 mm.
Some adaptations must be made to model the experimental setup numerically, as simulating the entire microchannel would be computationally costly. Thus, the computational domain only simulates a subsection of the whole microchannel, and the simulation parameters are rescaled accordingly to recover the same pressure gradient. The simulated subsection of the long microchannel is taken at its center so that the mean simulated pressure is equal to the mean pressure in the actual microchannel. The resulting domain discretizations for the two microchannels are also given in Table 2.
In addition, simulations are performed with alternative versions of the developed model to highlight the relevancy of the newly introduced developments. The first alternative version removes Knudsen diffusion (i.e., D K k = 0 so that D e k l = D k l ), and the second one keeps the Bosanquet-type wall function from a previous iteration of the numerical model [78], without Knudsen diffusion again. The versions will be identified as “LBM-noKD” and “LBM-Bosanquet”, respectively, in the subsequent figures, whereas the original model will be labeled as “Present LBM”.
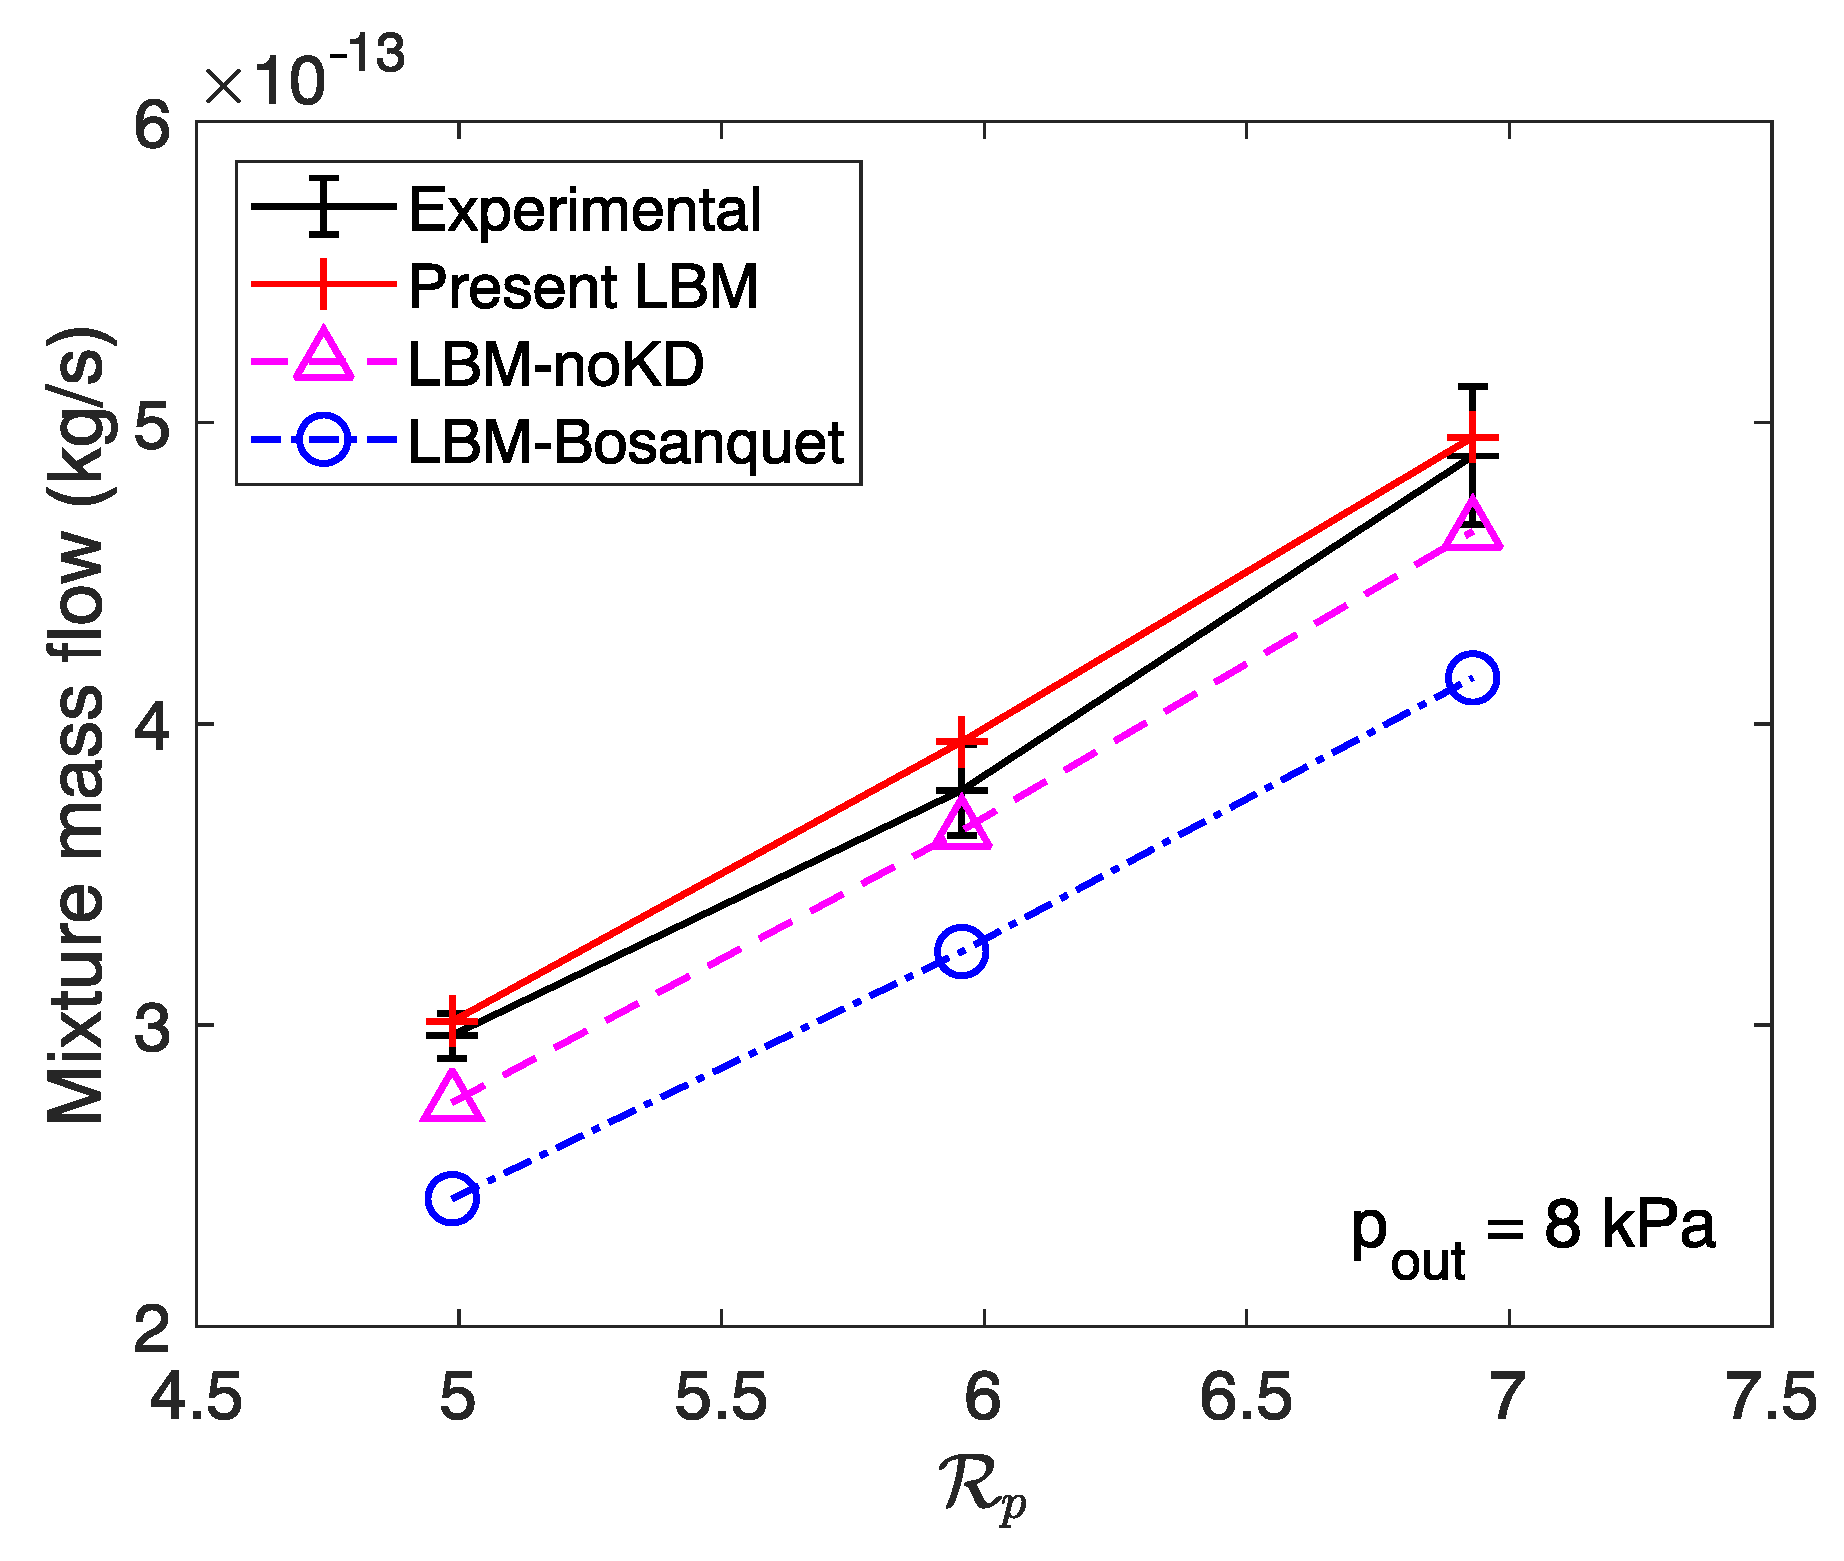
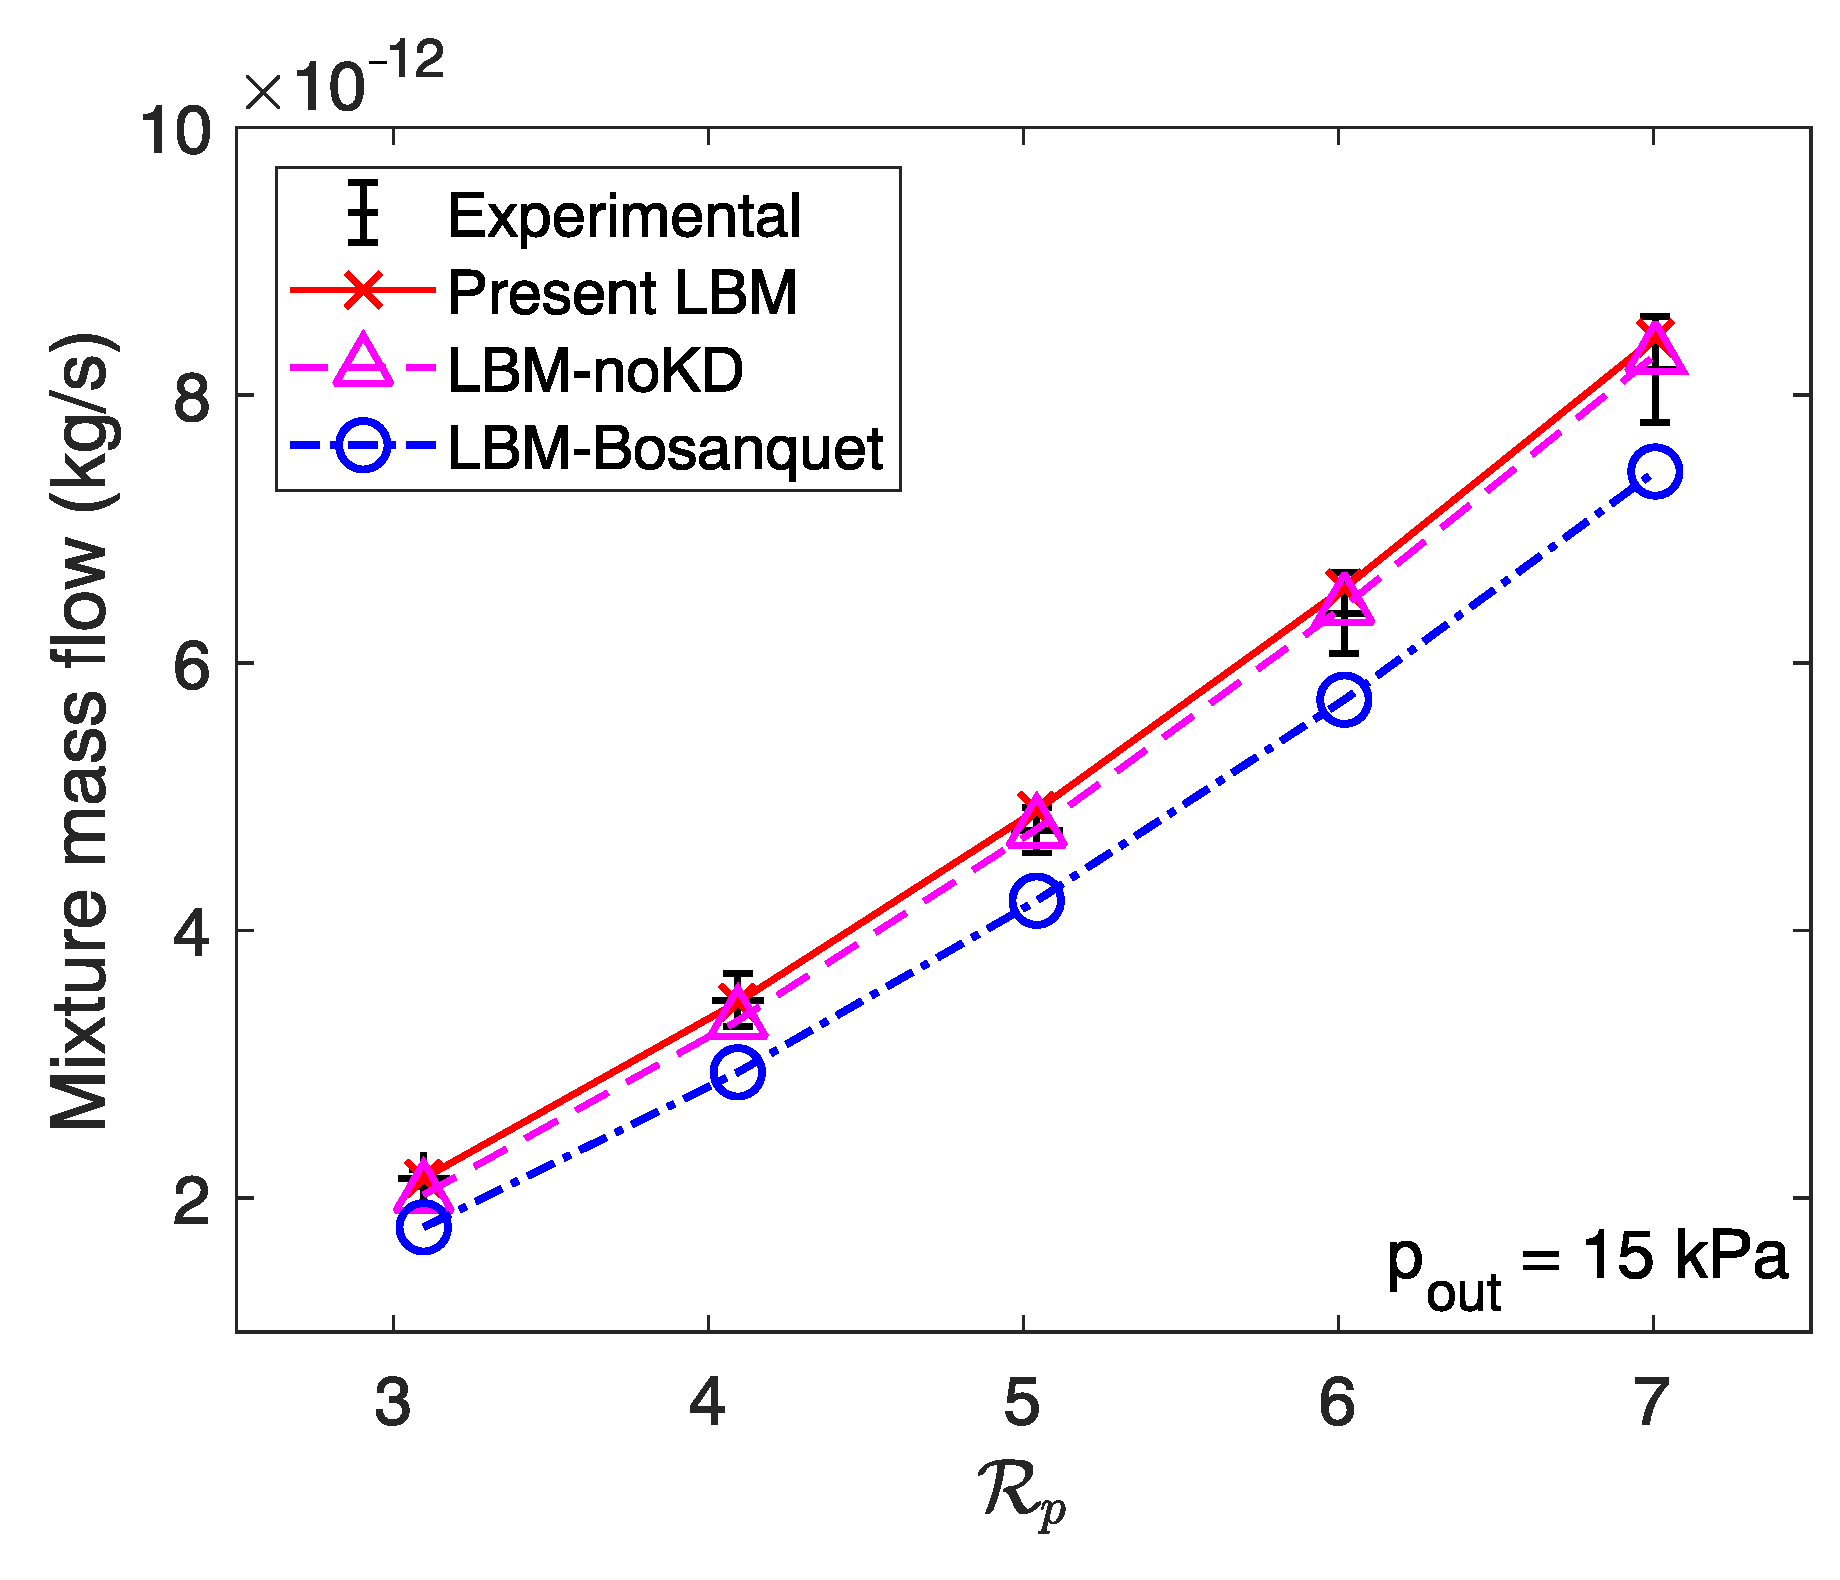
The mass flow rates for the He-Ar mixture are first plotted for the trapezoidal microchannel against the pressure ratio for an outlet pressure of 15 kPa in Figure 5 and 8 kPa in Figure 6. The experimental results extracted from Szalmas et al. [106] exhibit error bars to account for measurement uncertainty. As expected, the mixture mass flow rate increases with the pressure ratio. When p out mix = 15 kPa, the inclusion of Knudsen diffusion has little effect on the mass flow rate calculation. This can be explained by the low rarefied regime, as Kn mix 0.27 at the outlet of the domain based on the hydraulic diameter of the trapezoidal microchannel. In this regime, Knudsen diffusion does not contribute significantly to the global flow rate. Thus, numerical results fall within the error margin of the experimental measurements, even without considering Knudsen diffusion. However, the implementation of a local wall function still remains relevant, as the mass flow rate is underestimated with the Bosanquet-type wall function. At 8 kPa, the regime becomes more rarefied ( Kn mix 0.51 ), and the deviation becomes significant when integrating Knudsen diffusion or not. Despite the increasing difference in the mass flow rate calculation, the numerical results from the original model are in good agreement with the experimental data with or without Knudsen diffusion. To emphasize the increasing contribution of Knudsen diffusion, we perform similar simulations at higher rarefied regimes but for the rectangular cross-section microchannel.
Mass flow rates calculated using the different numerical models are plotted for the rectangular cross-section microchannel against the pressure ratio for an outlet pressure p out mix = 15 kPa in Figure 7 and p out mix = 2 kPa in Figure 8. We notice similar trends between the two types of microchannels. With the Bosanquet-type wall function, the mixture mass flow rate is largely underestimated for p out mix = 15 kPa, whereas the two other models are in good agreement with the experimental results. Again, the small influence of Knudsen diffusion in mass flow rate is explained by the low rarefaction rate of the experimental measurements ( Kn mix 0.35 based on the height of the microchannel). However, at 2 kPa, the inclusion of Knudsen diffusion becomes even more necessary, as the transport mechanism is almost dominant at this rarefaction rate ( Kn mix 2.6 ). Numerical results obtained using the “LBM-noKD” model deviate even more from the experimental data than for the trapezoidal microchannel, as the rarefaction rate is even greater. Therefore, it is crucial to include Knudsen diffusion as well as implementing a local wall function to simulate mixture flows in the transition flow regime, which is achieved by the present LBM.

3.3. Rarefied Multicomponent Flow in Porous Media

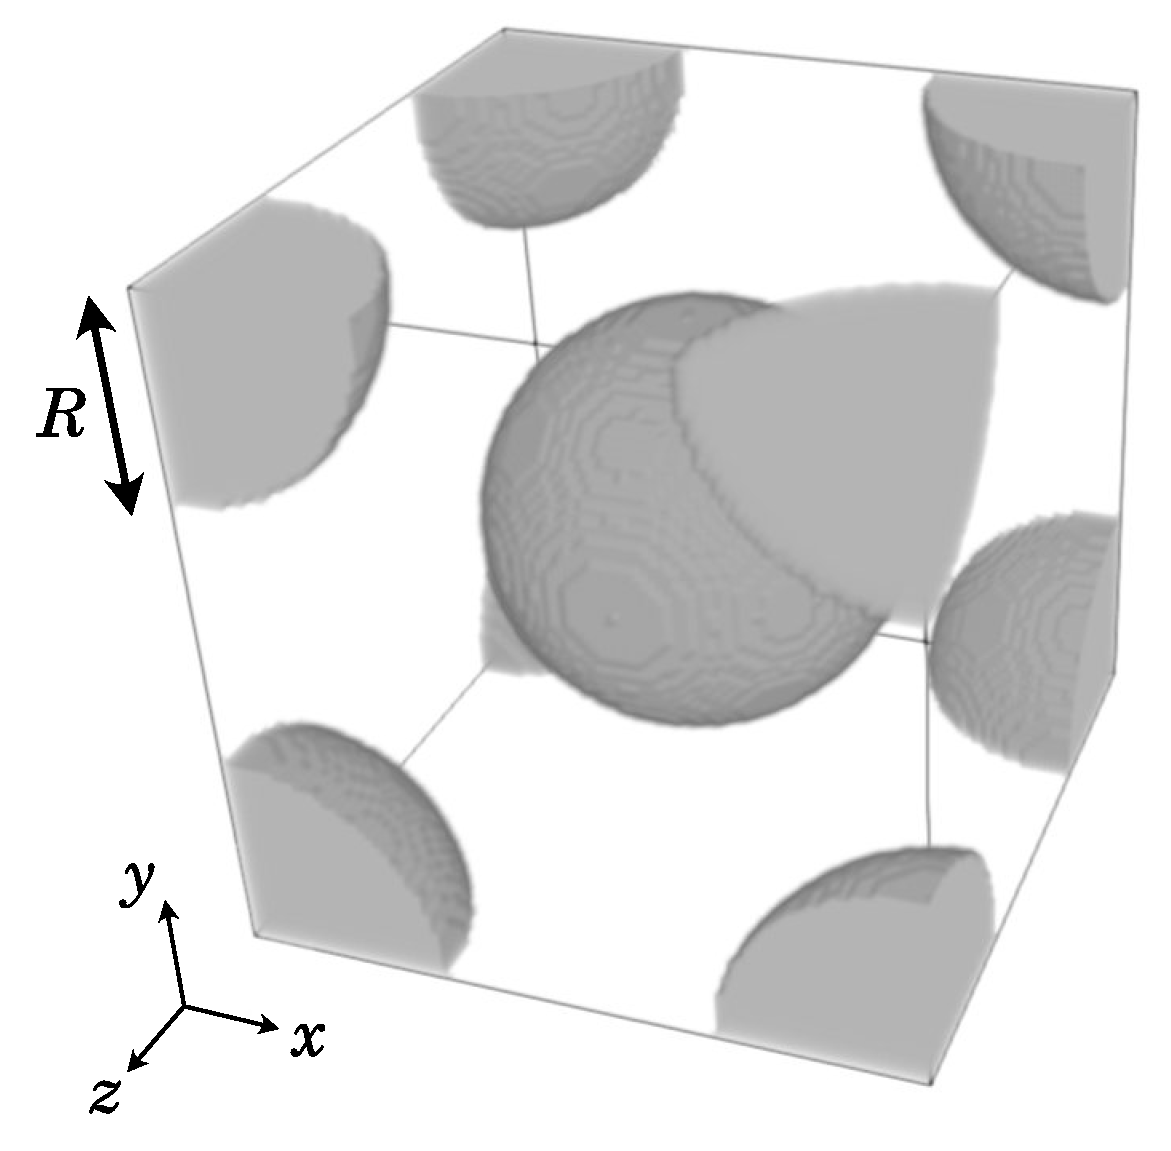
As rarefied flow in porous media has been investigated for pure component flows [52,53,54,55,56], the present test case extends the study to gaseous mixtures. For this purpose, the numerical model is applied for binary gaseous flows in the rarefied regime through a 3D porous geometry built by arranging spheres of radius R in a staggered fashion, as displayed in Figure 9. Inlet and outlet fluid buffers are joined to the porous structure to ensure a fully developed flow. The gaseous mixtures flow through the porous media via a pressure gradient along the x-direction imposed by pressure boundary conditions as in Section 3.1, whereas periodic boundary conditions are applied on the remaining sides of the domain. The flow behavior in microporous media for the species and the mixture in microporous media is evaluated based on its permeability. In the hydrodynamic regime, permeability can be computed using Darcy’s law as long as inertial effects are neglected [107]. For gaseous mixtures, the species and mixture apparent permeabilities K k and K mix are related to their respective velocities, so that:
K mix = η mix u ¯ mix Δ p mix L ,
K k = η mix u ¯ k Δ p mix L ,
where u ¯ mix and u ¯ k are the average streamwise mixture and species velocities, respectively.
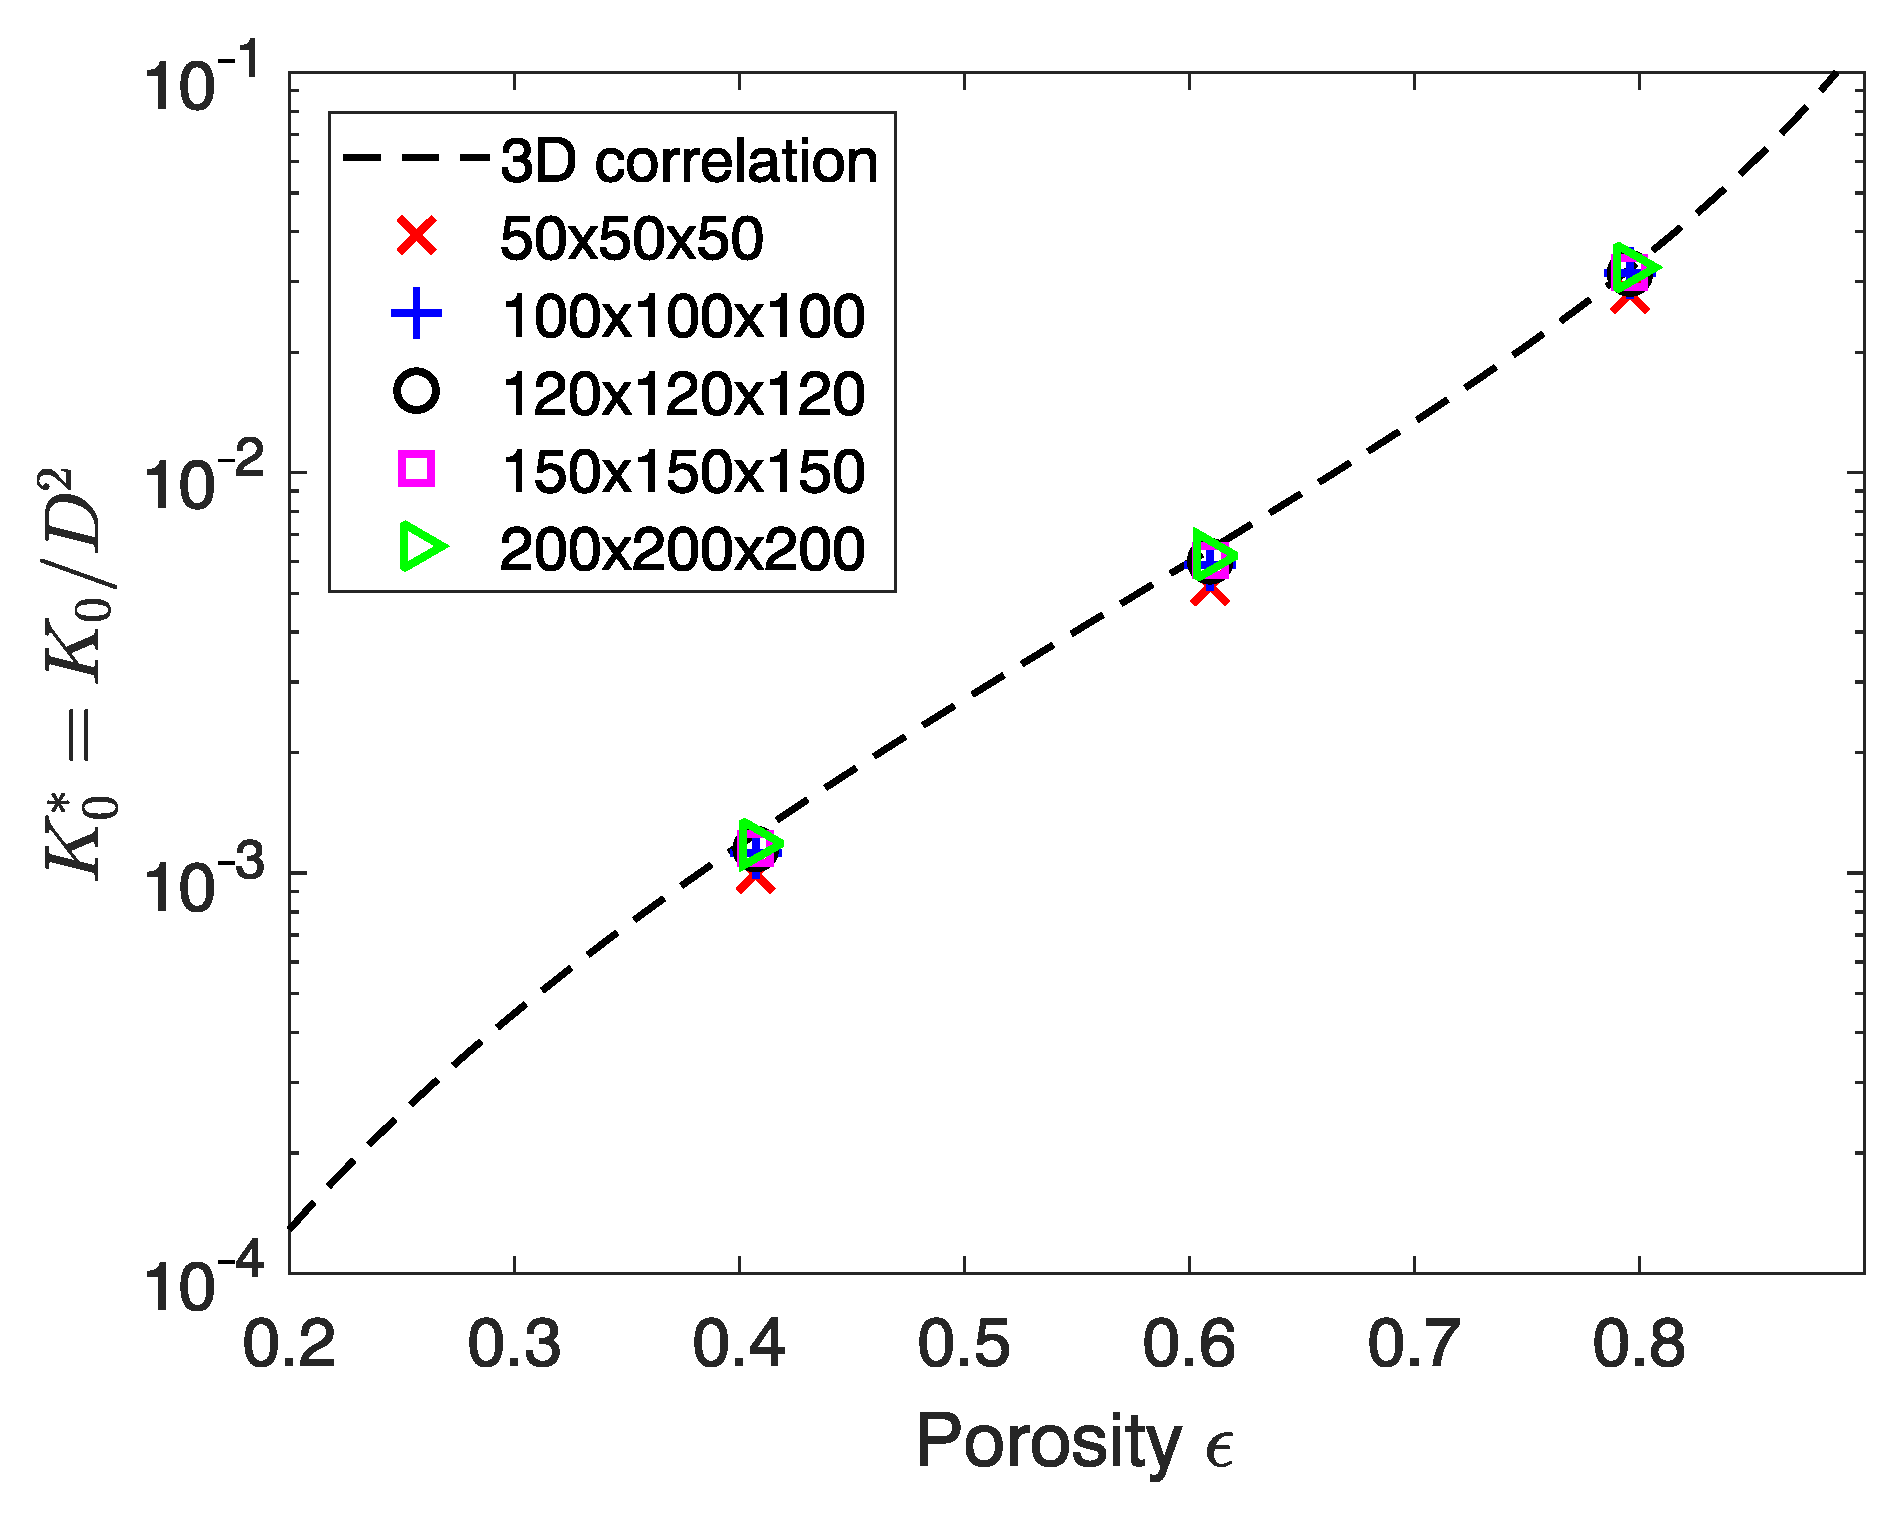
A preliminary study is conducted to set the domain discretization so that permeability values are mesh independent. Multicomponent and rarefied effects are first neglected. Thus, gas permeability is computed at different mesh sizes in the hydrodynamic regime and for a single component. Simulations are performed for porosities ϵ = 0.4, 0.6 and 0.8 by varying the radius of the spheres without changing their location. The permeability values are displayed in Figure 10 and are compared with the reference data from Jeong et al. [107] obtained for the same geometry. The subscript “0” in Figure 10 stands for the intrinsic permeability computed in the hydrodynamic regime as opposed to the apparent permeability. Its value is normalized with the diameter of the sphere D = 2 R , so that K 0 = K 0 / D 2 . The results are in good agreement with the correlation, even for the coarsest grid, regardless of the porosity. When compared to the finest grid, the relative numerical error on the permeability is smaller than 5% for the 100 × 100 × 100 discretization for all the porosities. The width of the buffer fluid zone is set to 20 nodes, so the total simulation domain has 140 × 100 × 100 nodes.
Previous studies have theoretically calculated the permeability enhancement factor for gaseous mixture flows [61,62], but they mainly focused on the influence of the molar fraction or the addition of a third component. In this present study, the effects of porosity and mixture composition on the species and mixture apparent permeabilities are numerically investigated.

3.3.1. Influence of Porosity

As porosity changes, the characteristic length varies as well. Therefore, under the same flow conditions, the rarefaction effects may have a different magnitude depending on whether the solid structure has a low or a high porosity, affecting the species and mixture permeability. Here, an equimolar He-Ar flow is simulated through the 3D staggered sphere structure with a porosity ranging from 0.4 to 0.8. The simulations are performed for a mixture Knudsen number Knmix ranging from 0.005 to 1.5 to cover a wide range of flow regimes. Unlike microchannel flows, the characteristic length to compute Knmix must rely on a relevant length that describes the porous media. We define the geometry based on its mean pore diameter d p given by the following expression [108]:
d p = 8 K 0 C o τ o r 2 ϵ ,
where C o and τ o r are the constriction and the tortuosity of the porous media, respectively, defined in the reference article [108].
To assess the impact of rarefaction on the same scale for all geometries, the numerical results are presented for the mixture permeability enhancement factor f c , which accounts for the increase in permeability due to rarefaction:
f c = K mix / K 0 mix ,
where K 0 mix is the mixture intrinsic permeability in the hydrodynamic regime.
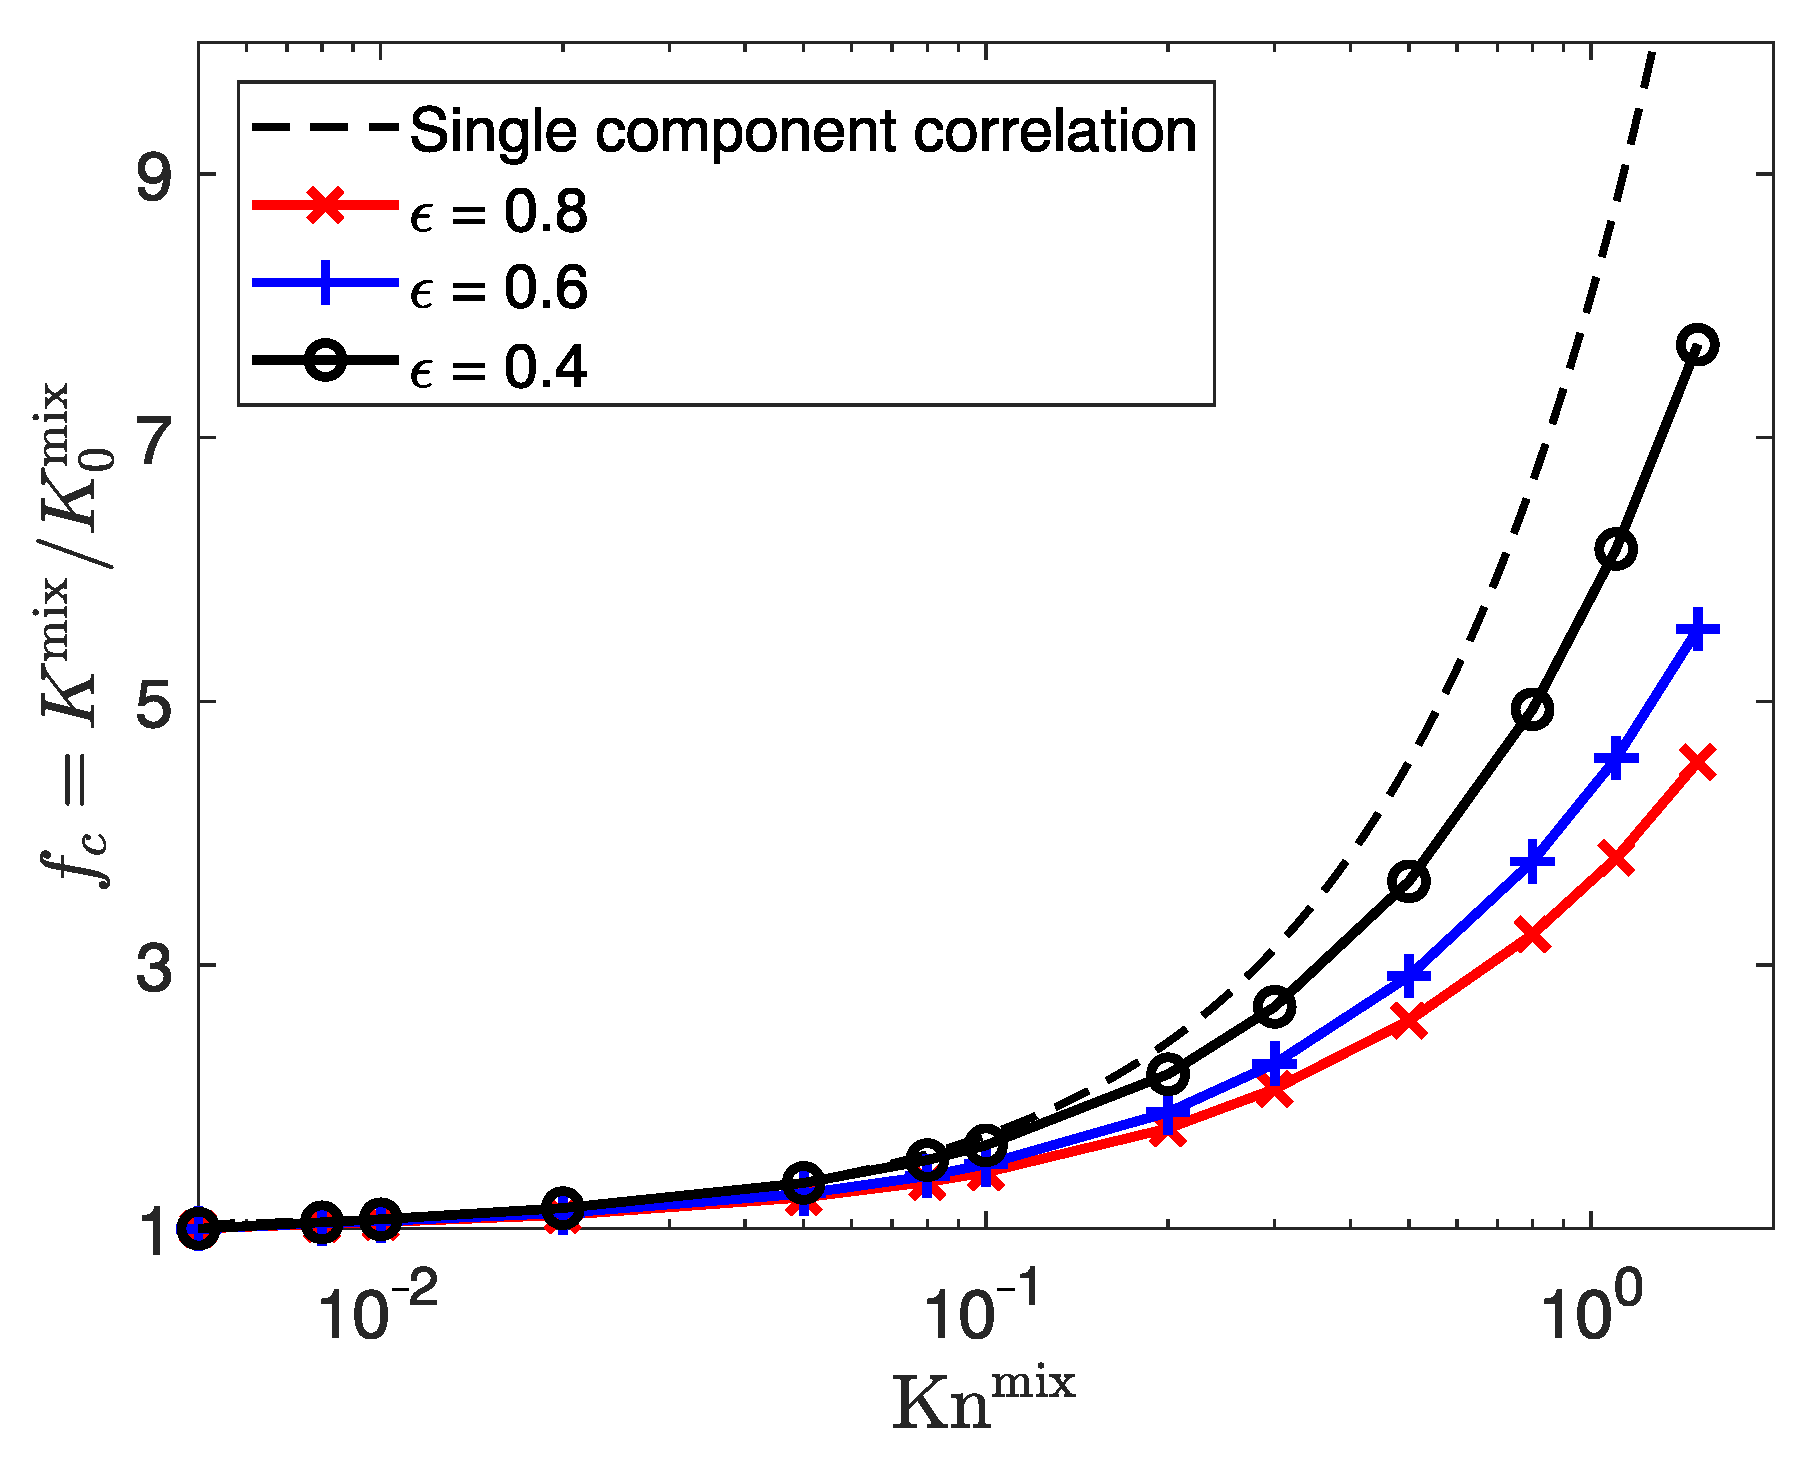
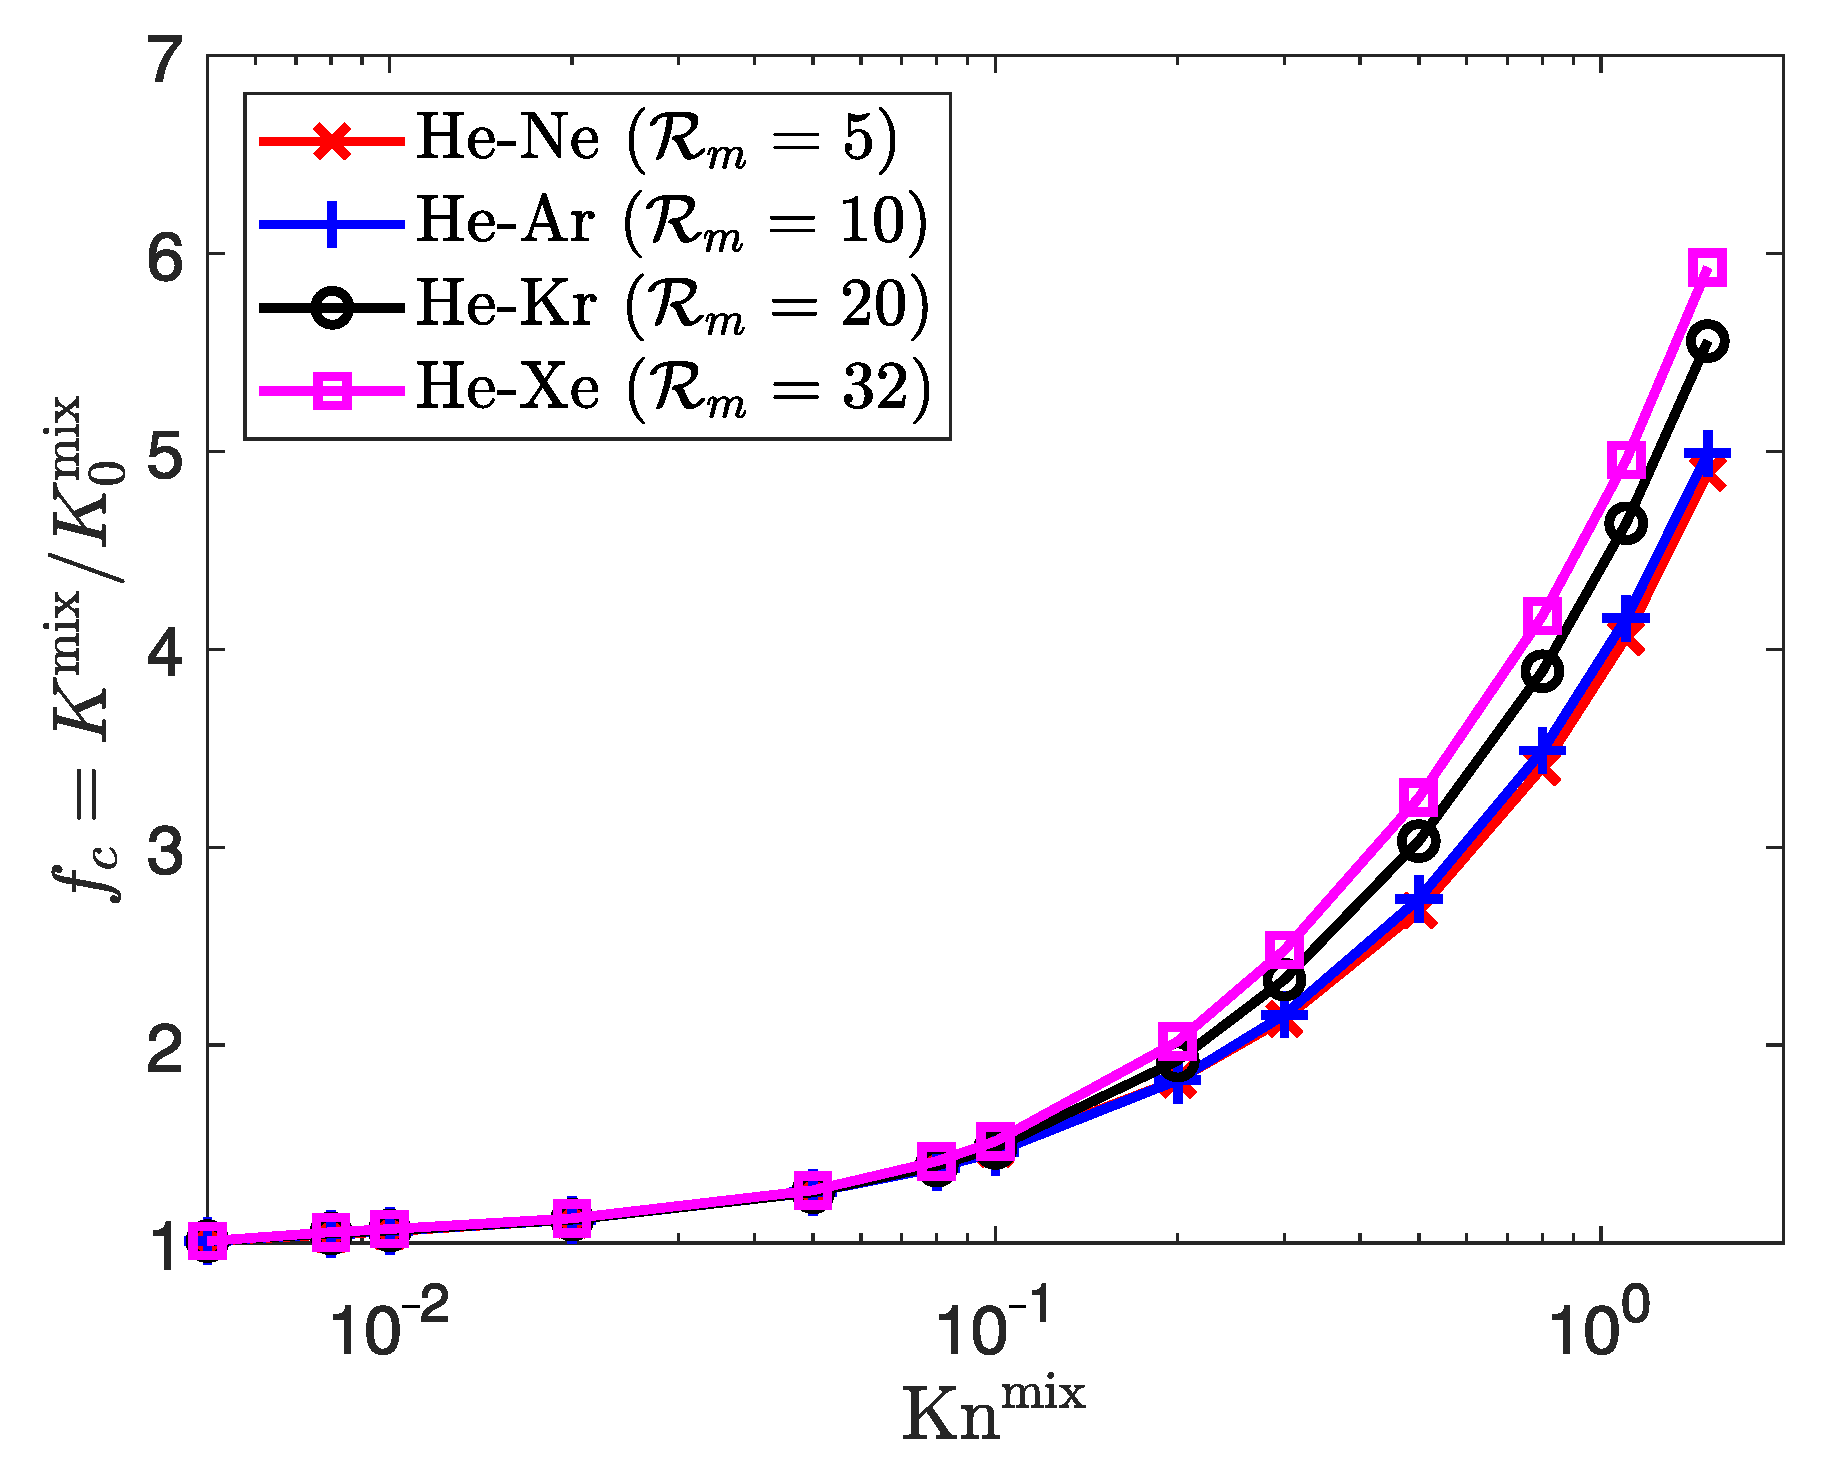
Figure 11 shows the evolution of the mixture permeability enhancement factor f c for the He-Ar equimolar mixture against Kn mix for the different target porosities. The single component correlation is also plotted for comparison [108]. We can see that f c increases with Kn mix for all porosities, which is expected, as rarefaction tend to offset the porous media drag force with the slippage effects. The increase in Kn mix results in a larger mean free path, so the gas particles flow more freely and are less subject to gas–solid collisions that might slow them down. Based on the numerical results, we can identify two distinct behaviors for the mixture flow in porous media. When Kn mix < 0.1 , f c increases with Kn mix at the same rate, regardless of the porosity. This is in agreement with the single component results [108], where porosity has no influence on the rate of f c with Kn mix . Therefore, the mixture behaves like a single component flow. When Kn mix is greater than 0.1, the rate of increase of f c decreases with porosity. This can be qualitatively explained by the increasing presence of solid walls. Indeed, since the specific surface of the porous media increases with porosity, more slippage occurs, so the rarefied flow deviates even more from the hydrodynamic behavior, resulting in a greater f c . However, slippage effects also exist for pure component flows, and is not sufficient to solely explain the mixture flow behavior in the transition flow regime. Furthermore, the f c of the mixture flow is consistently lower than the single component correlation, regardless of the porosity.
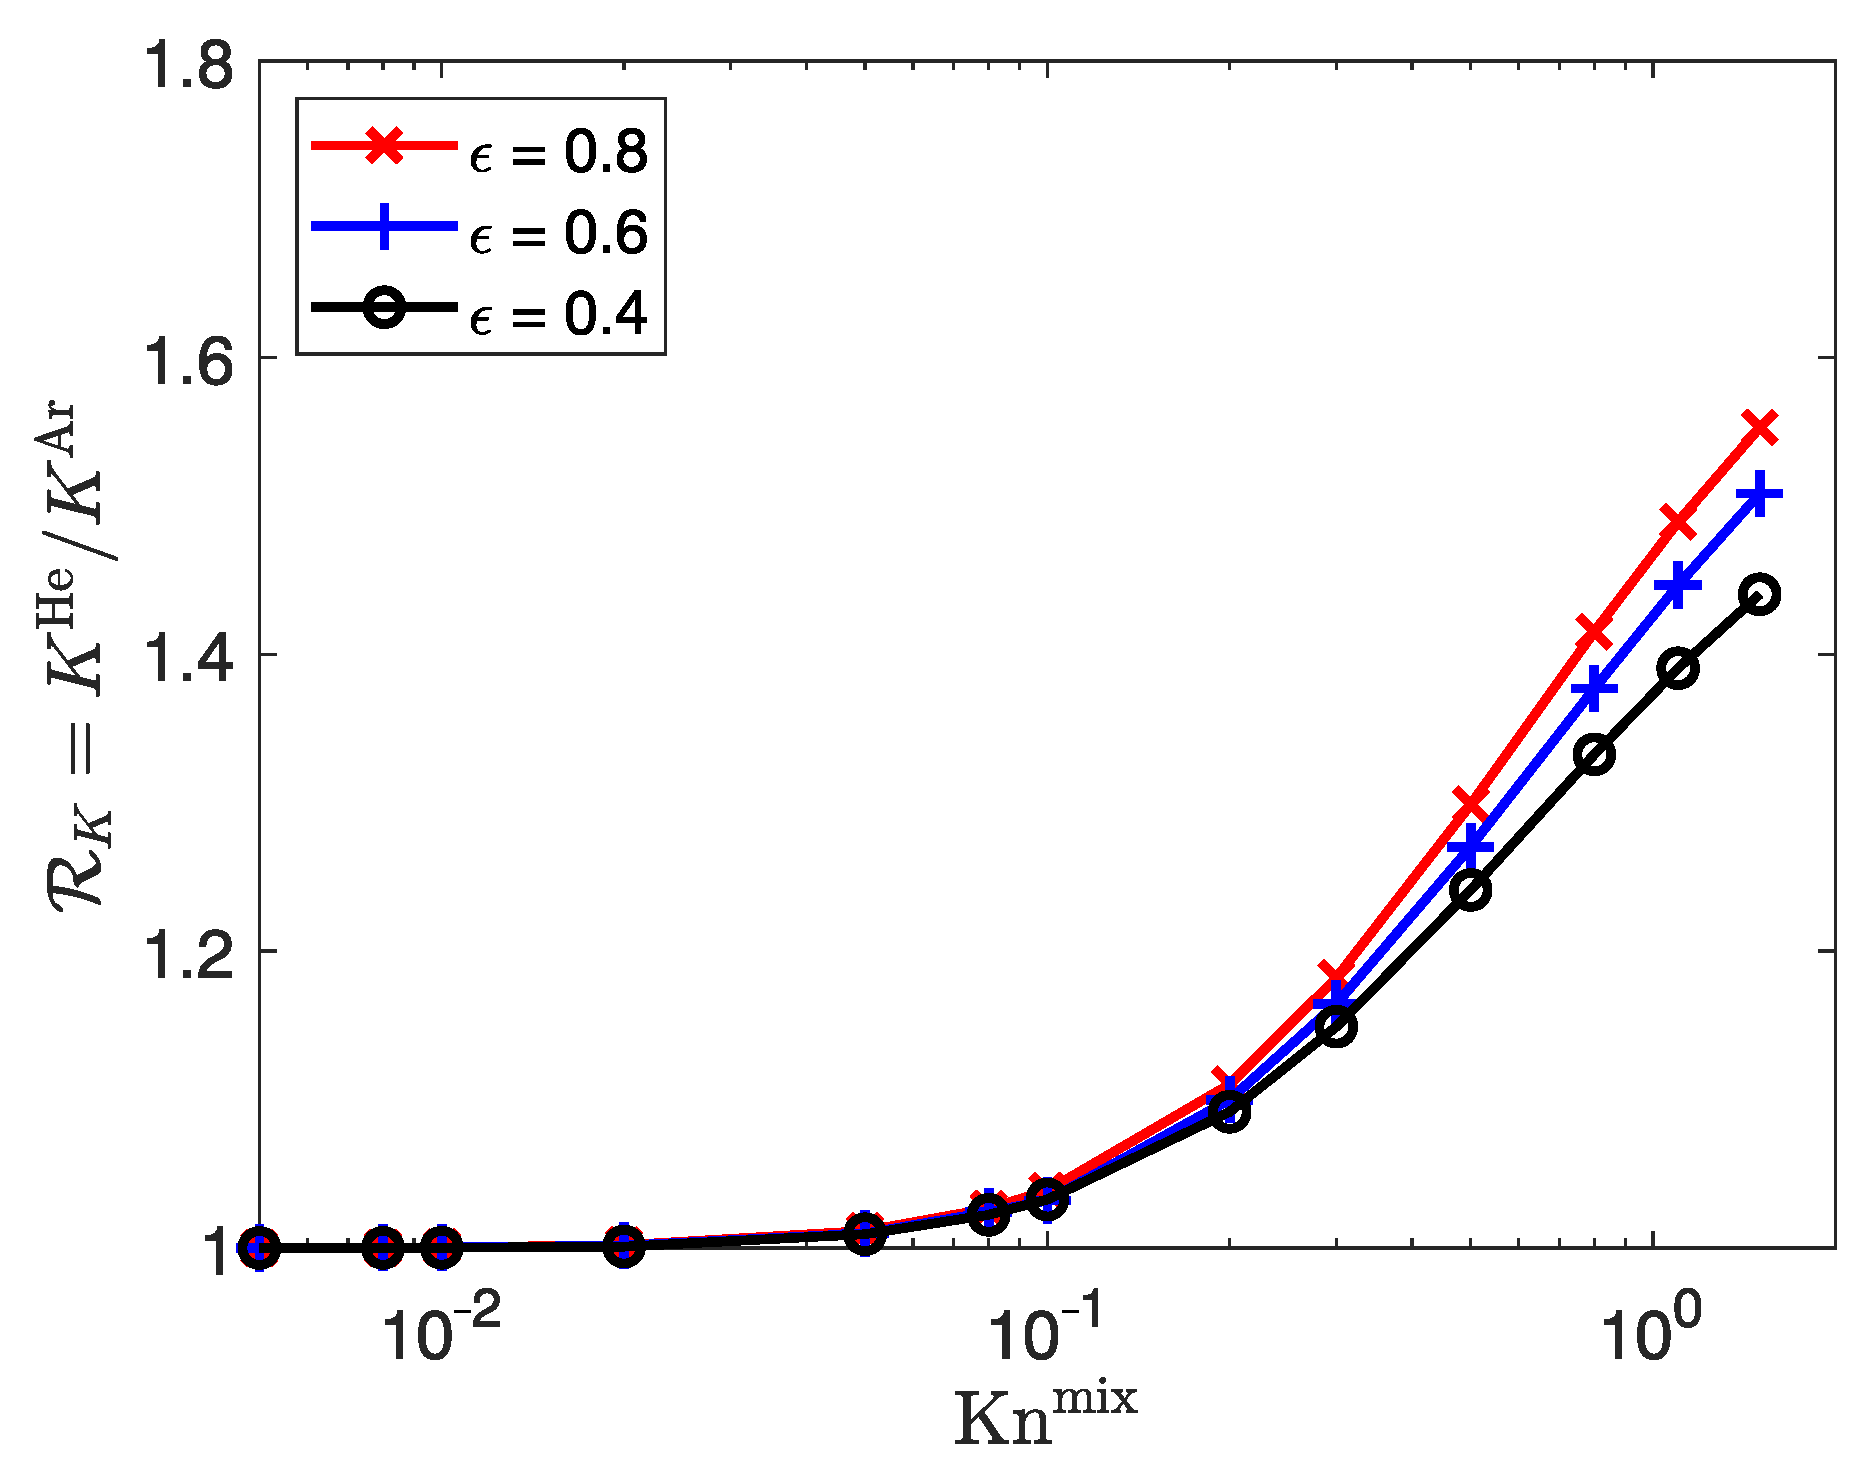
To further investigate the behavior at highly rarefied regimes, we look at the behavior of each individual species of the mixture by displaying the species permeability ratio R K = K He / K Ar in Figure 12. The ratio increases with Kn mix , regardless of porosity, meaning that the lighter species He flows faster than the heavier species Ar. This behavior describing the gas phase separation is consistent with the observations made for simple microchannels [78,109,110]. The two types of behavior seen in Figure 11 are also identified here. Indeed, the homogeneous behavior of the mixture is validated, as the value of R K approaches unity when Kn mix < 0.1 . An increase in R K with Kn mix is observed above 0.1, indicating an increase in the gas separation phenomenon. The degree of separation at a given Kn mix is greater at a high porosity, meaning that the presence of porous media has a mitigating effect on gas phase separation. The observations made in Figure 12 may explain the rate of f c with Kn mix in Figure 11. Indeed, the lowest porosity ( ϵ = 0.4 ) exhibits the lowest degree of separation, meaning that the mixture flow is less heterogeneous than for the highest porosity ( ϵ = 0.8 ). Therefore, the rate of increase in f c related to the mixture’s apparent permeability could be related to the degree of heterogeneity of the mixture, as shown in Figure 12.
Simulations at different porosities exhibit a dependency of the mixture permeability enhancement factor on geometrical features for mixture flows, especially at high rarefied regimes. Therefore, it is crucial to take multicomponent effects into account for gaseous mixture flows in the rarefied regime to estimate the mixture’s apparent permeability.

3.3.2. Influence of Mixture Composition

Previous studies have reportedly noticed the increase in gas phase separation with increasing molecular mass ratios at a given rarefaction rate for simple microchannels [77,78,109]. The present simulations extend the investigation to microporous media. Equimolar mixtures of He-Ne, He-Ar, He-Kr, and He-Xe with molecular mass ratios R m ranging from 5 to 32 are simulated from the hydrodynamic to the transition flow regimes. The molecular properties of the different components are listed in Table 1. The porous geometry given in Figure 9 is set to ϵ = 0.7 and remains identical throughout the different mixtures.
The evolution of the permeability enhancement factor is plotted against Kn mix in Figure 13. Like in Section 3.3.1, f c increases with Kn mix for all mixtures, and its evolution among the mixtures matches the previous observations. The rate of increase in f c is similar for all mixtures when Kn mix < 0.1 . Thus, all mixtures are equally affected by the rarefied effects, regardless of the molecular mass ratio. As rarefaction increases, mixtures gradually undergo different values of f c at a given Kn mix , which increases with R m . However, the molecular mass ratio seems to have less influence on the mixture’s apparent permeability than porosity, as the values of f c at high Kn mix are less spread for the different mixtures despite a wide range of R m .
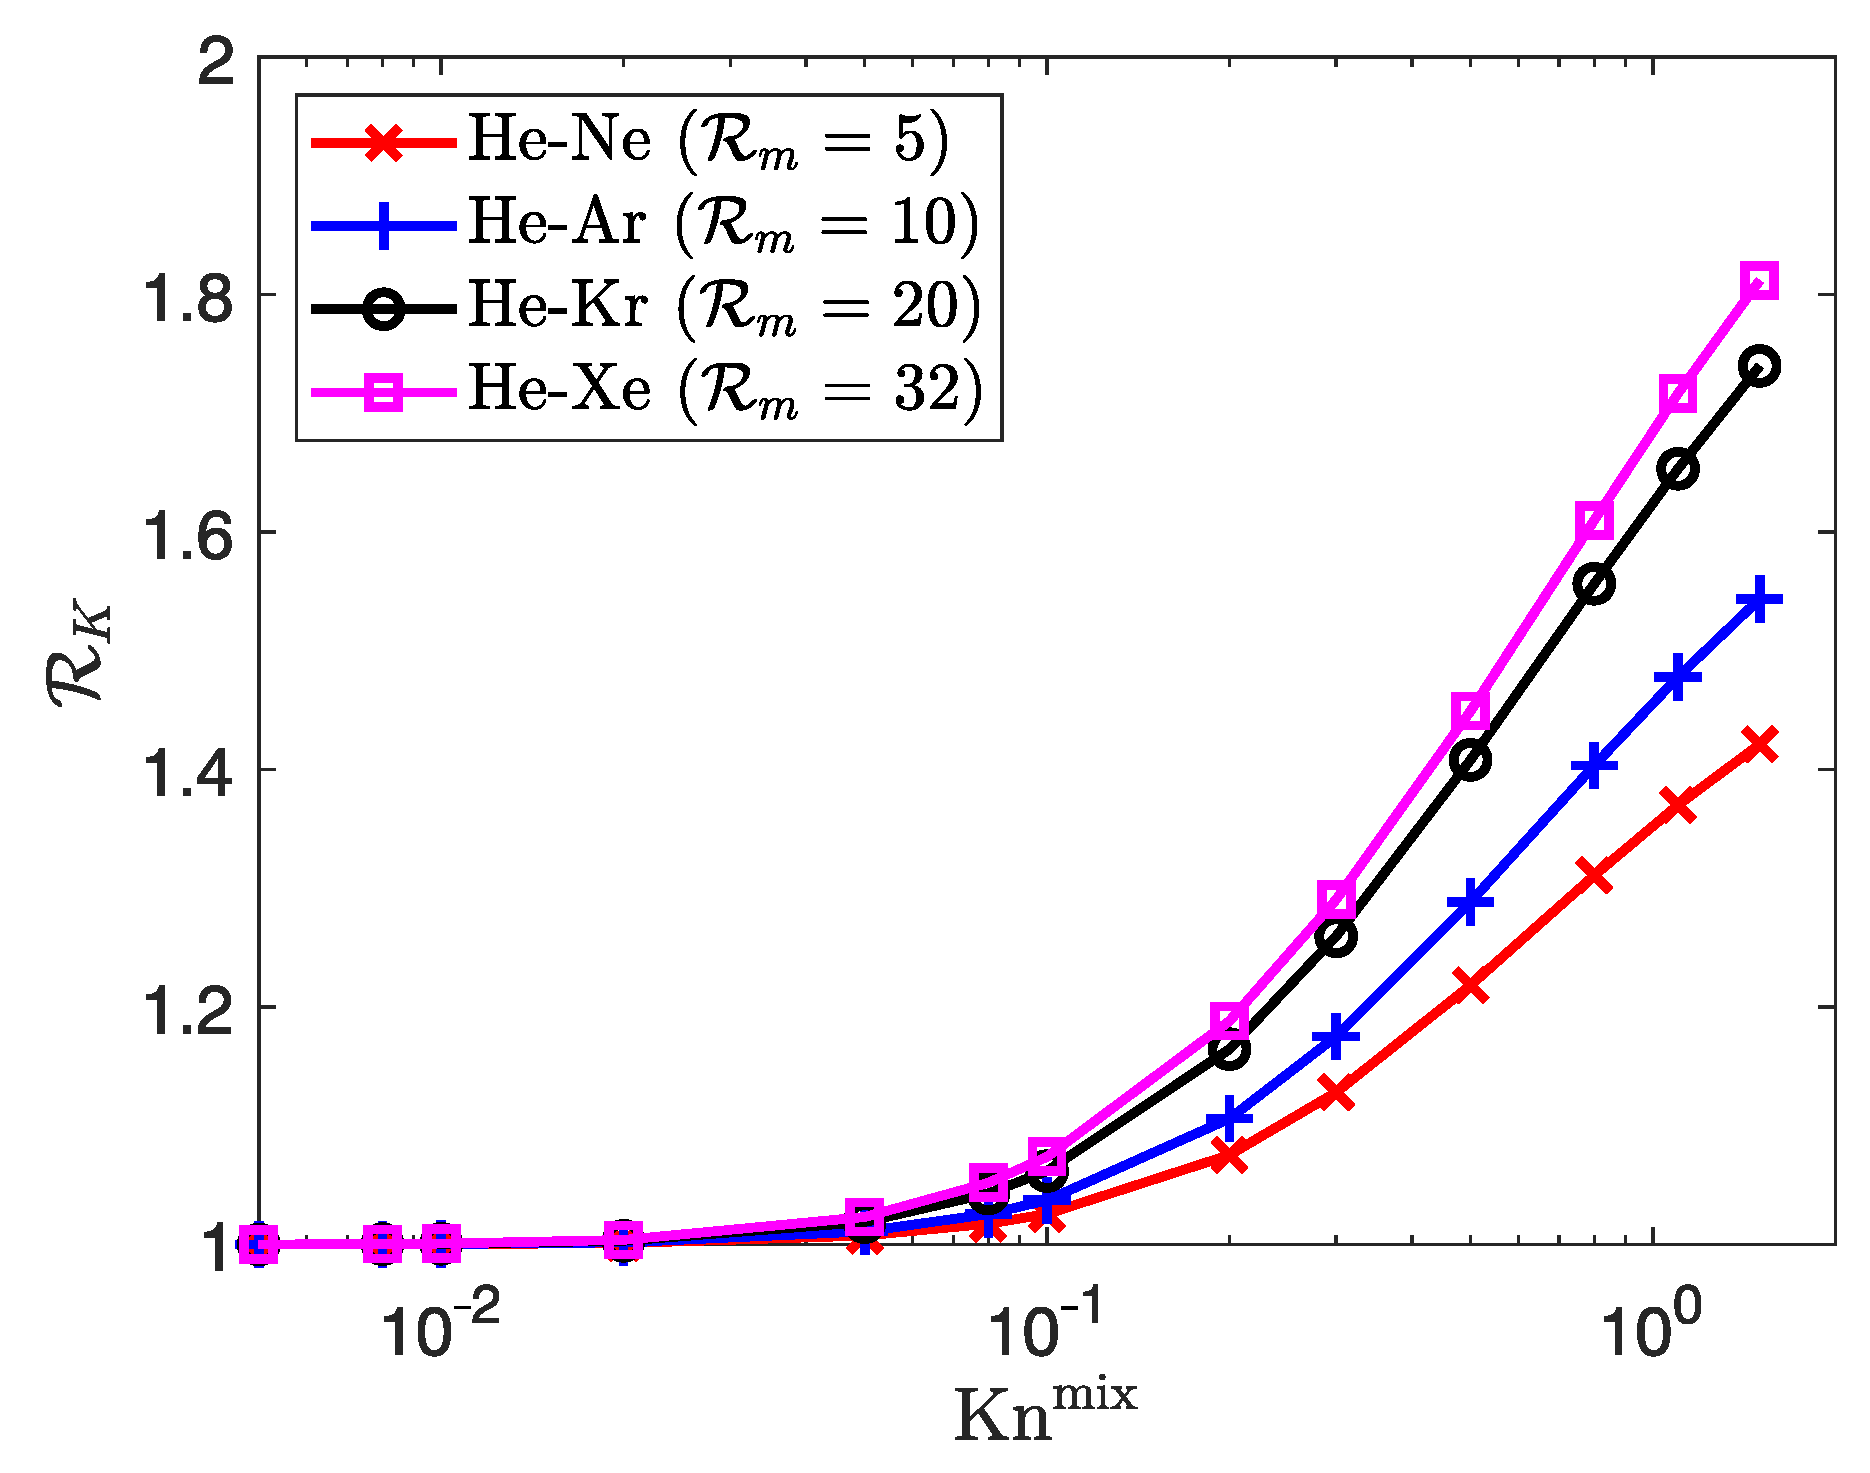
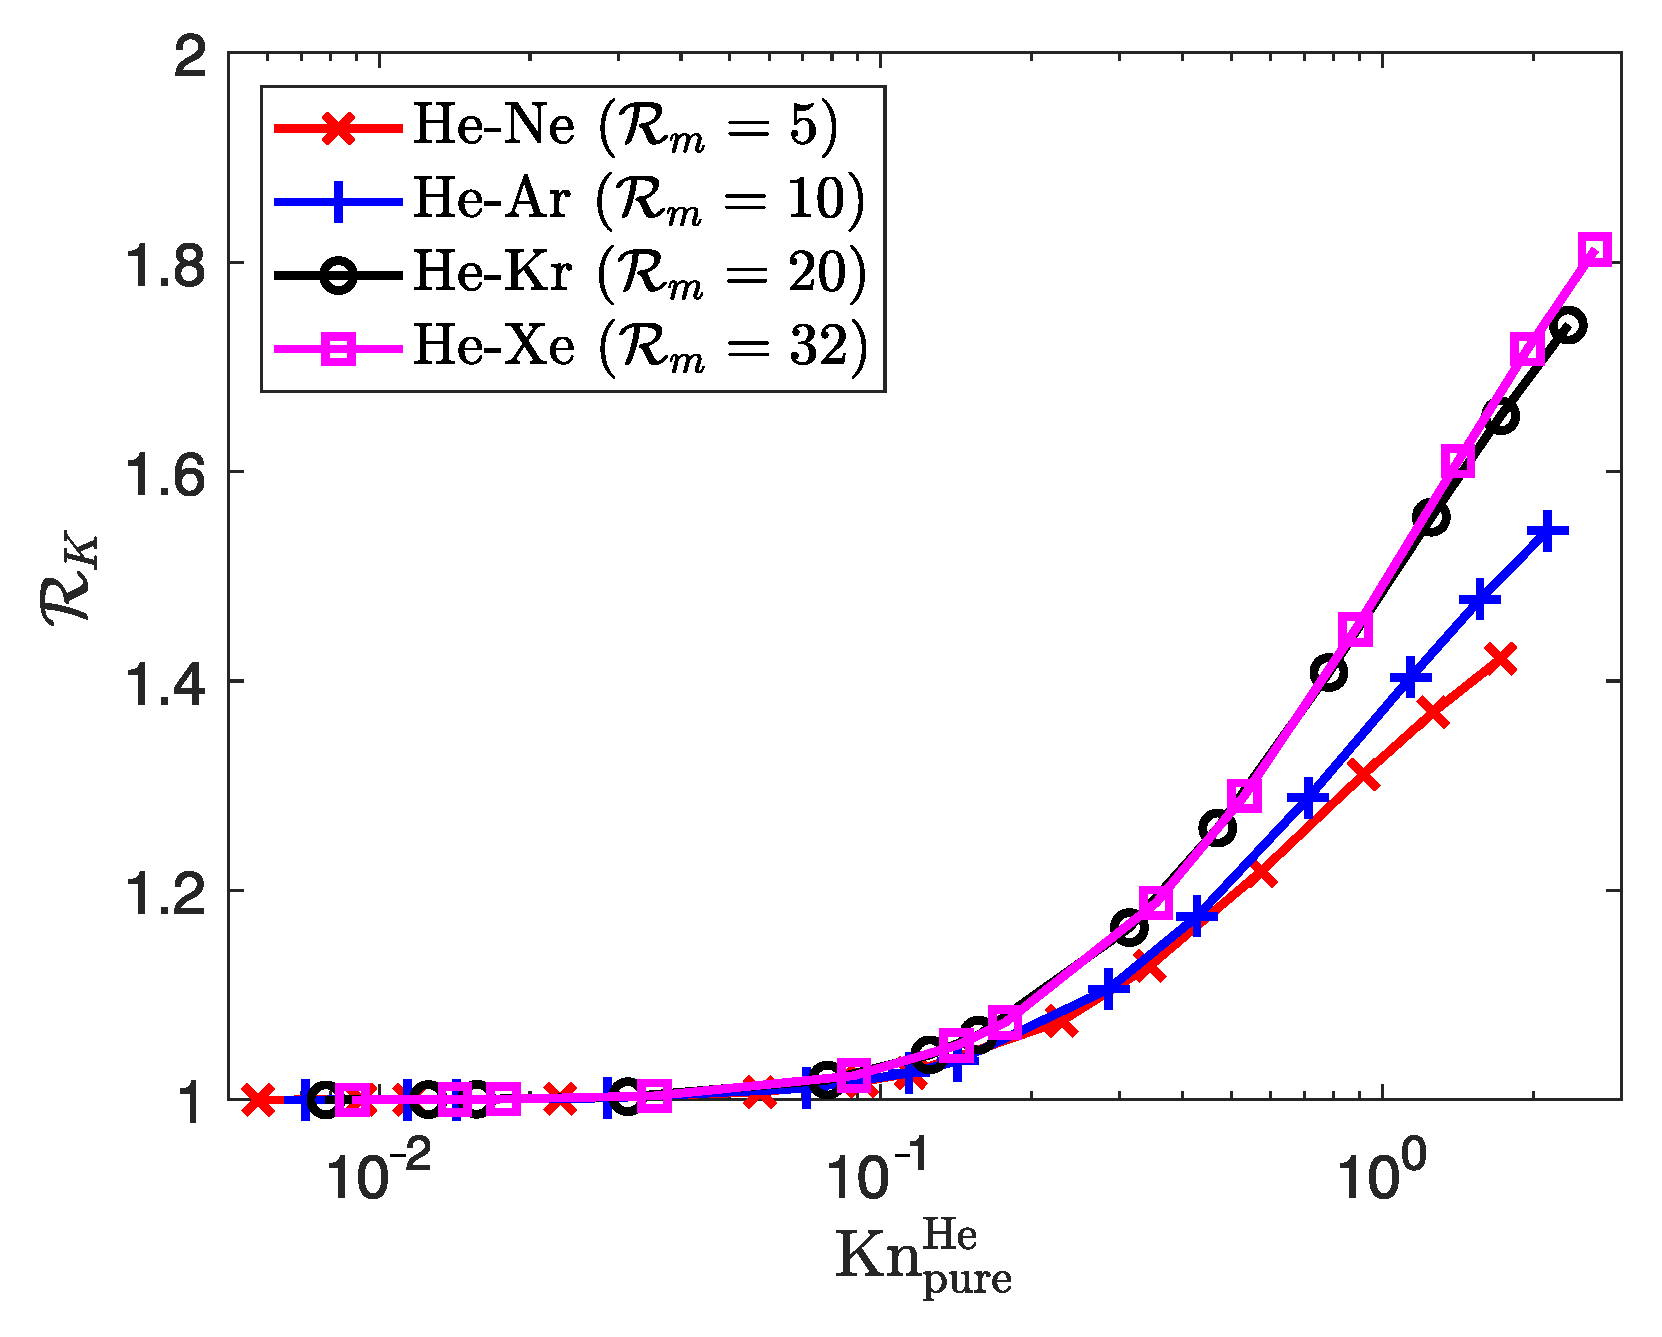
We follow up the analysis by plotting the species permeability ratios (the permeability of the lighter component is the numerator, which is K He in all mixtures) for the different mixtures in Figure 14. We notice that the gas phase separation is larger for mixtures with greater molecular mass ratios. Also, the separation phenomenon seems to appear at a earlier rarefaction rate for mixtures of species with disparate masses, which is in agreement with mixture flow behavior in microchannels [78,109]. Again, the degree of separation is almost negligible for all mixtures. When Kn mix > 0.1 , R K increases with Kn mix at a different rate, and the degree of gas phase separation is the greatest for the mixture with the largest molecular mass ratio. One may notice that the trend between f c and R K observed for the porosity is the opposite for the molecular mass ratio: at a given Kn mix , the mixture with the greatest value of R K also has the greatest value of f c . The mismatching evolution with the observation in Section 3.3.1 can be explained as we return in the physical domain.
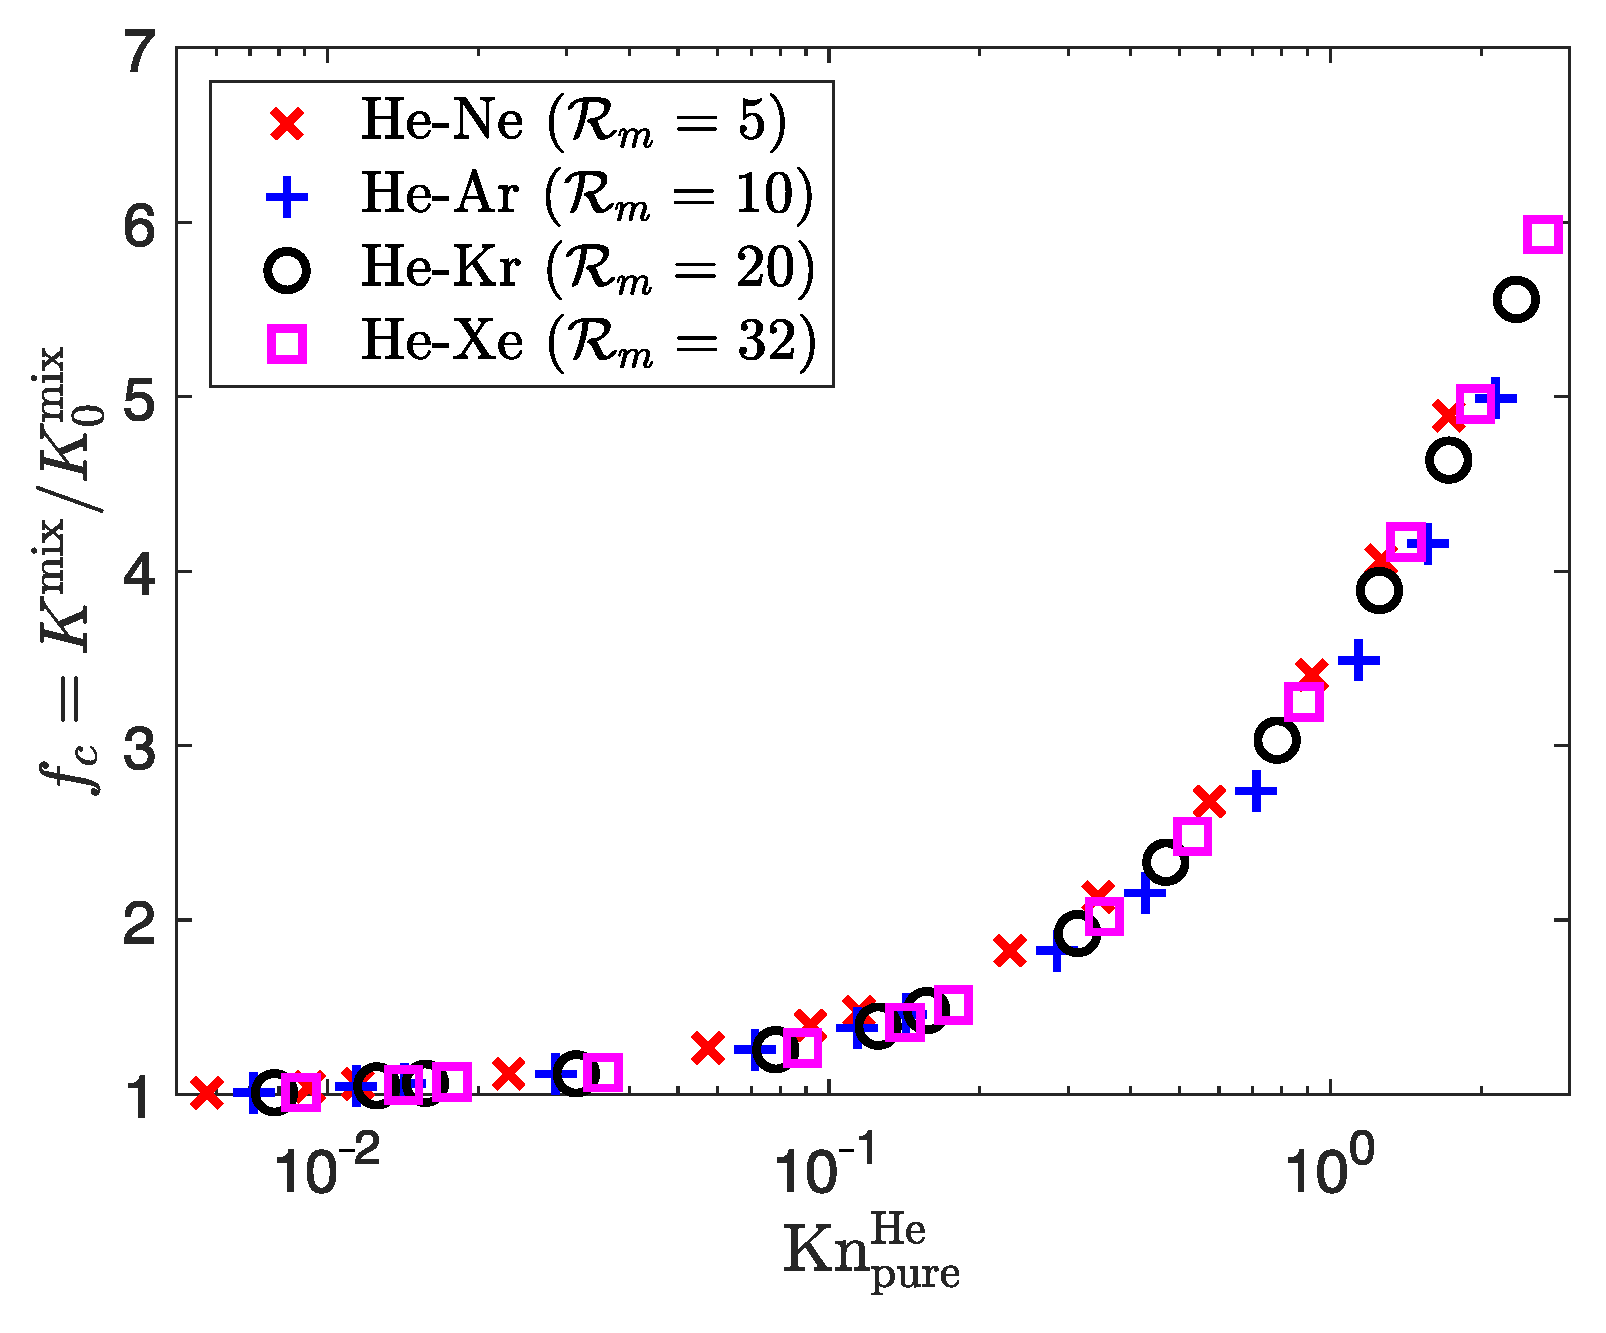
Simulations in LBM are conducted using lattice units, and a unit conversion procedure is required to extract the macroscopic physical quantities. The LBM algorithm benefits from the similarity law in fluid mechanics to simulate physical rarefied flows due to the use of Kn mix . However, based on the definition of Kn mix , simulating rarefied gaseous mixtures at the same Kn mix does not mean that the physical flow parameters are identical among the different mixtures. To illustrate this effect, we assume that the mean pore diameter is d p = 10 μm and the temperature is set to T = 300 K. To achieve Kn mix = 1 , Equations (17) and (19) recover a total pressure p mix = 12.2 kPa for the He-Ne mixture but only p mix = 7.9 kPa for the He-Xe mixture. As the He-Xe mixture flows through the microporous media with a lower pressure, the flow is effectively more rarefied, resulting in a higher permeability enhancement factor than for the He-Ne mixture. To recover the same flow parameters when computing using the same dimensionless number, the results are now displayed against Kn pure He = λ pure He / d p , where the Knudsen number based on the mean free path of He as a pure component λ pure He is defined as follows:
λ pure He = k B T 2 π d He 2 p mix .
Thus, plotting the numerical results against Kn pure He ensures the same flow parameters for the same reference rarefaction rate. It is worth noting that this issue on Kn mix does not exist in Section 3.3.1, since the simulations are performed for the same mixture. The numerical results in Figure 13 and Figure 14 are now plotted against Kn pure He in Figure 15 and Figure 16, respectively. This new display shows that all mixtures have a similar variation in the permeability enhancement factor against Kn pure He (directly related to flow pressure). Within the frame of these simulations, it would mean that the mixture’s apparent permeability increases with decreasing pressure, independent of the mixture composition. However, all mixtures still exhibit different behaviors towards rarefaction as we look at the value of R K in Figure 16. Indeed, gas phase separation is still observed, as the ratio increases with rarefaction rate, and the degree of separation increases with R m at a given rarefaction rate (or pressure). By ensuring the same physical flow parameters for the same dimensionless number, the mixture composition seems to have little effect on the evolution of the mixture’s apparent permeability in rarefied regimes, although the species velocity difference still increases with the molecular mass ratio. Following the single component works [46,56,108], a second-order correlation for the permeability enhancement factor f c can be derived for gaseous mixtures:
f c = 1 + a Kn pure He + b Kn pure He 2
With the present LBM results, the correlated coefficients are a = 2.75 and b = 0.37 with R 2 = 0.995 . One may notice that Equation (44) has been developed using He as the lightest species. Thus, further work using another reference species may lead to other coefficients.

4. Conclusions

An investigation of gaseous mixture flows in microporous media in the rarefied regime was performed using a individual species-based lattice Boltzmann model. The algorithm was improved from a former development by replacing the empirical consideration of the effective viscosity in the transition flow regime with a geometrically based wall function with a ray-tracing approach. The slip boundary conditions were also adapted to arbitrary geometries to enable microporous media simulations, and Knudsen diffusion was included using an effective binary diffusion coefficient to model the flow behavior in highly rarefied regimes. Those improvements enabled us to perform three-dimensional simulations. The numerical model was first verified through a long circular microchannel for an equimolar He-Ar mixture in the slip flow regime. A first-order convergence rate was found for the current LBM model compared to the analytical solutions obtained by solving the extended macroscopic equations with slip boundary conditions. The model was then validated by calculating the mixture’s mass flow rate through long rectangular and trapezoidal microchannels. A comparison with previous iterations of the numerical model shows that the mass flow rate is underestimated when Knudsen diffusion is not included. It is noteworthy that model validation for gaseous mixtures in the rarefied regime has not been previously reported in the literature within the LB framework to the authors’ knowledge.
Finally, a qualitative study investigated the influence of porosity and mixture composition on the species and mixture permeability in a structured arrangement of spheres. The different behavior of a gaseous mixture compared to a single component flow in microporous media at highly rarefied regimes was exhibited. Numerical results showed that gaseous mixtures flow like pure component flows at low rarefied regimes until Kn mix 0.1 , regardless of the porosity or mixture composition. The reduction to a single component flow was validated when looking at the species permeability ratio. Its value was near unity, meaning that the mixture was homogeneous and the species velocities were equal. At higher rarefied regimes, the permeability enhancement factor is affected by porosity. It increases at a higher rate when the regime becomes more rarefied for a low-porosity geometry. Also, at a given rarefaction rate, the gas phase separation is greater when the porosity is low. Regarding the mixture composition, numerical results for different equimolar mixtures at various molecular mass ratios showed that the gas separation phenomenon increases with molecular mass ratio. This observation is in agreement with the ones made for simple microchannels. The permeability enhancement factor increases at a higher rate for the mixture with the largest molecular mass ratio, thus resulting in the greatest degree of separation. This trend is inverted compared to the one observed while varying porosity. However, the redefinition of the rarefaction rate to recover similar physical flow parameters shows that the composition of the mixture has almost no influence on the mixture permeability enhancement factor, even though gas phase separation appears at highly rarefied regimes.
The increasing species permeability ratio in the rarefied regime highlights the porous media selectivity and could help the design of microporous media to control the magnitude of the separation process. However, further investigation must be carefully conducted to predict the mixture flow behavior in microporous media. One of the key issues to address remains the slip behavior at the solid walls of each individual species, which was approximated based on the mixture slip coefficient in the current model. Because gas–solid interactions have an increasing contribution to the global flow at rarefied regimes, they must be carefully modeled. Future work could focus on developing a boundary condition to accurately recover the physical slip velocity of each species in gaseous mixtures and extend the study to mixtures with more than two components. The effects of additional degrees of freedom in polyatomic gas within rarefied flows of mixtures could also be investigated to further improve the numerical model.

Author Contributions

Conceptualization, M.H., J.-M.T., S.A., S.L., M.R. and J.-Y.T.; data curation, M.H. and S.L.; formal analysis, M.H.; funding acquisition, S.L., M.R. and J.-Y.T.; investigation, M.H.; methodology, M.H. and J.-M.T.; project administration, S.A., S.L., M.R. and J.-Y.T.; resources, M.H., S.L., M.R. and J.-Y.T.; software, M.H., J.-M.T. and S.L.; supervision, S.A., S.L., M.R. and J.-Y.T.; validation, M.H.; visualization, M.H.; writing—original draft, M.H. and J.-M.T.; Writing—review and editing, M.H., J.-M.T., S.A., S.L., M.R. and J.-Y.T. All authors have read and agreed to the published version of the manuscript.

Funding

We acknowledge the support of the Natural Sciences and Engineering Council of Canada (NSERC) [reference number RGPIN-2020-04512 and RGPIN-2022-03506].

Data Availability Statement

The original contributions presented in this study are included in the article. Further inquiries can be directed to the corresponding author.

Conflicts of Interest

The authors declare no conflicts of interest.

References

  1. Reed, B.; Dang, L. Experimental evaluation of cold flow micronozzles. In Proceedings of the 37th Joint Propulsion Conference and Exhibit, Salt Lake City, UT, USA, 8–11 July 2001; p. 3521. [Google Scholar]
  2. Kovvali, A.S.; Sirkar, K. Dendrimer liquid membranes: CO2 separation from gas mixtures. Ind. Eng. Chem. Res. 2001, 40, 2502–2511. [Google Scholar] [CrossRef]
  3. Takahashi, Y.; Okajima, J.; Iga, Y.; Komiya, A.; Fu, W.S.; Maruyama, S. Study of supersonic micro-channel for cooling electronic devices. In Proceedings of the International Conference on Nanochannels, Microchannels, and Minichannels, Sapporo, Japan, 16–19 June 2013; American Society of Mechanical Engineers: New York, NY, USA, 2013; Volume 55591. [Google Scholar]
  4. Hossein-Babaei, F.; Paknahad, M.; Ghafarinia, V. A miniature gas analyzer made by integrating a chemoresistor with a microchannel. Lab Chip 2012, 12, 1874–1880. [Google Scholar] [CrossRef] [PubMed]
  5. Görke, O.; Pfeifer, P.; Schubert, K. Highly selective methanation by the use of a microchannel reactor. Catal. Today 2005, 110, 132–139. [Google Scholar] [CrossRef]
  6. Ho, C.M.; Tai, Y.C. Micro-electro-mechanical-systems (MEMS) and fluid flows. Annu. Rev. Fluid Mech. 1998, 30, 579–612. [Google Scholar] [CrossRef]
  7. Nakaye, S.; Sugimoto, H. Demonstration of a gas separator composed of Knudsen pumps. Vacuum 2016, 125, 154–164. [Google Scholar] [CrossRef]
  8. Gerlach, T. Pumping gases by a silicon micro pump with dynamic passive valves. In Proceedings of the International Solid State Sensors and Actuators Conference (Transducers’ 97), Chicago, IL, USA, 19 June 1997; Volume 1, pp. 357–360. [Google Scholar]
  9. Wang, X.; Su, T.; Zhang, W.; Zhang, Z.; Zhang, S. Knudsen pumps: A review. Microsyst. Nanoeng. 2020, 6, 1–28. [Google Scholar] [CrossRef]
  10. Chai, D.; Li, X. Rarefied gas transport in heterogeneous shale matrix using a practical apparent permeability model and fuzzy statistical method. J. Pet. Sci. Eng. 2021, 206, 109029. [Google Scholar] [CrossRef]
  11. Wang, J.; Chen, L.; Kang, Q.; Rahman, S.S. The lattice Boltzmann method for isothermal micro-gaseous flow and its application in shale gas flow: A review. Int. J. Heat Mass Transf. 2016, 95, 94–108. [Google Scholar] [CrossRef]
  12. Wang, J.; Chen, L.; Kang, Q.; Rahman, S.S. Apparent permeability prediction of organic shale with generalized lattice Boltzmann model considering surface diffusion effect. Fuel 2016, 181, 478–490. [Google Scholar] [CrossRef]
  13. Panerai, F.; Cochell, T.; Martin, A.; White, J.D. Experimental measurements of the high-temperature oxidation of carbon fibers. Int. J. Heat Mass Transf. 2019, 136, 972–986. [Google Scholar] [CrossRef]
  14. Lachaud, J.; Cozmuta, I.; Mansour, N.N. Multiscale approach to ablation modeling of phenolic impregnated carbon ablators. J. Spacecr. Rocket. 2010, 47, 910–921. [Google Scholar] [CrossRef]
  15. Panerai, F.; Ferguson, J.C.; Lachaud, J.; Martin, A.; Gasch, M.J.; Mansour, N.N. Micro-tomography based analysis of thermal conductivity, diffusivity and oxidation behavior of rigid and flexible fibrous insulators. Int. J. Heat Mass Transf. 2017, 108, 801–811. [Google Scholar] [CrossRef]
  16. Ferguson, J.C.; Panerai, F.; Lachaud, J.; Martin, A.; Bailey, S.C.; Mansour, N.N. Modeling the oxidation of low-density carbon fiber material based on micro-tomography. Carbon 2016, 96, 57–65. [Google Scholar] [CrossRef]
  17. Poovathingal, S.; Stern, E.C.; Nompelis, I.; Schwartzentruber, T.E.; Candler, G.V. Nonequilibrium flow through porous thermal protection materials, Part II: Oxidation and pyrolysis. J. Comput. Phys. 2019, 380, 427–441. [Google Scholar] [CrossRef]
  18. Gad-el Hak, M. Comments on “critical view on new results in micro-fluid mechanics”. Int. J. Heat Mass Transf. 2003, 46, 3941–3945. [Google Scholar] [CrossRef]
  19. Maxwell, J.C. VII. On stresses in rarified gases arising from inequalities of temperature. Philos. Trans. R. Soc. Lond. 1879, 231–256. [Google Scholar]
  20. Zhang, W.M.; Meng, G.; Wei, X. A review on slip models for gas microflows. Microfluid. Nanofluid. 2012, 13, 845–882. [Google Scholar] [CrossRef]
  21. Beskok, A.; Karniadakis, G.E. Report: A model for flows in channels, pipes, and ducts at micro and nano scales. Microscale Thermophys. Eng. 1999, 3, 43–77. [Google Scholar]
  22. Colin, S.; Lalonde, P.; Caen, R. Validation of a second-order slip flow model in rectangular microchannels. Heat Transf. Eng. 2004, 25, 23–30. [Google Scholar] [CrossRef]
  23. Chambre, P.A.; Schaaf, S.A. Flow of Rarefied Gases; Princeton University Press: Princeton, NJ, USA, 2017. [Google Scholar]
  24. Zhang, T.; Jia, L.; Wang, Z. Validation of Navier–Stokes equations for slip flow analysis within transition region. Int. J. Heat Mass Transf. 2008, 51, 6323–6327. [Google Scholar] [CrossRef]
  25. Deissler, R. An analysis of second-order slip flow and temperature-jump boundary conditions for rarefied gases. Int. J. Heat Mass Transf. 1964, 7, 681–694. [Google Scholar] [CrossRef]
  26. Yudistiawan, W.P.; Ansumali, S.; Karlin, I.V. Hydrodynamics beyond Navier-Stokes: The slip flow model. Phys. Rev. E 2008, 78, 016705. [Google Scholar] [CrossRef]
  27. Le, N.T.; White, C.; Reese, J.M.; Myong, R.S. Langmuir–Maxwell and Langmuir–Smoluchowski boundary conditions for thermal gas flow simulations in hypersonic aerodynamics. Int. J. Heat Mass Transf. 2012, 55, 5032–5043. [Google Scholar] [CrossRef]
  28. Singh, S.; Karchani, A.; Chourushi, T.; Myong, R.S. A three-dimensional modal discontinuous Galerkin method for the second-order Boltzmann-Curtiss-based constitutive model of rarefied and microscale gas flows. J. Comput. Phys. 2022, 457, 111052. [Google Scholar] [CrossRef]
  29. Cercignani, C. Mathematical Methods in Kinetic Theory; Springer: Berlin/Heidelberg, Germany, 1969; Volume 1. [Google Scholar]
  30. Guo, Z.; Zheng, C.; Shi, B. Lattice Boltzmann equation with multiple effective relaxation times for gaseous microscale flow. Phys. Rev. E 2008, 77, 036707. [Google Scholar] [CrossRef] [PubMed]
  31. Tucny, J.M.; Vidal, D.; Leclaire, S.; Bertrand, F. Comparison of existing and extended boundary conditions for the simulation of rarefied gas flows using the Lattice Boltzmann method. Int. J. Mod. Phys. C 2020, 31, 2050070. [Google Scholar] [CrossRef]
  32. Tucny, J.M.; Vidal, D.; Leclaire, S.; Bertrand, F. Kinetic Slip Boundary Condition for Isothermal Rarefied Gas Flows Through Static Non-Planar Geometries Based on the Regularized Lattice-Boltzmann Method. Commun. Comput. Phys. 2022, 31, 816–868. [Google Scholar] [CrossRef]
  33. Verhaeghe, F.; Luo, L.S.; Blanpain, B. Lattice Boltzmann modeling of microchannel flow in slip flow regime. J. Comput. Phys. 2009, 228, 147–157. [Google Scholar] [CrossRef]
  34. Zhao, Y.; Liu, X.; Zhang, L.; Shan, B. A basic model of unconventional gas microscale flow based on the lattice Boltzmann method. Pet. Explor. Dev. 2021, 48, 179–189. [Google Scholar] [CrossRef]
  35. Kalarakis, A.; Michalis, V.; Skouras, E.; Burganos, V. Mesoscopic simulation of rarefied flow in narrow channels and porous media. Transp. Porous Media 2012, 94, 385–398. [Google Scholar] [CrossRef]
  36. Li, Q.; He, Y.; Tang, G.; Tao, W. Lattice Boltzmann modeling of microchannel flows in the transition flow regime. Microfluid. Nanofluid. 2011, 10, 607–618. [Google Scholar] [CrossRef]
  37. Tang, G.; Tao, W.; He, Y. Lattice Boltzmann method for gaseous microflows using kinetic theory boundary conditions. Phys. Fluids 2005, 17, 058101. [Google Scholar] [CrossRef]
  38. Zhang, Y.; Qin, R.; Emerson, D.R. Lattice Boltzmann simulation of rarefied gas flows in microchannels. Phys. Rev. E 2005, 71, 047702. [Google Scholar] [CrossRef] [PubMed]
  39. Guo, Z.; Shi, B.; Zhao, T.; Zheng, C. Discrete effects on boundary conditions for the lattice Boltzmann equation in simulating microscale gas flows. Phys. Rev. E 2007, 76, 056704. [Google Scholar] [CrossRef] [PubMed]
  40. Bhatnagar, P.L.; Gross, E.P.; Krook, M. A model for collision processes in gases. I. Small amplitude processes in charged and neutral one-component systems. Phys. Rev. 1954, 94, 511. [Google Scholar] [CrossRef]
  41. Chai, Z.; Shi, B.; Guo, Z.; Lu, J. Gas flow through square arrays of circular cylinders with Klinkenberg effect: A lattice Boltzmann study. Commun. Comput. Phys. 2010, 8, 1052. [Google Scholar]
  42. Landry, C.J.; Prodanović, M.; Eichhubl, P. Direct simulation of supercritical gas flow in complex nanoporous media and prediction of apparent permeability. Int. J. Coal Geol. 2016, 159, 120–134. [Google Scholar] [CrossRef]
  43. Ansumali, S.; Karlin, I.V. Kinetic boundary conditions in the lattice Boltzmann method. Phys. Rev. E 2002, 66, 026311. [Google Scholar] [CrossRef]
  44. Succi, S. Mesoscopic modeling of slip motion at fluid-solid interfaces with heterogeneous catalysis. Phys. Rev. Lett. 2002, 89, 064502. [Google Scholar] [CrossRef]
  45. Yuan, Y.; Rahman, S. Extended application of lattice Boltzmann method to rarefied gas flow in micro-channels. Phys. A Stat. Mech. Its Appl. 2016, 463, 25–36. [Google Scholar] [CrossRef]
  46. Ho, M.; Pérez, J.G.; Reggio, M.; Trépanier, J.Y. Permeability calculation of rarefied gas flows through 2D porous structures using the lattice Boltzmann method. Phys. Chem. Earth Parts A/B/C 2019, 113, 43–49. [Google Scholar] [CrossRef]
  47. Arlemark, E.J.; Dadzie, S.K.; Reese, J.M. An extension to the Navier–Stokes equations to incorporate gas molecular collisions with boundaries. J. Heat Transf. 2010, 132, 041006. [Google Scholar] [CrossRef]
  48. Dongari, N.; Zhang, Y.; Reese, J.M. Modeling of Knudsen layer effects in micro/nanoscale gas flows. J. Fluids Eng. 2011, 133, 071101. [Google Scholar] [CrossRef]
  49. Michalis, V.K.; Kalarakis, A.N.; Skouras, E.D.; Burganos, V.N. Rarefaction effects on gas viscosity in the Knudsen transition regime. Microfluid. Nanofluid. 2010, 9, 847–853. [Google Scholar] [CrossRef]
  50. Ren, J.; Zheng, Q.; Guo, P.; Peng, S.; Wang, Z.; Du, J. Pore-scale lattice Boltzmann simulation of two-component shale gas flow. J. Nat. Gas Sci. Eng. 2019, 61, 46–70. [Google Scholar] [CrossRef]
  51. Klinkenberg, L. The permeability of porous media to liquids and gases. Drill. Prod. Pract. 1941, 2, 200–213. [Google Scholar] [CrossRef]
  52. Chen, L.; Zhang, L.; Kang, Q.; Viswanathan, H.S.; Yao, J.; Tao, W. Nanoscale simulation of shale transport properties using the lattice Boltzmann method: Permeability and diffusivity. Sci. Rep. 2015, 5, 8089. [Google Scholar] [CrossRef]
  53. Zhao, Y.l.; Wang, Z.m. Prediction of apparent permeability of porous media based on a modified lattice Boltzmann method. J. Pet. Sci. Eng. 2019, 174, 1261–1268. [Google Scholar] [CrossRef]
  54. Zhao, T.; Zhao, H.; Li, X.; Ning, Z.; Wang, Q.; Zhao, W.; Zhang, J. Pore scale characteristics of gas flow in shale matrix determined by the regularized lattice Boltzmann method. Chem. Eng. Sci. 2018, 187, 245–255. [Google Scholar] [CrossRef]
  55. Ho, M.; Leclaire, S.; Reggio, M.; Trépanier, J.Y. Stochastic effects of 2D random arrays of cylinders on rarefied gas permeability using the lattice boltzmann method. Transp. Porous Media 2021, 136, 607–637. [Google Scholar] [CrossRef]
  56. Zhao, J.; Yao, J.; Zhang, M.; Zhang, L.; Yang, Y.; Sun, H.; An, S.; Li, A. Study of gas flow characteristics in tight porous media with a microscale lattice Boltzmann model. Sci. Rep. 2016, 6, 32393. [Google Scholar] [CrossRef]
  57. Sirovich, L. Kinetic modeling of gas mixtures. Phys. Fluids 1962, 5, 908–918. [Google Scholar] [CrossRef]
  58. Hamel, B.B. Kinetic model for binary gas mixtures. Phys. Fluids 1965, 8, 418–425. [Google Scholar] [CrossRef]
  59. Kerkhof, P.J.; Geboers, M.A. Analysis and extension of the theory of multicomponent fluid diffusion. Chem. Eng. Sci. 2005, 60, 3129–3167. [Google Scholar] [CrossRef]
  60. Baker, R.W. Membrane Technology and Applications; John Wiley & Sons: Hoboken, NJ, USA, 2012. [Google Scholar]
  61. Wang, S.; Pan, Z.; Zhang, J.; Yang, Z.; Wang, Y.; Wu, Y.S.; Li, X.; Lukyanov, A. On the Klinkenberg effect of multicomponent gases. In Proceedings of the SPE Annual Technical Conference and Exhibition, San Antonio, TX, USA, 8–10 October 2017; OnePetro: Richardson, TX, USA, 2017. [Google Scholar]
  62. Wang, S.; Lukyanov, A.A.; Wu, Y.S. Second-order gas slippage model for the Klinkenberg effect of multicomponent gas at finite Knudsen numbers up to 1. Fuel 2019, 235, 1275–1286. [Google Scholar] [CrossRef]
  63. Sun, F.; Yao, Y.; Li, G.; Dong, M. Transport behaviors of real gas mixture through nanopores of shale reservoir. J. Pet. Sci. Eng. 2019, 177, 1134–1141. [Google Scholar] [CrossRef]
  64. Joshi, A.S.; Peracchio, A.A.; Grew, K.N.; Chiu, W.K. Lattice Boltzmann method for multi-component, non-continuum mass diffusion. J. Phys. D Appl. Phys. 2007, 40, 7593. [Google Scholar] [CrossRef]
  65. Paradis, H.; Sundén, B. Evaluation of lattice Boltzmann method for reaction-diffusion process in a porous SOFC anode microstructure. In Proceedings of the International Conference on Nanochannels, Microchannels, and Minichannels, Rio Grande, Puerto Rico, 8–12 July 2012; American Society of Mechanical Engineers: New York, NY, USA, 2012; Volume 44793, pp. 163–171. [Google Scholar]
  66. Guo, Y.; He, X.; Huang, W.; Wang, M. Microstructure effects on effective gas diffusion coefficient of nanoporous materials. Transp. Porous Media 2019, 126, 431–453. [Google Scholar] [CrossRef]
  67. Zheng, W.; Kim, S.H. The effects of catalyst layer microstructure and water saturation on the effective diffusivity in PEMFC. J. Electrochem. Soc. 2018, 165, F468. [Google Scholar] [CrossRef]
  68. Ma, Q.; Chen, Z. Lattice Boltzmann simulation of multicomponent noncontinuum diffusion in fractal porous structures. Phys. Rev. E 2015, 92, 013025. [Google Scholar] [CrossRef]
  69. Lin, Y.; Yang, C.; Choi, C.; Zhang, W.; Machida, H.; Norinaga, K. Lattice Boltzmann simulation of multicomponent reaction-diffusion and coke formation in a catalyst with hierarchical pore structure for dry reforming of methane. Chem. Eng. Sci. 2021, 229, 116105. [Google Scholar] [CrossRef]
  70. Asinari, P.; Luo, L.S. A consistent lattice Boltzmann equation with baroclinic coupling for mixtures. J. Comput. Phys. 2008, 227, 3878–3895. [Google Scholar] [CrossRef]
  71. d’Humières, D. Generalized lattice-Boltzmann equations. In Rarefied Gas Dynamics; Springer US: New York, NY, USA, 1992. [Google Scholar]
  72. Luo, L.S.; Girimaji, S.S. Lattice Boltzmann model for binary mixtures. Phys. Rev. E 2002, 66, 035301. [Google Scholar] [CrossRef] [PubMed]
  73. Arcidiacono, S.; Karlin, I.; Mantzaras, J.; Frouzakis, C. Lattice Boltzmann model for the simulation of multicomponent mixtures. Phys. Rev. E 2007, 76, 046703. [Google Scholar] [CrossRef] [PubMed]
  74. Asinari, P. Viscous coupling based lattice Boltzmann model for binary mixtures. Phys. Fluids 2005, 17, 067102. [Google Scholar] [CrossRef]
  75. Asinari, P. Multiple-relaxation-time lattice Boltzmann scheme for homogeneous mixture flows with external force. Phys. Rev. E 2008, 77, 056706. [Google Scholar] [CrossRef]
  76. Guo, Z.; Asinari, P.; Zheng, C. Lattice Boltzmann equation for microscale gas flows of binary mixtures. Phys. Rev. E 2009, 79, 026702. [Google Scholar] [CrossRef]
  77. Wang, L.; Xu, Z.; Guo, Z. Lattice Boltzmann simulation of separation phenomenon in a binary gaseous flow through a microchannel. J. Appl. Phys. 2016, 120, 134306. [Google Scholar] [CrossRef]
  78. Ho, M.; Ammar, S.; Leclaire, S.; Reggio, M.; Trépanier, J.Y. Lattice Boltzmann Modeling of Miscible Multicomponent Gas Mixtures in the Rarefied Regime. Commun. Comput. Phys. 2022, 32, 1179–1216. [Google Scholar]
  79. Kerkhof, P.J.; Geboers, M.A. Toward a unified theory of isotropic molecular transport phenomena. AIChE J. 2005, 51, 79–121. [Google Scholar] [CrossRef]
  80. Vienne, L.; Marié, S.; Grasso, F. Lattice Boltzmann method for miscible gases: A forcing-term approach. Phys. Rev. E 2019, 100, 023309. [Google Scholar] [CrossRef] [PubMed]
  81. Yu, H.; Chen, J.; Zhu, Y.; Wang, F.; Wu, H. Multiscale transport mechanism of shale gas in micro/nano-pores. Int. J. Heat Mass Transf. 2017, 111, 1172–1180. [Google Scholar] [CrossRef]
  82. Chen, L.; Kang, Q.; Pawar, R.; He, Y.L.; Tao, W.Q. Pore-scale prediction of transport properties in reconstructed nanostructures of organic matter in shales. Fuel 2015, 158, 650–658. [Google Scholar] [CrossRef]
  83. Engel, T.; Reid, P.J. Thermodynamics, Statistical Thermodynamics, and Kinetics; Prentice Hall: Upper Saddle River, NJ, USA, 2010. [Google Scholar]
  84. Dongari, N.; Sharma, A.; Durst, F. Pressure-driven diffusive gas flows in micro-channels: From the Knudsen to the continuum regimes. Microfluid. Nanofluid. 2009, 6, 679–692. [Google Scholar] [CrossRef]
  85. Tucny, J.M.; Leclaire, S.; Vidal, D.; Bertrand, F. Computation of effective viscosities for rarefied gas flows using Ray-tracing. Int. J. Appl. Comput. Math. 2023, 9, 110. [Google Scholar] [CrossRef]
  86. Tucny, J.M. Modélisation des écoulements de gaz raréfiés au travers de filtres fibreux par la méthode de Boltzmann sur réseau. Ph.D. Thesis, Polytechnique Montréal, Montreal, QC, Canada, 2020. [Google Scholar]
  87. Leclaire, S.; Parmigiani, A.; Malaspinas, O.; Chopard, B.; Latt, J. Generalized three-dimensional lattice Boltzmann color-gradient method for immiscible two-phase pore-scale imbibition and drainage in porous media. Phys. Rev. E 2017, 95, 033306. [Google Scholar] [CrossRef] [PubMed]
  88. Guo, Z.; Shu, C. Lattice Boltzmann Method and Its Application in Engineering; World Scientific: Singapore, 2013; Volume 3. [Google Scholar]
  89. Ammar, S.; Pernaudat, G.; Trépanier, J.Y. A multiphase three-dimensional multi-relaxation time (MRT) lattice Boltzmann model with surface tension adjustment. J. Comput. Phys. 2017, 343, 73–91. [Google Scholar] [CrossRef]
  90. d’Humières, D. Multiple–relaxation–time lattice Boltzmann models in three dimensions. Philos. Trans. R. Soc. Lond. Ser. A Math. Phys. Eng. Sci. 2002, 360, 437–451. [Google Scholar] [CrossRef]
  91. Yu, H.; Luo, L.S.; Girimaji, S.S. LES of turbulent square jet flow using an MRT lattice Boltzmann model. Comput. Fluids 2006, 35, 957–965. [Google Scholar] [CrossRef]
  92. Guo, Z.; Zheng, C.; Shi, B. Discrete lattice effects on the forcing term in the lattice Boltzmann method. Phys. Rev. E 2002, 65, 046308. [Google Scholar] [CrossRef]
  93. Leclaire, S.; El-Hachem, M.; Trépanier, J.Y.; Reggio, M. High order spatial generalization of 2D and 3D isotropic discrete gradient operators with fast evaluation on GPUs. J. Sci. Comput. 2014, 59, 545–573. [Google Scholar] [CrossRef]
  94. Hirschfelder, J.O.; Curtiss, C.F.; Bird, R.B. Molecular Theory of Gases and Liquids; Wiley: New York, NY, USA, 1964. [Google Scholar]
  95. Vienne, L. Simulation of Multi-Component Flows by the Lattice Boltzmann Method and Application to the Viscous Fingering Instability. Ph.D. Thesis, Conservatoire National des Arts et Metiers-CNAM, Paris, France, 2019. [Google Scholar]
  96. Stops, D. The mean free path of gas molecules in the transition regime. J. Phys. D Appl. Phys. 1970, 3, 685. [Google Scholar] [CrossRef]
  97. Dongari, N.; Zhang, Y.; Reese, J.M. Molecular free path distribution in rarefied gases. J. Phys. D Appl. Phys. 2011, 44, 125502. [Google Scholar] [CrossRef]
  98. Guo, Z.; Shi, B.; Zheng, C.G. An extended Navier-Stokes formulation for gas flows in the Knudsen layer near a wall. EPL (Europhys. Lett.) 2007, 80, 24001. [Google Scholar] [CrossRef]
  99. Abramov, R.V. Gas near a wall: Shortened mean free path, reduced viscosity, and the manifestation of the Knudsen layer in the Navier–Stokes solution of a shear flow. J. Nonlinear Sci. 2018, 28, 833–845. [Google Scholar] [CrossRef]
  100. Guo, Z.; Zheng, C. Analysis of lattice Boltzmann equation for microscale gas flows: Relaxation times, boundary conditions and the Knudsen layer. Int. J. Comput. Fluid Dyn. 2008, 22, 465–473. [Google Scholar] [CrossRef]
  101. Ivchenko, I.; Loyalka, S.; Tompson, R. Slip coefficients for binary gas mixtures. J. Vac. Sci. Technol. A Vacuum Surfaces Film. 1997, 15, 2375–2381. [Google Scholar] [CrossRef]
  102. Chapman, S.; Cowling, T.G. The Mathematical Theory of Non-Uniform Gases: An Account of the Kinetic Theory of Viscosity, Thermal Conduction and Diffusion in Gases; Cambridge University Press: Cambridge, UK, 1990. [Google Scholar]
  103. Zou, Q.; He, X. On pressure and velocity boundary conditions for the lattice Boltzmann BGK model. Phys. Fluids 1997, 9, 1591–1598. [Google Scholar] [CrossRef]
  104. Latt, J.; Chopard, B. Lattice Boltzmann method with regularized pre-collision distribution functions. Math. Comput. Simul. 2006, 72, 165–168. [Google Scholar] [CrossRef]
  105. Pitakarnnop, J.; Varoutis, S.; Valougeorgis, D.; Geoffroy, S.; Baldas, L.; Colin, S. A novel experimental setup for gas microflows. Microfluid. Nanofluid. 2010, 8, 57–72. [Google Scholar] [CrossRef]
  106. Szalmas, L.; Colin, S.; Valougeorgis, D. Flow rate measurements of binary gas mixtures through long trapezoidal microchannels. In Proceedings of the Journal of Physics: Conference Series; IOP Publishing: Bristol, UK, 2012; Volume 362, p. 012003. [Google Scholar]
  107. Jeong, N.; Choi, D.H.; Lin, C.L. Prediction of Darcy–Forchheimer drag for micro-porous structures of complex geometry using the lattice Boltzmann method. J. Micromech. Microeng. 2006, 16, 2240. [Google Scholar] [CrossRef]
  108. Yang, G.; Weigand, B. Investigation of the Klinkenberg effect in a micro/nanoporous medium by direct simulation Monte Carlo method. Phys. Rev. Fluids 2018, 3, 044201. [Google Scholar] [CrossRef]
  109. Valougeorgis, D.; Vargas, M.; Naris, S. Analysis of gas separation, conductance and equivalent single gas approach for binary gas mixture flow expansion through tubes of various lengths into vacuum. Vacuum 2016, 128, 1–8. [Google Scholar] [CrossRef]
  110. Szalmas, L.; Pitakarnnop, J.; Geoffroy, S.; Colin, S.; Valougeorgis, D. Comparative study between computational and experimental results for binary rarefied gas flows through long microchannels. Microfluid. Nanofluid. 2010, 9, 1103–1114. [Google Scholar] [CrossRef]
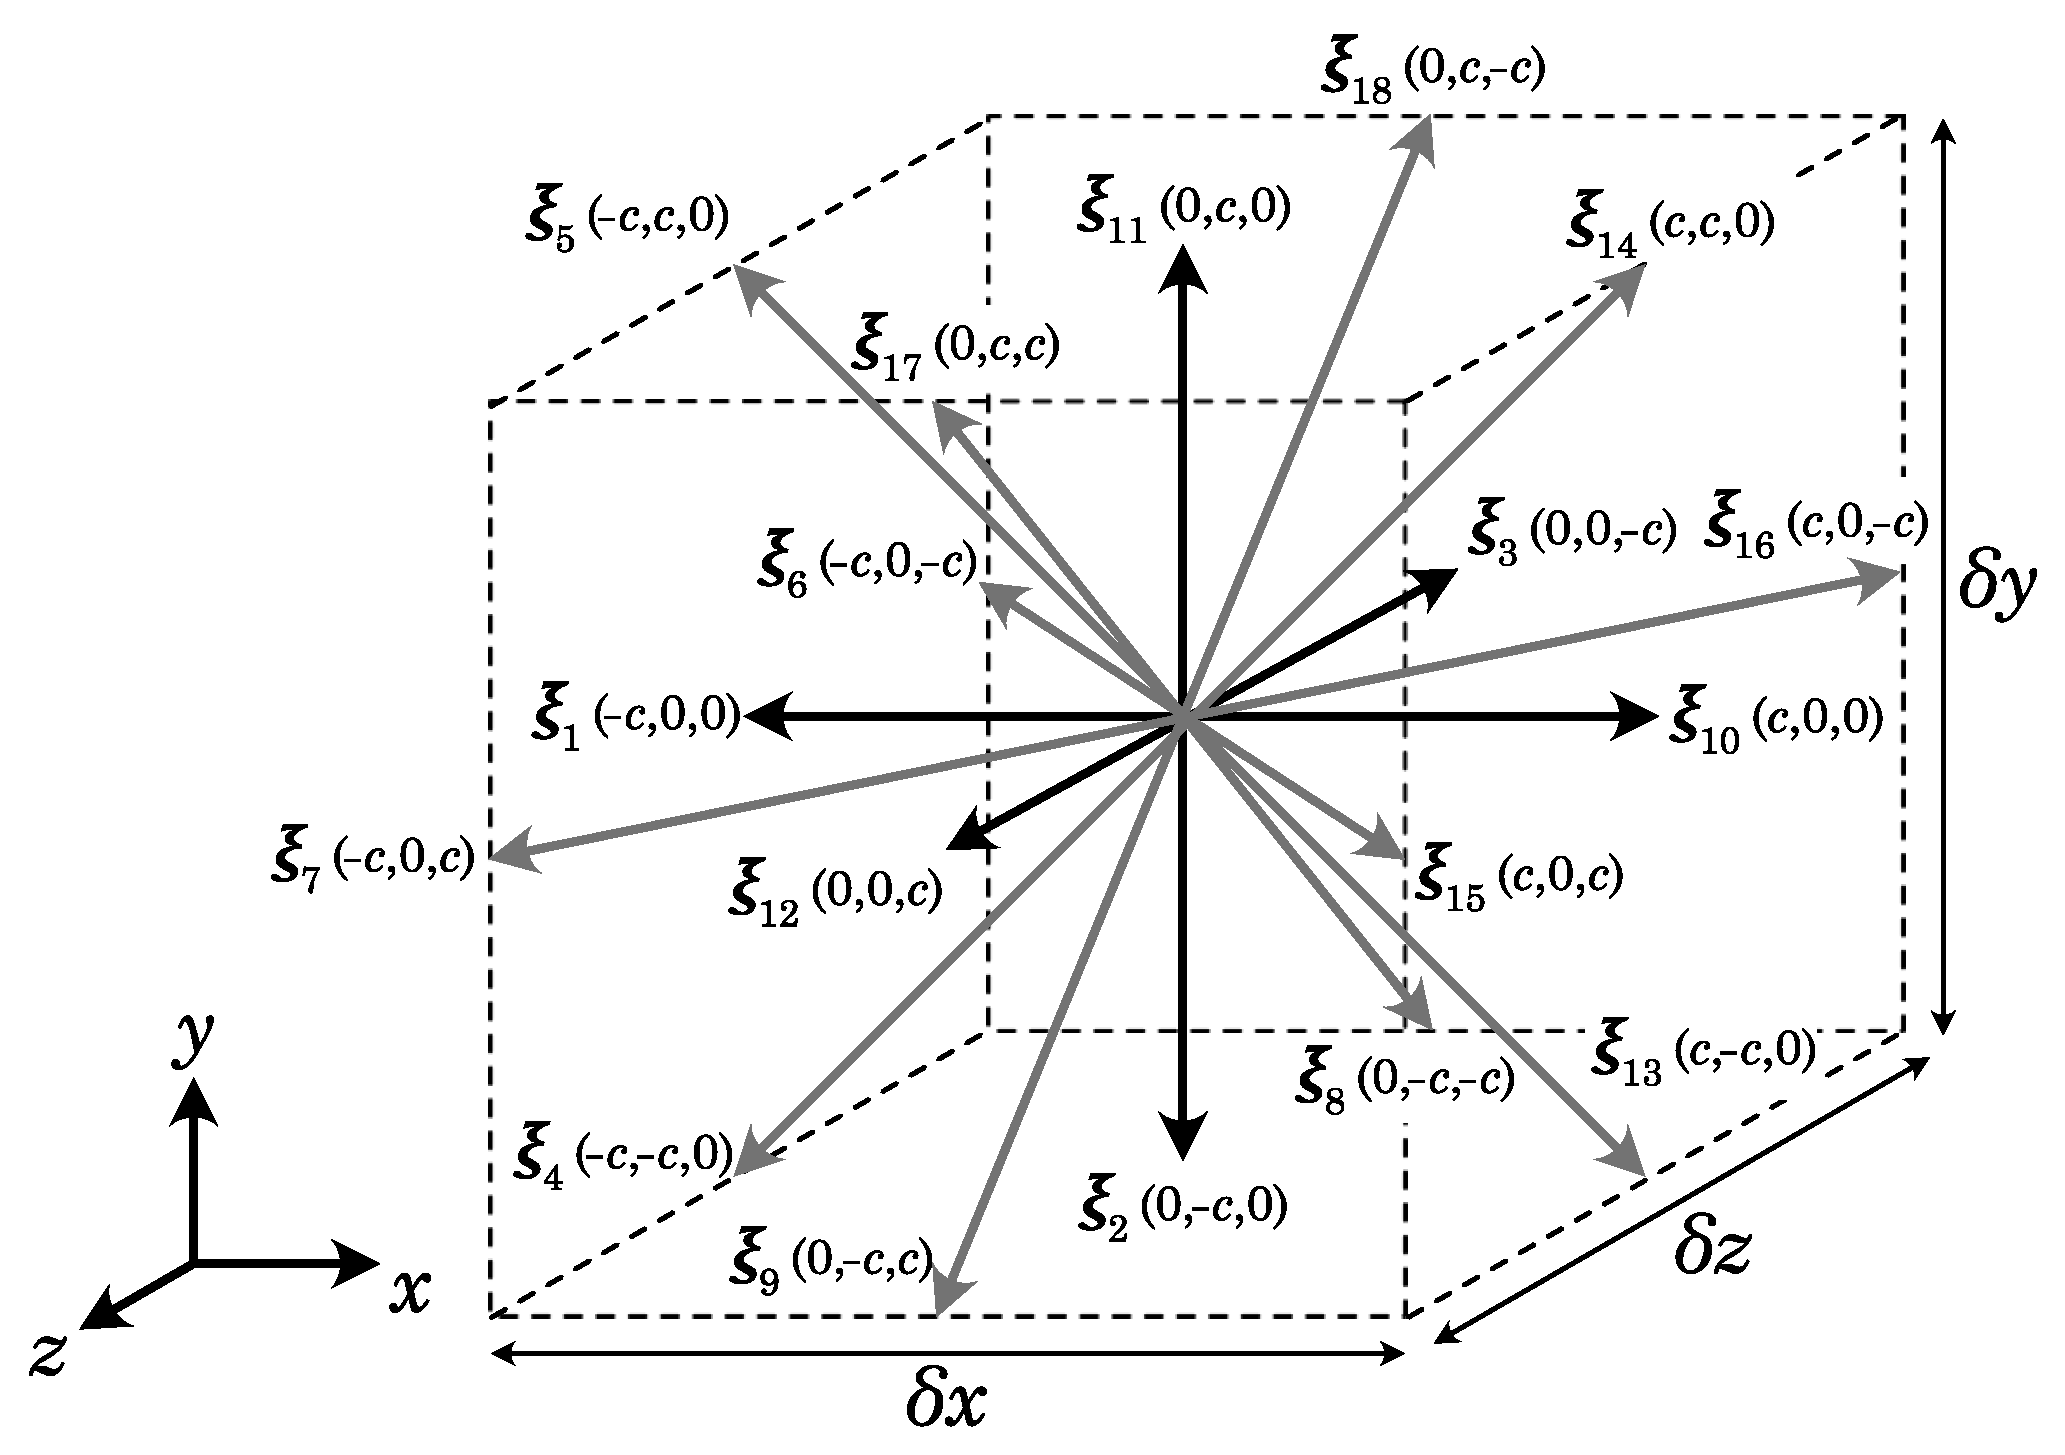
Figure 1. D3Q19 discretization scheme.
Fluids 09 00237 g001
Figure 2. Scheme of the CBBSR boundary condition for arbitrary geometries. Dark gray color accounts for solid nodes, light gray color accounts for fluid boundary nodes, white color accounts for fluid nodes in the bulk domain.
Fluids 09 00237 g002
Figure 3. Normalized axial velocity of He and Ar of an equimolar He-Ar mixture in a cylindrical microchannel at Kn mix = 0.1 . The analytical solution is extracted from Kerkhof et al. [59].
Fluids 09 00237 g003
Figure 4. Velocity L2-norm relative error of He and Ar of an equimolar He-Ar mixture in a cylindrical microchannel at Kn mix = 0.1 .
Fluids 09 00237 g004
Figure 5. Mass flow rates of an equimolar He-Ar mixture against the pressure ratio at an outlet pressure of 15 kPa in a trapezoidal cross-section microchannel. Experimental results are extracted from Szalmas et al. [106].
Fluids 09 00237 g005
Figure 6. Mass flow rates of an equimolar He-Ar mixture against the pressure ratio at an outlet pressure of 8 kPa in a trapezoidal cross-section microchannel. Experimental results are extracted from Szalmas et al. [106].
Fluids 09 00237 g006
Figure 7. Mass flow rates of an equimolar He-Ar mixture against the pressure ratio at an outlet pressure of 15 kPa in a rectangular cross-section microchannel. Experimental results are extracted from Pitakarnnop et al. [105].
Fluids 09 00237 g007
Figure 8. Mass flow rates of an equimolar He-Ar mixture against the pressure ratio at an outlet pressure of 2 kPa in a rectangular cross-section microchannel. Experimental results are extracted from Pitakarnnop et al. [105].
Fluids 09 00237 g008
Figure 9. Microporous geometry.
Fluids 09 00237 g009
Figure 10. Normalized intrinsic permeability against porosity for different mesh sizes for the 3D staggered sphere geometry. The 3D correlation is taken from Jeong et al. [107].
Fluids 09 00237 g010
Figure 11. Mixture permeability enhancement factor for the He-Ar mixture against Kn mix at different porosities.
Fluids 09 00237 g011
Figure 12. Species permeability ratio for the He-Ar mixture against Kn mix at different porosities.
Fluids 09 00237 g012
Figure 13. Mixture permeability enhancement factor at ϵ = 0.7 against Kn mix for equimolar binary gaseous mixtures of different molecular masses.
Fluids 09 00237 g013
Figure 14. Species permeability ratio at ϵ = 0.7 against Kn mix for equimolar binary gaseous mixtures of different molecular masses.
Fluids 09 00237 g014
Figure 15. Mixture permeability enhancement factor f c at ϵ = 0.7 against Kn pure He for equimolar binary gaseous mixtures of different molecular masses.
Fluids 09 00237 g015
Figure 16. Species permeability ratio at ϵ = 0.7 against Kn pure He for equimolar binary gaseous mixtures of different molecular masses.
Fluids 09 00237 g016
Table 1. Molecular characteristics of the gaseous mixtures from the hard-sphere model [102].
PropertyUnitHeNeArKrXe
Mass[g/mol]4.00320.1839.9483.80131.3
Diameter 10 10 × [m]2.7452.6023.6594.1994.939
Table 2. Dimensions and domain discretizations for rectangular [105] and trapezoidal [106] cross-section microchannels.
Cross-Section SchemePhysicalLBM Discretization
Parameters n x × n y × n z
Fluids 09 00237 i001 H = 1.88 μ m 800 × 224 × 20
W = 21.2 μ m
Fluids 09 00237 i002 H = 1.90 μ m 800 × 21 × 55
B = 5.38 μ m
b = 2.69 μ m
β = 54.74 o
Disclaimer/Publisher’s Note: The statements, opinions and data contained in all publications are solely those of the individual author(s) and contributor(s) and not of MDPI and/or the editor(s). MDPI and/or the editor(s) disclaim responsibility for any injury to people or property resulting from any ideas, methods, instructions or products referred to in the content.