1. Introduction
Mathematical models for thin domains describe many real-world applications in science and engineering. In biological applications, simulation of blood and fluid flow in vessels can be described by fluid and transport problems in thin domains [
1,
2,
3]. Flow simulation can study fluid flow in complex pipe structures, such as pipe-wise industrial installations, wells in the oil and gas industry, heat exchanges, etc. In reservoir simulations, thin domains are related to channels and fractures. Fractures have complex geometries with relatively small thicknesses compared to typical reservoir sizes [
4,
5,
6]. Moreover, a comparatively small domain thickness provides significant complexity in grid construction, rendering classical numerical methods less practical.
To employ these classical numerical methods, such as the finite difference methods [
7,
8,
9], finite volume methods [
10,
11], finite element methods [
12,
13,
14], and mixed finite element methods [
15,
16], to simulate such problems, an extremely fine grid needs to be constructed to resolve the complex geometry structure at the grid level. This approach is usually computationally expensive because the discretization leads to a large discrete problem with several unknowns. In the process of addressing computational inefficiency, much research work has been done on the development of robust numerical methods. See, for example, the survey articles [
17,
18,
19] and the references for the various types of numerical methods. Generally, two main procedures—namely, the use of parallel computing and the application of model-order-reduction techniques—are known. In parallel computing, multiple processors are used to concurrently execute numerous smaller computations that are derived from larger, intricate problems, as employed in, for instance, the research articles [
20,
21,
22], while multiscale model-order techniques lower the size of the model to reduce the computational domain [
23,
24,
25,
26,
27,
28,
29,
30]. The latter is employed in this paper.
Model reduction techniques usually depend on a coarse-grid approximation, which can be obtained by discretizing the problem onto a coarse grid and choosing a suitable coarse-grid formulation of the problem, which we implement here. One of the widely used ways is based on the numerical homogenization technique, whereby effective parameters are calculated in order to construct coarse-grid approximations [
31,
32]. Generally, these calculations are based on fine-grid results and are carefully done to mimic the fine-grid properties. Depending on the size of the area used in the calculations, upscaling techniques can be classified into local, extended local, and global approaches [
25]. The local approach calculates effective parameters over specific coarse block areas. In the global approach, the global solution is used to calculate the effective parameters for the upscaled model to incorporate time–space variation and take into account nonlinearity. Apart from the target coarse block areas, neighboring regions are also used in the calculations for the extended local approach to obtain more accurate results. All these approaches have advantages and disadvantages [
25,
33,
34,
35]. In the local upscaling method, coarse-grid parameters are obtained independently of global solution information, leading to a computationally efficient approach. More accurate calculations should be based on information about the fine-scale solution and will lead to the global approach. For example, we can involve iterations between the global coarse-grid model and local fine-grid calculations to update the macroscale parameters [
25]. This approach requires more computations than existing classic upscaling techniques, and some types of machine learning can be used to construct computationally efficient algorithms [
36].
Several multiscale methods have been developed to obtain the coarse-grid formulation for the problems in heterogeneous domains, including multiscale finite element methods [
26,
30], mixed multiscale finite element methods [
24], generalized multiscale finite element methods [
27], multiscale mortar mixed finite element methods [
28], multiscale finite volume methods [
37,
38], variational multiscale methods [
39], and heterogeneous multiscale methods [
40]. In [
41], we proposed the Generalized Multiscale Finite Element Method (GMsFEM) to solve problems in perforated domains. We developed a multiscale procedure to identify multiscale basis functions in each coarse block using a snapshot space and local spectral problems. We apply our general concept to the Laplace, elasticity, and Stokes equations in perforated domains. The construction of a multiscale method for transport and flow processes in perforated domains is considered in [
42], wherein we use the Mixed GMsFEM. In [
43,
44], we proposed the discontinuous Galerkin GMsFEM to solve the Laplace, elasticity, and Stokes equations.
In this work, we consider the numerical homogenization method, whereby averages of the effective properties of the materials are calculated and then used to approximate the solution on a coarse grid. This approach, although a model reduction technique, is different from the multiscale methods wherein multiscale basis functions are employed to extract information of the domain at the micro-level and then to bridge the information between the micro and macro scales [
45,
46]. We want to emphasize that this work seeks to contribute to the literature for robust numerical solutions for problems in the thin domain and is quite different from our previous works [
45,
46]. However, the idea of model reduction techniques was proposed to solve problems in thin domains.
In [
45], the proposed model-order-reduction technique was based on the Discontinuous Galerkin Generalized Multiscale Finite Element Method (DG-GMsGEM). It was used to solve unsteady-state Stokes flow and transport problems in thin domains with reactive boundaries. A snapshot space for each interface between coarse-grid cells was constructed to capture possible flows. To reduce the snapshot space size, dimension reduction was performed using the local spectral problem with the corresponding eigenvectors of the smallest eigenvalues for the approximation on the coarse grid. For the transport problem, a multiscale basis function for each interface between coarse-grid cells was constructed, and additional basis functions were also presented to capture non-homogeneous boundary conditions on walls. Subsequently, in our work [
46], the Mixed Generalized Multiscale Finite Element Method based on multiscale basis functions for velocity fields was proposed to lower the dimension of an elliptic problem in a thin domain. To obtain the multiscale approximation, snapshot spaces were constructed for each interface between coarse-grid cells, and a local spectral problem was solved to identify the dominant modes in the snapshot space. The results obtained from the numerical experiment displayed good applicability of the proposed scheme, and we noted that the scheme allows the description of heterogeneities of the domain on the micro-level with high accuracy.
Motivated by our previous works [
45,
46], where multiscale finite element methods were developed to upscale an elliptic and unsteady state Stokes flow and transport problems in thin domains with reactive boundaries, we aim to investigate the steady-state Stokes flow and transport problems in thin domains. Additionally, motivated by [
36,
47,
48], we present numerical upscaling based on the finite volume approximation on the coarse grid. Finite volume averaging is flexible, applicable under general conditions, and can produce accurate approximations to direct numerical simulation. Similarly to the multiscale finite volume method, numerical upscaling can consider the specific structure of the thin domain and construct an accurate macroscale characterization of the flow. In this paper, we aim to reduce the regular model with fully resolved geometry to a one-dimensional model. Thus, we propose a numerical averaging technique based on the finite volume method to construct the discrete problems on a coarse grid to lower the dimensions of both the flow and transport problems. Numerical simulations are conducted for three test geometries. In each instance, the results obtained from the finite element approximation on a fine grid are used as our reference solution.
The rest of the paper is organized as follows;
Section 2 entails the problem formulation, which includes defining the domain, introducing the full-order model, and presenting the weak formulation of our finite element approximation. In
Section 3, we present the lower-dimensional model and discuss the numerical averaging of both the flow and the transport problems.
Section 4 presents the numerical simulations and discusses the results obtained, while the final section summarizes the paper.
4. Numerical Results
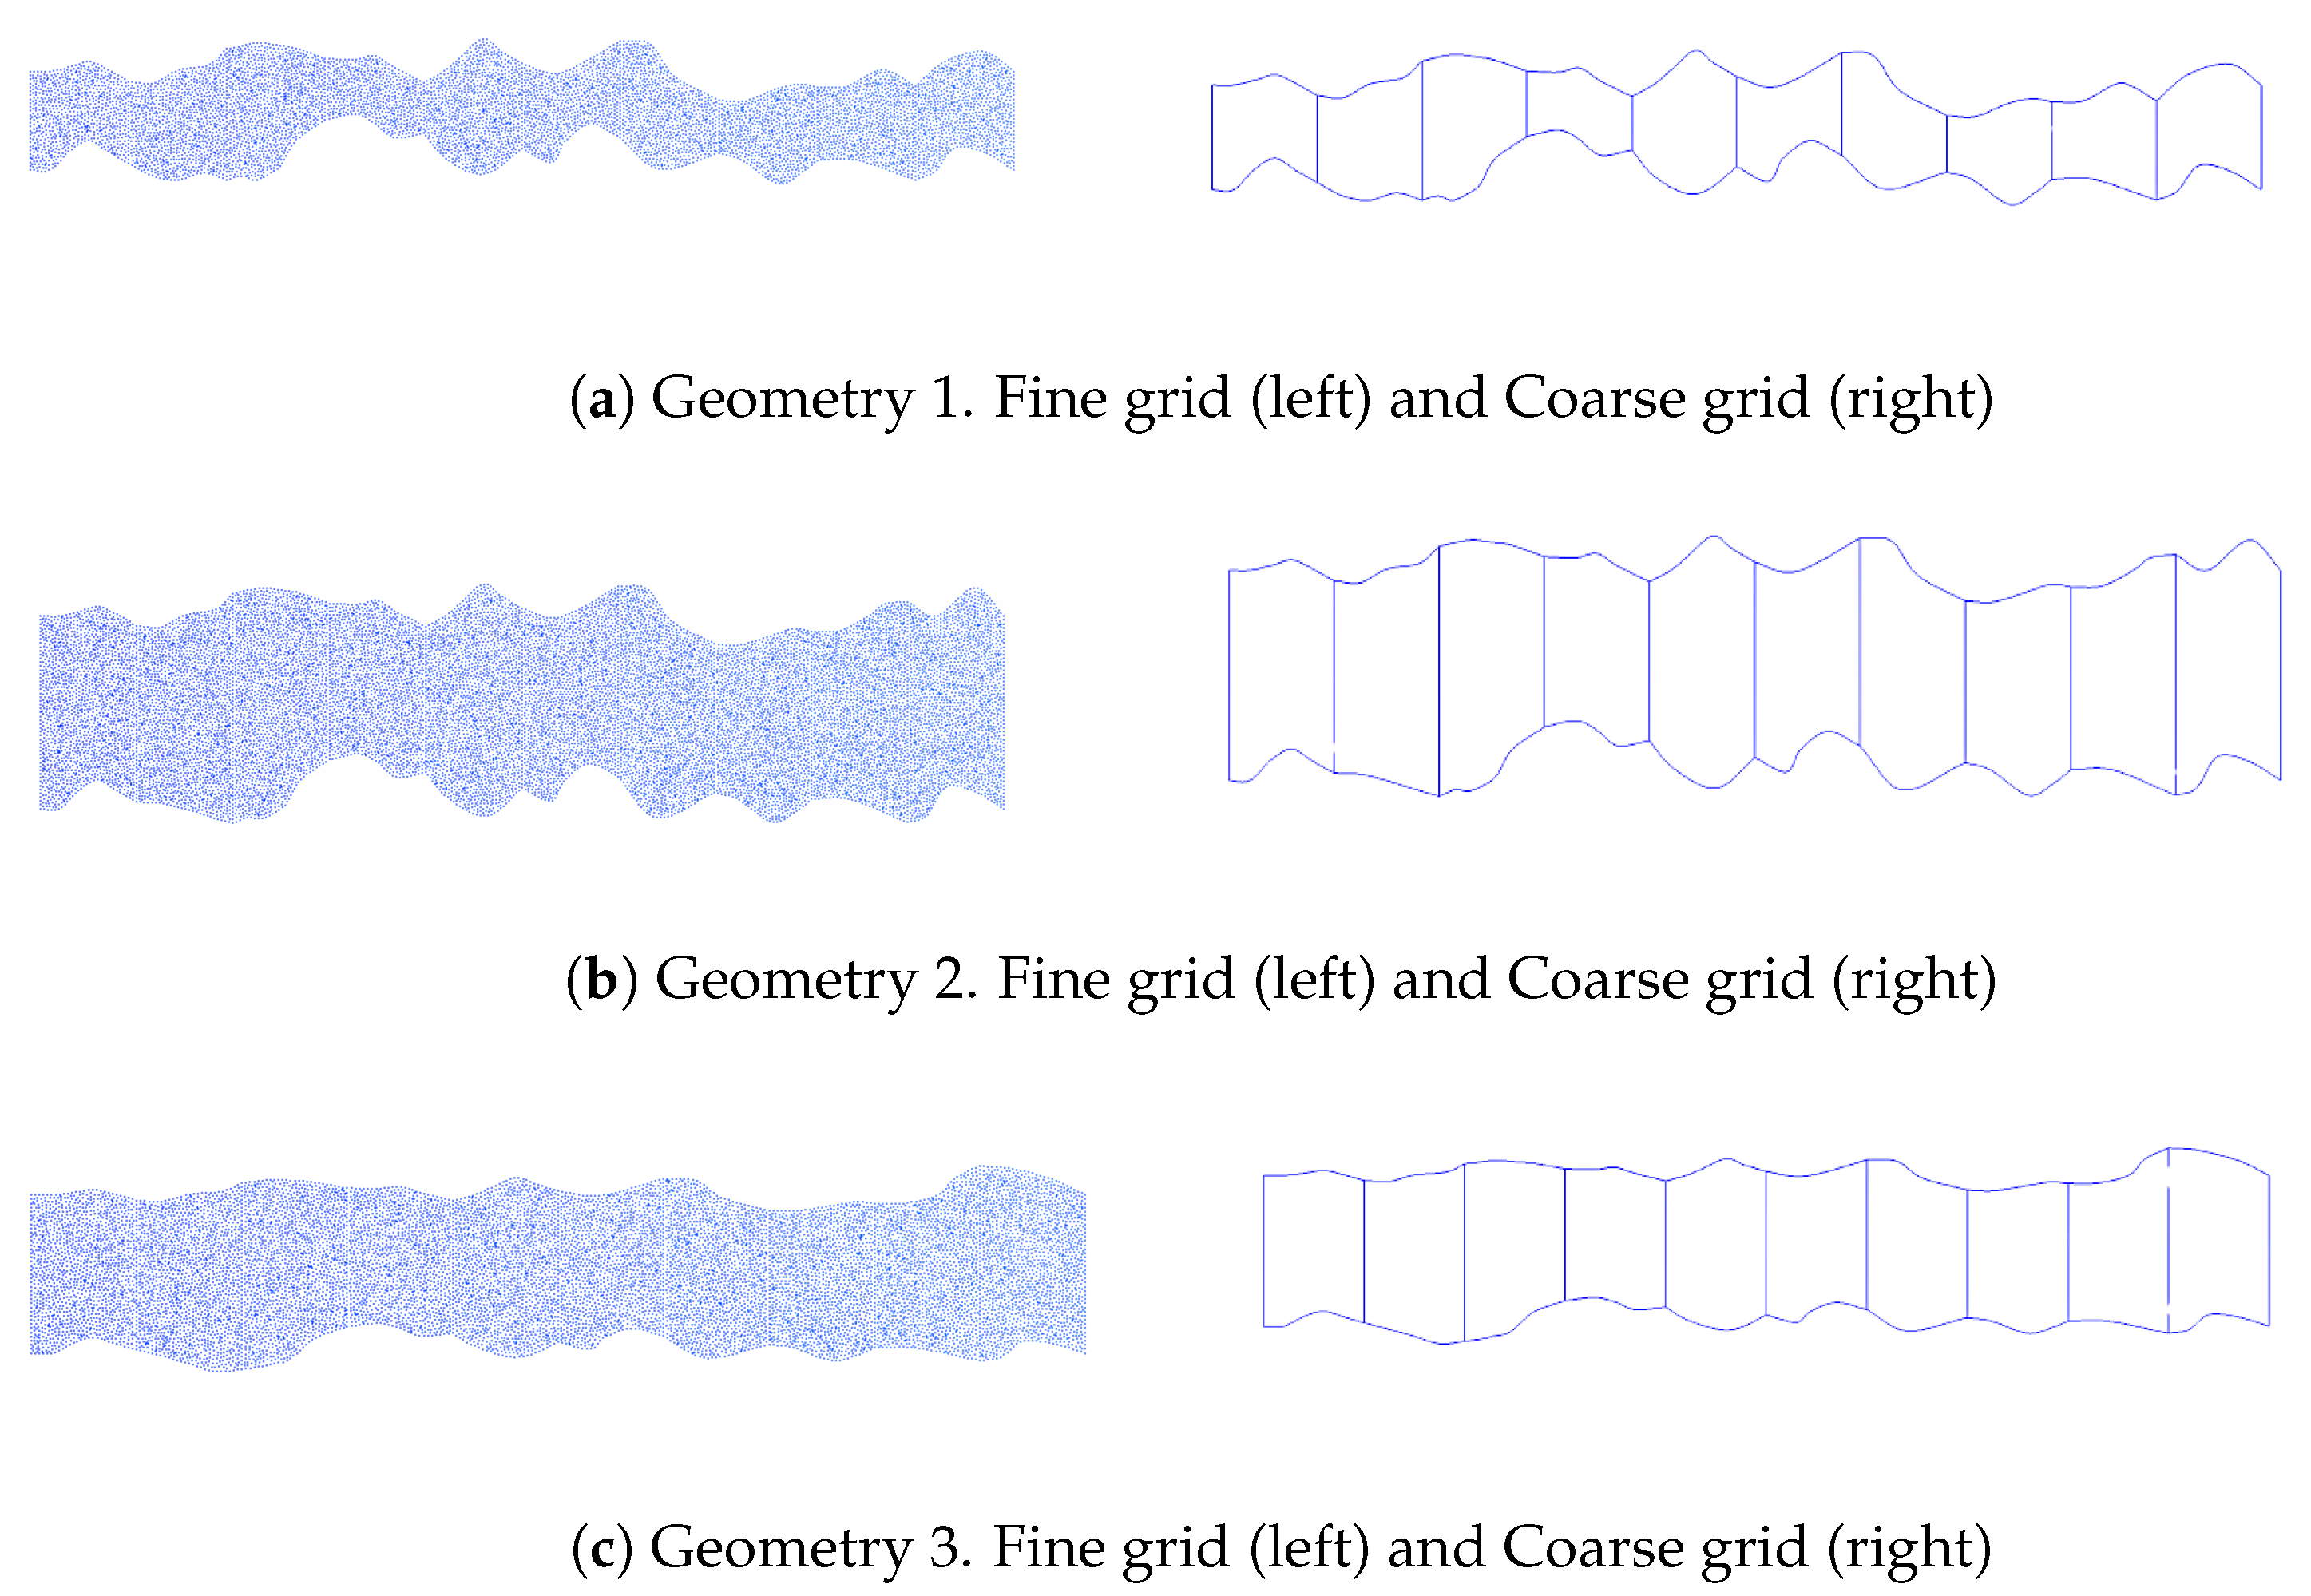
In this section, we present numerical results from simulations of lower-dimensional transport and flow models in a thin, rough-walled domain. The purpose of these simulations is to demonstrate the performance of the method presented in this paper. Numerical results were obtained from direct numerical simulations of the problems using three different geometries with full resolution. For each geometry, simulations were conducted using both the classical finite element method for the Stokes flow and transport problem on a fine-grid and the proposed upscaled one-dimensional scheme. The accuracy of the results obtained from the upscaled scheme was validated by calculating the errors between these results and those from the fine grid. Thus, throughout the simulations, the fine-grid solution serves as the reference solution for the upscaled solution, and the results in both scenarios are graphically displayed. Simulations were conducted for three different geometries, as displayed in
Figure 4. Geometries 1 and 2 exhibit rougher boundaries than Geometry 3, and Geometry 2 is a thicker version of Geometry 1. For each geometry, we simulated results for three physical quantities: velocity, pressure, and concentration. For the flow problem, we computed upscaled results for velocity and pressure, while for the transport problem, computations were performed for the concentration at different time levels for all geometries.
Concentration and pressure errors between fine-grid solutions and upscaled solutions were computed using the relative errors in the
norm:
respectively, across all geometries. Here,
are the upscaled solution and
are the average fine-grid solution for concentration and pressure, respectively. Additionally, we calculate the velocity error
where
is the upscaled velocity on the given coarse-grid interface
. Velocity and pressure errors are displayed in
Table 1. The concentration errors are computed at different time levels for the three diffusion coefficients. The results are displayed in tables and figures to determine the effects of using different geometries. All numerical simulations were conducted using open-source libraries, including FEniCS [
50], Gmsh [
51], and Paraview [
52].
The results for the Stokes flow problem for all geometries are presented in
Figure 5 and
Figure 6 for both the fine-grid and upscaled solutions.
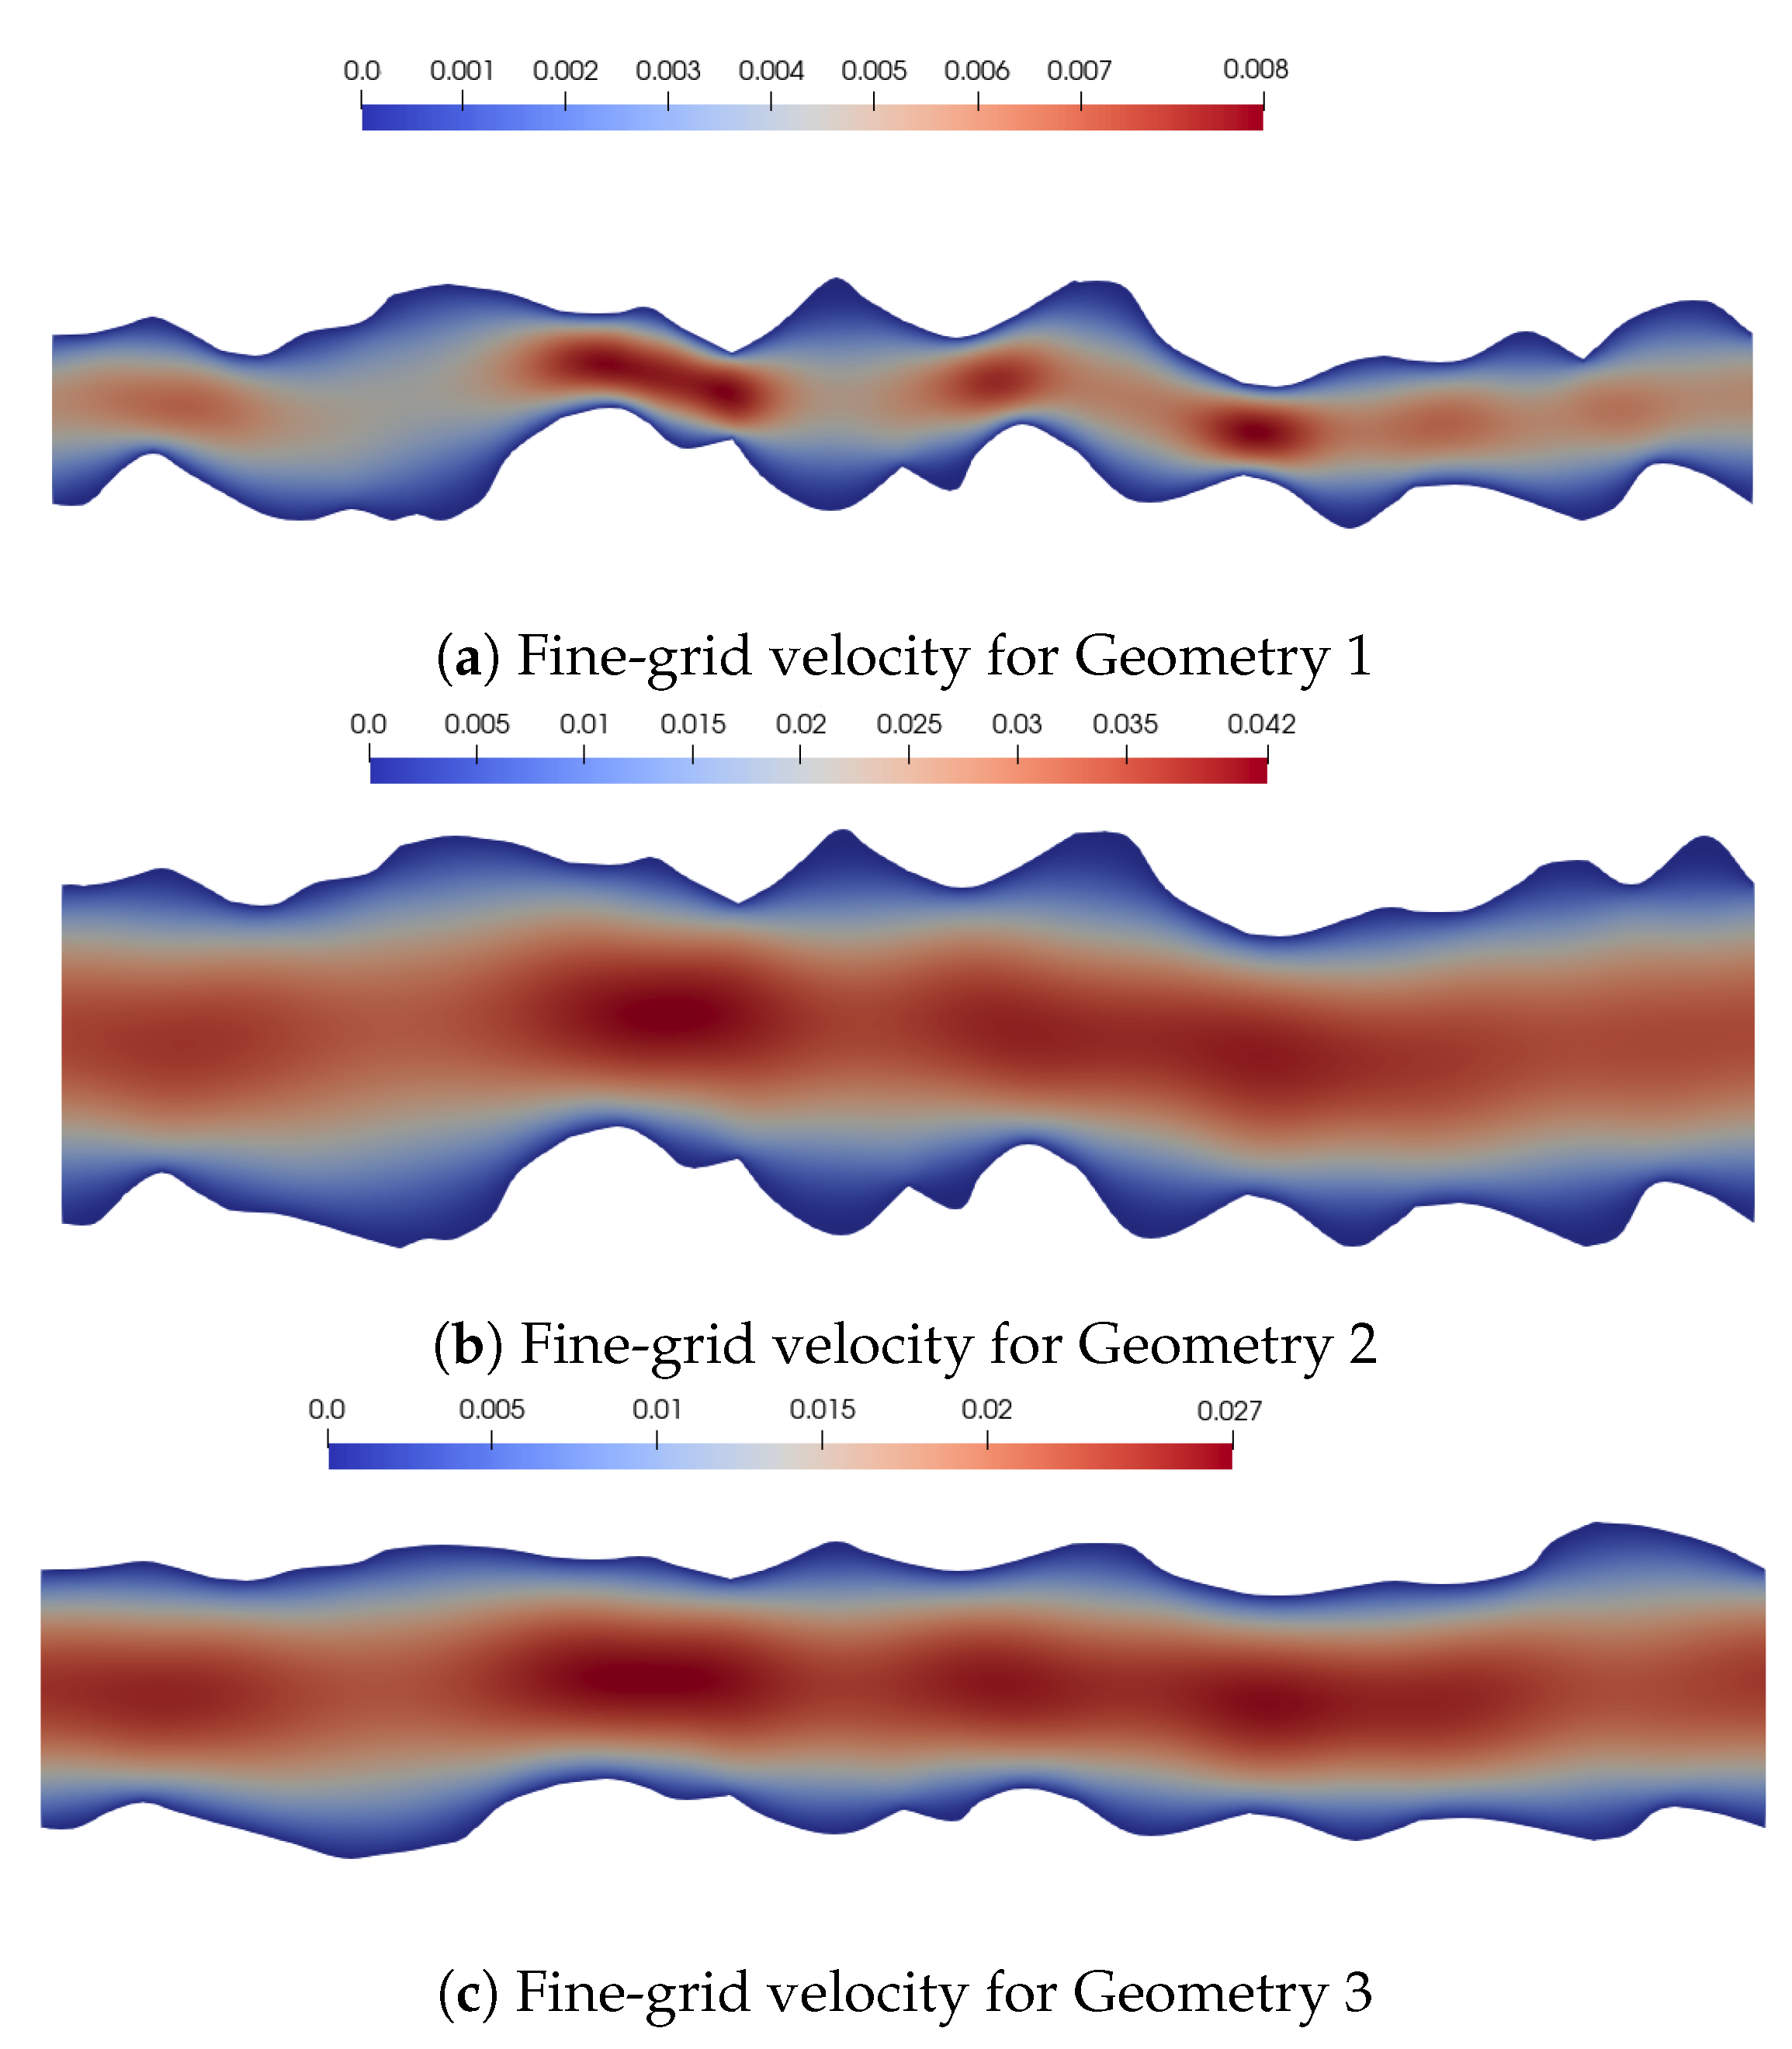
Figure 5 displays solutions of the velocity whilst
Figure 6 shows that of pressure. For Geometry 1,
Figure 5a depicts the fine-grid solution for velocity, and both the fine-grid and upscaled solutions for pressure are displayed in
Figure 5a. The fine-grid solution was achieved by constructing a two-dimensional grid consisting of 15,554 triangular cells and 8092 vertices, which can be observed on the left side of
Figure 4a. In contrast, a one-dimensional coarse grid comprising 10 cells, shown on the right in
Figure 4a, was employed to simulate the upscaled solution. For Geometry 2, the two-dimensional fine grid was composed of 32,594 triangular cells and 16,641 vertices, and a one-dimensional coarse grid with 10 cells was used to simulate the upscaled results. This can be observed in
Figure 4b, while their solutions can also be seen in
Figure 5b and
Figure 6b, respectively, for velocity and pressure. In addition, the results for the last domain, Geometry 3, are given in
Figure 5c for the fine-grid velocity and
Figure 6c for the fine-grid and upscaled solution for pressure. Here, 25,607 triangular cells and 13,109 vertices were employed for the two-dimensional mesh construction, and similarly to Geometries 1 and 2, a one-dimensional coarse grid with 10 cells was employed for the upscaled solution. These are displayed in
Figure 4c. This discretization approach enabled the fine grid to capture the complex geometry of our domain accurately. However, a significant amount of computational resources was required.
In our simulation of the flow problem, we set assumed no-flow boundary conditions at the top and bottom boundaries, and used the values for the initial velocity and , for the inflow boundary and outflow boundary conditions, respectively.
Upscaled velocity results exhibit high accuracy with minimal velocity error margins of
%,
%, and
% for Geometries 1, 2, and 3, respectively, with 10 cells. These results can also be confirmed through the corresponding entries in
Table 1. These results clearly show that Geometry 1 produced the highest errors, followed by Geometry 3 and then Geometry 2. However, the differences are not significant. Results for the upscaled model for pressure are highly accurate, with
%,
%, and
% pressure errors for Geometries 1, 2 and 3, respectively, which can also be observed from
Table 1. From
Table 1, we can see that simulations with Geometry 3 produced the smallest errors, followed by Geometry 2 and then Geometry 1. These results indicate that thinner geometries yield more significant errors, while larger geometries produce minor errors. However, despite Geometry 2 being more accurate than Geometry 3, the pressure error was greater than that of Geometry 3. This could be explained by the fact that the boundaries of Geometry 2 showed more roughness than that of Geometry 3, which could contribute to the error. Although Geometry 1 produced the highest error, its value is still small. Thus, the proposed upscaling technique demonstrates a strong match to the fine-grid model with high accuracy and significantly reduces the size of the discrete system.
To assess the effect of mesh resolution on the upscaled results, we consider simulations for a one-dimensional upscaled model with 5 cells in addition to those performed with 10 cells. Velocity errors of
%,
% and
% were obtained, and pressure errors of
%,
%, and
% were observed for Geometries 1, 2, and 3, respectively. These results are also presented in
Table 1, where velocity and pressure errors for
are tabulated. Errors obtained using 5 cells are higher than those found using 10 cells, indicating that a lower mesh resolution yields more errors than a higher mesh resolution. Furthermore, the influence of two different values of
and
was investigated to understand the impact on the results. Interestingly, our experiments revealed that values of both
and
produced the same errors as
, indicating that
does not affect the velocity and pressure errors.
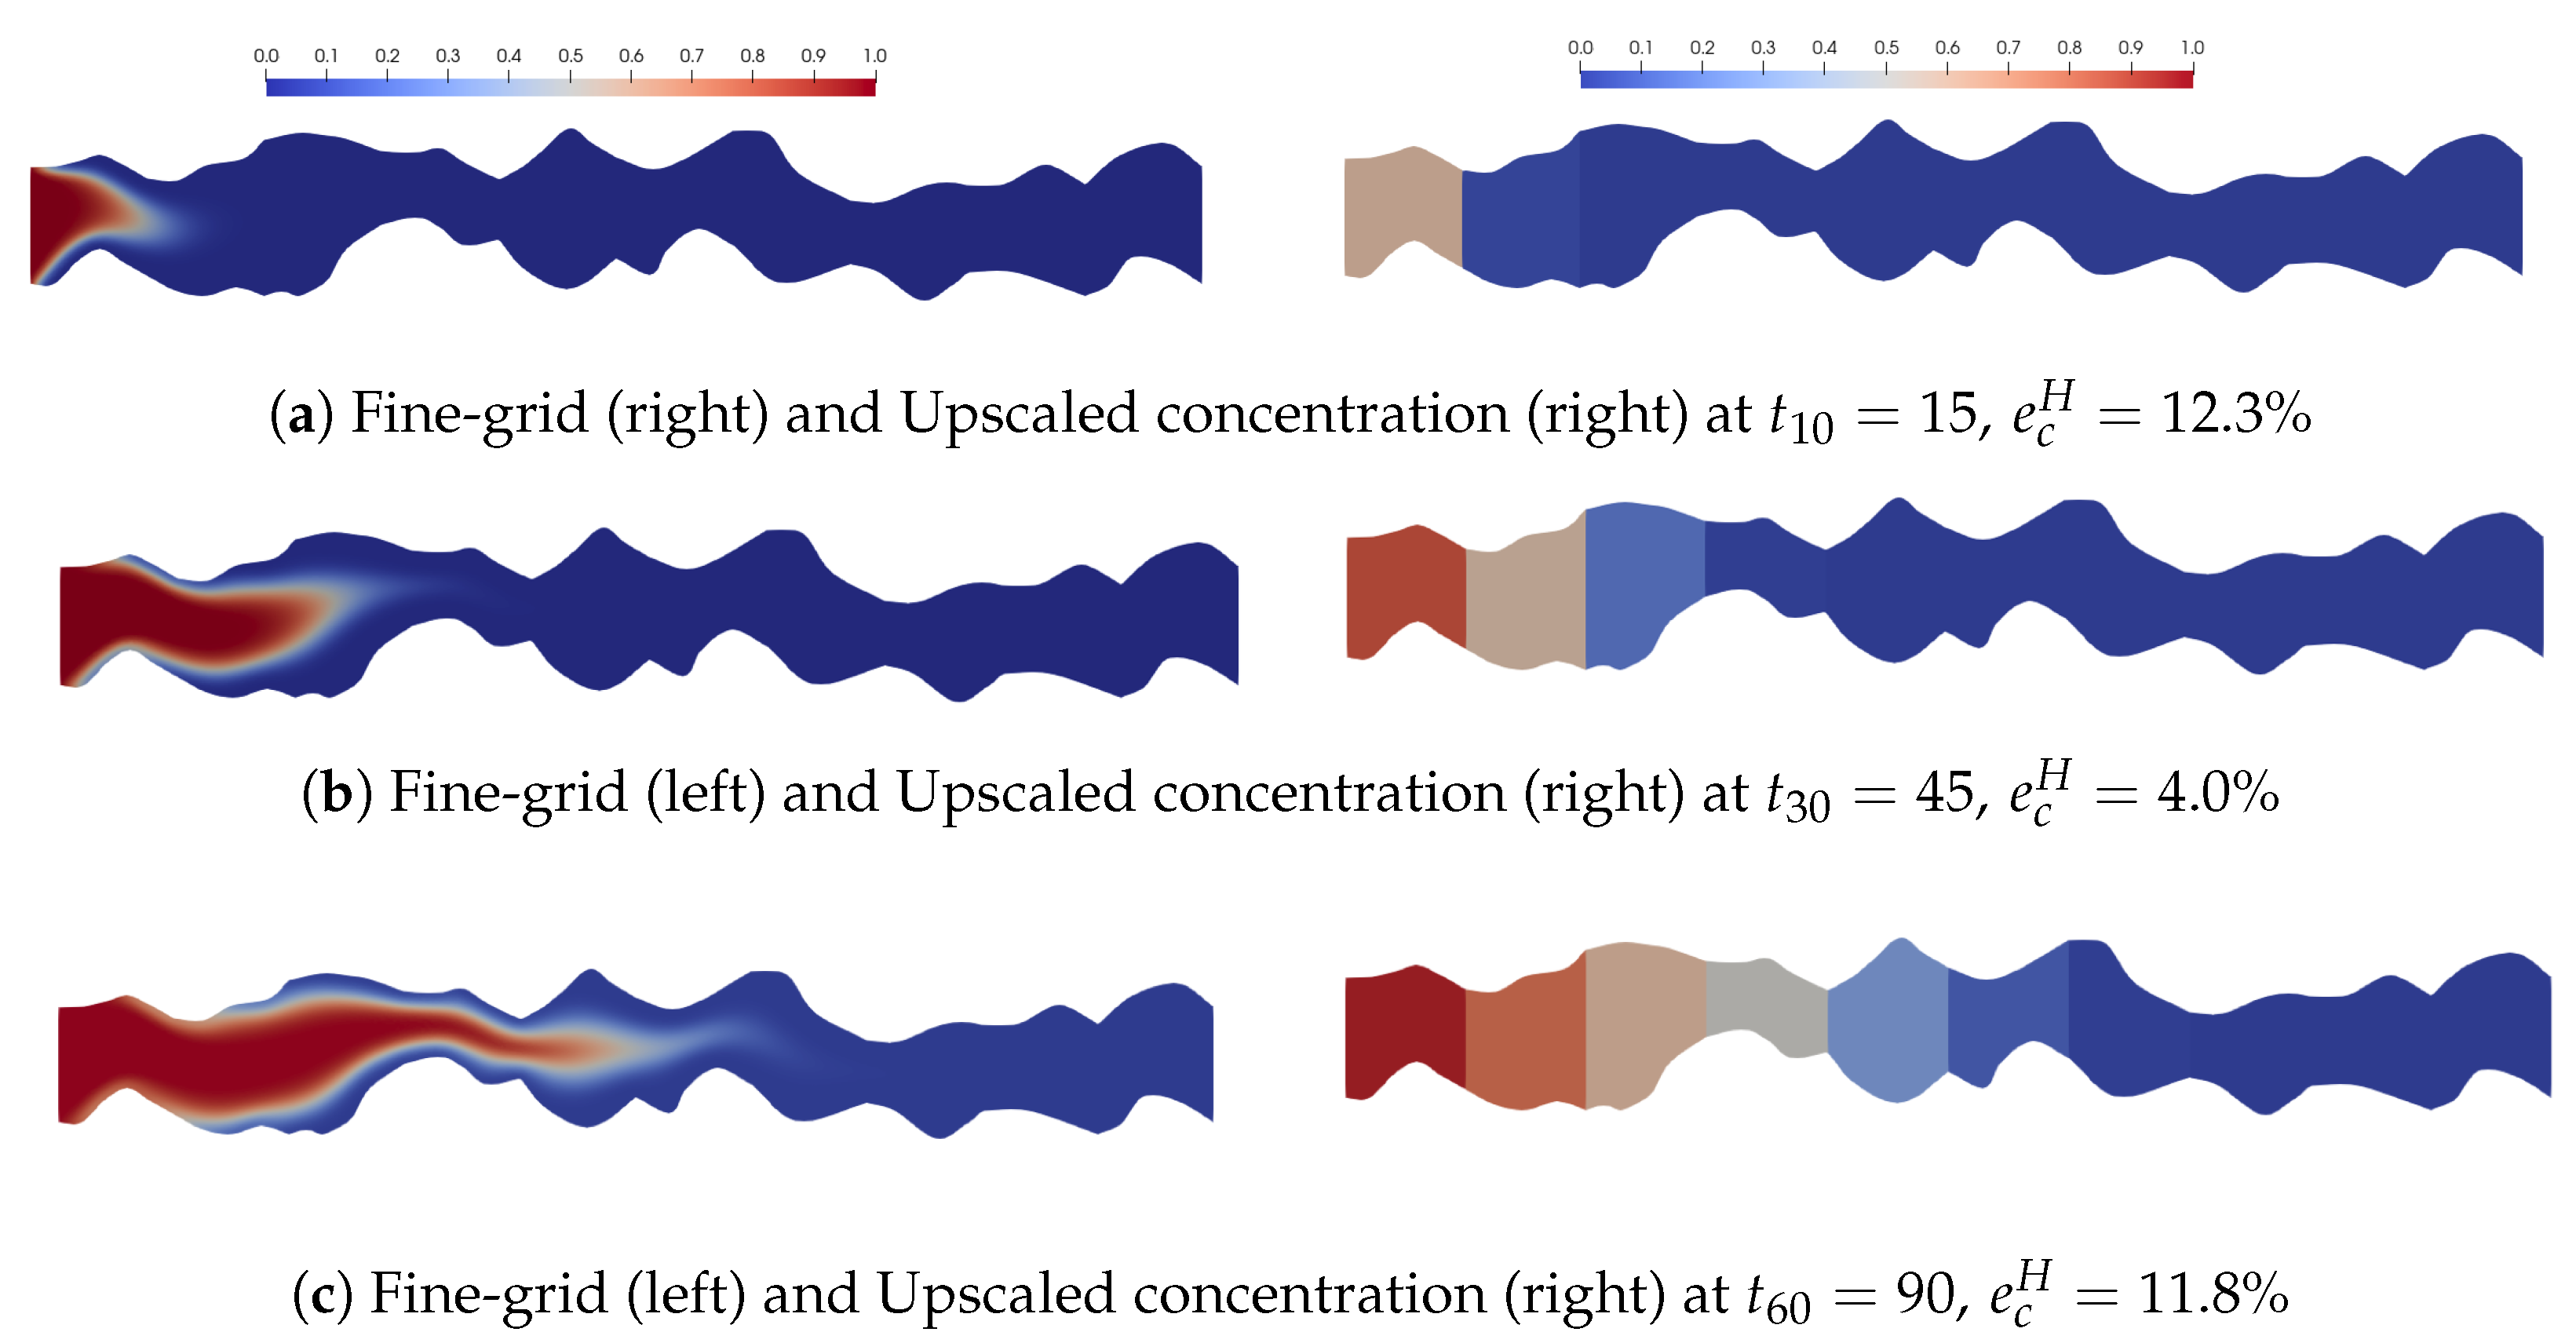
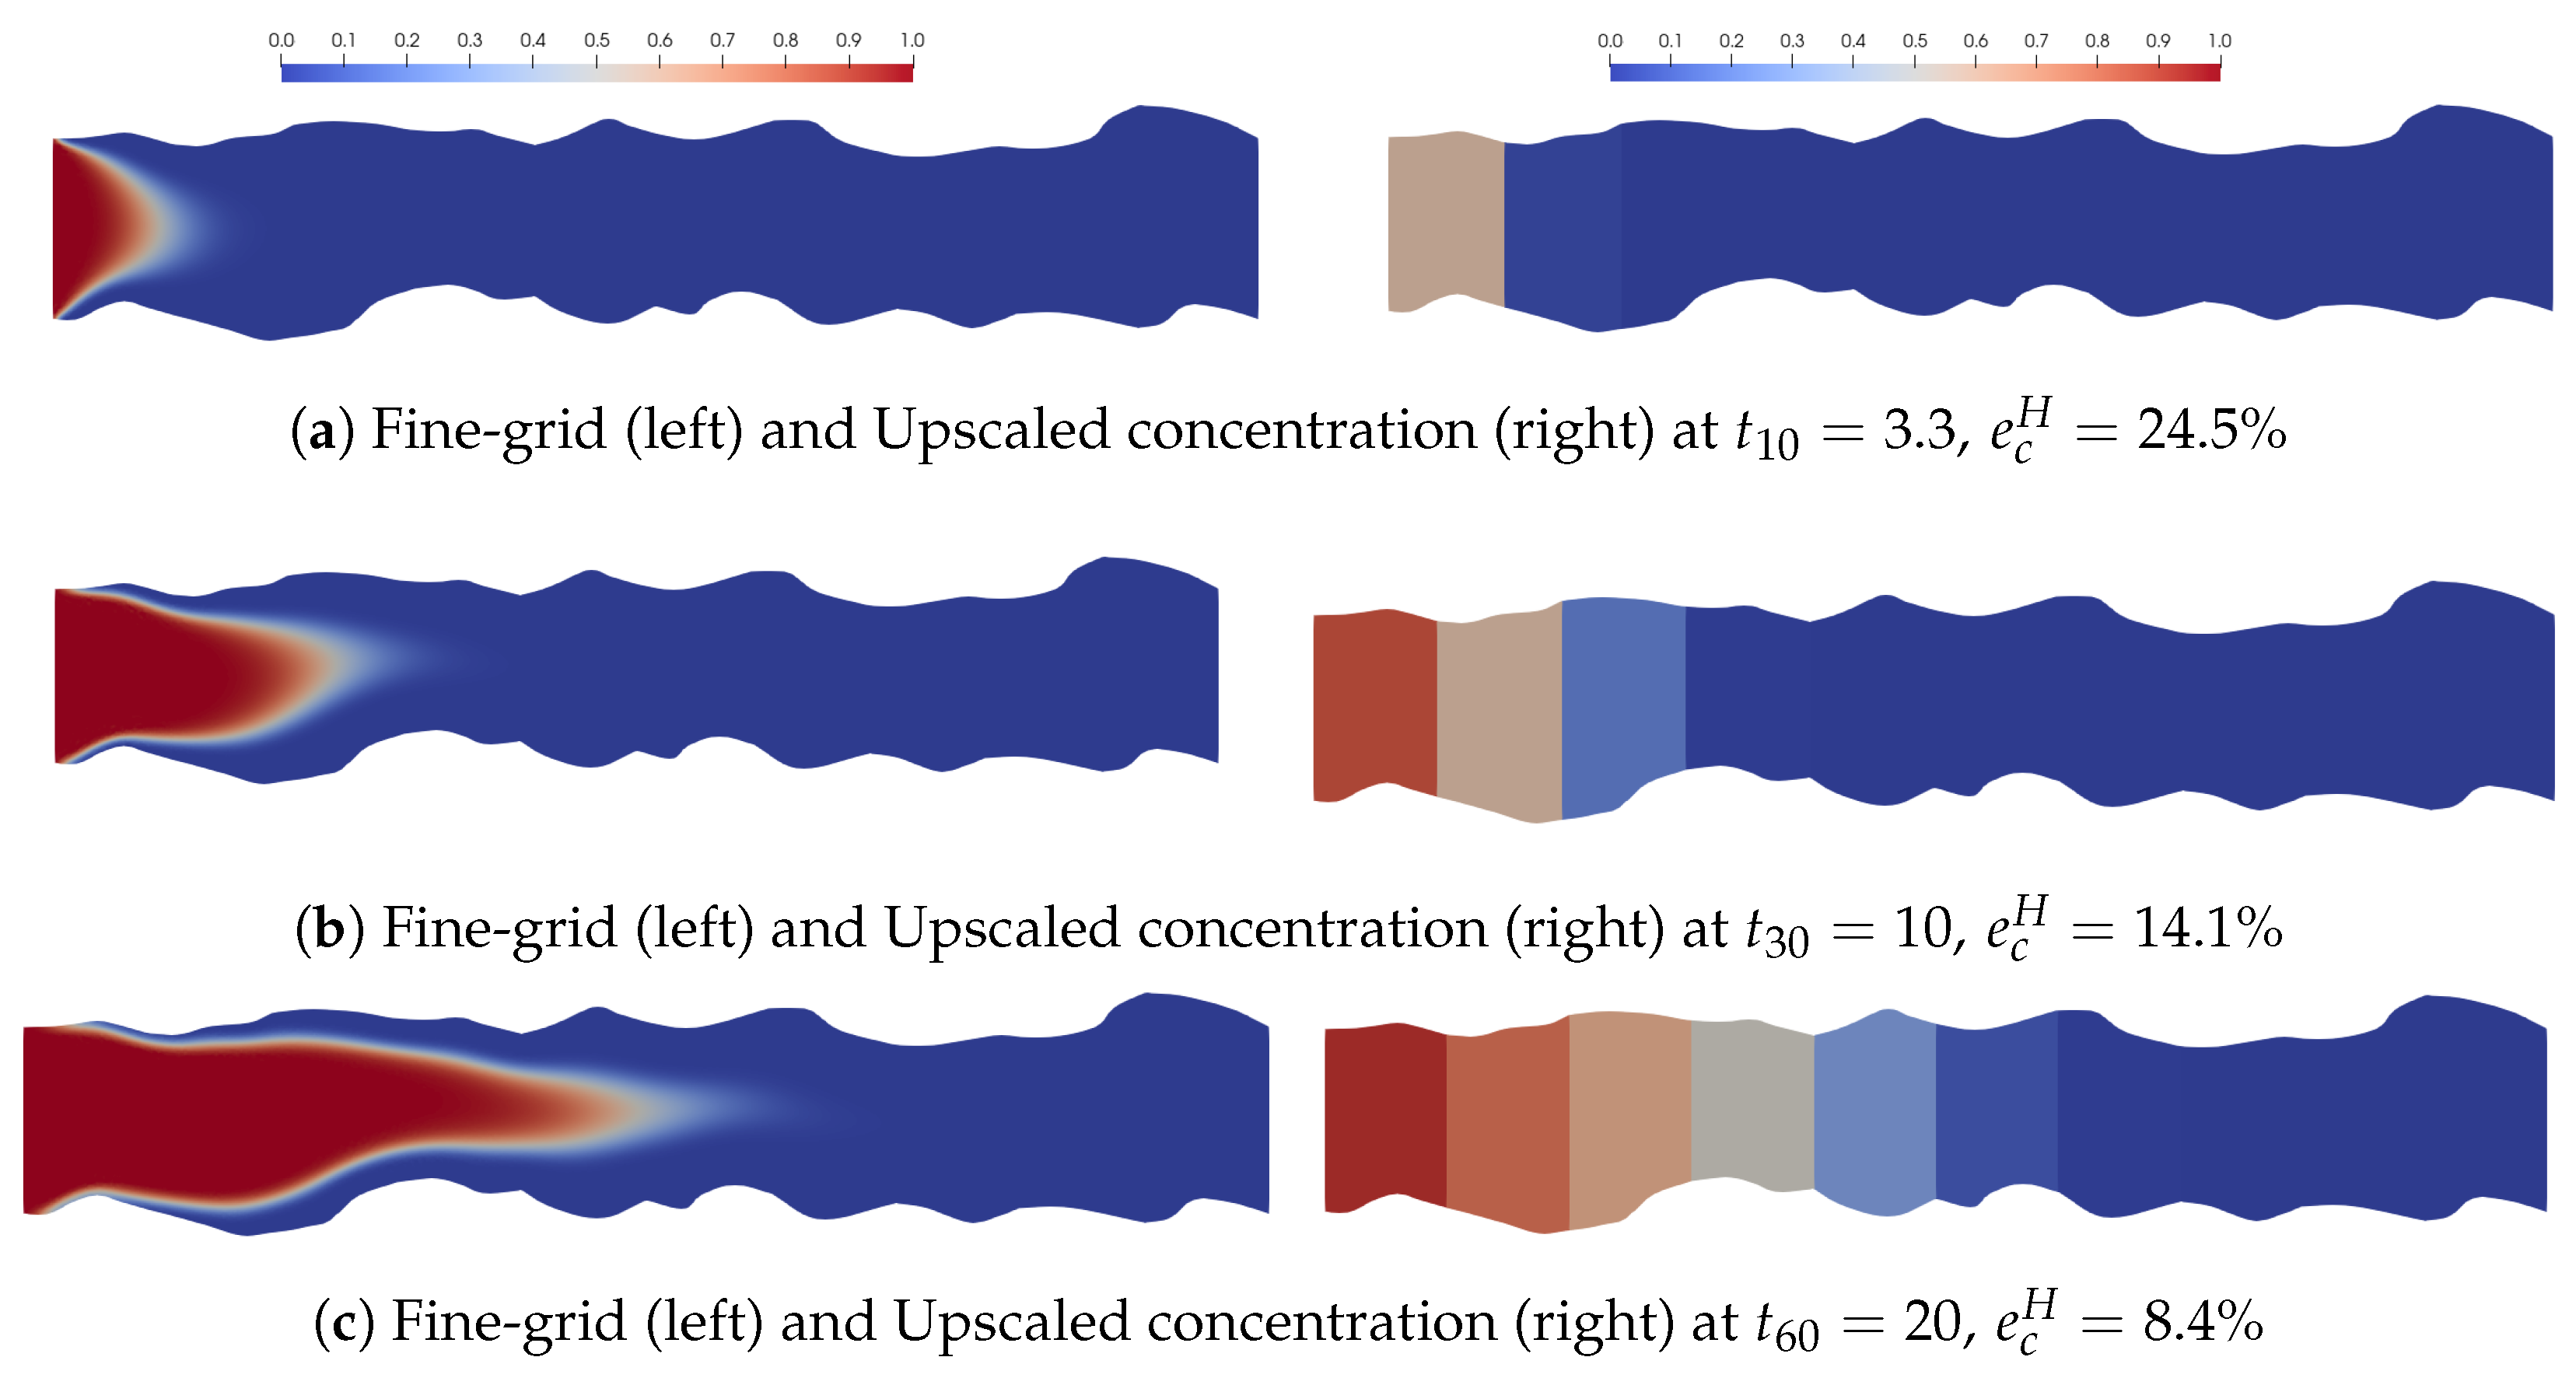
The results for the transport equation for all geometries are presented in
Figure 7,
Figure 8,
Figure 9,
Figure 10,
Figure 11,
Figure 12,
Figure 13,
Figure 14 and
Figure 15 for the three diffusion coefficients:
Figure 7,
Figure 10, and
Figure 13 display the outcomes obtained with a diffusion coefficient of
, while
Figure 9,
Figure 12, and
Figure 15 illustrate the results obtained with
. Results obtained with
are presented in
Figure 8,
Figure 11, and
Figure 14. These figures display both the reference fine-grid solution and the upscaled model solution. From the results, we can observe accurate solutions for the upscaling methodology.
In our simulation, the inflow and outflow concentration was set to
, and
was set as the initial concentration. Throughout the simulations, it was evident that among the three geometries, the thinnest domain—Geometry 1—required an extended time for the concentration to diffuse completely within the entire domain, while the other two domains—Geometries 2 and 3—required a shorter time. A maximum time of 90 with 60 iterations was used in the simulation of Geometry 1, and the concentration at the time steps
for both the fine-grid and the upscaled solution are displayed in the figures. For the thicker domains—Geometries 2 and 3—a maximum time of 20 with 60 iterations was used in the simulations, and the results of the concentrations at the time steps
are displayed. These choices of maximum time and time steps were influenced by the fact that concentrations in the thinner domains required a longer time to diffuse through the entire domain, while the opposite was required in the thicker domains. Relative errors for concentrations between the fine-grid solutions and the upscaled solutions for all geometries were also calculated, and the results are displayed in
Figure 16 and
Table 2,
Table 3 and
Table 4 for some time levels. The error decreases with increased time. Also, it can be observed that Geometry 1 produced the smallest errors, followed closely by Geometry 3 and finally Geometry 2, although the differences were not significant.
In addition, simulation results obtained with Geometry 1 are presented in
Figure 7,
Figure 8 and
Figure 9 for the diffusion coefficients
respectively. From the figures, it can be observed that the upscaled solution results gave a satisfactory approximation of the fine-grid solution. The computed errors associated with all three diffusion coefficients are given in
Figure 16a and
Table 2. From the figure, it is clear that the errors are converging to a smaller value, and also, the choice of diffusion coefficient does not have any significant effect on the results.
To determine the effect of the mesh resolution on the concentration for the upscaled results, additional simulations were conducted with Geometry 1 using a lower mesh resolution of 5 cells. The values of all other parameters remained the same.
Table 2 displays the concentration errors for Geometry 1 and shows that simulations with 5 cells produced higher errors than those obtained with 10 cells, highlighting a significant influence of mesh resolution on the proposed upscaled scheme in this geometry.
As previously mentioned, Geometry 2 has a greater width compared to Geometry 1 and 3, and this characteristic leads to an accelerated diffusion rate of the concentration throughout the entire domain. The simulation results for this particular domain are displayed in
Figure 10,
Figure 11 and
Figure 12. A high level of accuracy in the method we have introduced can be observed from the result. The concentration errors between the fine-grid solutions and the upscaled solutions for the three diffusion values are presented in
Figure 16b and
Table 3. This graph shows that errors are increasing in this domain, and this could be justified by the fact that this domain has very rough boundaries and a shorter time was used in the simulation. Similar to the previous domain, the performance of the proposed upscaled method in this domain does not depend on the value of the diffusion coefficient.
In Geometry 3, we consider a domain with smoother walls, and the simulated results are displayed in
Figure 13,
Figure 14 and
Figure 15 for the three diffusion coefficients. Satisfactory performance of the proposed technique can be seen from the graphs, which can also be confirmed by
Table 4 and
Figure 16c.
Table 4 and
Figure 16c display the errors between the fine-grid solution and the upscaled solution for each diffusion coefficient. From
Figure 16c, we can observe that the errors converge to a smaller value, and this observation can be confirmed by the results in
Table 4. Similar to Geometry 2, the concentration required shorter time steps to diffuse into the entire domain, and the results do not depend on the value of the diffusion coefficients.
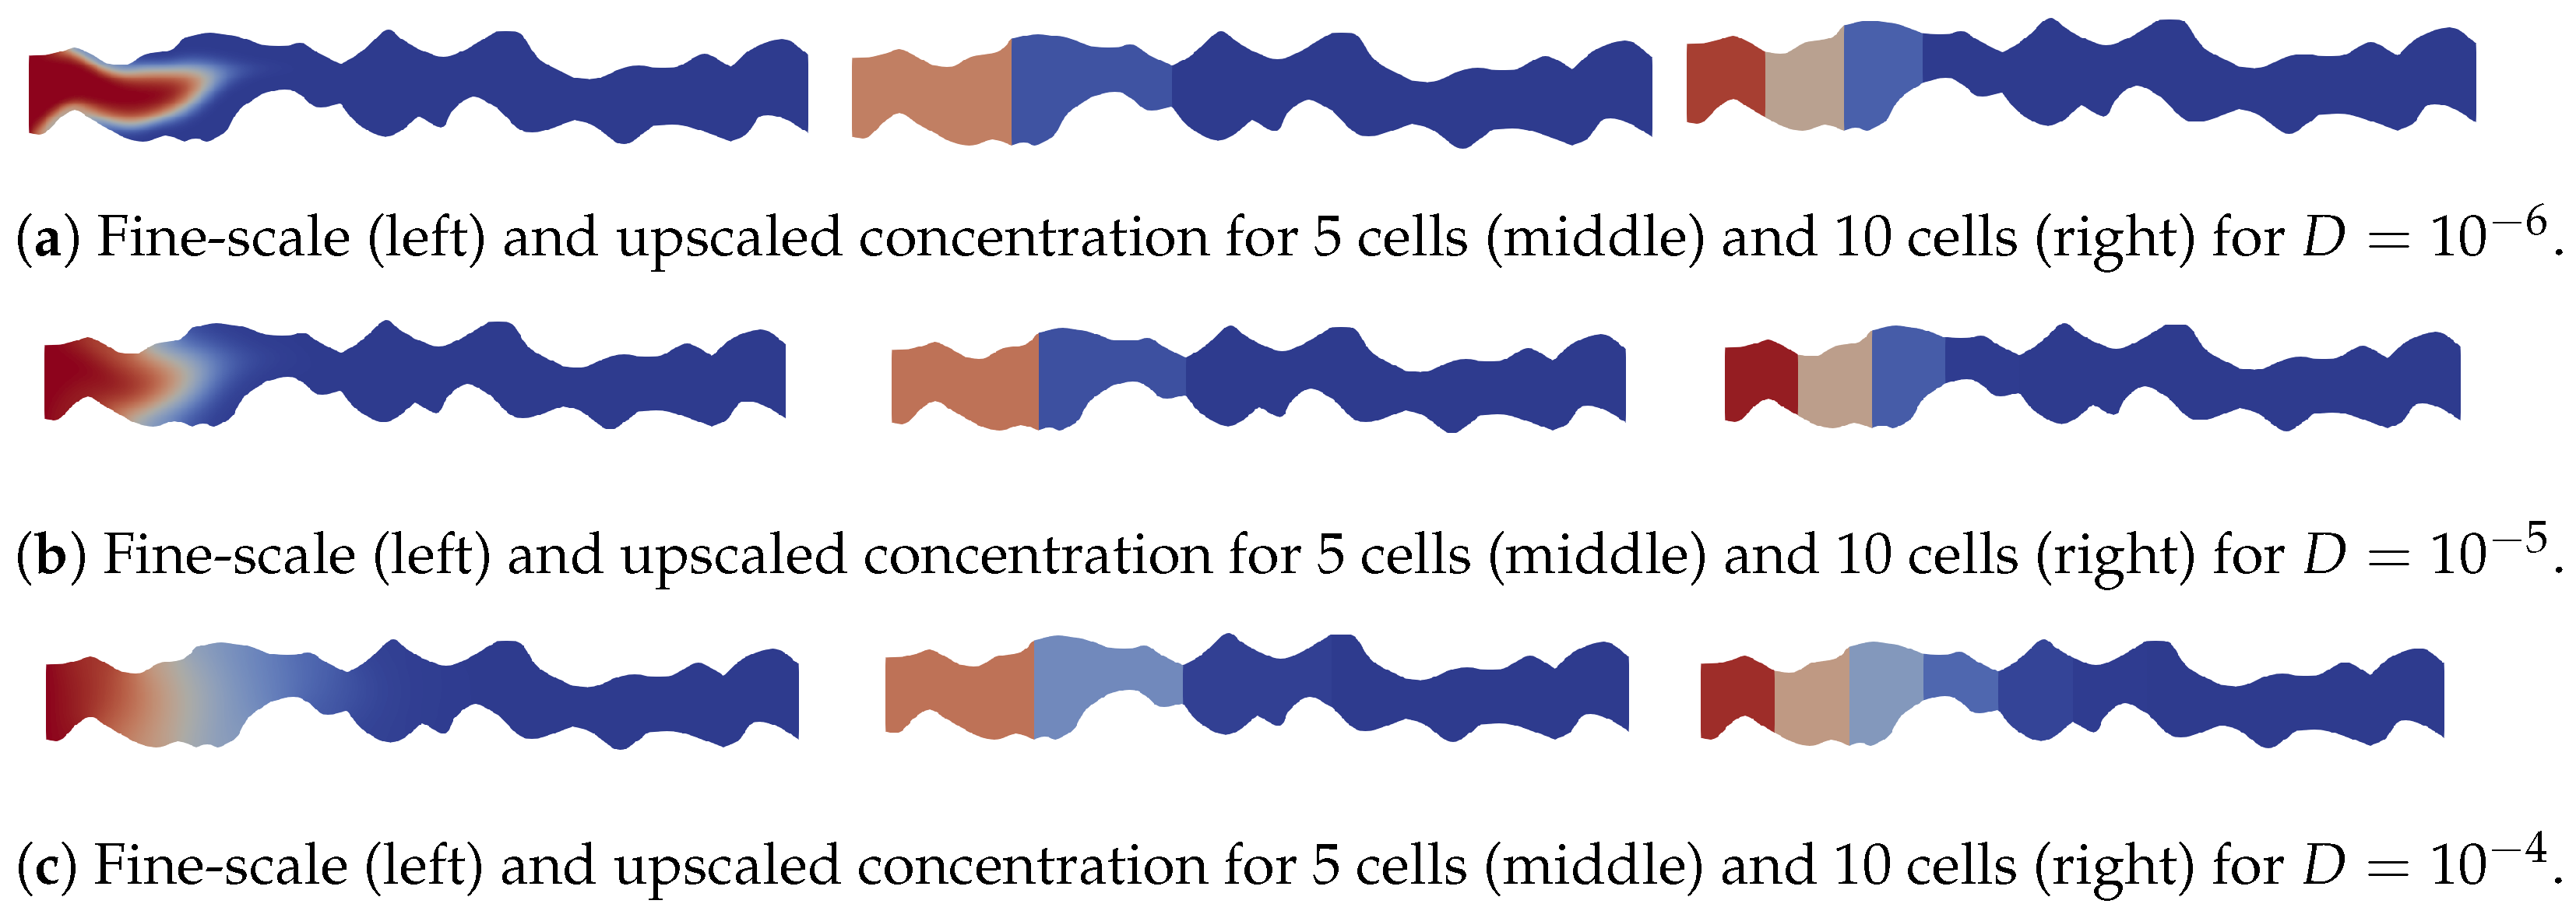
Furthermore, simulations were conducted with two additional viscosities,
and
, to analyze the effect of viscosity on the upscaled concentration for Geometry 1. We consider diffusion values of
, and
and both the 5- and 10-cell resolutions. Results for both fine and upscaled concentration at the final times are shown in
Figure 17a,c. Concentration results obtained with
are given in
Figure 17 for the 5- and 10-cell resolutions, respectively. Whilst those for
are displayed in
Figure 18a,c. We obtain faster flow with lower viscosity and observe that the concentration moves faster. In addition, concentration errors are displayed in
Table 5 and
Table 6 for
and
, respectively. We observe that errors obtained for
are lower than those of
with a very notable difference.
In our simulations, direct numerical simulations using finite element discretization on the fine grid—serving as our reference solution for the steady-state Stokes flow and transport problems—proved less computationally efficient than the upscaled simulations. For Geometry 1, the fine-grid simulations utilized 63,474 degrees of freedom for velocity, 8092 for pressure, and 8092 for concentration. In contrast, the upscaled results were achieved with a one-dimensional domain containing 10 or 5 cells for both the pressure and concentration equations.
For Geometry 2, the fine-grid solutions involved 131,750 degrees of freedom for velocity, 16,641 for pressure, and 16,641 for concentration. For Geometry 3, 103,648 degrees of freedom were employed for velocity and 13,109 for pressure and concentration. These large numbers of degrees of freedom highlight the substantial size of discrete systems and introduce numerous unknowns, especially compared to the upscaled one-dimensional formulation with 10 or 5 cells. Consequently, the computational cost is expected to be significantly higher than that of the one-dimensional upscaled approximation. This is evident in the computational time summaries provided in
Table 7, where notable differences in computational times are recorded between fine and upscaled simulations. The upscaled results exhibit significantly lower computational times compared to the fine-grid solutions, which show higher computational times.


