1. Introduction
Flow generation and control are rapidly developing as key technological areas relevant to several engineering sectors with the main goal of transport of mass or energy. There are many ways of generating and controlling flow, which include propellers, pumps, valves, turbines, synthetic jets, and magnetohydrodynamic and electrohydrodynamic generators. The main question is which one of these is the most appropriate for a given application. For some of them, the reason for implementation can be simply cost effectiveness and general availability, while others are reserved for special conditions. At the Technical University of Liberec, production of nanofibers is a very important research area. During the nanofiber production process, it is beneficial to use an external airflow to deposit the nanofibers to the desired location. The electrospinning process [
1], which is commonly used as the main production method, already uses high voltage (in the range of tens of kilovolts). This special situation offers the opportunity to apply the present strong electric field to also generate the airflow via electrohydrodynamic devices.
It is well known that around an asymmetrical system of electrodes connected to high voltage, two interconnected phenomena arise. The first one is a mechanical force (called after its discoverers, Biefeld–Brown force [
2]) affecting the whole system of electrodes in the same direction, commonly observed on a device called “lifter”, where a lightweight system of asymmetrical electrodes is able to lift itself against gravity [
3]. The second one is an airflow generated around the electrodes with the opposite orientation to the direction of the force [
4]. Since their discovery, many scientists have tried to use both phenomena in practical and also in somewhat unconventional applications, e.g., bladeless fans, air purifiers, ionic wind propulsion, reduction of drag on wings, electrospinning of nanofibers, flow control, and various military and space applications [
5,
6,
7,
8].
One of these is the possibility to generate and control airflow using these phenomena. This application has many advantages—very simple in design, no moving parts, little to no noise and very low power consumption [
9]. Since the airflow is generated by the interaction of a very strong electric field with the surrounding medium, the phenomena cannot be studied only from the point of view of physics. The fact that is in this case often neglected is the presence of chemicals generated during the process. This was studied only in some special cases, where corona discharge is used for commercial applications—e.g., air cleaners [
10,
11]. However, this has to be taken into account whenever corona discharge is used, since these chemicals can have negative consequences on both materials and health [
12,
13]. The novelty of this study lies in measuring the generated airflow using two independent methods—particle image velocimetry and hot-wire anemometry—comparing the results, especially in the analysis of possibly harmful chemical products in the airflow.
2. Theory
This article is focused on the properties of the airflow generated on the system of asymmetrical high-voltage electrodes. Most serious studies agree on the fact that the physical principle of the airflow generation is a continuous movement of ions and their interaction with neutral particles of the surrounding medium [
3].
On the system of two strongly asymmetrical electrodes (where the smaller electrode is connected to high voltage and the larger one is grounded), several basic postulates, which are the basis for the theory behind the phenomenon, can be stated:
(1) In the immediate vicinity of the small electrode, after it is connected to high voltage (in the range of kV), a strong electric field (in the range of MV/m) is generated. If the surrounding medium is air, a large number of charged particles of both polarities are formed in the vicinity of the small electrode at such high electric field strength.
(2) Charged particles with the opposite charge to the small electrode are immediately attracted to it and discharged. Conversely, particles with the same polarity (in the air primarily N
2+ ions) are accelerated in the direction of the electric field strength vector to a drift velocity and move from the equally charged smaller electrode to the grounded larger electrode (see
Figure 1).
(3) Since the charged particles move through an environment in which they are surrounded by a large number of electrically neutral molecules of the surrounding air, during their journey from one electrode to another, they collide with them many times (approximately 107 collisions per second).
(4) If the kinetic energy of charged particles accelerated by the electric field is not sufficient to ionize neutral air molecules, only momentum is transferred during collisions.
(5) Neutral particles can be considered stationary until the collision, because the speed of thermal motion is negligible compared with the speed of charged particles, which is induced by the electric field.
(6) It follows from the law of conservation of momentum that after a collision, neutral particles and charged particles should fly in opposite directions. Before the collision, the charged particle was accelerated by the electric field away from the equally charged smaller electrode. This means that after the collision with a neutral molecule, it should move back towards the smaller electrode. However, since it is still in the presence of the electric field, it is not allowed to move in this direction, and instead, it is again accelerated in the direction away from the equally charged electrode. However, the momentum that the charged particle gained by colliding with the neutral particle is transferred back to the source of the field, i.e., to the entire system of electrodes.
(7) A neutral molecule, which, after the collision, gained momentum of the same magnitude but in the opposite direction, gradually loses this momentum through further collisions with neutral molecules of the surrounding air. However, since neutral molecules are neither attracted nor repelled by either of the electrodes, their momentum is not transferred to the electrodes, but this movement of neutral particles is observed as an oriented airflow.
This mechanism works only if the region around the small electrode in which ionization takes place is sufficiently narrow. If the value of the electric field strength in the space between the electrodes increases enough to allow avalanche ionization, the airflow will decrease significantly, because the principle of its generation depends on the fact that the neutral air particles remain neutral even after a collision with a charged particle. If the voltage between the electrodes comes near the breakdown voltage of the given dielectric (in our case air), the characteristics of the discharge significantly changes. First, the intense corona discharge with ionized streamers is generated; then a spark discharge appears, and if the power supply allows, arc forms. However, neither of these generate continuous oriented airflow.
Furthermore, it is assumed that the cause of the current that flows through the circuit is only accelerated ions that move without recombination and other losses from one electrode to another.
There are many known electrode shapes for which the airflow has been studied [
14,
15,
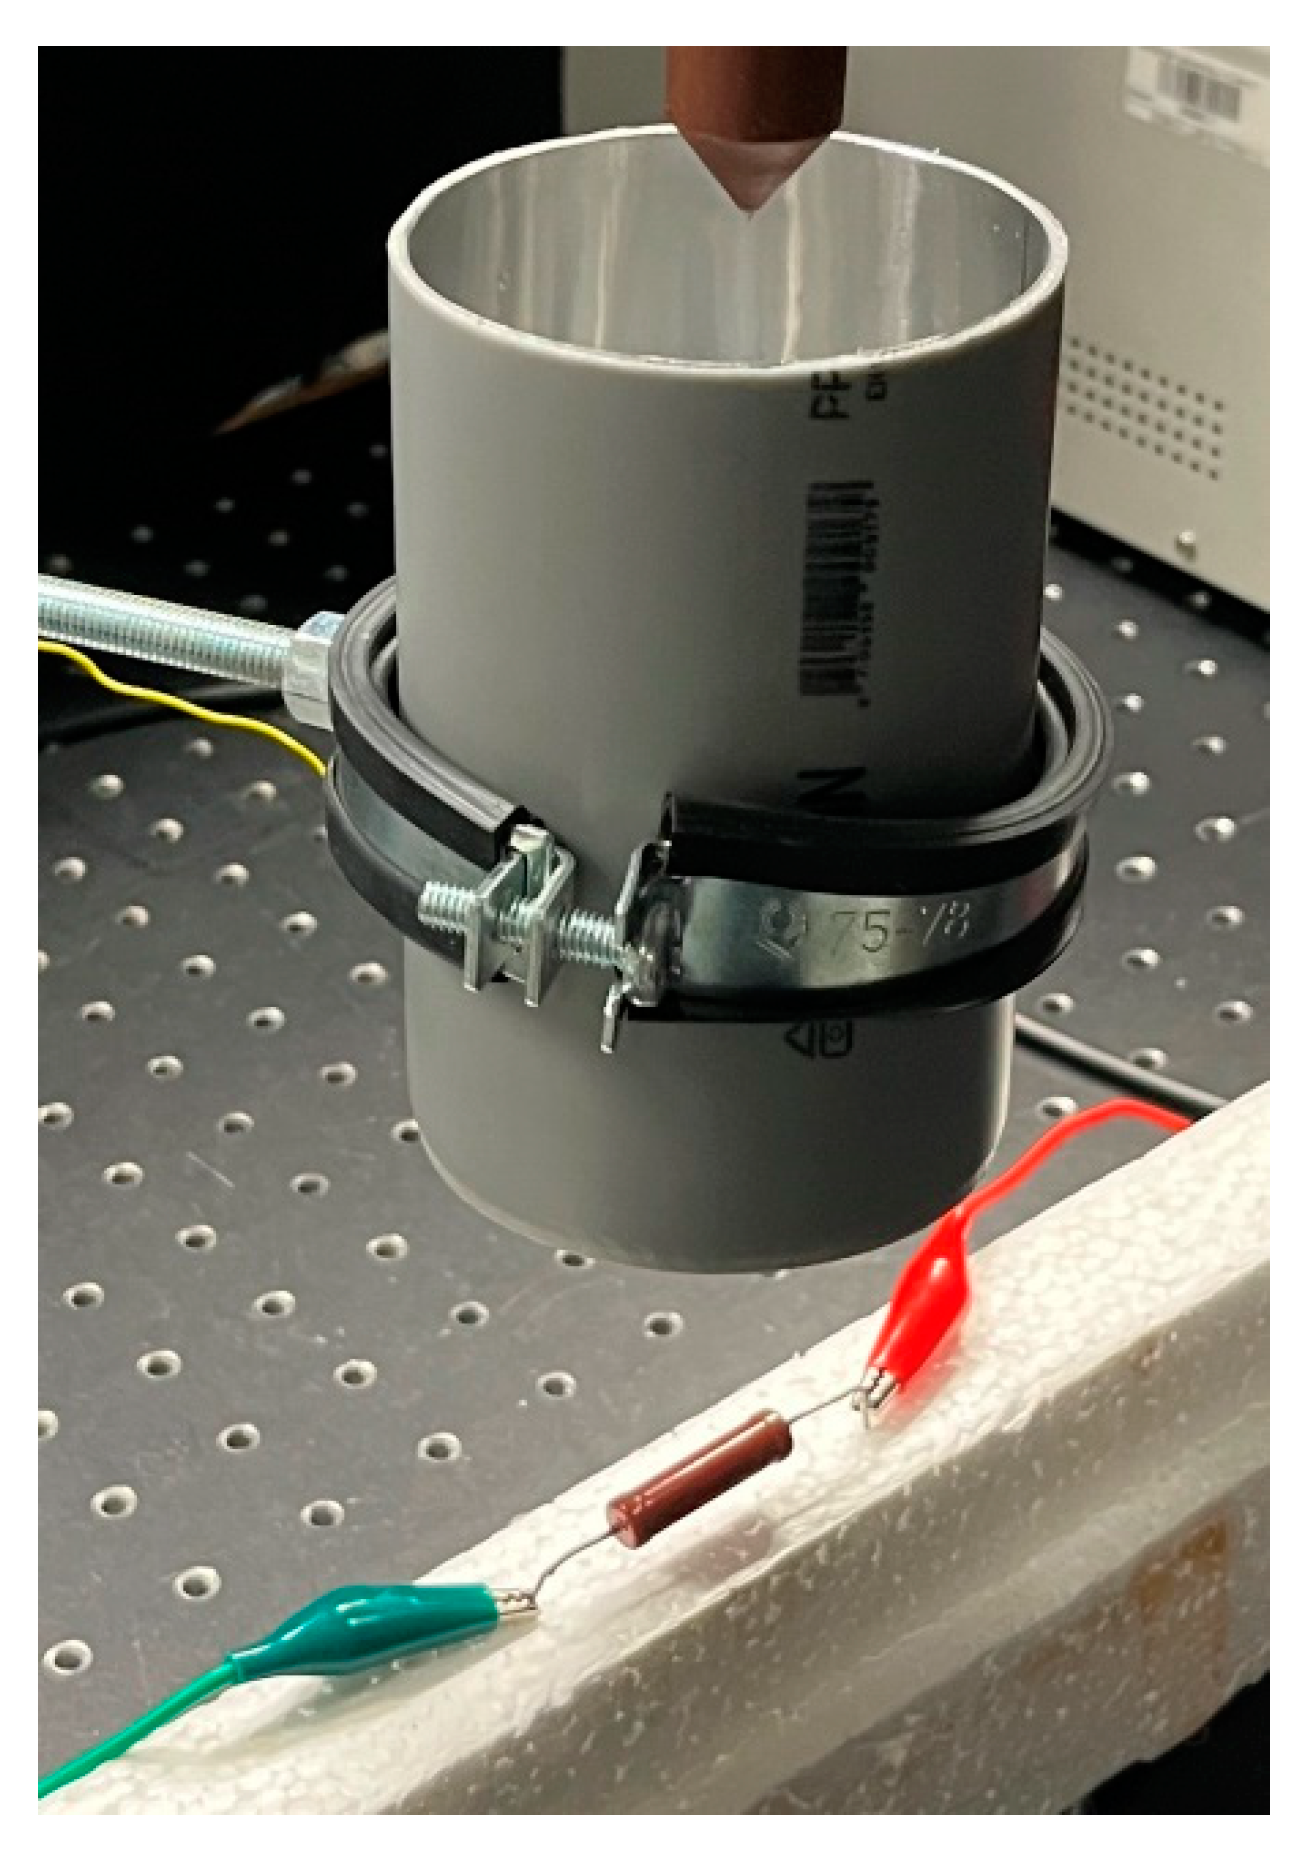
16]. For practical reasons, the authors chose to use an electrohydrodynamic (EHD) generator with a tubular grounded electrode and a single-point positive high-voltage electrode. This design offers several advantages—the generated airflow is canonical, well defined, and focused on a small area; the device itself is very simple to build; and most of its dimensions can be very easily adjusted.
The authors built several EHD airflow generators with different electrode dimensions. The single-point wire electrode is made of a stainless steel wire with a 1 mm diameter sharpened into a point with a slope of 45°. To restrict unwanted corona discharge along the wire length, it is fitted into a plastic cylinder with a diameter 30 mm so that just the pointed part of the wire extends. The only mechanical parameters that are changed during the experiments are the length of the larger electrode
a and the gap between the electrodes
g (see
Figure 2). The length (120 mm) and the diameter (70 mm) of the isolating plastic tube remain the same so that changing the length of the larger electrode
a does not change the aerodynamic conditions in the experiments.
During the measurements, the pointed electrode is always connected to positive high voltage U (power supply Glassman FX series, maximum voltage 50 kV, current limitation was set during all measurements to 5 mA), and the larger electrode is grounded. On the grounded side, the electric current I through the device is measured for each corresponding voltage. Electric current was measured using a digital multimeter, Agilent U1252B, set to the range of microamperes.
The airflow velocities were acquired using the Voltcraft hot-wire anemometer PL-135HAN. A hot-wire anemometer works on the principle of heating a thin metal wire by passing electric current through it and observing changes in temperature caused by the movement of the surrounding medium. If the temperature of the medium is known, it is then possible to calculate its velocity from the temperature changes in the heated wire. The hot-wire sensor was placed directly in the middle of the bottom end of the airflow generator. This placement ensures the electrical safety of the hot-wire sensor, since the electric field in this location (well below the grounded electrode) is approaching zero. Any charged particles moving from the pointed positive electrode are attracted to the grounded electrode and immediately discharged, so they cannot reach the hot-wire sensor. Therefore, the sensor measures only the velocity of the neutral airflow.
Since the velocities are changing dynamically around a central value, the measured data were averaged over 30 s for each measurement, and the mean velocity was obtained. All measured data were acquired for six different voltages, 10, 12, 14, 16, 18, and 20 kV. Ambient temperature (21 °C) and relative humidity (40%) were constant during all measurements.
3. Numerical Simulation
To obtain a more precise image of electric field strength around EHD generator electrodes, it is necessary to calculate it using numerical methods—in our case, finite element method (FEM). The behavior of the electric field in the
Ω ⊂
R3 region with the boundary
Γ is described by the elliptical partial differential equation—Gauss law of electrostatic field:
where
D is the electric displacement vector, and
σ is the electric charge density. It is assumed that the boundary of the region is divided into two parts,
Γ = Γ1 U
Γ2, on which the boundary conditions are given. On the part of the boundary
Γ1, the Dirichlet boundary condition is defined (denoted by the index
D); on the part of the boundary
Γ2, the Neumann boundary condition is defined (denoted by the index N);
nk is the
k-th component of the external normal unit vector on the boundary of the region
Ω.
The model is implemented in the ANSYS computing software. The PLANE121 element is used for electrostatic field analysis and implements Gauss law with boundary conditions. The geometry of the FEM model is a region approximately 3 times larger than the characteristic dimension of the experimental device in order to limit the influence of boundary conditions. The homogeneous Neumann boundary condition D
N = 0 is given on the whole boundary of the region. The electrodes are represented by the Dirichlet boundary condition, where the value of the electric potential is given.
Figure 3 shows the distribution of the electric potential and the electric field strength vector in the region bounded by the central axis and the tubular grounded electrode (electrode geometry corresponding to the built EHD generator, with zero gap
g between electrodes and
U = 18 kV).
As can be seen in
Figure 3, the maximum electric field strength is around the positive sharp wire electrode, as was expected. It decreases very rapidly with distance from the positive electrode. Thus, it is obvious that the ionization of air, which is the basis of the EHD generator operation, occurs only in the vicinity of the positive electrode. This is in accordance with the postulates presented in the Theory section. As the ionized particles move away from this very small ionization region, while being attracted to the grounded larger electrode, they collide along their path with electroneutral molecules in the surrounding air without any further ionization. This process, in turn, generates the examined airflow.
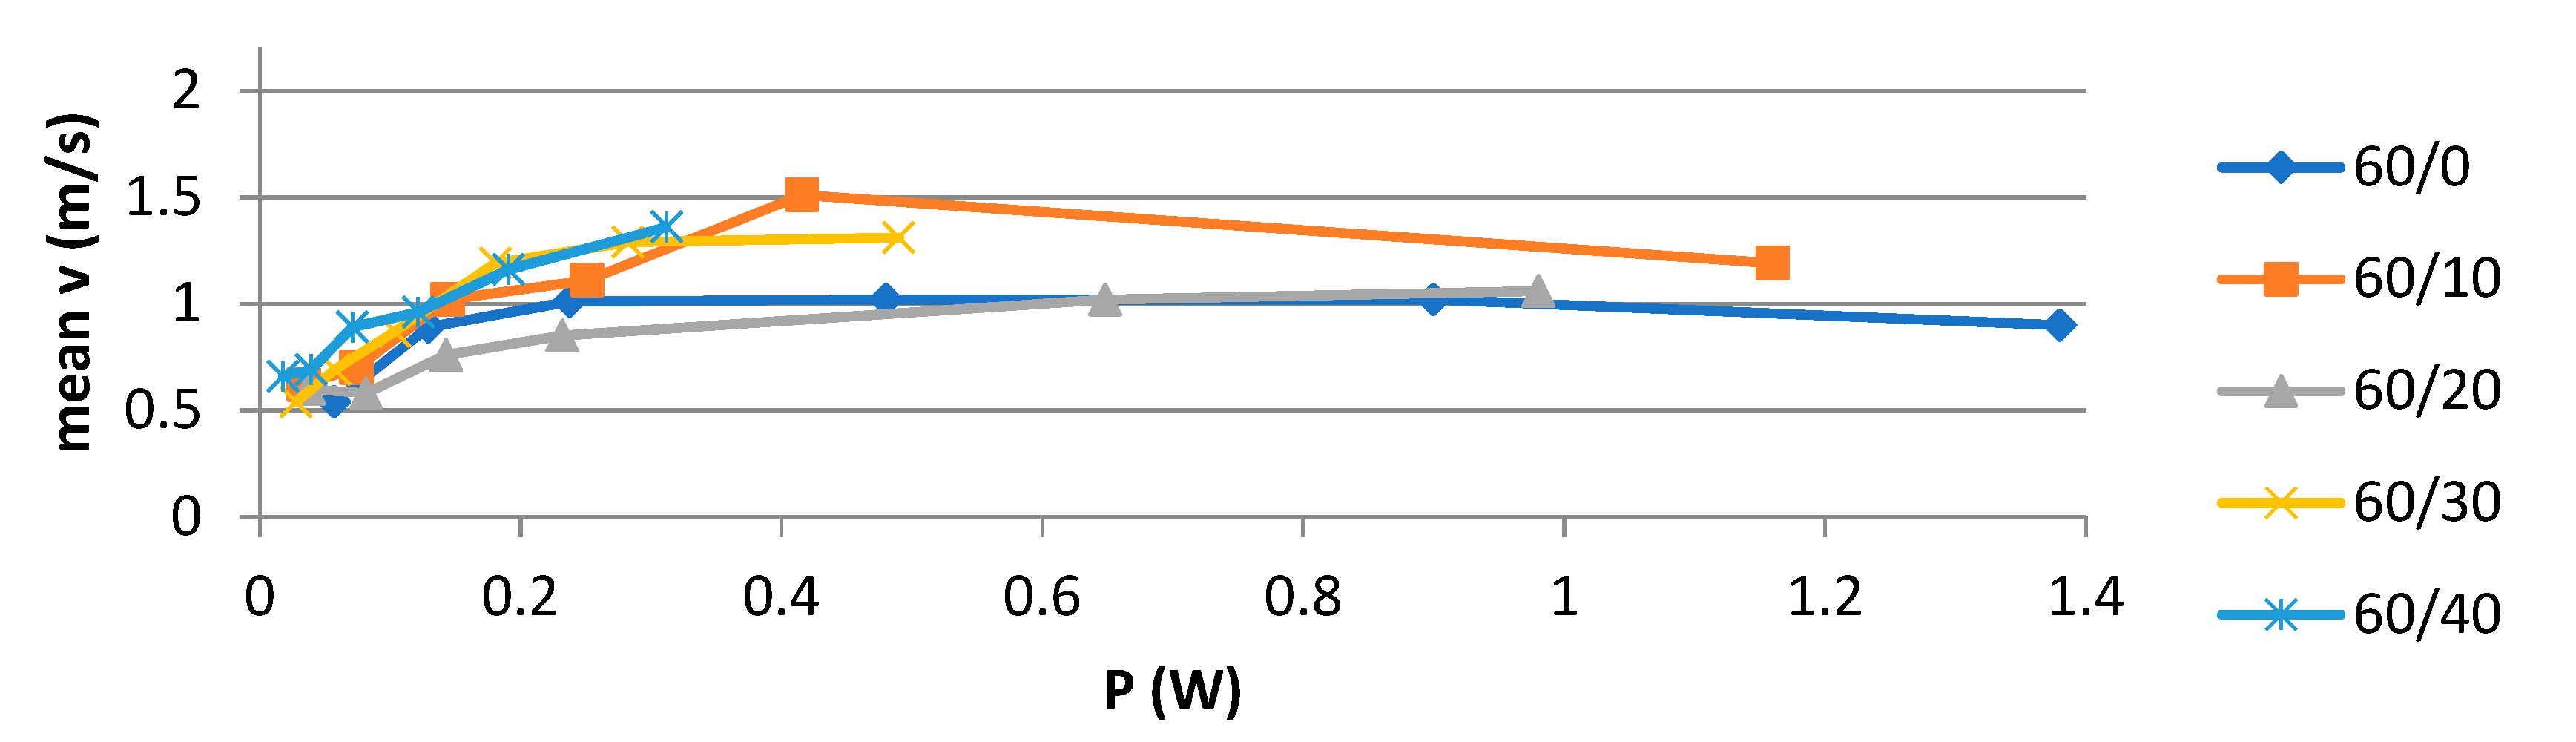
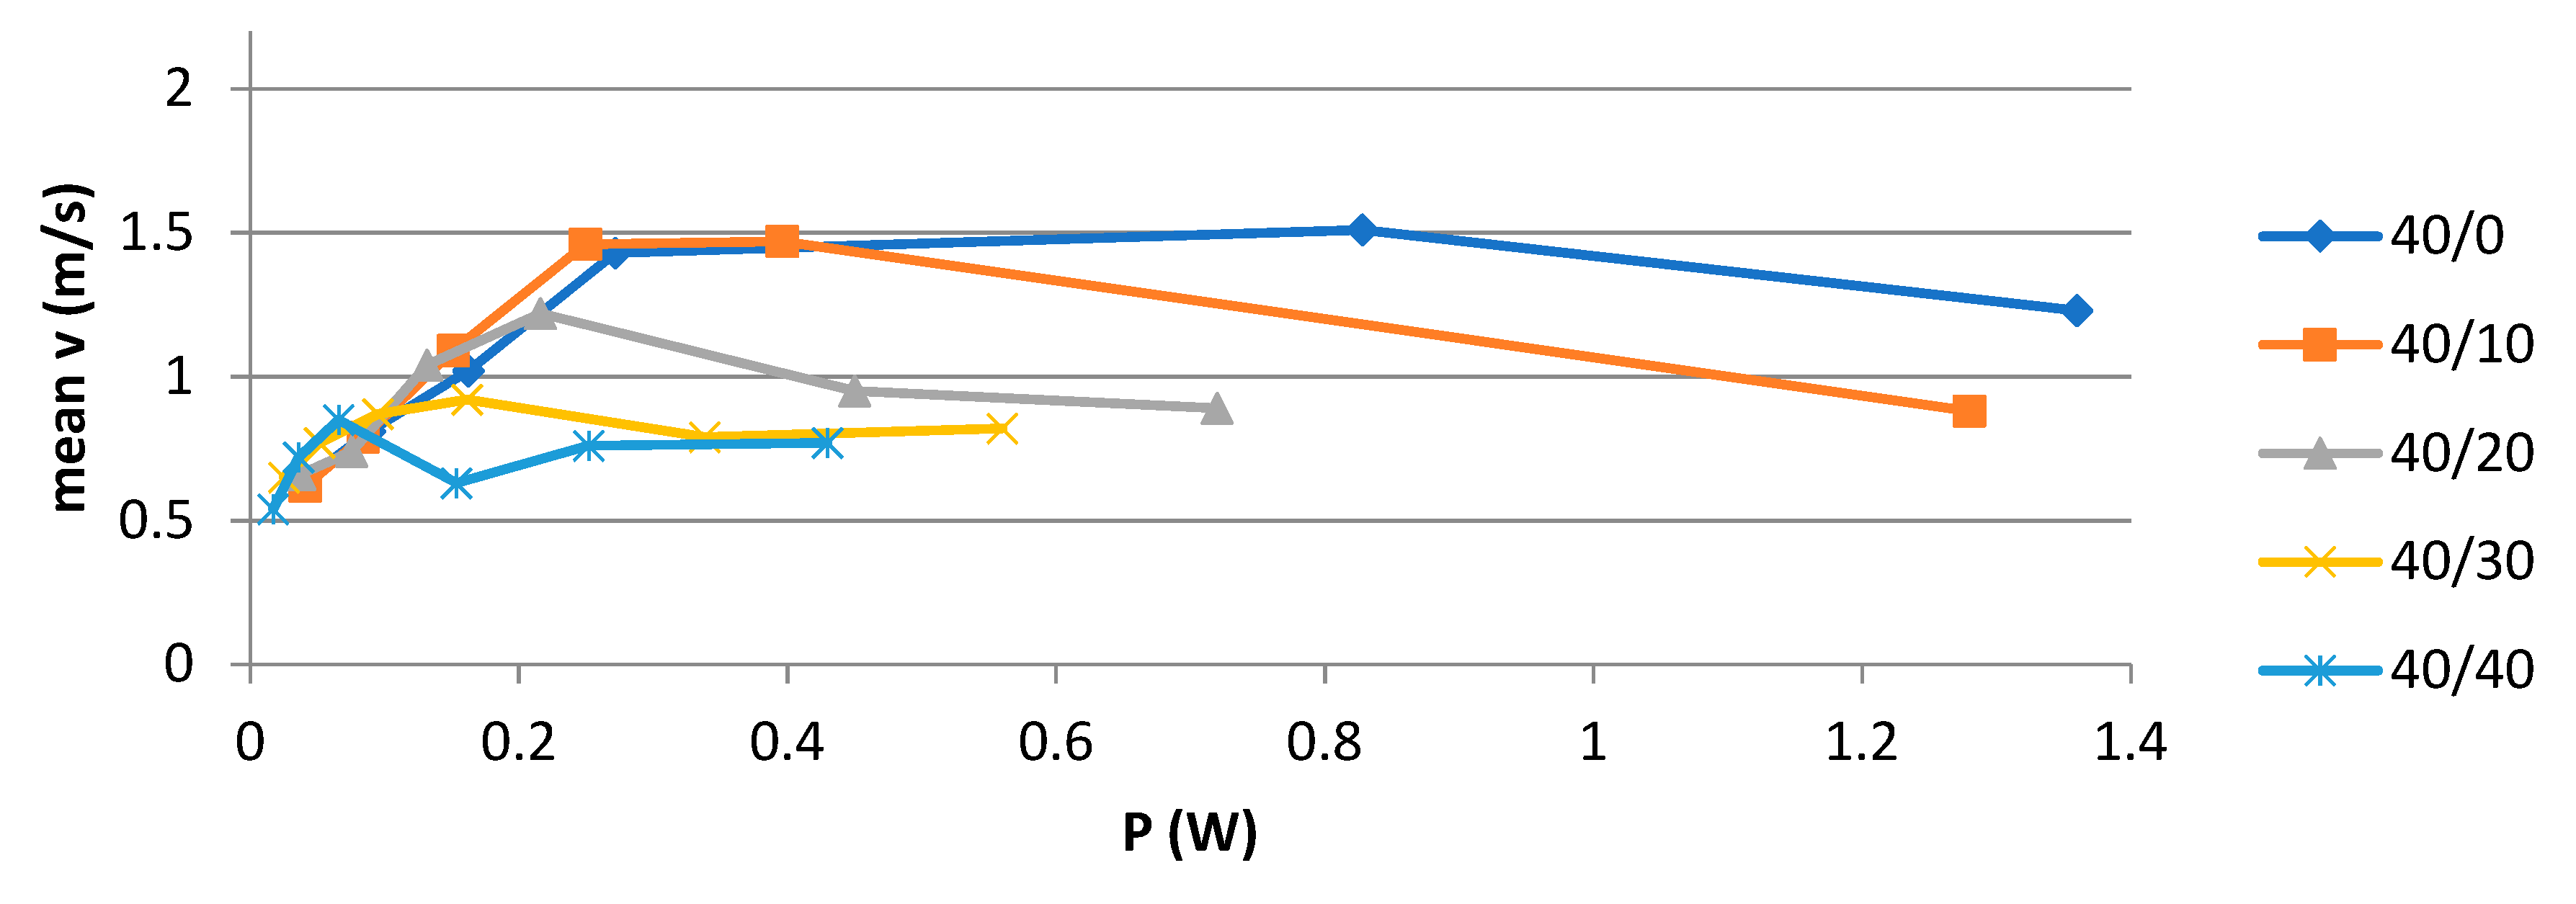
4. Measurements
To find the optimal design for generating the airflow, it was necessary to consider both electrical parameters (
U,
I) as a single variable—power consumption
P, defined for direct current as
P = U·I and to measure its relation to the value of the mean velocity
for each airflow generator geometry (see
Figure 4,
Figure 5,
Figure 6 and
Figure 7).
As can be seen, the maximal value of averaged velocities (around 2 m·s−1) is generated on an EHD generator with the longest grounded electrode (a = 100 mm). The second very important observation is that the airflow generation falls off at higher voltages for the majority of measured cases, because the electric current is consumed more and more on other types of discharge (first, corona discharge, and later, spark) and less on airflow generation. During spark discharge, the postulates stated in the Theory section are no longer valid, and for this reason, the working voltage range can be limited for this EHD generator’s geometries to 16 kV maximum. Another important fact shown in the graphs is that in the vast majority of measurements, the gap g = 40 mm is too big (affecting both electric field intensity vector and aerodynamic conditions), thus generating the least airflow velocities. Therefore, any practical applications of this type of EHD generator can be limited to 16 kV maximum working voltage and to 30 mm as the maximum electrode gap g.
For the sake of completeness, the V-A characteristic of one of the measured devices (a = 100 mm) with several electrode gaps is also included (see
Figure 8). As expected, the typical V-A characteristics of high-voltage corona discharge are shown. Because the device is working in the region of corona discharge only, the V-A characteristic includes the appropriate voltage ranges. For this reason, other discharge modes (e.g., spark discharge, arc) are not included.
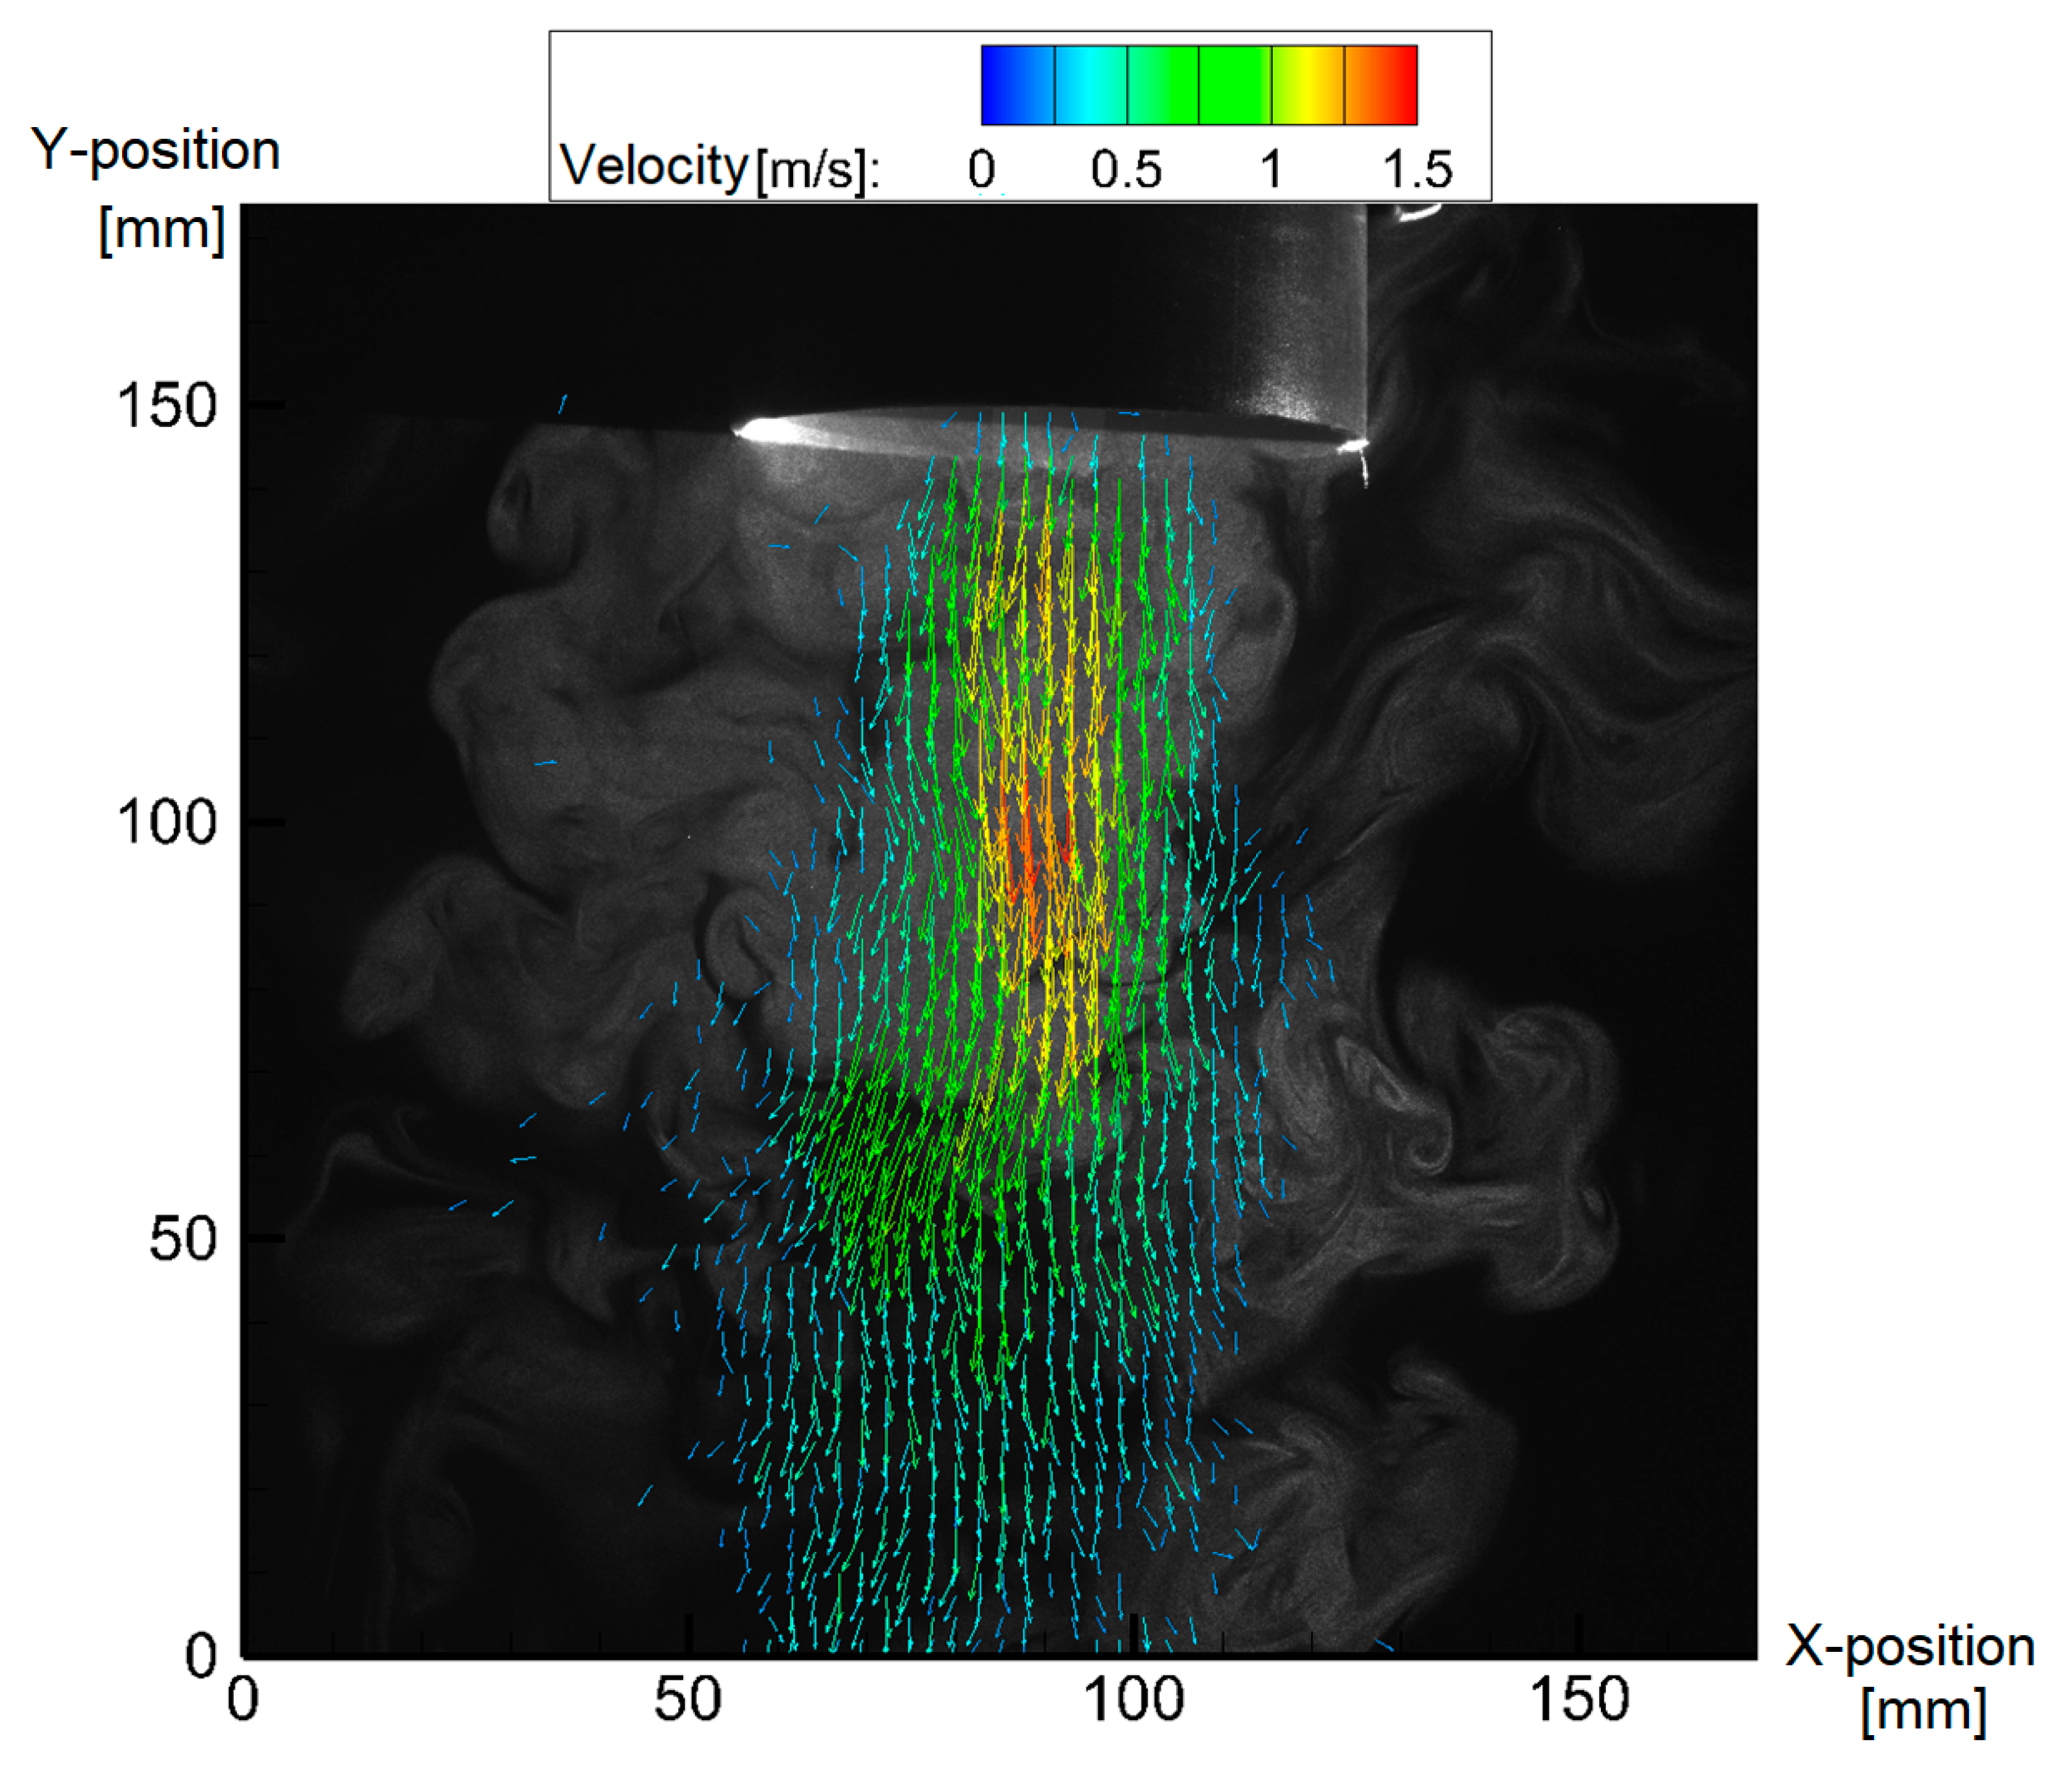
To further examine the generated airflow, the authors used the particle image velocimetry (PIV) method [
17], which can be successfully used even in these specific conditions, where the strong electric field is present [
18]. The PIV method begins with seeding the examined flowing medium with tracer particles with a very similar density to the medium to ensure that the particles follow the measured flow faithfully. Then the particles are illuminated by two pulses of laser light in immediate succession optically expanded into a plane, which the tracer particles reflect. The scene is captured using a high-speed digital camera, and the two images are compared through digital image analysis (using specialized software), where, from the position of the particles in both images, the velocity vector map can be calculated.
The PIV measuring setup consisted of the Nd:YAG green pulse laser Quantel EverGreen (wavelength of 532 nm, pulse frequency of 15 Hz, length of pulse of 10 ns, and energy of 25 mJ) and the digital camera HiSense Neo (resolution of 2260 × 2160, 12 bits/pixel, maximal capture rate of 50 frames/s), with Nikkor 60 mm f/2.8 D AF Microlens connected through a measurement card to a PC with Dantec Dynamics Studio software. The fog fluid SAFEX standard (according to DIN/VDE 0700 part 245 # 32.1) with an average particle size of 1 µm was used as a source of tracer particles, which were generated using a SAFEX Fog Generator.
PIV images were processed as follows: masking, cross-correlation, moving average filter, and vector statistics. The result can be seen in
Figure 9, showing the detailed characteristic of the measured airflow and also showing a very good agreement with previously measured results using hot-wire anemometry.
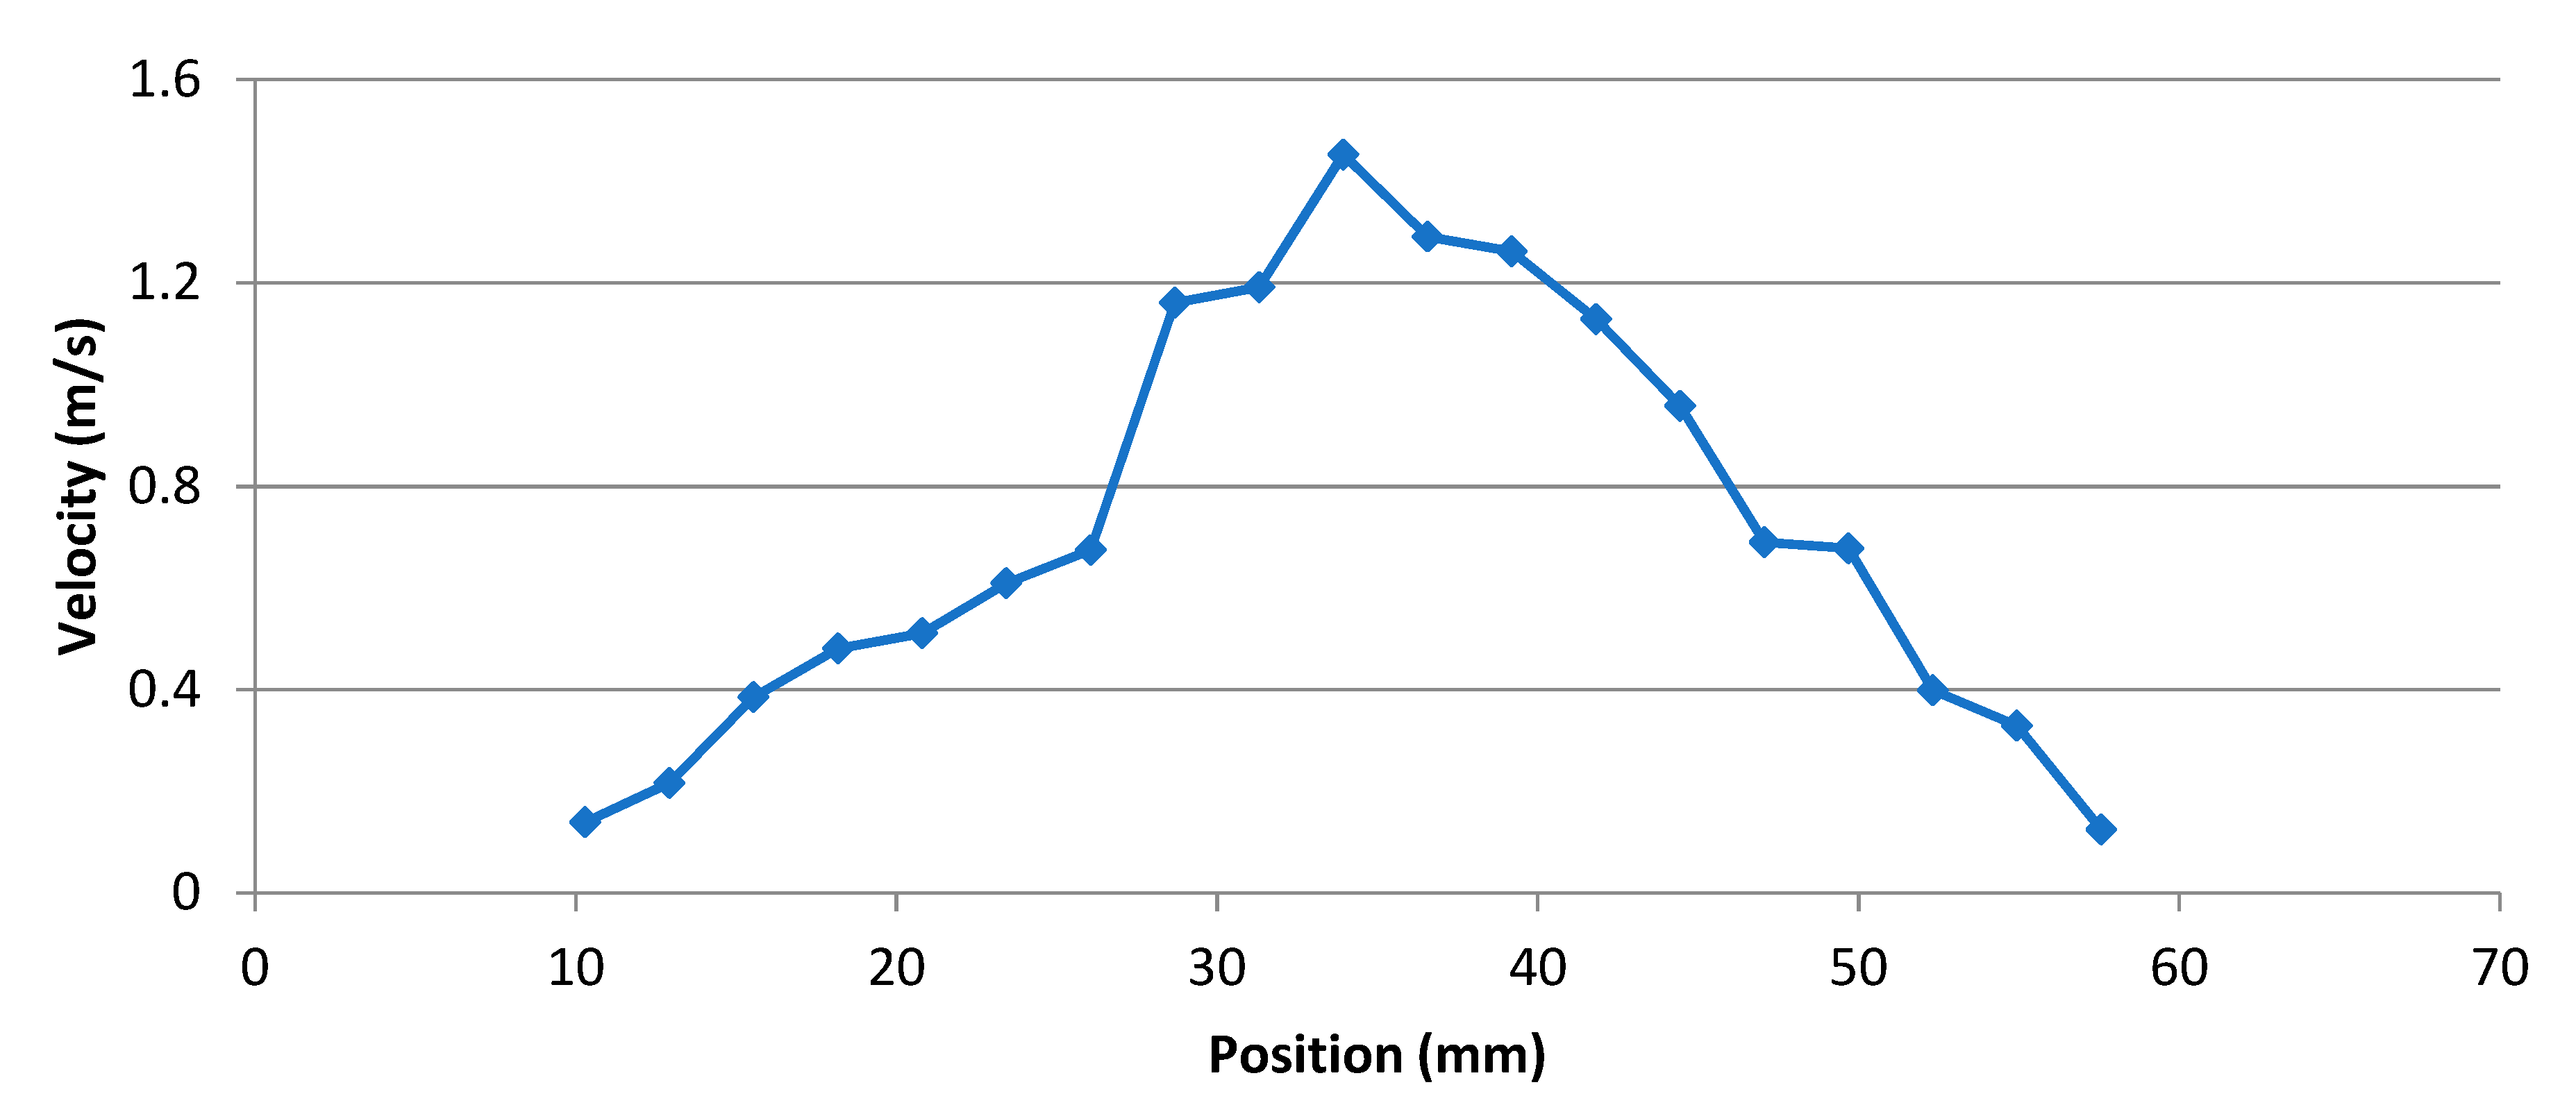
It is also interesting to note that the measured airflow is mostly focused in the center of the tube around the axis. This was further proven by the velocity profile of the examined airflow at a distance of 40 mm from the bottom edge of the EHD generator, as can be seen in
Figure 10. From this velocity profile, the approximate volumetric flow rate
Q as 0.9 dm
3·s
−1 was calculated. This value is indeed interesting for practical applications of the EHD flow generator, since the volumetric flow rate in the range of liters per second is not negligible and can be used, e.g., for the cooling of an individual power electric component.
6. Determination of Ozone and Nitrogen Oxides in the Generated Airflow
Because the airflow is generated using high voltage, it can be expected that it may contain harmful chemical products, especially ozone (O3) and nitrogen oxides (NOX). To measure the concentrations of both products, the following procedures were used.
The sampling conditions and the method of determination of ozone were based on the Occupational Safety and Health Administration [
19] method. The air sample was collected using a pump sampling probe, passed through two glass fiber filters impregnated with sodium nitrite (together with potassium carbonate and glycerine) at a flow rate of 200 mL·min
−1. Each filter was analyzed separately using ultraviolet molecular absorption spectrometry (UV-MAS) [
20], specifically the UV–VIS spectrometer PerkinElmer model Lambda 25. The entire ozone concentration measurement was performed twice in immediate succession.
The method used for the determination of nitrogen oxides was based on the methodological regulations of the Office of Public Health. The sampled air was sieved through an oxidation cartridge to ensure oxidation of the other nitrogen oxides to nitrogen dioxide. The nitrogen dioxide was subsequently absorbed in two series-connected frit impingers. Each impinger contained 10 mL of absorbent solution (containing 15 g of triethanolamine and 3 mL of n-butanol in 1000 mL). The nitrite formed was subsequently determined photometrically.
The measured concentration of ozone was 4.5 ± 0.4 µg·m−3. The US health exposure permissible limit for ozone is set to 200 µg·m−3. The measured concentration of nitrogen oxides was below 10 µg·m−3. The health exposure permissible limit for nitrogen oxides is set to 20 mg·m−3. It is obvious that in both cases, the generated products are well below the permissible limits. However, it is very important to emphasize that even minuscule amounts of ozone over a long time period can have detrimental effects on many technical materials (especially polymers), even if they pose no health hazards.


 ,
, 


