1. Introduction
Particle image velocimetry (PIV) is an optical method for velocity field measurement. The principle of the technique is the pulsed illumination of tracer particles from which velocity vectors are calculated in sub-regions called interrogation windows according to the change in particle positions between exposures [
1,
2]. Illumination is usually performed with a laser that creates an illuminated plane: planar and stereoscopic PIV [
3] or volume: 3D PIV [
4]. The acquired data must have a sufficient signal-to-noise ratio (SNR) [
5]. The favorable SNR requires a unique approach to prepare the experimental model so that the light scattered by tracer particles has the highest light intensity on the recording and negative optical phenomena such as reflection and refraction are eliminated. There is also a risk of camera sensor damage due to the high intensity of the reflected light [
6].
Wieneke [
7] explained several sources of uncertainty generated in the data acquisition process that decrease the SNR, for example, timing and synchronization errors, perspective errors, camera noise, etc. Xue et al. [
5] described a quantification of PIV measurement uncertainty directly from the information in the cross-correlation plane, i.e., the correlation plane obtained from the double frame mode record. The cross-correlation plane is the distribution of probabilities for image pattern displacement in the interrogation window. On the horizontal axes, there are coordinates of the interrogation window in pixels. The vertical axis represents signal and noise strength. In every interrogation window, only one primary peak represents the signal strength, and its position within the evaluated square determines the size and direction of the flow velocity vector. There are also many smaller peaks representing unwanted digital and optical noise. The basic way to determine the SNR is the primary peak ratio (PPR) method [
8]:
where
cmax is the primary peak height and
c2 is the height of the second-highest peak. The PPR of ideal data approaches infinity. Conversely, if the cross-correlation plane contains only noise, the PPR equals one. For quality results, the primary peak must have sufficient height separation from the noise and adequate width of the primary peak. It can be achieved using an appropriate experimental setup, correct saturation density of tracer particles, and appropriately chosen digital corrections of image data.
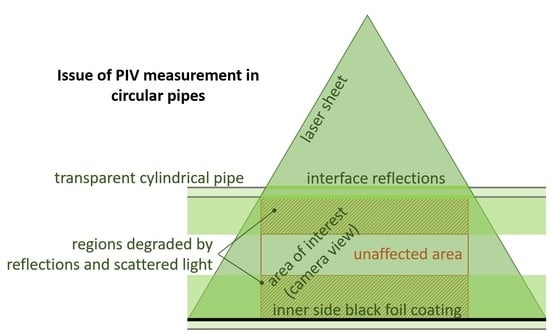
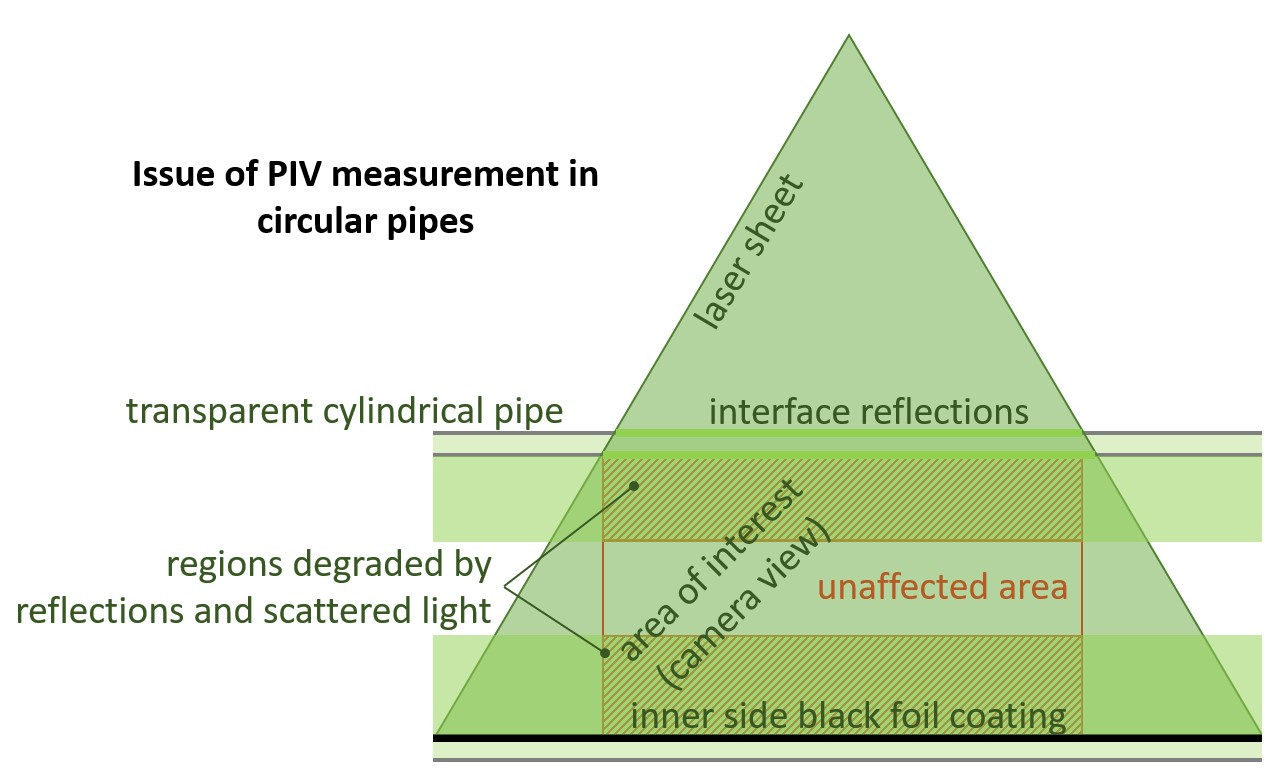
The method of illumination of the measuring plane must be taken into account. If the geometry arrangement does not allow the position of the laser sheet source axially, then it is necessary to illuminate the cylindrical experimental chamber radially. However, passing laser light through the cylindrical wall brings many complications, e.g., reflections and scattering. At both interfaces between the transparent cylindrical wall and air, the laser beams are refracted and transmitted through the internal structure of the wall to unwanted locations. Kong et al. [
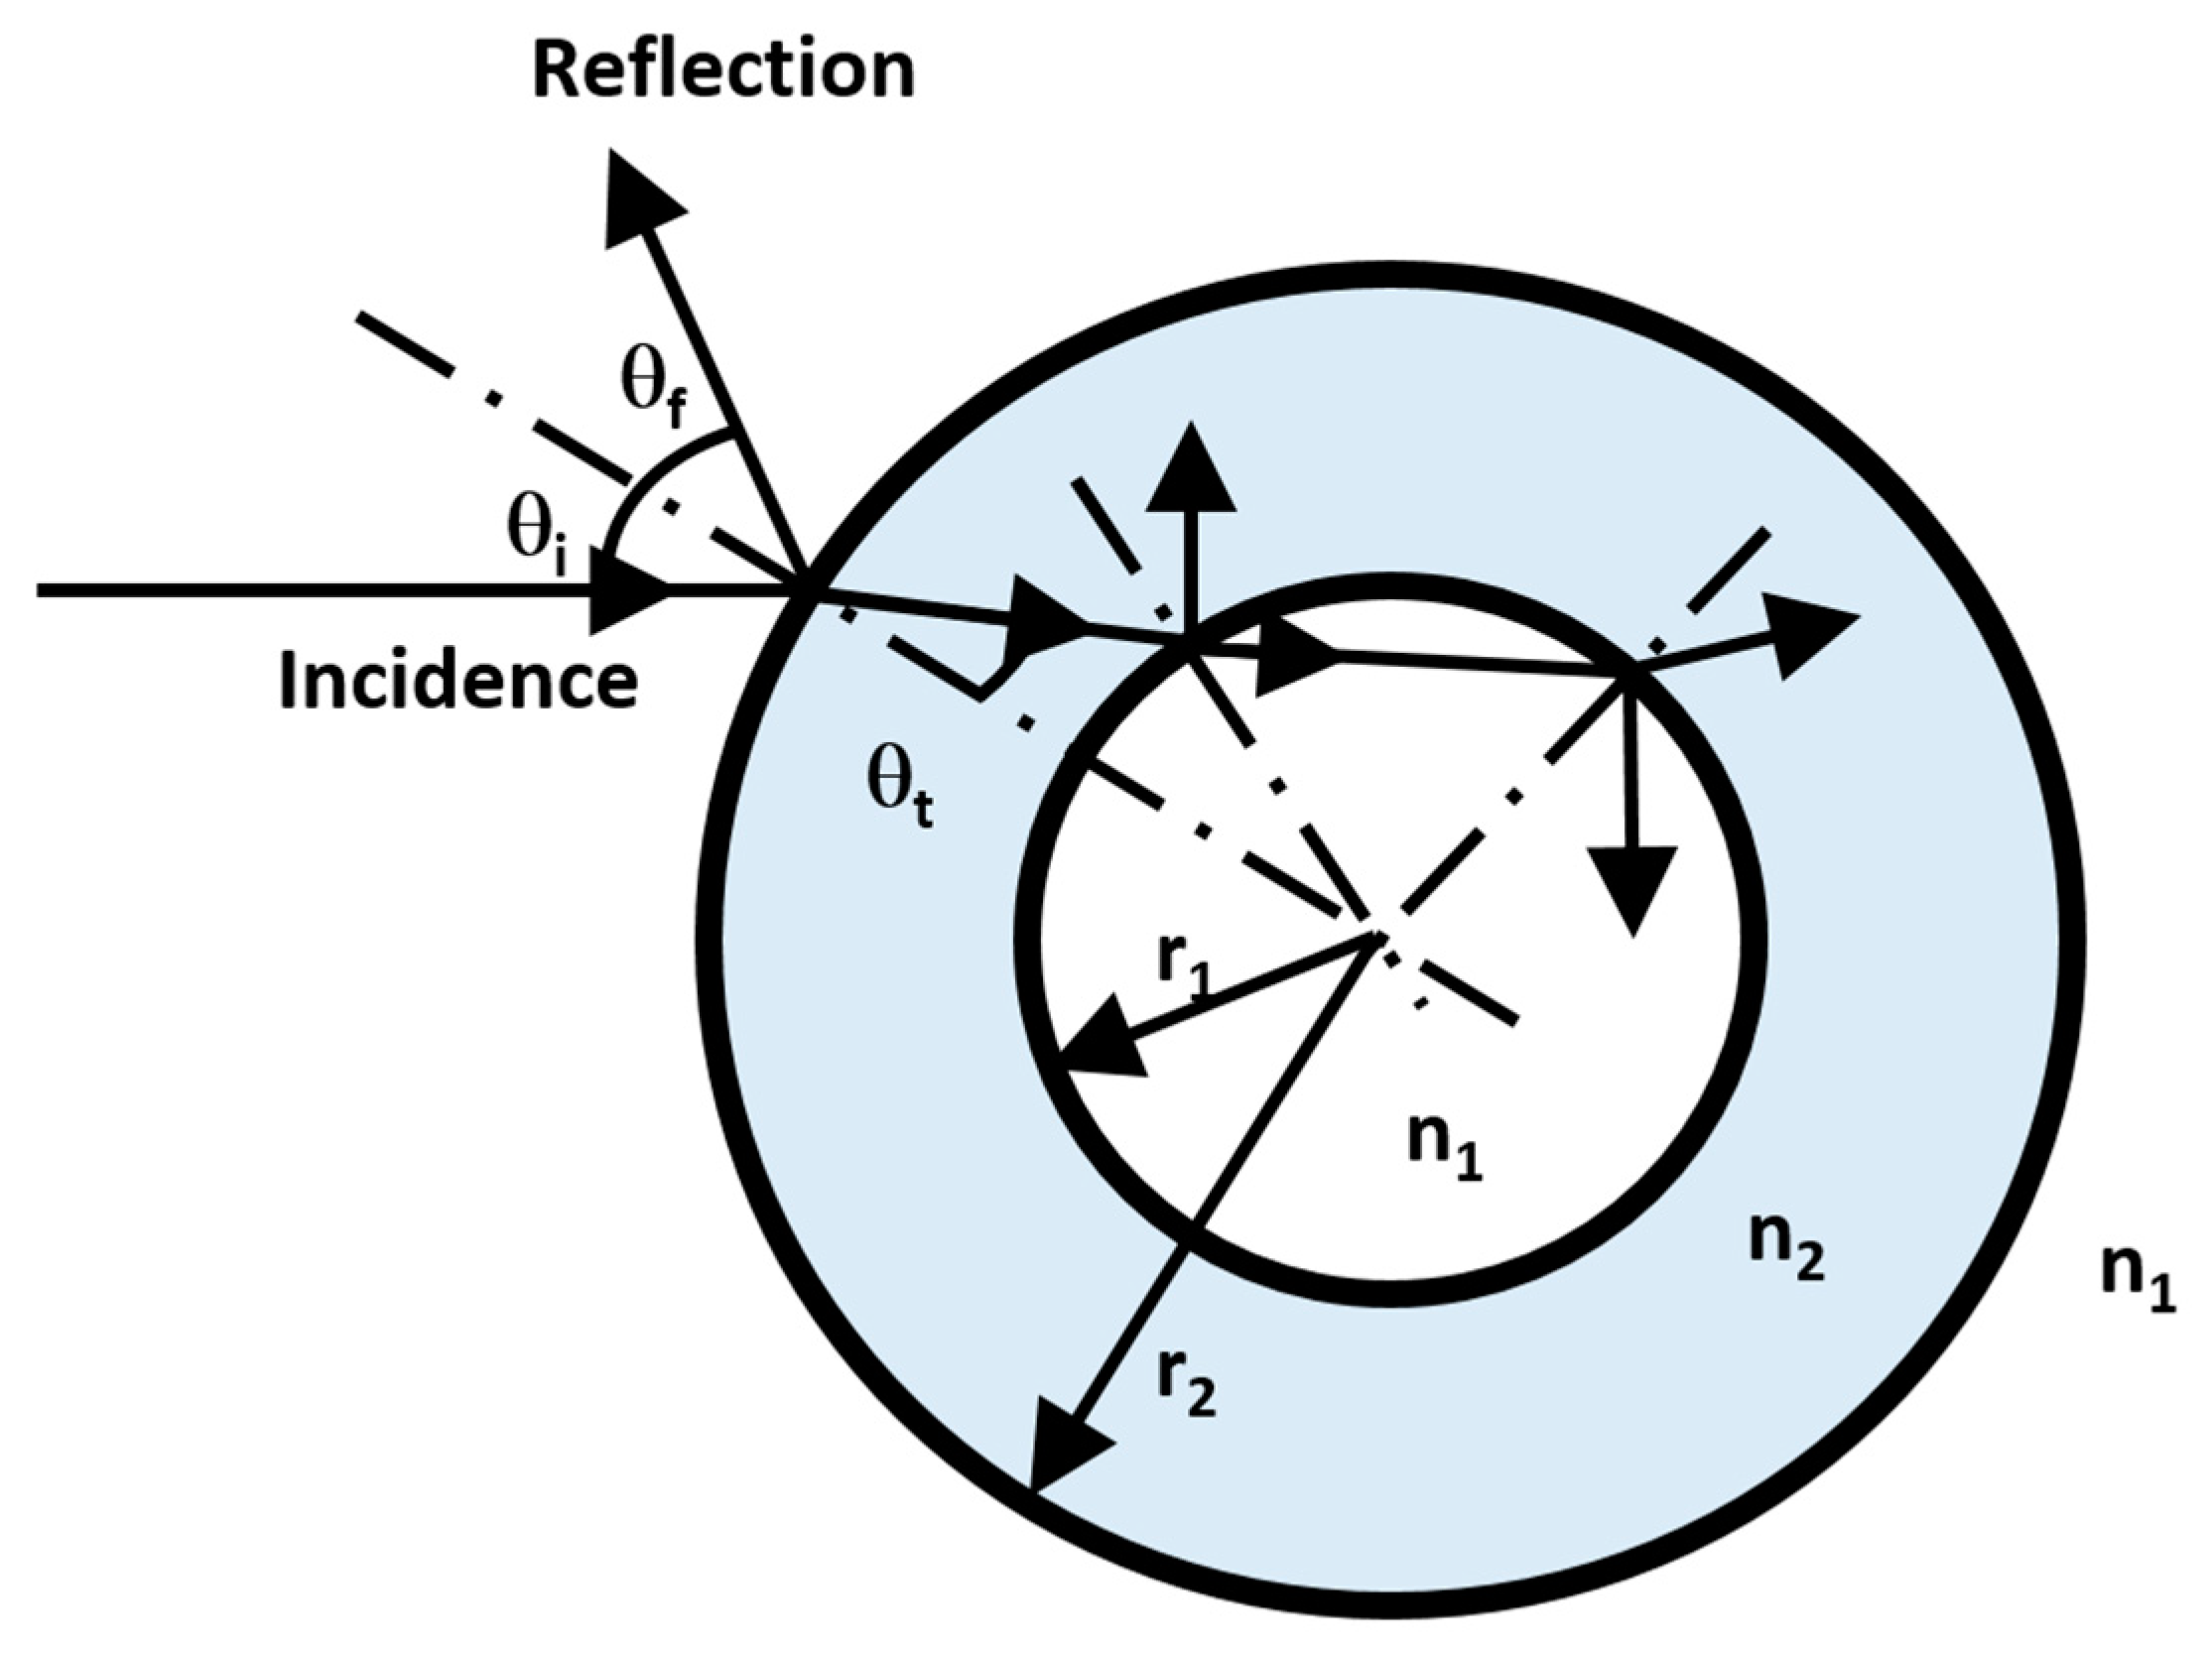
9] published a study of light beam transmission through a cylindrical wall. As
Figure 1 shows, the incident beam perpendicular to the axis of the pipe is divided into a reflection part and a transmission part at the interfaces of a hollow cylinder of inner radius
r1 and outer radius
r2. There is an assumption of wall refractive index
n2 and refractive index of the environment outside wall
n1. The angles of incidence
ϴi, reflection
ϴf, and refraction
ϴt at the first interface are also shown.
In [
9], Kong measured and calculated the intensity of diffused light around the circumference of the pipe in polar coordinates. In the case of incidence, the angle
ϴi = 0°, and the data showed the clearly readable central peak between −30 and 30 degrees caused by the direct passage of the laser beam through all interfaces. There is also a secondary peak region in ±(35 ÷ 60)°. This effect can adversely affect the quality of PIV data and needs to be eliminated.
A solution that partially eliminates negative optical effects is to subtract the unchanging background from the measured data. This software solution is helpful for the accurate calculation of the vector fields but is often insufficient because it does not eliminate the amount of light incident on the camera sensor. This light can be destructive to the sensor. A detailed description of this pre-processing method has been discussed, for example, by Adatrao and Sciacchitano [
10], Theunissen et al. [
11], and Deen et al. [
12].
Using a similarity theory is a suitable method to replace the gas medium with liquid. A liquid medium allows the use of PMMA particles with the fluorescent dye Rhodamine B designed for the micro-PIV application. A camera with a suitable optical filter then records only the wavelength that the particles emit, which was used by Lindken [
13], for example. Due to the high cost of the particles, Warjito et al. [
14] investigated alternative particles made of resin and Rhodamine B. However, replacing gas with liquid brings other problems. In addition to the increased demands on the tightness of the track, there is high refraction of light during the transition from a gaseous environment to a liquid medium, and it causes significant distortion of the acquired data. Efforts for its elimination led to the use of optical prisms. In the case of a circular pipe, this means embedding the channel in a flooded block, such as in the works of He et al. [
15], Wang et al. [
16], or Chang et al. [
17].
The way that the reflection can be significantly reduced is generally by using the appropriate choice of materials and coatings. Depardon et al. [
18], in their study of a flat-plate boundary layer, have used a fluorescent paint based on Rhodamine 6G. In the reflection from the wall, there is then a reduced intensity in the wavelength of the laser light. Paterna et al. [
6] then investigated the influence of other coatings and materials. Bisel et al. [
19] demonstrated the positive effect of Rhodamine 6G coating on the 3D PIV experiment.
Recently, a paper by Novosád et al. [
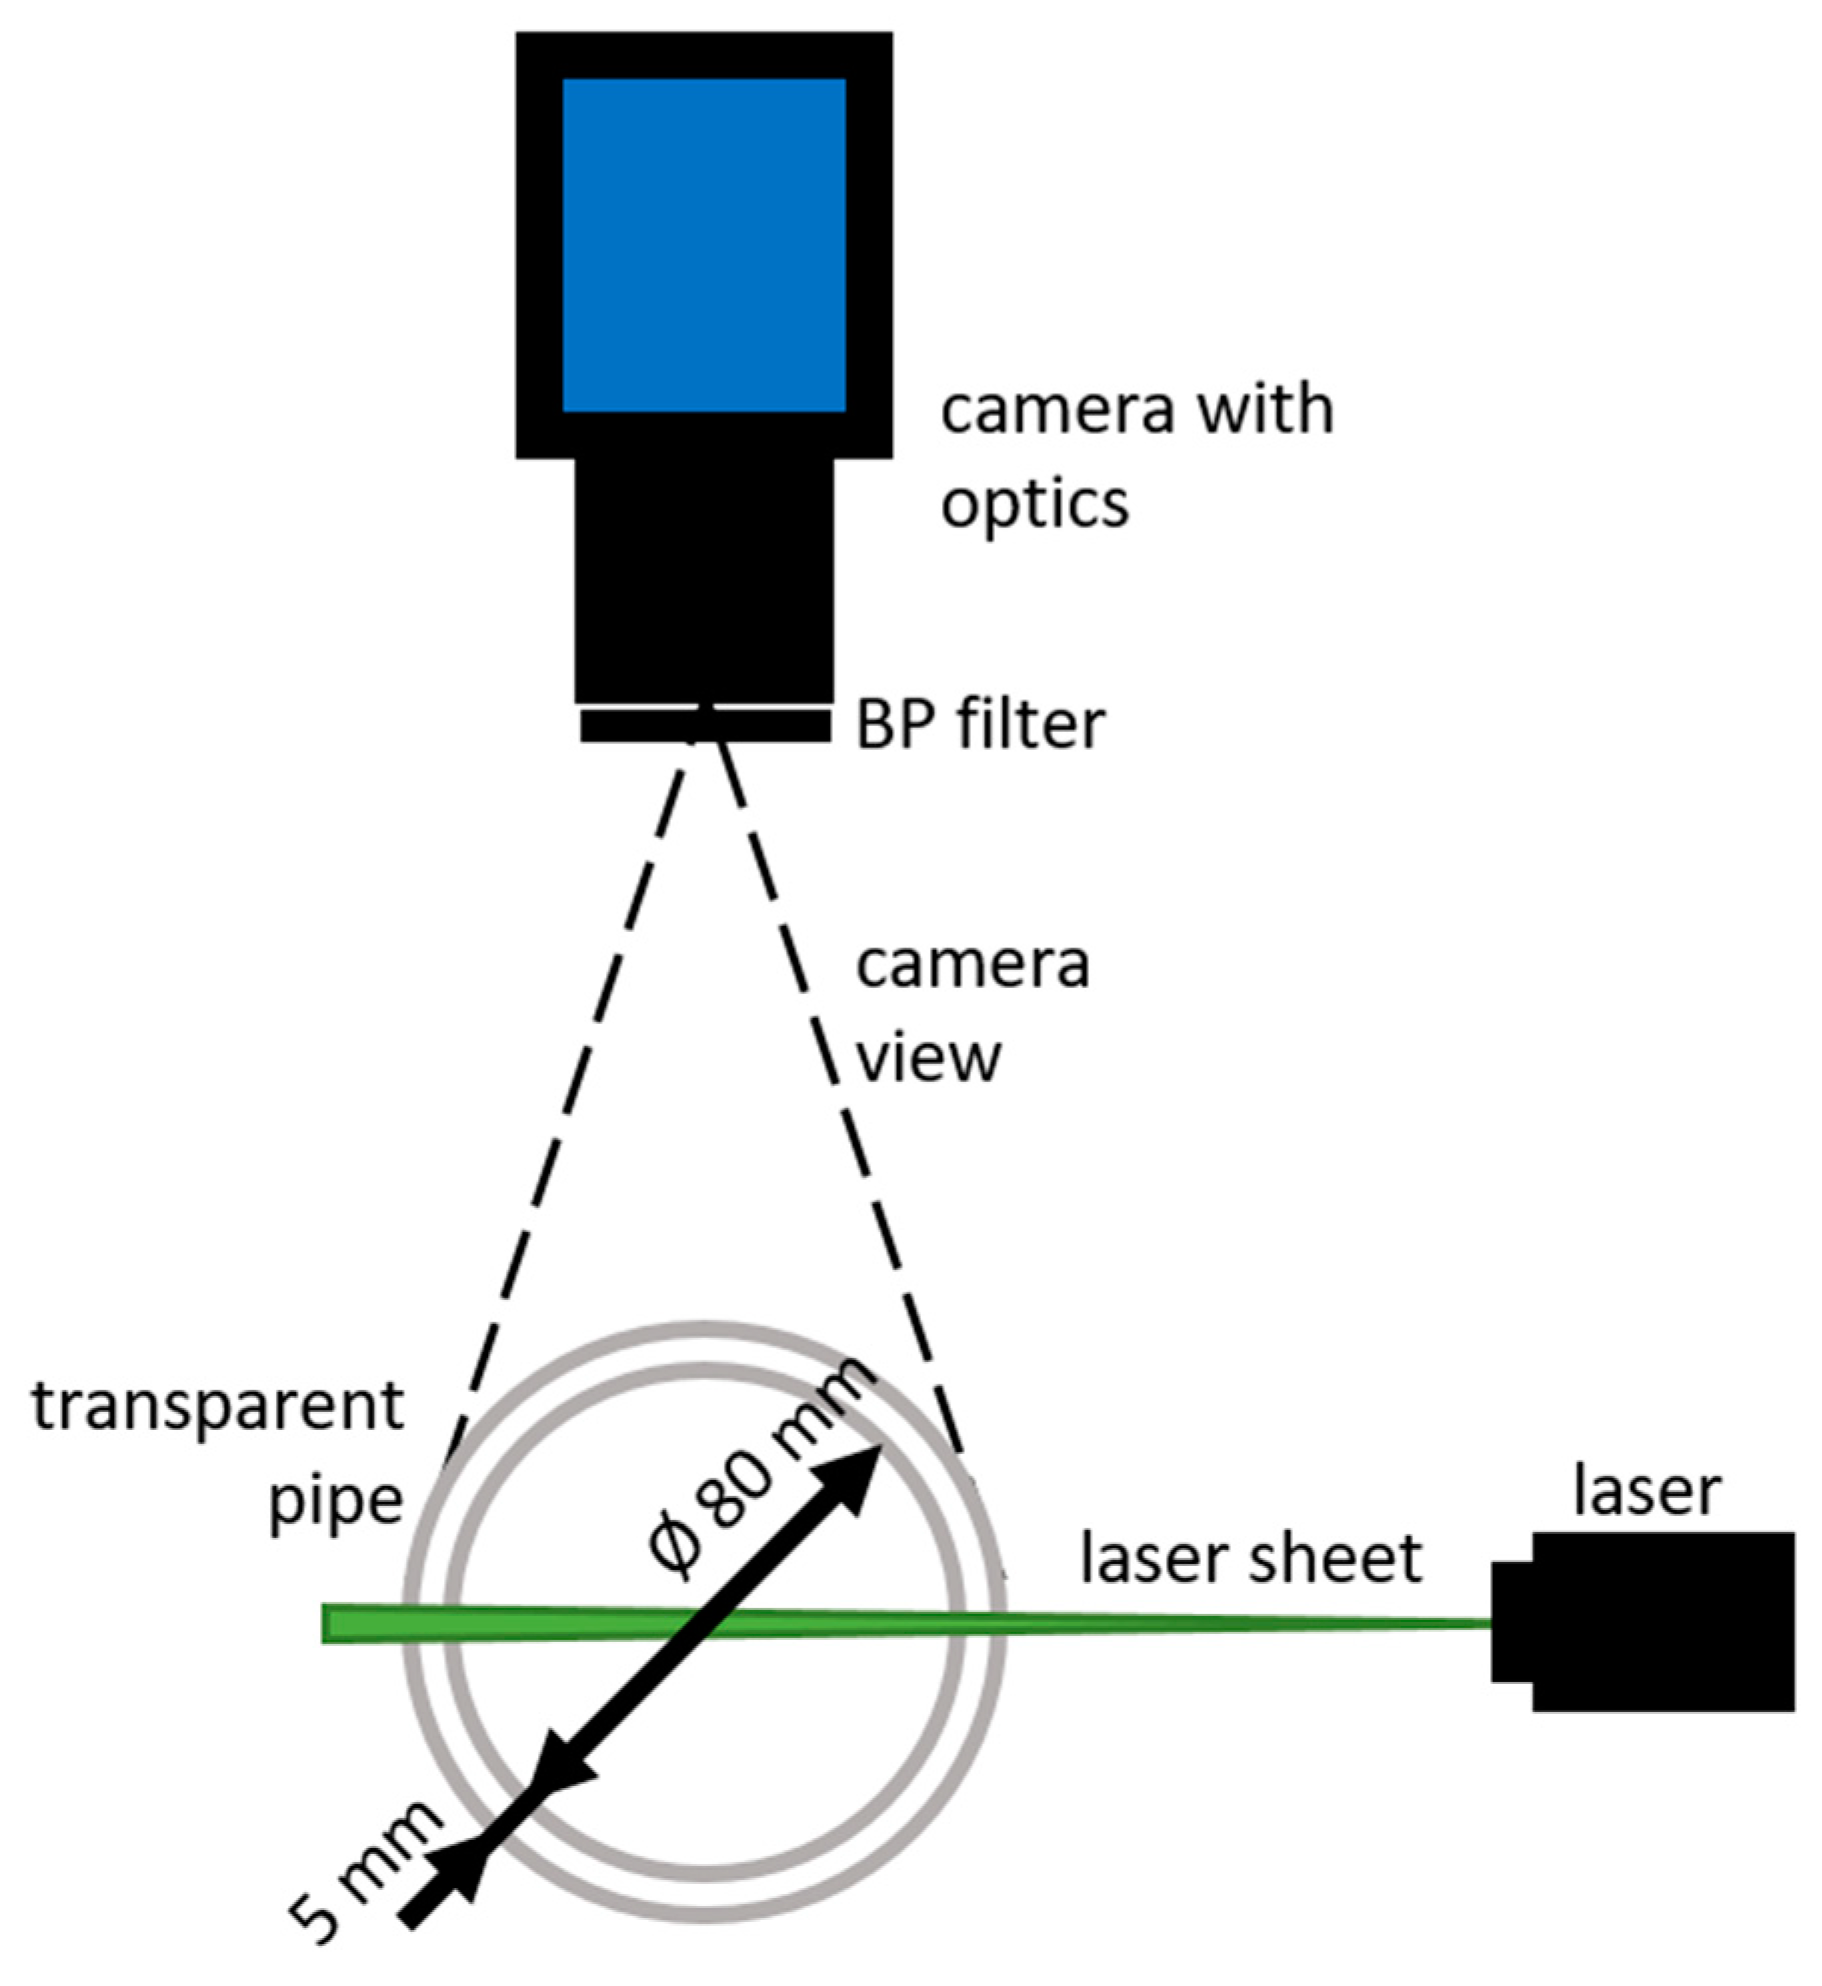
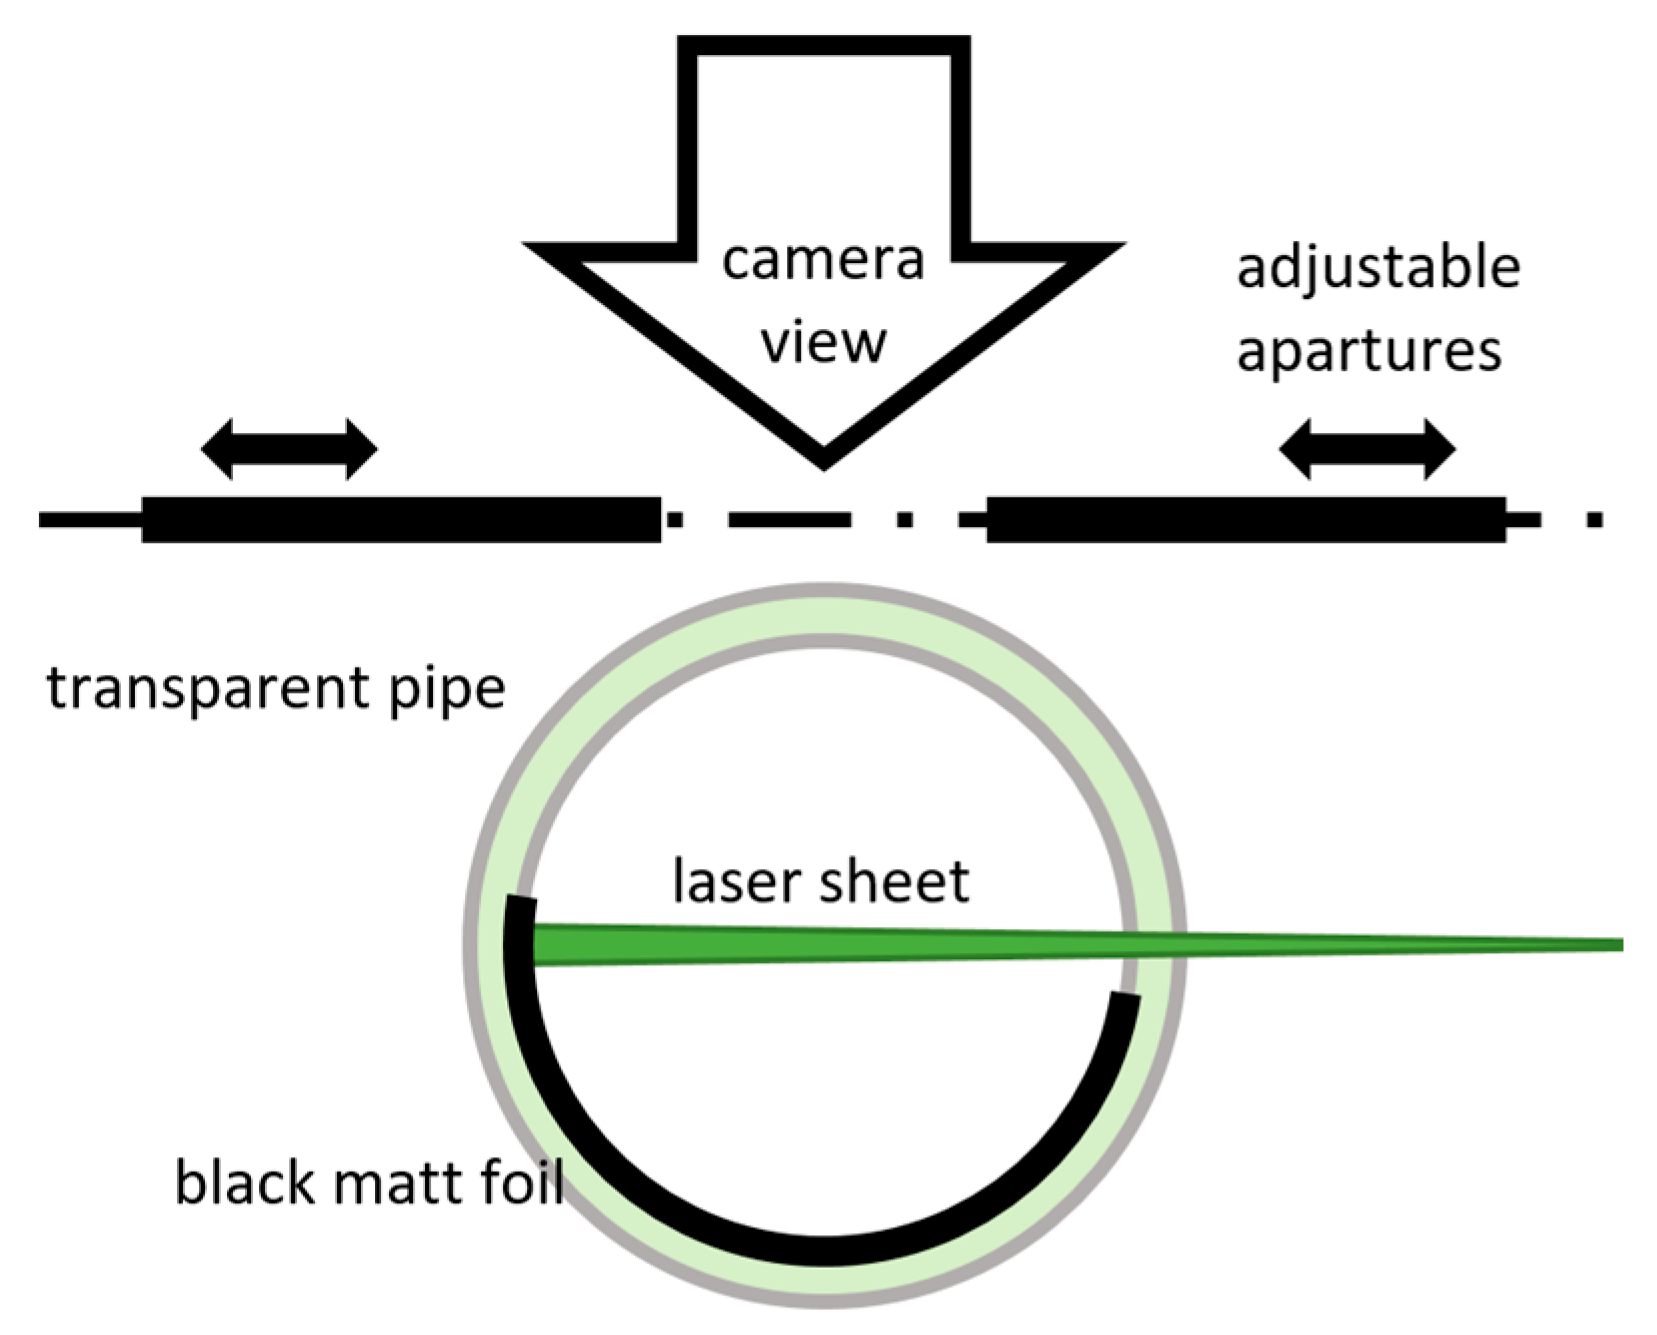
20] was published to verify the applicability of the PIV method for measurements in a DN 80 circular pipe as a part of the currently developed ultrasonic gas meter. This experimental model was based on the inner gas meter channel geometry, which consists of a system of straight pipes, elbows, and flow conditioning segments. The innovative geometry was designed to ensure suitable conditions for ultrasonic measurement in the straight pipe, especially the stability of the velocity profile. PIV measurements have been used for the validation of the velocity profile. The target area was made of straight plexiglass pipe with some but insufficient modifications. The inner backside from the PIV camera view was just taped over with a black matt film. An adjustable aperture blocked the adverse reflections. This measuring arrangement showed significant limitations because the measurable cross-section had thus been considerably reduced.
A very similar issue was recently solved by Wangxu et al. [
21]. They measured natural gas flow in a DN 100 straight pipeline using 2D PIV. They chose to coat the inside away from the camera with black matt spraying. This modification produced better results than the foil in the previous case, but there was still a large influence of scattered light.
This study aims to develop an efficient methodology for designing and manufacturing circular experimental channels for various applications of internal aerodynamics measurements. The main goal is to improve the methods for experiment preparation used previously [
20]. The work includes surface sample measurements and a subsequent PIV experiment in a circular pipe.
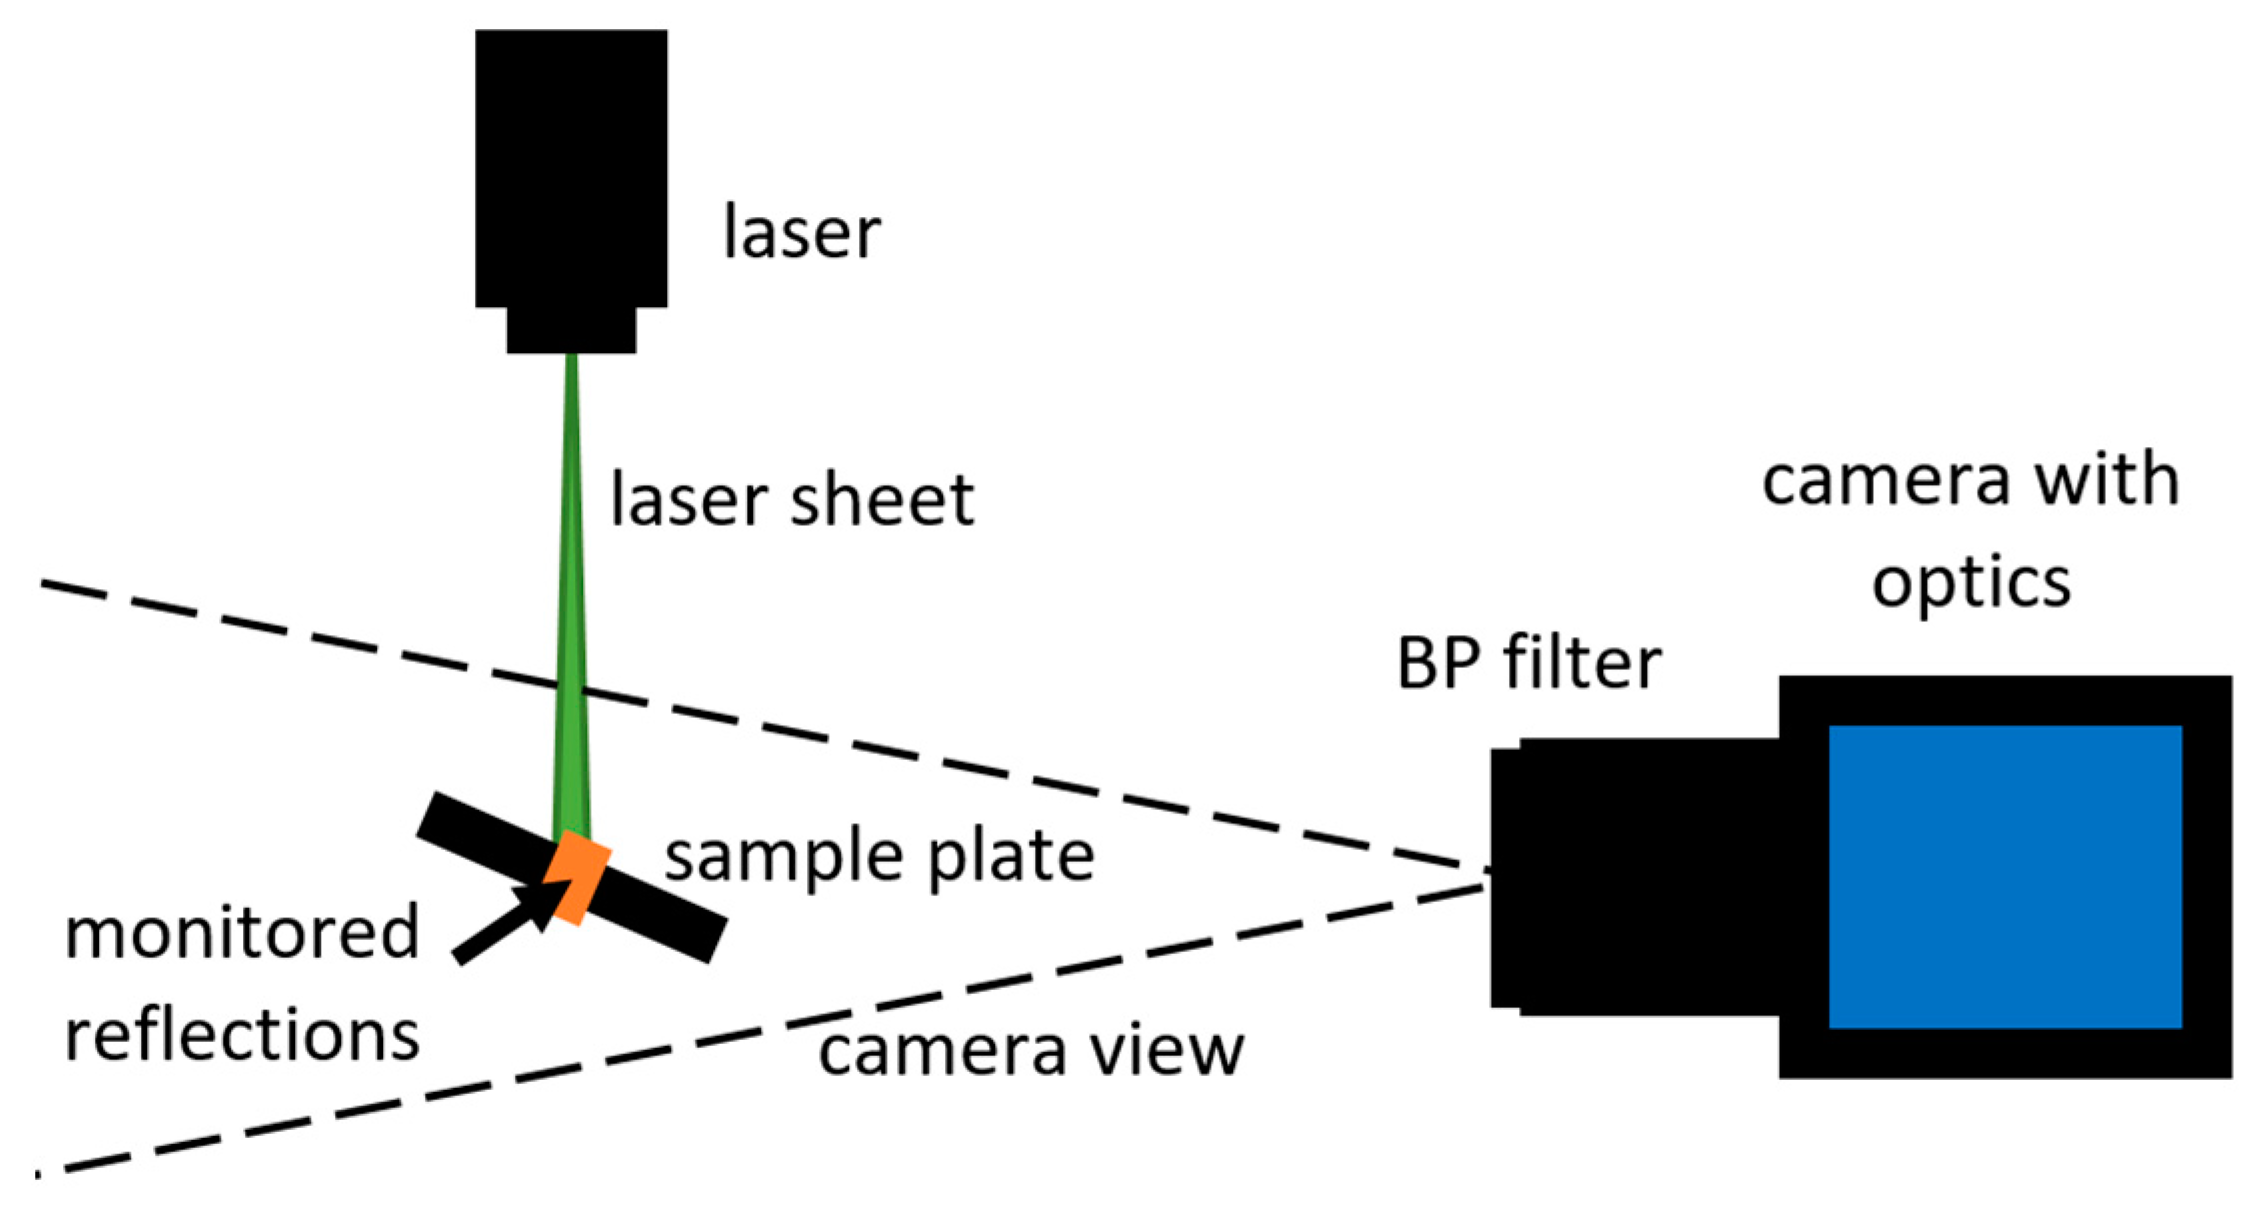
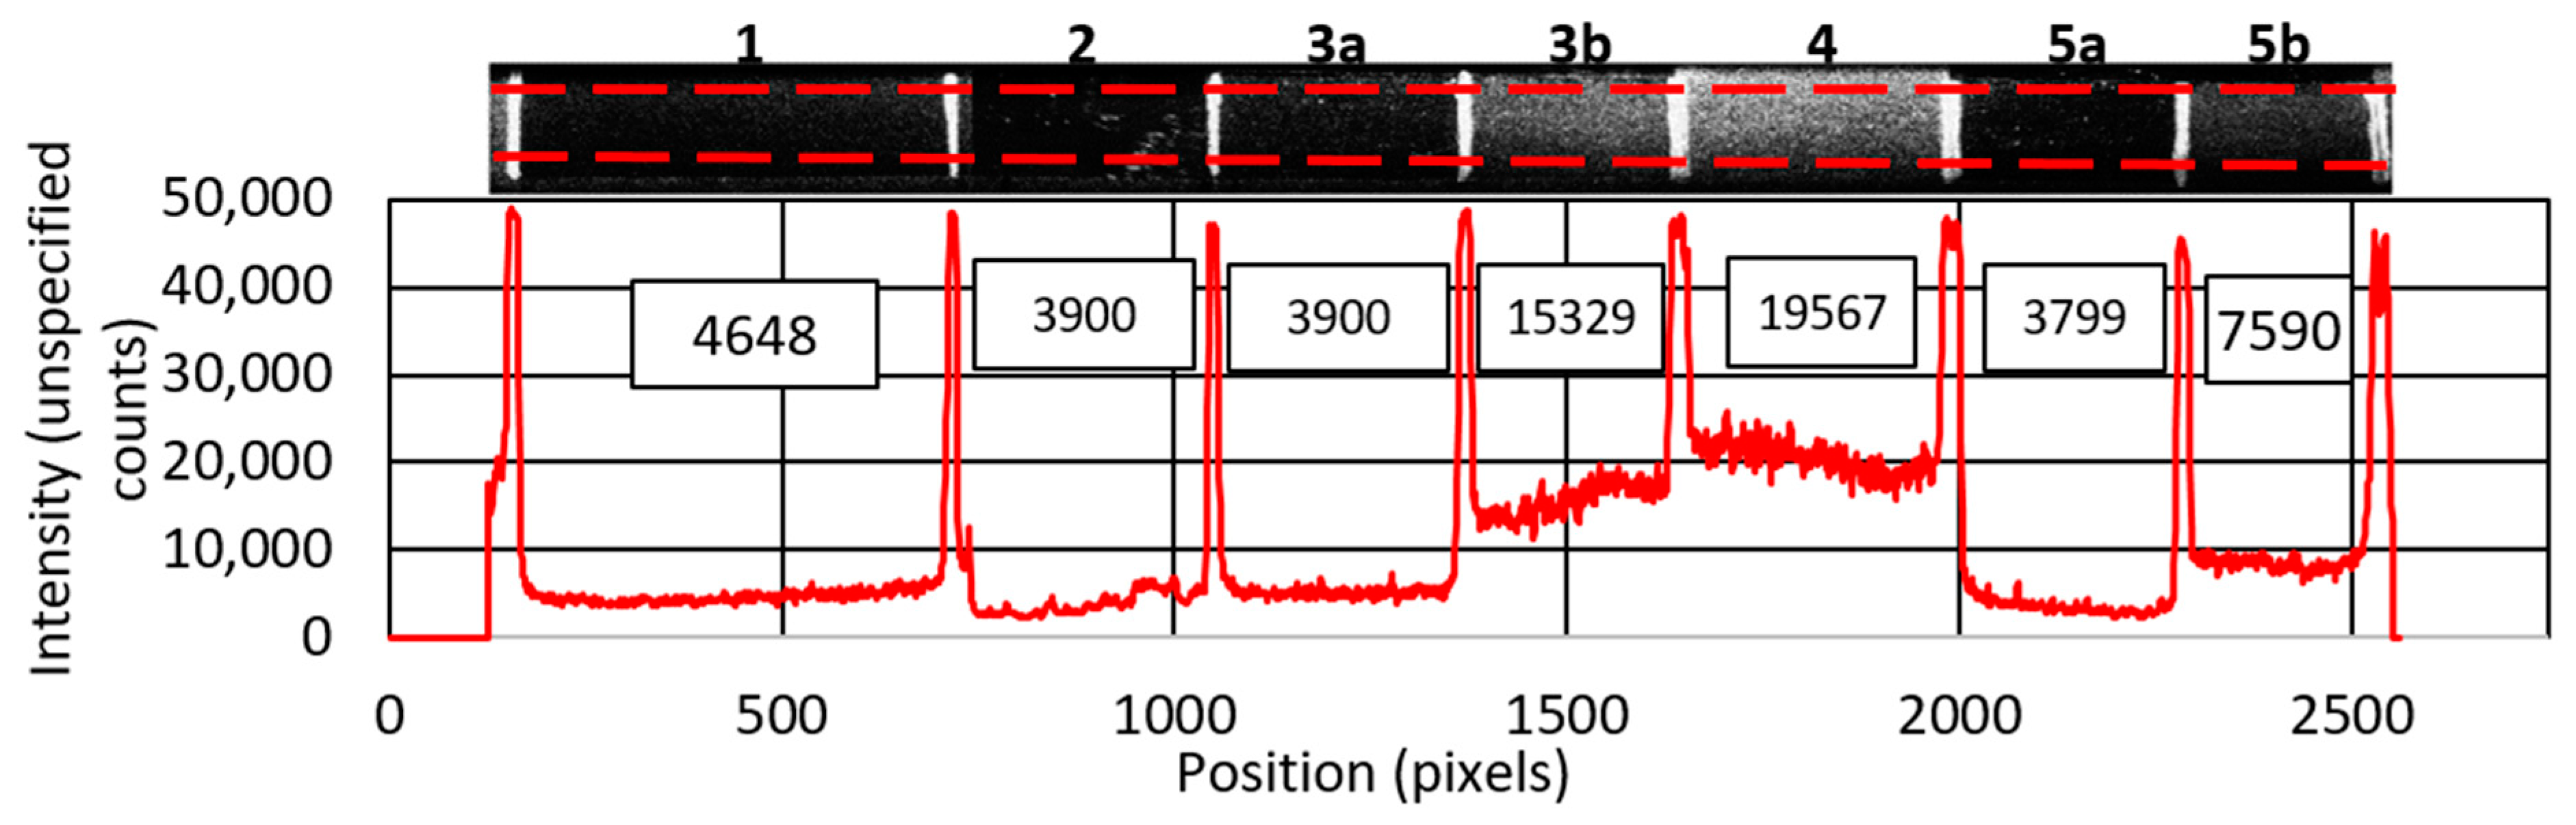
4. Results of Surface Finish Samples Measurement
In
Figure 4, you can see a graph of intensity along the sample plate. The red curve symbolizes values of light intensity obtained from the average values between the red dashed lines. Peaks with values above 45,000 are reflections of the sample plate’s dividing marks. Above the values of each sample, the average intensity value is shown in a rectangle. It can be noticed that samples 1, 2, 3a, and 5a have the lowest value of reflected light. Samples 3b, 4, and 5b have a significantly higher value.
Sample 2, which corresponds to plexiglass without modification, has the most reduced intensity of reflections. This is due to the fact that most of the rays pass through the material. However, it should be noted that the sample plate is planar, not cylindrical. Because of the optical properties of the circular pipe mentioned in the introduction, it is, therefore, advisable to choose a surface modification that prevents the laser from passing through. Samples 5a and 5b present a similar problem because the coating is partially transparent. Sample 1, i.e., black matt spraying, is more favorable than sample 3a (the average intensity is 12% lower). However, for samples 3 and 5, it can be noticed that part b, with the roughened surface, has a significantly higher intensity than part a, which is also rough due to the technique of applying the dye with a brush. Thus, the brush application is not a suitable approach. Due to the behavior of the individual layers, a combination of black matt and Rhodamine 6G spray was chosen as the most favorable option.
6. Results and Discussion
This section describes the results obtained. Six regimes were recorded, which are described in
Table 2. Modes marked with 0 represent photographic data without seeding particles showing local reflections in the unmodified mode, as shown in
Figure 6. The letter after the number distinguishes different degrees of shielding. Modes 1, 2, and 3 are PIV shots with varying degrees of shading and eventual pre-processing subtracting the permanent background from the image and increasing the contrast between the particle image and its surroundings. It is a good practice to complete individual subtraction for each data set because of possible variable conditions between collections, for example, changing light conditions around the experiment. Measurements of modes 1 to 3 were carried out under the same flow conditions, only with the substitution of a straight, circular part.
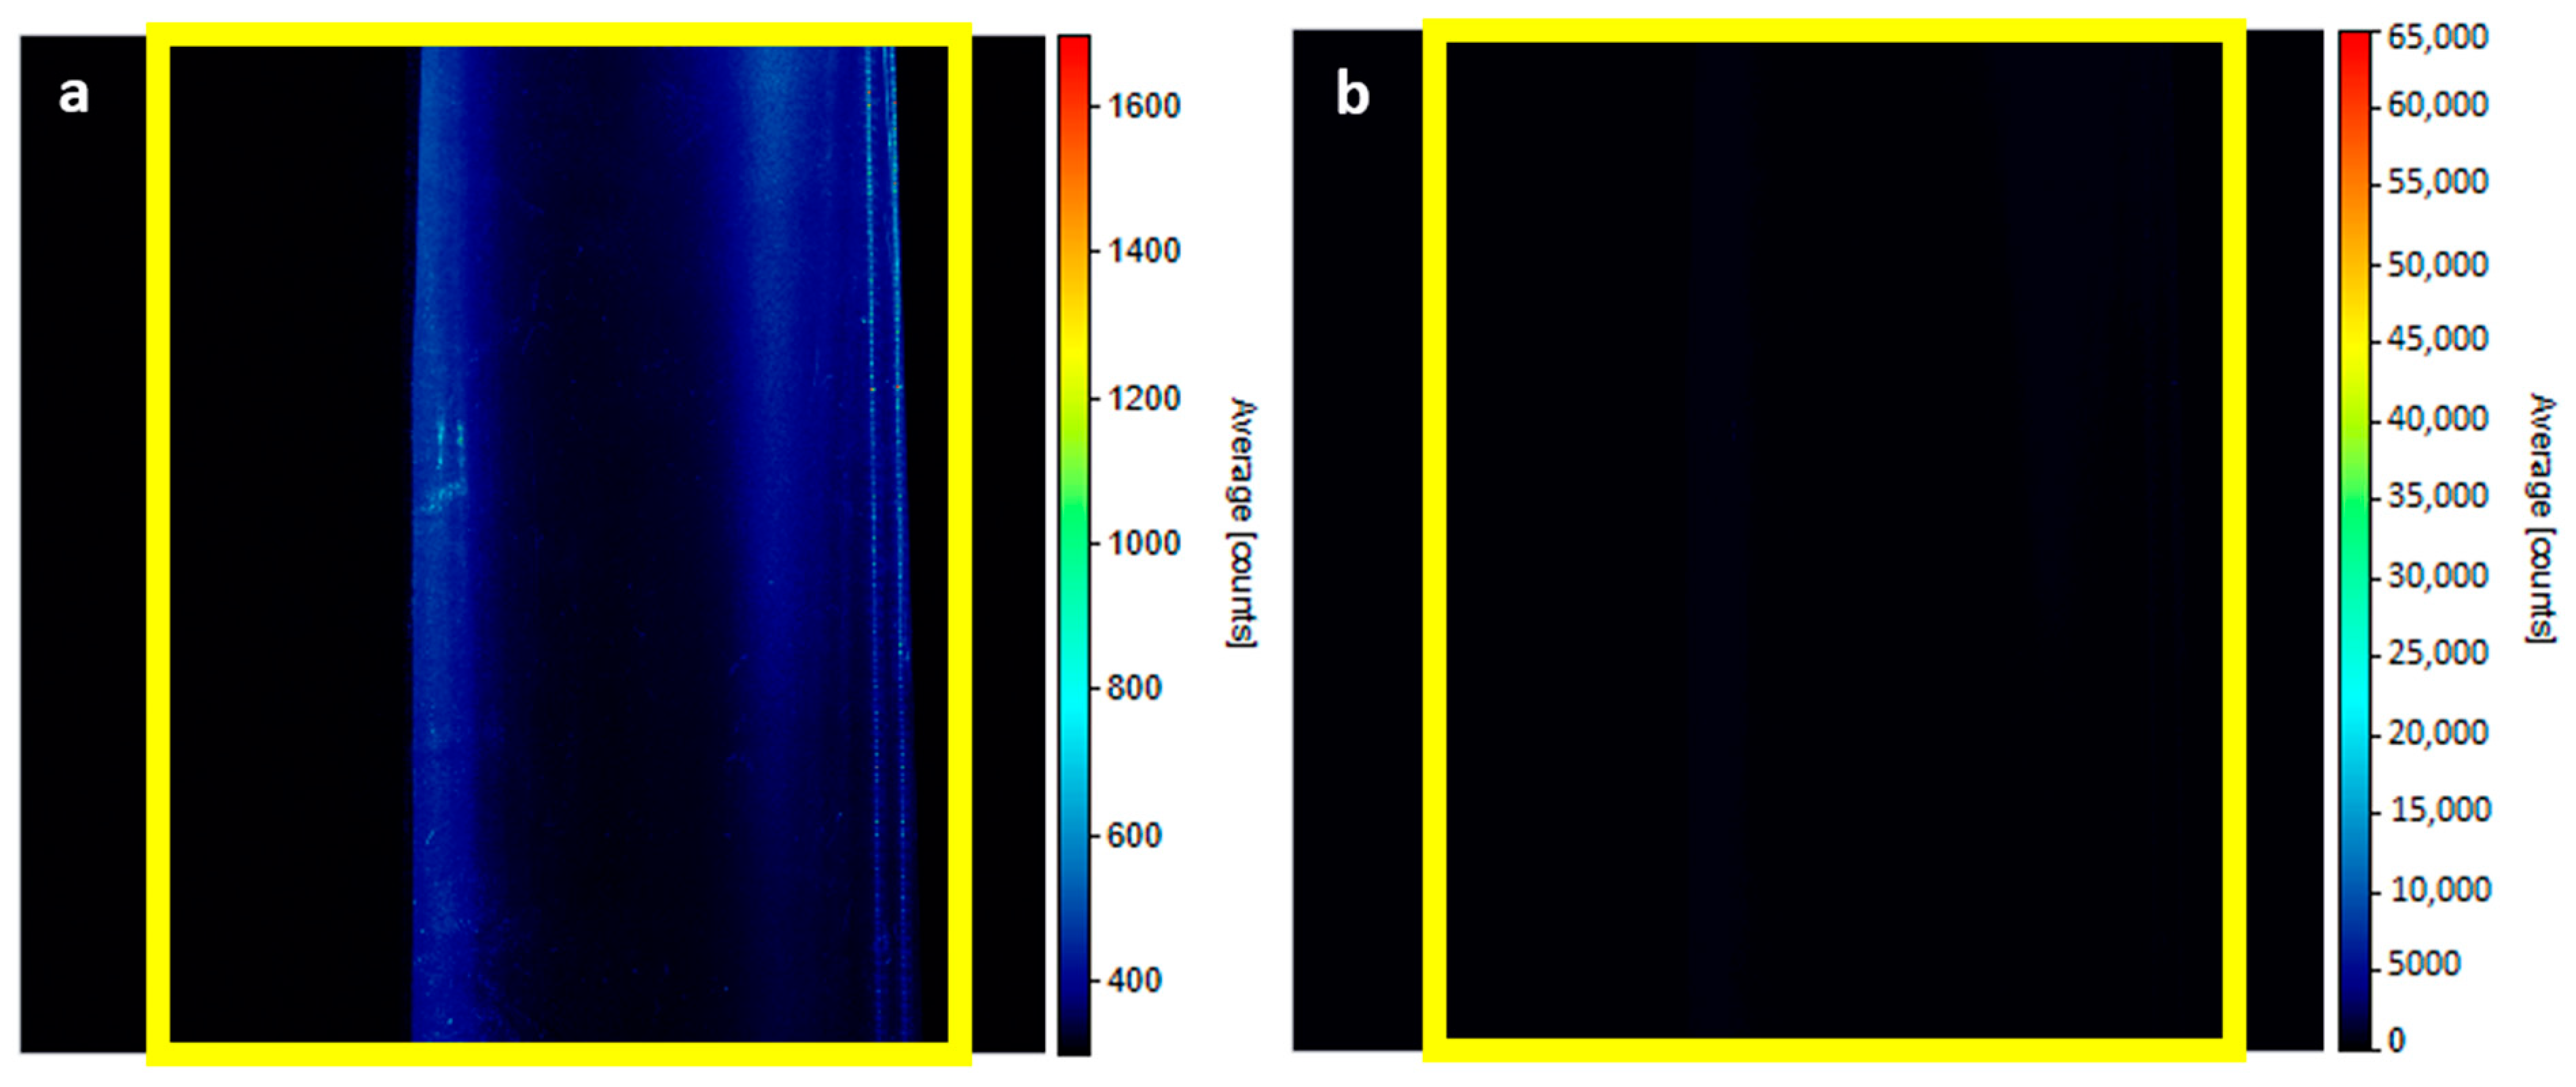
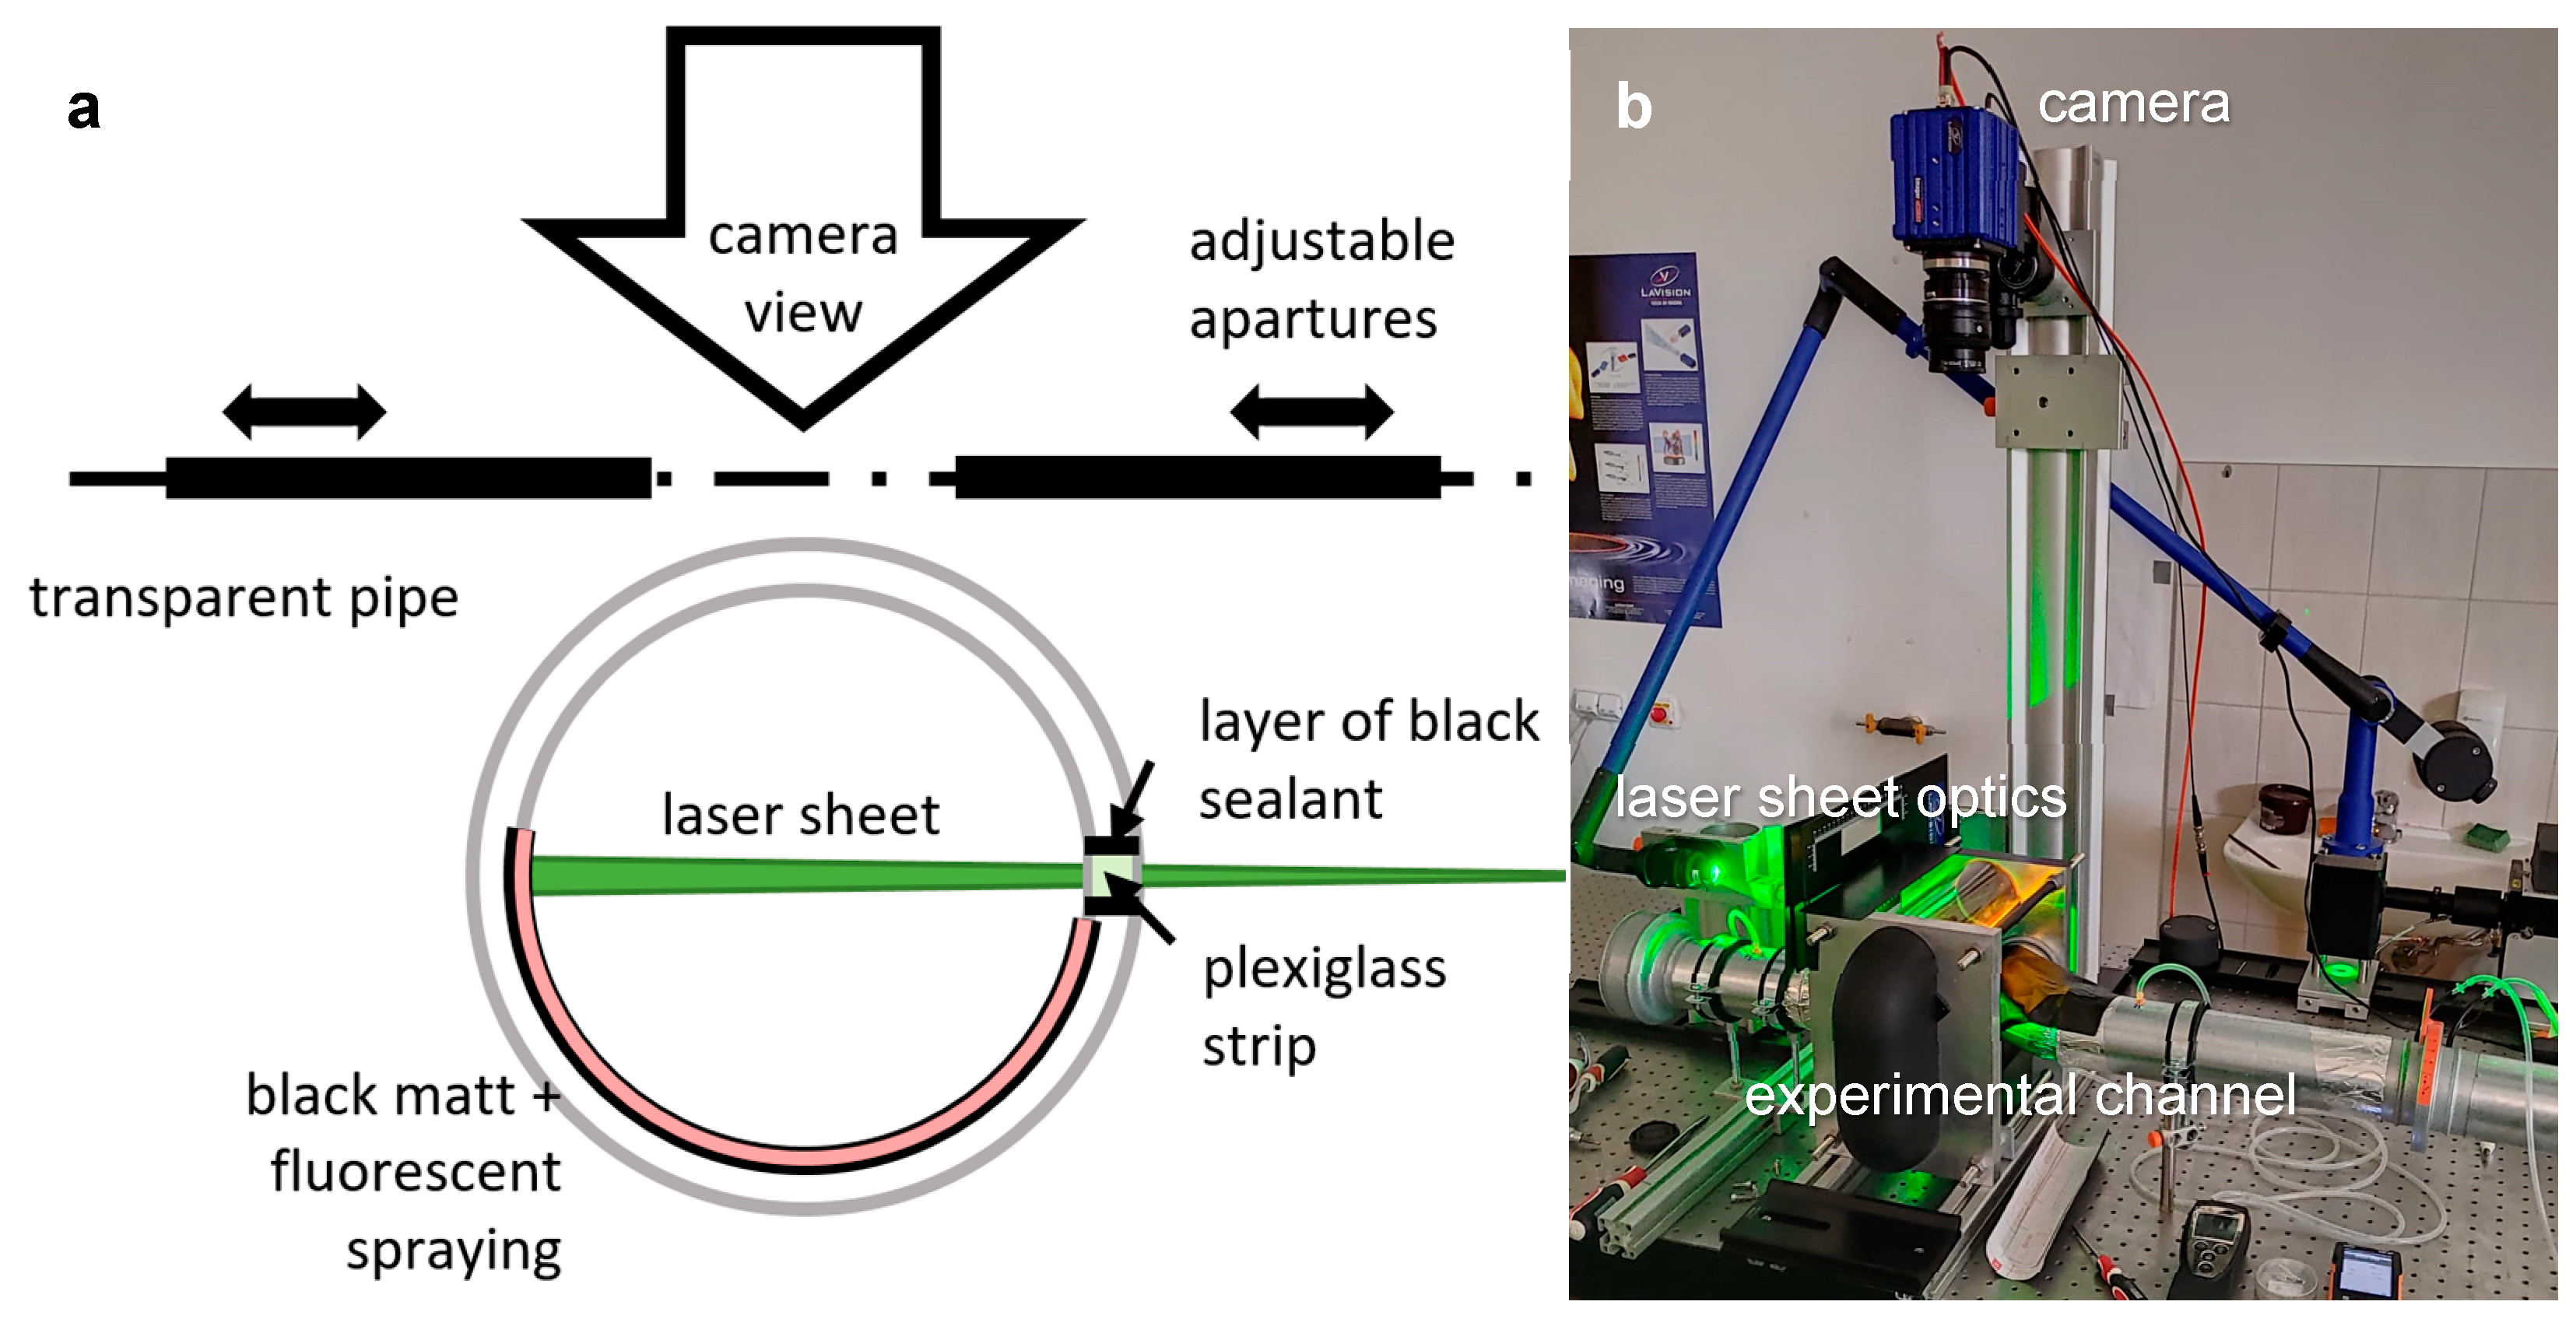
In
Figure 8, you can see the intensity map of regime 0a. Yellow rectangles define the boundaries of the pipe.
Figure 8a displays a range of intensities from 300 to 1700 units.
Figure 8b shows the full range from 0 to the sensor maximum (65,000 counts). It is possible to notice that a small area inside the measured space attacks the maximum allowed intensity even at the lowest adjustable laser power. These two small oval reflections are probably due to the phenomenon refereed by Kong et al. [
9]. Such values can only be recorded for a very short time. Otherwise, the sensor may be destroyed.
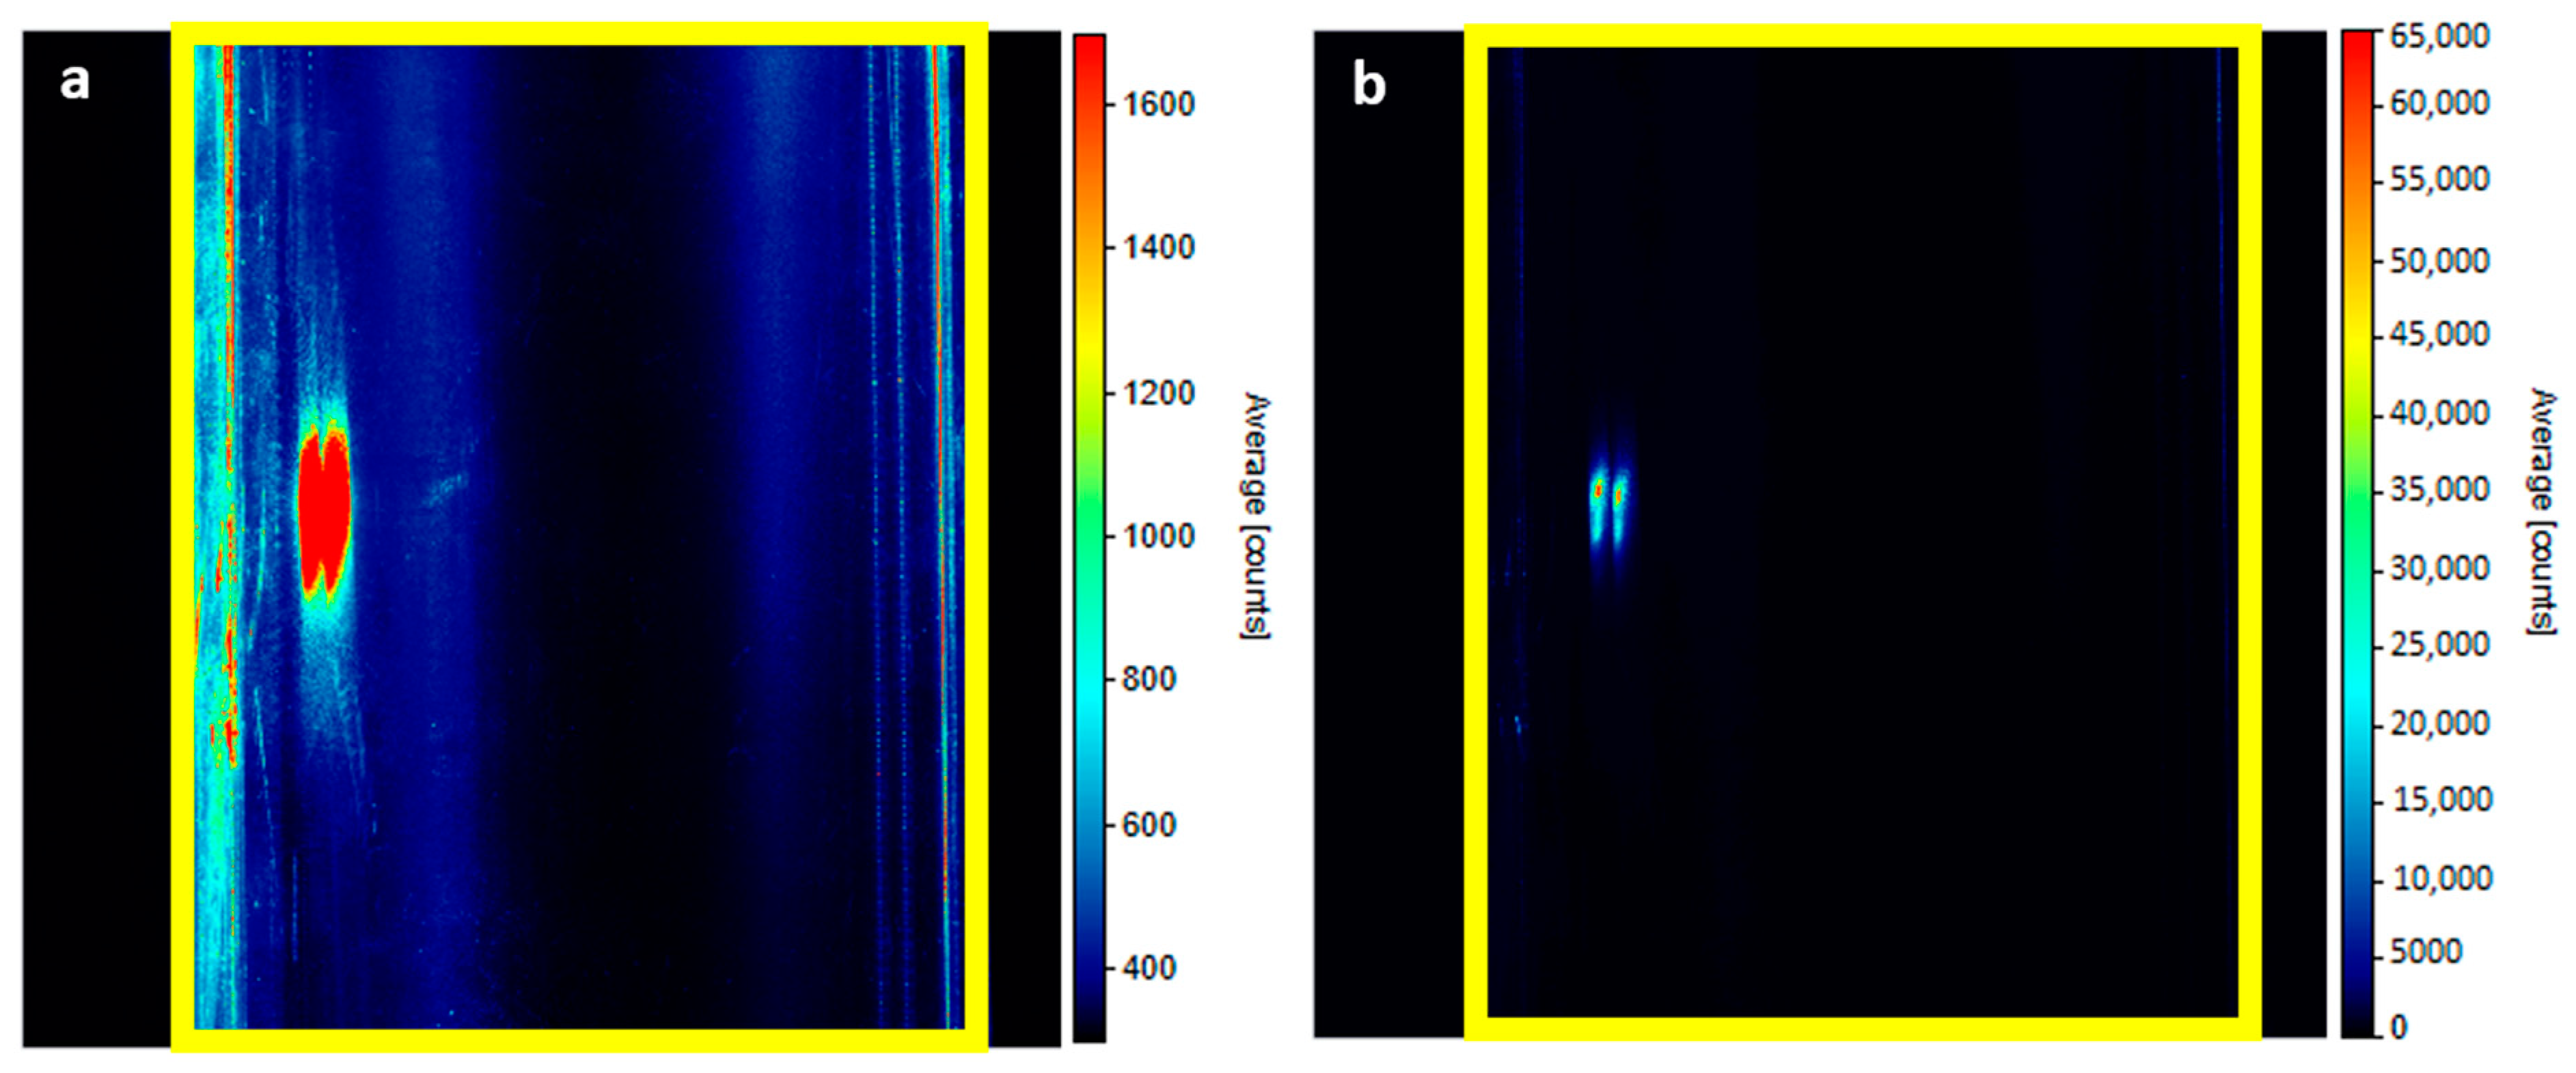
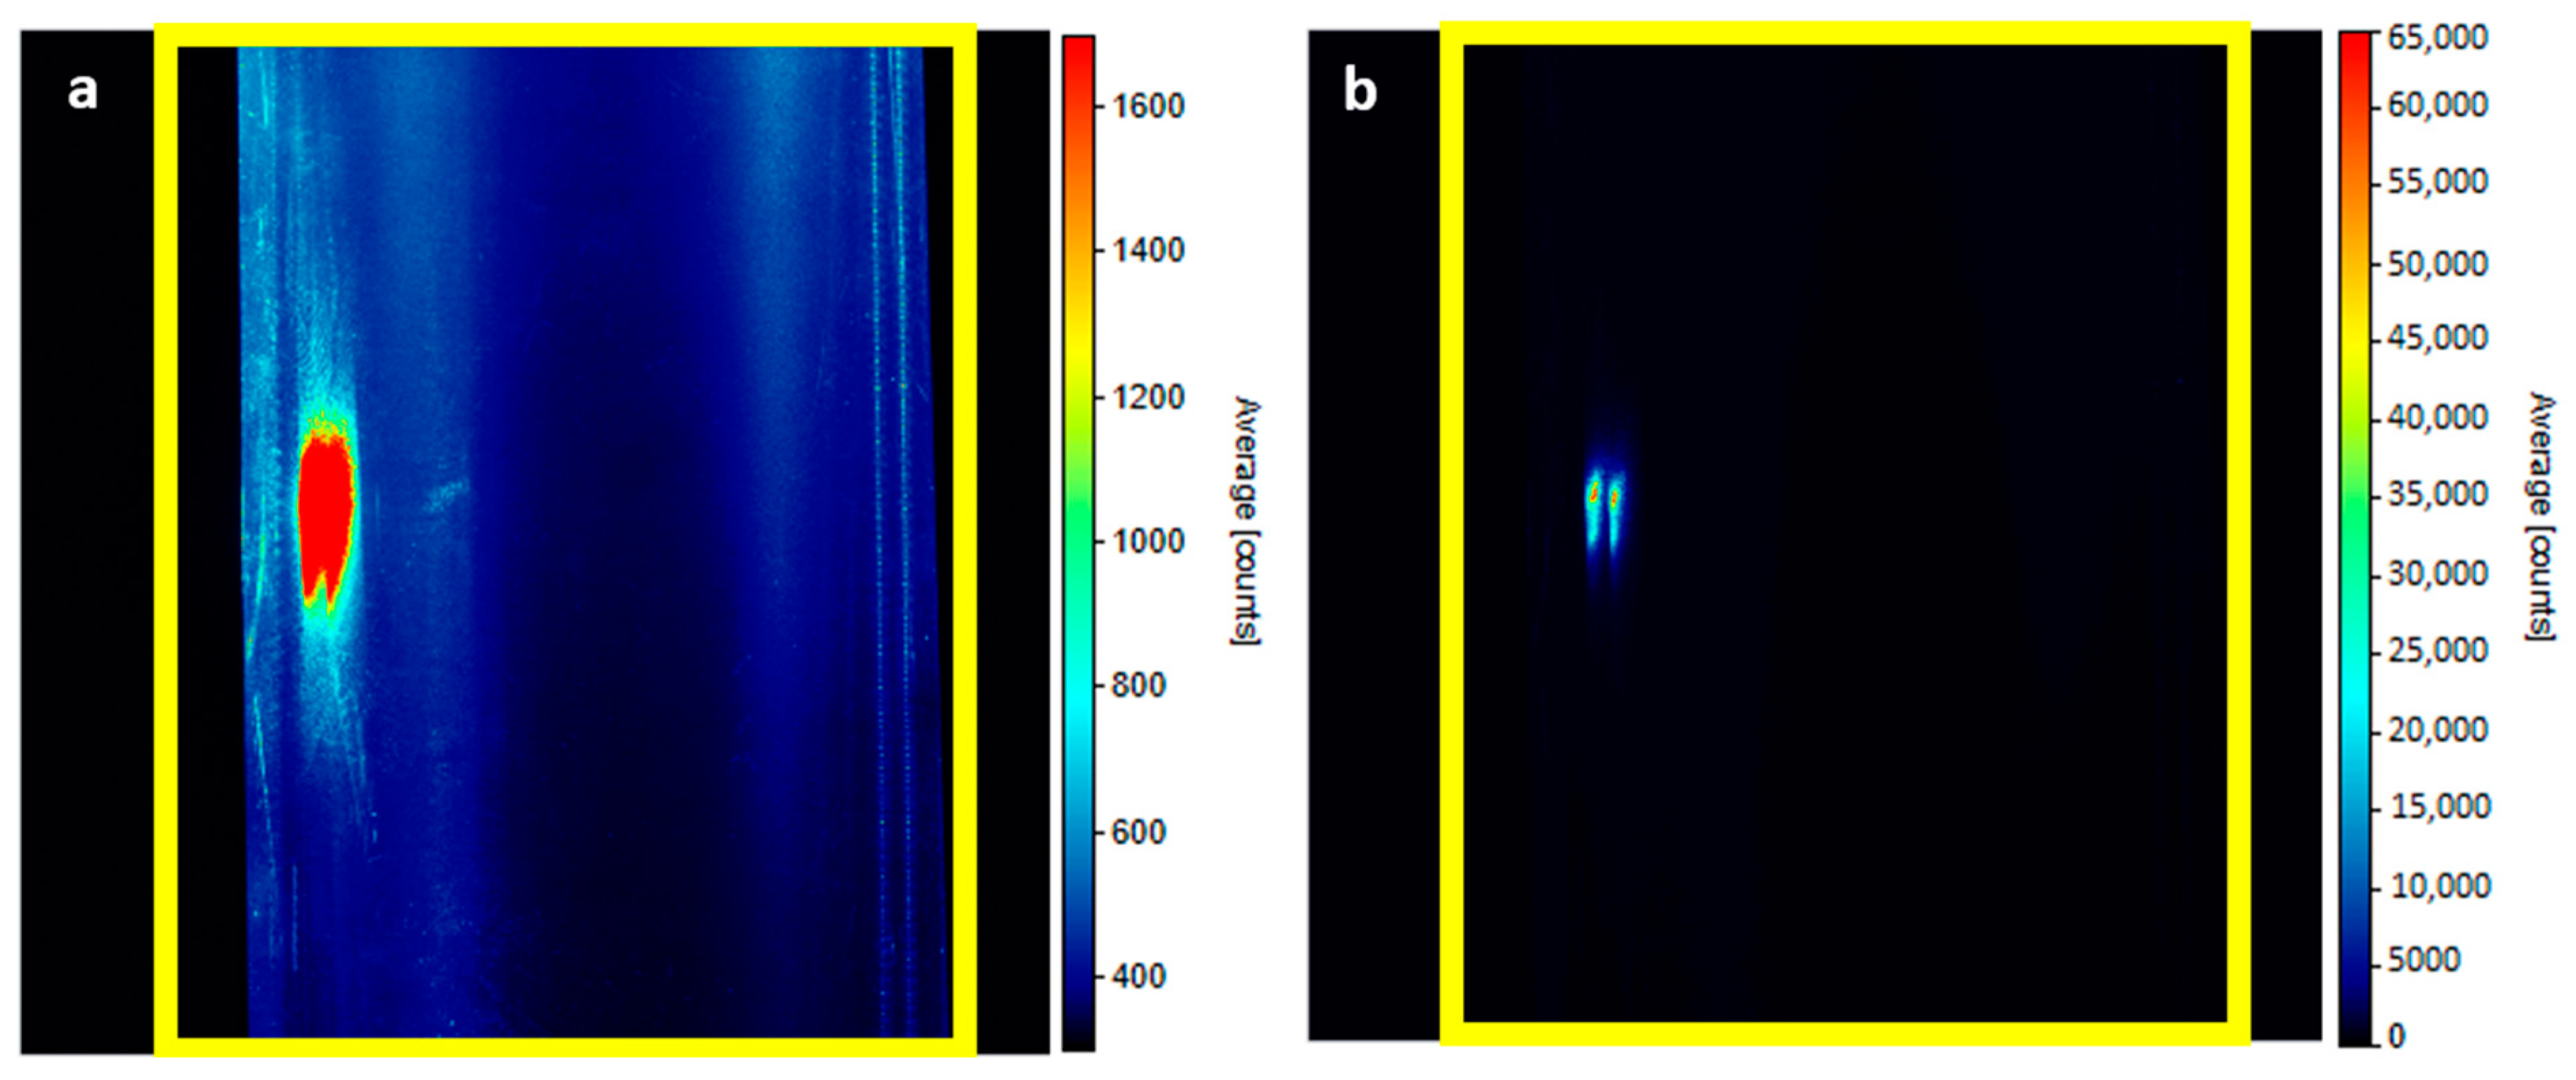
Figure 9 represents regime 0b; only near-wall reflections are covered, and inside the measurement, area reflections are still there. These areas must be shielded in the current arrangement; see regime 0c in
Figure 10. In this picture, both areas adjacent to the wall are covered.
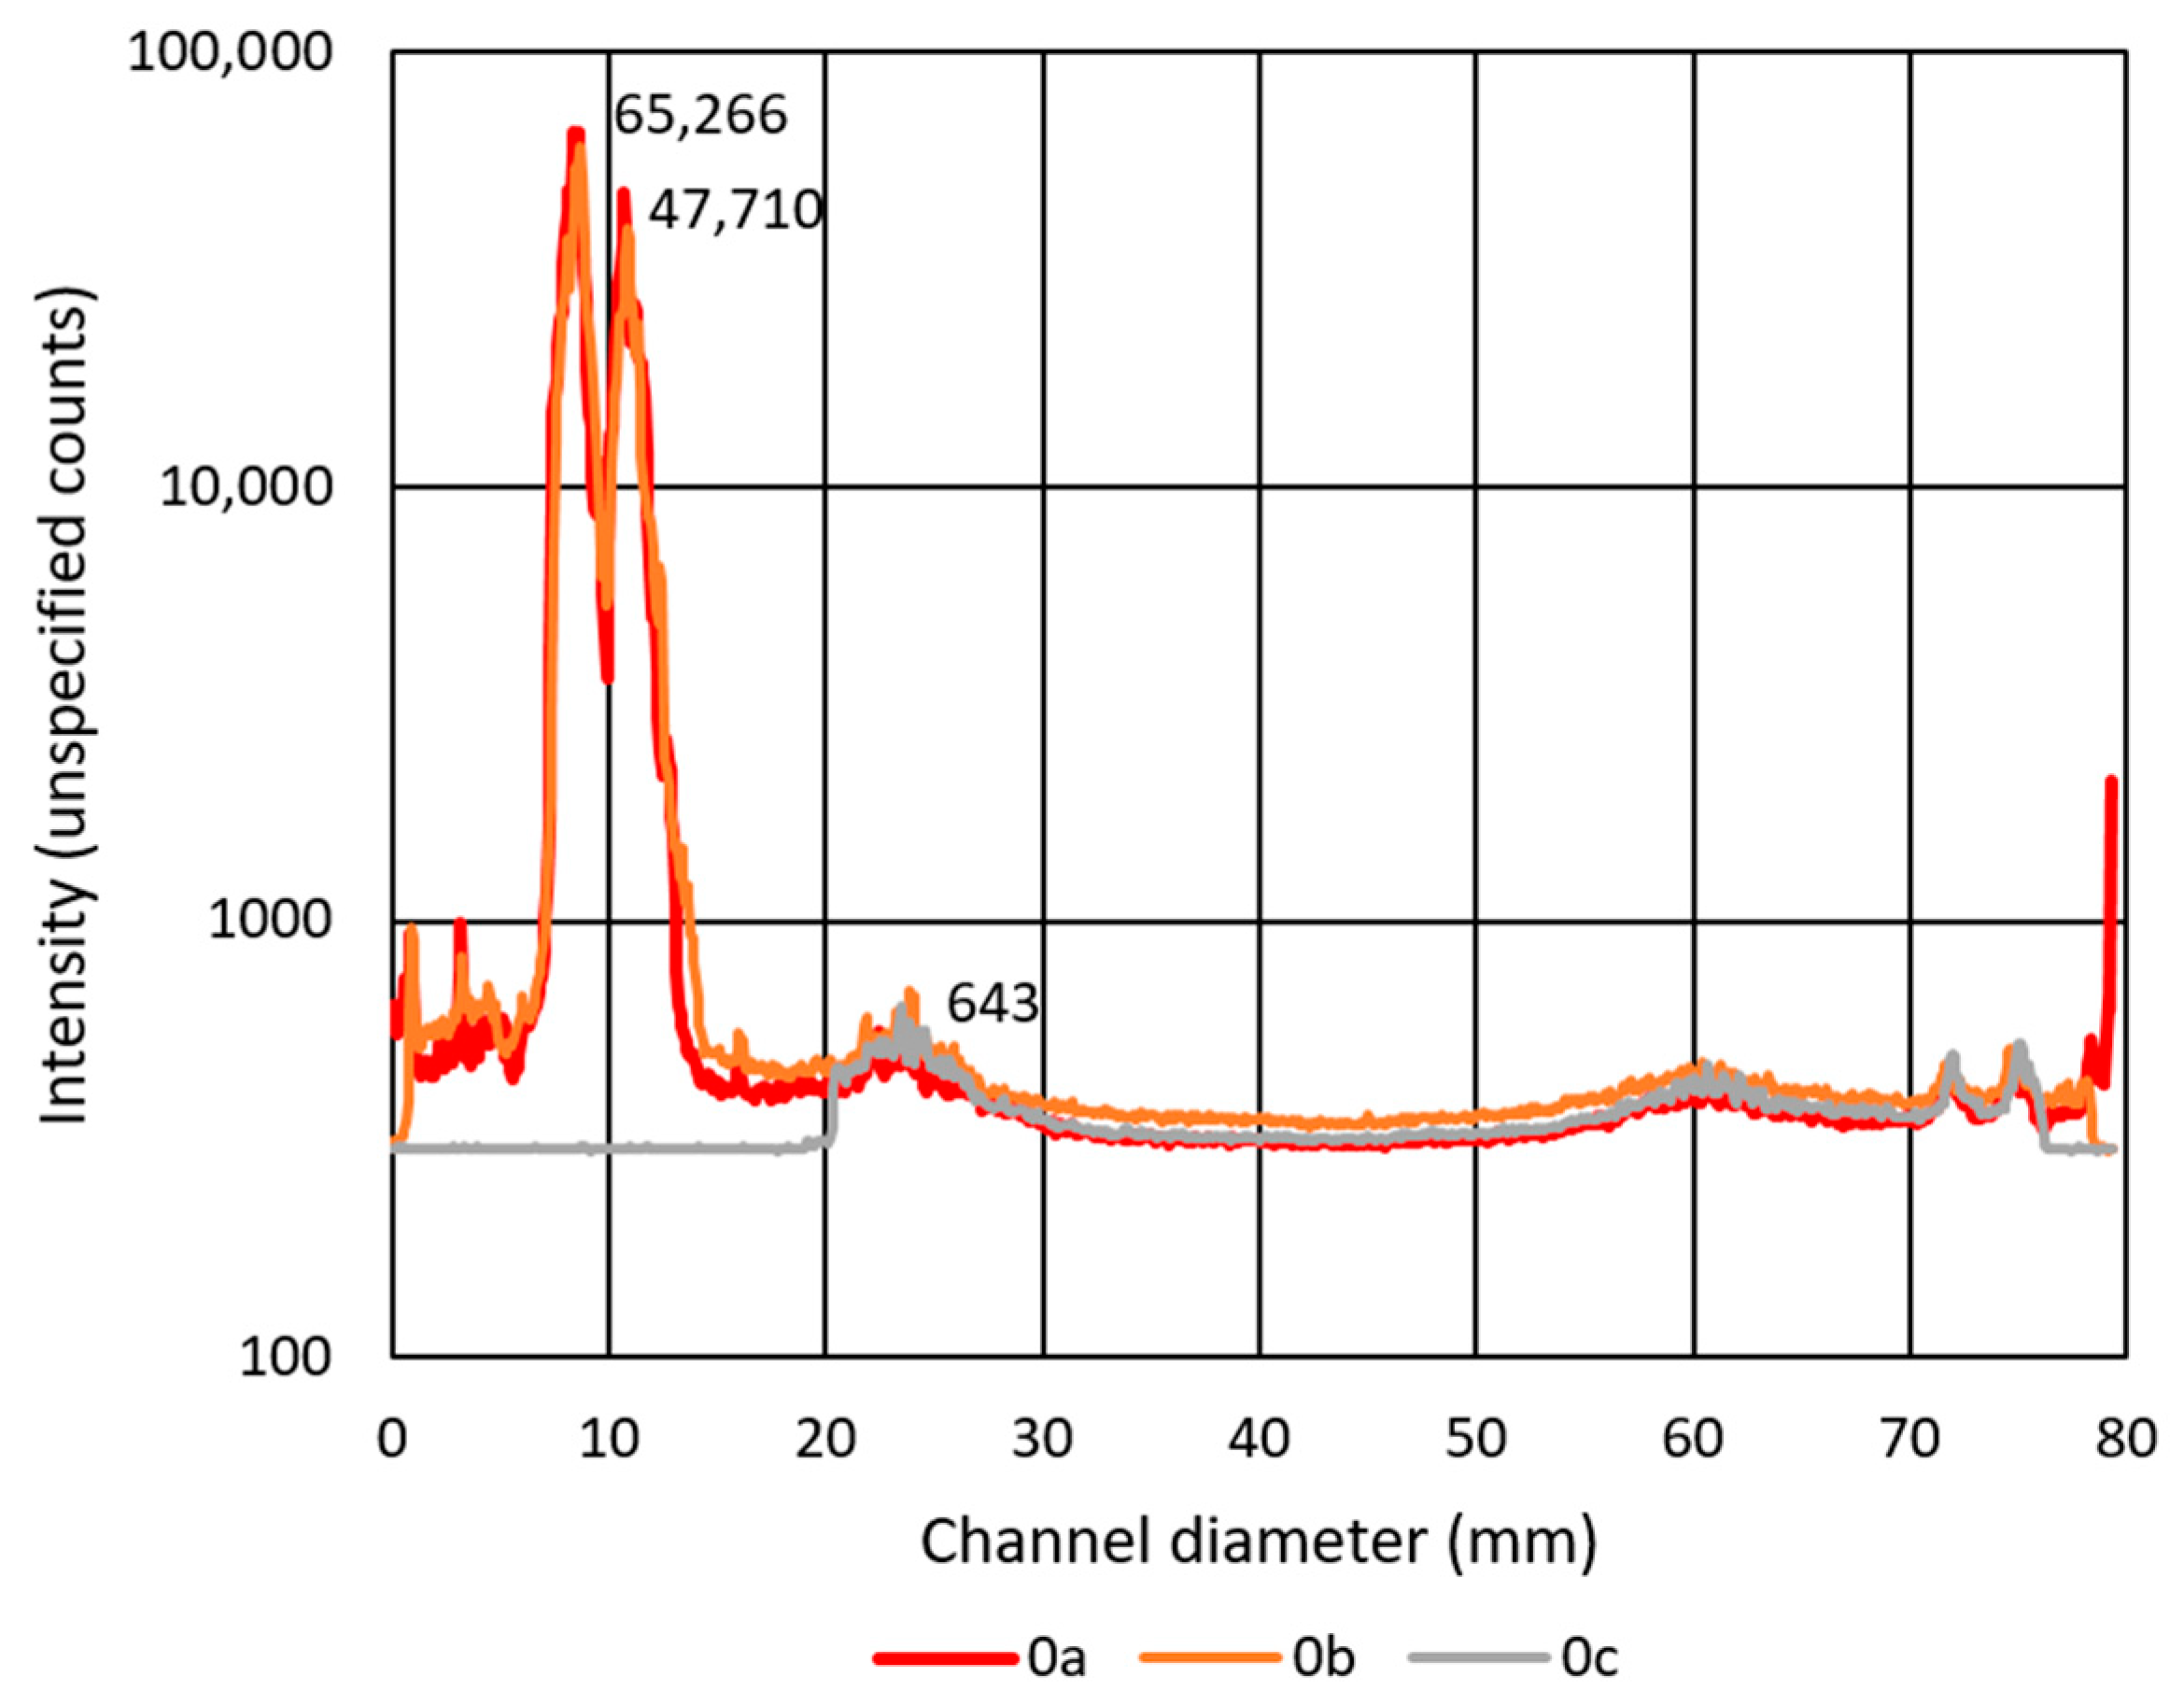
Figure 11 shows the waveform of intensity across the channel diameter in the region of the highest reflections. The intensity axis is plotted on a logarithmic scale due to the high gradients. The graph shows the intensity of regimes 0a, 0b, and 0c, and the recorded intensity value is displayed in the area of the three highest peaks. Regimes 0a and 0b are degraded by the area where the intensity attacks the maximum of the camera sensor. Mode 0c visibly displays a shading area close to the 20 mm diameter value. The maximum intensity is 643 counts, which is less than 1% of the maximum measurable value of the sensor. However, this arrangement severely limits the measurable diameter, and moreover, the measured region is still irregularly illuminated by scattered light, which can reduce the contrast between the particles and the background, especially at higher laser power.
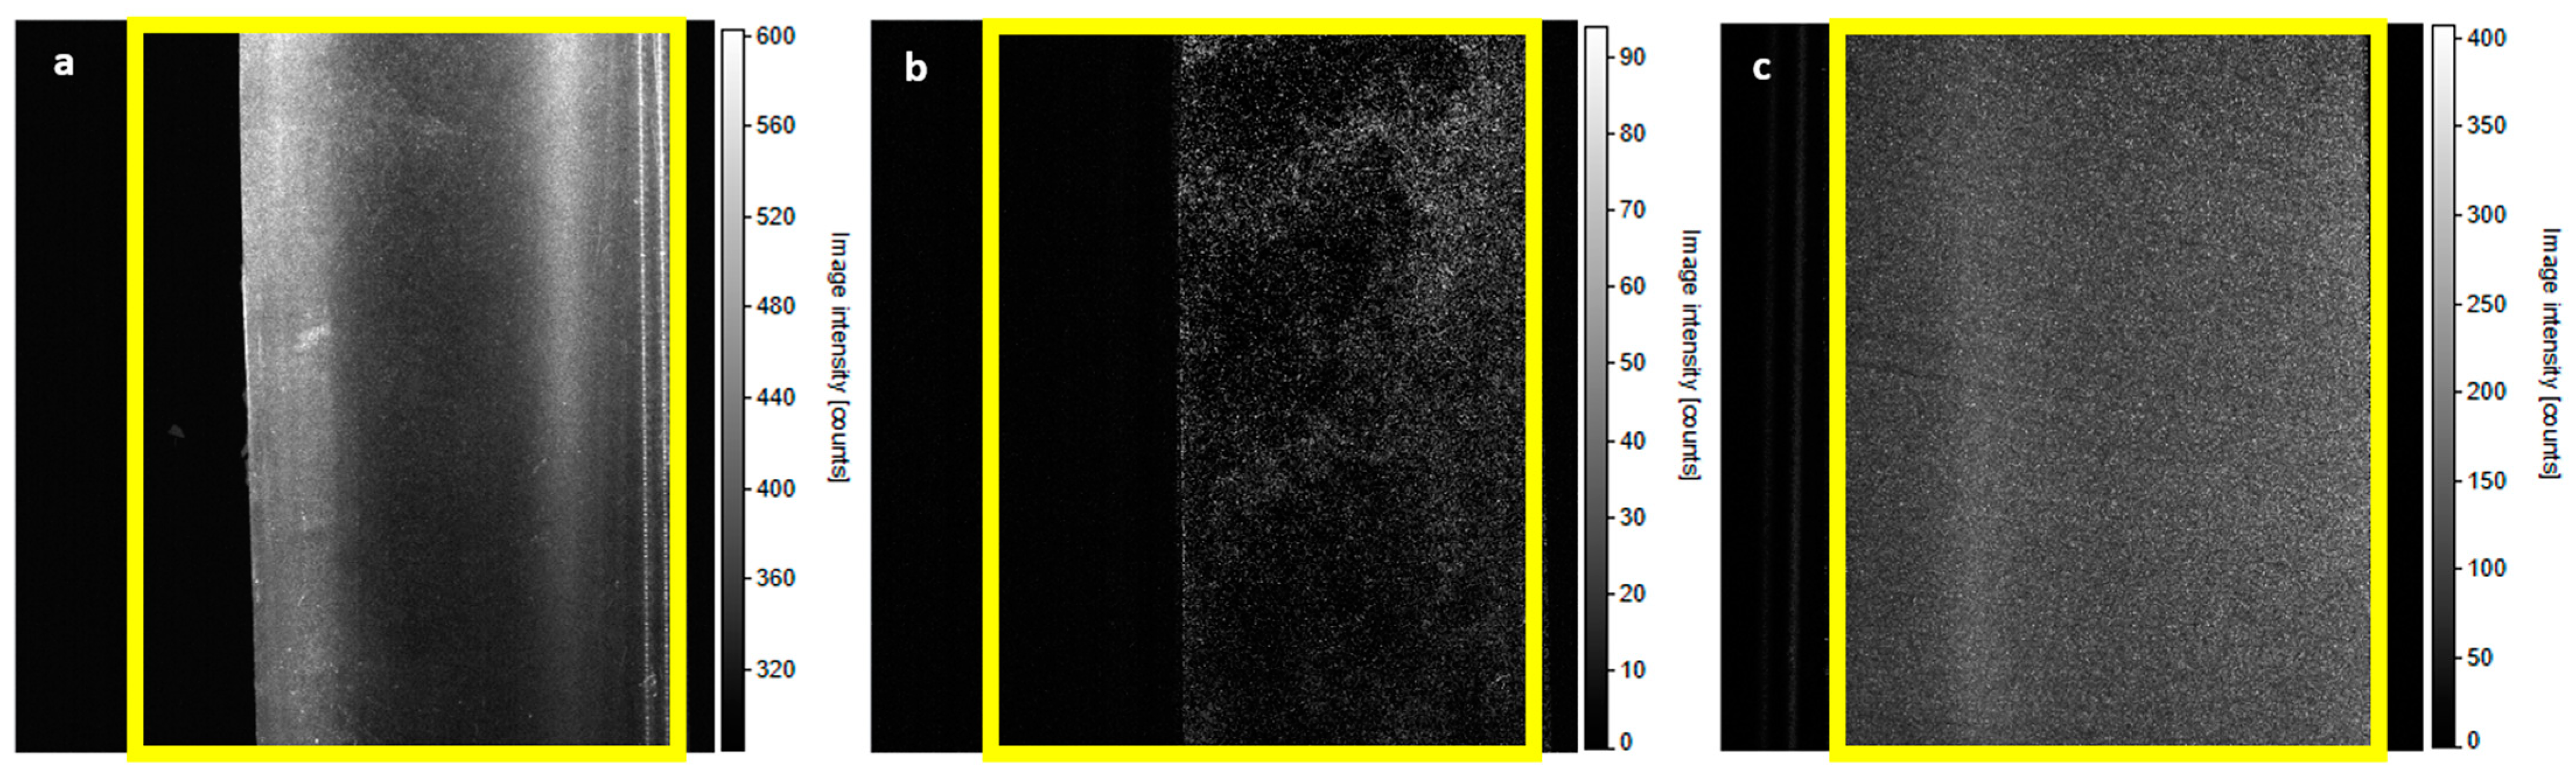
Sample intensity maps of the seeded channels are shown in
Figure 12. These include regimes 1, 2, and 3, according to
Table 2. Cases 1 and 2 are shielded due to reflections, whereas case 3 is not. It can also be seen that in case 1, the particles are not contrasted enough, so a background subtraction is necessary. On the other hand, mode 3, the modified case, allows the measurement over the whole diameter and does not even require background subtraction.
PPR analysis was performed according to Equation (1). The values of the PPR of measured regimes are written in
Table 3. It can be seen that subtracting the background will contribute to a higher PPR by 0.2. Mechanical modifications of the channel lead to a further increase. It can be assumed that subtracting the background would increase this value even more.
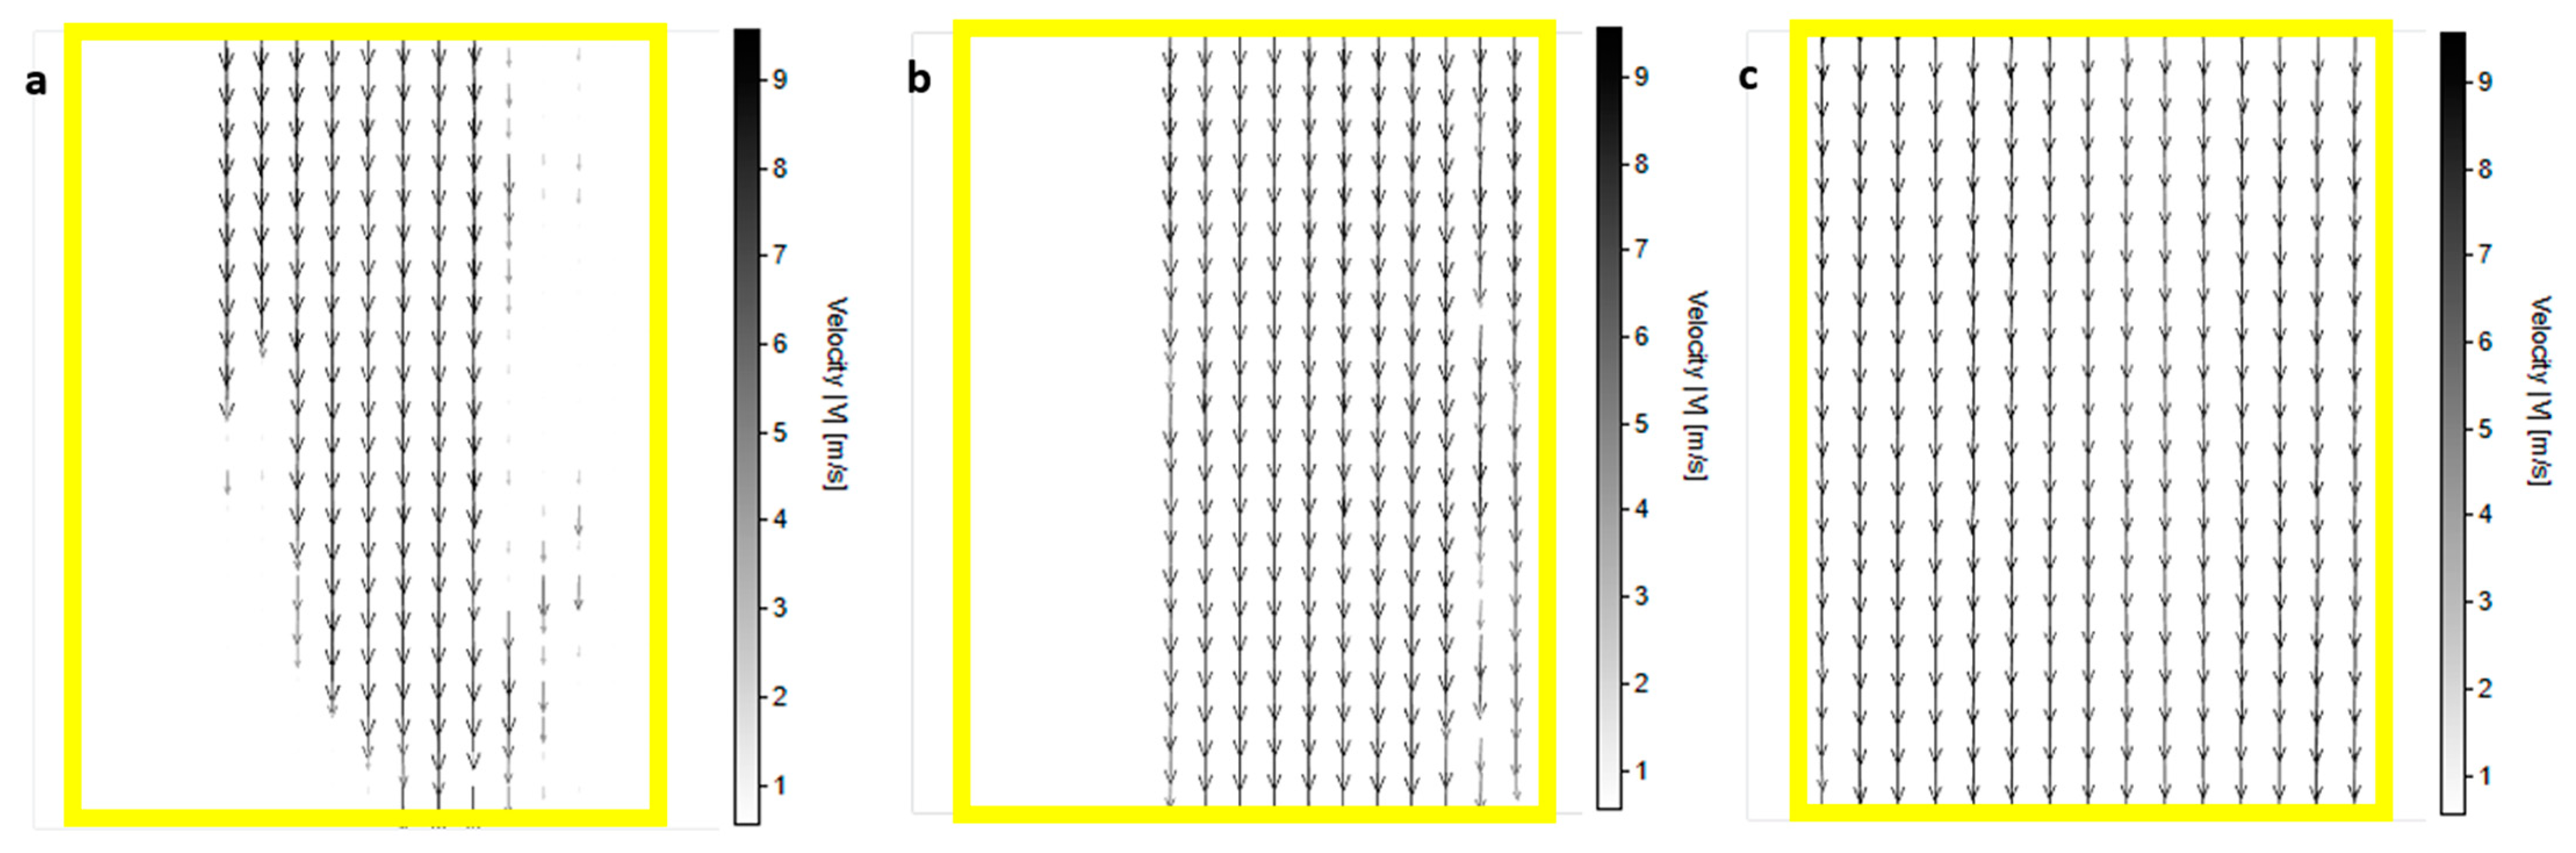
Channel streamlines for regimes 1, 2, and 3 are found in
Figure 13. Every regime has a velocity greyscale of up to 9.5 m/s. They are straight and parallel, which is to be expected in this arrangement. However, in regimes 1 and 2, the edge of the shielded part of the profiles is visible on the left side. In regime 2, there are fewer degraded regions than in regime 1 due to background subtraction. Vectors in empty regions were filtered out as erroneous due to high noise. In regime 3, the channel area is completely filled with streamlines.
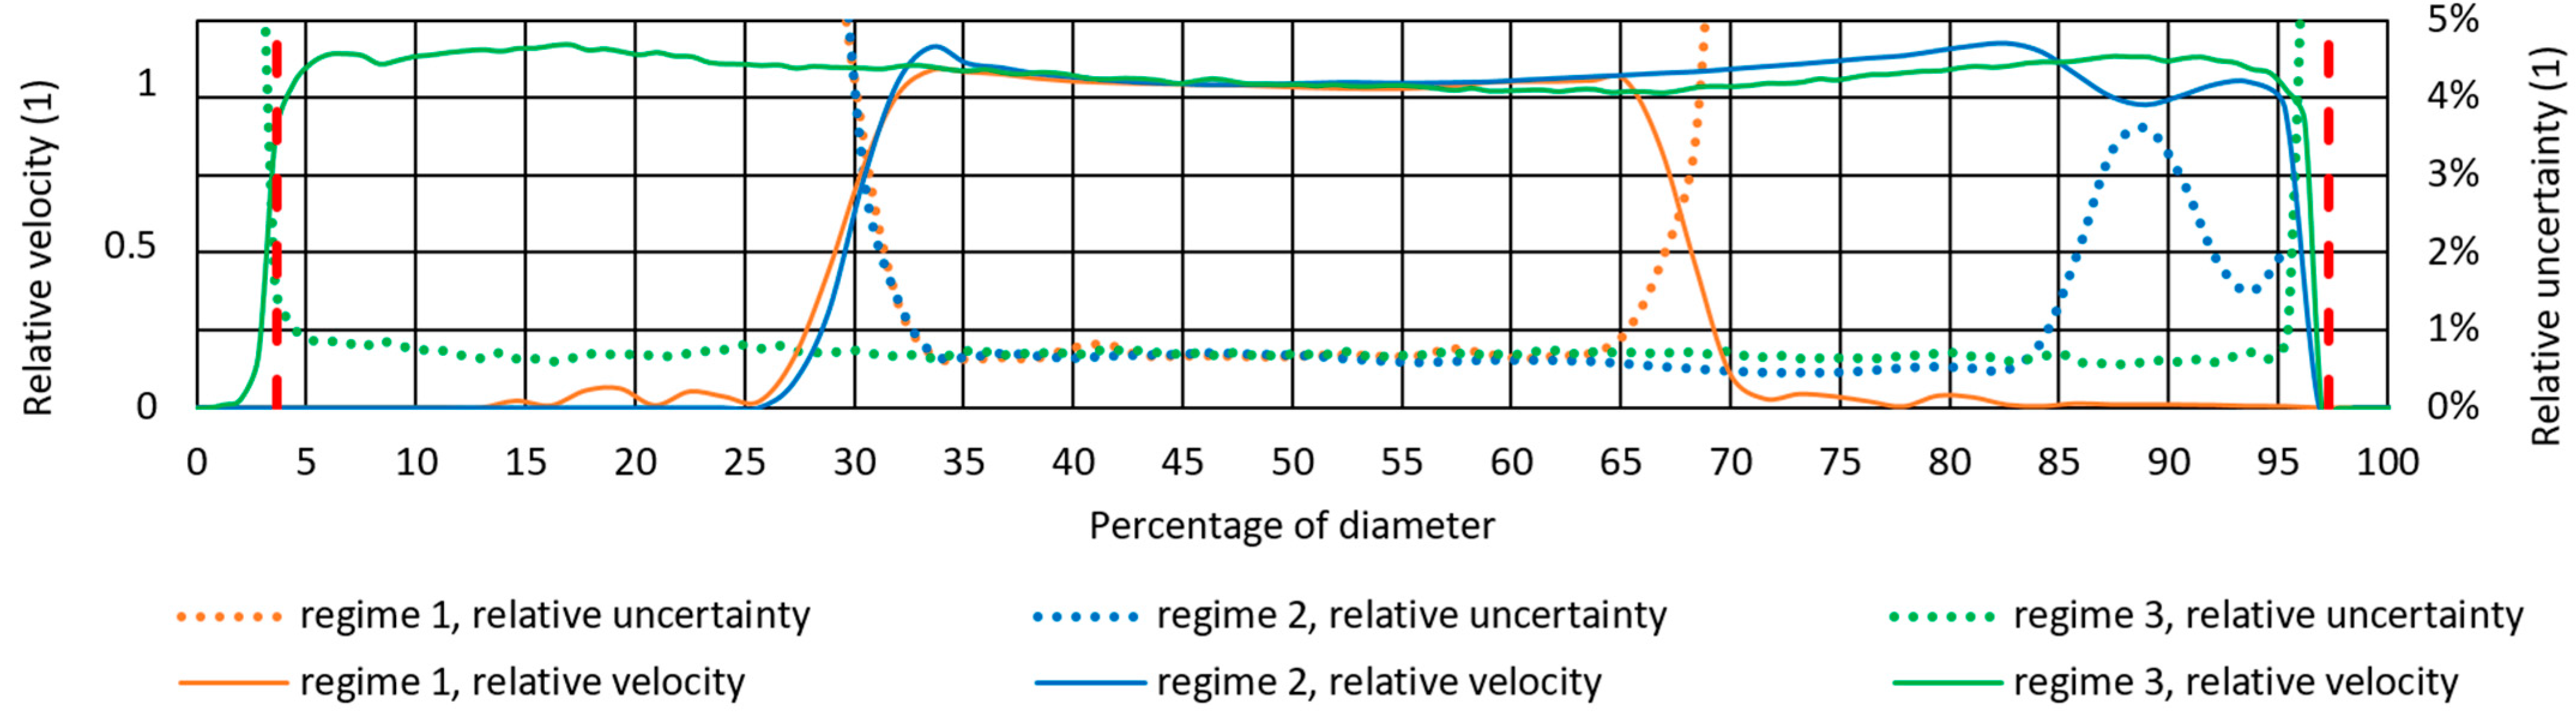
The averaged velocity profiles are plotted in the corresponding coordinates in
Figure 14 to present the validity of the measured data for each mode. The horizontal primary axis represents the channel diameter in percent. The vertical axis shows the dimensionless velocity relative to the velocity in the middle of the profile. The orange line of regime 1 indicates that this mode is the least suitable as it covers the smallest part of the profile. The blue line of regime 2 is more favorable on the right side. According to the comparison of cases 1 and 2, background subtraction is necessary. However, the data on the left are not available at all due to the shielding. The best is, therefore, the green line of regime 3, i.e., with all modifications. Similar results are represented by the relative measurement uncertainty shown as a dotted line in the corresponding color; the values can be read on the secondary axis. The uncertainty in all three cases increases towards the optically degraded areas. Outside these areas, however, it is always less than 1% of the measured local value. Dataset 3 is limited only by the vertical red dashed lines that mark the calibrated area. Sections outside this area are invalid due to extreme optical distortion in the peripheral regions of the pipeline. However, this area is 7.4% of the diameter and can be further reduced using a calibration target with a finer marker grid. Still, this work mainly focuses on reducing scattered light inside the measurement space. Therefore, the relevance of the results in close proximity to the wall was not emphasized. Moreover, such a wide area may be sufficient for many potential verification measurements.
7. Conclusions
In this paper, the experimental work focused on the preparation of a cylindrical pipe model for PIV measurements is presented. First, samples were created to find the optimum internal surface modification. The modification chosen was black matt spraying followed by the fluorescent dye spray-based Rhodamine 6G. The tube was surface modified and was also modified geometrically by cutting an elongated gap and inserting a thin flat sheet of plexiglass, which was optically insulated with black sealant from the cylindrical wall to prevent light from spreading through the internal wall structure. Data were measured and compared for the unmodified (default) and modified channels.
Measurements showed that with such a modified pipe, the evaluation could be performed without pre-processing the raw data, i.e., background subtraction. Compared to the unmodified case, no area is degraded by the reflections of direct or scattered light. The only limitation is the extreme distortion on the cylindrical wall close to the walls. The near wall area was 7.4% of the channel diameter but can be reduced using a larger and finer calibration target. In this work, the distortion was corrected only with a standard polynomial calibration model. Advanced distortion avoidance was not investigated in this work and might be a topic for further study. For example, replacing the flow medium with a fluid that has a close refractive index to the pipe material and making a comparison based on similarity theory is suggested. Another possibility is a ray tracing-based image correction method. These algorithms create an artificial image that can significantly reduce high-level distortion. However, this approach may be suitable for higher distortion levels rather than just in the radial direction of the cylindrical channel.
The modifications presented in this paper may also be suitable for possible stereo-PIV measurements in the longitudinal plane of the channel. However, the laser sheet must be wider (approx. 5 or 10 mm), and the gap width must be sufficient for this. This requires further investigation.


