Abstract
The application of ultrasonic waves in the processing of hydrocarbons is a new promising technology that has developed rapidly in recent years. However, the acoustic-induced cavitation erosion phenomenon is poorly studied. In this paper, a comparison study of cavitation erosion was carried out in water and oils with different viscosities produced from Ashal’cha and North Komsomol using an ultrasonic reactor operating at an industrial frequency of 20 kHz. The acoustic spectra obtained from hydrophones during the ultrasonic treatment of fluids can be characterized by using subharmonics of the main frequency and a continuous white noise level. Moreover, the cavitation erosion of aluminum foil under various ultrasound irradiation times and power levels was thoroughly investigated. It has been found that the process of ultrasonic cavitation has a less erosive impact on metal foil in oil due to its high viscosity. In addition, the formation of microflows in the oil phase, which also intensify the erosion process, is hindered. Cavitation erosion in the Ashal’cha oil sample exhibited a higher intensity compared to that in the North Komsomol oil sample. It was found that upon increasing ultrasound intensity in the case of the viscous (Ashal’cha) oil sample, cavitation stability was disrupted. In turn, this led to a reduction in the collapse energy of the cavitation bubbles. The results we obtained enable the assessment of cavitation erosion in crude oil and could be used to improve methodologies for monitoring and optimizing cavitation processes in crude oil.
1. Introduction
Cavitation is a process that occurs in a liquid under the influence of low pressures, leading to the formation of density discontinuities. Cavitation can be caused hydrodynamically, acoustically, and under any physical exposure (such as an intensive optical pulse or a spark) that cause discontinuities in the fluid [1]. The concept of cavitation is closely linked to the notion of the tensile strength of a liquid. The tensile strength of a liquid is a conditional concept that characterizes the minimum pressure at which discontinuities occur within the liquid. Unlike solid materials, the duration of the applied acoustic is of great significance in a liquid. The initiation of discontinuities in a liquid appears within cavitation nuclei (inhomogeneities and microbubbles of air or vapor in which gas diffusion occurs as pressure decreases). It is evident that, over time, based on scales comparable to the diffusion rate of dissolved gas in the bubble, the tensile strength of the liquid cannot exceed atmospheric pressure [2]. However, under short-term loading, the tensile strength of a liquid can reach enormous values. For example, the tensile strength of water under pulsed wave loadings, according to various estimates, can range from 3.9 to 400 MPa [3]. When an ultrasonic wave propagates, the fluid medium experiences cyclic pressure changes. During rarefaction, pressure decreases, leading to the separation of distinct regions and the formation of cavitation voids. These voids continue to absorb energy during subsequent cycles of compression and rarefaction. These bubbles are filled with gases dissolved in the liquid and vapors of the liquid [4]. A schematic representation of the process of energy accumulation by a cavitation bubble is shown in Figure 1.
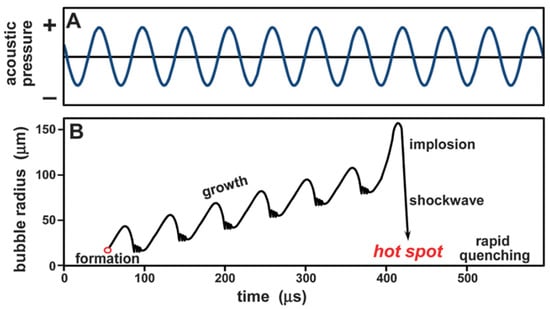
Figure 1.
Schematic illustration of the growth and implosion of cavitation bubbles. Adapted from [4].
When the cavitation bubble reaches a critical size, it collapses during the subsequent compression cycle. The cavitation can quantitatively be characterized via the cavitation index, which is the time-averaged volumetric concentration of cavitation bubbles [5].
During the collapse of a cavitation bubble, it deforms, and as it reaches its minimum size, a cavitation microjet forms due to inertial forces acting on the collapsing wall. The formation of microjets leads to phenomena such as the sound capillary effect and cavitation erosion [6]. The magnitude of the sound capillary effect depends on the capillary diameter, temperature, ultrasound parameters, liquid pressure, and the number of dissolved gases [7,8]. The collapse of a cavitation bubble leads to various physical and chemical processes. Firstly, during bubble collapse, there is a localized extreme increase in temperature and pressure, reaching up to 5000 °C and 1000 atmospheres, accordingly [4]. Additionally, the impact of the capillary jet, which is directed towards the fluid’s inhomogeneities and surface boundaries due to the bubble’s deformation, plays a significant role [9,10,11,12]. The erosive effect of ultrasonic cavitation on solid objects is used to produce nanoparticles of various materials and forms [13].
During the cavitation process, a bubble can be filled with vapor or dissolved gas. Vapor cavitation is a phase transition from the liquid to bubble, and this process is similar to boiling in low pressure; however, air cavitation involves diffusive outgassing or the dissolution of gases in a liquid [14]. Air cavitation depends on the dissolved air fraction, pressure drop rate, and liquid shear speed [15]. Due to the differences in the speed of vapor and gas bubble formation and implosion in cavitation processes, cavitation erosion is caused mostly by vapor cavitation [16].
Cavitation exists in a wide range of different hydraulic systems due to rapid changes in velocity and flow pressure in such systems. Cavitation leads to a reduction in the performance and life span of devices in hydraulic systems. There are several studies that have investigated cavitation flow in pipelines [17,18,19], turbines [20,21], pumps [22,23], and valves [24,25].
Ultrasonic processing is widely applied in the petroleum and chemical industries. Specifically, it is employed in the production of heavy oil by assisting in viscosity reduction, in the processing and upgrading of crude oil in refineries, in pipeline transportation, and in storage facilities. There are many studies in the literature that focus on the influence of ultrasound energy on enhancing oil recovery [26,27,28,29,30,31,32,33]. It is reported that cavitation processing is widely used in the cracking and rectification of hydrocarbons [34,35,36,37,38]. Cavitation-induced oil upgrading allows for the break down of heavy-molecular-weight fragments and long chains, which lowers the cracking temperature and increases the yield of light fractions. Ultrasound-assisted oil desulfurization is also a highly attractive process [39,40,41,42,43]. The increased efficiency of ultrasound-assisted desulfurization compared to conventional hydrodesulfurization methods is due to the improved dispersion of the catalyst particles and, consequently, particle surface area [44], as well as increased catalytic activity resulting from localized increases in temperature and pressure, along with enhanced mass transfer [45]. On the other hand, ultrasound energy exhibits excellent performance in the demulsification and emulsification of oil–water emulsion types, depending on the characteristics of ultrasound energy [46,47,48,49,50,51]. Ultrasonic processing can be used to improve the properties of emulsions. Ultrasound technology allows for the improvement of bitumen emulsions’ structural and technological properties [52].
In their study, Mullakaev et al. evaluated the possibility of employing ultrasound technology for the transportation of heavy crude oils through viscosity reduction and increasing pour point temperature [53]. In the last decade, ultrasound technology has been extensively used globally to clean and enhance membrane permeability for filtration purposes while treating contaminated wastewater [54]. The main mechanisms responsible for increasing filtration efficiency are cavitation and Brownian motion, which disrupt the filter cake on membranes and reduce concentration polarization on the membrane surface.
Ultrasound cavitation erosion has also been widely discussed in the literature; it has been observed by many authors to be a result of the collapse of cavitation bubbles. This phenomenon is accompanied by the formation of microjets (Figure 2), which are directed to the solid material [55]. According to the authors of [55], the velocity of the jet reaches 120 m/s, which is consistent with the theoretical data obtained by other researchers. According to the theoretical model, the initial velocity of a microjet in water is 170 m/s at the moment of contact with the opposite wall of the cavitation bubble, and it decreases to 130 m/s as it propagates further in the milieu [56].
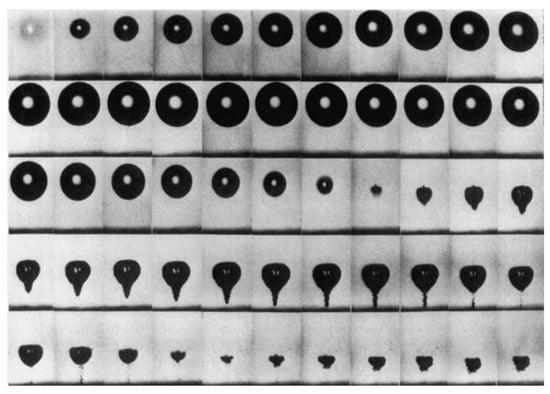
Figure 2.
Formation of microjets in a single cavitation bubble generated via a laser pulse in distilled water near a solid object (recorded at a rate of 75,000 frames per second; frame size = 7.2 mm × 4.6 mm). Adapted from [55].
The destructive performance of microjets is explained by the high erosive potential of cavitation, which can accelerate the wear and tear of machine components [57]. The development of materials that can effectively withstand cavitation erosion is currently one of the crucial tasks of material science [58,59]. Few researchers have addressed cavitation erosion in oil emulsions, hydraulic oils, etc. [60,61,62,63,64,65,66,67]. There are a number of theoretical and experimental studies on cavitation in relation to crude oil [64]. In [65], numerical and experimental analyses of cavitation erosion in coal oil are performed. According to the authors of this study, cavitation is the main reason for the wear of the coal oil slurry valve. In [66], the authors investigate treating crude oil via cavitation. Intense hydrodynamic cavitation appears during treatment. It allows one to increase the yield of distillate. Similar results were obtained in [67,68], where cavitation was used to reduce heavy oil viscosity. In [69], a cavitation erosion test was carried out in the multiphase flow containing 20% of heavy crude oil and 80% of water. The performance of different types of steels and coatings was compared to improve the durability of pipelines, and the cavitation erosion mechanism was studied. In [70], cavitation erosion damage in an oil pump in Saudi Arabia was observed, as well as cavitation-induced vibration. In all of the above-mentioned studies, cavitation is not considered as the main problem of erosion in oil during the exploitation of hydraulic systems; however, the presence of cavitation erosion cannot be denied. It is important to evaluate the cavitation erosion rate in the oils to better understand the process.
However, there is a lack of information about the application of cavitation erosion in crude oil, particularly crude oil with low API and high viscosity. Cavitation erosion behavior in viscous liquids has been investigated in a number of studies [71,72]. In all studies, high viscosity reduces the development of microjets and their propagation in medium; moreover, a high viscosity delays the shrinkage of the cavitation bubble and increases the minimum volume to which the cavitation bubble shrinks.
For this paper, we aimed to study cavitation erosion in heavy crude oil samples using aluminum foil and to determine the ultrasonic parameters that have a significant impact on the formation of cavitation erosion.
2. Materials and Methods
2.1. Objects of Study
The objects of the given study were the crude oil samples produced from Ashal’cha (Republic of Tatarstan, Russia) and North Komsomol (Yamalo-Nenetsk Autonomous Region, Russia). The temperature-dependent viscosity curves for the crude oil samples are presented in Figure 3.
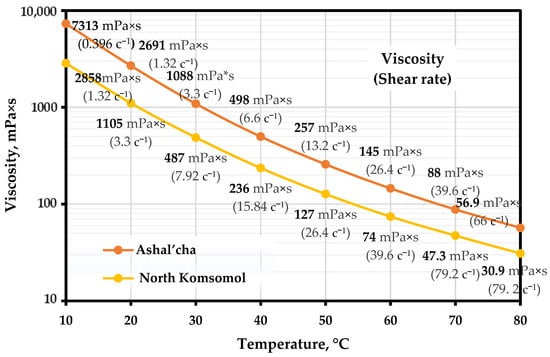
Figure 3.
The viscosity of the crude oil samples.
Distilled water was used as the medium for the cavitation erosion experiments, the results of which are compared with the experiments involving the crude oil medium. We used distilled water due to its transparency, which allowed us to record video imagery of cavitation erosion, and the fact that this medium is well studied and well documented in the literature.
2.2. Ultrasonic Treatment Set-Up
The experimental set-up for the ultrasonic treatment of the heavy oil was developed by LLC “VOLNA” (Moscow, Russia). The key feature of the given experimental set-up was the ability to control the acoustic multifrequency fields at the given amplitude [73,74,75]. A schematic illustration of the experimental set-up is shown in Figure 4. The thermostatically controlled reactor (5) was filled with 100 mL crude oil sample and maintained at a temperature of 40 °C for 1 h. The temperature in the vessel at any certain time was controlled by thermocouples (3). A piezoceramic transducer (6) (mounted at the bottom of the reactor) was used to excite the ultrasound waves.
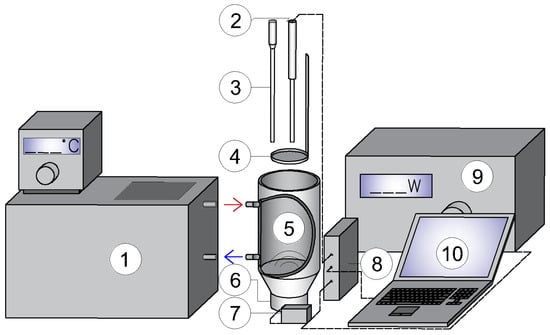
Figure 4.
Experimental set-up for the ultrasonic processing of fluids: 1—thermostat; 2—hydrophone; 3—thermometer; 4—foil with holder; 5—temperature-controlled reactor; 6—piezoceramic ultrasonic transducer; 7—current transformer; 8—digital oscilloscope; 9—laboratory generator UZG-22; 10—personal computer; arrows show water circulation.
The amplitude was regulated by adjusting the power of the generator (9). The frequency of the applied signals was detected through the use of a transformer (7). The acoustic signal frequency was also monitored using a hydrophone (2). A digital oscilloscope (8) connected to a computer (10) was used to receive the signals. To determine the erosive capability, a foil with a holder (4) was immersed in the reactor (5). The cavity erosion was evaluated by using aluminum foil (4) that had been immersed in the reactor filled with crude oil. The frequency of the main harmonics of the applied signal was 20 kHz, and its spectrum is presented in Figure 5.
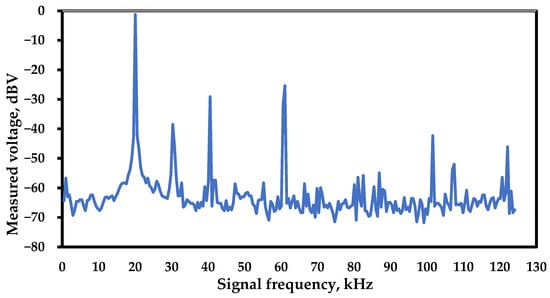
Figure 5.
Spectrum of the signal applied to the piezoceramic transducer.
For both the water and oil mediums, the experiments were carried out at powers of 30 W, 60 W, and 90 W for sonication durations of 1 min, 3 min, 5 min, and 10 min.
2.3. Analysis of Cavitation Erosion
The aluminum foil within the holder was designed (Figure 6) to evaluate the cavitation erosion intensity. The holder consisted of a plastic ring and a handle. The aluminum foil was evenly stretched over the ring. The smooth surface of the foil was used to prevent the accumulation of the evolved gases under it. The gases can behave like a buffer that prevents contact between the liquid and the foil.
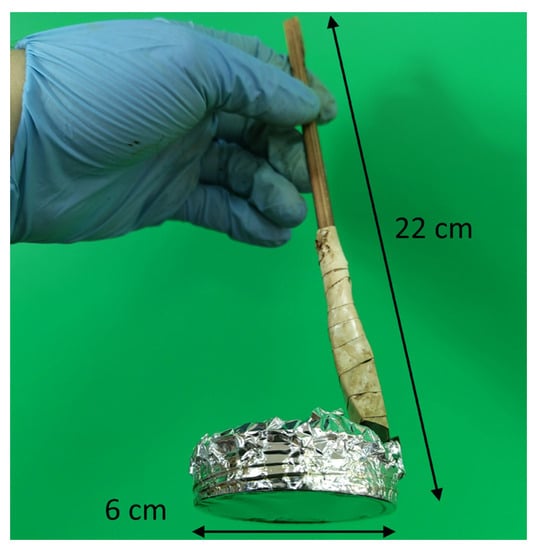
Figure 6.
The aluminum foil with holder.
The measurement of acoustic spectra with hydrophones and cavitation erosion evaluation with aluminum foil were carried out separately. Deformation of the foil after cavitation erosion was photographed using a high-resolution camera (1920 × 1280 pixels). “ImageJ 1.54d” software was used to estimate the area of the deformation within the foil based on the number of “black” and “white” pixels. However, to estimate the perimeters of the deformed pit-like zones of foil, the given and other standard approaches are not applicable because of the complexity of the shapes, such as the presence of many closed worn areas and the unevenness of the wear lines. Therefore, through using Microsoft Excel’s Visual Basic for Applications (VBA), we developed an algorithm that could estimate the perimeter of the erosion pits based on the number of boundary pixels between the dark and light areas and the application of coefficients that take into account the angle of the boundary line and the length of the line passing through this pixel (Figure 7). Such a modification allowed for more precise perimeter calculations for the complex shapes. The developed algorithm was tested on the ideal spere perimeter, and the standard deviation factor did not exceed 2%.
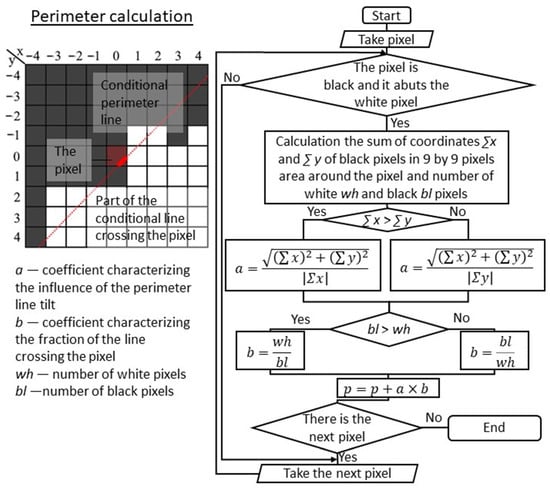
Figure 7.
Algorithm for calculating the perimeter of the erosion.
The k-factor was introduced to show the smoothness of the erosion, which is simply the deviation of the perimeter of the complex erosion (p) from the equivalent perimeter of the ideal circle with the same area. The given statement mathematically can be expressed as shown in Equation (1).
where p is the perimeter of erosion in the foil calculated by the developed algorithm (ref. Figure 7), and S is the area of the erosion on the foil, which is equal to the number of white pixels in the photos.
3. Results and Discussion
3.1. Acoustic Spectra
Figure 8 presents the acoustic spectra obtained from hydrophones using water and different crude oil samples. In the spectra, measured voltage level was corrected, so zero level is equal to the average noise level of the hydrophones during measurement without ultrasound irradiation. In the obtained spectra, it is essential to highlight the prominent peaks (Figure 8). Among these, the 20 kHz peak corresponds to the fundamental frequency of the ultrasonic signal applied to the piezoelectric transducer (Figure 4). The following prominently expressed peaks in all the presented graphs are at 40.5 kHz, 61 kHz, 81.5 kHz, and 102 kHz, representing the harmonics of the fundamental frequency. For water, intermediate peaks (2n + 1) f0/2 should be noted. These peaks are not pronounced for crude oil, while there are additional peaks at 66.5 kHz, 87 kHz, and 107.5 kHz of unknown origin in all cases; However, in the case of water, they are less distinct. These peaks have not been previously described in the literature and require further analysis. However, we note that these peaks reach their maximum magnitude at the beginning of intense cavitation growth, i.e., at a power of 60 kHz. Their presence may be associated with cavitation phenomena in viscous liquids like oil.
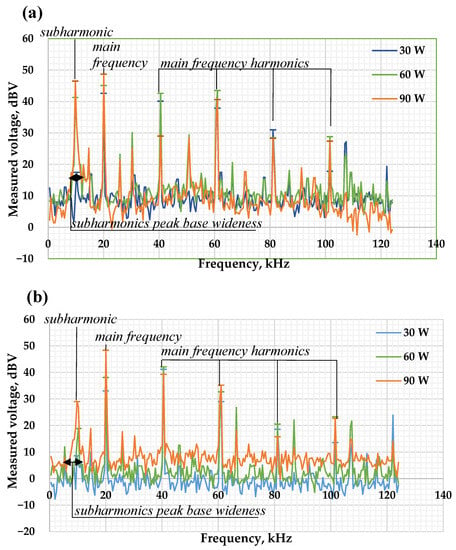
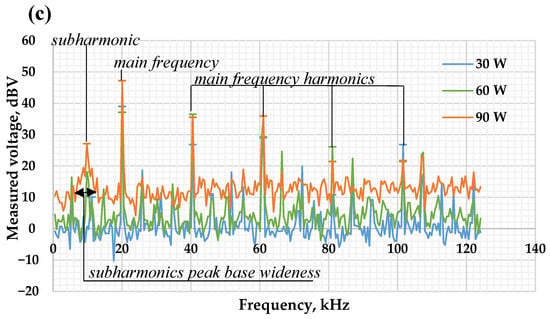
Figure 8.
Acoustic spectra from hydrophones in (a) water, (b) North Komsomol oil, and (c) Ashal’cha oil.
The subharmonic of the fundamental frequency at 10 kHz, which is associated with the oscillation of cavitating bubbles in water larger than the resonance size, is particularly important for analysis [76]. The magnitude of this peak increases significantly, with a slight increase in the fundamental frequency and with increasing ultrasound intensity. The slower growth in the main frequency is attributed to the presence of large bubbles in the liquid, which prevent ultrasound propagation in the liquid and dampen the acoustic signal. Additionally, the growth of bubbles in cavitating liquid is specifically related to the main frequency, which reduces wave energy [76].
The intensity of the subharmonics of the Ashal’cha crude oil sample recorded at maximum power is lower than that of the North Komsomol crude oil sample. However, for the latter sample, a wider peak in the ranges of 6–14 kHz was observed. A similarly wide peak for the water sample was observed in the ranges of 9–11 kHz. The base of the peak for the North Komsomol oil is also visually slightly higher. The “blurring” of the peak may indicate deviations in the oscillations of the bubbles after the first cycle of sonication. This could be related to the occurrence of bubble collapse interruptions and phase shifts in bubble collapse relative to ultrasound pressure oscillations. Additionally, there is an apparent increase in the overall level of continuous white noise against the background of the increased base of the subharmonic peak.
3.2. Cavitation Erosion Evaluation
The sonication process in liquid medium is accompanied by the formation of the local areas with intensive cavitation erosion. The local intensive cavitation areas were generally observed near heterogeneous materials, likely due the presence of cavitation nuclei near them (Figure 9). The local intensive cavitation area can be concentrated at a point, multiple points, or extended in a line along the solid material. Figure 9 presents the intensity of the local cavitation areas on the aluminum foil immersed in the water phase. The cavitation area is easy to observe due to the presence of aluminum particles, and for contrast, they are highlighted in red in Figure 9.
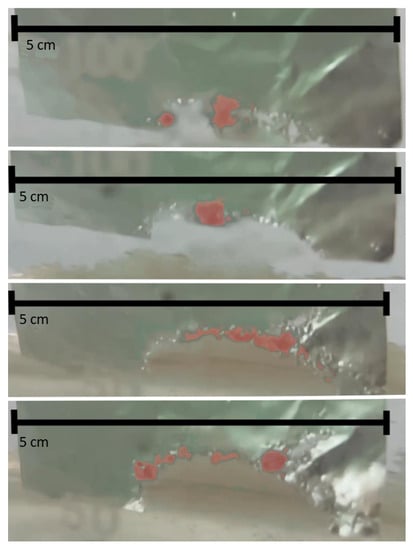
Figure 9.
Local cavitation area on aluminum foil immersed in water under various sonication times.
Visual depictions of the cavitation erosion of aluminum foil (with a thickness of 20 μm) immersed in the water depending on the sonication time and power are provided in Figure 10. Subjecting the aluminum foil to sonication for 10 min under 60 W and 90 W totally damaged the foil. On the other hand, the cavitation erosion induced under 30 W sonication had no damaging or erosive effect on the aluminum foil (the same aluminum foil immersed in the oil phase). This means that the energy required to collapse the cavitation bubbles in crude oil is much higher than that required for water. Therefore, we decided to use aluminum foil with a lower thickness (14 μm instead of 20 μm) in subsequent experiments to evaluate the intensity of the cavitation erosion in the oil samples.
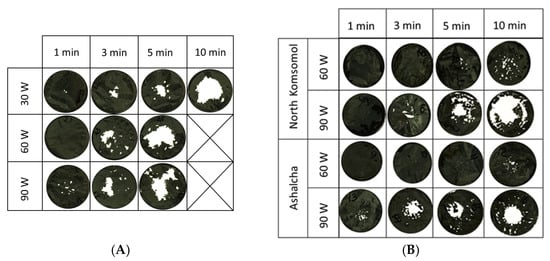
Figure 10.
Cavitation erosion of aluminum foil immersed in (A) water and (B) crude oil samples.
According to the obtained results (see Figure 10), the cavitation erosion of both water and crude oil samples depends on the sonication time and power. The correlation between the erosion and sonication time for both the water and oil phases can be determined from viewing Figure 11. The dependency of the erosion in water phase from the sonication time has a polynomial behavior (R2 = 0.996), while the correlation between the erosion of crude oil and the sonication time is almost linearly proportional (R2 = 0.949). The latter curve’s behavior significantly eases the task of determining the intensity of cavitation.
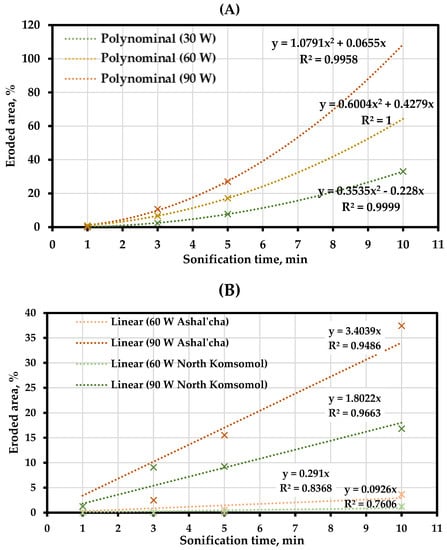
Figure 11.
Sonication time’s dependency on the erosion of aluminum foil immersed in (A) water and (B) crude oil samples.
The non-linear dependency of the foil erosion in water is probably due to the greater amount of energy released during the collapse of the cavitation bubbles in contrast to the oil bulk. At the same time, it becomes possible to detach large pieces of foil in the water; these pieces are much larger than the fraction of the detached material during a single collapse of the cavitation bubble. The much more complex shape of the edge of the foil in the case of crude oil samples supports this finding. The shape coefficient k characterizes the form complexity; it can be calculated as the perimeter of eroded area divided by the length of the circle of the same area (1). Table 1 presents the shape coefficients for the tested samples. The complexity of the boundaries increases with the shape coefficient. According to the estimated results (Table 1), the complexity of the boundaries formed during foil erosion in the crude oil samples is much higher than the complexity of that in water. This means that, in the less viscous liquid, intense cavitation creates streams that allow liquid to rip large pieces of foil off, creating smooth boundaries. Thus, in viscous liquid, it is harder for cavitation to create streams.

Table 1.
Shape coefficient (k) of foil erosion after sonication.
For a comparative assessment of the damaging energy resulting from the collapse of a single bubble, the images of the foil were analyzed using an optical microscope, and the average deformation sizes were estimated. Images of local cavitation deformations in aluminum foil immersed in water and crude oil samples after bubbles collapse at various power are shown in Figure 12a,b. In the images, a millimeter ruler scale is attached to enable the evaluation of the size of the deformation. The single areas of deformation discernible in the images have different sizes and are associated with the collapse of a single cavitation bubble. Deformations of the bottom of the recesses in the images in the form of a small bump are associated with the deformation of the foil during the imaging procedures.
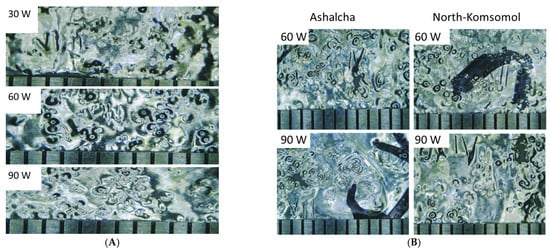
Figure 12.
Images of aluminum foil after bubble collapse in (A) water and (B) crude oil samples (images captured via the use of an optical microscope). The divisions of the ruler correspond to 1 mm.
The results of our quantitative analysis of the deformation sizes observed in the images of the foil after sonication are summarized in Figure 13. The size of single deformation sections reflects the collapse energy of single cavitation bubbles. The graphs show the sizes of distinguishable single sections of deformation on the foil after sonication in the water and crude oil samples at different ultrasound power levels.
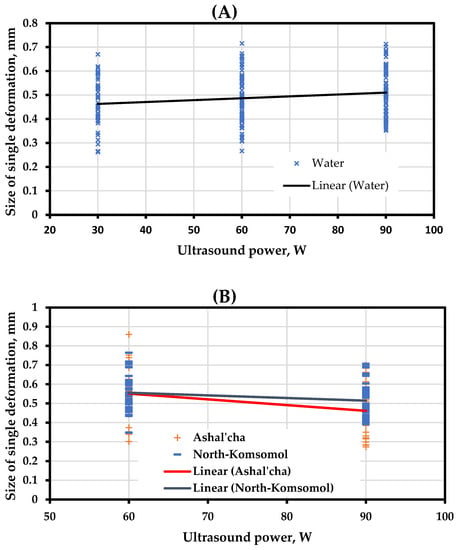
Figure 13.
Influence of ultrasonic power on visible individual deformation sizes and calculated mean values in (A) water and (B) crude oil samples.
According to the obtained graphs, the size of the individual deformation sites varies widely, and they are almost independent from the power of the ultrasound. Thus, for water, the average size of the deformation sites increases slightly with increasing ultrasound power, but for oil, the inverse is true. It is noticeable that for the high-viscosity crude oil sample (Asha’lcha), the average size of the deformation sites decreases more than it does for the North Komsomol oil sample, and the decrease in the average value is 0.091 mm, while for North Komsomol oil, it is 0.042 mm.
This fact may be related to the phenomenon of increasing the level of white noise on the acoustic spectrum when the ultrasound power reaches 90 watts (Figure 8). The disruption of the growth of cavitation bubbles and the displacement of the bubble collapse phase relative to pressure fluctuations in the liquid can lead to both the distortion of the peaks of the acoustic spectrum and a decrease in the total bubble collapse energy and subsequent microjet, which leads to the formation of deformation on the foil and the erosion of solids in the cavitating liquid. It is also worth noting that in both oils, the average size of single deformation sites at a power of 60 watts is almost equal and is 0.55 mm and 0.56 mm for the Ashal’cha and North Komsomol crude oil samples, respectively.
4. Conclusions
The study compares aluminum foil cavitation erosion rates for high-viscosity crude oil samples from Ashal’cha and North Komsomol reservoirs with cavitation erosion in water. This study was carried out using a temperature-controlled reactor with a piezoceramic ultrasonic transducer. There were three power settings for the test: 30 W, 60 W, and 90 W. During sonification, acoustic spectra were measured.
Ultrasound cavitation in oil has a much lower erosion rate compared to water. Due to the high viscosity of oil, there are significant limitations for the cavitation jets and flow formation. Therefore, similar foil cavitation erosion rates could be obtained in water when using foil with a thickness of 20 μm and 14 μm in oil. Secondly, for oil, the erosion line complexity is much higher, which pertains to the lack of large torn off parts of foil during cavitation; thus, in contrast to the erosion process in water, the erosion process in oil is linear. The erosion rate for the Ashal’cha oil was two times higher than that for the North Komsomol oil.
Our acoustic spectra analysis showed good reliability regarding our cavitation rate assessment (facilitated by our subharmonic analysis of the main frequency, 10 Hz). However, after reaching a particular threshold (between 60 W and 90 W), in the case of the Ashal’cha oil, an increase in the white noise level and a decrease in the subharmonic peak were obtained. At the same time, the bubble collapse energy for 90 W ultrasound irradiation decreased. However, in general, bubble collapse energy does not depend on the ultrasound power below that threshold.
Author Contributions
Conceptualization, A.V.D. and A.V.V.; methodology, A.F.M., D.A.M., and V.A.S.; validation, I.M.D., L.V.S., and A.A.G.; investigation, A.A.K., A.V.D., and G.F.B.; writing—original draft preparation, F.A.A., A.V.D., and G.F.B.; writing—review and editing, F.A.A. and G.F.B. All authors have read and agreed to the published version of the manuscript.
Funding
This research received no external funding.
Data Availability Statement
Not applicable.
Conflicts of Interest
The authors declare no conflict of interest.
References
- Pernik, A.D.; Roy, N.A. Fizicheskiy Enciklopedicheskiy Slovar’; Vvedenskiy, V.A., Vul, B.M., Eds.; Soviet Encyclopedia: Moscow, Russia, 1962; Volume 2. [Google Scholar]
- Shapiro, V.E. Proch’nost na razriv zhidkosti, provodyashey tok. High Temp. 1975, 13, 979–983. [Google Scholar]
- Bogach, A.A.; Utkin, A.V. Prochnost Vodi pti impulsnom rastyazhenii. J. Appl. Mech. Tech. Phys. 2000, 41, 198–205. [Google Scholar]
- Xu, H.; Zeiger, B.W.; Suslick, K.S. Sonochemical synthesis of nanomaterials. Chem. Soc. Rev. 2013, 42, 2555–2567. [Google Scholar] [CrossRef] [PubMed]
- Nurullaev, V.H. Conditions formation of cavitational zones and its action on physical and chemical characteristics crude oils. Transp. Storage Oil Prod. Hydrocarb. 2017, 1, 38–42. [Google Scholar]
- Rozina, E.A. Cavitational regime of sonocapillary effect. Acoust. Bull. 2003, 6, 48–59. [Google Scholar] [CrossRef]
- Mikhailova, N.V.; Smirnov, I.V.; Sharipova, A.; Slesarenko, V. Calculation of a Sonocapillary Effect Dependence on an Ultrasonic Frequency Based on a Threshold Cavitation Criterion. Probl. Strength Plast. 2020, 82, 64–74. [Google Scholar] [CrossRef]
- Mikhailova, N.V.; Smirnov, I.V. Analytical Modelling of the Influence of Temperature and Capillary Diameter on the Sonocapillary Effect for Liquids with Different Density. In Proceedings of the XXXII International Conference of Young Scientists and Students “Topical Problems of Mechanical Engineering”, Moscow, Russia, 7–10 November 2021; pp. 306–311. [Google Scholar]
- Kuppa, R.; Moholkar, V.S. Physical Features of Ultrasound-Enhanced Heterogeneous Permanganate Oxidation. Ultrason. Sonochemistry 2010, 17, 123–131. [Google Scholar] [CrossRef]
- Mieles-Gómez, L.; Lastra-Ripoll, S.E.; Torregroza-Fuentes, E.; Quintana, S.E.; García-Zapateiro, L.A. Rheological and Microstructural Properties of Oil-in-Water Emulsion Gels Containing Natural Plant Extracts Stabilized with Carboxymethyl Cellulose/Mango (Mangiferaindica) Starch. Fluids 2021, 6, 312. [Google Scholar] [CrossRef]
- Eskin, D.G.; Tzanakis, I. High-Frequency Vibration and Ultrasonic Processing. In Processing of Metallic Alloys under External Fields; Springer: Berlin/Heidelberg, Germany, 2018; pp. 153–193. [Google Scholar]
- Zhu, L.; Yang, Z.; Xin, B.; Wang, S.; Meng, G.; Ning, J.; Xue, P. Microstructure and Mechanical Properties of Parts Formed by Ultrasonic Vibration-Assisted Laser Cladding of Inconel 718. Surf. Coat. Technol. 2021, 410, 126964. [Google Scholar] [CrossRef]
- Gedanken, A. Using Sonochemistry for the Fabrication of Nanomaterials. Ultrason. Sonochemistry 2004, 11, 47–55. [Google Scholar] [CrossRef]
- Osterland, S.; Günther, L.; Weber, J. Experiments and Computational Fluid Dynamics on Vapor and Gas Cavitation for Oil Hydraulics. Chem. Eng. Technol. 2022, 46, 147–157. [Google Scholar] [CrossRef]
- Iga, Y.; Okajima, J.; Takahashi, S.; Ibata, Y. Occurrence characteristics of gaseous cavitation in oil shear flow. Phys. Fluids 2022, 34, 023313. [Google Scholar] [CrossRef]
- Iliechev, V.I.; Lesunovskiy, V.P. O spectrah shuma pri gidrodinamicheskoy cavitacii. Akust. Zhurnal 1963, 9, 32–36. [Google Scholar]
- Zhu, J.; Wu, G.; Duan, X.; Li, X.; Tang, X. Numerical studies on applications of cavitation models in water hammer-induced cavitating flows in pipelines. Phys. Fluids 2023, 35, 095129. [Google Scholar] [CrossRef]
- Urbanowicz, K.; Bergant, A.; Kodura, A.; Kubrak, M.; Malesińska, A.; Bury, P.; Stosiak, M. Modeling Transient Pipe Flow in Plastic Pipes with Modified Discrete Bubble Cavitation Model. Energies 2021, 14, 6756. [Google Scholar] [CrossRef]
- Jansson, M.; Andersson, M.; Karlsson, M. High-Speed Imaging of Water Hammer Cavitation in Oil–Hydraulic Pipe Flow. Fluids 2022, 7, 102. [Google Scholar] [CrossRef]
- Su, W.-T.; Zhao, W.; Binama, M.; Zhao, Y.; Huang, J.-Y.; Chen, X.-R. Experimental Francis Turbine Cavitation Performances of a Hydro-Energy Plant. Sustainability 2022, 14, 3263. [Google Scholar] [CrossRef]
- Podnar, A.; Hočevar, M.; Novak, L.; Dular, M. Analysis of Bulb Turbine Hydrofoil Cavitation. Appl. Sci. 2021, 11, 2639. [Google Scholar] [CrossRef]
- Liu, X.; Mou, J.; Xu, X.; Qiu, Z.; Dong, B. A Review of Pump Cavitation Fault Detection Methods Based on Different Signals. Processes 2023, 11, 2007. [Google Scholar] [CrossRef]
- Karagiovanidis, M.; Pantazi, X.E.; Papamichail, D.; Fragos, V. Early Detection of Cavitation in Centrifugal Pumps Using Low-Cost Vibration and Sound Sensors. Agriculture 2023, 13, 1544. [Google Scholar] [CrossRef]
- Ren, P.; Wang, B.; Zhang, W.; Xie, Z. Influence of Bubbles Causing Cavitation on Spool Oscillation of a Direct Drive Servovalve. Micromachines 2021, 12, 717. [Google Scholar] [CrossRef] [PubMed]
- Cavallo, D.M.; Chiavola, O.; Frattini, E.; Palmieri, F. A Novel Approach for Hydraulic Valve Experimental Assessment Under Cavitating Condition. Int. J. Fluid Power 2022, 23, 183–204. [Google Scholar] [CrossRef]
- Marfin, E.A.; Gataullin, R.N.; Abdrashitov, A.A. Acoustic Stimulation of Oil Production by a Downhole Emitter Based on a Jet-Driven Helmholtz Oscillator. J. Pet. Sci. Eng. 2022, 215, 110705. [Google Scholar] [CrossRef]
- Abramov, V.O.; Abramova, A.V.; Bayazitov, V.M.; Mullakaev, M.S.; Marnosov, A.V.; Ildiyakov, A.V. Acoustic and Sonochemical Methods for Altering the Viscosity of Oil during Recovery and Pipeline Transportation. Ultrason. Sonochemistry 2017, 35, 389–396. [Google Scholar] [CrossRef] [PubMed]
- Mullakaev, R.M.; Mullakaev, M.S. Ultrasound in the Processes of Treatment of Oil-Contamined Waste: Overview. Ecol. Ind. Russ. 2021, 25, 53–59. [Google Scholar] [CrossRef]
- Fu, L.; Zhang, G.; Ge, J.; Liao, K.; He, Y.; Wang, X.; Li, H. Study on Dual-Frequency Ultrasounds Assisted Surfactant Extraction of Oil Sands. Fuel Process. Technol. 2017, 167, 146–152. [Google Scholar] [CrossRef]
- Tyncherov, K.T.; Mukhametshin, V.S.; Paderin, M.G.; Selivanova, M.V.; Shokurov, I.V.; Almukhametova, E.M. Thermoacoustic Inductor for Heavy Oil Extraction. IOP Conf. Ser. Mater. Sci. Eng. 2018, 327, 042111. [Google Scholar] [CrossRef]
- Otumudia, E.; Hamidi, H.; Jadhawar, P.; Wu, K. The Utilization of Ultrasound for Improving Oil Recovery and Formation Damage Remediation in Petroleum Reservoirs: Review of Most Recent Researches. Energies 2022, 15, 4906. [Google Scholar] [CrossRef]
- Hamidi, H.; Haddad, A.S.; Otumudia, E.W.; Rafati, R.; Mohammadian, E.; Azdarpour, A.; Pilcher, W.G.; Fuehrmann, P.W.; Sosa, L.R.; Cota, N.; et al. Recent Applications of Ultrasonic Waves in Improved Oil Recovery: A Review of Techniques and Results. Ultrasonics 2021, 110, 106288. [Google Scholar] [CrossRef]
- Otumudia, E.; Hamidi, H.; Jadhawar, P.; Wu, K. Effects of Reservoir Rock Pore Geometries and Ultrasonic Parameters on the Removal of Asphaltene Deposition under Ultrasonic Waves. Ultrason. Sonochemistry 2022, 83, 105949. [Google Scholar] [CrossRef]
- Abbasov, M.M. Nontraditional Methods of Influence On Hydrocarbon Raw Material For The Intensification Of The Processes Of Its Processing. AutoGas Fill. Complex Altern. Fuel 2015, 11, 20–28. [Google Scholar]
- Zolotukhin, V.A. New technology for processing of heavy oil black and oil residues. Khimicheskoe Neftegazov. Mashinostroenie 2004, 10, 8–11. [Google Scholar]
- Kurochkin, A.K.; Kurochkin, A.V. ”VISBREAKING-THERMACAT ®”—The basic process of the modern oil refineries for high level oil processing. Expo. Oil Gas 2008, 3, 47–53. [Google Scholar]
- Prosin, M.V.; Potapov, A.N.; Ivanova, A.S.; Polishchuk, E.S. Rotor-Pulsation Machine for Extracting in Solid—Liquid System. Proc. Univ. Appl. Chem. Biotechnol. 2014, 10, 70–75. [Google Scholar]
- Promtov, M.A.; Avseev, A.S. Impul’snye tekhnologii pererabotki nefti i nefteproduktov. Neftepererab. Neft. 2007, 6, 22–24. [Google Scholar]
- Shamseddini, A.; Mowla, D.; Esmaeilzadeh, F. Continuous Treatment of Petroleum Products in a Tailor-Made Flow-through Sonoreactor. J. Pet. Sci. Eng. 2019, 173, 1149–1162. [Google Scholar] [CrossRef]
- Gildo, P.J.; Dugos, N.; Roces, S.; Wan, M.-W. Optimized Ultrasound-Assisted Oxidative Desulfurization Process of Simulated Fuels over Activated Carbon-Supported Phosphotungstic Acid. MATEC Web Conf. 2018, 156, 03045. [Google Scholar] [CrossRef]
- Desai, K.; Dharaskar, S.; Pandya, J.; Shinde, S.; Gupta, T. Trihexyl Tetradecyl Phosphonium Bromide as an Effective Catalyst/Extractant in Ultrasound-Assisted Extractive/Oxidative Desulfurization. Environ. Sci. Pollut. Res. 2022, 29, 49770–49783. [Google Scholar] [CrossRef]
- Jalali, M.R.; Sobati, M.A. Intensification of Oxidative Desulfurization of Gas Oil by Ultrasound Irradiation: Optimization Using Box–Behnken Design (BBD). Appl. Therm. Eng. 2017, 111, 1158–1170. [Google Scholar] [CrossRef]
- Dehkordi, A.M.; Kiaei, Z.; Sobati, M.A. Oxidative Desulfurization of Simulated Light Fuel Oil and Untreated Kerosene. Fuel Process. Technol. 2009, 90, 435–445. [Google Scholar] [CrossRef]
- Kairbekov, Z.K.; Anisimov, A.V.; Myltykbaeva, Z.K.; Kanseitova, D.K.; Rakhmanov, E.V.; Seisembekova, A.B. Sonocatalytic Oxidative Desulfurization of Oil from the Zhanazhol Oilfield. Mosc. Univ. Chem. Bull. 2017, 72, 29–33. [Google Scholar] [CrossRef]
- Margeta, D.; Sertić-Bionda, K.; Foglar, L. Ultrasound Assisted Oxidative Desulfurization of Model Diesel Fuel. Appl. Acoust. 2016, 103, 202–206. [Google Scholar] [CrossRef]
- Pedrotti, M.F.; Enders, M.S.P.; Pereira, L.S.F.; Mesko, M.F.; Flores, E.M.M.; Bizzi, C.A. Intensification of Ultrasonic-Assisted Crude Oil Demulsification Based on Acoustic Field Distribution Data. Ultrason. Sonochemistry 2018, 40, 53–59. [Google Scholar] [CrossRef] [PubMed]
- Nasiri, H.G.; Mosavian, M.T.H.; Kadkhodaee, R. Demulsification of Gas Oil/Water Emulsion via High-Intensity Ultrasonic Standing Wave. J. Dispers. Sci. Technol. 2013, 34, 483–489. [Google Scholar] [CrossRef]
- Xu, X.; Cao, D.; Liu, J.; Gao, J.; Wang, X. Research on Ultrasound-Assisted Demulsification/Dehydration for Crude Oil. Ultrason. Sonochemistry 2019, 57, 185–192. [Google Scholar] [CrossRef]
- Luo, X.; Gong, H.; Cao, J.; Yin, H.; Yan, Y.; He, L. Enhanced Separation of Water-in-Oil Emulsions Using Ultrasonic Standing Waves. Chem. Eng. Sci. 2019, 203, 285–292. [Google Scholar] [CrossRef]
- Hamidi, H.; Mohammadian, E.; Asadullah, M.; Azdarpour, A.; Rafati, R. Effect of Ultrasound Radiation Duration on Emulsification and Demulsification of Paraffin Oil and Surfactant Solution/Brine Using Hele-Shaw Models. Ultrason. Sonochemistry 2015, 26, 428–436. [Google Scholar] [CrossRef]
- Antes, F.G.; Diehl, L.O.; Pereira, J.S.F.; Guimarães, R.C.L.; Guarnieri, R.A.; Ferreira, B.M.S.; Flores, E.M.M. Effect of Ultrasonic Frequency on Separation of Water from Heavy Crude Oil Emulsion Using Ultrasonic Baths. Ultrason. Sonochemistry 2017, 35, 541–546. [Google Scholar] [CrossRef]
- Shorin, V.A.; Myasnikova, S.A. Improving Properties of Bitumen Emulsion with Ultrasound Treatment. Bull. Vologda State Univ. Ser. Tech. Sci. 2021, 2, 77–79. [Google Scholar]
- Mullakaev, M.S.; Mullakaev, R.M. Sonochemical Technology for Transportation of High Viscous. In Proceedings of the XII International Conference “Oil and Gas Chemixtry”, Tomsk, Russia, 26–30 September 2022; pp. 144–145. [Google Scholar]
- Zhou, L.; Wang, Z. A Comparison Study on the Removal of Paraffin Wax Deposition Plug by Ultrasound Treatment, Chemical Demulsifier and Combination of Ultrasound and Chemical Demulsifier. Pet. Sci. Technol. 2020, 38, 690–697. [Google Scholar] [CrossRef]
- Lauterborn, W.; Bolle, H. Experimental Investigations of Cavitation-Bubble Collapse in the Neighbourhood of a Solid Boundary. J. Fluid Mech. 1975, 72, 391. [Google Scholar] [CrossRef]
- Plesset, M.S.; Chapman, R.B. Collapse of an Initially Spherical Vapour Cavity in the Neighbourhood of a Solid Boundary. J. Fluid Mech. 1971, 47, 283–290. [Google Scholar] [CrossRef]
- Bogachev, I.N. Kavitacionnoe Razrushenie I Cavitacionnostoikie Splavi; Metallurgia: Moscow, Russia, 1972. [Google Scholar]
- Korobov, Y.; Alwan, H.; Makarov, A.; Kukareko, V.; Sirosh, V.; Filippov, M.; Estemirova, S. Comparative Study of Cavitation Erosion Resistance of Austenitic Steels with Different Levels of Metastability. Met. Work. Mater. Sci. 2022, 24, 61–72. [Google Scholar] [CrossRef]
- Rodionov, V.P.; Ukolov, A.I. The Laws of Cavitation Erosion of Construction Materials. Her. Dagestan State Tech. Unive. Tech. Sci. 2017, 44, 39–47. [Google Scholar] [CrossRef][Green Version]
- Silva, C.A. da Corrosion in Multiphase-Flow Pipelines: The Impact on the Oil and Gas Industry. Ph.D. Thesis, Universidade de São Paulo, São Paulo, Brazil, 2023. [Google Scholar]
- Osterland, S.; Müller, L.; Weber, J. Influence of Air Dissolved in Hydraulic Oil on Cavitation Erosion. Int. J. Fluid Power 2021, 22, 373–392. [Google Scholar] [CrossRef]
- Rao, B.C.S.; Buckley, D.H. Erosion of Aluminum 6061-T6 under Cavitation Attack in Mineral Oil and Water. Wear 1985, 105, 171–182. [Google Scholar] [CrossRef]
- Skvortsov, S. Techniques of Ultrasound Cavitation Control. Sci. Educ. Bauman MSTU 2015, 15, 83–100. [Google Scholar] [CrossRef]
- Li, C.; He, J.; Jia, W.; Yang, F.; Ban, J.; Qui, B. Modeling transient cavitating flow in large drop crude oil pipelines. J. Pet. Sci. Eng. 2023, 220, 111241. [Google Scholar] [CrossRef]
- Zheng, Z.; Ou, G.; Jin, H. Numerical-Experimental Study on the Erosion-Cavitation Wear of Coal Oil Slurry Valve. In Proceedings of the ASME 2017 Pressure Vessels and Piping Conference, Volume 3A: Design and Analysis, Waikoloa, HI, USA, 16–20 July 2017. [Google Scholar] [CrossRef]
- Ajinomoh, C.S.; Momoh, O.R.; Maku, J.J. Hydrodynamic Cavitation as Oil Pretreatment Prior to Distillation. In Proceedings of the SPE Nigeria Annual International Conference and Exhibition, Lagos, Nigeria, 31 July–2 August 2023. [Google Scholar] [CrossRef]
- He, X.; Liu, H.; Jiang, W.; Zheng, W.; Zhang, H.; Lv, K.; Chen, H. Experimental study and numerical simulation of heavy oil viscosity reduction device based on jet cavitation. Pet. Sci. Technol. 2023. [Google Scholar] [CrossRef]
- Cui, J.; Zhang, Z.; Liu, X.; Liu, L.; Peng, J. Studies on viscosity reduction and structural change of crude oil treated with acoustic cavitation. Fuel 2020, 263, 116638. [Google Scholar] [CrossRef]
- Silva, C.A.; Varela, L.B.; Kolawole, F.O.; Tschiptschin, A.P.; Panossian, Z. Multiphase-flow-induced corrosion and cavitation-erosion damages of API 5L X80 and API 5DP grade S steels. Wear 2020, 452–453, 203282. [Google Scholar] [CrossRef]
- Bolleter, U.; Schwarz, D.; Carney, B.; Gordon, E.A. Solution to Cavitation Induced Vibration Problems in Crude Oil Pipeline Pumps. In Proceedings of the Eight International Pump Users Symposium, College Station, TX, USA; 1991; pp. 21–27. [Google Scholar] [CrossRef]
- Luo, J.; Xu, W.; Zhai, Y.; Zhang, Q. Experimental Study on the Mesoscale Causes of the Influence of Viscosity on Material Erosion in a Cavitation Field. Ultrason. Sonochemistry 2019, 59, 104699. [Google Scholar] [CrossRef]
- Brujan, E.A. Cavitation bubble dynamics in non-newtonian fluids. Polym. Eng. Sci. 2010, 49, 419–431. [Google Scholar] [CrossRef]
- Kuryakov, V.N. Influence of Ultrasonic Treatment on Kinetic of Asphaltene Aggregation in Toluene/Heptane Mixture. J. Phys. Conf. Ser. 2021, 1942, 012035. [Google Scholar] [CrossRef]
- Volkova, G.I.; Morozova, A.V. Strukturnie preobrasovaniya asphaltenov bituma posle ultrazvukovoi obrabotki. Khimiya Tverd. Topl. 2022, 2, 51–55. [Google Scholar] [CrossRef]
- Dengaev, A.V.; Kayumov, A.A.; Getalov, A.A.; Aliev, F.A.; Baimukhametov, G.F.; Sargin, B.V.; Maksimenko, A.F.; Vakhin, A.V. Chemical Viscosity Reduction of Heavy Oil by Multi-Frequency Ultrasonic Waves with the Main Harmonics of 20–60 KHz. Fluids 2023, 8, 136. [Google Scholar] [CrossRef]
- Kotukhov, A.V.; Efremov, D.V.; Bannikova, I.A.; Bayandin, Y.V.; Uvarov, S.V.; Naimark, O.B.; Zharko, N.A.; Dezhkunov, N.V. Study of cavitation noise without subharmonics. Thecnical Phys. Lett. 2023, 49, 39. [Google Scholar] [CrossRef]
Disclaimer/Publisher’s Note: The statements, opinions and data contained in all publications are solely those of the individual author(s) and contributor(s) and not of MDPI and/or the editor(s). MDPI and/or the editor(s) disclaim responsibility for any injury to people or property resulting from any ideas, methods, instructions or products referred to in the content. |
© 2023 by the authors. Licensee MDPI, Basel, Switzerland. This article is an open access article distributed under the terms and conditions of the Creative Commons Attribution (CC BY) license (https://creativecommons.org/licenses/by/4.0/).