Article

The Effects of Mainstream Reynolds Number and Blowing Ratio on Film Cooling of Gas Turbine Vanes

by
Germán Sierra-Vargas
,
Diego Garzón-Alvarado
and
Carlos Duque-Daza
*
Department of Mechanical and Mechatronics Engineering, Universidad Nacional de Colombia, Bogotá 111321, Colombia
*
Author to whom correspondence should be addressed.
Fluids 2023, 8(10), 263; https://doi.org/10.3390/fluids8100263
Submission received: 3 August 2023 / Revised: 15 September 2023 / Accepted: 19 September 2023 / Published: 26 September 2023
(This article belongs to the Section Heat and Mass Transfer)

Abstract

:
Film cooling performance was evaluated numerically for three mainstream Reynolds numbers and four blowing ratios (BR). A computational model based on finite volume discretization was used to solve an incompressible and transient flow over a NACA 4412 cascade vane. Several passive scalars were included in the model to evaluate the condition of adiabatic temperature and constant temperature for the surface vane. For the adiabatic temperature condition, the film effectiveness mainly depends on the jet trajectory and recirculation zones. For the constant temperature condition, the net heat flux reduction (NHFR) varies according to the boundary layer separation and reattachment. Consequently, misleading conclusions could be drawn if only one of the two approaches is adopted. For instance, the mainstream Reynolds number Re = 3615 reached a maximum average effectiveness lower than 0.3 with an average NHFR of 0.25. However, for Re = 10,845 the maximum average effectiveness was close to 0.45, but with negative average NHFR values. This finding demonstrates the need to explore new indicators like jet trajectory, convective coefficient and skin friction coefficient, as presented in this paper.

1. Introduction

Gas turbines are mainly used for aircraft propulsion and electric power generation [1]. In fact, there are no outstanding alternatives that can replace gas turbines as a feasible alternative for aircraft propulsion in the coming years. First, a compact gas turbine can provide high thrust with dimensions that fit the weight and space requirements of an aircraft [2]. Additionally, it takes advantage of forward speeds and flight altitudes that are favorable for the thermodynamic cycle. Secondly, the absence of alternating elements ensures high reliability, reduces the need for lubricating oil and facilitates maintenance [3]. From the power generation perspective, gas turbines have positioned themselves as one of the preferred options. This is due to low costs and the ability to operate with various fuels [4]. Also, the start-up and shut-down times are quite short, which allows for their intermittent operation in the face of different energy demands [5]. This characteristic makes them a valuable complement to non-constant alternative sources such as solar, wind and tidal energy. As a result, gas turbines are also playing an important role in the transition to renewable energy [6].
For these reasons, efforts have been devoted to continue developing high-efficiency gas turbines. This has been achieved, for instance, by increasing the rotor inlet temperature (RIT). Generally, an increase of 50 K-RIT generates approximately 10% additional power and a 3% increase in the cycle efficiency [7]. Today’s gas turbines operate with RIT close to 1800 K, achieving efficiencies around 45% in the simple-cycle and above 60% in the combined-cycle [8]. However, high temperatures inside the combustor favor the formation of some pollutants, which has limited the maximum value of RIT. Hence, advanced combustion chambers have been developed that manage to reduce emissions of NOx by actively adjusting the air-fuel premix (DLN) [9]. In this way, better control of the reaction products is obtained, allowing higher turbine inlet temperatures (TIT) to be used. In this regard, it is expected that new combustor designs will make it possible to exceed 2000 K-RIT in the near future [10].
Even so, the increase in TIT is undesirable for the turbine elements, especially for the vanes located in the first stage. Such extreme temperature conditions can cause creep, high-temperature corrosion and thermal fatigue problems [11,12]. Worse still, the TIT values can be well above the permissible temperature of the materials, which is approximately 1300 K [13]. As a solution, thermal barrier coatings (TBC) are used for the manufacture of the vanes, allowing them to withstand temperatures close to 1600 K [14]. Moreover, the use of ceramic matrix composites (CMCs) and environmental barrier coatings (EBCs) is being investigated to further increase their resistance to those higher TIT values [15,16].
Nevertheless, advances in materials science have not been sufficient to fully protect the turbine components. An alternative strategy to attenuate such a drawback is to induce cooling mechanisms. For instance, a portion of air can be drawn from the compressor to cool the elements in the hot section. With respect to the vanes, the cooling air can be routed through several internal passages designed to maximize heat transfer, which is then expelled through a set of holes in order to reduce the surface temperature as well [17]. Figure 1 depicts this method, which is known as film cooling. In this approach, the gases coming from the combustor enter the turbine with a temperature T . At the same time, air is injected with a velocity U j and a temperature T j , usually lower than T . The mainstream velocity U causes the jet to adhere to the surface, forming a protective layer on the vane.
Refrigeration or cooling schemes have made it possible to increase the TIT value, in turn producing an increase in cycle efficiency. However, by removing air from the compressor, the mass flow used for power generation is reduced. So, using too much refrigerant causes a decrease in performance, while too little refrigerant leads to deficient cooling [18]. Approximately 5% of the total air is used to cool the combustor walls, discs and turbine vanes [19].
Therefore, it is common to try to optimize the amount of coolant flow by developing more effective cooling technologies. As for film cooling, there are still a number of challenges to overcome [20]. First of all, it is necessary to gain a deeper understanding of the mechanism by which the coolant interacts with the gases from the combustion chamber. This phenomenon is quite complex due to the formation of different vortices that modify the heat transfer [21]. Secondly, additional indicators are required to comprehensively assess the impact of the film cooling. Usually, the effectiveness is analyzed only from the temperature distributions, while the convective coefficient or refrigerant expenditure are considered less frequently [22,23,24]. It is also important to study other factors such as net heat flux reduction (NHFR). This criterion takes into account the temperature decrease caused by the coolant, but also the increase in the convective coefficient due to the injection process [25]. Thirdly, most of the studies are aimed at modifying the jet hole geometry [26,27,28]. Although the results demonstrate an improvement in cooling, they do not provide sufficient information on the possible implications on vane aerodynamics. For instance, incorporating slots or ramps near the injection may generate pressure losses, as well as a decrease in the main flow due to boundary layer detachment [29,30,31]. In this way, it is necessary to jointly investigate the cooling effectiveness with the flow dynamics.
The objective of this study is to investigate whether the film cooling method can be detrimental for some mainstream Reynolds numbers and blowing ratios (BR). Therefore, the film cooling performance is evaluated over a NACA 4412 cascade vane for different mainstream and jet velocities. On the one hand, the jet trajectory is used to analyze recirculation and high-temperature zones. The film cooling behavior is also related to the jet trajectory, finding that the film effectiveness decreases rapidly as the jet moves away from the surface. In contrast, it was found that NHFR depends mainly on the development of the boundary layer. An analysis of the convective coefficient and skin friction coefficient reveals that the film cooling increases the heat transfer to some regions of the vane.
The paper is organized as follows. In Section 2, the considerations used in the computational model are described. In Section 3, the results of the validation on flat plate are reported. In the same section, the results of the simulations over a NACA 4412 cascade vane are shown. Finally, Section 4 and Section 5 present the conclusions and future research.

2. Numerical and Computational Methods

Assuming a continuum, the mathematical model was based on the principles of conservation of mass, momentum and energy. In addition, the macroscopic properties of the fluid can be used to describe the flow behavior, for instance, a uniform density ρ . In this sense, Equation (1) is obtained by applying the principle of conservation of mass to a transient, incompressible and three-dimensional flow.
· U = 0
This expression corresponds to the equation of continuity, where U is the fluid velocity.
The principle of conservation of momentum is based on Newton’s second law. It states that the rate of change in momentum is equal to the sum of the forces acting on a fluid particle. Hence, Equation (2) is obtained for a transient, incompressible and three-dimensional flow.
U t + U · U = p + ν 2 U
In this formula, p represents the pressure normalized by the density and ν is the kinematic viscosity of the fluid.
Since the flow is incompressible, the energy transport equation is not required to solve the mathematical model. However, the temperature was simulated as a passive scalar in order to study the film cooling performance. As shown in Equation (3), the temperature has no influence on the physical properties of the fluid, it is only a field transported by the velocity U.
T t + · ( U T ) = ( λ T )
This expression corresponds to the convection-diffusion equation, where T is the temperature and λ is the thermal diffusivity coefficient of the fluid.
Moreover, the fluid properties were estimated as a weighted average based on the volumetric flows. For example, the method for calculating the kinematic viscosity ν is presented in Equation (4).
ν = ν @ T · Q + ν @ T j · Q j Q + Q j
where the kinematic viscosity at the mainstream temperature ν @ T and the kinematic viscosity at the jet temperature ν @ T j are weighted by each corresponding volumetric flow Q and Q j . The resulting value is divided by the total volumetric flow.
Large eddy simulation (LES) was used to model the flow turbulence. In this method, the large-scale turbulent structure is calculated directly, while the small-scale turbulent structures are predicted by the subgrid-scale model (SGS) [32]. Specifically, wall-adapting local eddy-viscosity (WALE) was used in this work, since it takes into account the energy dissipation in eddies and convergence zones. This model is based on the square of the velocity gradient tensor, so it considers the strain rate and the rotation rate of the smallest resolved turbulent fluctuations [33]. The eddy-viscosity ν t is computed as presented in Equation (5).
ν t = ( C w Δ ) 2 ( S i j d S i j d ) 3 / 2 ( S ¯ i j S ¯ i j ) 5 / 2 + ( S ¯ i j S ¯ i j ) 5 / 4
where C w is the WALE constant, Δ is the length scale, S i j represents the deformation tensor, and S i j d denotes the traceless deformation tensor. Therefore, WALE model reproduces the near-wall scaling of the eddy-viscosity without a dynamic procedure, which is convenient for complex geometries. For instance, this model was employed to investigate the film cooling for different jet hole geometries on a flat plate [34,35]. As a result, the interaction between the jet and the mainstream turbulent boundary layer is reasonably predicted [36].
The finite volume method (FVM) was used for the spatial discretization. This technique transforms partial differential equations into a system of linear algebraic equations. In a first step, the conservation principles equations are integrated and transformed into balance equations over small fluid volumes. In a second step, interpolation profiles are chosen to approximate the change in variables within each of these volumes [37]. Additionally, the Crank–Nicolson method was used for temporal discretization. It is a semi-implicit scheme based on a weighted average between the explicit and implicit formulations. This results in a second-order and numerically stable method [32].
Pressure–velocity coupling was performed using the PIMPLE algorithm, which is a combination of pressure-implicit with operator splitting (PISO) and semi-implicit method for pressure-linked equations (SIMPLE) [38,39]. Four internal correctors and one non-orthogonal corrector were used to compute the pressure. On the other hand, the criteria for moving to the next time step were nine outer correctors or reaching a pressure and velocity residual of 1 × 10 5 . The PIMPLE algorithm is accurate and stable, because during each outer corrector the variables are updated [40]. This allowed a variable time step and a fixed Courant number equal to 1.5 to be used in the simulations. However, the maximum time step was restricted not to exceed 5 × 10 4 s to avoid decreasing the temporal accuracy.
The computational model was implemented in OpenFOAM. It is a set of open source libraries focused on finite volume discretization. This software has a wide variety of solvers, utilities and applications to resolve problems related to continuum mechanics, but also to perform preprocessing and postprocessing activities [41]. For instance, OpenFOAM includes a transient solver for incompressible and turbulent flows of Newtonian fluids called pimpleFOAM. Simulations were carried out with this solver, because it also uses the PIMPLE algorithm in the pressure-velocity coupling.
Computations were performed with parallel processing on a DELL Precision 7820 workstation equipped with 64GB RAM and under Slackware linux OS. In addition, the workstation has an Intel® Xeon® E5 processor @3.4GHz with twelve physical cores. Nevertheless, hyper-threading technology made it possible to compute using twenty cores, so each simulation required about ninety hours. Regarding the software, OpenFoam v8 and ParaView 5.6.0 were employed. Similarly, GNU Octave 5.2.0 and gnuplot 5.2 were used for minor postprocessing work.

3. Results and Discussion

First, the computational model was tested on a flat plate. For this geometry, the adiabatic temperature was obtained to analyze the jet position. As expected, the jet moved away from the surface as BR increased. Furthermore, the film effectiveness was contrasted with results presented by other authors, being consistent with the reported numerical and experimental data.
Secondly, the film cooling performance was studied over a NACA 4412 cascade vane. In this case, the jet trajectory was compared with velocity and temperature distributions in order to identify possible critical regions near the surface. Similarly, the film effectiveness was related to the location of the coolant stream, finding that the film cooling behavior depends on the jet trajectory. Subsequently, the skin friction coefficient and the convective coefficient were calculated. The results indicate that negative NHFR values coincide with boundary layer separation and regions where heat flux increased.

3.1. Validation on a Flat Plate

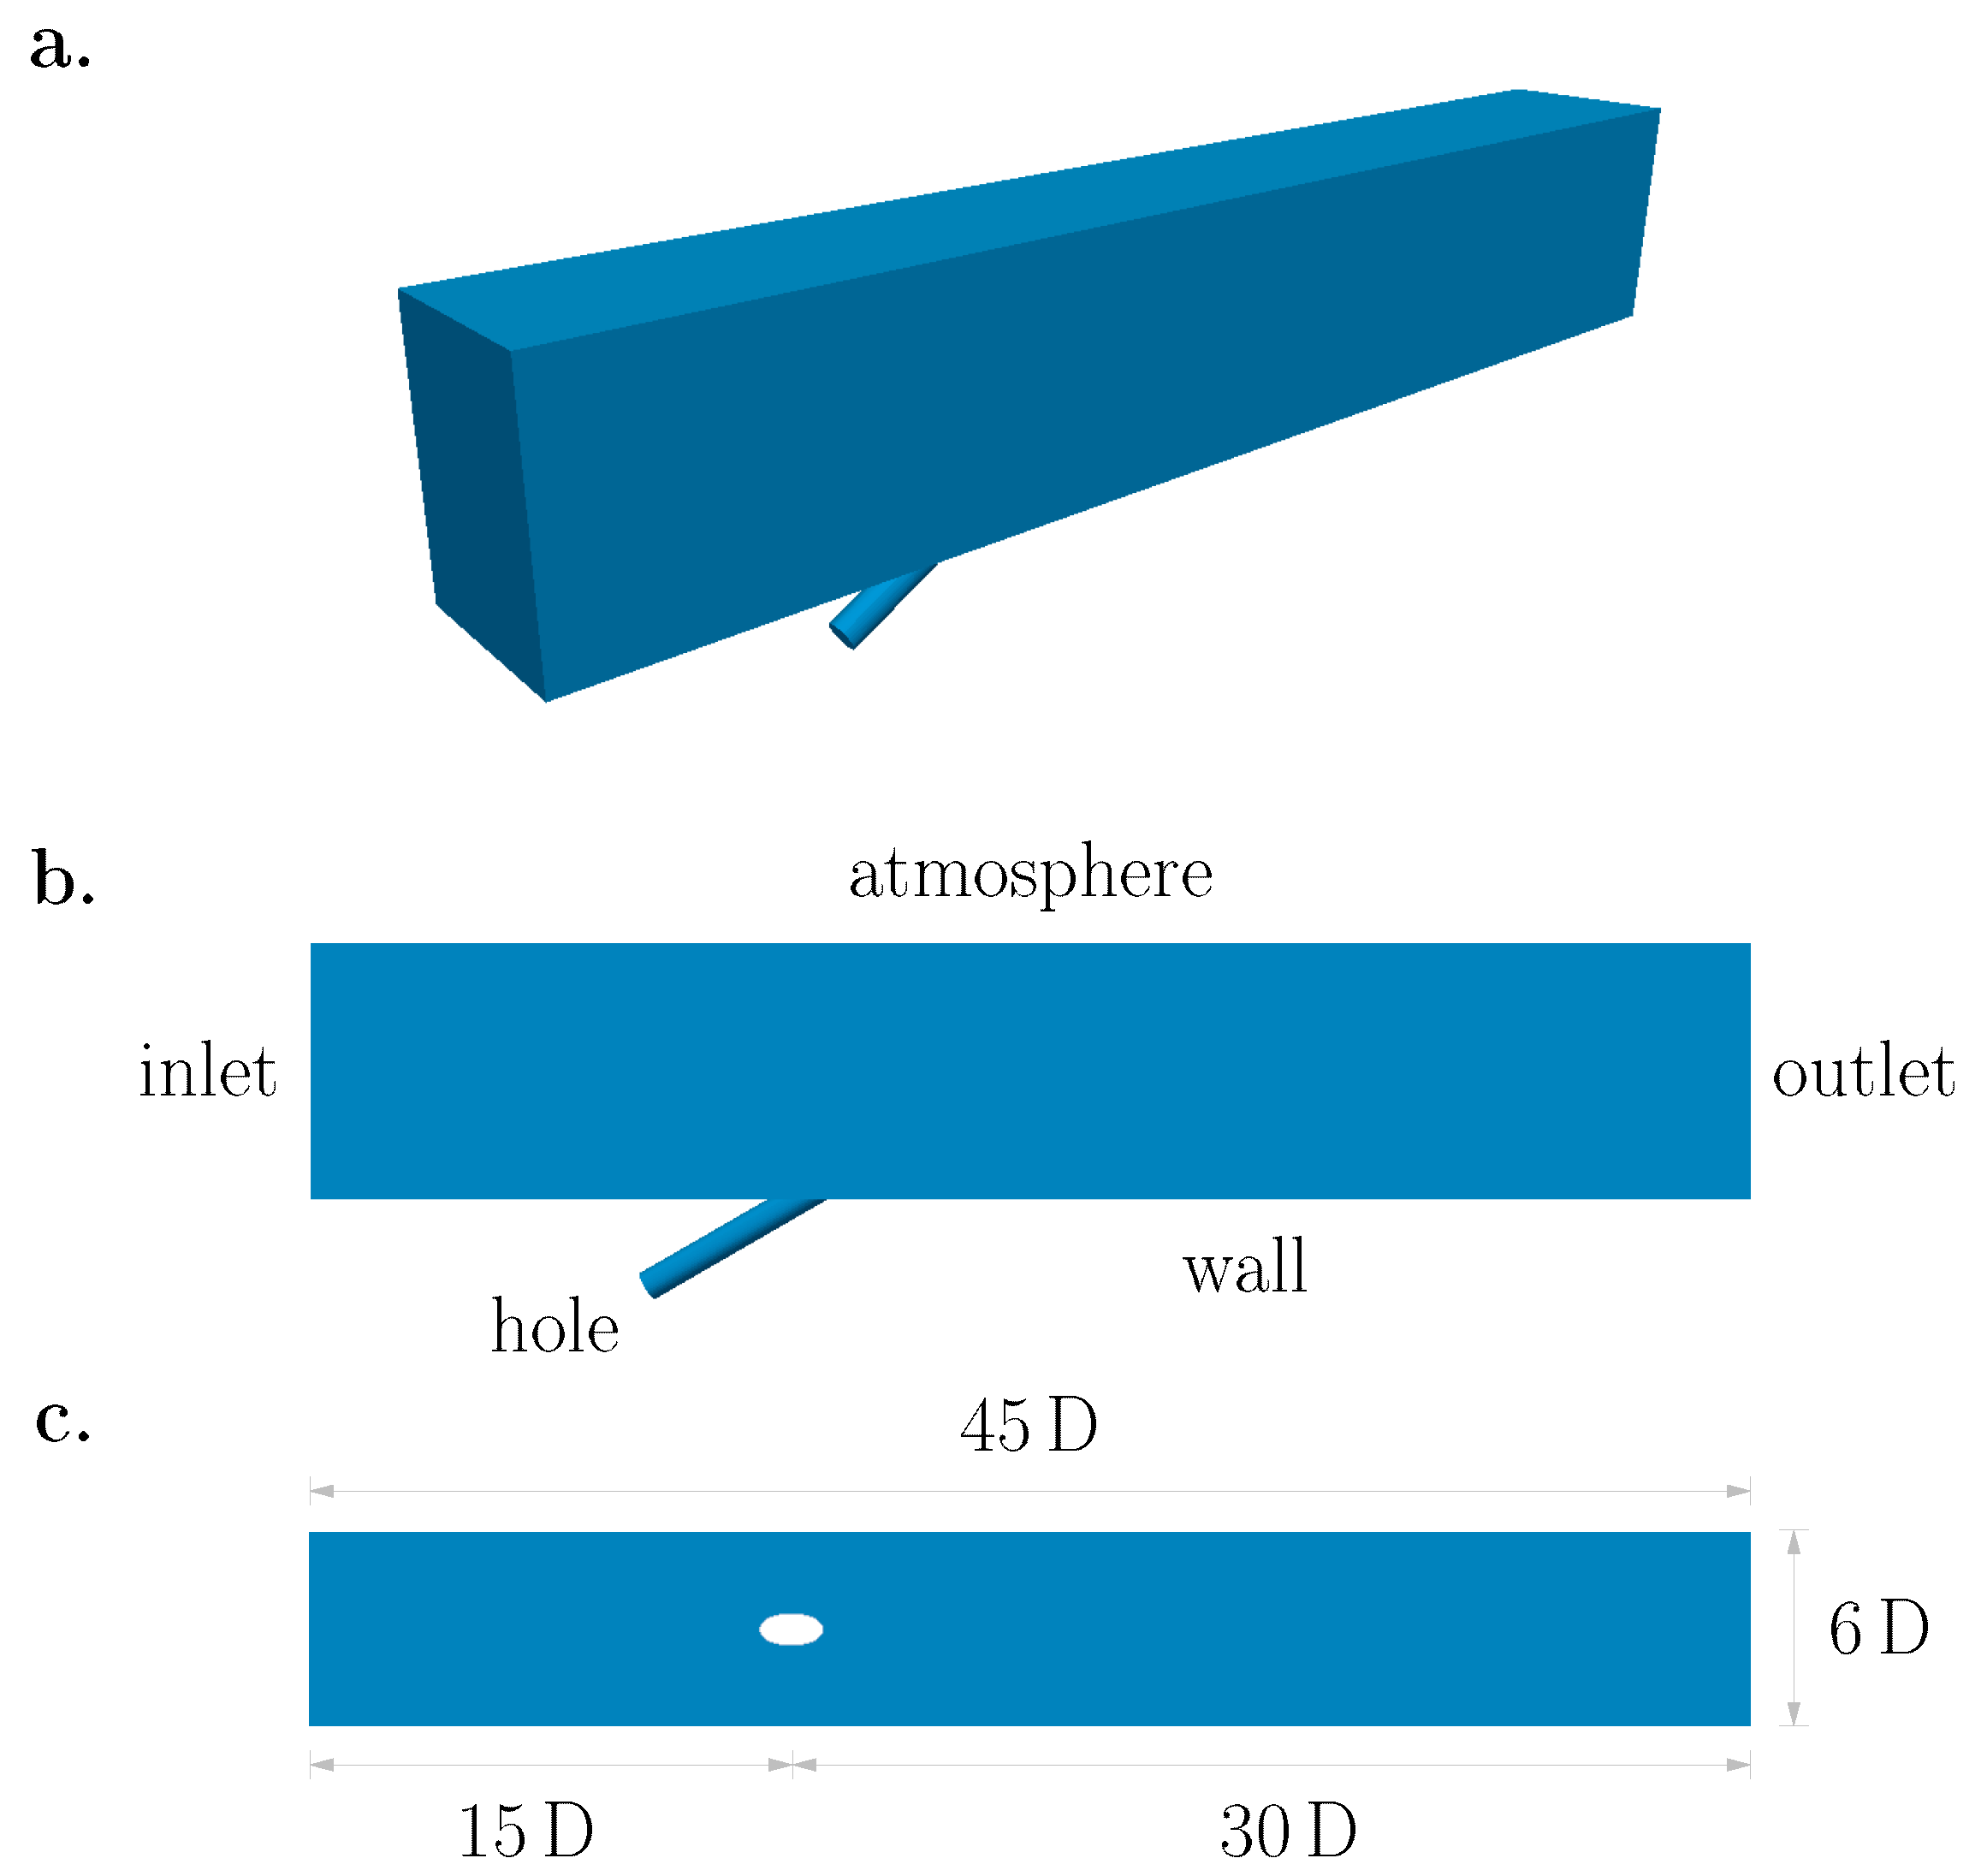
As shown in Figure 2, the geometry corresponds to a flat plate with a single hole of diameter D. The pipe was 6 D length with an angle of inclination of 30°. It was located 15 D from the boundary inlet to allow a fully developed flow at the mainstream entrance. Also, the plate was 30 D length downstream of the injection in order to identify the jet trajectory. For the same reason, a computational domain of 3 D width and 8 D height was chosen. In fact, the selected dimensions are similar to those used by Baagherzadeh [42]. In that work, the injection was investigated, finding acceptable results for a pipe of 5 D length. However, the computational domain was 35 D length and approximately 2 D width. These differences were due to the boundary conditions selected in the present study.
The boundary conditions for the velocity and pressure fields are shown in Table 1, where the subscript n denotes the normal direction to the plane and the subscript t represents the tangential direction to the plane. The subscript b indicates that the value is calculated from the other local fields. Afterwards, a description of the boundary conditions is presented.
The mainstream enters through the boundary inlet, while the injection of the jet takes place through the boundary hole. At both boundaries, the volumetric flow was prescribed to guarantee a uniform velocity over the patch. With respect to the pressure, a fixed gradient condition was used in order to allow the propagation of the perturbations [43]. For the same purpose, at the boundary outlet, a null Neumann condition for the velocity and a Dirichlet condition for the pressure were applied. Here, the reference pressure p r e f is the fluid pressure under quiescent conditions and away from the boundary. This value was set to zero for convenience.
At boundary atmosphere, both inflow and outflow were permitted. For the inflow, the reference pressure decreases as the velocity increases. As a consequence, pressure gradients decrease causing the fluid to decelerate. Therefore, the pressure and velocity fields are stabilized, resulting in a robust and stable solution. For the outflow, the boundary conditions are similar to those prescribed at the boundary outlet.
Additionally, a symmetry condition was used on boundaries front and back, to reduce the computational demand. For the pressure, this boundary condition reduces to zero gradient. For the velocity, this boundary condition is zero gradient in the tangential direction and zero fixed value in the normal direction. Finally, a no-slip condition was applied to the boundary wall to represent a solid and impermeable border.
The boundary conditions for the passive scalars are shown in Table 2, where the subscript n denotes the direction normal to the plane. Subsequently, a description of the boundary conditions employed is presented.
Firstly, T d y e is a dimensionless tracer used to determine the jet trajectory. At the boundary hole, a fixed value equal to one was set representing the entrance of the coolant. Conversely, at the boundary inlet, a zero gradient condition was prescribed in order to prevent diffusion by concentration gradients. At the boundary wall, a null Neumann condition was applied to represent the flow constraint across the border.
Secondly, T a d is the adiabatic temperature, which corresponds to the maximum temperature that could be encountered on the walls. For this field, a Dirichlet condition was used at boundaries inlet and hole, with the mainstream temperature T and the jet temperature T j , respectively. Regarding the boundary wall, a zero gradient condition was set to avoid heat flux, since it is considered an adiabatic surface.
Thirdly, T q is a passive scalar used to calculate the heat transfer to the walls. As with the adiabatic temperature, a fixed value was prescribed at boundaries inlet and hole according to the mainstream temperature T and the jet temperature T j . Nevertheless, at the boundary wall, a Dirichlet condition was applied in order to compute the temperature gradients over the surface. The results can be interpreted as the heat flux required to maintain a constant temperature at the boundary. Here, the value of the jet temperature T j was chosen as a reference.
For the three passive scalars, a null Neumann condition was set at boundary outlet. In a similar way, a symmetry condition was prescribed at the boundaries front and back which, for scalar fields, simplifies to a zero gradient condition. With respect to the boundary atmosphere, the condition alternates between a fixed value and a fixed gradient.
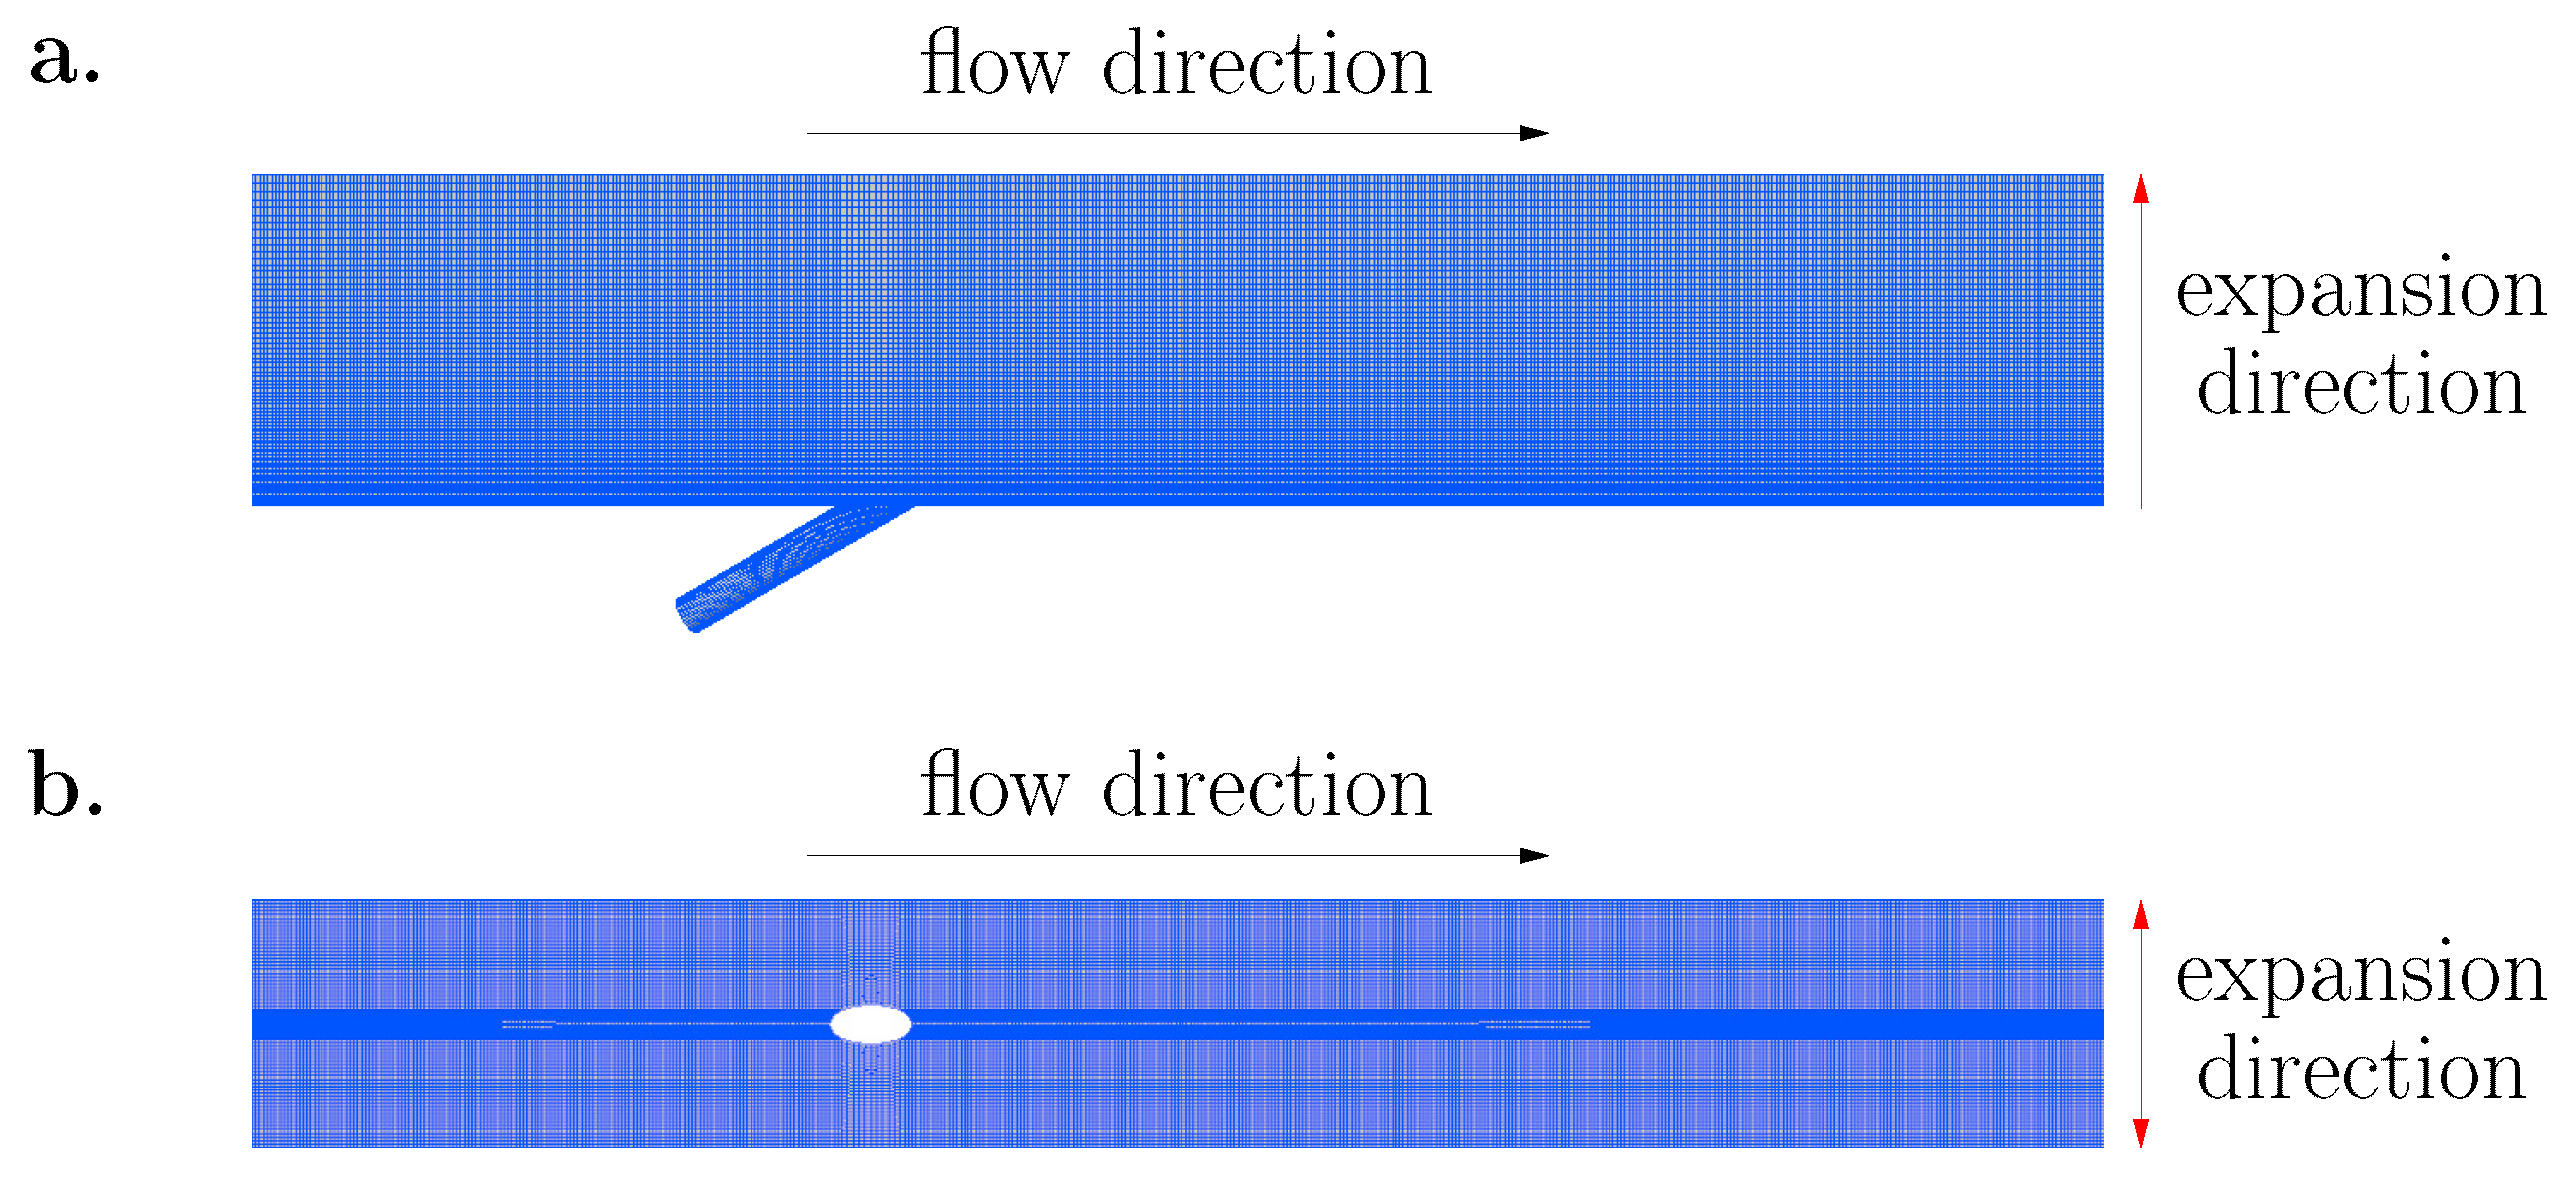
On the other hand, the computational grid was built with blockMesh of OpenFOAM. This utility is a structured mesh generator that supports cell size gradation and curved edges [41]. As presented in Figure 3, the near wall region was refined to capture the boundary layer development more accurately. For this purpose, different levels of refinement were evaluated until the value of y + was around one and below five in all cases studied. This was achieved with a start cell size of about 0.04 D height and an expansion ratio of five. Consequently, the computational domain was composed of twelve blocks with a total of 3,040,000 hexahedral cells.
Four simulations were performed on a flat plate for BR = 0.5, 1, 1.5 and 2. For all cases, the mainstream velocity U was fixed and the jet velocity U j was adjusted according to Equation (6).
BR = U j U
In this sense, a mainstream volumetric flow Q = 2.4 × 10 3 m3/s was prescribed in order to ensure a uniform velocity U = 0.5 m/s at the boundary inlet. This value is equivalent to a mainstream Reynolds number Re = 4947, computed with the length upstream of the injection.
Table 3 shows the BR, jet volumetric flows Q j and jet velocities U j employed. The jet Reynolds number Re j was calculated using the pipe diameter as the characteristic length.
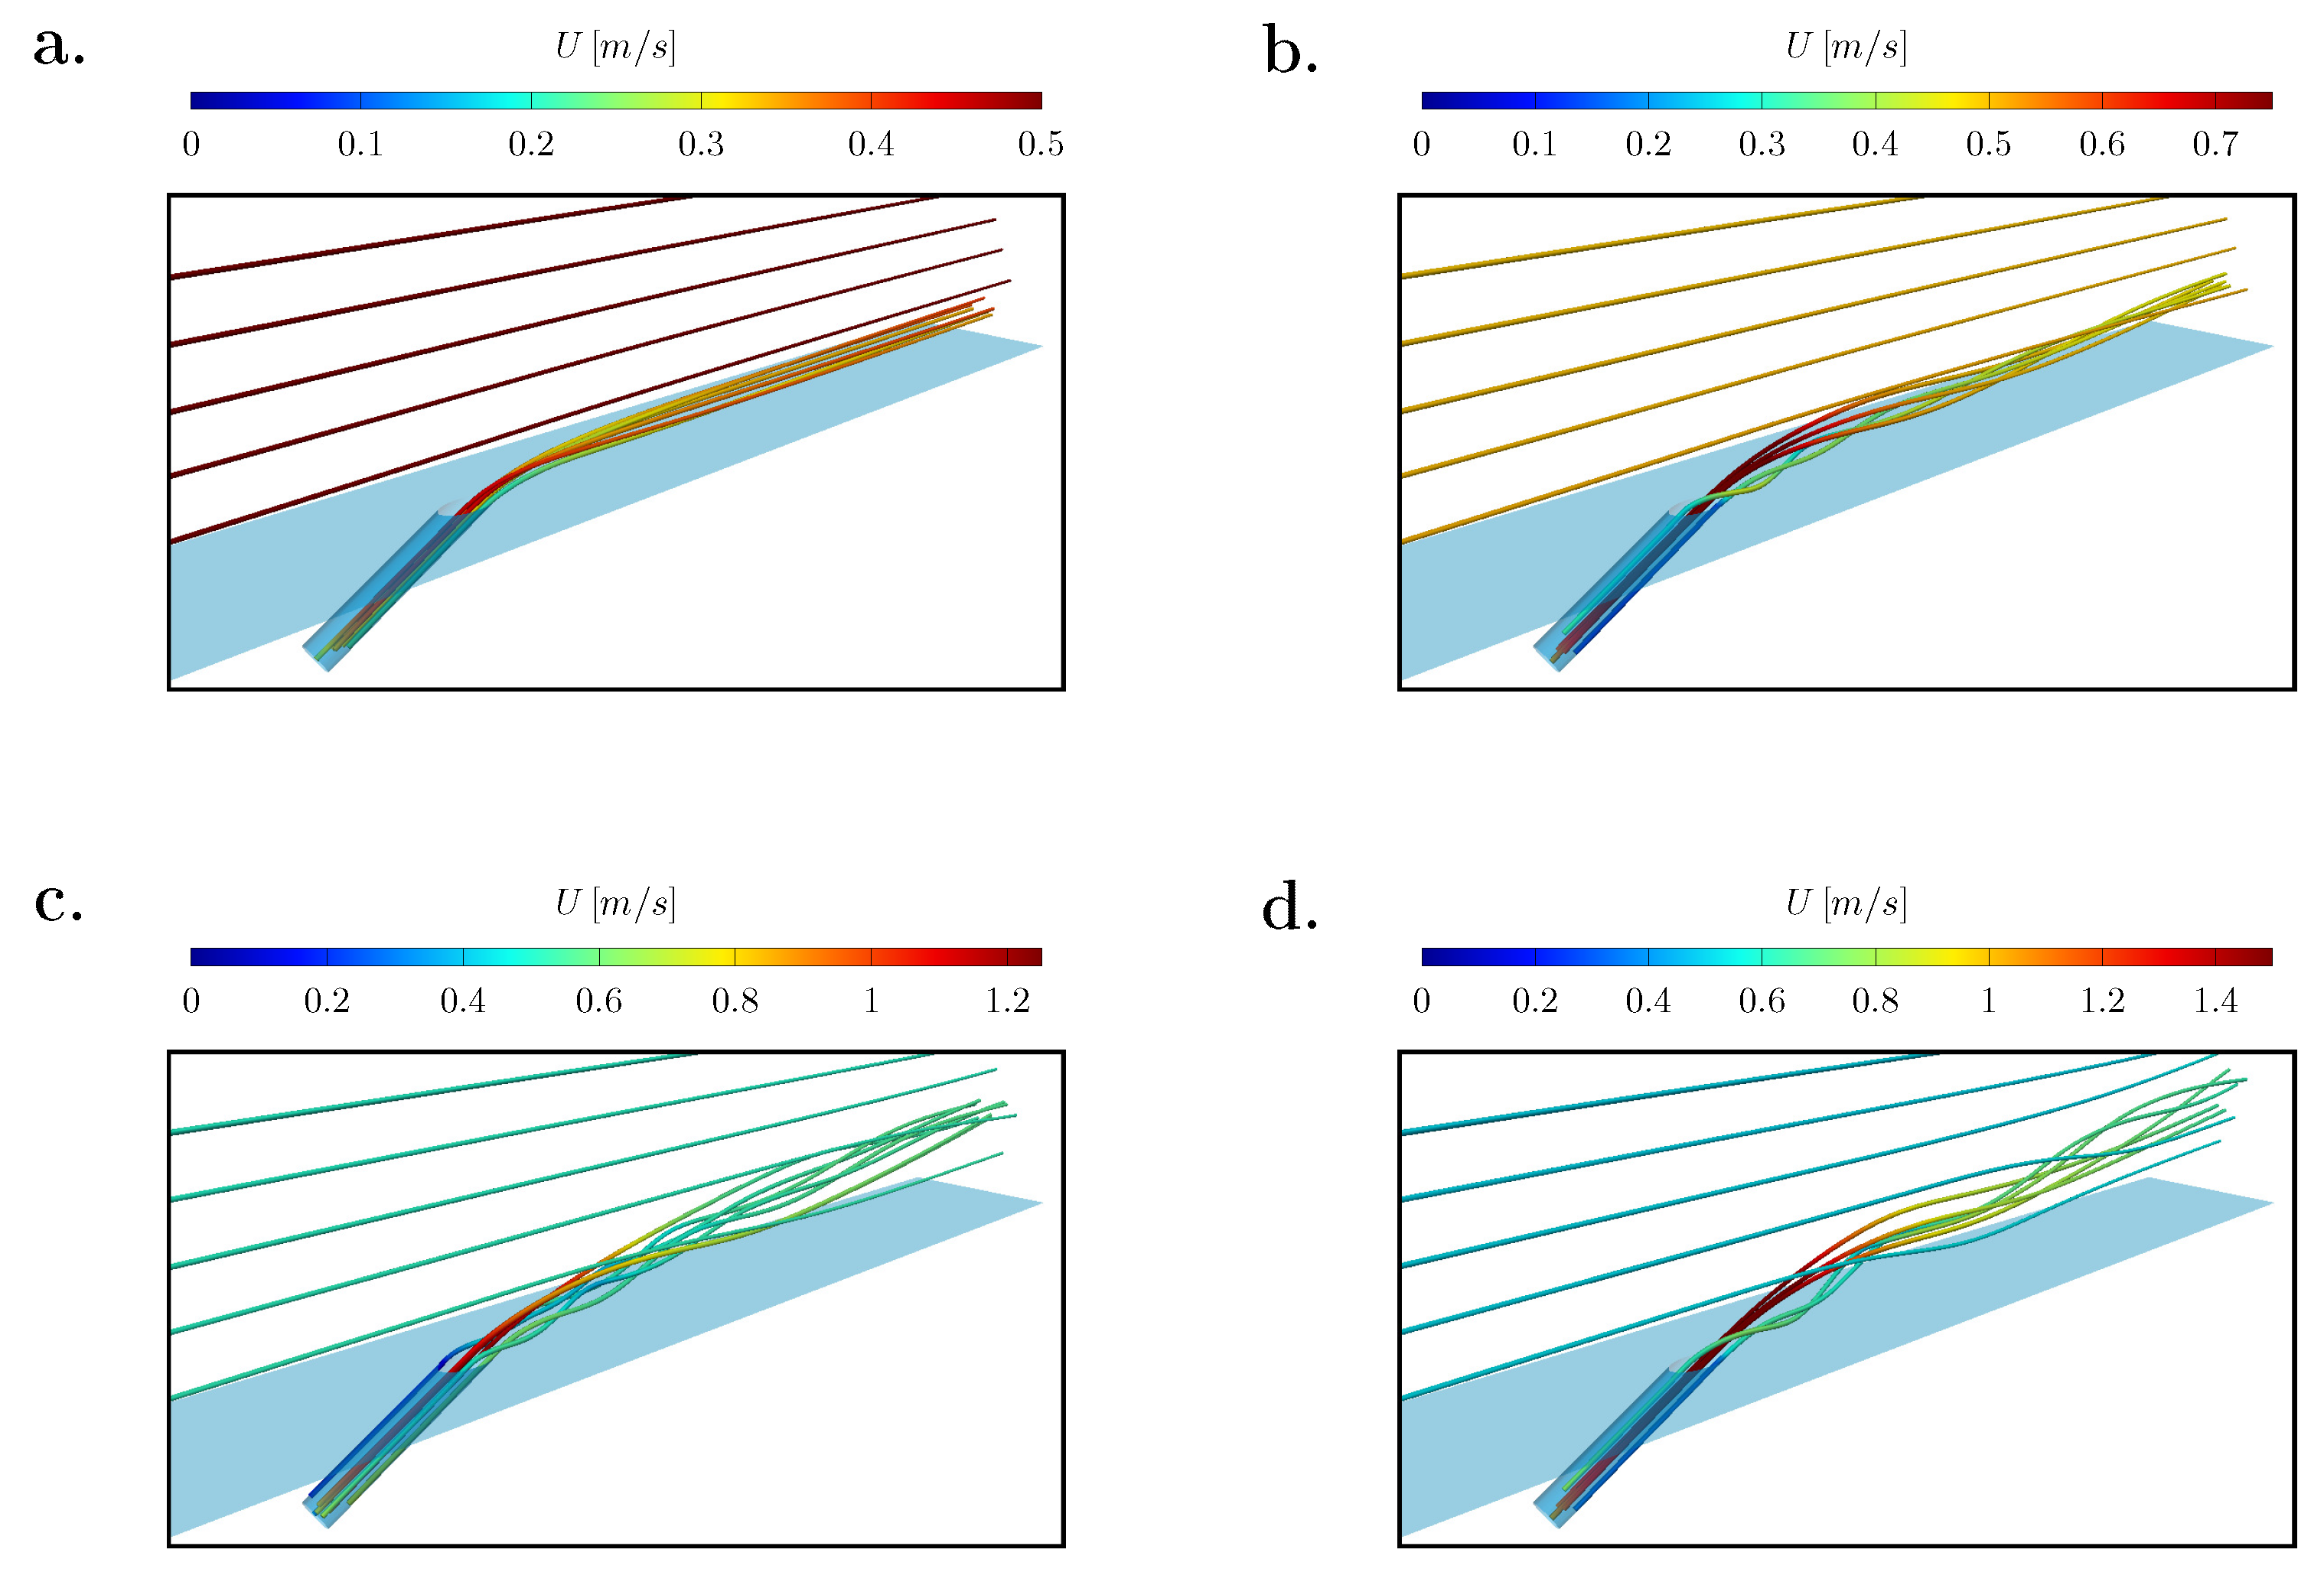
Computations were performed until the pressure, velocity and temperature reached a steady state. Hence, simulations ran for 3 s based on the evolution of these fields in the entire domain. Thereafter, the mean values were calculated until a time of 6 s had elapsed. As shown in Figure 4, the mainstream mean velocity was uniform before injection, but then changes depending on the jet height.

3.1.1. Adiabatic Temperature

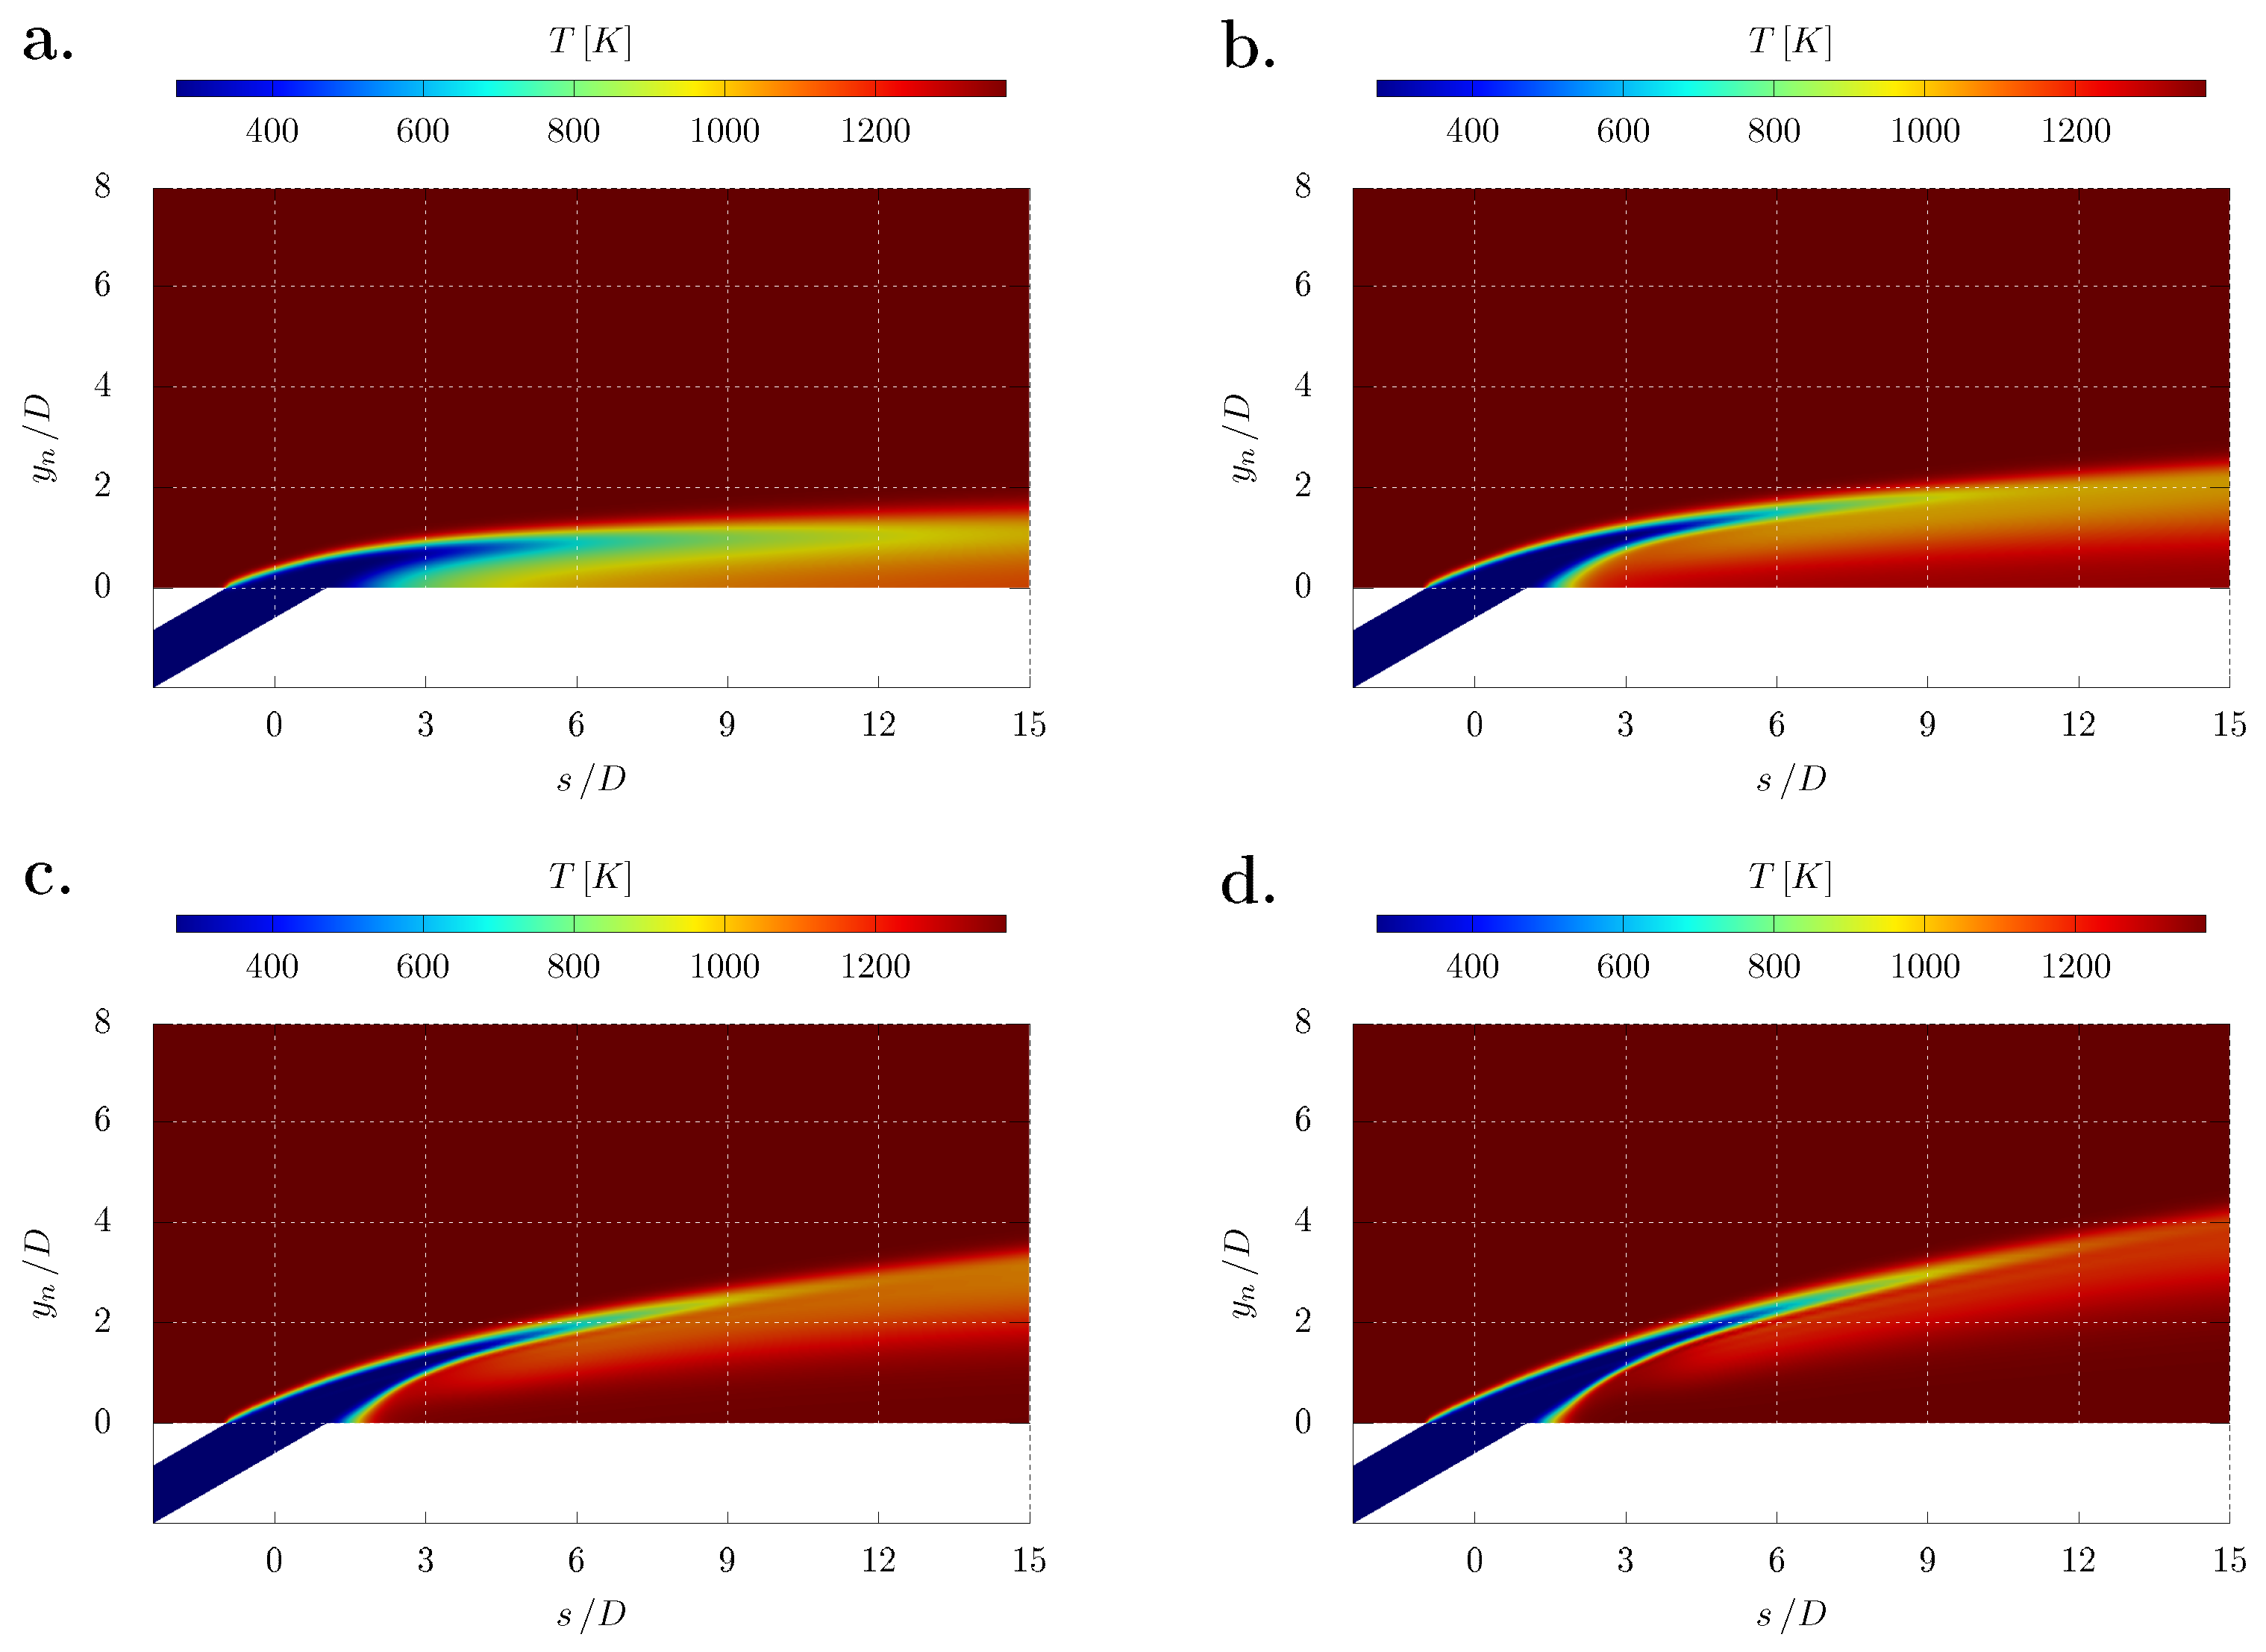
The adiabatic temperature for different BR is shown in Figure 5. In this image, s is the length along the surface and y n is the distance normal to the flat plate. The data are reported for 15 D length downstream after injection and a computation time of 6 s. As a result, the jet was observed to move away from the wall with increasing BR.
According to Figure 5a, the jet remains close to the surface for BR = 0.5. This causes the temperature between the jet and the wall to not exceed 1000 K. When BR = 1, the jet detaches up to 2 D height, as presented in Figure 5b. In this case, the fluid below the jet exceeds 1200 K after 6 D length. As seen in Figure 5c, the jet separates further when BR = 1.5. As a consequence, the mainstream contacts the surface before 3 D length. Finally, for BR = 2, the jet reaches 4 D height, as shown in Figure 5d. Similarly, the fluid temperature indicates that the jet has low incidence on the near wall region.

3.1.2. Film Effectiveness

The film effectiveness η is one of the most widely used methodologies to characterize the refrigeration performance. As shown in Equation (7), this parameter is a dimensionless form of the adiabatic temperature T a d .
η = T T a d T T j
Figure 6 shows the film effectiveness reported in the literature for BR = 2. In general, all simulations capture the trend observed in experimentation [42,44]. The film effectiveness approaches one near injection and then decreases from s = 3 D . For s < 3 D , the numerical results are greater than the experimental data. Conversely, these values are lower than the experimental data at s > 3 D . The film effectiveness of the present study was closer to the experimental data for s < 3 D , but similar to that obtained with the RANS k ϵ model when s > 3 D . In this region, the results of the LES Smagorinsky model were closer to the experimental data.

3.2. Simulations over a NACA 4412 Cascade Vane

A geometric model based on a NACA 4412 airfoil was used to study the film cooling performance on a gas turbine vane [45,46]. The first digit indicates that this profile has a maximum camber equal to 4% of the chord. According to the second digit, the maximum camber is located at 40% of the chord from the leading edge. Finally, the last two digits denote a maximum thickness equal to 12% of the chord.
The other geometric parameters were established from a GE-E3 first-stage vane [47]. Hence, two NACA 4412 vanes were arranged in cascade with an attack angle of 30°. As presented in Figure 7, only the lower airfoil has film cooling through a single hole of diameter D. The pipe was 2 D length with an angle of inclination of 25° with respect to a tangent line drawn at the injection point. It was positioned at 5 D from the leading edge to allow the film cooling to shower most of the airfoil suction surface.
For both airfoils, a length along the suction surface of 100 D and a chord of about 70 D were chosen. The separation between them at the leading edge was 29 D, which leads to a mean passage height of approximately 35 D. In this sense, boundaries inlet and outlet were also placed at 35 D length from the vanes. On the other hand, the computational domain was 5 D width and 87 D height.
The same boundary conditions used in the flat plate simulations were employed. In this way, the boundary conditions for the velocity and pressure fields are presented in Table 1. In relation to passive scalars, the boundary conditions are described in Table 2.
At the other side, the computational grid was built with blockMesh of OpenFOAM. As indicated in Figure 8, the near wall region was refined to capture the boundary layer development more accurately. For this purpose, different levels of refinement were evaluated until the value of y + was around one and below five in all cases studied. This was achieved with a start cell size of about 0.03 D height and an expansion ratio of fifty. Consequently, the computational domain was composed of fifty-three blocks with a total of 3,360,000 hexahedral cells.
Twelve simulations were performed over a NACA 4412 cascade vane for three Re and four BR. For each Reynolds number, the mainstream velocity U was fixed and the jet velocity U j was adjusted according to ecu:BR.
In this sense, a mainstream volumetric flow Q was prescribed in order to ensure a uniform velocity U at the boundary inlet. Nevertheless, only 1 3 Q flows through the central passage where the film cooling was analyzed. Here, the mainstream Reynolds number Re was computed with one half of the mean passage height. As a result, Figure 9 presents the mean velocity over the upper and lower airfoil.
Table 4 shows the BR, jet volumetric flows Q j and jet velocities U j employed. The jet Reynolds number Re j was calculated using the pipe diameter as the characteristic length.
Computations were performed until the pressure, velocity and temperature reached a steady state. For Re = 3615, simulations ran for 0.15 s based on the evolution of these fields in the entire domain. Thereafter, the mean values were calculated until a time of 0.3 s had elapsed. Similarly, for Re = 7230, the simulations ran for 0.1 s and then advanced to 0.2 s. For Re = 10,845, the fields reached a steady state at 0.5 s, so the computation time selected was 0.1 s.

3.2.1. Jet Trajectory

The jet trajectory was defined from the maximum value of the passive scalar T d y e . In this way, the jet position was compared with velocity and temperature T q distributions. For the cases studied, the jet trajectory has a similar trend regardless of BR, so only data for BR = 1 and different Re are reported. In the following images, the results on the vane midline are shown, where s is the length along the suction surface and y n is the distance normal to the vane.
Figure 10 presents the results for BR = 1 and Re = 3615. The trajectory shows that the jet attempts to separate from the surface when s < 20 D . However, the jet height decreases again when s = 40 D , since the maximum camber is located in this region. After this point, the jet moves away definitively, reaching a separation of 1 D at s = 70 . Finally, for s > 90 D , the jet position continues to increase until it reaches a maximum height below 2 D.
In addition, it can be considered that the jet velocity was approximately 4 m/s, which is lower than 5 m/s prescribed at the boundary hole. With respect to temperature, the measurements along the jet trajectory are not constant. For s < 50 D , the temperature is around 800 K. As the jet separates from the surface, values close to 1000 K are recorded at s = 70 D . Furthermore, when s = 90 D , a higher temperature region is observed near the vane wall at 1 D height. For s = 100 D , the jet reaches a maximum temperature of 1200 K.
Figure 11 shows the results for BR = 1 and Re = 7230. The jet trajectory reaches a first maximum when s < 20 D . Nevertheless, the mainstream causes the jet to attach to the surface at 30 D < s < 50 D . Subsequently, the jet height increases until it reaches a second maximum at s = 90 . The jet position always were located below 2 D height.
Additionally, the jet velocity is around 5 m/s, while the velocity at the boundary hole is 10 m/s. On the other hand, the temperature distribution indicates that for s < 70 D , the jet does not exceed 900 K. From this point, the temperature increases up to 1200 K when s > 90 . At the same location, a region at 1100 K is observed near the vane wall.
Figure 12 presents the results for BR = 1 and Re = 10,845. The trajectory indicates that the jet attempts to separate from the vane wall when s < 20 D . However, for 30 D < s < 50 D , the jet attaches to the surface due to the mainstream and the airfoil camber. After this point, the jet position increases until it reaches a height close to 1 D at s = 80 D . At the end, the jet trajectory decreases and stabilizes when s > 90 D .
Moreover, the jet velocity along the trajectory does not overcome 10 m/s, although the velocity at the boundary hole is 15 m/s. In relation to the temperature, for s < 70 D , the jet does not exceed 800 K. On the contrary, when s = 80 D , it reaches a maximum temperature of 1000 K. From this location, a region at 1200 K is observed very close to the surface. Nevertheless, the zone where the jet trajectory stabilizes remains at about 900 K.
Figure 13 shows the results for BR = 1 and different Re . In general, the jet trajectory presents the same trend for the three cases. When s < 20 D the jet reaches 0.6 D height, but then decreases approaching the surface. For Re = 7230 and 10,845, this decrease causes the jet to attach to the vane wall when 30 D < s < 50 D . Subsequently, the jet position increases until it reaches its maximum value. For Re = 3615 and 7230, the trajectories collapse when 70 D < s < 90 D reaching 1.6 D height. In contrast, for Re = 10,845, the maximum height of the jet does not exceed 1 D and is located at s = 80 D . From this point, the jet again descends for Re = 7230 and 10,845. Finally, when s > 90 D , the jet position continues to increase for Re = 3615, decreases for Re = 7230, and remains constant for Re = 10,845.

3.2.2. Film Effectiveness

The film effectiveness η is one of the most widely used methodologies to characterize the refrigeration performance. As presented in Equation (7), this parameter is a dimensionless form of the adiabatic temperature T a d . For all cases, the film effectiveness has a similar trend regardless of BR, so only data for BR = 1 and different Re are reported. In the following images, the results on the vane midline are shown, where s is the length along the suction surface and y n is the distance normal to the vane.
Figure 14 presents the results for BR = 1 and different Re . The film effectiveness reaches its maximum value close to injection. In this way, the effectiveness was greater than 0.8 for s < 10 D . However, when 10 D < s < 20 D , it decays rapidly as a consequence of increasing jet height. Conversely, the film effectiveness increases for Re = 7230 and 10,845 at 20 D < s < 30 D , since the jet is located close to the vane wall. After this point, the variation in the jet trajectory does not influence the effectiveness, which is reduced at the same rate for the three cases. In addition, when 70 D < s < 80 D , the film effectiveness decreases for Re = 7230 and 10,845, due to a region of high temperature situated near the surface.
A new indicator, known as average film effectiveness η ¯ , was proposed in order to compare the results for different BR and Re . As presented in Equation (8), it is computed as the integral of the film effectiveness at the vane midline. In this expression, s is the length along the surface.
η ¯ = 1 s s η d s
Figure 15 shows the results for different BR and Re . For all cases, the maximum average effectiveness occurs when BR=1. In this case, for Re = 3615, the film effectiveness is below 0.3, while for Re = 7230, it approaches 0.4. For Re = 10,845, the effectiveness does not exceed 0.45, although it is greater than the other Reynolds numbers. On the contrary, for Re = 3615, the lowest values were obtained regardless of BR. In general, the film effectiveness improves with increasing BR, although this increment reduces as a greater BR is used.

3.2.3. Net Heat Flux Reduction

NHFR takes into account the temperature decrease caused by the coolant, but also the increase in the convective coefficient due to the injection process [25]. Its definition is presented in the Equation (9), where q is the heat flux when the film cooling method is used and q 0 corresponds to the heat flux without cooling. Therefore, NHFR < 0 indicates an increment in heat flux relative to the condition without film cooling.
NHFR = 1 q q 0
Based on the no-slip condition, a conduction heat transfer process between the first fluid layer and the surface was assumed. Hence, heat fluxes were computed from temperature gradients at the adjacent cells to the vane as shown in Equation (10).
q = k T q y n
where k is the thermal conductivity of the fluid and y n is the direction normal to the vane. Thereby, T q over the suction surface of the lower vane were used to estimate q, while T q over the suction surface of the upper vane were used to estimate q 0 , as noted in Figure 8.
Furthermore, the convective coefficient h and skin friction coefficient C f were calculated. On the one hand, h was computed by balancing the convection and conduction heat flux as described in Equation (11), T was chosen as the temperature of the fluid sufficiently far from the surface, while T q at the boundary wall corresponds to the same jet temperature T j , according to tab:BCT.
h ( T T j ) = k T q y n
At the other side, C f was estimated in order to study the boundary layer behavior. In Equation (12), A is the area of the airfoil suction surface, s is the length along the surface, n ^ is the unit vector of area, τ ¯ is the shear stress tensor, and x ^ is the unit vector of the flow direction indicated in Figure 8.
C f = 1 ρ U 2 A s n ^ · τ ¯ · x ^ d A
In the following images, the results on the vane midline are presented. Additionally, both coefficients were normalized by the first maximum after injection to facilitate their comparison. Thereby, h ^ is the normalized convective coefficient, C f ^ is the normalized skin friction coefficient, s is the length along the suction surface, and y n is the distance normal to the vane.
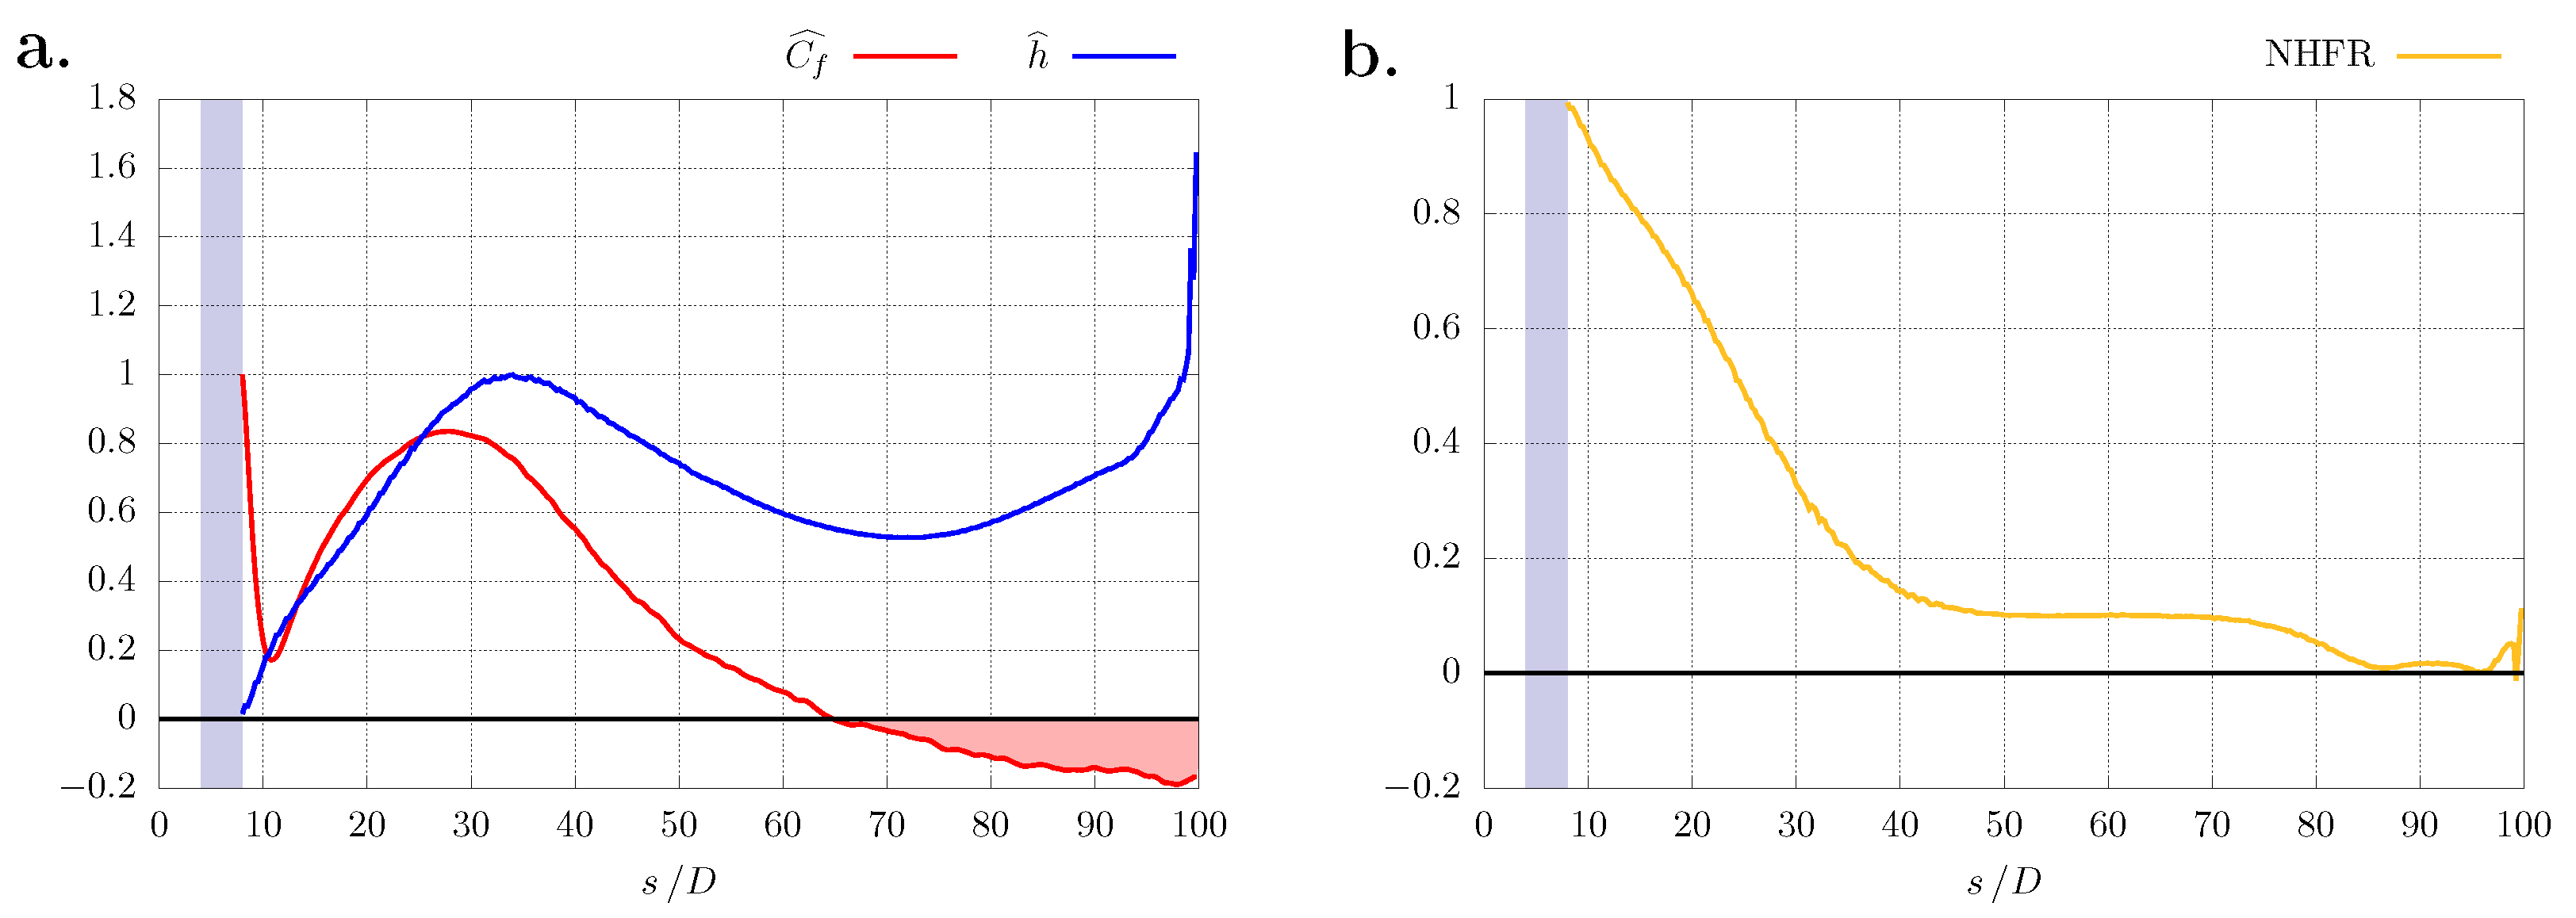
Figure 16 shows the results for BR = 1 and Re = 3615. On the one hand, the normalized skin friction coefficient presents its maximum value at the injection point, but at s = 10 D , it decreases rapidly to 0.2. When s = 30 D , this coefficient reaches a second maximum at approximately 0.8. From this location, it decreases again until it turns negative at s > 60 D , which means a boundary layer separation.
A similar trend is found for the normalized convective coefficient. On the one hand, there is an increment at s < 40 D until it reaches 1. Subsequently, this coefficient decays below 0.6 when s = 70 D . However, it increases to 1.6 when s = 100 D .
NHFR is equal to 1 at the injection point. Afterwards, it decreases at a constant rate until it reaches 0.2 when s = 40 D . NHFR remains constant until s = 70 D and decreases again to turn null.
Figure 17 presents the results for BR = 1 and Re = 7230. For s = 10 D , a reduction in the normalized skin friction coefficient until negative values is recorded. Almost instantaneously, there is an increment and a boundary layer reattachment. When s = 30 D , this coefficient reaches its maximum value, but decreases again below zero. This occurs from s = 60 D , and indicates a second boundary layer separation.
Similarly, the normalized convective coefficient increases when s < 40 D . Nevertheless, for 40 D < s < 70 D , it decreases to below 0.5. At s > 70 D , an increment allows this coefficient to approach 3.
On the other hand, the maximum NHFR takes place near the injection, but turns null for s < 40 D . Subsequently, there is a slight increment when 40 D < s < 70 D without exceeding 0.2. For s > 70 D , NHFR is negative, so the heat flux in this region is greater than for the vane without film cooling.
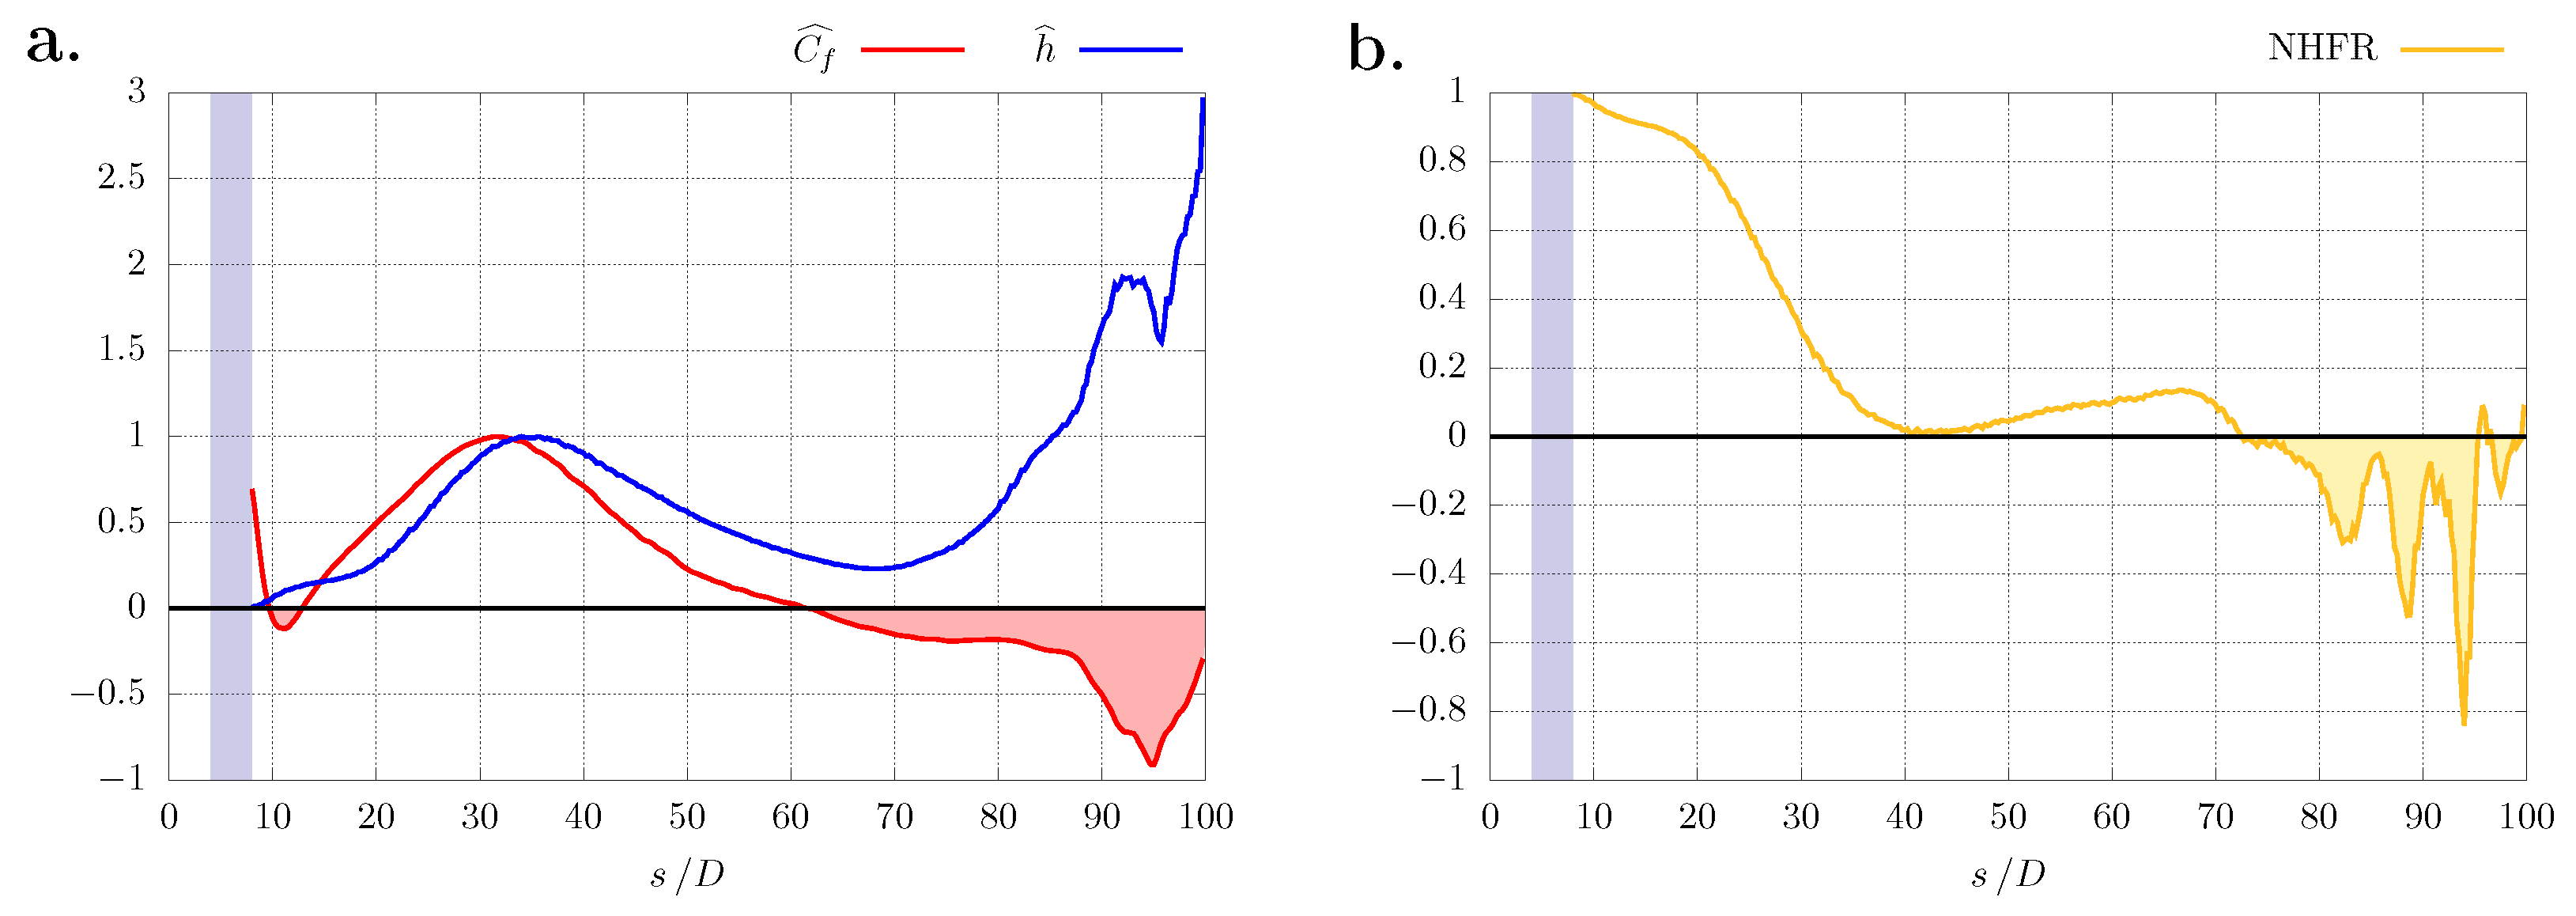
Figure 18 shows the results for BR = 1 and Re = 10,845. The normalized skin friction coefficient decreases after injection. When s = 10 D , there is a boundary layer separation represented by the negative values of this coefficient. From this location, it increases to its maximum value at s = 30 D . Afterwards, this coefficient changes sign at 60 D < s < 70 D , so there is a boundary layer separation again. Nevertheless, in 80 D < s < 90 D the boundary layer reattaches.
Similarly, the normalized convective coefficient increases from injection, and it reaches a first maximum at 30 D < s < 40 D . From this point, it decreases to below 0.5 for 50 D < s < 70 D . Subsequently, the heat transfer increases rapidly until it reaches a second maximum at 80 D < s < 90 D . Finally, this coefficient remains around 1.5 when 90 D < s < 100 D .
Additionally, NHFR shows a decrease in the heat flux due to the jet at 10 D < s < 40 D . However, when 40 D < s < 50 D , there are no significant differences using the film cooling method. For 50 D < s < 70 D , this indicator increases without exceeding 0.5. Conversely, when 70 D < s < 90 D , the increment in heat transfer is detrimental to the vane. For s > 90 D , there are two regions where NHFR is positive and negative, respectively.
A new indicator, known as average net heat flux reduction NHFR ¯ , was proposed in order to compare the results for different BR and Re . As shown in ecu:aNHFR, it is computed as the integral of NHFR at the vane midline. In this expression, s is the length along the surface.
NHFR ¯ = 1 s s NHFR d s
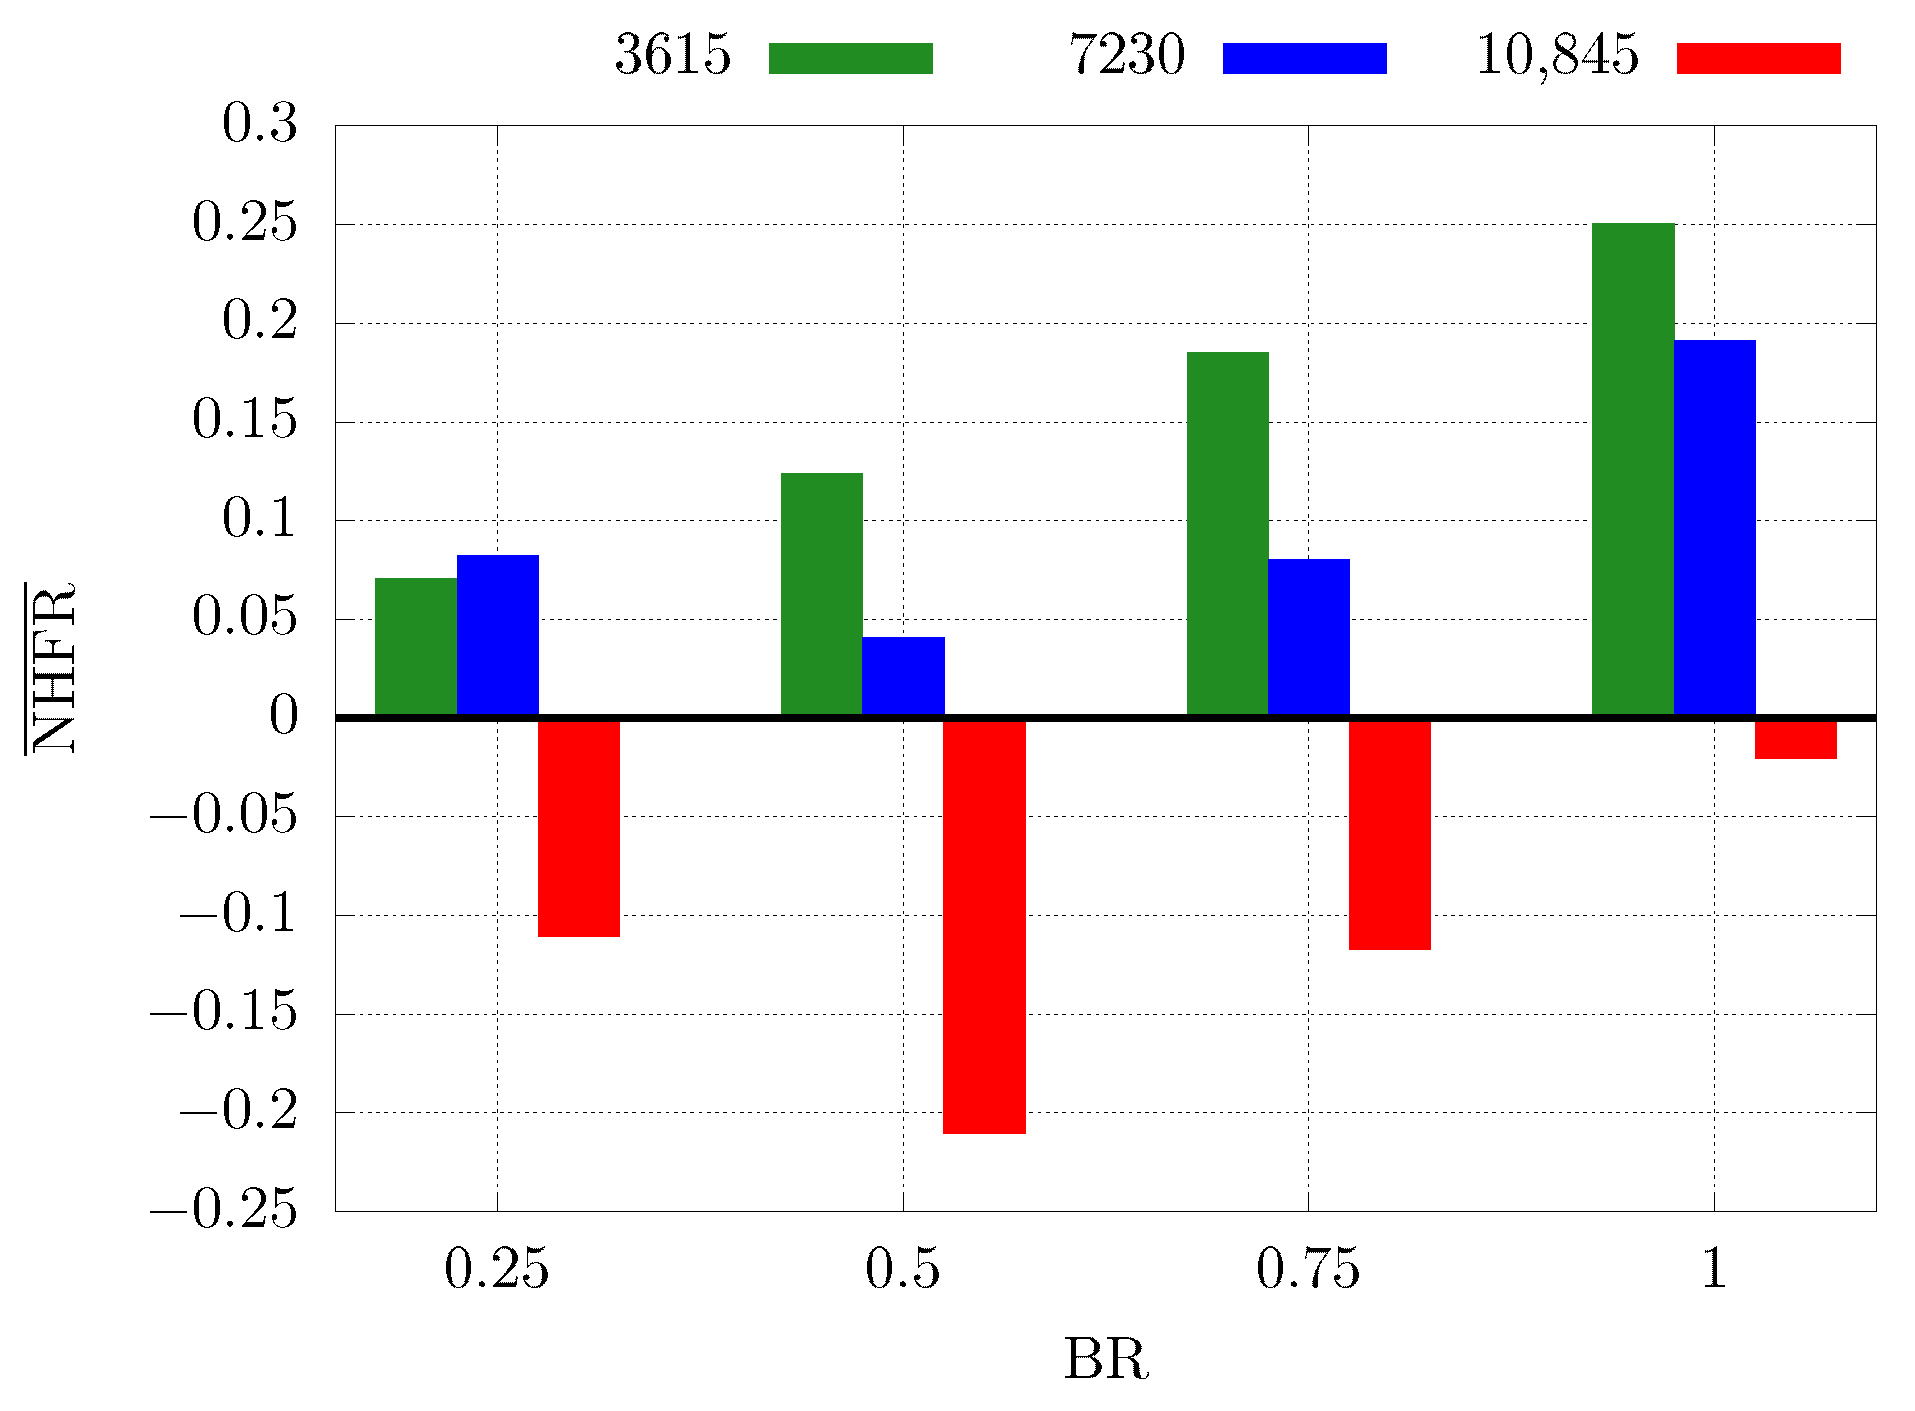
Figure 19 presents the results for different BR and Re . For all cases, the maximum average NHFR occurs when BR = 1. Under these conditions, for Re = 3615, a reduction of 0.25 is recorded, while for Re = 7230, this indicator approaches 0.2. For Re = 10,845, the results indicate that the film cooling favored heat transfer in a manner detrimental to the vane. This is evident for all the configurations studied, being the most critical situation when BR = 0.5. The minimum average NHFR is found for Re = 7230 at this same BR. On the contrary, for Re = 3615 the lowest value occurs for BR = 0.25.

4. Conclusions

The analysis of numerical results led to the identification of three principal regions along the suction surface. Where s < 20 D , the coolant tends to detach from the vane wall due to jet velocity, resulting in a greater separation between the jet and the surface as BR increases. However, the jet maintains a low temperature for about 10 D length. Beyond this point, the film effectiveness decays exponentially, except for BR = 1, where the reduction is at a constant rate. Concurrently, the skin friction coefficient diminishes rapidly due to jet separation. Nevertheless, the influence of the mainstream raises the shear stresses, which again leads to an increase in this coefficient. The jet also induces a temperature gradient that increases the convective coefficient. Even so, the heat flux remains lower than in the uncooled vane, as indicated by positive NHFR values.
In the region where 20 D < s < 50 D , the jet reapproaches the vane wall, and for a higher Re , it attaches to the surface. This behavior is influenced by the location of maximum camber, the change in direction and acceleration of the mainstream. Contrary to expectations, an increase in BR results in a closer approach to the surface. Consequently, jets with greater separation in s < 20 D now exhibit a lower height. In relation to the skin friction coefficient, it decreases due to the development of the mainstream on the vane wall. In the same way, jet diffusion reduces the temperature gradients near the surface, leading to a decrease in both the convective coefficient and the rate of NHFR reduction.
For s > 50 D , the jet height increases until it separates from the surface, not exceeding 2 D height for all combinations of BR and Re . This separation allows the mainstream to impinge directly on the vane wall, resulting in a high temperature region below the jet at s = 90 D and a decrease in film effectiveness. The region is positioned closer to the surface for higher Re .
Furthermore, film effectiveness analysis reveals a decrease in surface temperature as Re increases. However, the temperature difference may augment the heat flux, leading to adverse effects as observed for Re = 10,845. Therefore, relying solely on one indicator to evaluate film cooling performance is insufficient and the jet trajectory, convective coefficient and skin friction coefficient can be used as a complement.
Both the convective coefficient and the skin friction coefficient exhibit similar trends, reflecting the analogous nature of heat and momentum transfer. The convective coefficient indicates regions of heat flux without specifying direction, which requires a joint analysis with NHFR. On the other hand, the skin friction coefficient reveals that boundary layer separation hampers vane cooling, since its decrease coincides with the reduction in NHFR.

5. Future Research

In this study, the jet trajectory was determined from the concentration of a passive scalar. However, alternative methods using midline velocity or maximum vorticity may yield slightly different positions. Additionally, geometrical parameters such as airfoil type, angle of attack, injection angle or injection point could influence jet behavior and warrant further investigation.
The simulations were conducted without varying the mainstream and jet temperatures, leaving the effect of the temperature ratio unstudied. Similarly, constant fluid properties were assumed, but variations in temperature may influence the indicators presented.
Finally, the results were reported on the vane midline, omitting phenomena in other directions. Future research could explore indicators at different locations, providing a more comprehensive understanding of film cooling performance.

Author Contributions

Conceptualization, G.S.-V., C.D.-D. and D.G.-A.; methodology, G.S.-V., C.D.-D. and D.G.-A.; software, G.S.-V.; validation, G.S.-V.; formal analysis, G.S.-V.; investigation, G.S.-V., C.D.-D. and D.G.-A.; resources, G.S.-V., C.D.-D. and D.G.-A.; writing—original draft preparation, G.S.-V., C.D.-D. and D.G.-A.; writing—review and editing, G.S.-V., C.D.-D. and D.G.-A.; supervision, C.D.-D. and D.G.-A. All authors have read and agreed to the published version of the manuscript.

Funding

This research received no external funding.

Data Availability Statement

The data presented in this study are available upon request from the corresponding author.

Conflicts of Interest

The authors declare no conflict of interest.

Abbreviations

The following abbreviations are used in this manuscript:
BRBlowing ratio
CMCCeramic matrix composite
DLNDry low NOx
EBCEnvironmental barrier coating
FVMFinite volume method
LESLarge eddy simulation
NHFRNet heat flux reduction
PISOPressure-implicit with operator splitting
RANSReynolds-averaged Navier–Stokes equations
RITRotor inlet temperature
SGSSubgrid-scale model
SIMPLESemi-implicit method for pressure-linked equations
TBCThermal barrier coating
TITTurbine inlet temperature
WALEWall-adapting local eddy-viscosity

References

  1. Soares, C. Gas Turbines: An Introduction and Applications. In Gas Turbines; Butterworth-Heinemann: Oxford, UK, 2015; Volume 1. [Google Scholar] [CrossRef]
  2. National Academies of Sciences, Engineering, and Medicine, Aggressive goals for gas turbine development: Aviation. In Advanced Technologies for Gas Turbines; The National Academies Press: Washington, DC, USA, 2020; Volume 2.2. [CrossRef]
  3. Cohen, H. Teoría de las Turbinas de Gas; Marcombo: Barcelona, Spain, 1982; p. 433. [Google Scholar]
  4. Boyce, M.P. An Overview of Gas Turbines. In Gas Turbine Engineering Handbook; Butterworth-Heinemann: Oxford, UK, 2006; Volume 1. [Google Scholar] [CrossRef]
  5. Banihabib, R.; Assadi, M. The Role of Micro Gas Turbines in Energy Transition. Energies 2022, 15, 8084. [Google Scholar] [CrossRef]
  6. Farhat, H.; Salvini, C. Novel Gas Turbine Challenges to Support the Clean Energy Transition. Energies 2022, 15, 5474. [Google Scholar] [CrossRef]
  7. Gil García, G. Turbinas y Compresores de Gas. Los Motores del Siglo XXI; Alfaomega: Benito Juarez, CDMX, Mexico, 2013; p. 600. [Google Scholar]
  8. Min Kwon, H.; Won Moon, S.; Seop Kim, T.; Won Kang, D. Performance enhancement of the gas turbine combined cycle by simultaneous reheating, recuperation, and coolant inter-cooling. Energy 2020, 207, 118271. [Google Scholar] [CrossRef]
  9. Faqih, M.; Omar, M.B.; Ibrahim, R.; Omar, B.A.A. Dry-Low Emission Gas Turbine Technology: Recent Trends and Challenges. Appl. Sci. 2022, 12, 10922. [Google Scholar] [CrossRef]
  10. Ishikawa, M.; Terauchi, M.; Komori, T.; Yasuraoka, J. Development of High Efficiency Gas Turbine Combined Cycle Power Plant; Technical Review (TR) 2008-451015; Mitsubishi Heavy Industries, Ltd.: Tokyo, Japan, 2008. [Google Scholar]
  11. Puspitasari, P.; Andoko, A.; Kurniawan, P. Failure analysis of a gas turbine blade: A review. IOP Conf. Ser. Mater. Sci. Eng. 2021, 1034, 12156. [Google Scholar] [CrossRef]
  12. Fathyunes, L.; Mohtadi-Bonab, M.A. A Review on the Corrosion and Fatigue Failure of Gas Turbines. Metals 2023, 13, 701. [Google Scholar] [CrossRef]
  13. Wee, S.; Do, J.; Kim, K.; Lee, C.; Seok, C.; Choi, B.G.; Choi, Y.; Kim, W. Review on Mechanical Thermal Properties of Superalloys and Thermal Barrier Coating Used in Gas Turbines. Appl. Sci. 2020, 10, 5476. [Google Scholar] [CrossRef]
  14. Krishna Anand, V.G.; Parammasivam, K.M. Thermal barrier coated surface modifications for gas turbine film cooling: A review. J. Therm. Anal. Calorim. 2021, 146, 545–580. [Google Scholar] [CrossRef]
  15. Zhu, D. Aerospace Ceramic Materials: Thermal, Environmental Barrier Coatings and SiC/SiC Ceramic Matrix Composites for Turbine Engine Applications; Technical Memorandum (TM) 2018-219884; NASA Glenn Research Center: Cleveland, OH, USA, 2018. [Google Scholar]
  16. Lv, B.; Jin, X.; Cao, J.; Xu, B.; Wang, Y.; Fang, D. Advances in numerical modeling of environmental barrier coating systems for gas turbines. J. Eur. Ceram. Soc. 2020, 40, 3363–3379. [Google Scholar] [CrossRef]
  17. Han, J.C.; Dutta, S.; Ekkad, S. Gas Turbine Heat Transfer and Cooling Technology; CRC Press: Boca Raton, FL, USA, 2013; p. 887. [Google Scholar] [CrossRef]
  18. El-Damaty, W.; Gadalla, M. Exergoeconomic Analysis of Intercooled, Reheated and Recuperated Gas Turbine Cycles With Air Film Blade Cooling. In Proceedings of the ASME 2018 International Mechanical Engineering Congress and Exposition, Pittsburgh, PA, USA, 9–15 November 2018. [Google Scholar] [CrossRef]
  19. Filinov, E.P.; Kuz’michev, V.S.; Tkachenko, A.Y.; Ostapyuk, Y.A.; Krupenich, I.N. Estimation of cooling flow rate for conceptual design stage of a gas turbine engine. Proc. Inst. Mech. Eng. Part A J. Power Energy 2021, 235, 2014–2021. [Google Scholar] [CrossRef]
  20. Zhang, J.; Zhang, S.; Wang, C.; Tan, X. Recent advances in film cooling enhancement: A review. Chin. J. Aeronaut. 2020, 33, 1119–1136. [Google Scholar] [CrossRef]
  21. Chang, J.; Du, Y.; Shao, X.; Zhao, Y.; Zheng, S. Investigation and analysis of vortex and application of jet in crossflow. Case Stud. Therm. Eng. 2019, 14, 100459. [Google Scholar] [CrossRef]
  22. Li, W.; Li, X.; Ren, J.; Jiang, H. Length to diameter ratio effect on heat transfer performance of simple and compound angle holes in thin-wall airfoil cooling. Int. J. Heat Mass Transf. 2018, 127, 867–879. [Google Scholar] [CrossRef]
  23. Li, W.; Lu, X.; Li, X.; Ren, J.; Jiang, H. High resolution measurements of film cooling performance of simple and compound angle cylindrical holes with varying hole length-to-diameter ratio–Part I: Adiabatic film effectiveness. Int. J. Therm. Sci. 2018, 124, 146–161. [Google Scholar] [CrossRef]
  24. El-Damaty, W.; Gadalla, M. Assessment of Gas Turbine’s Cooling Systems Integrated With Bottoming Cycle. In Proceedings of the ASME 2018 Power Conference, Lake Buena Vista, FL, USA, 24–28 June 2018. [Google Scholar] [CrossRef]
  25. Bogard, D.G. Airfoil Film Cooling. In The Gas Turbine Handbook; U.S. Department of Energy’s National Energy Technology Laboratory (NETL): Pittsburgh, PA, USA, 2006; Volume 4.2.2.1. [Google Scholar]
  26. Khalatov, A.; Shi-Ju, E.; Wang, D.; Borisov, I. Film cooling evaluation of a single array of triangular craters. Int. J. Heat Mass Transf. 2020, 159, 120055. [Google Scholar] [CrossRef]
  27. Wang, J.; Zhao, Z.; Tian, L.; Ren, X.; Sundén, B. Effects of hole configuration on film cooling effectiveness and particle deposition on curved surfaces in gas turbines. Appl. Therm. Eng. 2021, 190, 116861. [Google Scholar] [CrossRef]
  28. Zhu, R.; Xie, G.; Simon, T.W. New Designs of Novel Holes Based on Cylindrical Configurations for Improving Film Cooling Effectiveness. In Proceedings of the ASME Turbo Expo 2018: Turbomachinery Technical Conference and Exposition, Oslo, Norway, 11–15 June 2018. [Google Scholar] [CrossRef]
  29. Hou, R.; Wen, F.; Luo, Y.; Tang, X.; Wang, S. Large eddy simulation of film cooling flow from round and trenched holes. Int. J. Heat Mass Transf. 2019, 144, 118631. [Google Scholar] [CrossRef]
  30. He, J.; Deng, Q.; Feng, Z. Film Cooling Performance Enhancement by Upstream V-shaped Protrusion/Dimple Vortex Generator. Int. J. Heat Mass Transf. 2021, 180, 121784. [Google Scholar] [CrossRef]
  31. Zhou, W.; Peng, D.; Wen, X.; Liu, Y.; Hu, H. Unsteady analysis of adiabatic film cooling effectiveness behind circular, shaped, and sand-dune-inspired film cooling holes: Measurement using fast-response pressure-sensitive paint. Int. J. Heat Mass Transf. 2018, 125, 1003–1016. [Google Scholar] [CrossRef]
  32. Ferziger, J.H.; Perić, M. Computational Methods for Fluid Dynamics; Springer: Berlin/Heidelberg, Germany, 2012; p. 426. [Google Scholar] [CrossRef]
  33. Nicoud, F.; Ducros, F. Subgrid-Scale Stress Modelling Based on the Square of the Velocity Gradient Tensor. Flow Turbul. Combust. 1999, 62, 183–200. [Google Scholar] [CrossRef]
  34. Hou, R.; Wen, F.; Wang, S.; Luo, Y.; Tang, X. Large eddy simulation of the trenched film cooling hole with different compound angles and coolant inflow orientation effects. Appl. Therm. Eng. 2019, 163, 114397. [Google Scholar] [CrossRef]
  35. Zamiri, A.; Chung, J.T. Large eddy simulation of internal coolant crossflow orientation effects on film-cooling effectiveness of fan-shaped holes. Int. J. Heat Mass Transf. 2022, 190, 122778. [Google Scholar] [CrossRef]
  36. Kang, Y.S.; Rhee, D.H.; Song, Y.J.; Kwak, J.S. Large Eddy Simulations on Film Cooling Flow Behaviors with Upstream Turbulent Boundary Layer Generated by Circular Cylinder. Energies 2021, 14, 7227. [Google Scholar] [CrossRef]
  37. Moukalled, F.; Mangani, L.; Darwish, M. The Finite Volume Method in Computational Fluid Dynamics; Springer: Cham, Switzerland, 2016; p. 791. [Google Scholar] [CrossRef]
  38. Issa, R.I. Solution of the implicitly discretised fluid flow equations by operator-splitting. J. Comput. Phys. 1986, 62, 40–65. [Google Scholar] [CrossRef]
  39. Caretto, L.S.; Gosman, A.D.; Patankar, S.V.; Spalding, D.B. Two calculation procedures for steady, three-dimensional flows with recirculation. In Proceedings of the Third International Conference on Numerical Methods in Fluid Mechanics, Paris, France, 3–7 July 1972; Springer: Berlin/Heidelberg, Germany, 1973. [Google Scholar] [CrossRef]
  40. Holzmann, T. Mathematics, Numerics, Derivations and OpenFOAM (R); Holzmann CFD: Leoben, Austria, 2019; p. 159. [Google Scholar]
  41. Marić, T.; Höpken, J.; Mooney, K.G. The OpenFOAM (R) Technology Primer; European Organisation for Nuclear Research (CERN): Geneva, Switzerland, 2021; p. 423. [Google Scholar] [CrossRef]
  42. Baagherzadeh Hushmandi, N. Large Eddy simulation of flat plate film cooling at high blowing ratio using OpenFOAM. Heat Mass Transf. 2018, 54, 1603–1611. [Google Scholar] [CrossRef]
  43. Greenshields, C.; Weller, H. Notes on Computational Fluid Dynamics: General Principles; CFD Direct: Reading, UK, 2022; p. 291. [Google Scholar]
  44. Thurman, D.R.; El-Gabry, L.A.; Poinsatte, P.E.; Heidmann, J.D. Turbulence and Heat Transfer Measurements in an Inclined Large Scale Film Cooling Array: Part II–Temperature and Heat Transfer Measurements. In Proceedings of the ASME 2011 Turbo Expo: Turbine Technical Conference and Exposition, Vancouver, BC, Canada, 6–10 June 2011. [Google Scholar] [CrossRef]
  45. Dhivya, S.; Karthikeyan, A. Design and Analysis of Gas Turbine Blade with Cooling. EAI Endorsed Trans. Energy Web Inf. Technol. 2018, 5, 12. [Google Scholar] [CrossRef]
  46. El-Sayed, A.F. Blade Profile Selection. In Aircraft Propulsion and Gas Turbine Engines; CRC Press: Boca Raton, FL, USA, 2017; Volume 14.5.3. [Google Scholar]
  47. Zhao, W.; Chi, Z.; Zang, S. Numerical and experimental study of scaling criteria accuracy for film cooling using CO2 coolant. Int. J. Heat Mass Transf. 2021, 181, 121984. [Google Scholar] [CrossRef]
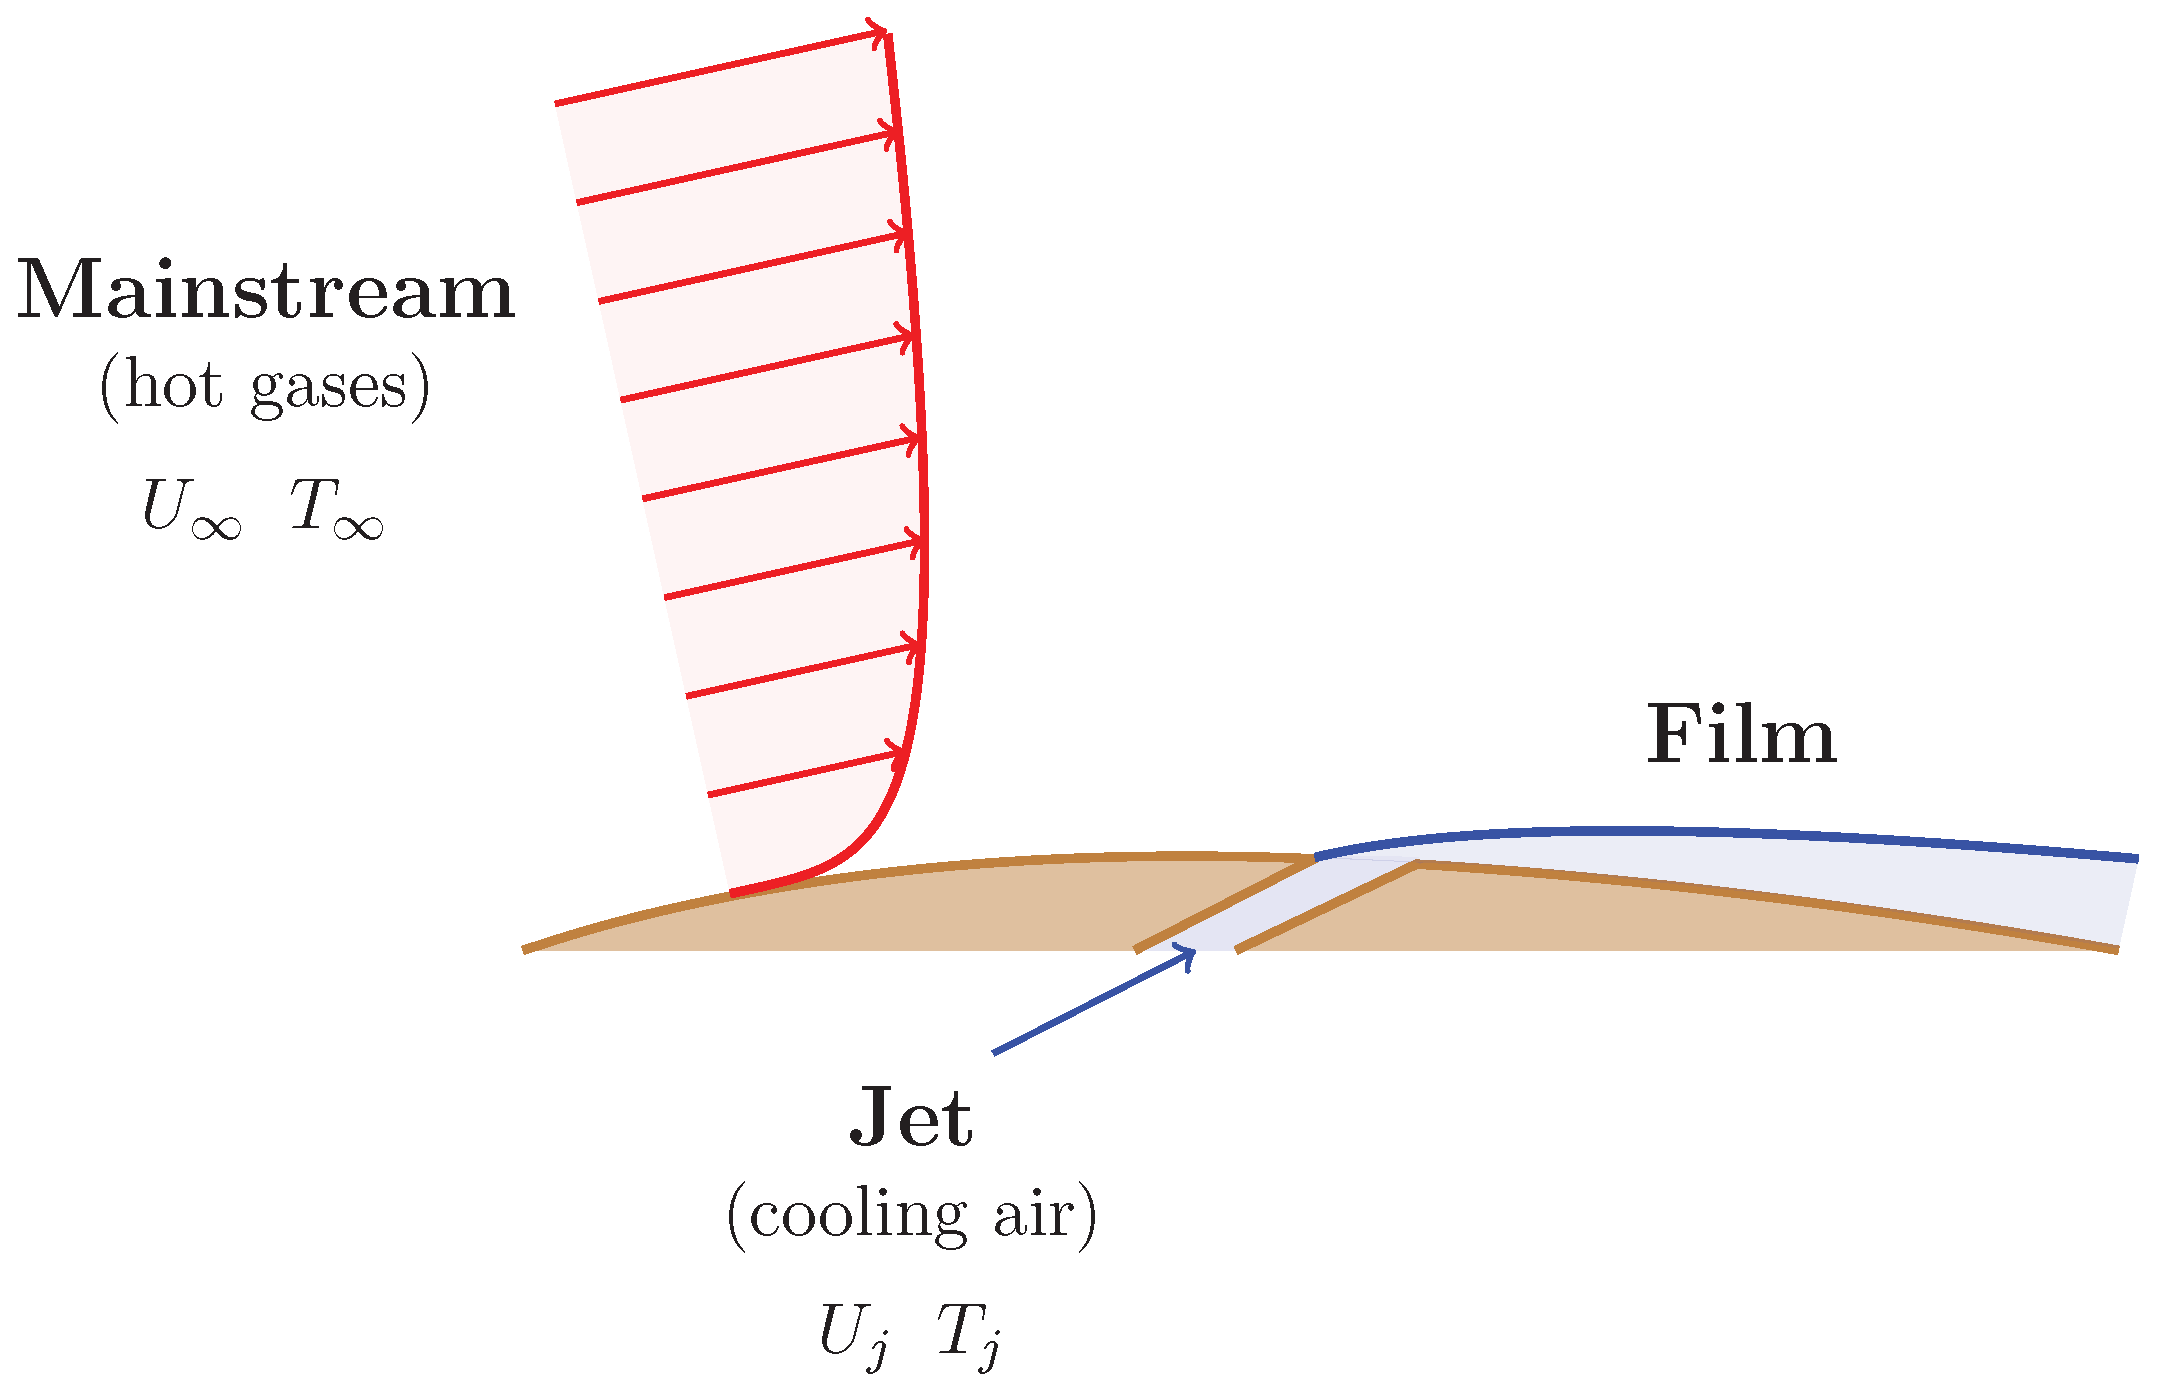
Figure 1. Schematic of film cooling on a vane.
Fluids 08 00263 g001
Figure 2. Details of the geometrical model used for the flat plate with D = 0.01 m: (a) Three-dimensional view. (b) Overall view on the middle plane. (c) Cutting plane at the end of the pipe.
Fluids 08 00263 g002
Figure 3. Details of the computational grid used for the flat plate: (a) Overall view on the middle plane. (b) Cutting plane at the end of the pipe.
Fluids 08 00263 g003
Figure 4. Velocity streamlines: (a) BR = 0.5. (b) BR = 1. (c) BR = 1.5. (d) BR = 2.
Fluids 08 00263 g004
Figure 5. Adiabatic temperature on the middle plane: (a) BR = 0.5. (b) BR = 1. (c) BR = 1.5. (d) BR = 2.
Fluids 08 00263 g005
Figure 6. Comparison of film effectiveness on flat plate for BR = 2, against results obtained with LES (Smagorinsky) and RANS ( k ϵ ) by Baagherzadeh [42], and experimental data reported by Thurman et al. [44].
Fluids 08 00263 g006
Figure 7. Details of the geometrical model used in the NACA 4412 cascade vane simulations with D = 0.01 m: (a) Three-dimensional view. (b) Boundaries of the computational domain. (c) Dimensions of the computational domain.
Fluids 08 00263 g007
Figure 8. Details of the computational grid used in the NACA 4412 cascade vane simulations: (a) Overall view on the middle plane. (b) Zoom on the vane without film cooling (upper airfoil). (c) Zoom on the vane with film cooling (lower airfoil).
Fluids 08 00263 g008
Figure 9. Velocity streamlines: (a) Zoom on the vane without film cooling (upper airfoil). (b) Zoom on the vane with film cooling (lower airfoil).
Fluids 08 00263 g009
Figure 10. Jet trajectory for BR = 1 and Re = 3615: (a) Velocity distribution. (b) Temperature distribution. The blue stripe indicates the position of the injection.
Fluids 08 00263 g010
Figure 11. Jet trajectory for BR = 1 and Re = 7230: (a) Velocity distribution. (b) Temperature distribution. The blue stripe indicates the position of the injection.
Fluids 08 00263 g011
Figure 12. Jet trajectory for BR = 1 and Re = 10,845: (a) Velocity distribution. (b) Temperature distribution. The blue stripe indicates the position of the injection.
Fluids 08 00263 g012
Figure 13. Jet trajectory for BR = 1 and different Re . The blue stripe indicates the position of the injection.
Fluids 08 00263 g013
Figure 14. Film effectiveness for BR = 1 and different Re : (a) Jet trajectory. (b) Film effectiveness. The blue stripe indicates the position of the injection.
Fluids 08 00263 g014
Figure 15. Average film effectiveness for different BR and Re .
Fluids 08 00263 g015
Figure 16. Indicators for BR = 1 and Re = 3615: (a) Normalized convective coefficient and normalized skin friction coefficient. (b) Net heat flux reduction (NHFR). The blue stripe indicates the injection position; the red shaded regions denote boundary layer separation.
Fluids 08 00263 g016
Figure 17. Indicators for BR = 1 and Re = 7230: (a) Normalized convective coefficient and normalized skin friction coefficient. (b) Net heat flux reduction (NHFR). The blue stripe indicates the injection position; the red shaded regions denote boundary layer separation; the yellow shaded region shows film cooling deterioration.
Fluids 08 00263 g017
Figure 18. Indicators for BR = 1 and Re = 10,845: (a) Normalized convective coefficient and normalized skin friction coefficient. (b) Net heat flux reduction (NHFR). The blue stripe indicates the injection position; the red shaded regions denote boundary layer separation; the yellow shaded region shows film cooling deterioration.
Fluids 08 00263 g018
Figure 19. Average NHFR for different BR and Re .
Fluids 08 00263 g019
Table 1. Boundary conditions for velocity and pressure fields.
BoundaryUp
atmosphere (inflow) U n = U b U t = 0 p = p r e f | U | 2 / 2
atmosphere (outflow) n U n = 0 n U t = 0 p = p r e f
inlet U n = Q · A n p = 0
hole U n = Q j · A j n p = 0
outlet n U = 0 p = p r e f
wall U = 0 n p = 0
front/back U n = 0 t U t = 0 t U t = 0
Table 2. Boundary conditions for passive scalars.
Boundary T dye T ad T q
atmosphere (inflow) T d y e = 0 T a d = T T q = T
atmosphere (outflow) n T d y e = 0 n T a d = 0 n T q = 0
inlet n T d y e = 0 T a d = T T q = T
hole T d y e = 1 T a d = T j T q = T j
outlet n T d y e = 0 n T a d = 0 n T q = 0
wall n T d y e = 0 n T a d = 0 T q = T j
front/back n T d y e = 0 n T a d = 0 n T q = 0
Table 3. Simulation cases on flat plate with T = 1373.15 K and T j = 273.15 K.
BR Q j [m3/s] U j [m/s]Re j
0.5 3.93 × 10 5 0.5330
1 7.85 × 10 5 1660
1.5 1.18 × 10 4 1.5990
2 1.57 × 10 4 21320
Table 4. Simulation cases over a NACA 4412 cascade vane with T = 1500 K and T j = 600 K.
BR 1 3 A Q [m3/s] U [m/s]Re Q j [m3/s] U j [m/s]Re j
0.25 7.26 × 10 2 53615 0.98 × 10 4 1.2552
0.5 1.96 × 10 4 2.5105
0.75 2.95 × 10 4 3.75157
1 3.93 × 10 4 5209
0.25 14.52 × 10 2 107230 1.96 × 10 4 2.5105
0.5 3.93 × 10 4 5209
0.75 5.89 × 10 4 7.5314
1 7.86 × 10 4 10418
0.25 21.78 × 10 2 1510,845 2.95 × 10 4 3.75157
0.5 5.89 × 10 4 7.5314
0.75 8.85 × 10 4 11.25471
1 11.78 × 10 4 15628
Disclaimer/Publisher’s Note: The statements, opinions and data contained in all publications are solely those of the individual author(s) and contributor(s) and not of MDPI and/or the editor(s). MDPI and/or the editor(s) disclaim responsibility for any injury to people or property resulting from any ideas, methods, instructions or products referred to in the content.