Article

Conformal Satellite Tanks—Printed Plastics and Fluid Interactions

by
Alexander Bauer
,
Alexander Burnicki
,
Marco Eßer
,
Äantas Kesten
,
Ermanno Manca
,
Niklas Meyners
,
Tim Lukas Kirsch
,
Till Siebert
,
Ana Stankovic
,
Benedict Grefen
* and
Enrico Stoll
*
Chair of Space Technology, Technische Univers ität Berlin, Marchstraße 12-14, D-10587 Berlin, Germany
*
Authors to whom correspondence should be addressed.
These authors contributed equally to this work.
Fluids 2022, 7(8), 265; https://doi.org/10.3390/fluids7080265
Submission received: 28 June 2022 / Revised: 21 July 2022 / Accepted: 28 July 2022 / Published: 3 August 2022

Abstract

:
Initial experiments in the design process of a novel 3D printed conformal propellant tank for small satellites are conducted. Contact angle measurements of static colored water droplets on printed PLA, PMMA, and PETG sample plates are performed. Additionally, the optical characteristics of transparent printed tanks of two to five millimeter wall thickness and with three illumination setups are evaluated. The results indicate that the influence of fluorescein as a colorant in the useful concentration only slightly affects the contact angle measurements. The combination of well scattered UV light and use the smallest possible wall thicknesses, on the order of two millimeters, made out of PLA provides the best visibility. These findings enable the development of a printed conformal tank design with an integrated PMD.

1. Introduction

The propulsion system of a satellite can account for more than half of the satellite’s weight, depending on the mission, leading to a significant design impact [1]. Tanks and propellant are the mass drivers for propulsion systems. In addition to reducing the weight of the tank itself, it is important to reduce the influence of propellant movements on the center of mass of the satellite [2]. Therefore, the common tank design is a spherical or cylindrical pressure vessel installed axisymmetrically and close to the center of mass of the satellite. A common approach for controlling propellant movement is the use of diaphragms. The added materials and parts needed for diaphragms inhibit additive manufacturing of an integrated tank design. To extend the capabilities of small satellites and CubeSats, new adapted small propulsion system designs are needed, and are currently being developed [3]. While small satellites have mass limitations, their limited volume is often the stronger design driver [4,5].
Conformal tank design is a solution for integrating tanks in small satellites in a volume efficient manner. Conformal in this context means that these tanks can have complex geometries, allowing the space around other components to be used as efficiently as possible [3]. However, these designs present several difficulties, such as unpredictable fuel sloshing, ensuring a continuous fuel flow, and completely emptying the tanks [6]. Propellant Management Devices (PMD) mitigate these difficulties in common tank designs, and could be adapted for conformal designs. Modern 3D printing techniques enable the manufacturing of conformal tanks with built-in static PMDs as an integrated component. The interaction of this design with an integrated PMD is the subject of current research. Currently, this research is limited to individual effects and components [3]. An evaluation of the integrated system behavior in a realistic microgravity environment has not been performed.
An experiment to address this disparity using a sounding rocket would assess conformal tank designs with integrated PMDs printed with a transparent filament. With an optical system, the dynamic behavior of several conformal tank designs could be evaluated in flight while colored water is drained from the tanks. Due to the cost of such an experiment, preparatory research is necessary in order to ensure the most efficient experimental setup. This preparatory research is discussed in the present paper.
The function of the PMD is based on capillarity, thus, the surface tension needs to be examined. A contact angle measurement investigates the influence of dye on the interaction of water with different printed material surfaces and provides insights on the surface tension by evaluating the wettability. As the wetting state is independent of gravity, the results transfer to the PMD in a space environment. Furthermore, the visibility of the fluids in the structure needs to be reviewed for the best possible outcome of subsequent studies. The idea is to improve the visibility with fluorescence. The optical property of the dyed fluid is evaluated under different illumination setups. The materials used in a Fused Deposition Modelling (FDM) printing process are Polyactide (PLA), Polymethylmethacrylat (PMMA), and Polyethylenterephthalat modified with glycol (PETG). The properties of the 3D printer used are listed in Table A1 [7]. Water was used as the test fluid, and fluorescein as the colorant. As there are no known effects of microgravity on artificial light sources, an experimental setup of color measurements is transferable to space conditions. These preparatory experiments can enable a future detailed sounding rocket experiment setup to evaluate the performance of a static PMD-filled conformal tank made out of plastic. The visibility of dyed fluid behind transparent plastics, the potential illumination, and the comparability of the contact angles in regard to aluminum were all evaluated. Aluminum is a potential printing material for a subsequent test tank.
Comparable contact angle measurements for FDM-printed PLA have already been performed [8]. However, the following experiment is intended to assess the influence of a colorant. While prior research controlled for the effect of dyes in water and did not find an impact, an extensive literature review did not find articles covering the specific material combinations needed for the following experiments [9]. There is, however, an extensive literature about contact angle measurements. Hebbar et al. [10] provides a comprehensive introduction to the topic. In the following experiment, the sessile drop technique is used, which is described in more detail below.
Building on existing research concerning the optical properties of FDM-printed PLA, the effects of wall thickness on transparency and illumination setups were investigated in order to determine a suitable combination of illumination, coloring, and material. In order to investigate the different optical properties, a dedicated test tank was designed. The test tank does not represent a final configuration for a satellite; it has an open fluid chamber, with different wall thicknesses on the front side. The back side was adapted accordingly to ensure a consistent fluid volume behind the front wall. A technical drawing of the printed tank can be seen in the experiment description. A detailed description of the challenges involved in comparable experiment setups is provided by Quero et al. [11]. For example, unavoidable small air-filled voids between the deposited layers can lead to a reduction in transparency due to multiple boundary layer interactions. The previous literature has focused on individual aspects of the optical characteristics of FDM-printed plastics, for example, different treatment methods for improving the transparency of printed PETG. However, these methods usually cannot be applied to complex structures, and can, for example, reduce the tensile strength of PETG [12].
Adding to the current research, the aim of this article is to present an experimental evaluation of the influence of dyes, different printing materials, and illumination setups on the contact angle and the optical properties of water. Section 2 presents the experimental setup, while the outcome is presented in Section 3 and afterwards discussed in Section 4, then a final conclusion is drawn.

2. Experiments

A total of two experiments were carried out. The aim of the first experiment was to investigate the contact angle between the fluid and the different printable filaments. In the second experiment, the transparency of the filaments was investigated depending on the print thickness and illumination. The overall setup for both experiments was almost identical. 
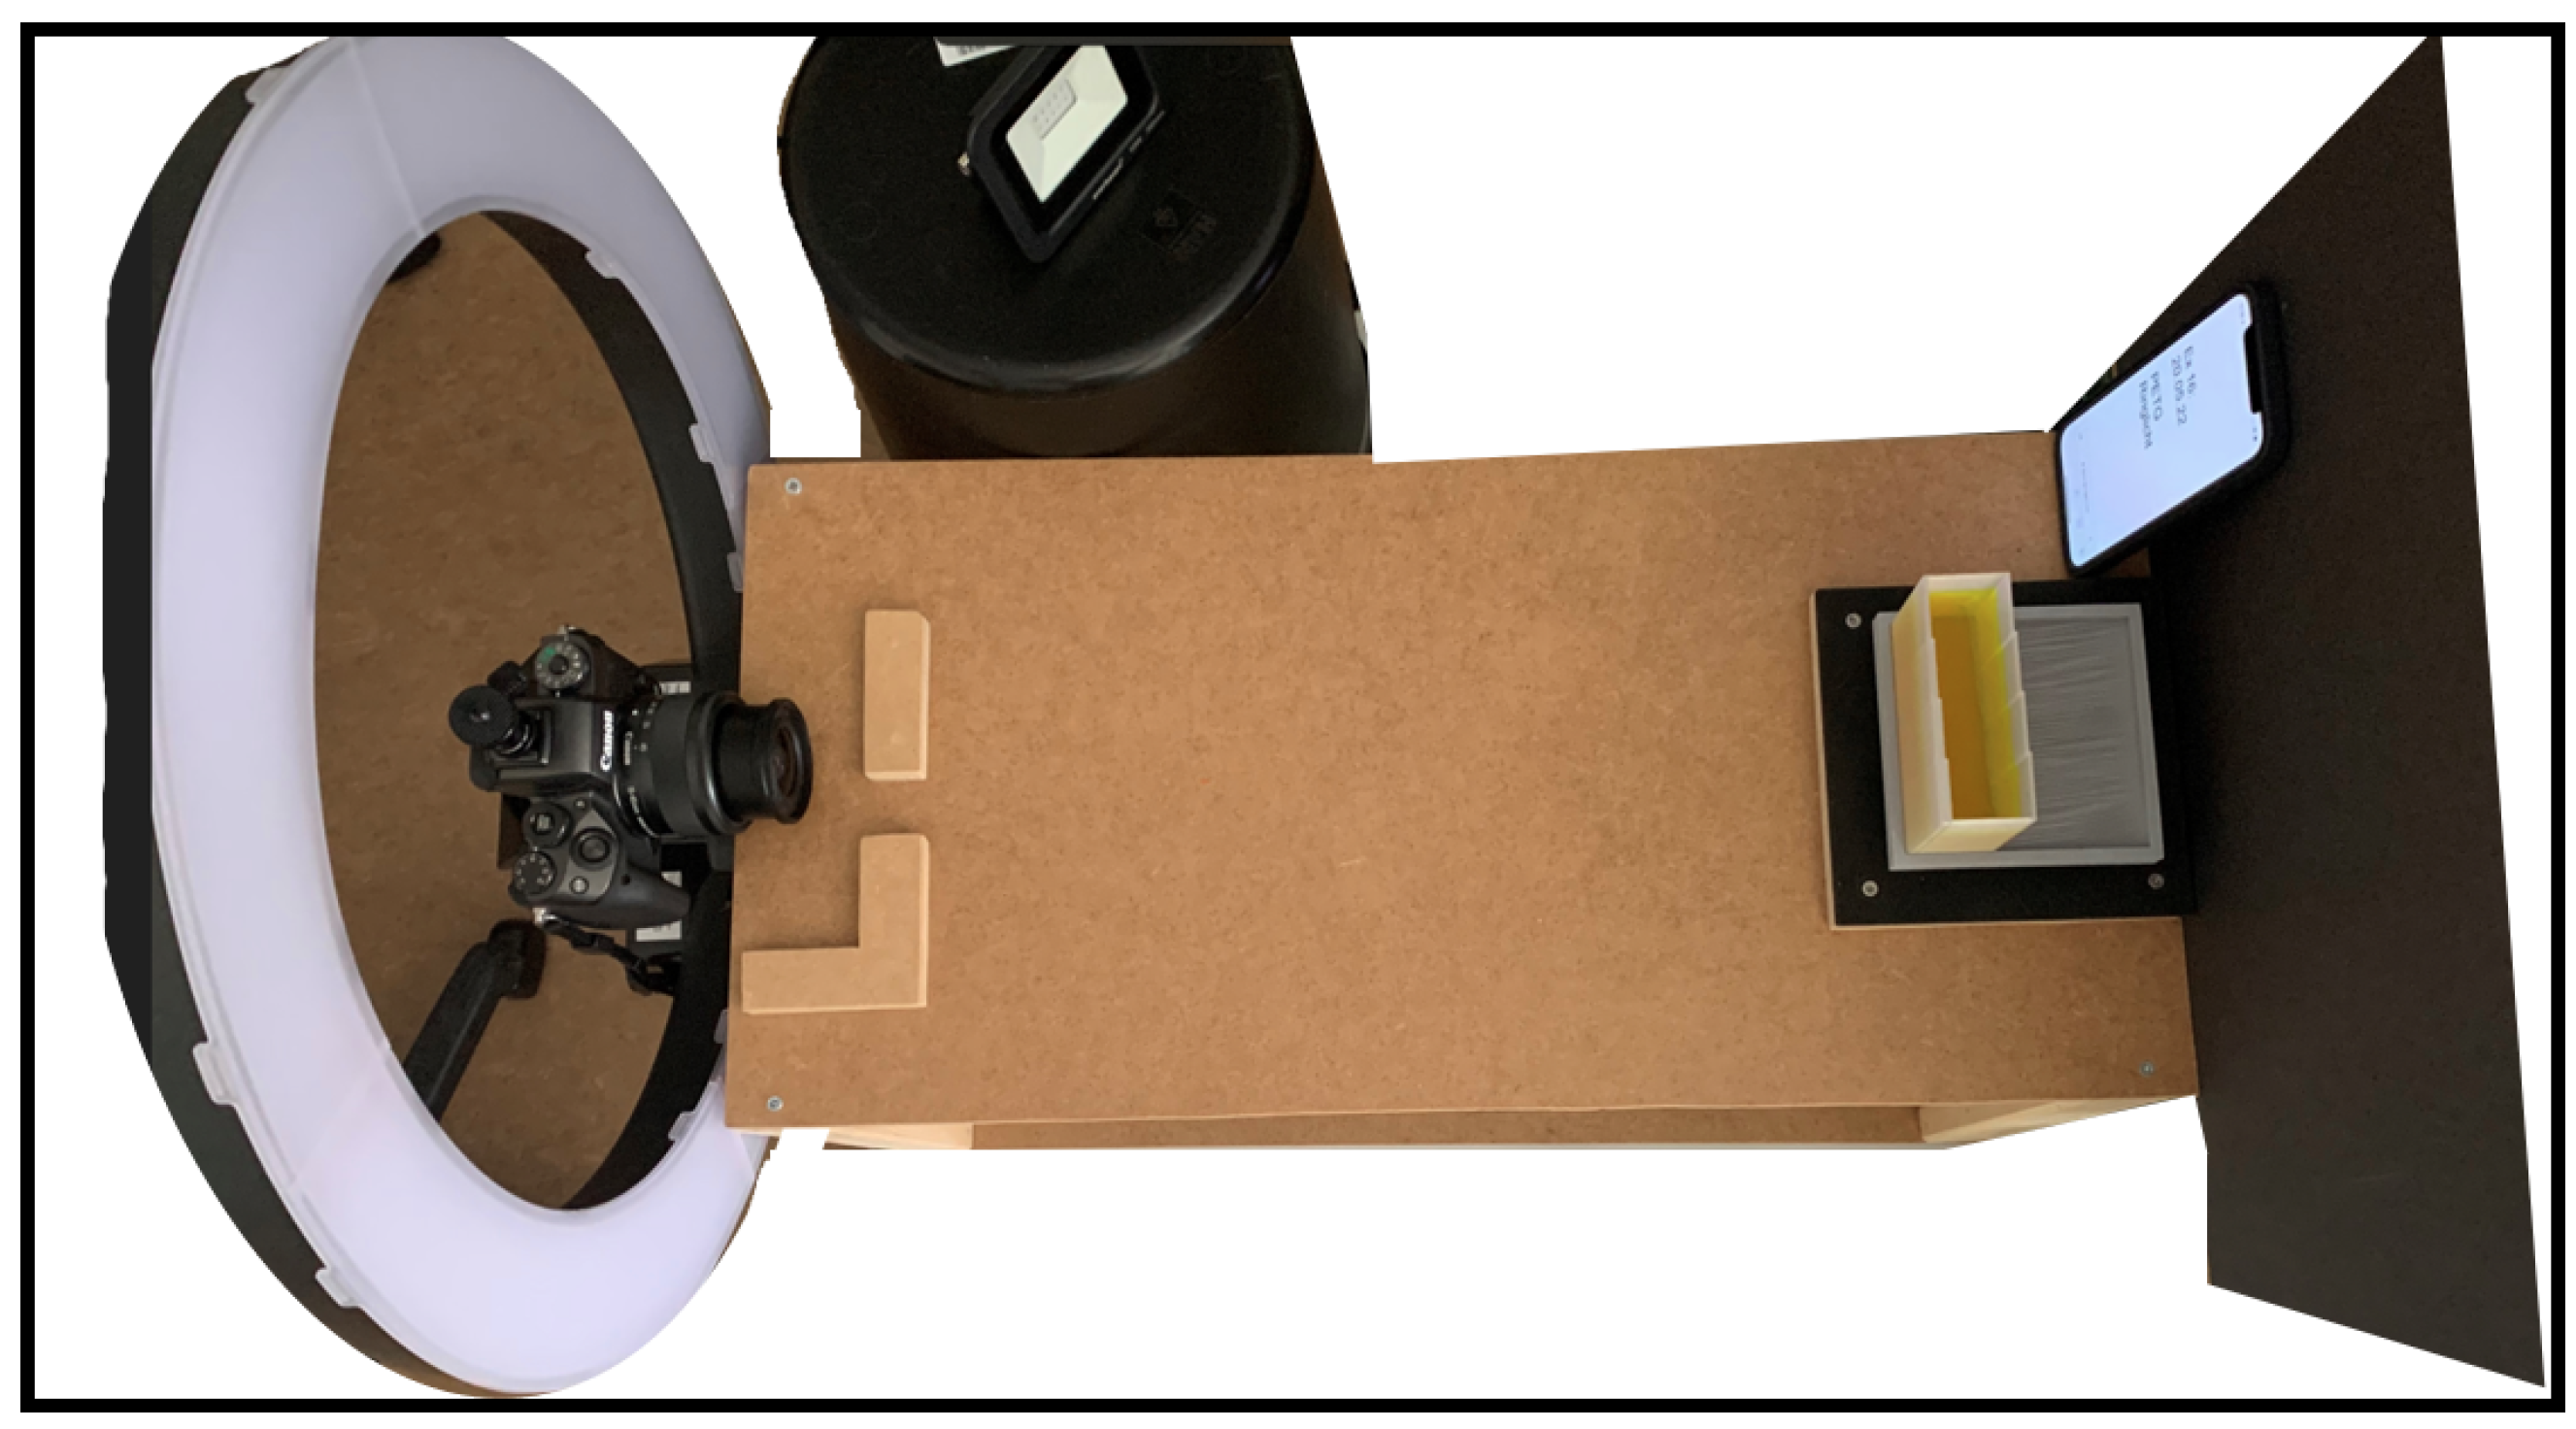
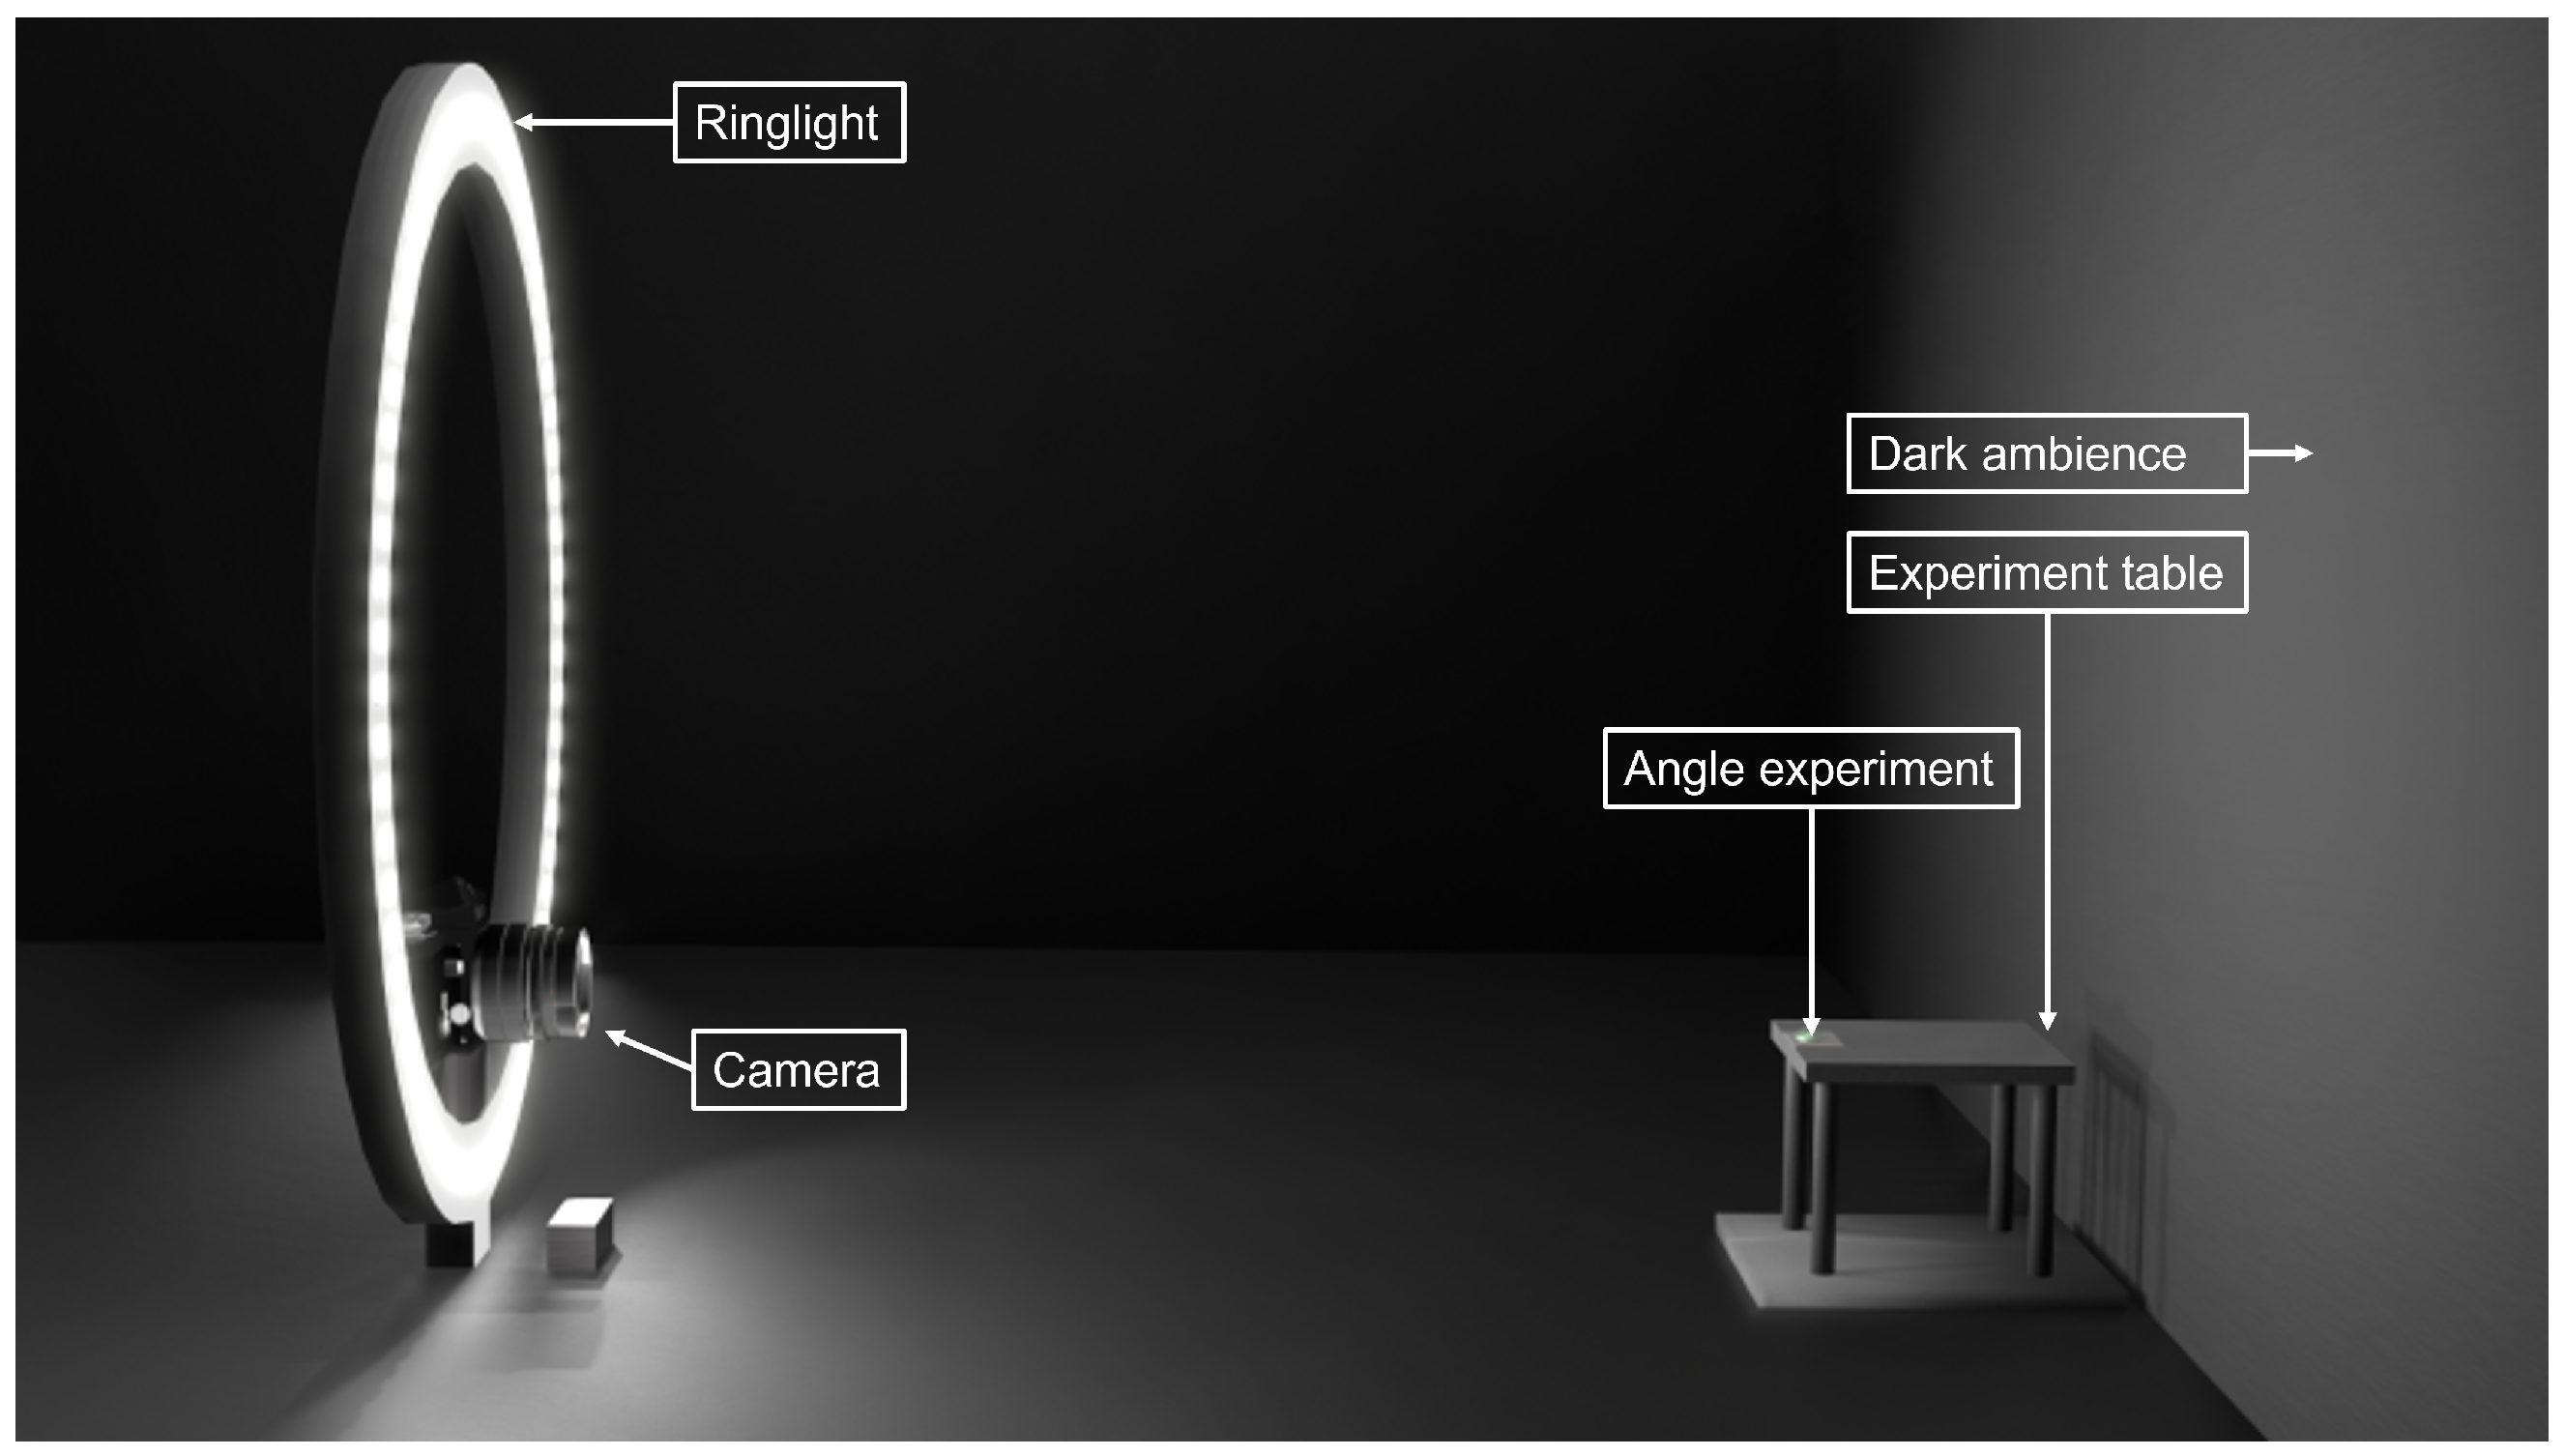
Figure 1 shows a render of the optical angle measurement setup. A top-down view with measurements is shown in Figure A1, and an image of an exemplary setup for the optical experiment can be seen in Figure A2.
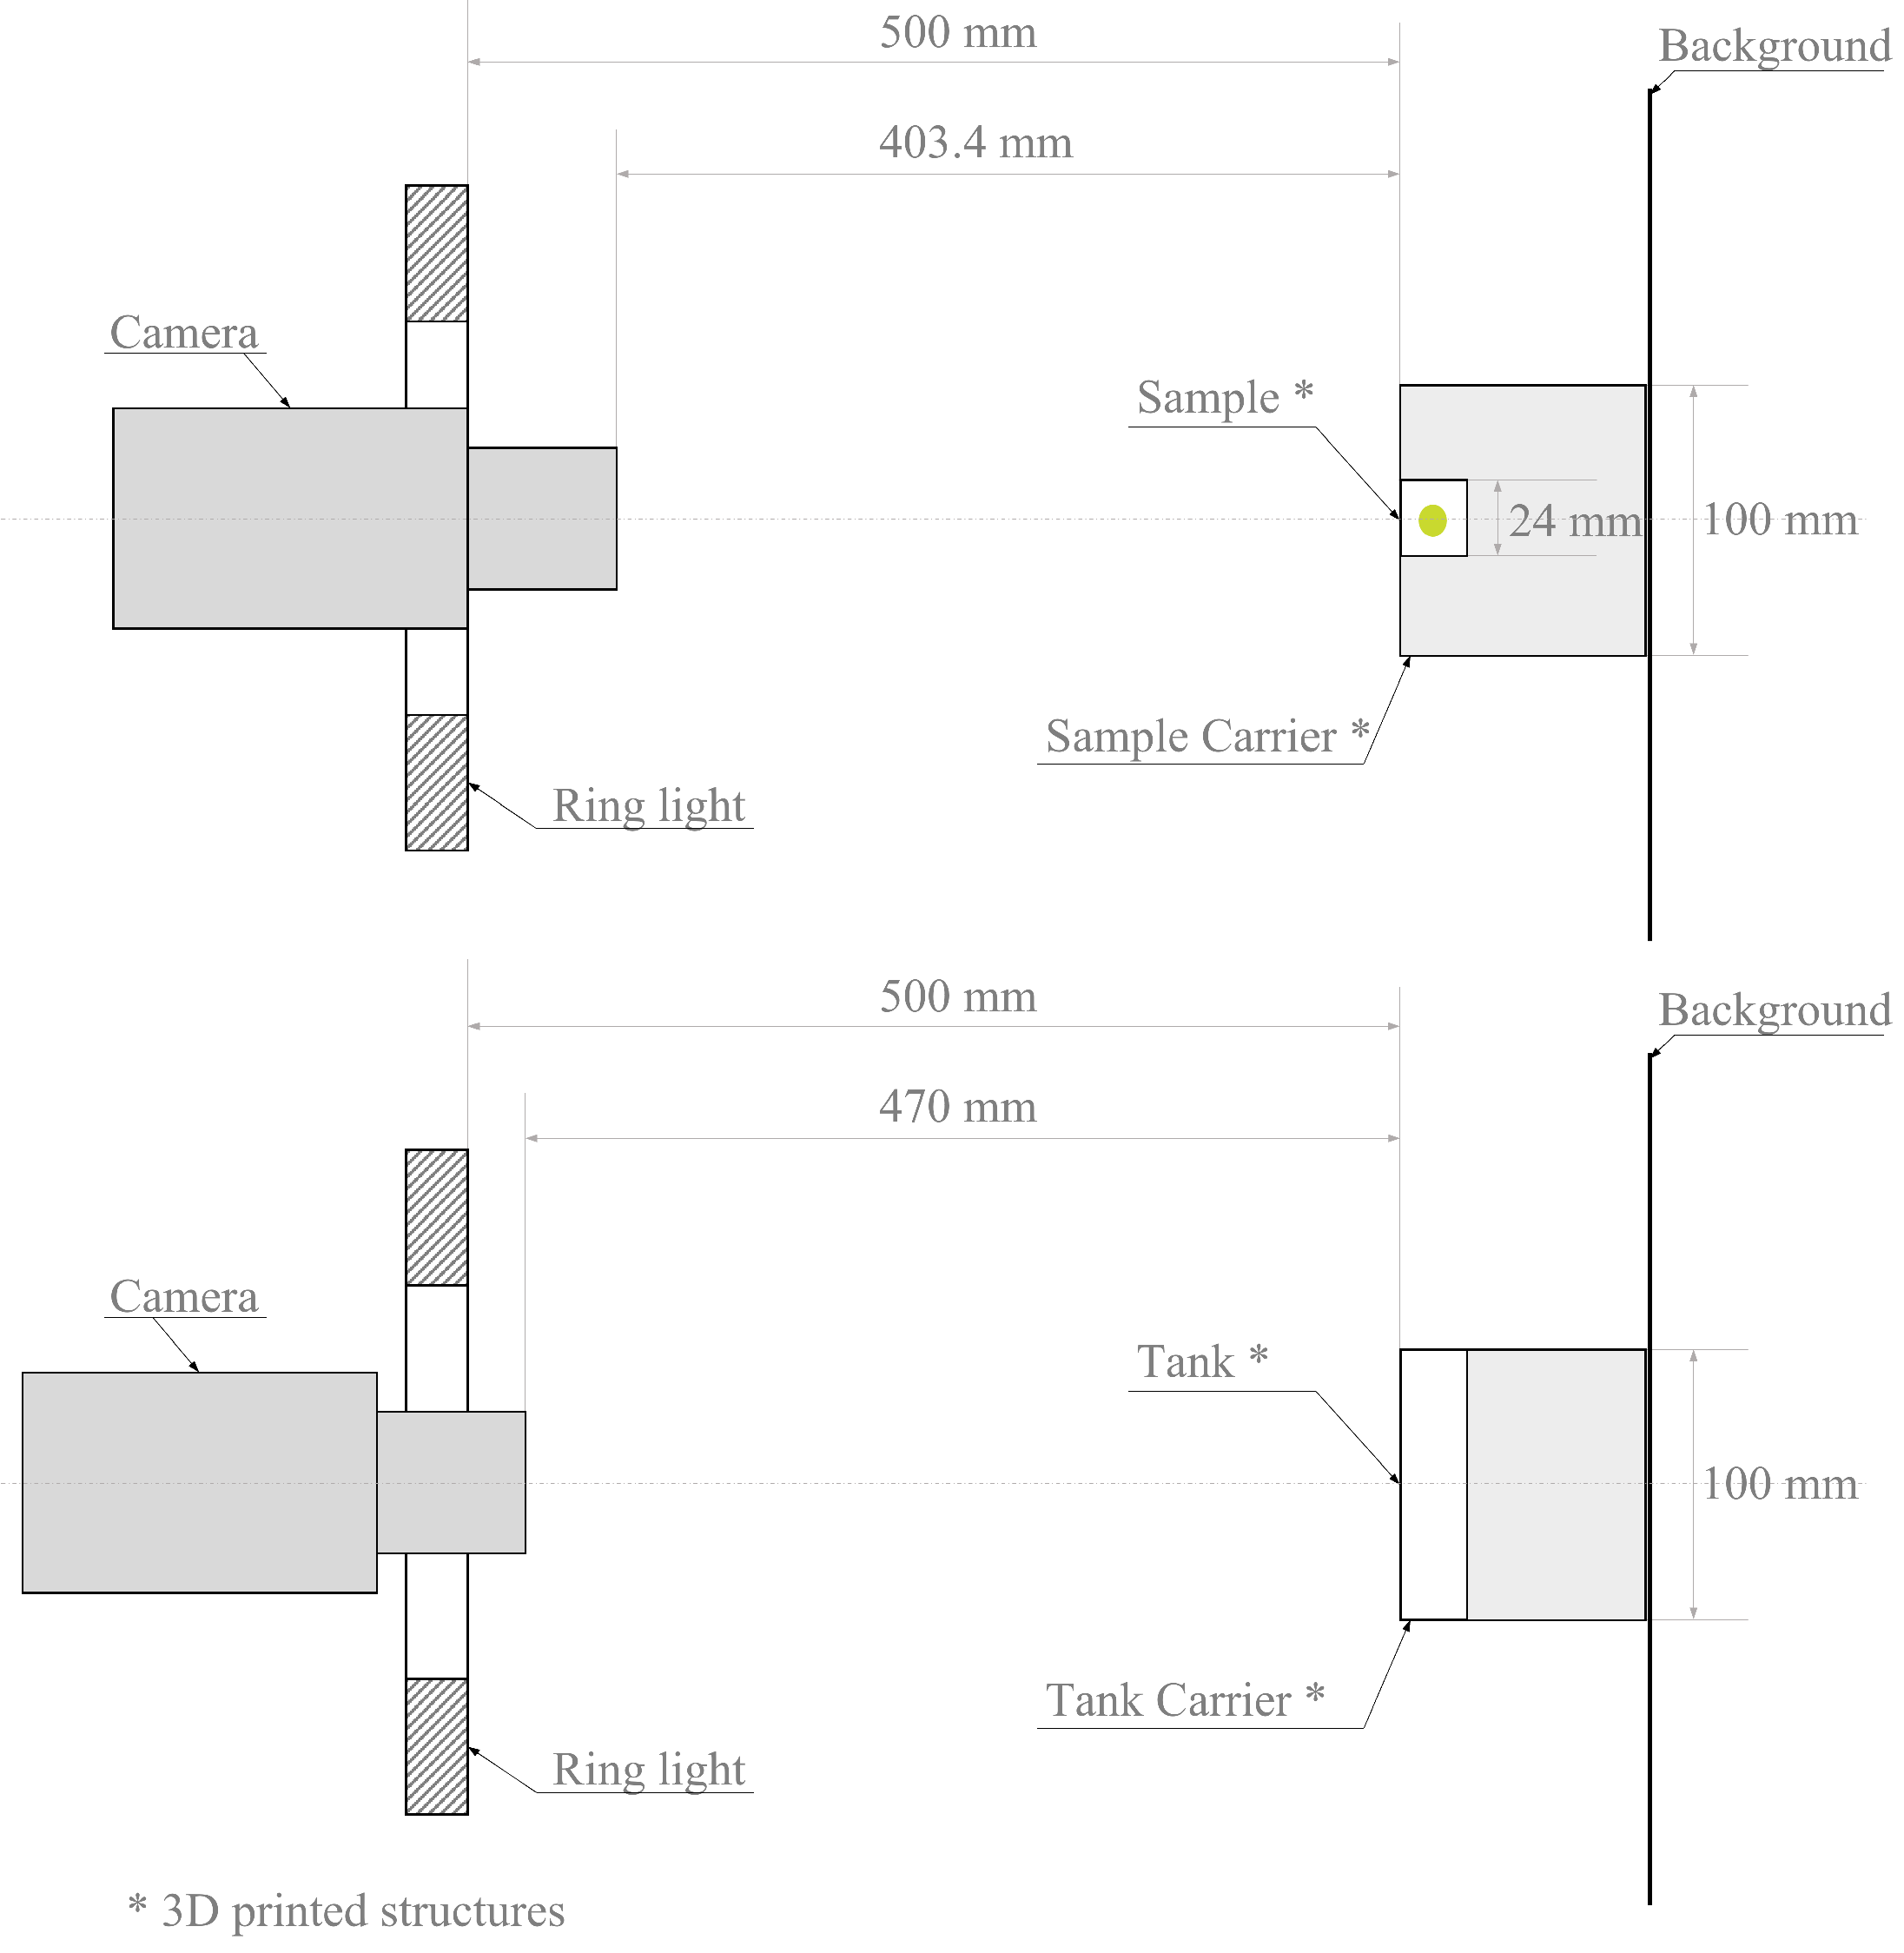
The camera was mounted on a tripod and the lens of the camera was aligned parallel to the front plane of the sample carrier. The sample carrier was a 3D-printed structure resembling a table. A ring light used for even and indirect illumination was identically aligned, and was positioned at a distance of 500 mm from the sample carrier. Additionally, an Ultraviolet (UV) light source was used as an alternative illumination setup. In order to ensure a uniform background for all measurements, a sheet of black cardboard was positioned behind the table. For the contact angle measurements, a piece of molton fabric was used to provide a more uniform background with the chosen focus settings, as other backgrounds proved to be too inconsistent in previous experimental runs. All 3D printed parts used in the experiments were manufactured using a Prusa i3 Mk3S+. Two different fluids, namely, water and water mixed with Fluorescein with a concentration of 0.33 g/L, were used in the experiments.

2.1. Contact Angle Measurements

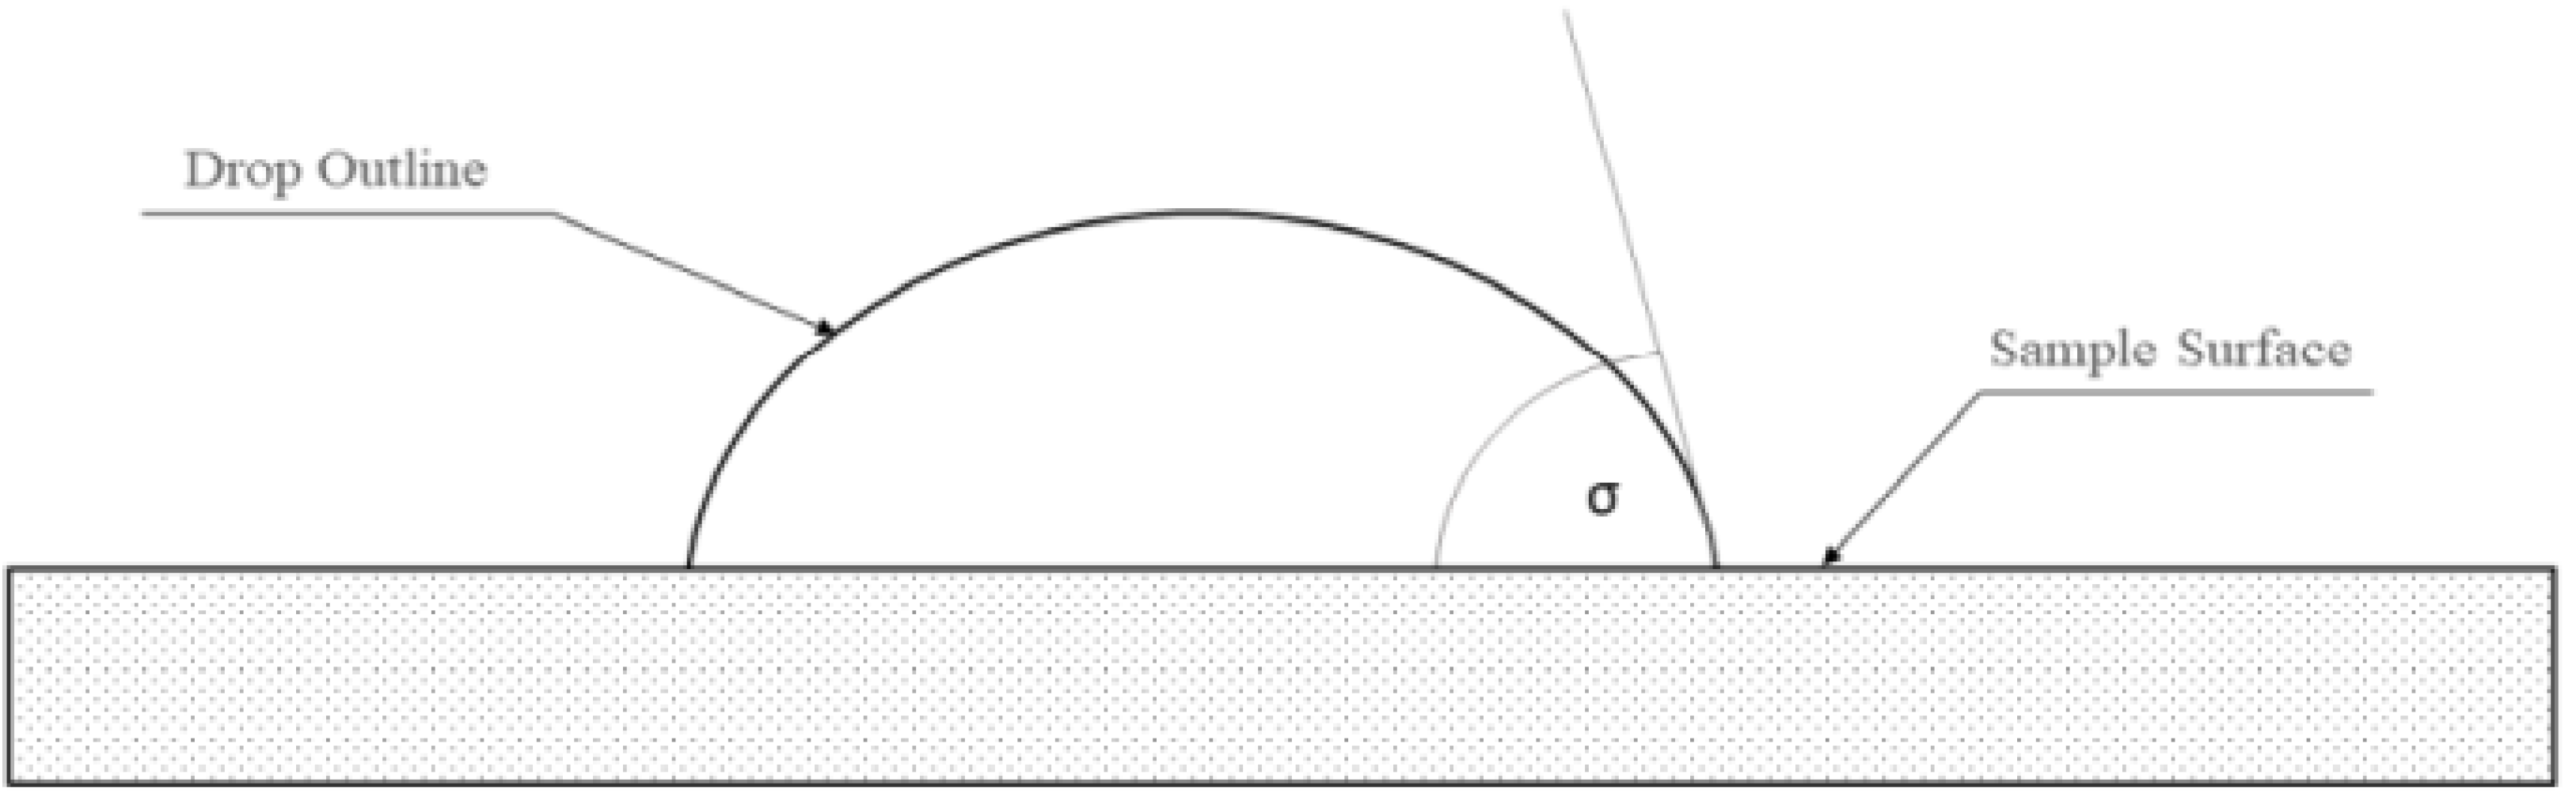
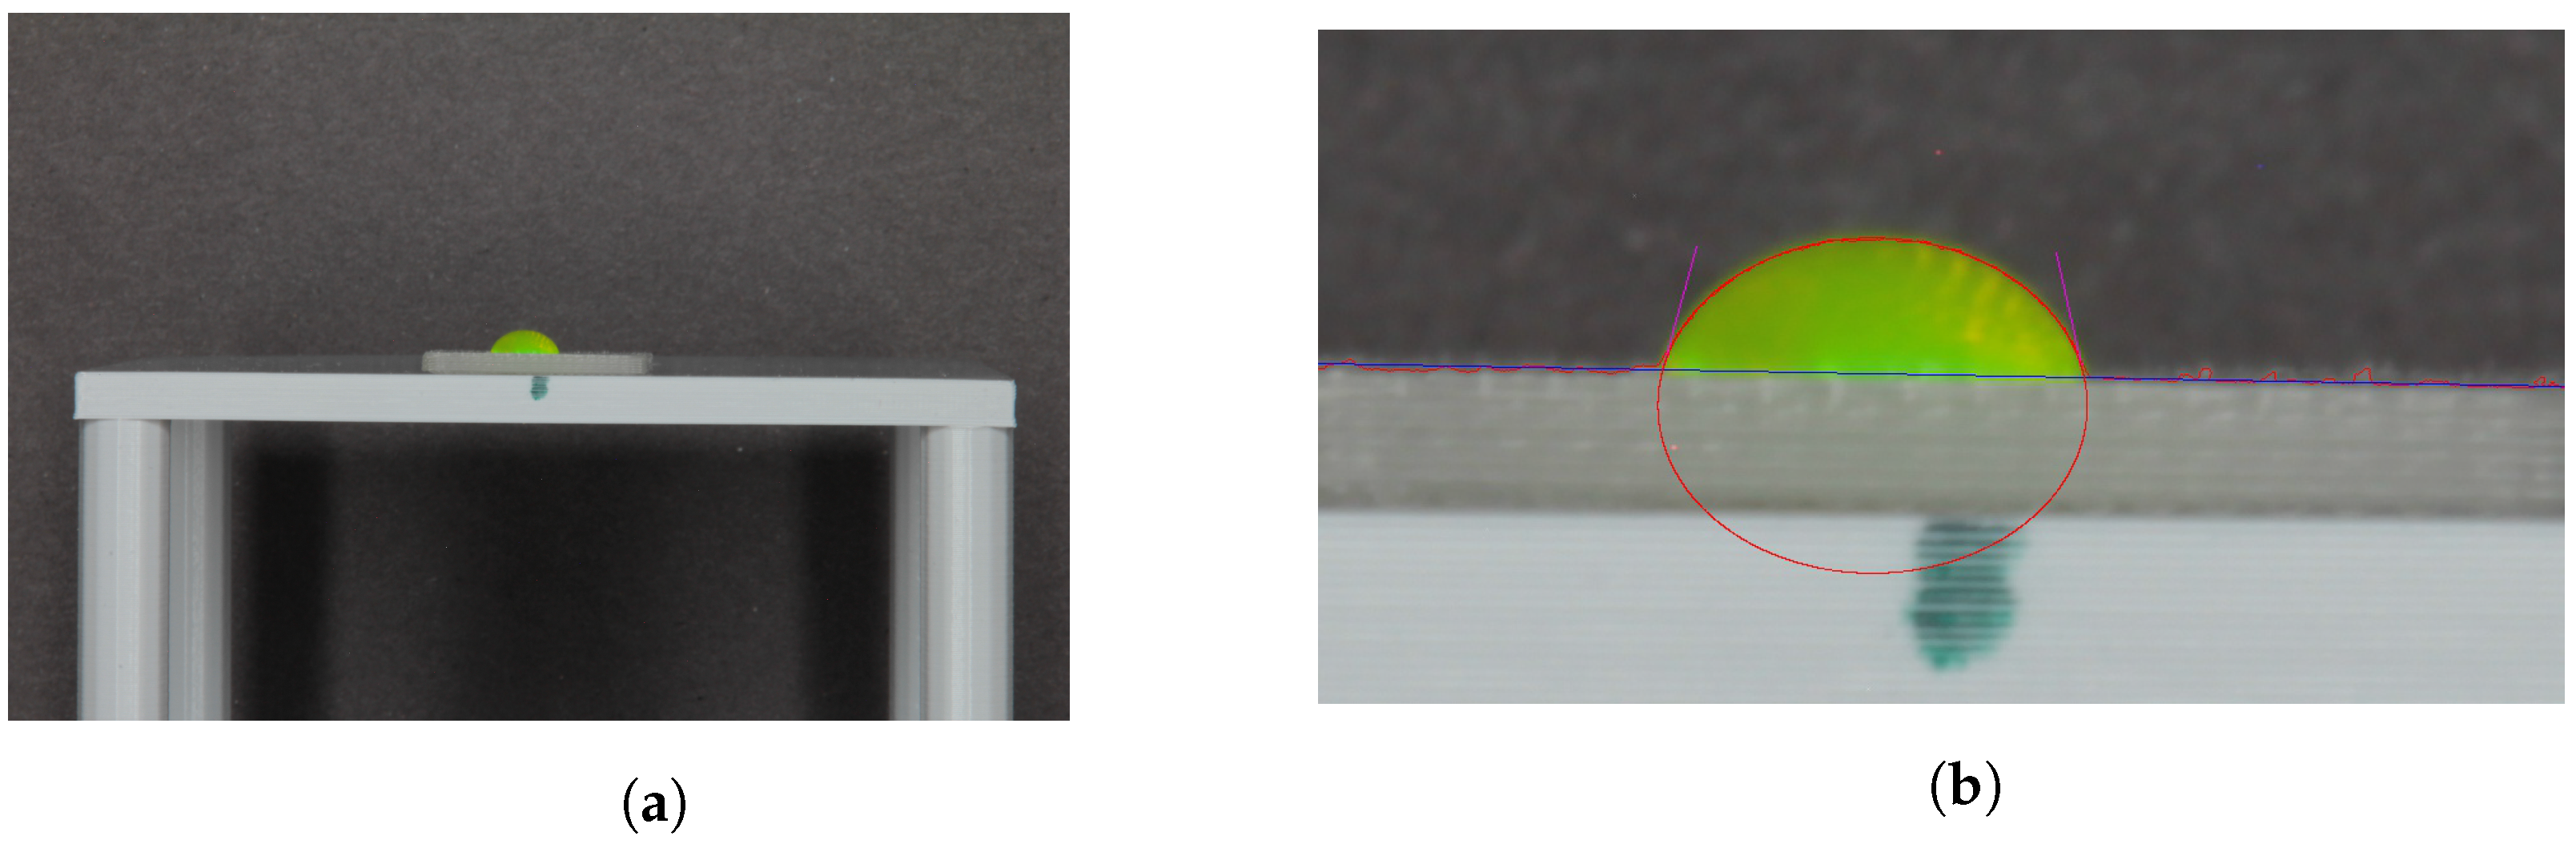
The angle measurements were conducted by analyzing the angles shown in Figure 2, using the angle of fluid drops on the surface of different additive manufactured sample plates under ambient conditions.
This procedure is referred to as a drop shape analysis or sessile drop technique [10,13]. The analysed materials were PMMA, PETG, and PLA, each with two different print resolutions of 0.3 mm and 0.05 mm, resulting in six different sample plates. The dimensions of the plates were 24 mm by 24 mm by 2 mm. Additionally, an aluminium plate was analysed as a comparable future test tank material. Due to the manufacturing process of the plates, one side of the plates was smoother, as the first layer was pressed on the buildplate of the printer during printing. For each measurement, the sample plate was placed with the smooth side facing upwards on the table structure aligned to the table edge and perpendicular to the camera setup, as seen in Figure 1. A technical drawing is shown in Appendix A.
For this experiment, a Canon EOS 60D camera with a Tamron AF 18–200 mm f/ 3.5–6.3 XR Di II LD aspherical lens and two macro extension tubes was used. Due to the use of the macro extension tubes, the sample occupies a larger part of the images. The camera parameters are listed in Table 1.
As the camera with lens was aligned with the lens at the lowest focal length, the total distance between the camera and the edge of the sample plate changed by the length extension of the lens of 96.6 mm, resulting in a distance of 403.4 mm.
The samples were cleaned before each measurement with isopropyl alcohol. The twelve possible combinations of material, print resolution and fluid were all investigated. Each combination was measured ten times, resulting in 120 images in total.
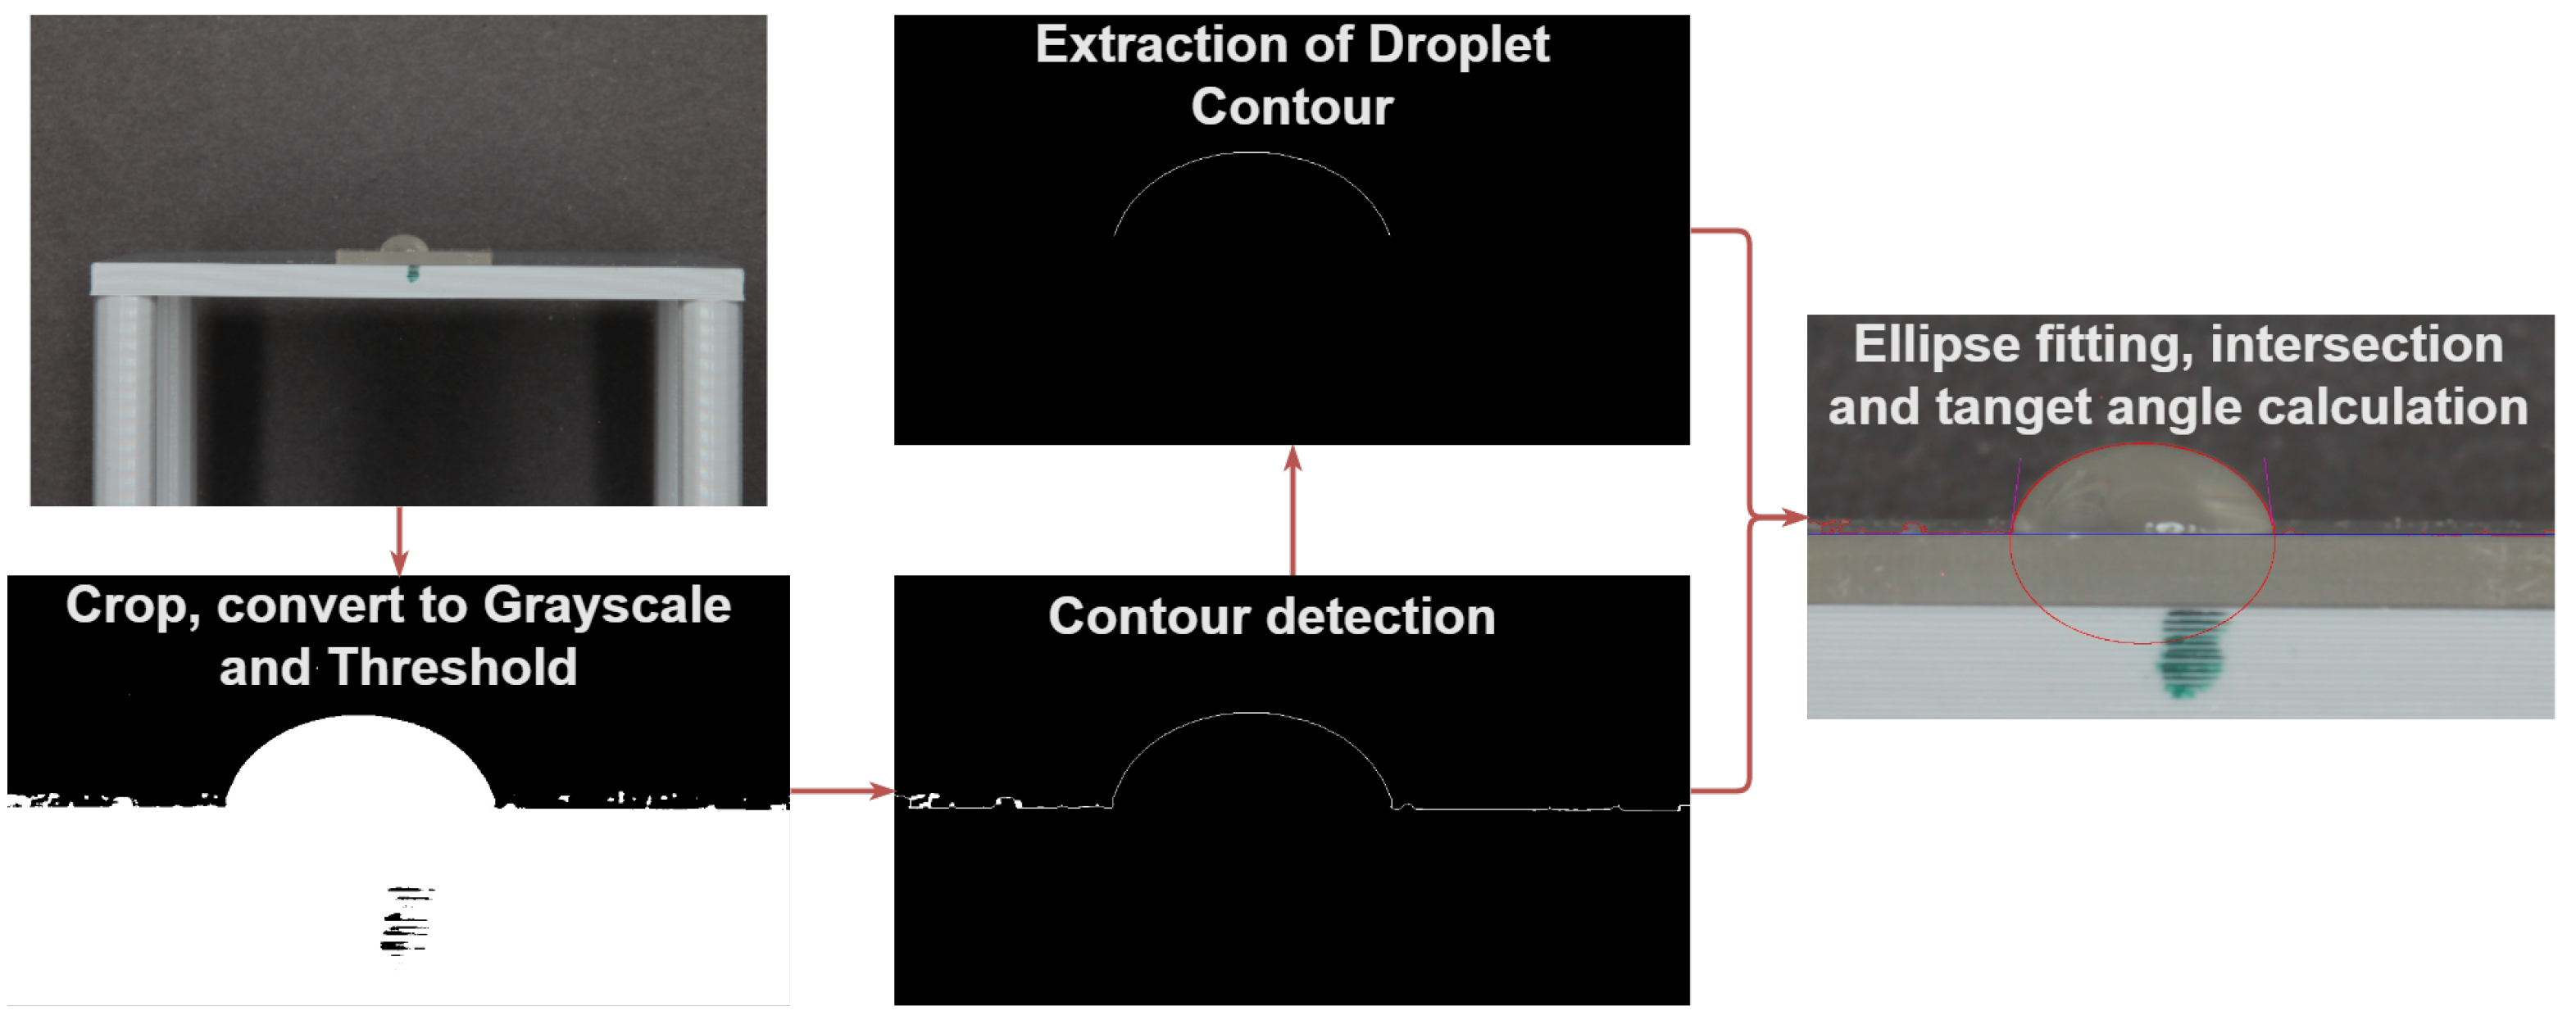
In order to derive the contact angle from the collected image data, computer vision was utilized. The images were centered and cropped around the droplet to minimize processing time and to ensure that only the relevant area was analyzed. Then, the images were converted to a gray-shaded color space and thresholded to separate the background and foreground of the image. From the resulting binary image, a contour along the plate and droplet was derived with the implementation of the OpenCV contour finding algorithm [14]. Taking this contour, the horizontal border of the plate was derived as a parameterized line with the Hough Transform implementation of OpenCV [
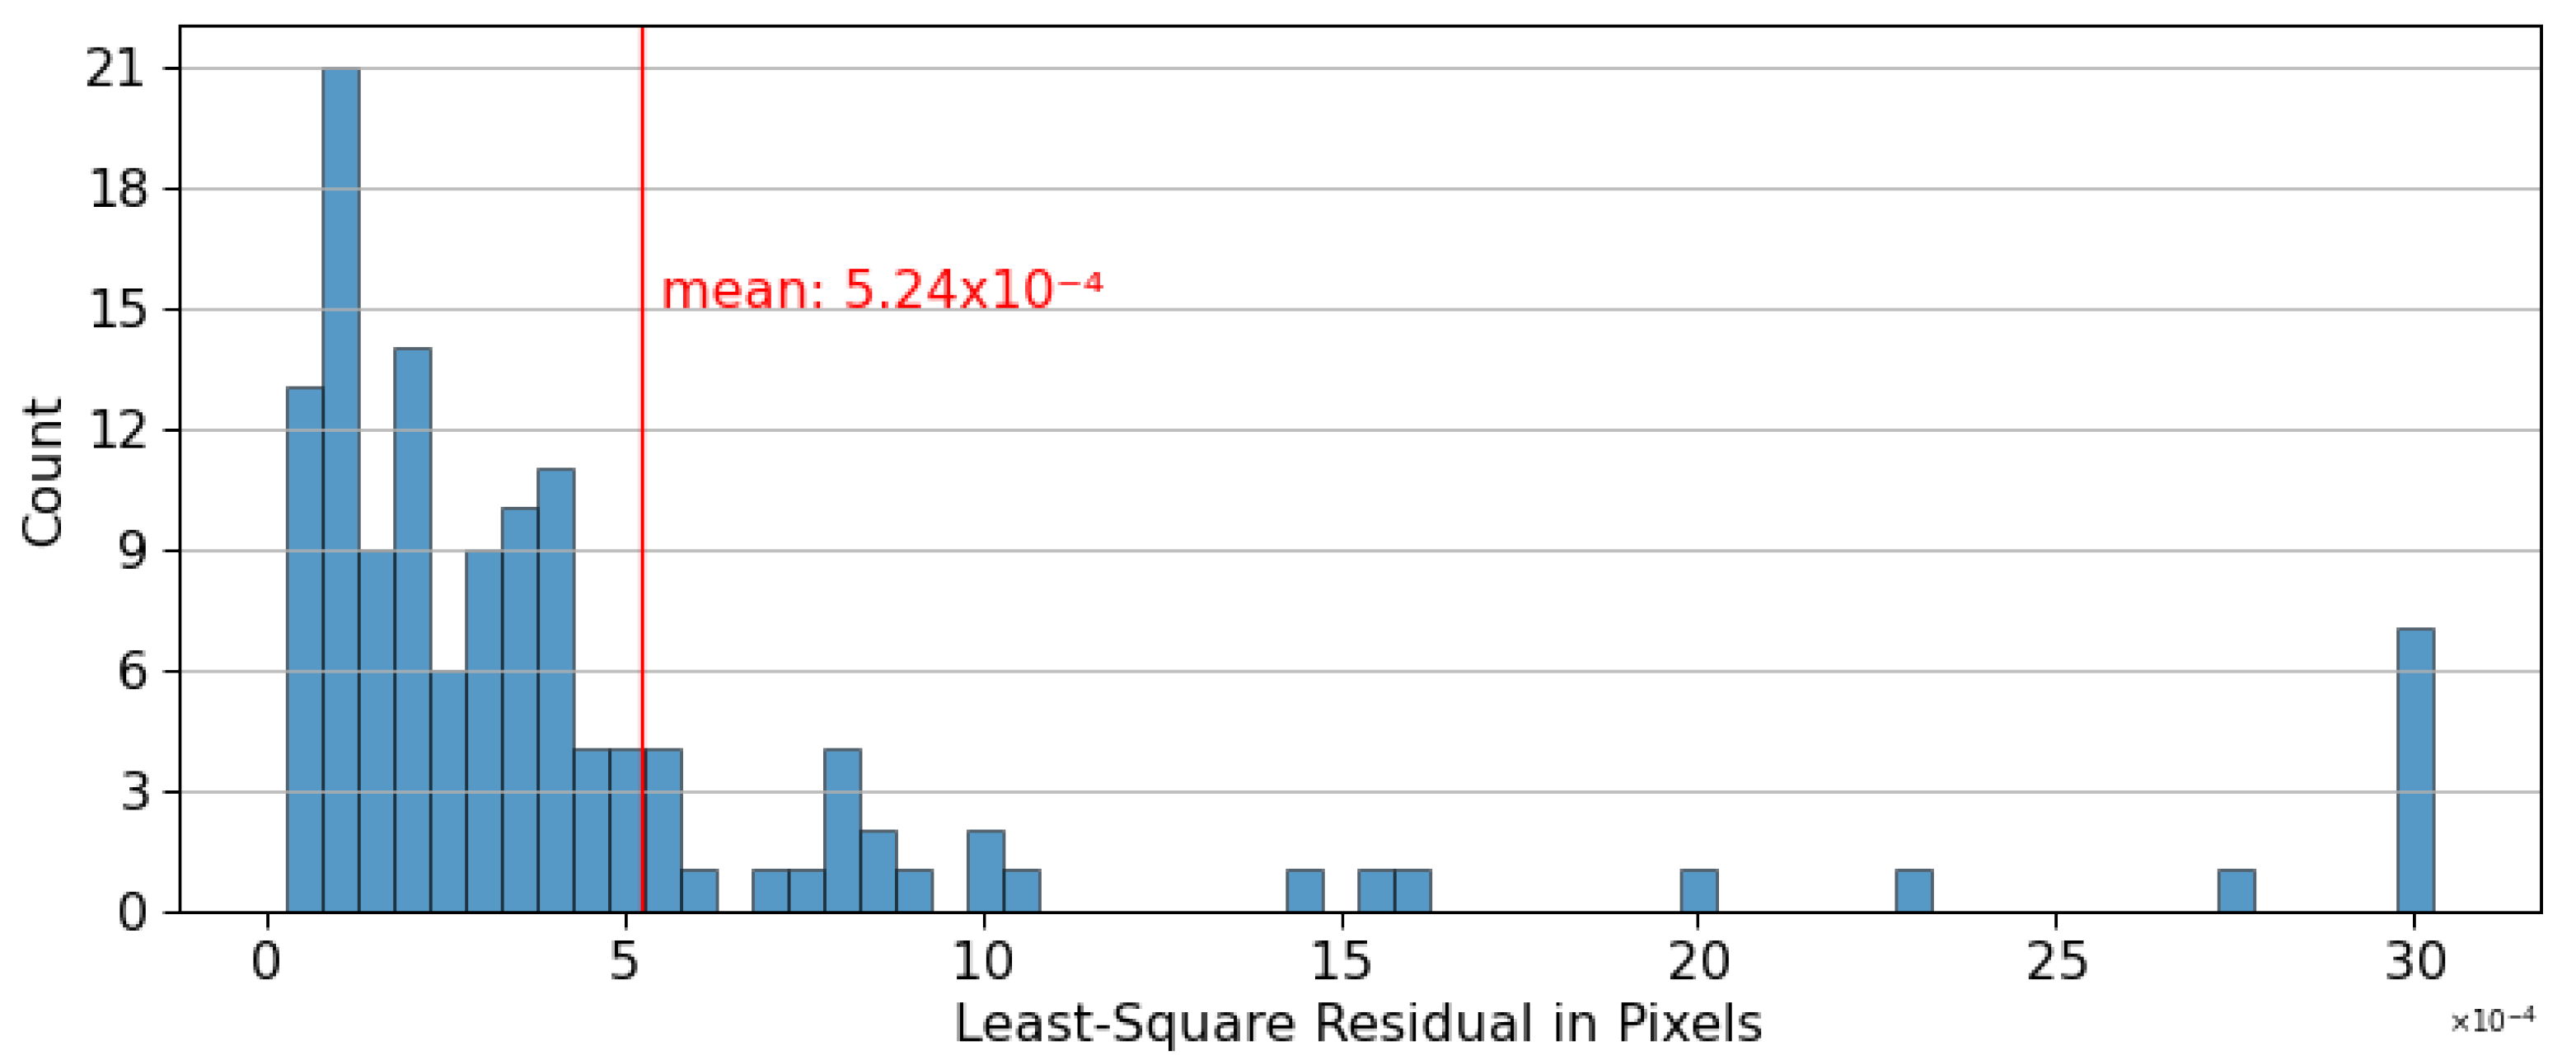
15]. This algorithm is occlusion-insensitive, and can therefore easily derive the straight line from the combined droplet and plate contour. The line was used to extract the contour of the droplet by cropping the contour line with a small pixel margin above it. The droplet contour pixels were transformed into the Cartesian coordinate space. The resulting points were used to fit an ellipse by analytically solving a least-square regression problem. As least square regression is sensitive to outliers, a simple outlier filter was applied beforehand by removing points that exceeded a standard deviation of two sigma.
Finally, the contact angle was calculated by intersecting the horizontal line with the fitted ellipse and calculating the angle between the horizontal line and the tangent of the ellipse in the intersection point. Figure 3 provides an example of this processing, and a rough overview of the process with the intermediate images is depicted in Figure 4.

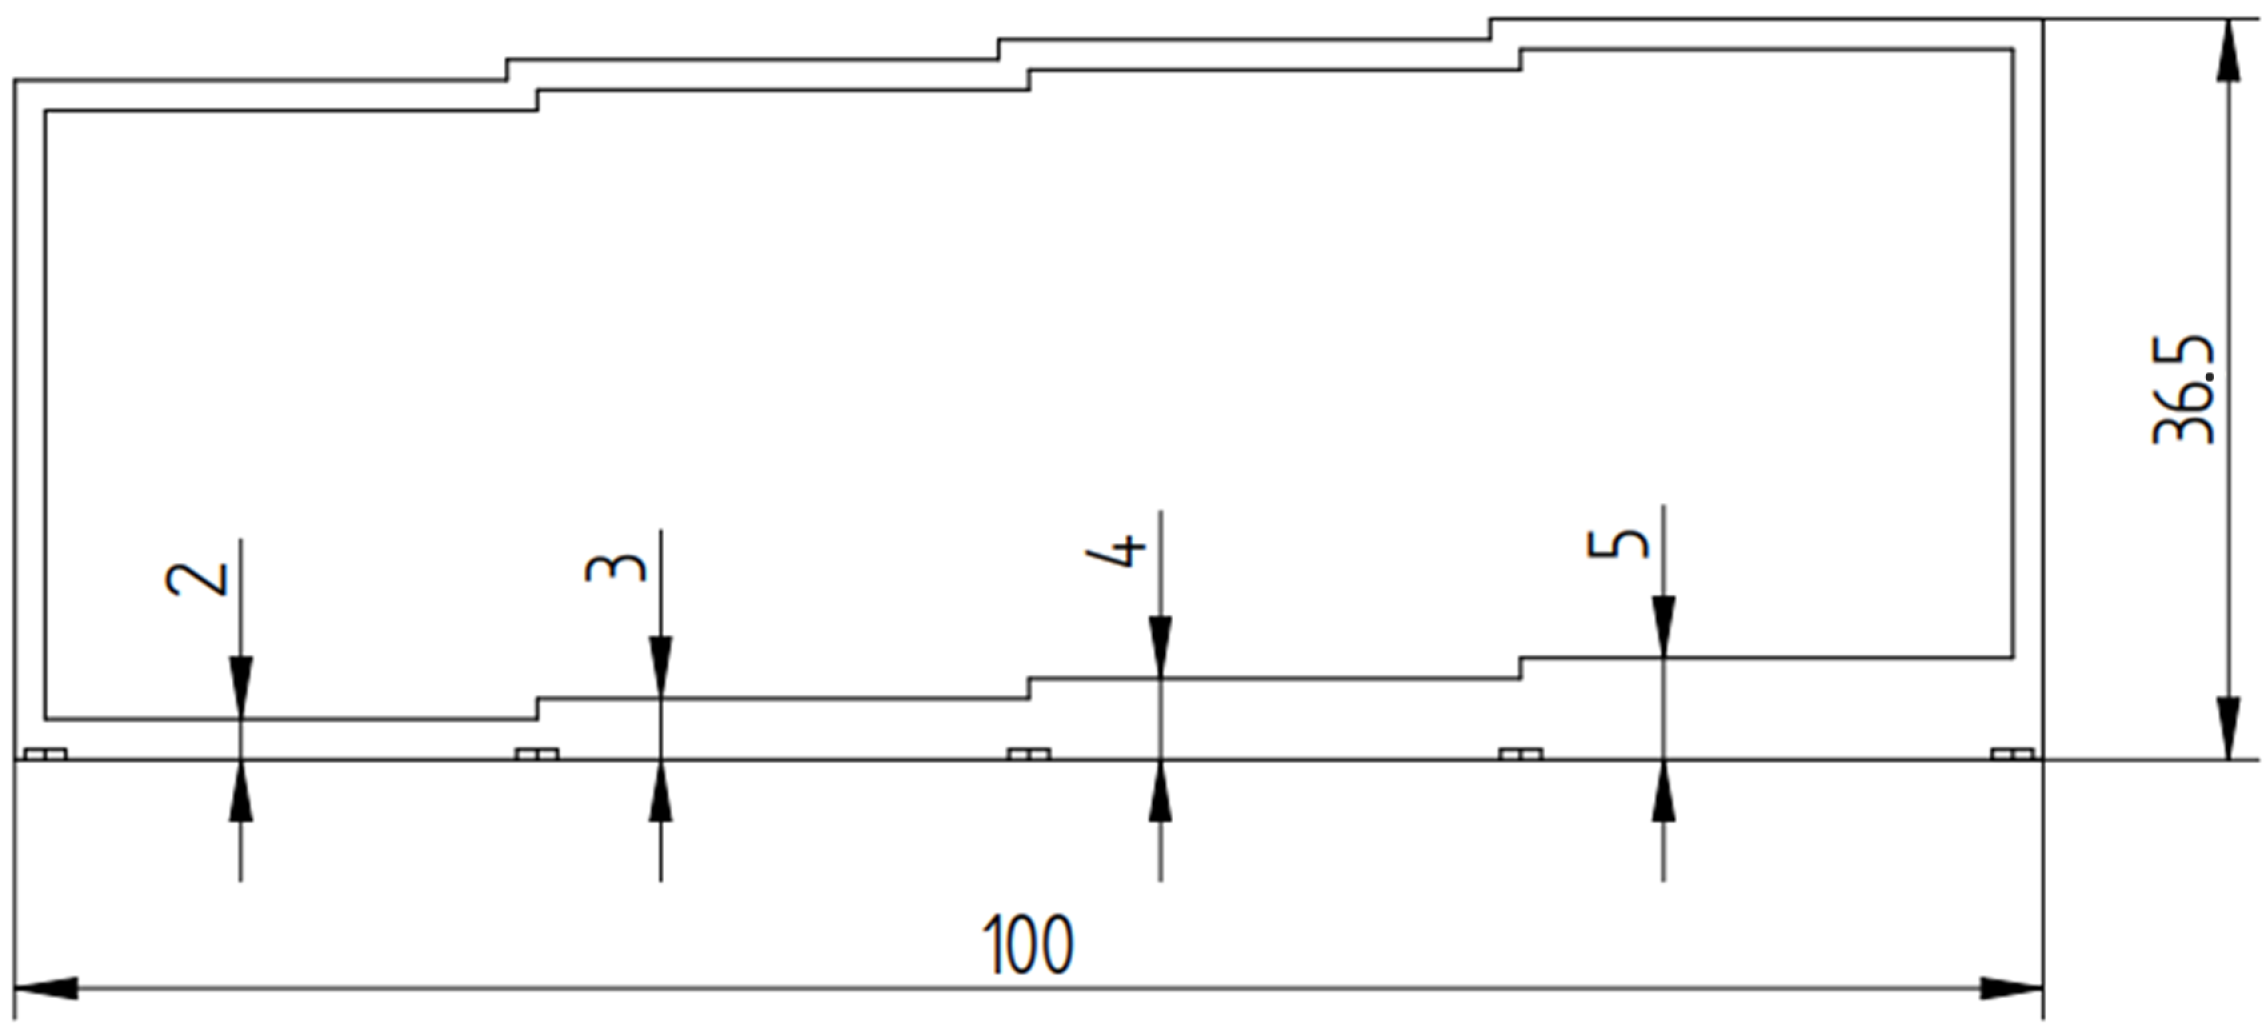
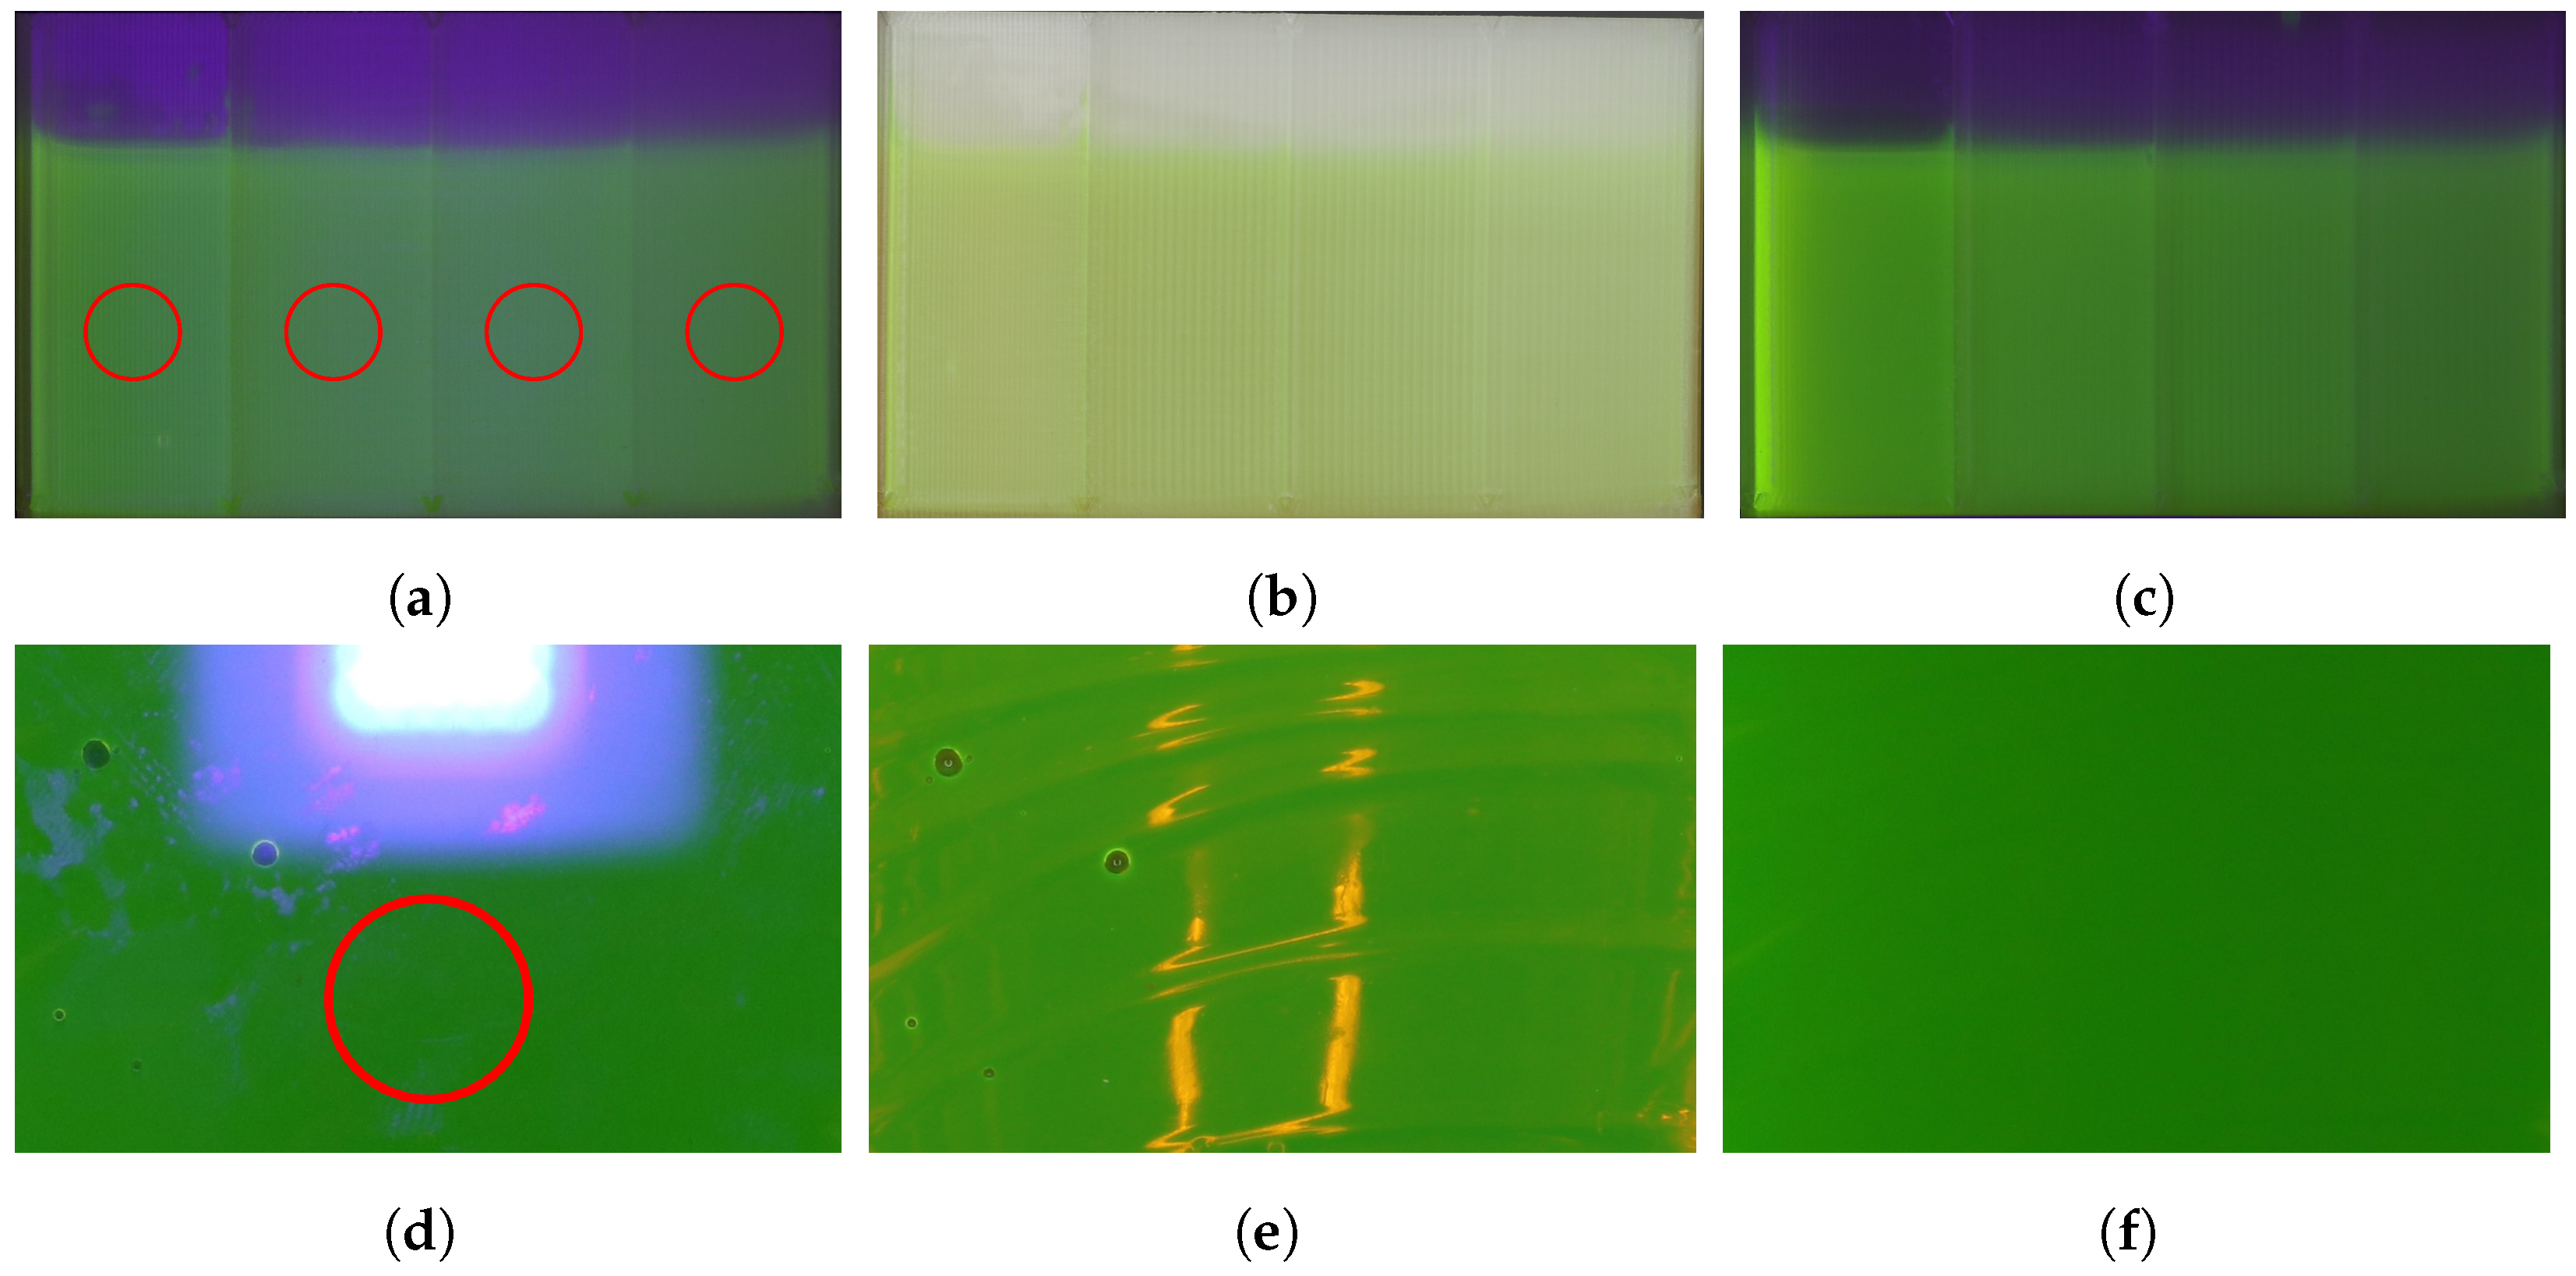
2.2. Optical Measurements

For the optical analysis of the fluid dynamics and the level of the tank in a future sounding rocket experiment, the visibility of the fluid in the propellant tank is an important factor. Therefore, combinations of printable materials, water mixed with fluorescein, and different illuminations were investigated. The goal of the experiment was to determine the most suitable filament type and maximum print thickness for the first prototype propellant tank. Tanks 3D printed from three different types of filaments were filled with fluorescent water for comparison. One tank was printed using translucent PLA, a second tank using PMMA and a third tank using PETG. A fourth tank made of non-3D printed PMMA plates served as a reference value for an ideally transparent tank. The three printed containers had four different chambers with increasing wall thicknesses (2 mm, 3 mm, 4 mm, and 5 mm), as shown in Figure 5.
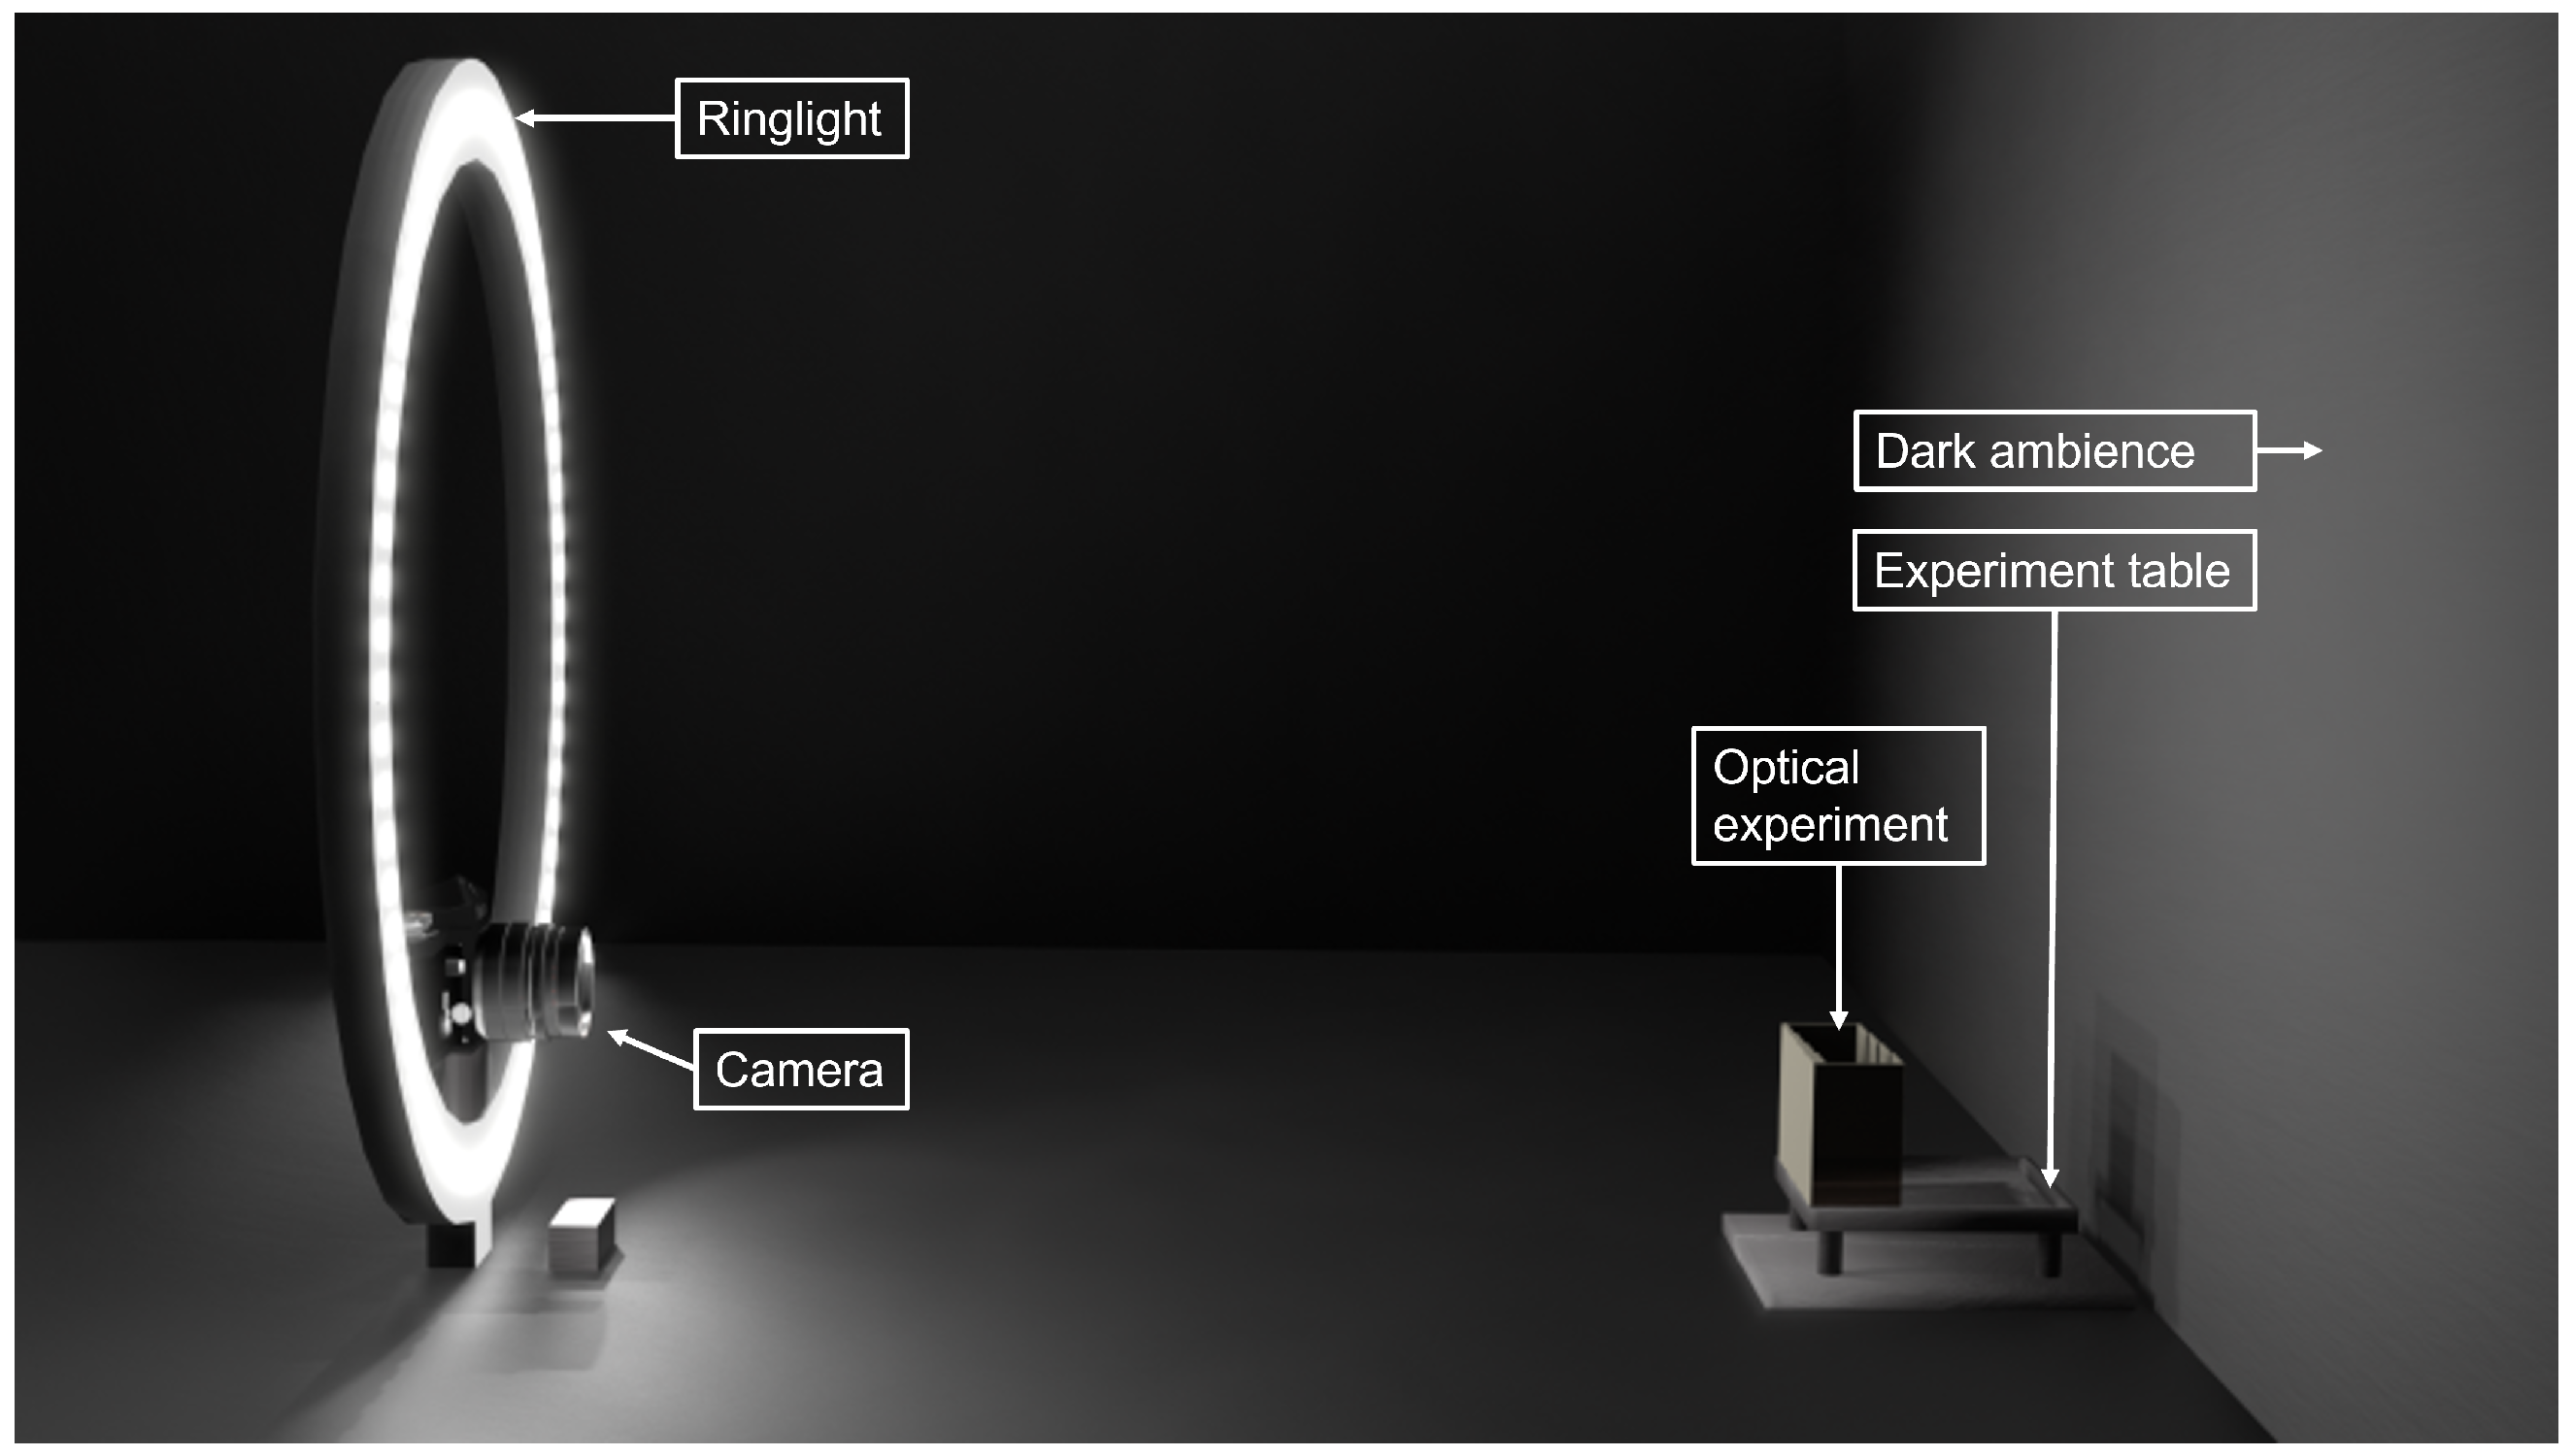
Two illumination setups were considered, one with a white-colored ring light and another using a rectangular UV light source. The UV light maximizes the fluorescent effect of the dye. The full setup is shown in Figure 6. The tanks were placed in an elevated position in front of a dark background. The camera was positioned inside the ring light, resulting in a distance of 470 mm between the camera lens and the tank. A technical drawing and picture of the real setup are shown in Appendix A.
The illumination setup was optimized in order to reduce unwanted reflections on the front wall of the tanks, and the room was darkened to exclude influences from other light sources. Due to unavoidable interfering reflections from the UV light source, setups with the light at an 45° angle from the left and from the right side were used as well. To evaluate effects resulting from partial transparency of different filament materials, the deviation of the Red, Green and Blue (RGB) values from the ideally transparent reference container was analysed. The RGB color codes for a sample in each tank area were measured. The average color value of the measurement area filled with fluid was compared with a reference representing the fluid visibility under ideal transparency conditions. The process was repeated for each tank chamber with varying thickness and the reference container. Additionally, the overall visibility of the fill level and whether capillary effects could be observed in the corners of the tanks were assessed qualitatively.

3. Results

3.1. Contact Angle Measurements

The overall range of contact angles spans from 50.94° to 85.16°. This does not include the 20 measurements for PETG 0.3 mm, as the test plate was soaking up the fluid, acting as a sponge. For this reason, nine of the twenty measurements lead to contact angles higher than 85.16°, of up to 163.63°. Additionally, three of the ten images for PETG 0.3 with dyed water were not interpretable by the evaluation software as a result of the test plate malfunction. The measured values for PETG 0.3 are included in Table 2. The sponge effect and resulting measurements lead to the standard deviation being about five to ten times higher than that of the other measurements. Due to these measurements, PETG 0.3 is excluded from Figure 7 as it distorts the plot scale and is not comparable.
A high variance within each measurement group results in a strong overlap of the confidence intervals, as visible in Figure 7. Table 2 provides the mean values and standard deviations for the twelve combinations. For the aluminum reference test plate only, the measurements with dyed water are provided. The aluminum images show that the pure water droplets’ visibility in the current experimental setup depends on partial illumination effects from below enabled by transparency and light scattering within the printed plastic test plates. The experiment resulted in large standard deviations as a result of the combination of the measurements and printing technique used and the programmed evaluation software.

3.2. Optical Measurements

To evaluate the visibility of the liquid inside the 3D printed tanks, the RGB values of the different tank areas are compared to the RGB values of the pure liquid inside the reference container. The front wall of the reference container was made of a fully transparent PMMA sheet to allow for an unobstructed view of the fluid.
Figure 8 shows examples from the 3D printed PMMA tank (top) and the reference tank (bottom) under different lighting conditions. In total, three illumination settings are under investigation. In Figure 8a,d, the tank is illuminated from the front with a UV light source, while in Figure 8b,e it is illuminated with an white ring light. To minimize reflection on the front wall of the tanks affecting the color stamp, in Figure 8c,f the tanks are illuminated with UV light at a 45° angle from the left. As can be seen in Figure 8d,e, frontal illumination results in large reflections.
Evaluation of the captured images was performed by measuring the RGB values within an area of 11 × 11 pixels separately for each tank segment, as symbolized in Figure 8 by red circles. RGB values represent the composition of the colors red, green, and blue in values from 0 to 255. A value of (0, 0, 0) results in black, and a value of (255, 255, 255) results in white. RGB values can be used to localize the liquid in the tank by using variations in the color composition of filled and non-filled parts of the tank. In addition, they can be further processed using an evaluation algorithm.
Table 3, Table 4 and Table 5 show the results of the three different illumination settings. For each tank segment, the average percentage deviation from the reference tank for all three color channels was calculated. In previous experiments, the influence of the color of the background was investigated. The PMMA tank was imaged in front of a black backdrop and in front of a white backdrop. The color of the background did not show any significant influence during evaluation.
Comparing the values for the UV light in Table 3 with the ringlight illumination in Table 4 shows that the deviation relative to the reference tank for the UV light setting is about half the deviation for the ringlight setup.
The deviations for offset UV light illumination in Table 5 are the lowest over all wall thickness values. Additionally, the values for this setup result in the most consistent behaviour and match the intuitive expectation that a thinner wall leads to better visibility. Except for the PLA tank values of 2 mm, 3 mm, and 4 mm, the measurements indicate that this effect can only be partially observed for the other two setups. The experiments were conducted from both 45° and 315° (45° right) while looking at the tank. As the calculated deviation from both sides was calculated in the middle of the tank segment, the orientation makes no noticeable difference in the data.
Considering all measurements that were taken, PETG has consistently higher deviation values than either PMMA or PLA in each illumination setting. With the UV light setup, PLA has the lowest deviation values in the measurements for 2 mm in Table 3 except for 3D printed PMMA.

4. Discussion

4.1. Contact Angle Measurements

The results indicate that all of the tested materials can be used in a future experiment testing a conformal tank design. Due to the high standard deviation of the measured mean values, no further assumptions can be made based on the current experimental results. The chosen measurement procedure does not consider hysteresis effects. Consequently, the procedure provides results with errors of up to 10 ° [16]. However, it is sufficient to allow for a qualitative assessment of material combinations for their intended use.
Furthermore, due to the drop size, the influence of gravity cannot be completely neglected. For an analysis that better fits the future use case, the capillary length of water, around 2.7 mm, needs to be taken into account in order for gravity to be negligible [17]. In the current setup, the drop diameters exceeded this value by about a factor of two. This leads to gravity-flattened droplets, for which contact angle measurements are often less accurate and lead to decreasing contact angles with increasing gravity [18]. Although the values of the contact angles do not consider the influence of a micro-gravity environment, the wetting status remains stable [18], and can therefore be transferred to the use case.
An automated and statistical approach is preferred over manual measurement in order to avoid human error as well as to saving time by not requiring manual evaluation of hundreds of pictures. However, the automated approach showed significant disadvantages, despite being consistent for most of the dataset. Noisy edges due to fibers or additive material residues caused issues in processing, and necessitated manual tuning of hyperparameters. Two pictures had to be neglected because either the algorithm could not derive a horizontal line or fitted the ellipse wrong, which a human interpreter could have measured accurately. Overall, this is an acceptable quota of successful fits for the evaluation. The only exception is the PETG measurement series, due to its high standard deviation. To make the algorithm more stable and improve its overall accuracy, several aspects could be improved with respect to measurement and evaluation. Due to the angle the pictures were taken at, a slight, positive bias is introduced by the fact that the horizontal line is dictated by the bright front face. The edge of this face sits sightly below the actual intersection line at the current viewing angle. Another problem is the low contrast between foreground and background. A matte black background behind the droplet and white surroundings to avoid the droplet refracting dark materials towards the camera could be used as an improved setup. For a repetition of the experiment, a comparison of the automated evaluation process with adapted open source approaches could be evaluated [13]. These issues result in relatively large confidence intervals for the single results, which makes it difficult to determine a significant difference in the measurements with and without fluorescence. Due to the tripod used for the contact angle measurements, the camera was not perfectly aligned for all measurements, which is clearly visible if one compares Figure 3 and Figure 4; in Figure 4, the top side of the sample plate is visible, while in Figure 3 it is not. This difference occured due to manual correction of the height and angle of the camera and subsequent misalignment due to fastening of the tripod head. As the droplets retain their half-ellipsoid shape, it is assumed that the contact angle error stemming from this source is smaller than the distribution of angles due to the surface texture resulting from the FDM manufacturing process. To assess the uncertainty associated with our measurements, Figure 9 shows the distribution of residuals of the least square regression. Displayed are the residuals of all fitted ellipses in pixels. The mean residual is marked in red. It is clearly visible that the fit uncertainty is in the subpixel range, and therefore negligible.
Despite these issues, the measurements and their evaluation match comparable results in other research [8] regarding the measurements with aluminium. This leads to the conclusion that the results of the plastic measurements are close to the actual contact angle as well. Assessing the displayed angles manually led to comparably high variances. PETG proved to be relatively inconsistent. PLA had the smallest deviation errors, leading to relatively consistent behaviour and an indication that PLA printed tanks should show consistent behaviour when emptied. PMMA results were almost comparable to PLA results, therefore, other factors have to be taken into account for material selection.

4.2. Optical Measurements

A major factor influencing the quality of measurement is the reflection on the front wall of the tanks. In Figure 8e, it can be seen that the white light is not evenly distributed, affecting the color measurements. In addition, in Figure 8b, when using the white ringlight the level of the tanks is visible to the naked eye, while the capillary effect is not. The other images can be used to qualitatively assess the visibility of tank’s fill level and the capillary effect in the tank’s corners. The results with UV illumination can be seen in Figure 8a,c,d,f. Filling the tanks with fluorescent liquid greatly improves visibility with respect to the fill level, and it is easier to observe the capillary effect in the corners of the tank walls.
Another advantage of UV illumination is that reflections on the front tank wall are reduced compared to illumination by the ringlight, as can be seen in Figure 8a. Nevertheless, unwanted light artifacts remain with frontal illumination. It can be seen that the light is not homogeneously distributed, as it comes from a relatively narrow point source and does not scatter enough to evenly illuminate the whole tank. The color deviation is smallest at the point of the thinnest wall, while subsequent deviation values of thicker wall sections are contradictory. The second thickest area has the largest deviation. This may be due to shading and brightening, which are not distributed evenly on the tank because of the UV light’s point source. Another factor that influences the reflection could be the infill structure of the tank. Despite the listed sources of error, it can be said that the associated uncertainty regarding the location of the fluid within the tank is negligible. The visibility of the fluid in the tank is always available regardless of the illumination ratio and tank thickness. Bias factors that affect the repeatability of the experiment, such as the influence of daylight in a darkened room, have a small magnitude relation to the visibility of the fluid in the tank.
Overall, the use of a fluorescent fluid in combination with lateral UV illumination of the sample significantly improves the visibility of the fill level. The experimental setup could be further improved by distributing the UV light more evenly, e.g., by using a diffuser and illuminating the sample from several directions. In addition, the transparency of the 3D printed tanks could be increased. This could be achieved by using slower printing speeds and by printing thicker layers using a larger print nozzle, or by chemical and thermal post-treatment of the prints. The combination of these post-treamtments needs to be evaluated, as these are currently commonly used for less complex transparent structures [12]. A combination of printed PLA parts and non-printed PMMA plates could be used to increase visibility through a less complex tank wall while allowing for complex transparent PMD designs [19]. These factors allow higher visibility of the fluid, and could therefore facilitate the localization of the fluid in the tank.

5. Conclusions

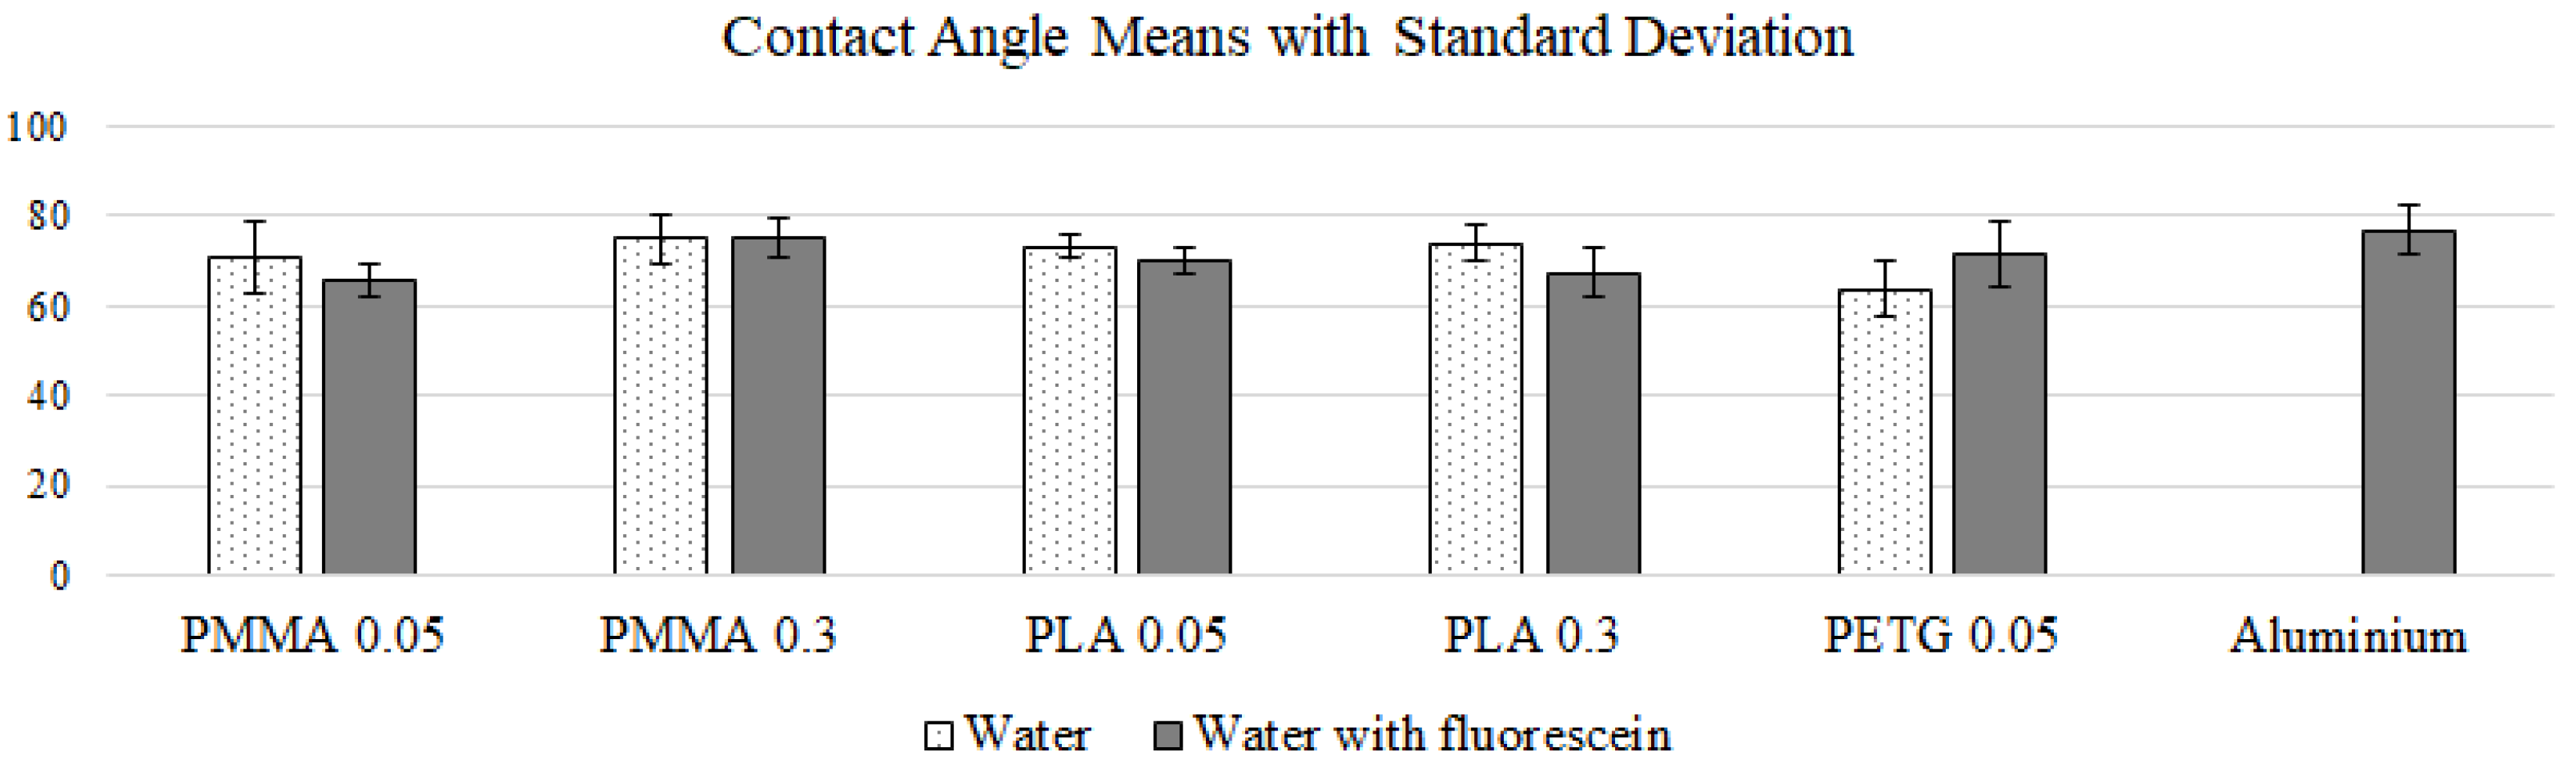
This article has shown that a PLA-printed PMD with potentially non-printed PMMA tank walls is the choice for further experiments needed in designing a conformal tank with a static PMD. Effects of the non-printed PMMA tank walls on PMD functionality still need to be investigated. Furthermore, there is an indication that the influence of Fluorescein as a dye in the necessary concentration has only a small to negligible effect on the contact angle. In contrast, higher concentrations do lead to significant effects, although they do not contribute to visibility and are therefore not needed. In addition, different combinations of illumination and wall thickness were tested. Improved visibility under UV light was found with thin walls of about two millimeters. Under these conditions, optical measurement of the tank level is possible, and capillary effects in the corners can be seen.
This work enables the design of an efficient experimental setup for testing of a new 3D printed conformal tank design with an integrated PMD. Building on the current research, the next step in this research is to design and evaluate possible designs of conformal tanks for their behavior under rocket launch loads.

Author Contributions

Conceptualization, T.L.K.; Data curation, A.B. (Alexander Bauer); Investigation, A.B. (Alexander Burnicki), M.E., Ä.K., E.M., N.M. and A.S.; Methodology, A.B. (Alexander Burnicki), M.E., Ä.K., E.M., N.M. and A.S.; Project administration, T.L.K., T.S. and A.S.; Software, A.B. (Alexander Bauer) and T.S.; Supervision, B.G. and E.S.; Writing—original draft, A.B. (Alexander Bauer), A.B. (Alexander Burnicki), M.E., Ä.K., E.M., N.M., T.L.K., T.S. and A.S.; Writing—review and editing, A.B. (Alexander Bauer), A.B. (Alexander Burnicki), M.E., Ä.K., E.M., N.M., T.L.K., T.S., A.S., B.G. and E.S. All authors have read and agreed to the published version of the manuscript.

Funding

We acknowledge support by the German Research Foundation and the Open Access Publication Fund of TU Berlin.

Data Availability Statement

All detailed research data can be requested from the corresponding authors.

Conflicts of Interest

The authors declare no conflict of interest.

Abbreviations

The following abbreviations are used in this manuscript:
PMDPropellant Management Device
FDMFused Deposition Modelling
PLAPolylactide
PMMAPolymethylmethacrylat
PETGPolyethylenterephthalat
UVUltraviolet
RGBRed Green Blue

Appendix A

The following figures are variants for Figure 1 and Figure 6. The first is a set of technical drawings for the angle experiment and the optical experiment seen in Figure A1.
Figure A1. Technical drawings for both experimental setups.
Fluids 07 00265 g0a1
The second figure shows two real photographs of the experimental setup, seen in Figure A2.
Figure A2. Real experiment setup.
Fluids 07 00265 g0a2
To print the tanks with different materials, a Prusa i3 MK3S+ 3D printer was used. Table A1 provides an overview of the characteristics of the printer.
Table A1. Characteristics of Prusa i3 MK3S+ [7].
TechnologyFused Deposition Modeling
Supported filament thickness1.75 mm
Max. volume250 × 210 × 200 mm
Minimum print density50 µm
MaterialsAll standards
Max. temperature300 °C
Max. Printing speed200 mm/s
Dimensions420 × 420 × 380 mm

References

  1. Wertz, J.R.; Everett, D.F.; Puschell, J.J. Space Mission Engineering: The New SMAD; Microcosm Press: Cleveland, OH, USA, 2011. [Google Scholar]
  2. Chen, X.; Yao, W.; Zhao, Y.; Chen, X.; Zheng, X. A practical satellite layout optimization design approach based on enhanced finite-circle method. Struct. Multidiscip. Optim. 2018, 58, 2635–2653. [Google Scholar] [CrossRef]
  3. Collicott, S.H.; Beckman, E.A.; Srikanth, P. Conformal tanks: Small-sat propellant management technology. In Proceedings of the AIAA Propulsion and Energy 2019 Forum, Indianapolis, Indiana, 19–22 August 2019; p. 3874. [Google Scholar]
  4. Chandra, A.; Tonazzi, J.C.L.; Stetson, D.; Pat, T.; Walker, C.K. Inflatable membrane antennas for small satellites. In Proceedings of the 2020 IEEE Aerospace Conference, Big Sky, MT, USA, 7–14 March 2020; IEEE: Piscatway, NJ, USA, 2020; pp. 1–8. [Google Scholar]
  5. Becedas, J.; Caparrós, A. Additive Manufacturing Applied to the Design of Small Satellite Structure for Space Debris Reduction. In Applications of Design for Manufacturing and Assembly; IntechOpen: London, UK, 2018; pp. 59–76. [Google Scholar]
  6. Tummala, A.R.; Dutta, A. An overview of cube-satellite propulsion technologies and trends. Aerospace 2017, 4, 58. [Google Scholar] [CrossRef] [Green Version]
  7. Prusa. Overview Table for Technical Info on Prusa MK3S+. 2022. Available online: https://www.prusa3d.com/product/original-prusa-i3-mk3s-kit-3/ (accessed on 14 March 2022).
  8. Modi, U.; Prakash, S. Wettability of 3D printed polylactic acid (PLA) parts. In Proceedings of the AIP Conference Proceedings, Jodhpur, India, 18–22 December 2019; AIP Publishing LLC: Melville, NY, USA, 2019; Volume 2148, p. 030052. [Google Scholar]
  9. Kanungo, M.; Mettu, S.; Law, K.Y.; Daniel, S. Effect of roughness geometry on wetting and dewetting of rough PDMS surfaces. Langmuir 2014, 30, 7358–7368. [Google Scholar] [CrossRef] [PubMed]
  10. Hebbar, R.S.; Isloor, A.M.; Ismail, A.F. Contact angle measurements. In Membrane Characterization; Elsevier: Amsterdam, The Netherlands, 2017; pp. 219–255. [Google Scholar]
  11. Quero, R.F.; da Silveira, G.D.; da Silva, J.A.F.; de Jesus, D.P. Understanding and improving FDM 3D printing to fabricate high-resolution and optically transparent microfluidic devices. Lab Chip 2021, 21, 3715–3729. [Google Scholar] [CrossRef] [PubMed]
  12. Ghasemieshkaftaki, M.; Ortiz, M.A.; Bluyssen, P.M. An overview of transparent and translucent 3D-printed façade prototypes and technologies. In Proceedings of the Healthy Buildings Europe 2021 Online Conference, Oslo, Norway, 21–23 June 2021. [Google Scholar]
  13. Akbari, R.; Antonini, C. Contact angle measurements: From existing methods to an open-source too. Adv. Colloid Interface Sci. 2021, 294, 102470. [Google Scholar] [CrossRef] [PubMed]
  14. Suzuki, S.; Be, K. Topological structural analysis of digitized binary images by border following. Comput. Vision Graph. Image Process. 1985, 30, 32–46. [Google Scholar] [CrossRef]
  15. Hough Line Transform. Available online: https://docs.opencv.org/3.4/d6/d10/tutoria_py_houghlines.html (accessed on 14 March 2022).
  16. Lander, L.M.; Siewierski, L.M.; Brittain, W.J.; Vogler, E.A. A systematic comparison of contact angle methods. Langmuir 1993, 9, 2237–2239. [Google Scholar] [CrossRef]
  17. Liu, T.; Kim, C.J. Contact angle measurement of small capillary length liquid in super-repelled state. Sci. Rep. 2017, 7, 3867. [Google Scholar] [CrossRef] [PubMed]
  18. Liu, Y.-M.; Wu, Z.-Q.; Bao, S.; Guo, W.-H.; Li, D.-W.; Zeng, X.-B.; Huang, L.-J.; Lu, Q.-Q.; Guo, Y.-Z.; Yin, D.-C.; et al. The Possibility of Changing the Wettability of Material Surface by Adjusting Gravity. Research 2020, 2020, 2640834. [Google Scholar] [CrossRef] [PubMed] [Green Version]
  19. Bressan, L.P.; Adamo, C.B.; Quero, R.F.; de Jesus, D.P.; da Silva, J.A. A simple procedure to produce FDM-based 3D-printed microfluidic devices with an integrated PMMA optical window. Anal. Methods 2019, 11, 1014–1020. [Google Scholar] [CrossRef]
Figure 1. Setup of the angle measurement experiment.
Fluids 07 00265 g001
Figure 2. Definition of the contact angle.
Fluids 07 00265 g002
Figure 3. Examples of an original and processed image. Blue: Derived horizontal line; Red: Contour and fitted ellipse; Purple: Tangents of the ellipse in the intersection points. (a) Original image example; (b) processed image example.
Fluids 07 00265 g003
Figure 4. Flowchart of the angle measurement algorithm.
Fluids 07 00265 g004
Figure 5. Drawing of the tank from above; all values in mm.
Fluids 07 00265 g005
Figure 6. Setup of the optical measurement experiment
Fluids 07 00265 g006
Figure 7. The mean angles of each measurement row, with the standard deviation as error bars.
Fluids 07 00265 g007
Figure 8. PMMA printed tank and reference container under the different illumination setups. The red circles indicate the measurement areas. (a) PMMA tank with UV light front; (b) PMMA tank with white ringlight front; (c) PMMA tank with UV light from 45° angle; (d) reference container with UV light front; (e) reference container with white ringlight front; (f) lighting with UV light from 45° angle.
Fluids 07 00265 g008
Figure 9. Histogram of the residuals from least square regression in pixels
Fluids 07 00265 g009
Table 1. Camera parameters and general experimental parameters.
ParameterValue
Focal Length200 mm
Aperturef/40
Exposure Time8 s
ISO100
Macro Rings13 and 31 mm
Fluorescene Concentration0.33 g/L
Repetitions10
Table 2. Arithmetical means of the measured contact angles along with standard deviation, σ .
MaterialPrint resolution [mm]Water [°] σ Water with Fluoresceine [°] σ
PMMA0.0570.627.9465.723.51
0.374.975.3775.164.46
PLA0.0573.192.7969.902.65
0.373.954.2867.405.20
PETG0.0563.785.9571.577.25
0.394.4230.80121.6534.79
Aluminium---76.815.33
Table 3. Average percentage deviation from reference tank for lighting with UV light from the front.
Deviation [%] at a Wall Thickness of
Material2 mm3 mm4 mm5 mm
PETG17.2518.5622.2222.48
PMMA12.4215.2919.0816.99
PLA14.6414.5112.689.41
Table 4. Average percentage deviation from reference tank for lighting with white ringlight from the front.
Deviation [%] at a Wall Thickness of
Material2 mm3 mm4 mm5 mm
PETG40.3936.7340.6543.14
PMMA35.5634.2536.3438.82
PLA39.7429.4129.9329.28
Table 5. Average percentage deviation from reference tank for lighting with UV light at a 45° angle.
Deviation [%] at a Wall Thickness of
Material2 mm3 mm4 mm5 mm
PETG8.8912.1614.7717.78
PMMA9.159.6710.5911.90
PLA5.104.975.106.14
Publisher’s Note: MDPI stays neutral with regard to jurisdictional claims in published maps and institutional affiliations.

