1. Introduction
Vortex shedding is an oscillating flow pattern that occurs when fluid overflows a solid bluff body. It depends on flow velocity and the size and shape of the obstacle. Behind the body, vortices detach periodically from either side, forming the well-known von Kármán vortex street. Thereby, alternating low-pressure zones on the downstream side of the structure result in a fluctuating force. Its effect on sound generation has been extensively studied, dating back to the seminal work [
1], which introduced the Strouhal number.
When the body is enclosed in a duct, the surrounding air forms a volume that may vibrate by virtue of resonant eigenmodes. Parker experimentally investigated such modes in a hard-walled, low-speed wind tunnel with a cascade of parallel flat plates [
2]. The observed pressure fluctuations could be attributed entirely to acoustic effects and their shapes were probed. In [
3], they were calculated numerically as solutions of the wave equation under the assumption of a small Mach number. In this work, the two-dimensional
-mode was defined, a standing acoustic wave with peak pressures at mid-chord position on the duct walls, alternating between above and below the plate.
In the presence of vortex shedding with a frequency close to the eigenfrequency of a duct mode, resonance can occur. In this case, the unsteady flow and the acoustic field mutually interact. Once initiated, the process is self-propelling and ultimately leads to synchronization of both frequencies, known as lock-in. This is accompanied by high sound pressure levels. Cumpsty and Whitehead developed a mathematical model to explain the interaction mechanism [
4]. Archibald conducted experiments with acoustic forcing to decouple the fluid dynamic and acoustic parts of the interaction mechanism [
5]. Thereby the mathematical model was extended to include a feedback effect. Koch presented a thorough analysis using the analytical Wiener–Hopf solution of an oscillating system [
6], covering staggered cascades and subsonic Mach numbers. In [
7,
8] Welsh et al. investigated the influence of plate geometries on the lock-in range. Furthermore, a potential flow model was derived to predict the actual fluid dynamics leading to resonant conditions.
There are numerous works on the numerical treatment of the described flow phenomenon. Usually incompressible flow and acoustics are treated separately and appropriate modeling has to be applied to include their mutual interaction. For example, Tan et al. used the calculated flow field as an input for the acoustic model [
9]. A sinusoidally oscillating velocity perturbation was then applied to mimic the influence of the
-mode on the flow. The duct mode was obtained from an eigenvalue problem and Howe theory employed to determine if the acoustic resonance could sustain. The resulting scheme proved computationally efficient and allowed for extensive parameter studies.
In spite of the numerous investigations, a unified understanding of the underlying coupling mechanism is not yet available. It is understood that pressure fluctuations, originating from unsteady flow due to the plate, excite and sustain the acoustic resonance. The reverse direction, however, is less clear. The flipping of low and high pressure zones beneath and above the plate is able to trigger separation, both at the leading and the trailing edge. Its effect on sound generation depends on geometric properties of the plate, such as its length and thickness, and the shapes of the leading and trailing edges. To give a few examples, flat plates in open jets were investigated by Parker and Welsh [
10]. Among other things, it was found that vortices generated at the leading edge were diffused before reaching the trailing edge when the length to thickness ratio was larger than 25. Hourigan et al. conducted numerical simulations using a spectral-element method [
11]. They considered flat plates of varying aspect ratio with square and elliptical leading edges to tell apart the effects of leading and trailing edge vortex shedding and point out their possible interactions. When enclosed in a duct, vortex shedding at the semi-circular trailing edge was identified as the driver of sustained resonance by Welsh et al. in [
8]. This is the setup investigated here. For a square leading edge, vortices shed from the leading edge separation bubble were found by Stokes and Welsh in [
7]. Experiments with a semi-circular leading edge by Mathias et al. showed a similar, but smaller separation bubble [
12]. These works suggest an influence of the acoustic pressure on reattachment. In particular, for low velocity, small vortices in, or fluctuations of the boundary layer would travel along the plate and act as the sound source when passing the trailing edge. Thereby, the number of vortices fitting on the plate gives rise to discrete regimes of excitation. Tan et al. in [
9] pointed out the relative phase between the vortices entering the wake and the sound as a crucial element for sustained resonance. Experiments by Katasonov et al. were focused on longer plates [
13]. Up to three resonance regimes were found and their dependence on plate length and leading and trailing edge geometry investigated. It was shown that semi-circular edges lead to the strongest acoustic excitation. Furthermore square leading edges were seen to have an influence on wakes, at least with respect to the mean flow state. Finally, analysis of power spectra suggested that the interaction mechanism was truly non-linear.
The motivation for this work is twofold. First it is demonstrated that a state-of-the-art flow solver is able to directly capture the vortex shedding, the acoustic resonance, and their mutual interaction. Second, the obtained results provide highly resolved and accurate temporal and spatial flow field data, which can aid as a first step towards a systematic understanding of the complex flow interactions. Furthermore, a hysteresis behavior is discovered, which has not been reported in detail before.
In contrast to previous numerical studies, this is a high-fidelity approach, which does not make use of any reduced order modeling specific to the test case. Because of the acoustics involved, a compressible flow solver is mandatory. This is challenging because the discrepancy between acoustic and convective velocities results in a badly conditioned numerical problem. Nevertheless, it can be shown that the numerical results agree well with experimental data in terms of predicted shedding frequencies, lock-in range, and sound pressure levels. Chosen numerical parameters are explained and discussed in detail where variations turned out crucial. Previous work on the subject was published by Kociok in [
14].
2. Methods
All simulations presented in this work have been carried out using the CFD code
TRACE. It is a compressible Navier–Stokes flow solver, developed at the Institute of Propulsion Technology of the German Aerospace Center (DLR), with emphasis on turbomachinery flows [
15]. A finite-volume discretization of the three dimensional, compressible, unsteady, Favre- and Reynolds-averaged Navier–Stokes equations (URANS) can be solved in steady, unsteady, linearized, and adjoint fashion on structured and unstructured grids. A multi-block approach and modern communication structures allow for highly parallel computations with excellent scaling. Inviscid fluxes are computed using Roe’s flux-difference splitting method [
16] with Harten’s entropy fix [
17]. The upwind states are evaluated using the MUSCL family of schemes with several limiters available to smooth the solution in the vicinity of shocks. Viscous terms are discretized using second-order accurate central differences.
The investigated test case was setup to be in close accordance with Welsh et al. [
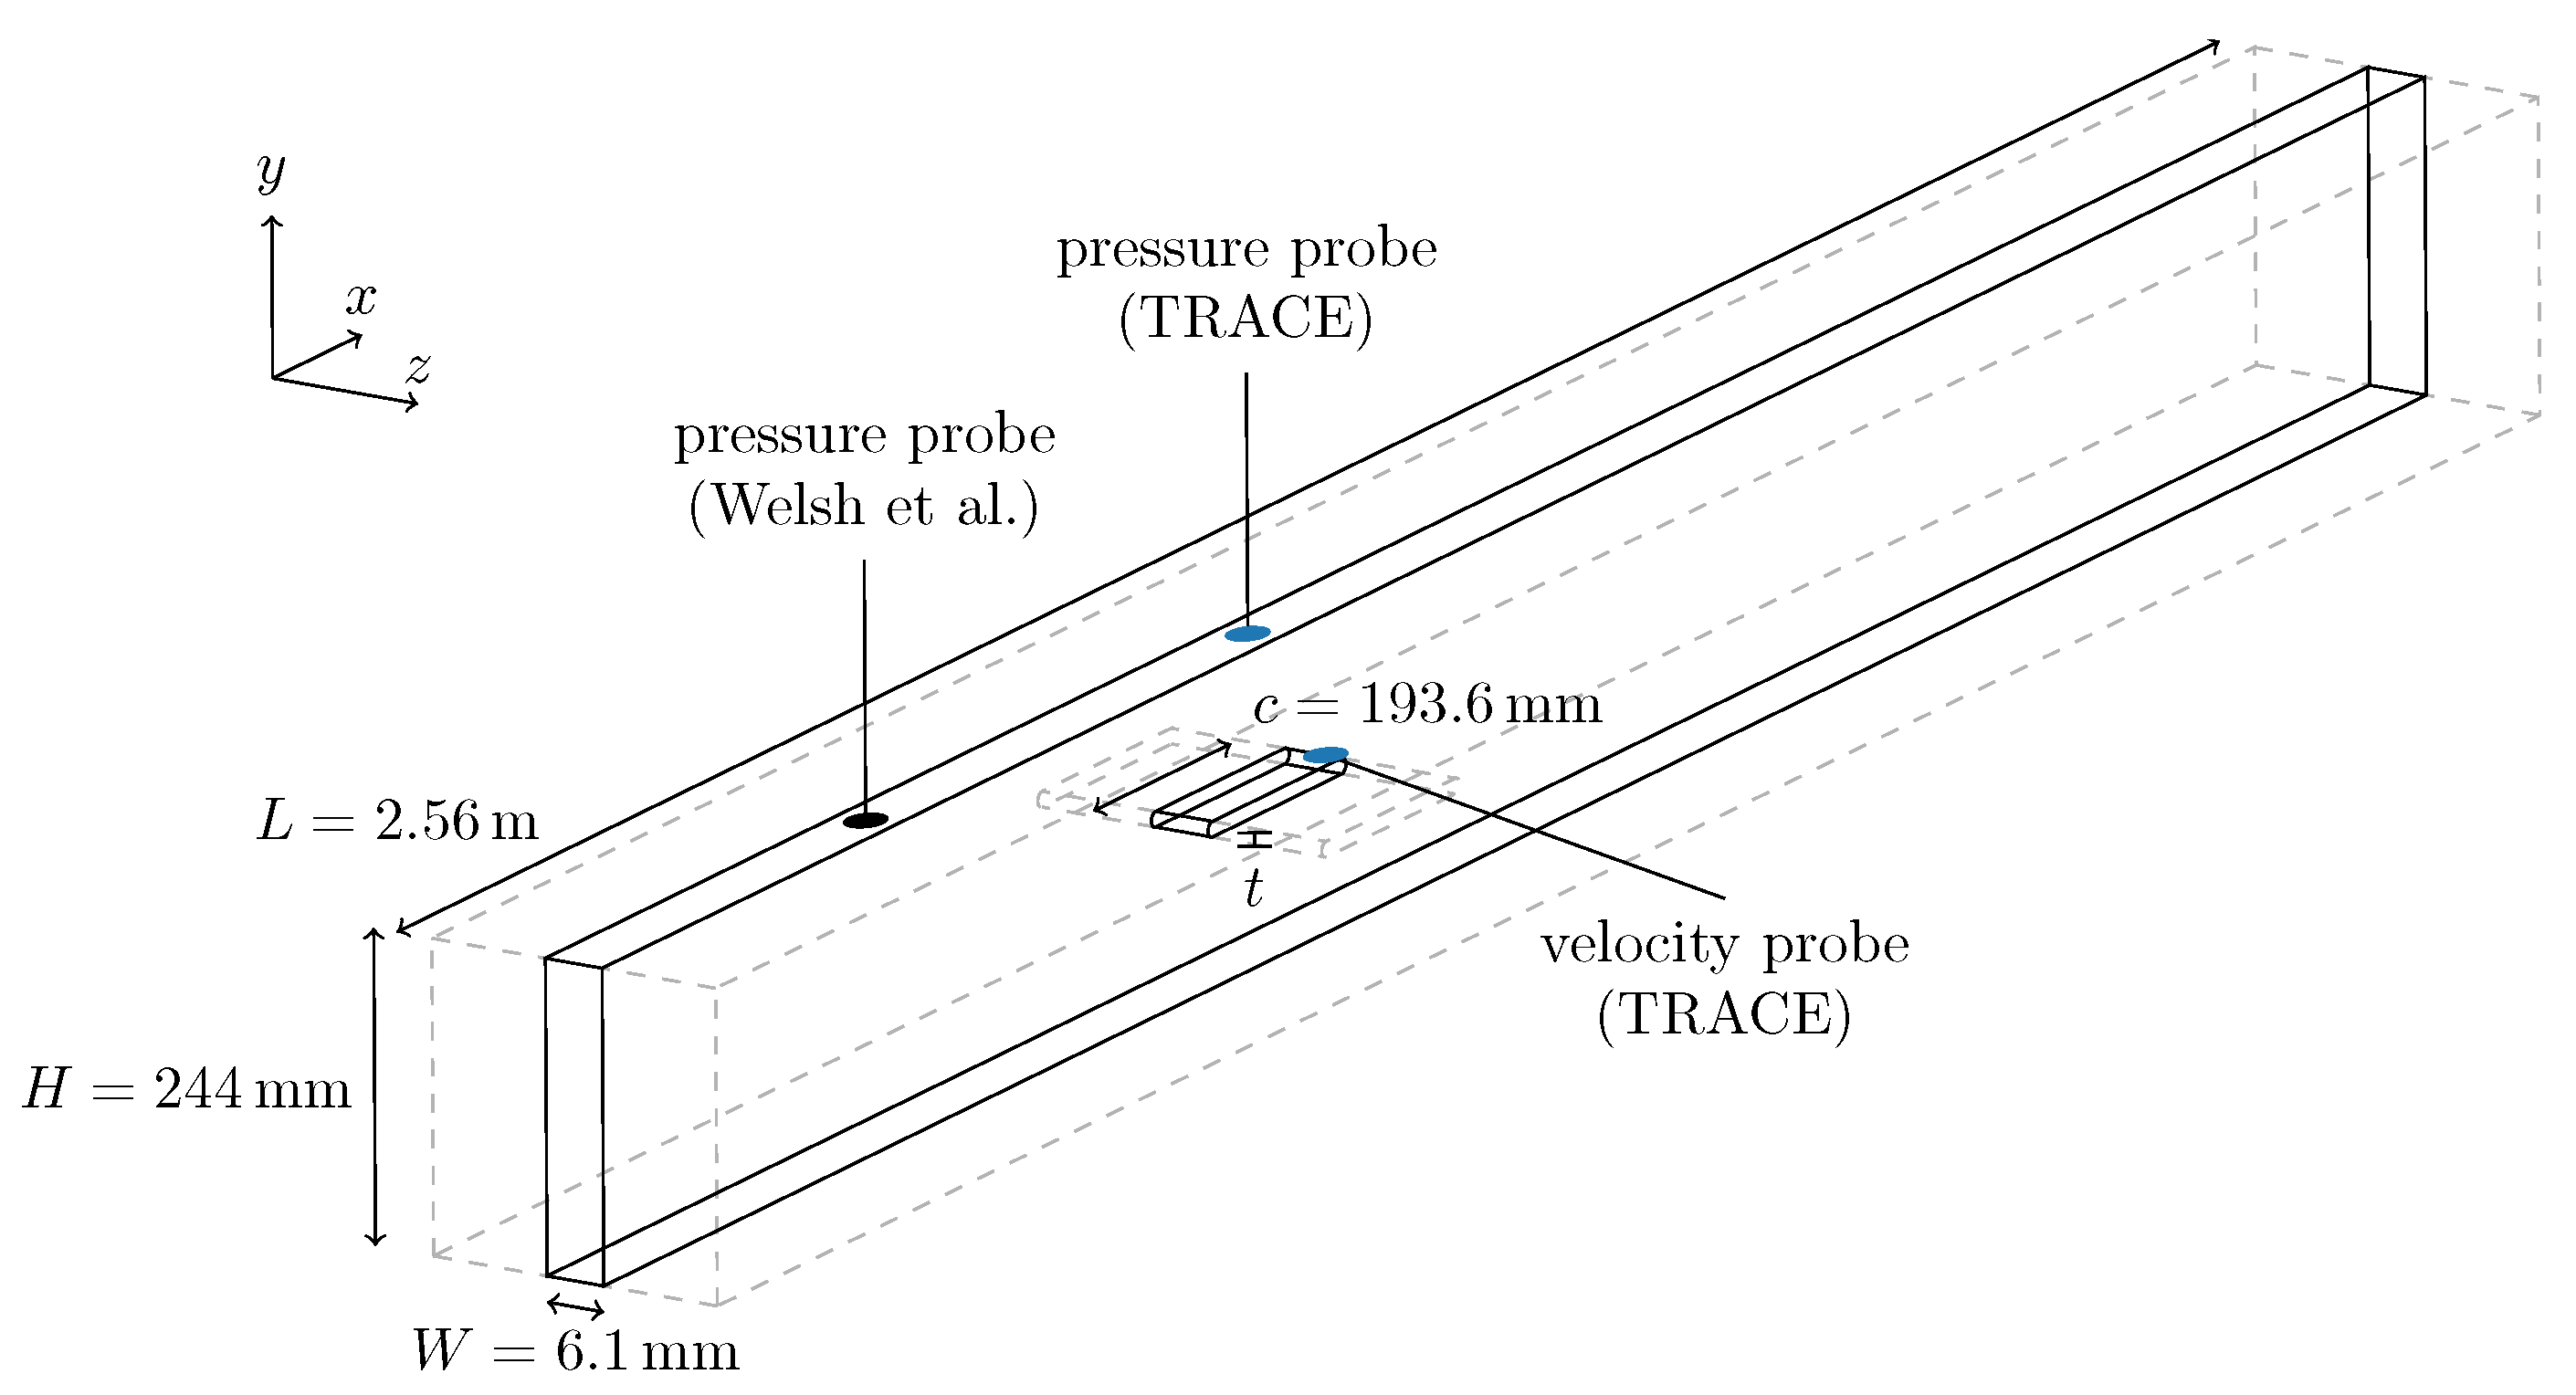
8]. For the computational domain, the working section of the wind tunnel with a length of
and a square cross section of
side length was considered. A plate with a thickness of
and a chord length to thickness ratio of
was put in a vertically centered position. Leading and trailing edges were of semi-circular shape with a radius of
. See
Figure 1 for a schematic of the setup.
Of course there are further components of the real experimental apparatus in front and behind, but these should at best not disturb the flow in the working section and are, therefore, ignored in the numerical modeling. For spatial discretization a multi-block structured mesh was generated using the in-house meshing tool
PyMesh. Strong mesh refinement was applied towards the plate and the walls to achieve a non-dimensional wall distance
. This led to an absolute length of 2 · 10
−5 m for cell edges normal to walls, which also was the global minimum. The resolution in the wake region was chosen rather fine as well.
Figure 2 shows an overview and a close-up of the region around the plate.
Owing to the reported two dimensional nature of the flow pattern, the baseline study was confined to a slice of the three-dimensional geometry. In this situation, only one cell was used in spanwise direction, with length and inviscid boundary conditions. TRACE recognizes this special configuration and then essentially solves a two-dimensional problem. Altogether, the computational domain of the baseline setup comprised 78,888 cells.
The considered flow velocities were in the range of 22 to 37 , corresponding to Reynolds numbers in the range of 17,937 to 30,166 with respect to plate thickness and a viscosity modeled by the Sutherland law. The velocity was set by varying total temperature and pressure at the inflow and static pressure at the outflow. In general, ambient conditions of 293 K and 101,325 Pa were used.
For spatial discretization a third order MUSCL scheme without limiter was used. Temporal integration was done by an implicit Runge–Kutta scheme of third order. The time step size was chosen, such that 128 steps were made during one period of 530
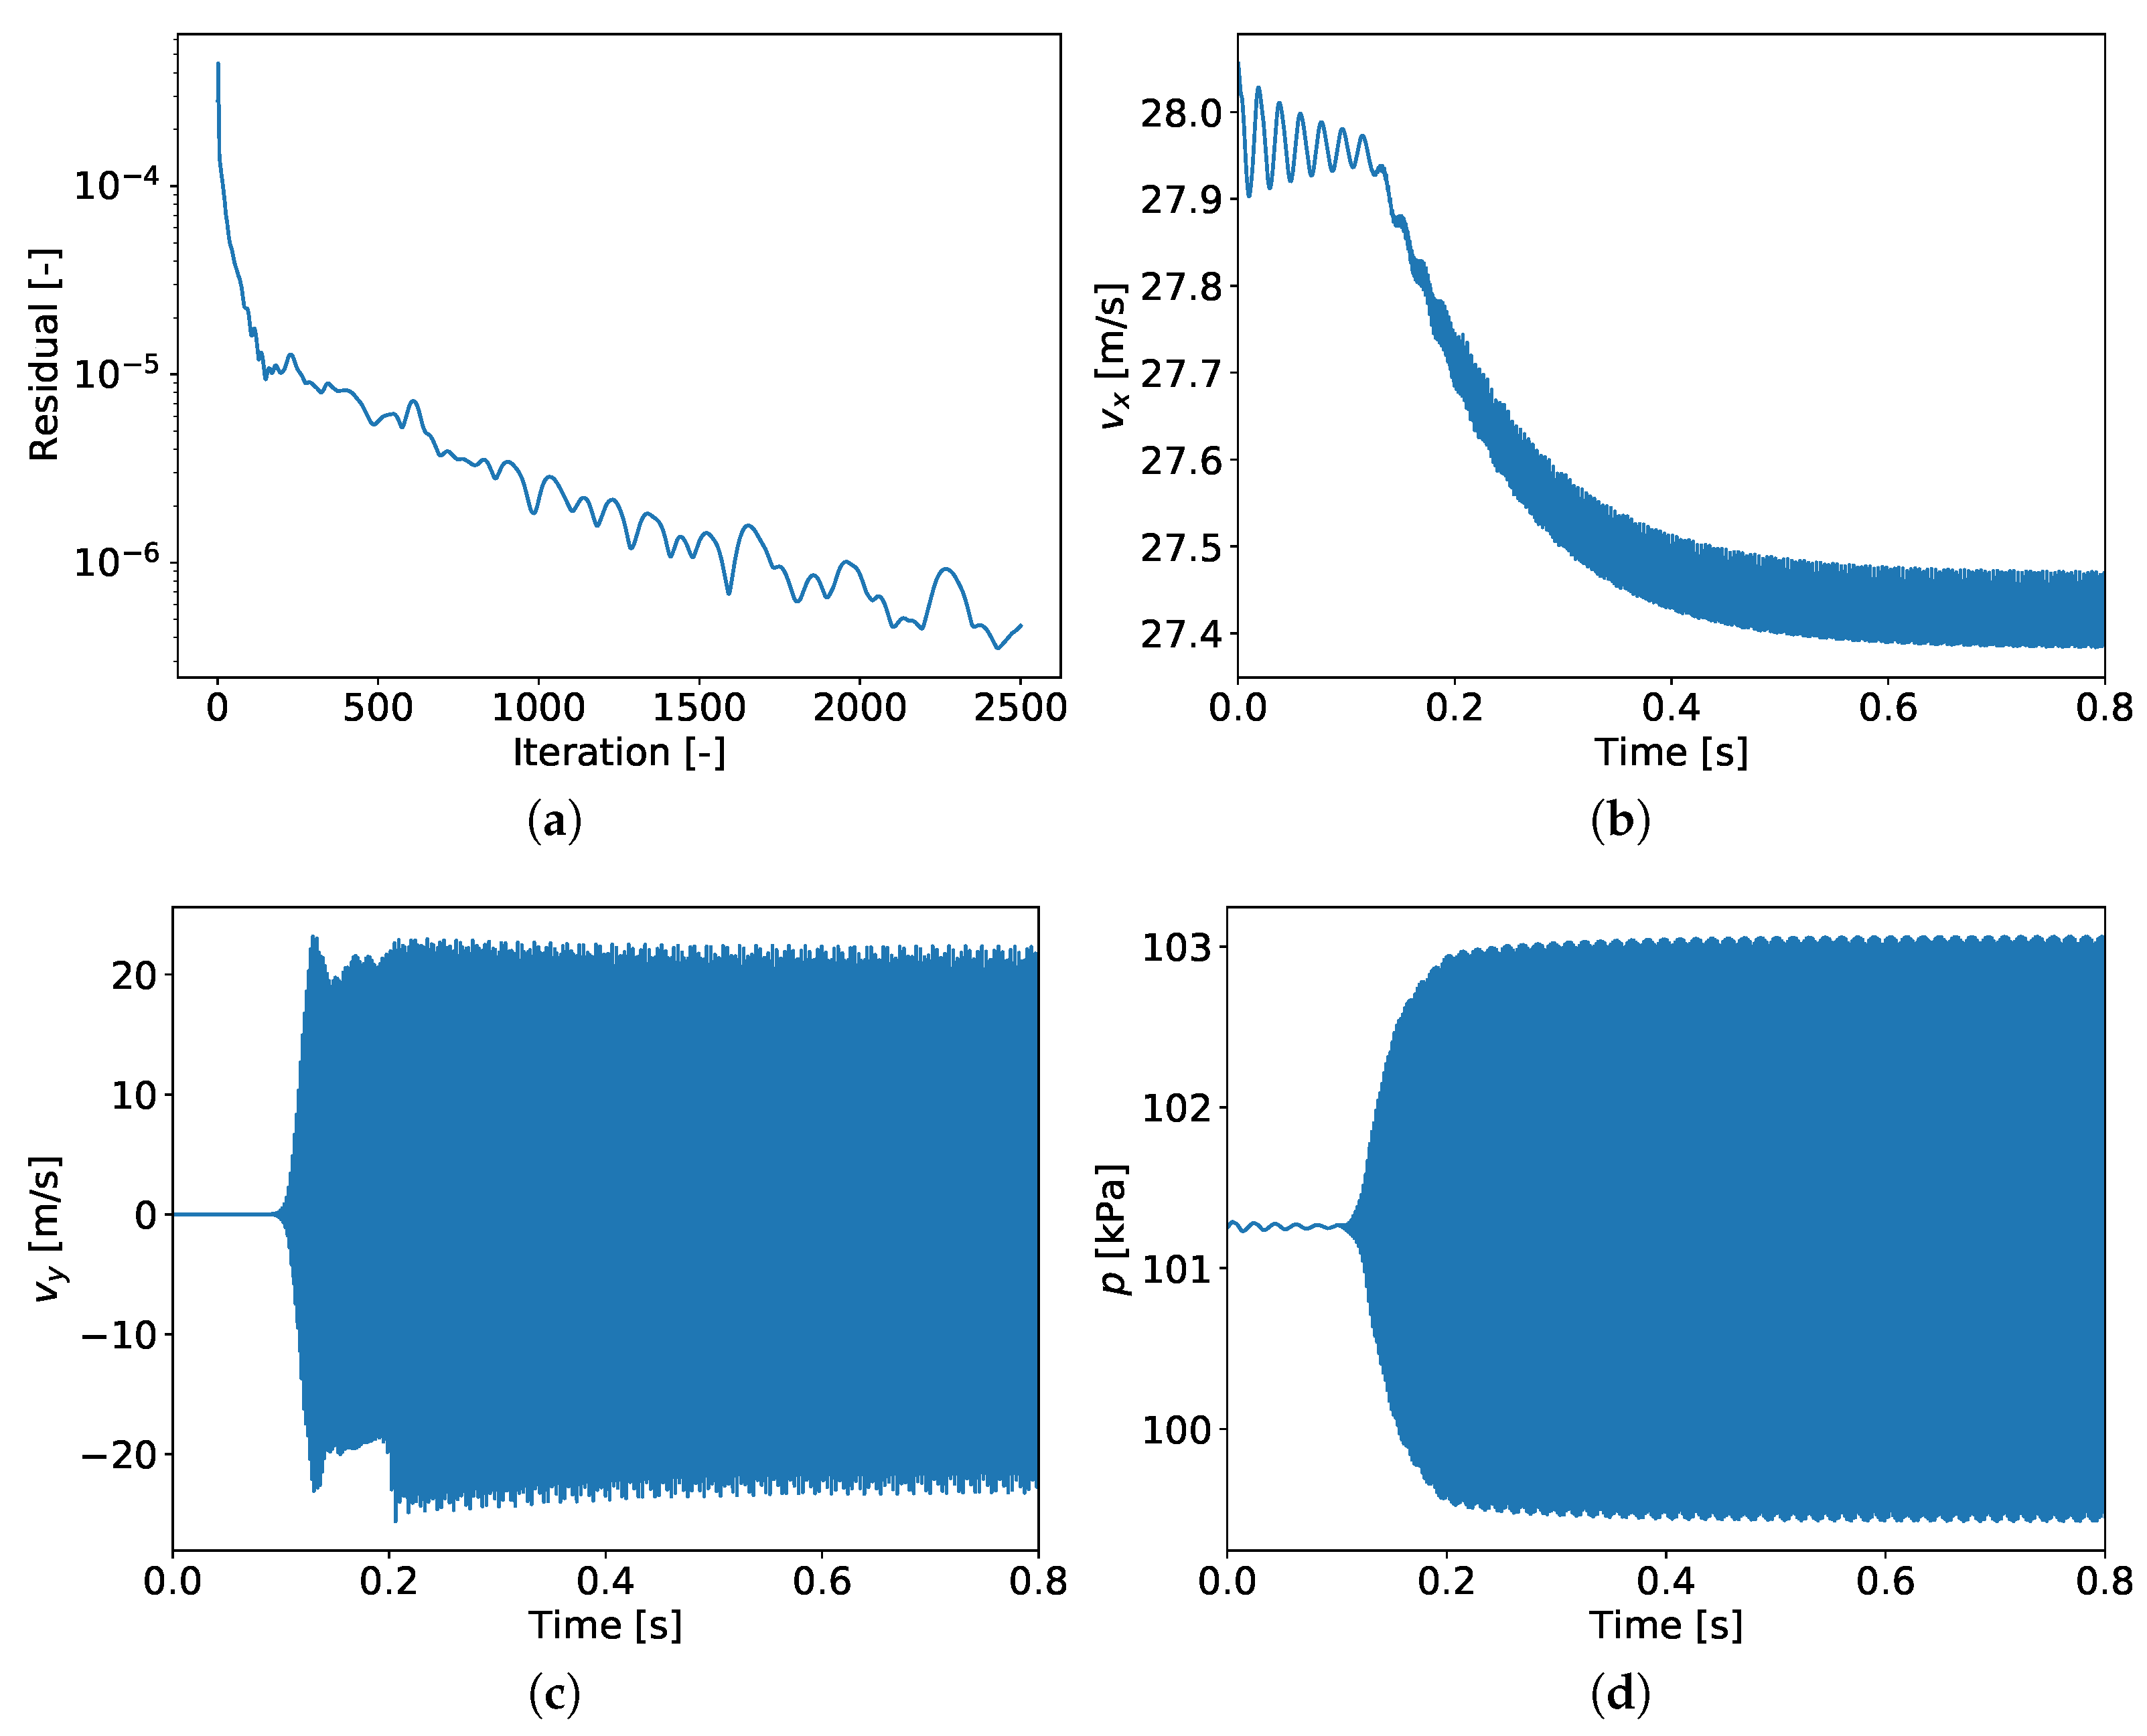
, which was the expected resonance frequency. Consequently, the local CFL number, calculated with respect to the minimal edge length of cells, was about 292 for small cells next to walls when accounting for both convective and acoustic speed. When only the convective speed was considered, the maximal CFL number was about 16 at a distance of several cells diagonally from the leading edge. To solve the system of equations in each step, a dual time stepping, predictor–corrector method was iterated until the residual was smaller than 1 · 10
−8. Simulations were advanced in time until the vortex shedding frequency had settled at a constant value. As acoustic waves were expected to travel along the duct, artificial reflections at the boundaries of the computational domain had to be avoided. To this end,
TRACE’s non-reflecting boundary conditions [
18] were employed at the inflow and outflow panels. For solid walls, non-slip and adiabatic boundary conditions were used. Turbulent effects were modeled by Menter’s SST
k-
model. The computer code used double precision floating point numbers.
To obtain the vortex shedding frequency, the vertical velocity component was recorded at a probe located within the wake of the plate, see
Figure 1. In a post-processing step, the elapsed times between zero crossings were calculated and averaged. Sound pressure levels were determined from a probe on the upper wall above the plate at mid-chord position. The pressure signal was recorded, centralized, and its root mean square computed. For the sound pressure level, a reference pressure of 20 μPa was used. All of this was performed in an effort to be as close as possible to the experimental setup by Welsh et al. [
8]. However, in the experiments, the microphone recording the sound was placed upstream of the plate and the numerical solution of the convected wave equation was used to extrapolate the signal to the described mid-chord wall position.
4. Conclusions
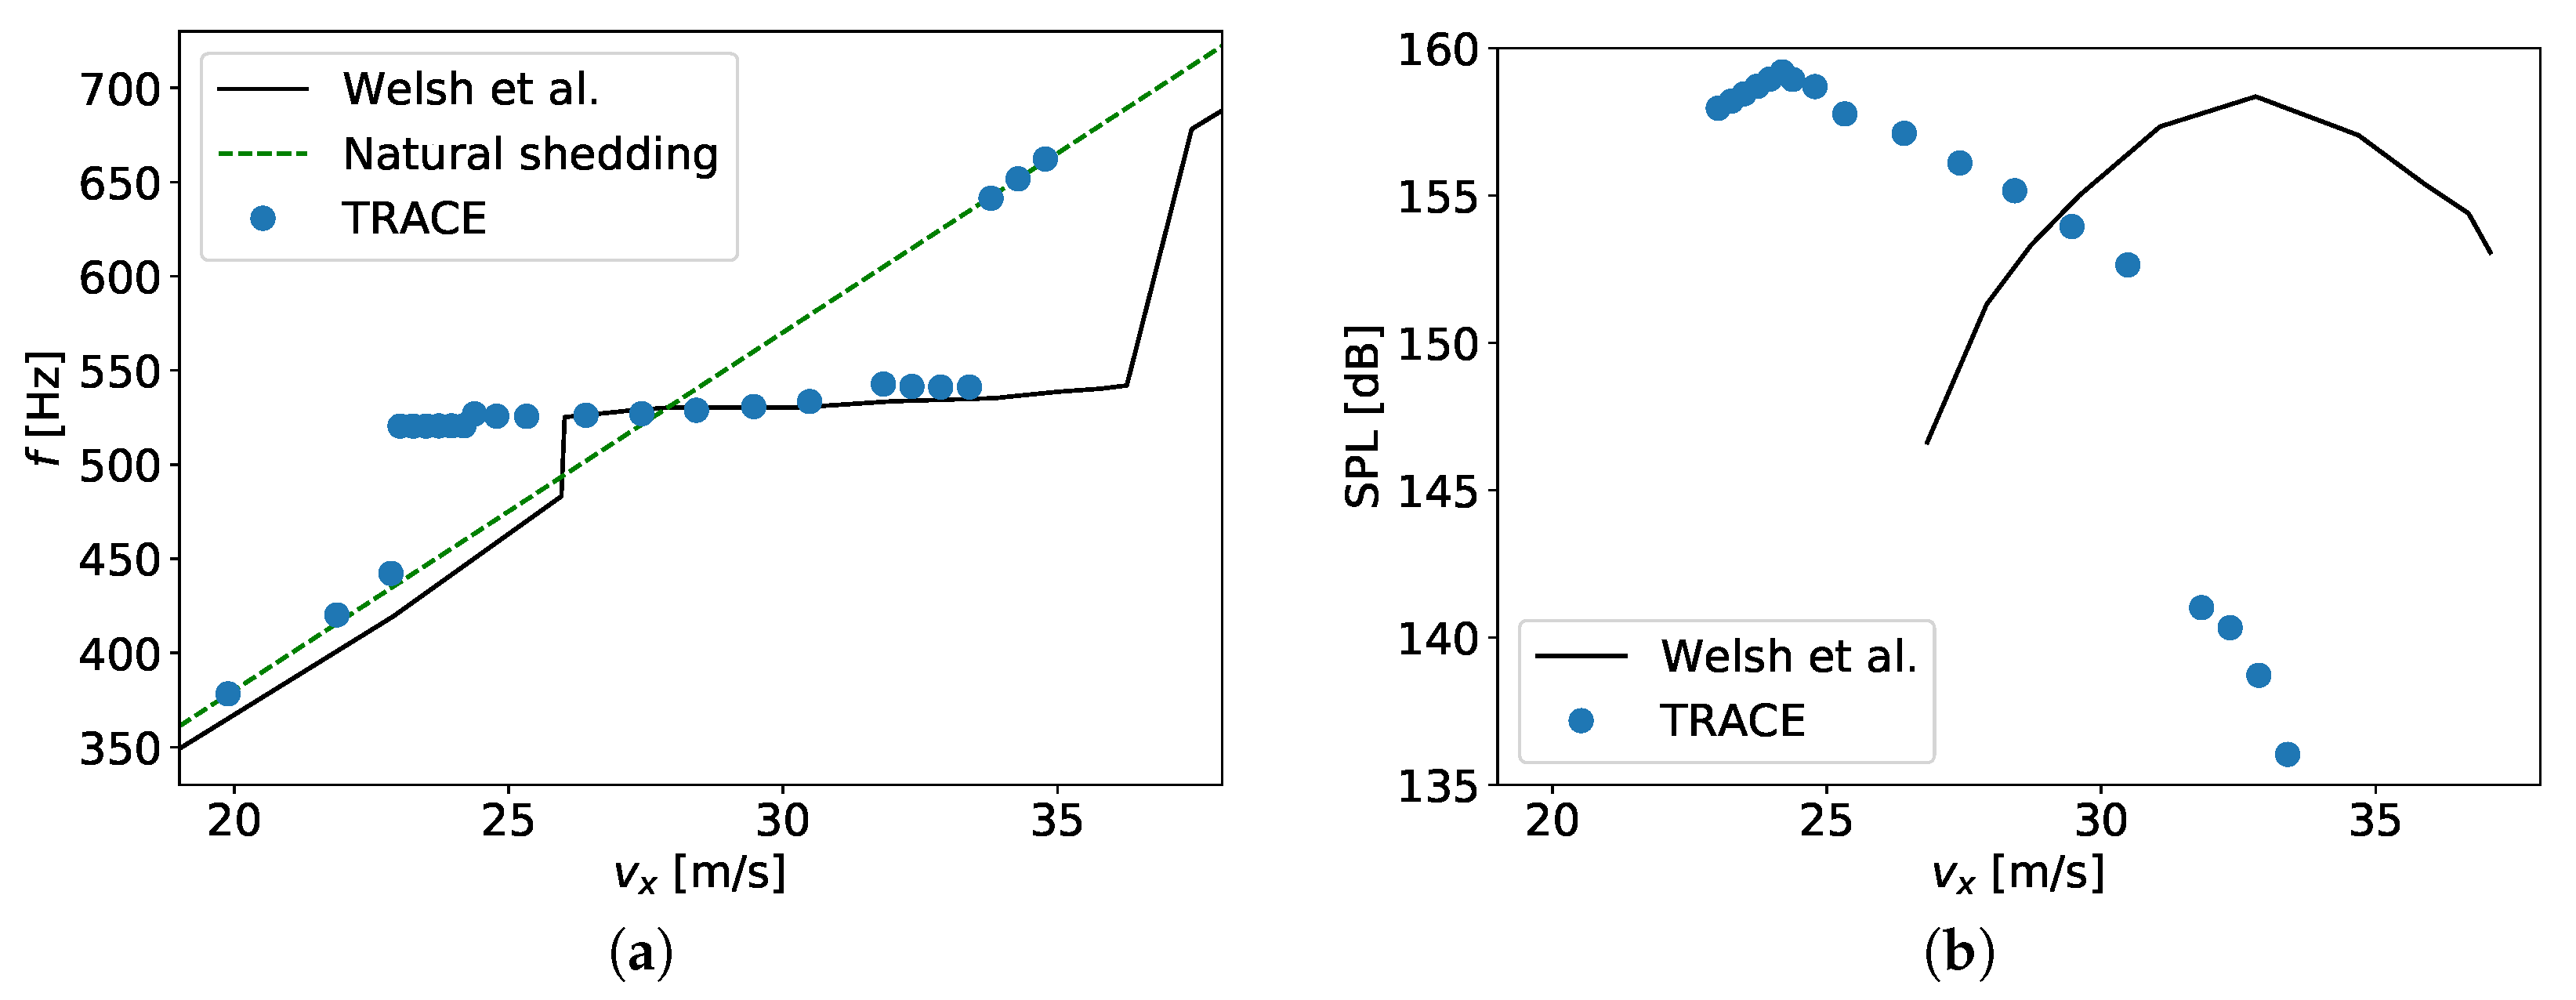
In this work, a classical test case was investigated, showing acoustic resonance in a duct caused by vortex shedding. It was demonstrated that a state-of-the-art flow solver is able to capture the complex interplay of aerodynamics and aeroacoustics, and their mutual frequency locking. In comparison to experimental data, the onset and cessation of lock-in were predicted for lower velocities. The spanned range for lock-in and the resonant frequency however agreed well. Sound pressure levels were predicted in the correct range of values, but showed a different course within lock-in. The deviations indicate that, for reasons unknown so far, the numerical modeling led to a different behavior of the resonating system. Numerical parameter studies proved the validity of the employed CFD setup. Apart from spatial grid resolution, pseudo time convergence criteria, and turbulence modeling, the initialization turned out crucial and revealed hysteresis effects at the borders of the lock-in range not reported in detail before. Altogether, highly resolved and accurate temporal and spatial flow field data were obtained, which can aid in further studies of the mutual interaction phenomenon.


 correspond to .
 correspond to .


