Article

High-Speed Digital Photography of Gaseous Cavitation in a Narrow Gap Flow

Faculty of Engineering Science and Health, University of Applied Sciences and Arts, 37085 Göttingen, Germany
*
Author to whom correspondence should be addressed.
Fluids 2022, 7(5), 159; https://doi.org/10.3390/fluids7050159
Submission received: 31 March 2022 / Revised: 28 April 2022 / Accepted: 28 April 2022 / Published: 3 May 2022

Abstract

:
The research of cavitation in narrow gap flows, e.g., lubrication films in journal bearings or squeeze film dampers, is a challenging task due to spatial restrictions combined with a high time-resolution. Typically, the lubrication film thickness is in the range of a few microns and the characteristic time for bubble generation and collapse is less than a few milliseconds. The authors have developed a journal bearing model experiment, which is designed according to similarity laws providing fully similar flow conditions to real journal flows while offering ideal access to the flow by means of optical measurement equipment. This work presents the high-speed photography of bubble evolution and transportation in a Stokes-type flow under the influence of shear and a strong pressure gradient which are typical for lubricant films. A paramount feature of the experiment is the dynamic variation (increase/decrease) of the minimum film thickness which triggers the onset of cavitation in narrow gap flows. Results presented in the work on hand include the time-resolved data of the gas release rate and the transient expansion of gas bubbles. Both parameters are necessary to set up numerical models for the computation of two-phase flows.

1. Introduction

A full understanding of lubricant flow in journal bearings or squeeze film dampers is necessary for a robust design that guarantees reliability under various operational conditions. However, a dynamic load is typical for these components, which was already observed by Wilson [1], particularly in the case of journal bearings inside diesel engines. Looking at the dynamics of a lubricant film, the variation of the minimal film thickness causes a pressure gradient which in turn leads to regions with low local pressure that can result in cavitation if the local pressure falls below a critical value. This critical value can be the saturation pressure for dissolved gas or the vapor pressure of the liquid itself, respectively. Yet, vapor cavitation always concerns the durability of the machine element.
A brief review summarizing the findings of numerous works that have researched cavitation can be divided in two categories.

1.1. Cavitation in General

The citations in this section deal with flow cavitation in water, which in contrast to oil contains only marginal amounts of dissolved gas, and consequently, the following citations are works pertaining to vaporous cavitation in general. In his dissertation, Borbe [2] investigated flow cavitation in wastewater and concluded that vapor cavitation is the mechanism that results in material cavitation or erosion. Mottyll [3] simulated cavitation by means of a density-based solver and assumed that the aggressive types of cavitation are related to bubbles collapsing near the surface of solid walls. Peters [4] carried out numerical modelling that included the prediction of cavitation erosion for hydrodynamic flows by means of the Euler–Euler and multi-scale Euler–Lagrange methods in his dissertation. With respect to dissolved air in water, he assumed, “in contrast to vaporization, which is a fast process, taking place directly at a bubbly interface, gas diffusion into water is a rather slow process through a comparably thick diffusion layer around the bubble surface”. Due to the fact that surface tension reduces the dissolution time of a bubble, one can deduce that the larger the bubbles are, the slower the dissolution and absorption of the gas becomes. Peters and Moctar [5] presented results of the numerical assessment of cavitation-induced erosion that show the dynamic behavior of collapsing bubbles in water on their passage through an axisymmetric nozzle. In a recent numerical work, Lyu et al. [6] tracked dispersed gas/vapor bubbles in a Lagrangian fashion and described bubble compression and expansion by a modified Rayleigh–Plesset equation. Their meshing is rigid in an isometric domain and the modeling effort focuses on a gas-liquid mixture that is treated as a continuous and compressible fluid. It is common to the works cited above that typical geometrical dimensions, such as clearances or distances to the most adjacent wall, are in the range of several millimeters and therefore far greater than bearing clearances and lubrication film thicknesses.

1.2. Cavitation Related to Lubrication Systems

In contrast to cavitation in general, which is mainly studied in water as operating fluid, the cavitation process in lubrication systems is characterized by the physical properties of oil and specifically, in the case of gaseous cavitation, the substantially higher capability of dissolving gases, i.e., air. Rosenberg [7] discussed gaseous cavitation in liquids and assumed that: “The differences and similarities of the two forms of cavitation bubbles have not always been noted in the literature. Experimental observations on bubbles assumed to be vapor-filled have been questioned by other experimenters”. Additionally and in particular, for journal bearings and squeeze film dampers, the close proximity of solid walls bordering the lubricating film is a distinctly different boundary condition for the development of cavitation.
In an extensive analysis of displacement curves of the crankshaft inside the main bearings of an eight-cylinder diesel engine, Graf and Kollmann [8] identified the sections of the load cycle and thus areas on the bearing liner which are prone to cavitation damage. They surmised that the risk of cavitation correlates with the dynamics of film thickness. In their work on lubricant films, Dowson and Taylor [9] described the process of cavitation: “If the pressure in a lubricant falls to its vapor pressure, the lubricant may boil at ambient temperature. Vapor-filled cavities will be formed and these may later collapse, causing cavitation erosion. The occurrence of vaporous cavitation in bearings is normally restricted to situations in which the loading is dynamic, for example in the main bearings of diesel engines”. Braun and Hendricks [10] carried out an experimental investigation on the vaporous/gaseous cavity characteristics of a journal bearing operating with high eccentricity and came to the following conclusion.
“Hydrocarbon vapor versus liberation of dissolved gases—that is the question!”. Moreover, they “distinguish[ed] between three types of mechanisms which can create and cause a bubble to grow. …
(a)
If, suddenly, the pressure is reduced to p g but remains larger than p v , the dissolved gas nuclei will merge into a separate gaseous phase and, at a critical cluster radius, rupture the homogeneity of the oil film. This is in essence gaseous cavitation. …
(b)
If the pressure is lowered to p < p v , volatile hydrocarbon nuclei can be engendered by nucleation sites at the surfaces (akin to nucleate boiling) or by impurities existing in the fluid. Upon nucleation, they will either form a new cavity or be released into an existing gaseous cavity forming a mixture of dissolved gases and vapors. …
(c)
Finally, the so-called pseudo-cavitation can occur when the size of the bubble changes due to a variation of p rather than an adiabatic and isothermal mass exchange from oil to the cavity”.
Brewe [11] made a theoretical investigation of a vapor bubble in the lubricant film of a dynamically loaded journal bearing. He assumed that “cavitation can either be a result of (1) dissolved gas coming out of solution or (2) evaporation (flashing) of the fluid. Both types of cavitation are commonly observed in journal bearings, squeeze film dampers ….”. Sun and Brewe [12] carried out an experimental study by means of high-speed photography capturing the formation of gaseous cavitation in a journal bearing rig specially designed to provide optical access to the lubricating film. With due respect, this experiment can be considered a blueprint of the work presented in the paper on hand. Leonard et al. [13] designed a special fretting test rig equipped with a high-speed video camera to observe fretting phenomena. They concluded: “Cavitation occurs in grease or oil due to either gas evolution (gaseous cavitation) or vapor evolution (vaporous cavitation). … Vaporous cavitation requires a much greater pressure drop and is far more dangerous than gaseous cavitation”. Xing [14] analyzed the characteristics of a squeeze film damper by means of a numerical approach including an experimental evaluation. He found: “… the appearance and collapse of the vapor cavities was synchronous with journal whirling speed” and “the vapor cavities were unstable and disappeared as soon as the high pressure appeared but the gaseous cavities persist during the high pressure region and diminished in size”.
A review for journal bearings was presented by Braun and Hannon [15]. They recognized and reviewed three forms of cavitation in their article as follows: “Gaseous cavitation generally contains one or multiple species of gases dissolved in the fluid and occurs as the pressure falls below the saturation pressure of the particular gas component. Pseudo-cavitation is a form of gaseous cavitation during which the gas bubble expands on account of depressurization without further gas mass diffusion from the liquid to the gas phase. Vaporous cavitation is the result of a thermodynamic non-equilibrium event when the pressure falls below the vapor pressure of the liquid at the prevalent temperature”.
Osterland et al. [16] investigated the influence of air which is dissolved in hydraulic oil. They made a distinction between vapor, gas and pseudo-cavitation because mineral oils contain a high amount of air, i.e., up to 10 L of gas per 100 L of oil. The authors argued: “that most frequently cavitation erosion in hydraulic pumps and valves is caused by vapor cavitation and not by gas cavitation. In fact, concerning the most critical effect of cavitation, the erosion, [they] expect gas cavitation to reduce the cavitation erosion by damping the damage relevant vapor cavitation”. Their findings were based on copper samples which were exposed to stock oil, containing a natural amount of air, and air-free oil, respectively. The erosion damage of the samples tested with air-free oil was found to be 4.4 to 5.1 times larger than that with stock oil.
Chen and Israelachvili [17] proposed a “new mechanism of cavitation damage” for lubrication films separating two adjacent walls undergoing highly transient clearance changes, e.g., rolling contact in bearings or tooth flanks, and surmised that “the inception of cavities is intimately connected with simultaneous relaxations of high local strain energies on nearby surfaces, and in many practical situations, damage is more likely to occur during the formation, rather than the collapse, of cavities”. Zhou et al. [18] presented a novel approach to predicting air release and absorption in hydraulic oil, arguing that under dynamic conditions the equilibrium-based theory fails. Instead, the authors proposed different process paths for gas release and absorption, respectively. In a recent work, Pendowski and Pischinger [19] studied the transient oil flow inside the connecting rod of a crankshaft. The validation of their numerical model revealed that the otherwise reliable Henry’s law had to be replaced by a non-equilibrium approach suggested by [18] to predict the accumulation of released gas from load cycle to load cycle. The authors suggested that the release velocity of dissolved gas is 10,000 times faster than the velocity by which the fluid can absorb the gas. In a previous work, Reinke et al. [20] analyzed displacement curves presented by [8] and derived a cavitation factor. The cavitation factor incorporates eccentricity and the eccentricity change rate indicating the regions with a high potential of cavitation in good agreement with [8]. An obvious similarity between [17] and [20] can be observed, as the highly dynamic displacement velocity of the bordering walls in the vicinity of the minimum film thickness contributes to the magnitude of the cavitation factor.

1.3. Summary and Comparison between Cavitation in General and Cavitation in Lubricant Systems, Particularly in Lubricant Films

In summary and based on the citations above, the work on hand follows the definitions regarding the form of cavitation spelt out by [15] that are well accepted and used by numerous other authors, e.g., those of [9,10,11,12,13]:
Gaseous cavitation occurs when dissolved gas is released out of the lubricant and gas-filled bubbles are formed.
Vaporous cavitation occurs when the liquid lubricant is subject to a local pressure below its vapor pressure and spontaneous evaporation engenders vapor-filled bubbles.
Pseudo-cavitation occurs when gas-filled bubbles change their size without any mass transfer with the surrounding liquid.
Furthermore, it is common understanding that cavitation erosion is one potential cause for bearing failures, which is well documented by the comprehensive studies of Gläser [21], Garner et al. [22] and Engel [23]. The main findings by reviewing the literature are:
(a)
Cavitation erosion remains a restricting factor pertaining the reliability of journal bearings;
(b)
All available sources agree that erosion must be caused by vaporous cavitation;
(c)
Due to the amount of dissolved gas in lubricating fluids, the effect of gas cavitation must be taken into consideration;
(d)
Gaseous cavitation reduces the effect of vaporous cavitation;
(e)
There exist two processes of vaporous cavitation which may result in erosion:
  • The traditional and well-documented case of the implosion of bubbles generating pressure waves and impinging jets;
  • The newly proposed case [17] that the inception of a bubble leads to the relaxation of high local strain energies on nearby surfaces.
As described above there are fundamental differences between hydraulic flows in water and lubricant film flows which are organized in Table 1 for direct comparison.
This work targets the lubricant flow in a journal bearing selecting suction cavitation as the subject of the investigation, because other bearing-related types of cavitation require the presence of a microstructure such as an oil groove or boring according to [21] that would make the experimental set-up more complex. Suction cavitation in bearings is triggered by the dynamic displacement of the shaft, resulting in a transient film thickness [8] and it is common ground among the researchers that only vaporous cavitation may result in material erosion. Moreover, it is state-of-the-art knowledge that the presence of gaseous cavitation reduces the impact of vapor cavitation [13,14,16]. Therefore, this work tackles gaseous cavitation to provide the necessary data in order to set up future experiments avoiding any interference by gaseous cavitation.

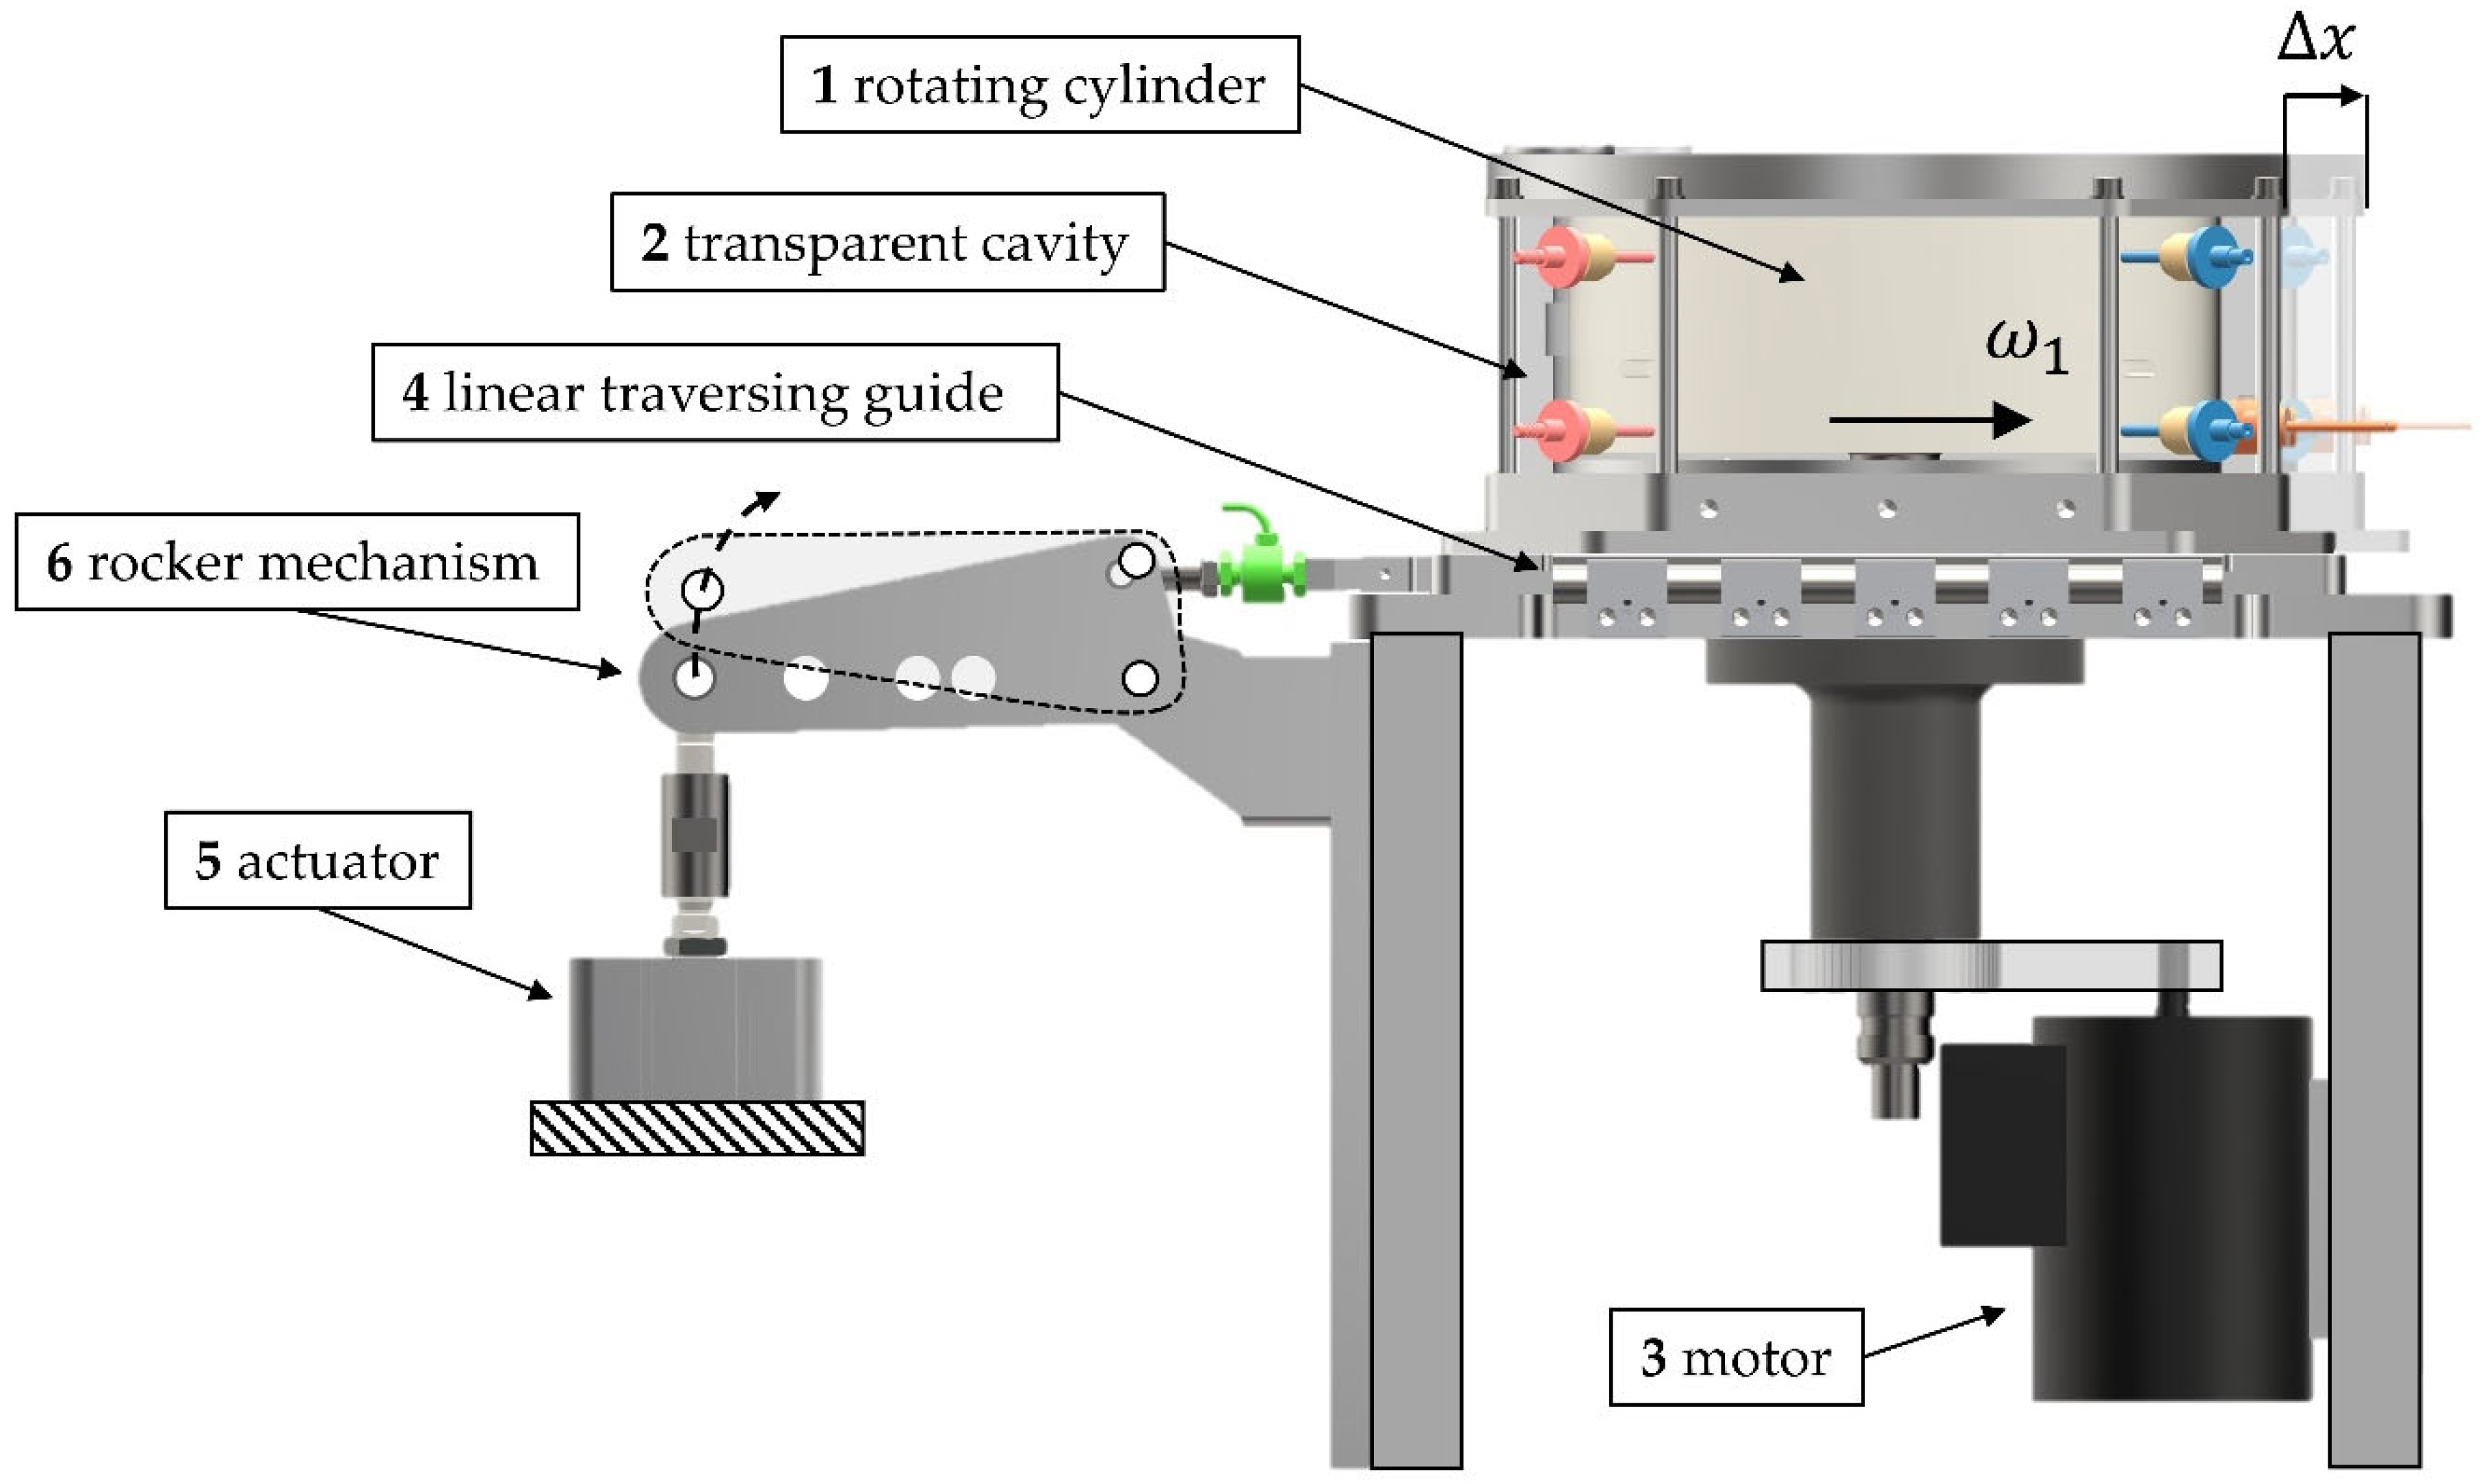
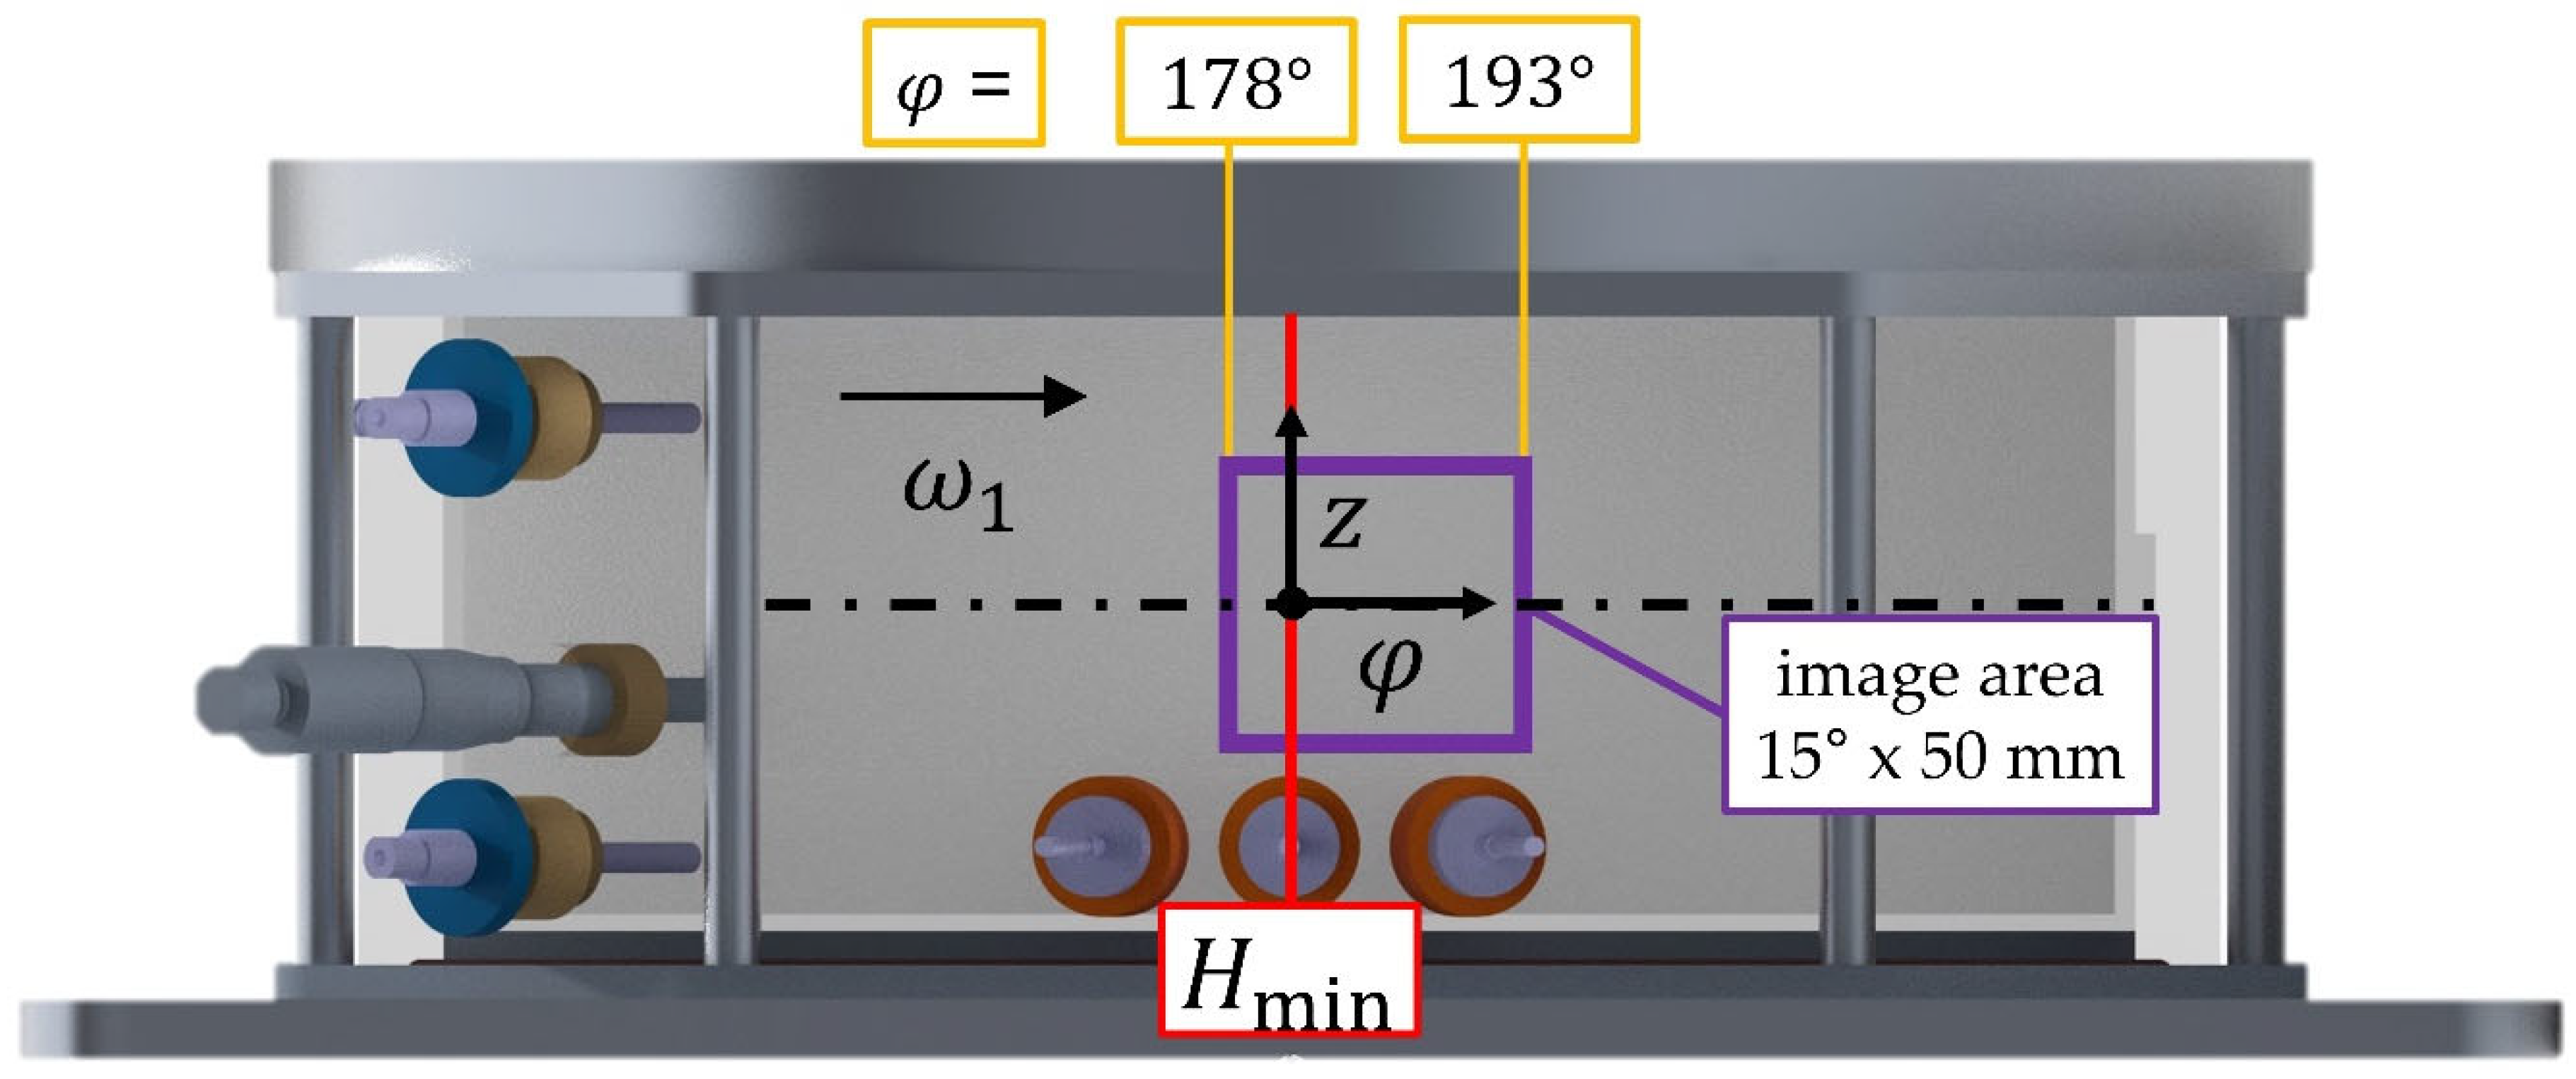
2. Experimental Apparatus and Set-Up

2.1. Experiment

The experimental set-up is a further development of the Couette flow apparatus that was presented originally by Reinke et al. [24] consisting of a cylinder 1 located inside housing with a cylindrical cavity 2. The housing is made of polymethyl methacrylate (PMMA), precision-machined and polished, providing the best optical quality. Its octagonal outer shape enables an unrestricted radial optical access into the cavity. The cylinder rotates with a given rotational speed ω 1 and is positioned eccentrically in relation to the axis of the cavity. Due to the rotation of the cylinder, which is powered by a motor 3, a journal-bearing-type flow develops inside the fluid film. The cavity encloses the cylinder completely; thus, the clearance at top and bottom of the cylinder give space for a cross-flow, from the pressure maximum towards the pressure minimum which are caused by the circumferential flow, creating a three-dimensional flow structure. In addition to the original design [24], the cavity 2 is mounted on a linear traversing guide 4 which assures precise positioning in relation to the cylinder 1 and control of the minimum fluid film thickness between 1 and 2. The dynamic variation of the film thickness is achieved by means of an actuator 5 and a rocker mechanism 6. This mechanism displaces the cavity radially in relation to the rotating cylinder and that movement gives the specific change in minimal lubrication film thickness that is the core cause of cavitation. A variation of attachment points at the rocker provides the necessary range of displacement velocity targeted in this project. Figure 1 displays the design features of the experiment.

2.2. Camera

A high-speed camera (iX Cameras i-Speed 720, iX Cameras, Rochford, UK) is used to capture bubble formation and transport inside the liquid film. The maximum data capacity of the camera is 20 Gpx/s. Hence, resolution and frame rate have to be balanced. The experiment is recorded with a resolution of 1680 × 1242 pixels at 10,000 frames per second (fps). Based on a physical resolution of 80 px, which defines the minimum detection limit for the smallest bubble, the maximum exposure time is set at 60 μs. Additionally, major components, including a fast lens with macro capacity (Walimex T3.1 100 mm ED, Samyang Optics, Changwon, Korea) and artificial lighting (2 spotlights Hedler ProfiLux LED 1000, Hedler Systemlicht GmbH, Runkel, Germany with a combined luminous flux of 50,000 lm), are completing the set-up. Due to the experiment’s physical dimensions, the lens has to support close focus with a respective magnification ratio of 1:1. Figure 2 shows the camera’s view and the image area A on which the image processing is based. The image area is downstream of the absolute minimum film thickness H min inside the divergent section of the fluid film. The Sommerfeld angle φ marks the lateral position.

2.3. Fluid and Dissolved Gas

The fluid used for the experimental tests is paraffin oil (CAS-8042-47-5). The dissolved gas is air and its content is a main variable of the investigation. Two fluids are used in the experiments:
(a)
For a high level of dissolved gas: stock paraffin that is saturated with air;
(b)
For a low level of dissolved gas: vacuum-treated paraffin with reduced air content.
The air content is measured by means of a fiber-optic oxygen sensor (PyroScience OXSOLV-PTS, PyroScience GmbH, Aachen, Germany) detecting the infrared absorption spectrum of oxygen. The total air content is calculated based on an oxygen-to-air ratio of 21%.

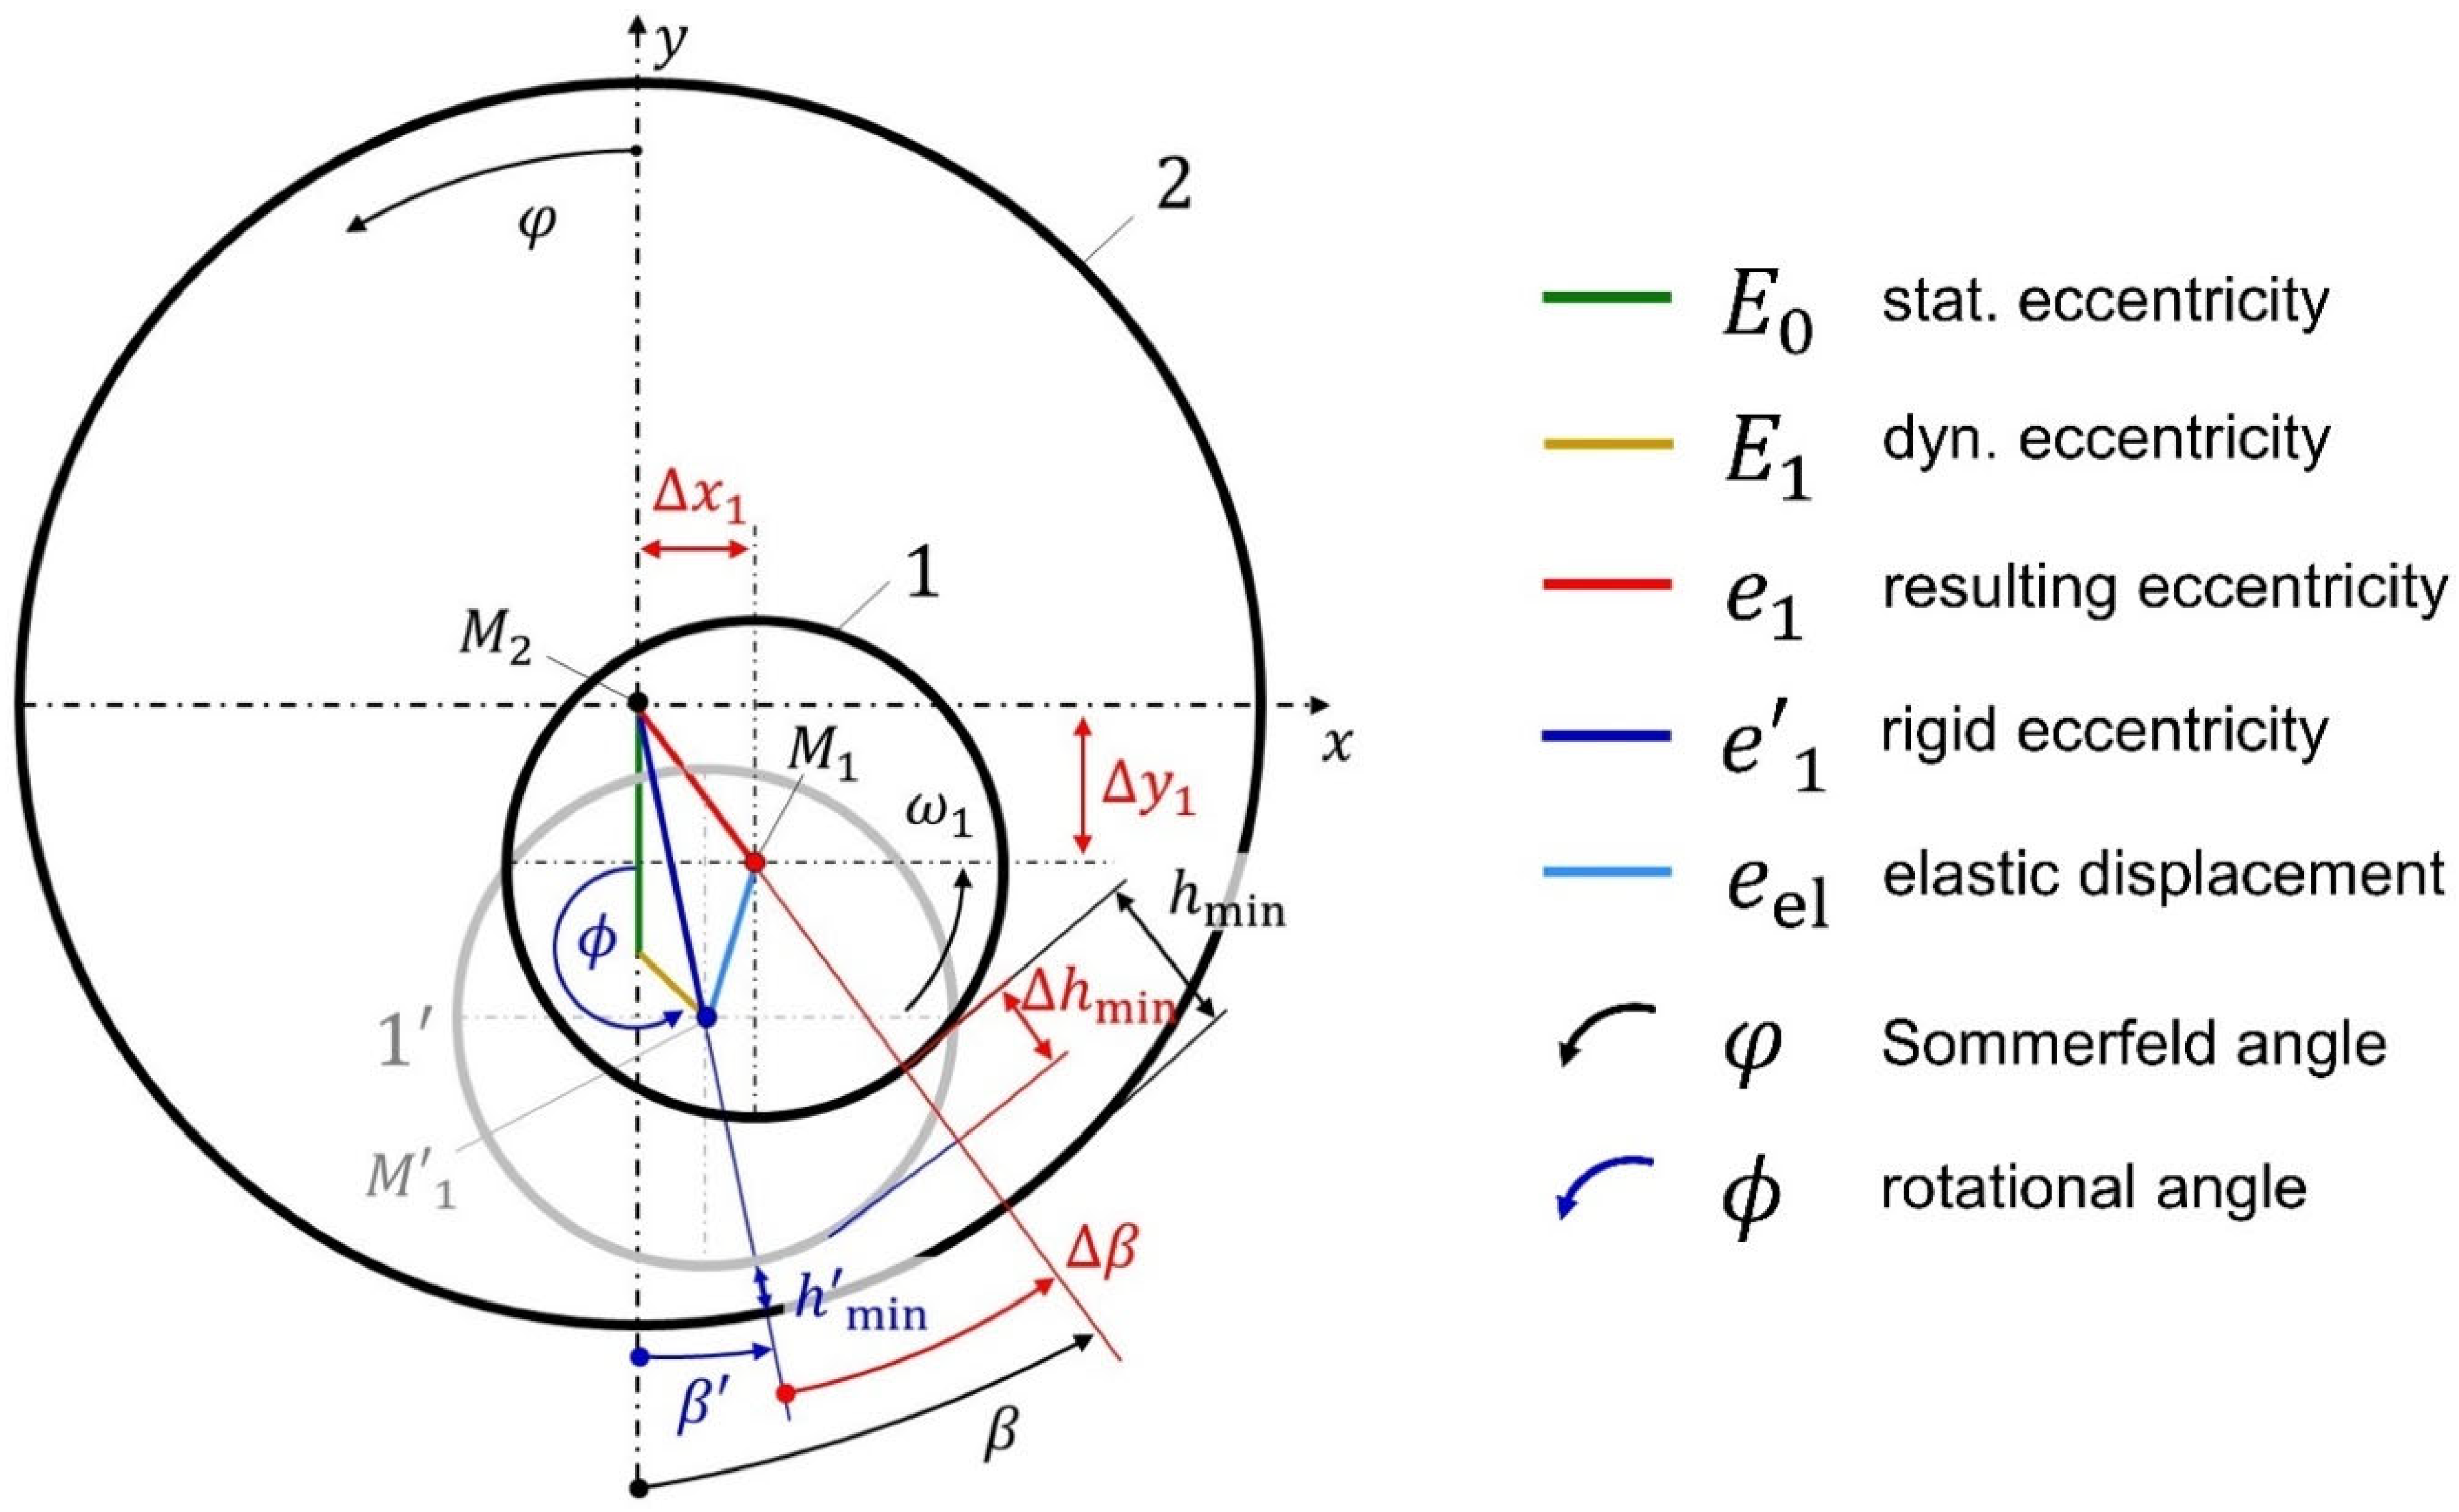
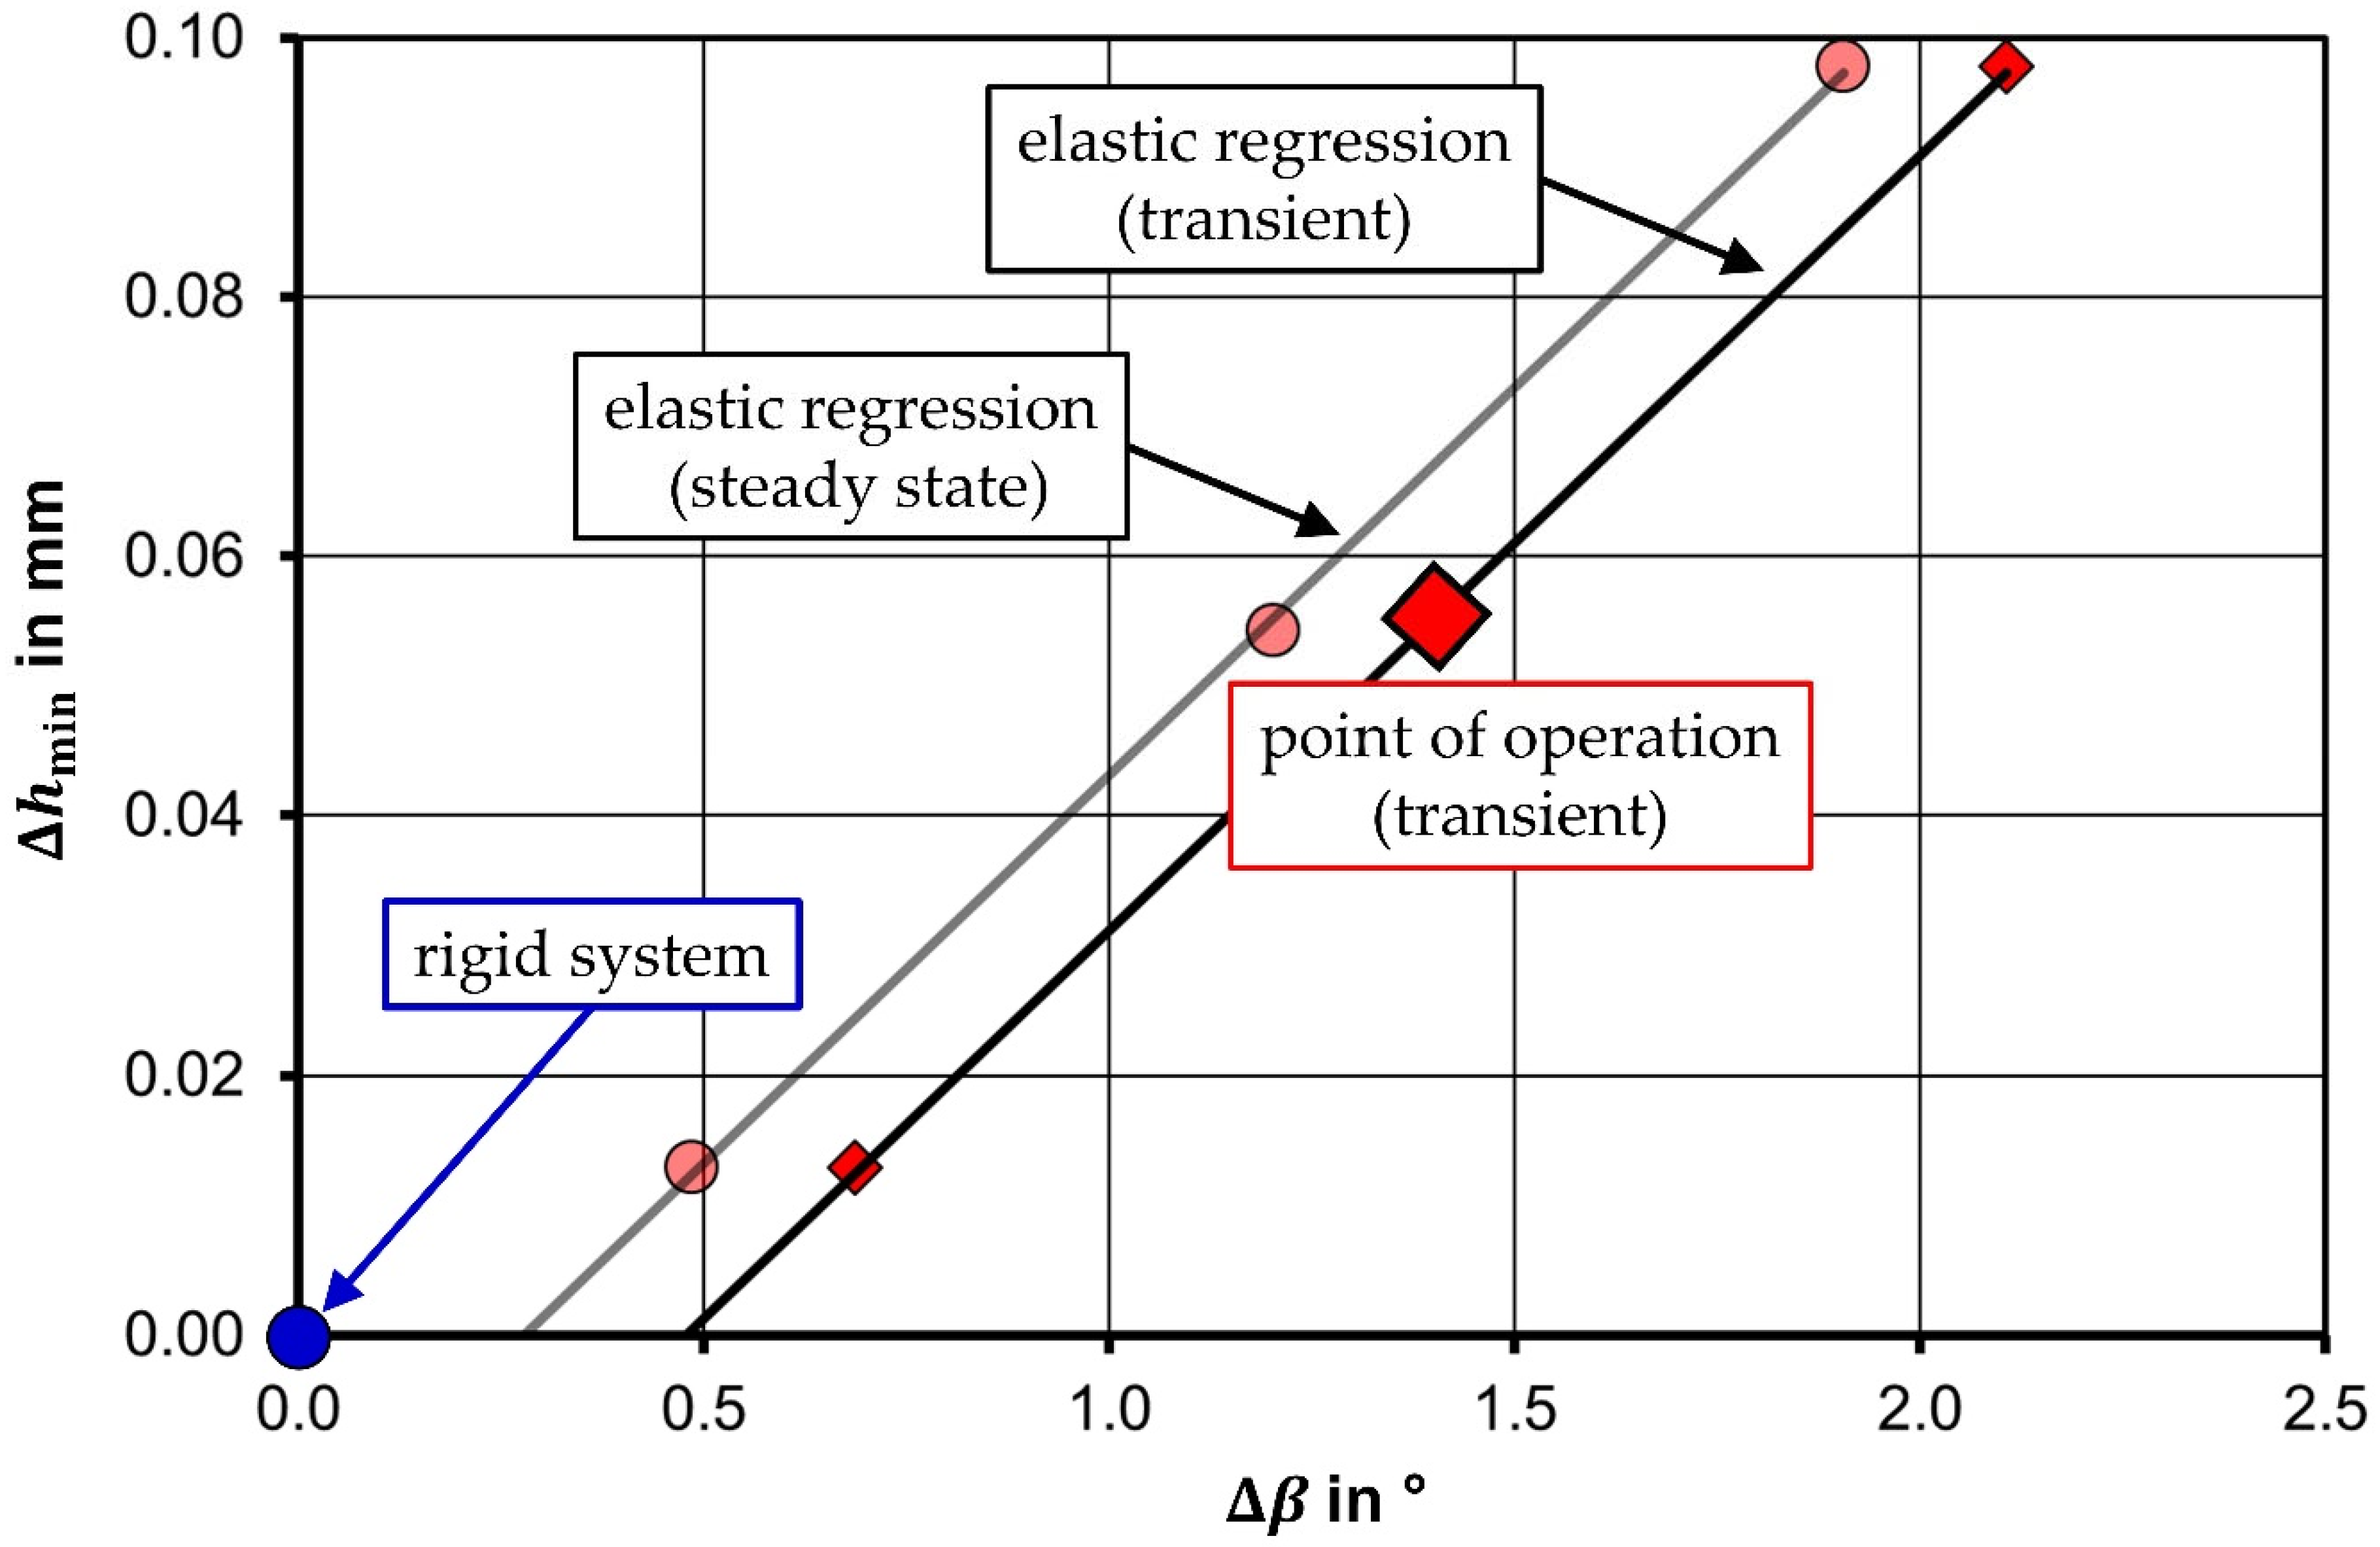
2.4. Main Parameters and Elasticity

Figure 3 illustrates the main parameters of the experiment and Couette flow.
Due to the real operating conditions of the experiment that are described in detail in [24] which include a natural eccentricity and the elasticity, the resulting minimal film thickness is corrected according to Equation (1):
h min = h min + Δ h min   .
Herein,   h min includes the effect of the eccentricity
h min = H min + E 1 cos ϕ  
and Δ h min represents the elastic part. Moreover, the minimal film thickness undergoes a lateral displacement β defined by Equation (3) which stems partially from the natural eccentricity expressed by β and the elastic effect given by Δ β , respectively.
β = β + Δ β
Equation (4) defines the angular position caused by eccentricity
tan β = λ sin ϕ
with the eccentricity ratio λ
λ = E 1 E 0  
The elastic correction of the angular position of the minimal film thickness is related to the radial displacement Δ h min by a first-order approximation
Δ β = 2.89 0.0961 + Δ h min H min
Figure 4 displays the data of the present, further developed set-up versus the data of the original set-up [24] at steady state when the cylinder 1 rotates with constant angular speed ω 1 .
However, the investigation of cavitation requires a transient condition that is, in the work on hand, a dynamic variation of the minimum film thickness that is produced by a radial displacement of the cavity 2. The forced movement of the cavity alters the elastic response of the system, leading to a revised relation between the momentary minimum film thickness and its lateral position given by Equation (7) and illustrated by Figure 5.
Δ β = 2.89 0.168 + Δ h min H min  

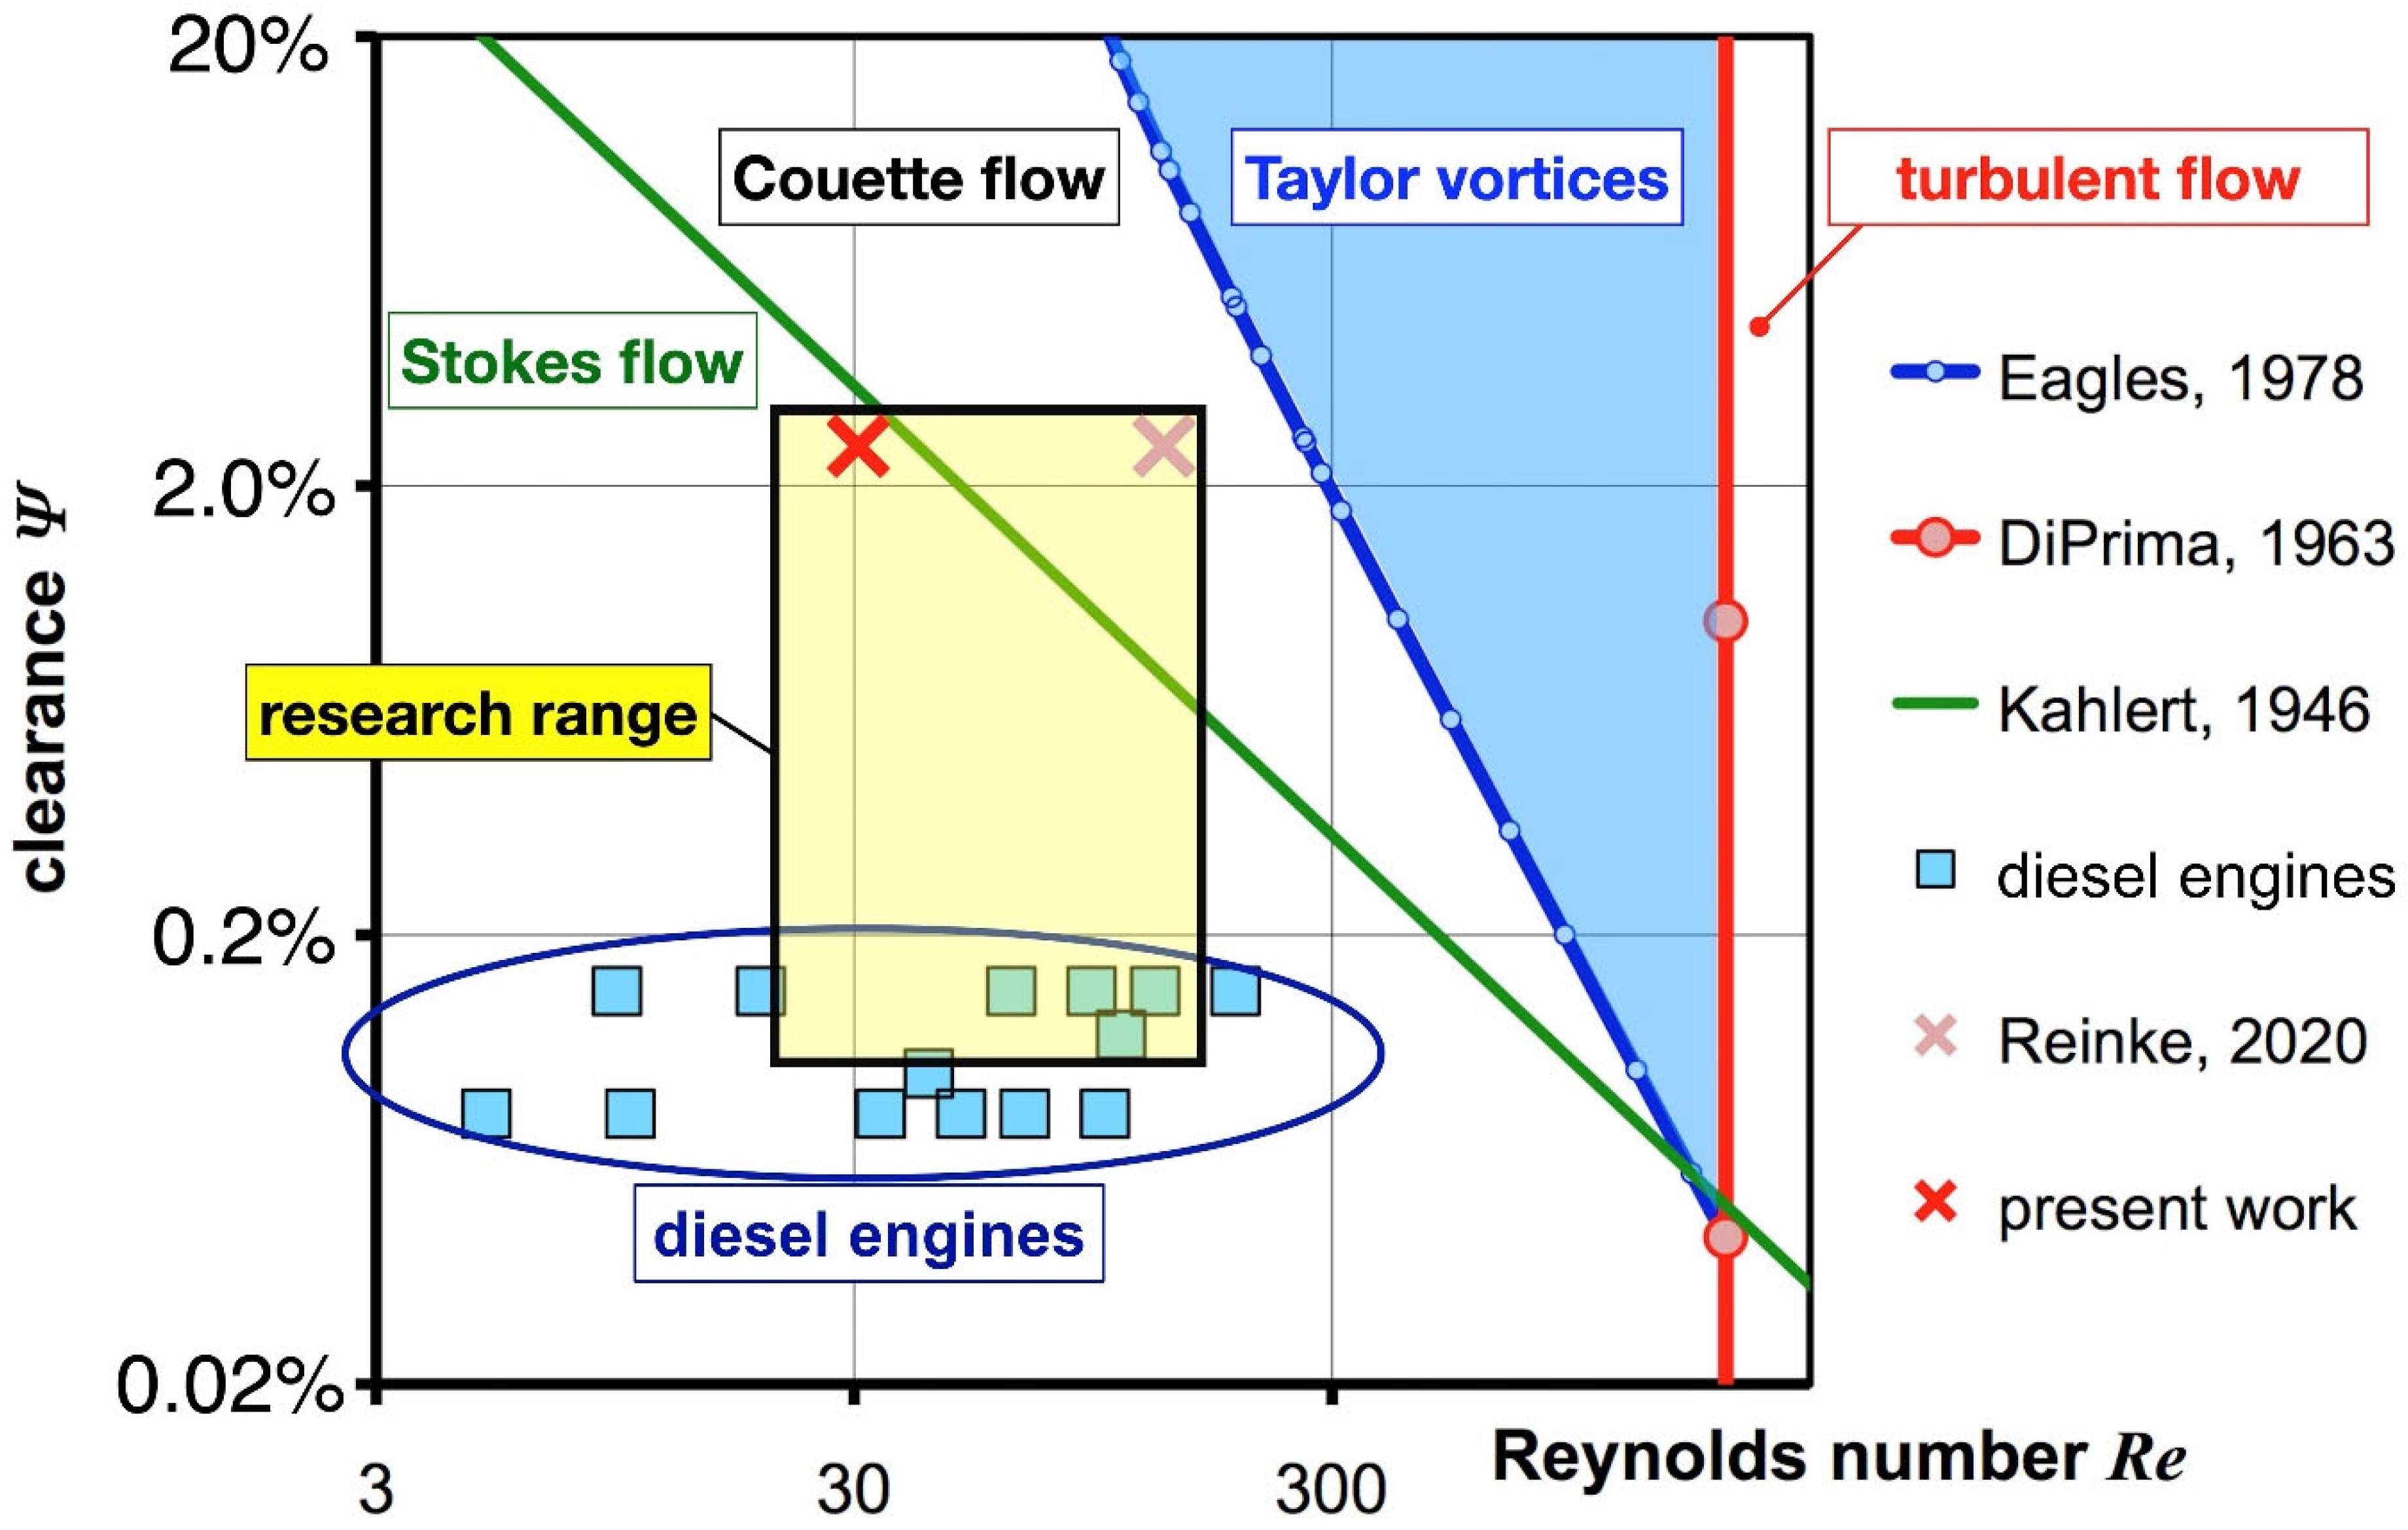
2.5. Broader Perspective and Physical Parameters

The diagram displayed in Figure 6 puts this work into a broader perspective in relation to the previous work [24] and other studies pertaining to the Taylor–Couette flow at low clearance ratios. The diagram shows the range of Reynolds number and clearance ratio which is addressed in this work. Compared to the previous work [24], which was located at the corner of the targeted research range that extends towards the operational range of journal bearings in diesel engines, the current experimental campaign is carried out well below the limit proposed by Kahlert [25] in the domain of the Stokes flow. The limit for the Stokes flow region is defined by Equation (8):
R e Ψ = 1 .
Moreover, the borders to the Taylor vortex flow according to Eagles et al. [27] and to the fully turbulent flow according to DiPrima [28] are displayed, as well. It can be surmised that turbulence is of no concern because the Reynolds number is 2 orders of magnitude below the critical value. All substantial operational parameters are listed in Table 2 for further reference.

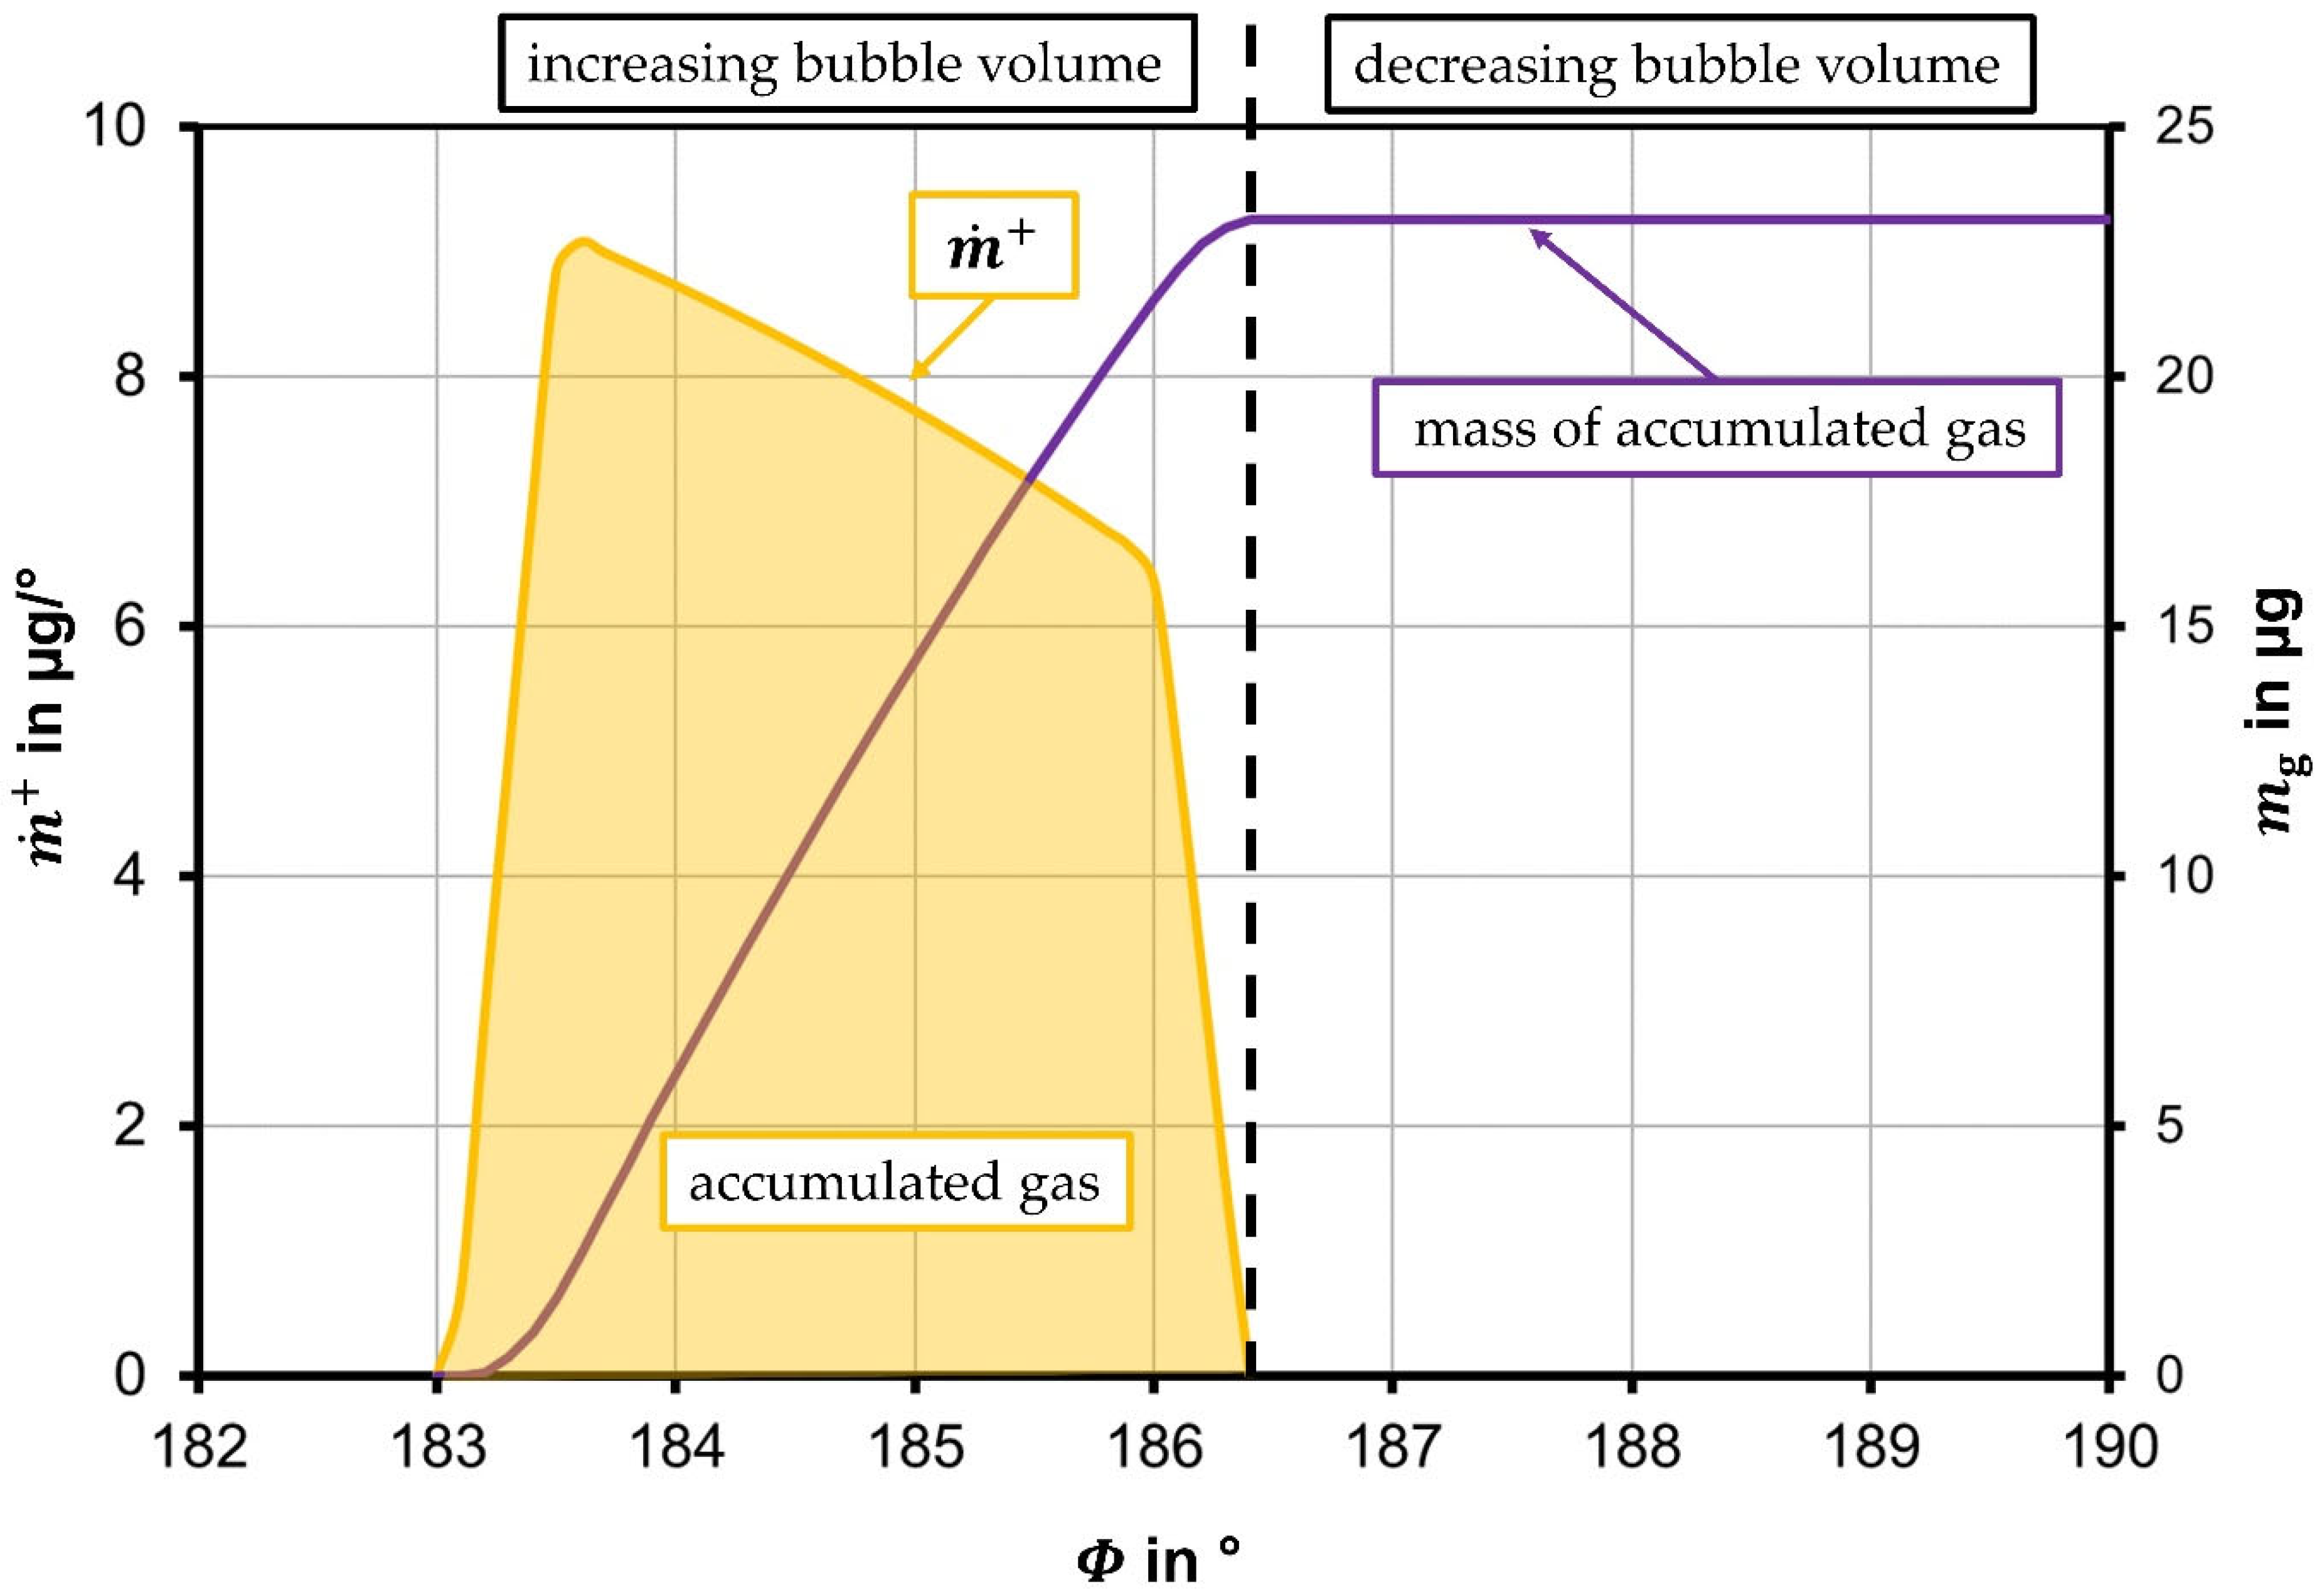
3. Experimental Results Accrued for Numerical Simulation
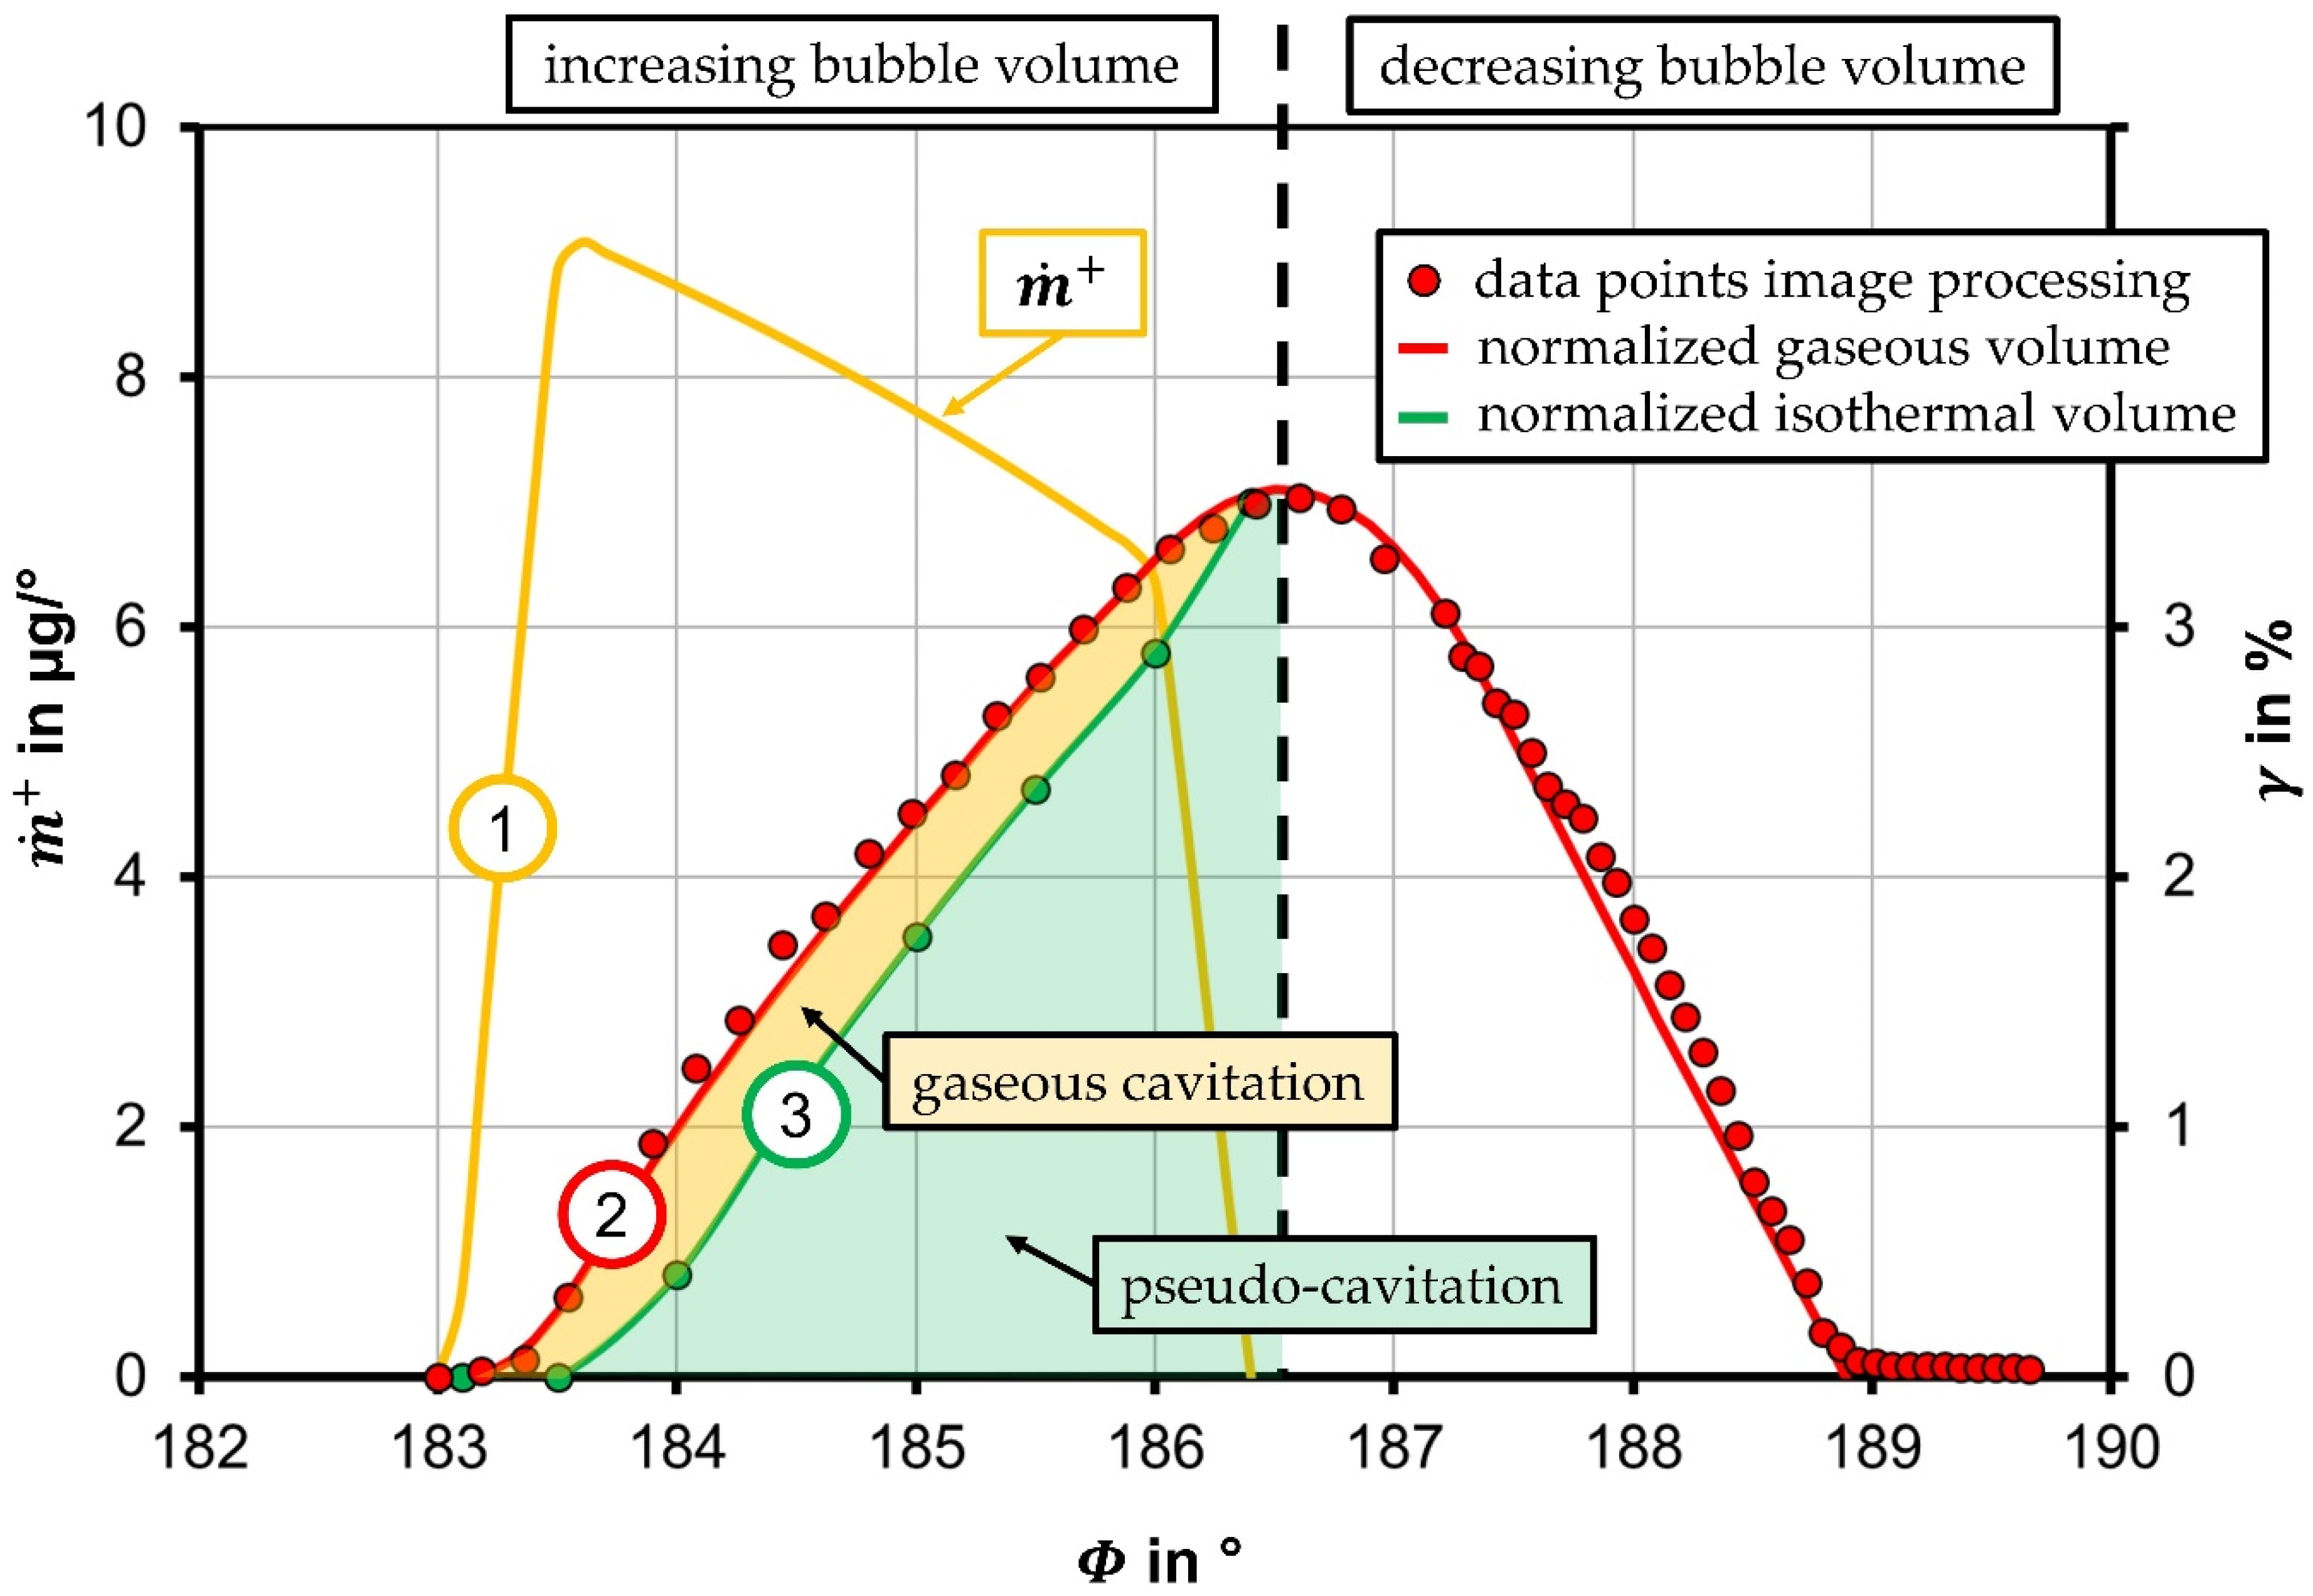
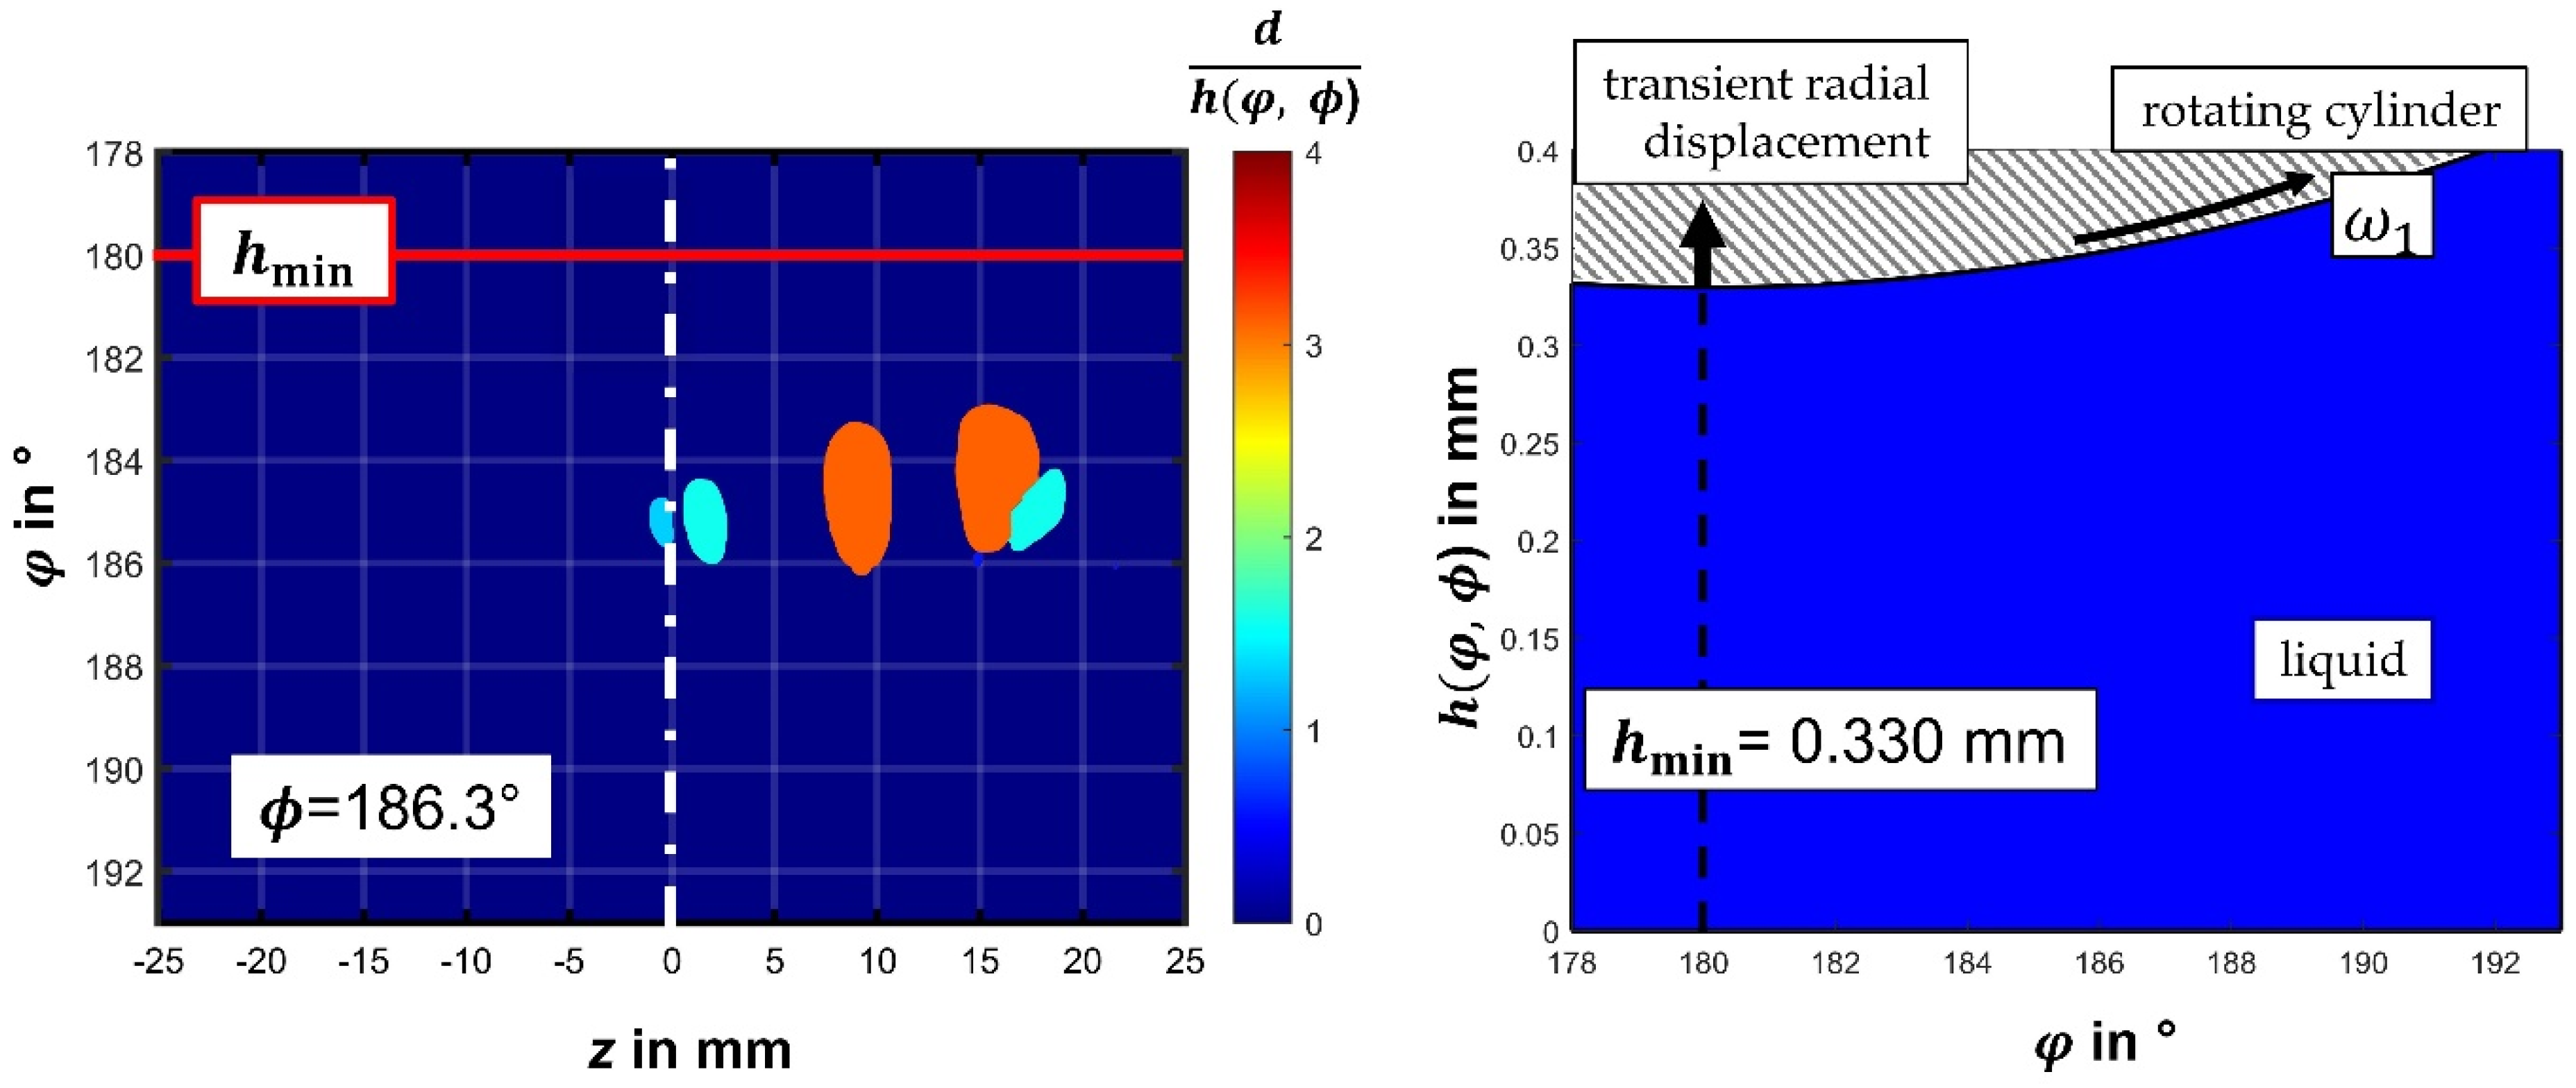
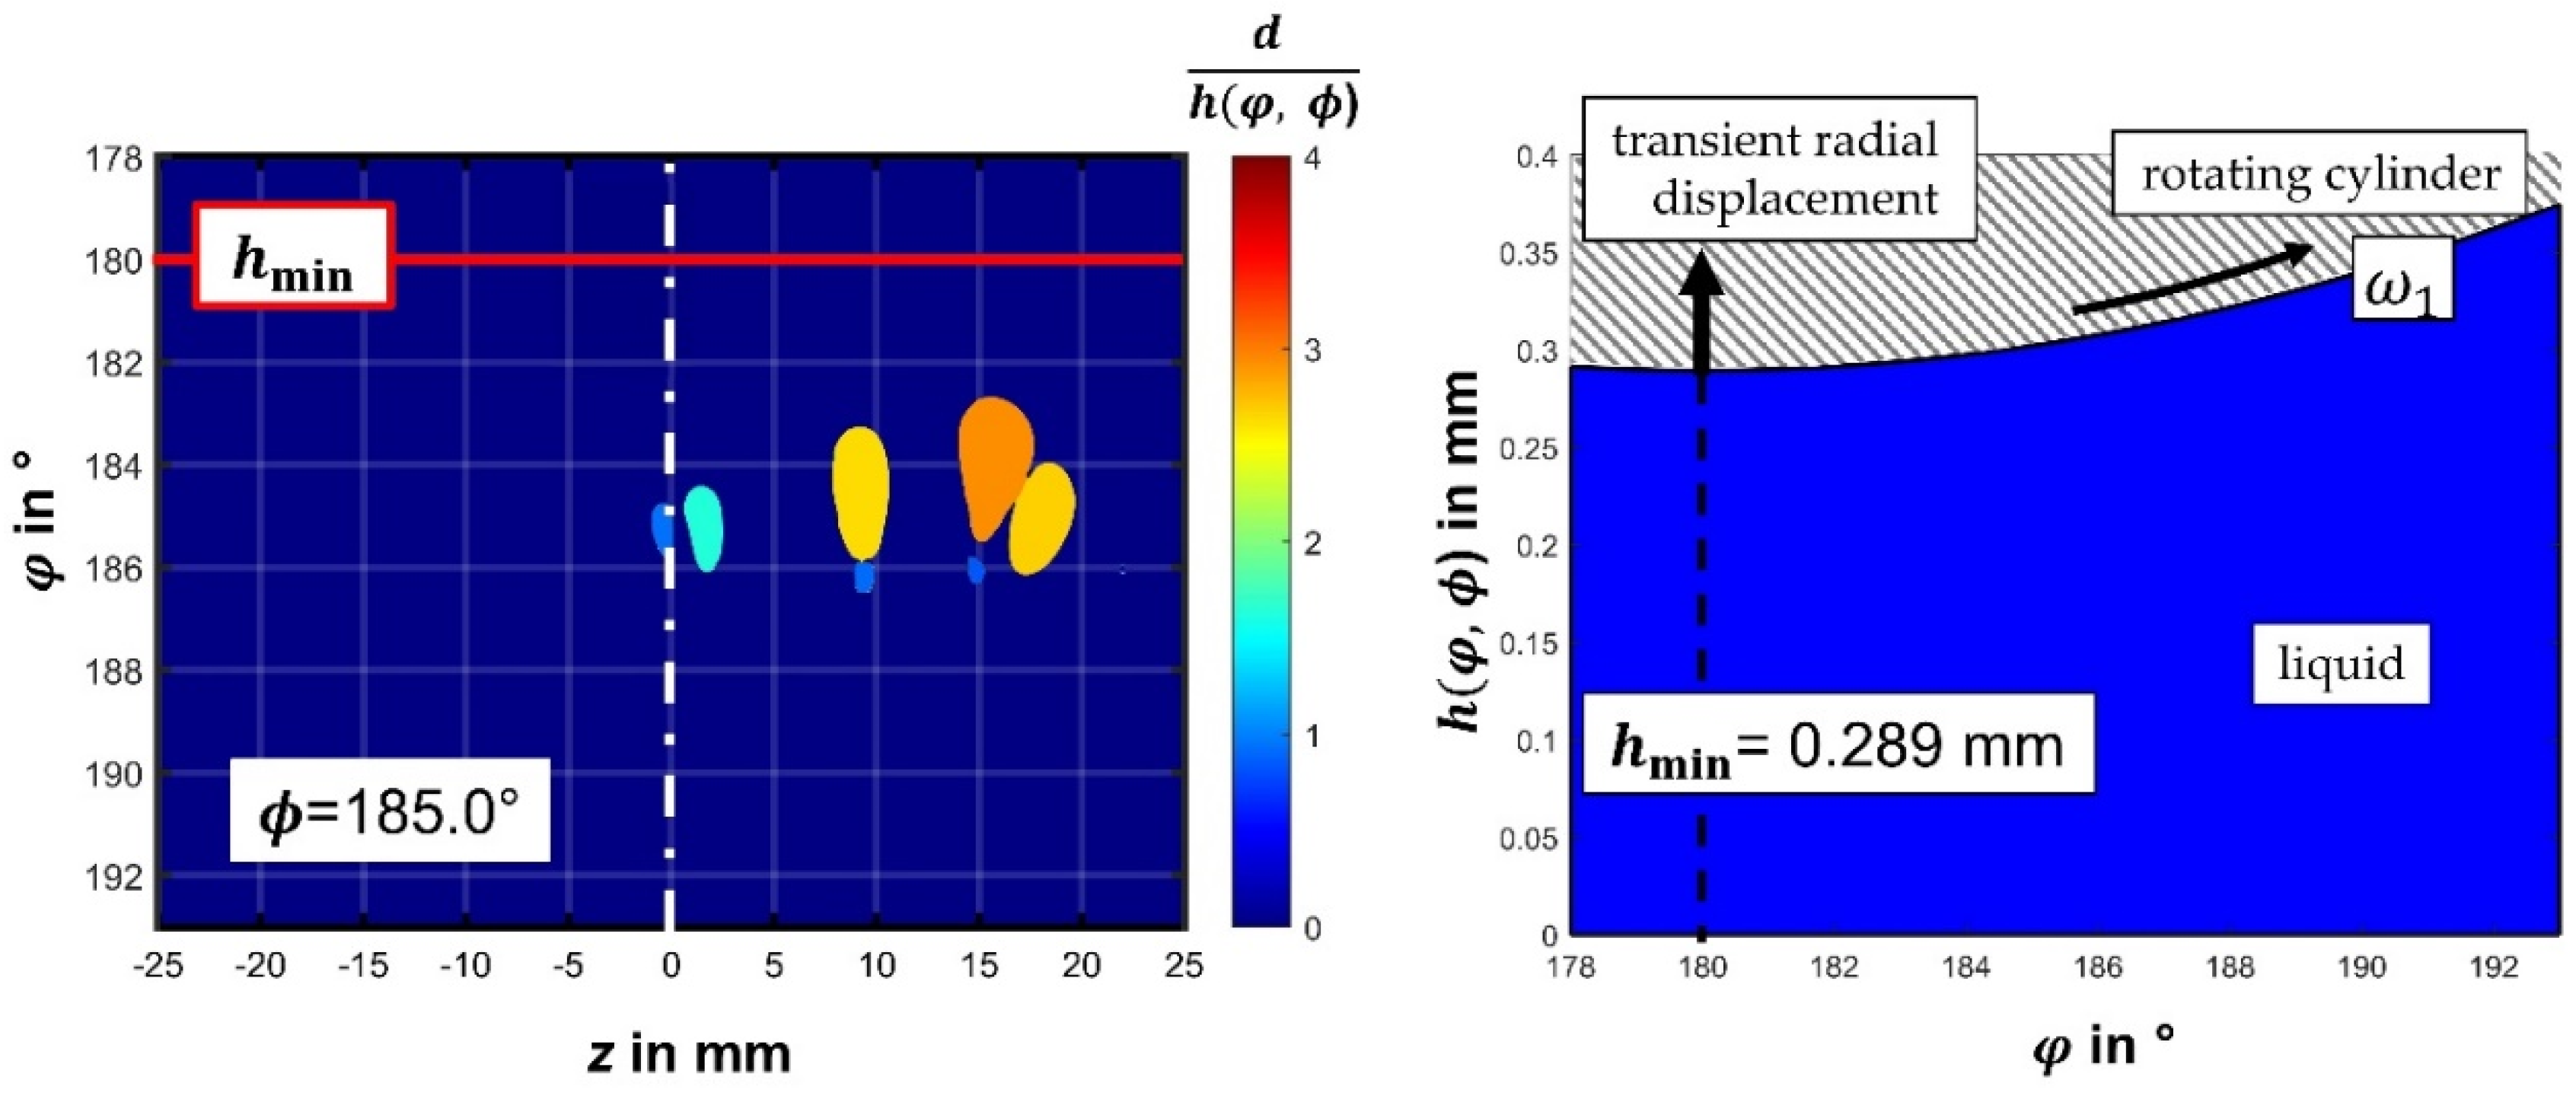
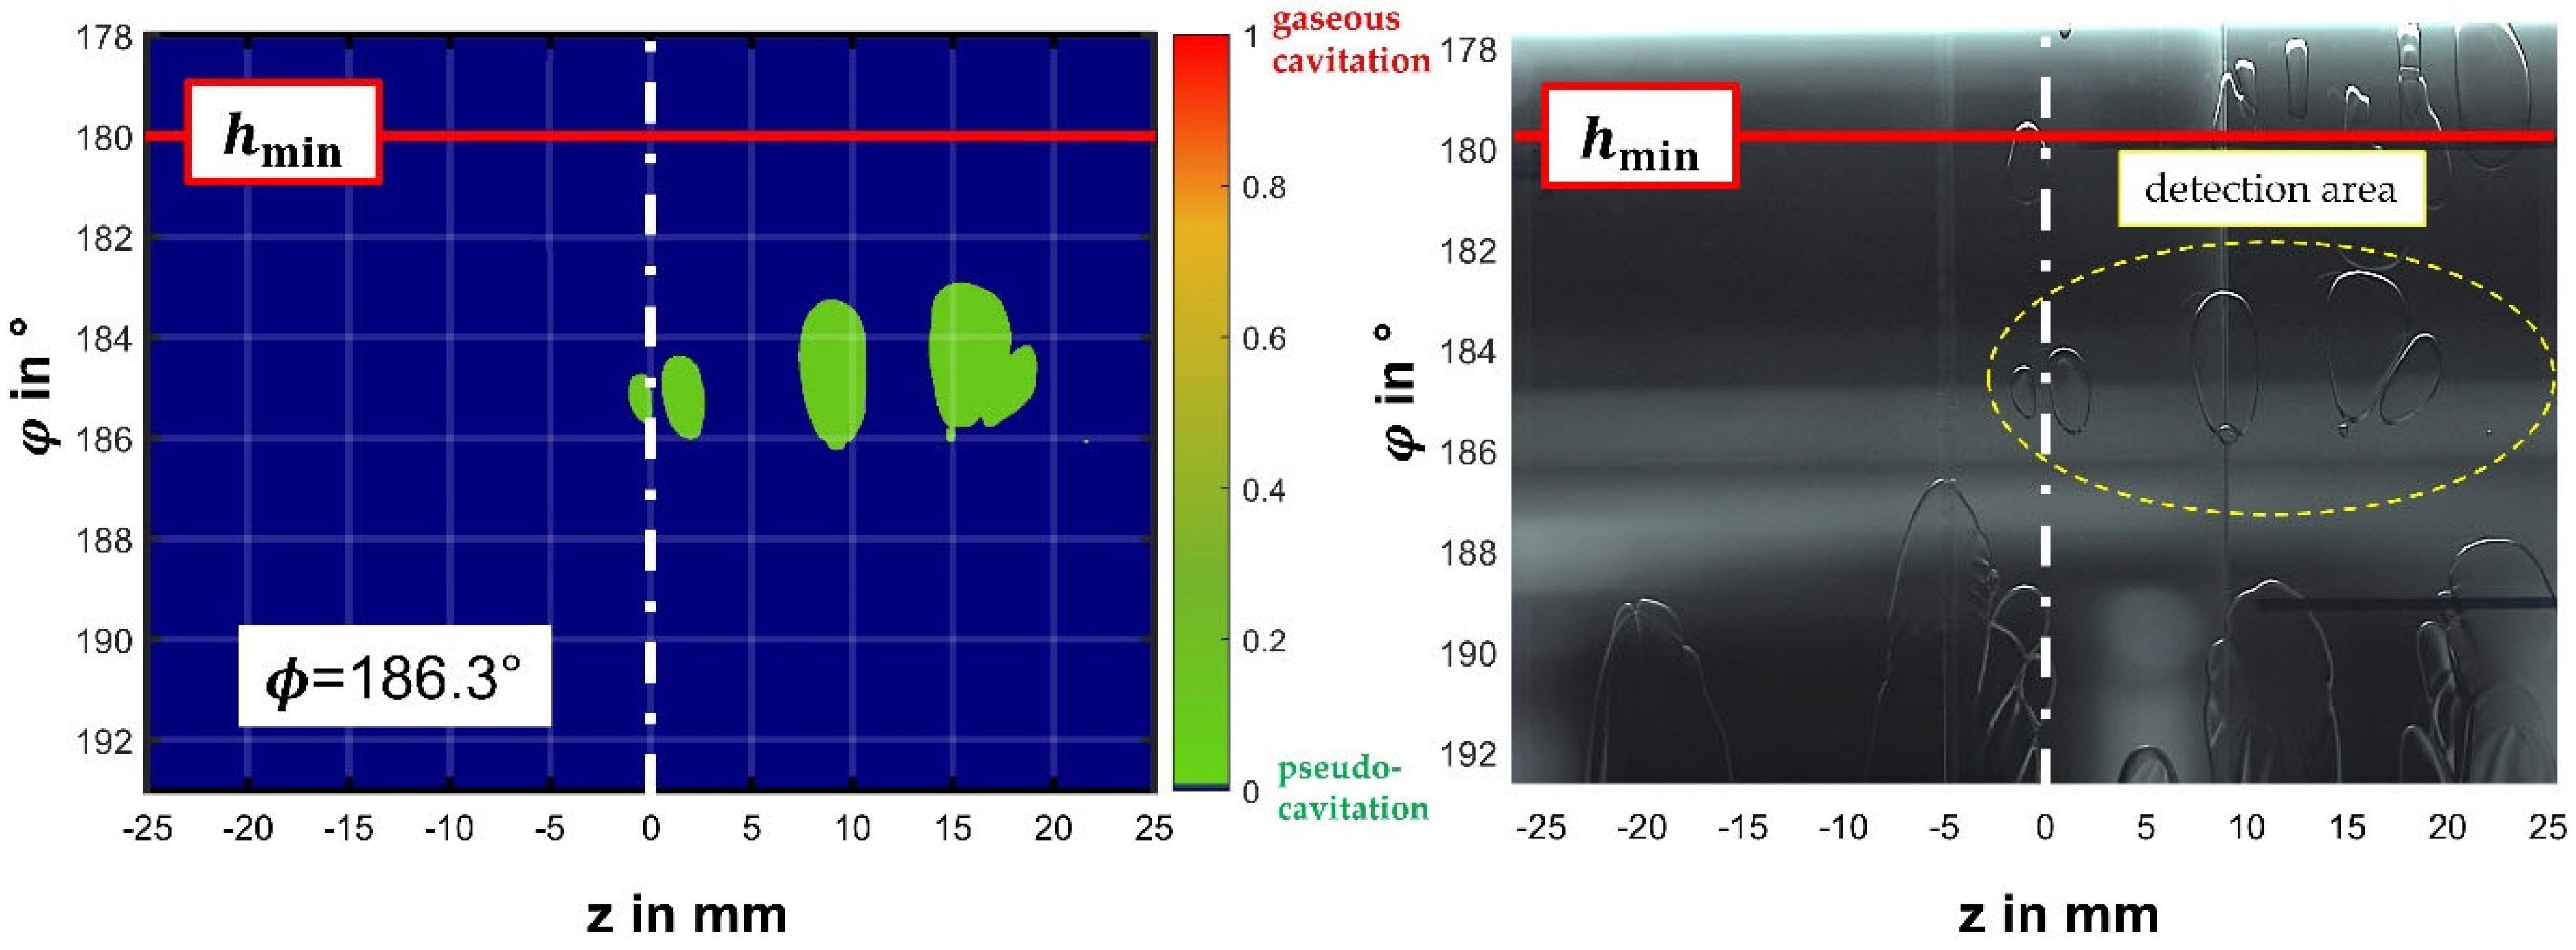
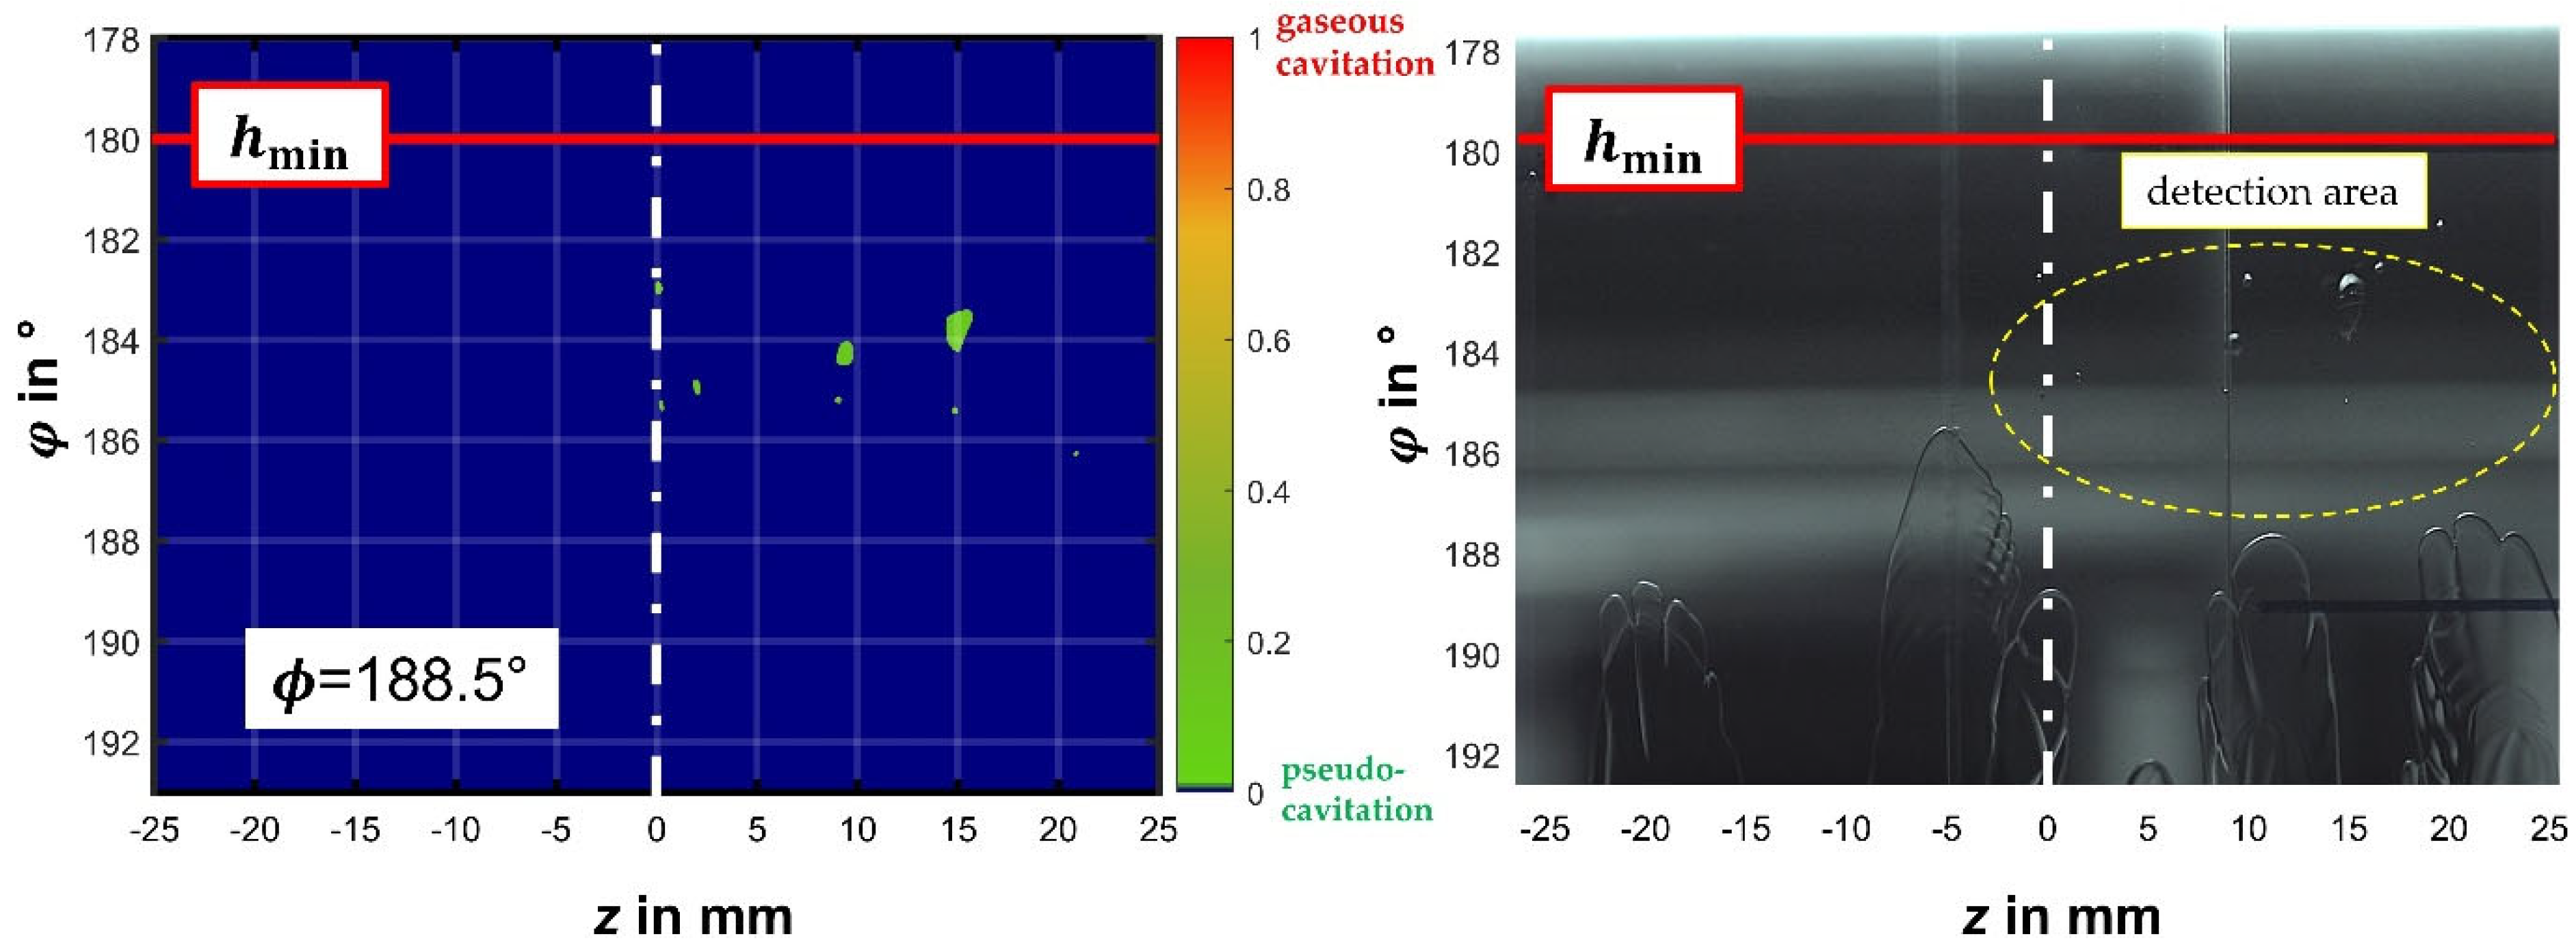
In many applications, an accurate numerical simulation is founded on solid empirical parameters which are obtained from experiments. The authors have introduced their numerical model in [24], which is based on a more general formulation presented by Ferziger and Perić [29]. The numerical simulation of the lubricant flow in the Couette apparatus requires a computational domain that is enclosed by three geometrical boundaries: the cylinder as a moving solid wall, the transparent cavity as a fixed solid wall and the axial open ends of the fluid film. Individual boundary conditions for the flow variables must be specified respectively. For the solid walls, gradient conditions apply for pressure and volume fraction, as well as no-slip conditions for the velocity. At the open ends, the ambient pressure is specified and the volume fraction is set to one, which corresponds to a complete liquid filling. A flexible meshing of the fluid domain enables the displacement of the rotating cylinder including the elastic correction according to Equation (7). Typical for a volume-of-fluid formulation, all properties are discretized on the unit volume and, according to Sauer [30], the two-phase flow requires an additional transport equation for the liquid volume fraction α , which is normalized by the total volume of liquid and gas
α t + α u + α 1 α u α = M ˙ + + M ˙ ρ ,
which applies the liquid volume fraction
α = V l V l + V g .
The source terms on the right-hand side of Equation (9) are defined by the Schnerr–Sauer model [31] and are mass flow rates discretized on the unit volume. The experimental data used in this work are obtained in the section of the fluid film directly downstream of the minimum film thickness and are integral quantities for the entire fluid volume according to Equation (11) rather than a quantization per unit volume. The time-dependent volume V tot represents the entire fluid volume between the cavity and rotating cylinder, which is integrated across the image area A along the Sommerfeld angle
V tot = B R 1 φ h φ , ϕ d φ
and, according to [24], with the local fluid film thickness
h φ , ϕ = H 0 + e 1 ϕ , Δ h min cos φ + β .
The fluid film thickness h φ , ϕ is measured directly by means of displacement sensors, and digital image processing yields the gas volume V g derived from the bubble’s size, which are combined to re-write Equation (10) in the following form:
α = V tot V g V tot .
The Schneer–Sauer model includes two empirical parameters C R and C A quantifying the mass flow for gas release M ˙ + and gas absorption M ˙ of the source terms. These empirical parameters must be derived from experimental data and, in order to do so, they need to be quantified for V tot which, for the case of bubble growth, leads to Equation (14), which is derived from the formula given by [31]:
m ˙ + = sgn p g p ϕ ρ l   ρ g ρ α 1 α V tot 3 d ˙ d C R .
The first term in Equation (14), the pressure difference in relation to the saturation pressure p g , defines the direction of the mass transfer, and a positive sign results in gas release from the fluid. The second term quantifies the normalized mass fractions of liquid and gas, respectively, and is based on the densities of the species and the volume fraction from Equation (13). The third term represents the growth rate of the bubbles. The empirical parameter C R completes Equation (14) and this parameter has to be quantified in order to execute any numerical computation. Hence, one important result of this work is the quantification of C R by processing the high-speed images of the cavitation digitally. Moreover, the image processing yields the bubble size time resolved at recording speed. Thus, bubble diameter d and bubble expansion velocity d ˙ become available. In general, the bubble growth rate is derived from the Rayleigh–Plesset equation, which is valid for an indefinite flow regime. Alas, liquid films do not provide an indefinite space in which bubbles can develop. In particular, the transient conditions in the vicinity of the minimum film thickness must be considered. It stands to reason that this term demands closer attention with respect to the conditions of a narrow gap flow and only during the inception phase Figure 7a, bubbles are smaller in diameter than the film thickness. The initial phase is followed by a phase Figure 7b when the bubble diameter is approximately equal to the film thickness and ultimately bubbles become disk-shaped with a visible diameter much larger than the film thickness Figure 7c. The calculation of the bubble growth rate must include this development according to the phases that are illustrated in Figure 7.
For the first phase, the inception of bubbles, we assume a spherical bubble with a diameter d and find the time derivative of its volume
d V B d t = π 2 d 2 d ˙
and that becomes, by normalizing with the bubble’s volume,
d V B d t V B 1 = 3 d ˙ d .
When a bubble is subject to the second phase and its diameter is of the magnitude of the local film thickness, the bubble volume becomes
V B = π 4 d 2 h φ B , ϕ
and the corresponding time derivative reads as follows:
d V B d t = π 2 d d ˙ h φ B , ϕ + π 4 d 2   h ˙ φ B , ϕ
and Equation (15) adjusted to phase 2 becomes, by normalizing with the bubble’s volume,
d V B d t V B 2 = 2 d ˙ d + h ˙ φ B , ϕ h φ B , ϕ .
When a bubble undergoes the third phase of the growth process, its diameter is significantly larger than the local film thickness and the bubble volume becomes
V B = π 4 d 2 φ h φ , ϕ d φ
and the normalized bubble growth rate for phase 3 is
d V B d t V B 3 = 2 d ˙ d + h ˙ h ¯ φ B , ϕ ,
where the second addend on the right-hand side represents the normalized displacement velocity of the rotating cylinder 1 in relation to the cavity 2 that is averaged with respect to the bubble center. The final component, which must be measured in order to compute C R , is the mass flow rate of gas that is released from the liquid. The mass flow rate is obtained by subtracting the proportion of the bubble volume increase caused by pseudo-cavitation from the bubble volume increase recorded by high-speed photography. For the process of bubbles increasing in size, we insert Equation (13) and the bubble growth rates according to their specific phases into Equation (14), leading to Equation (22), which incorporates specific parameters reflecting the characteristic phases of cavitation in fluid films in narrow gaps
C R , i = m ˙ +   m ¯ m l   m g d V B d t V B i
indicated by the phase index i and where the density averaged fluid mass equals to
m ¯ = ρ V tot .
In summary, this approach provides all necessary components to compute the empirical parameters for the distinct phases of bubble growth, i.e., the fluid volume V tot of the fluid film downstream of the minimum film thickness H min is geometrically defined, the normalized bubble growth rate as well as the mass flow rate are obtained by means of image processing and the thermodynamic properties of the gas are derived from other measured quantities such as pressure and temperature, which are ultimately available to calculate liquid and gaseous mass. Equations (11)–(23) show the deduction of C R step by step and the process for deducing C A must be executed for bubble shrinking accordingly.

4. Results

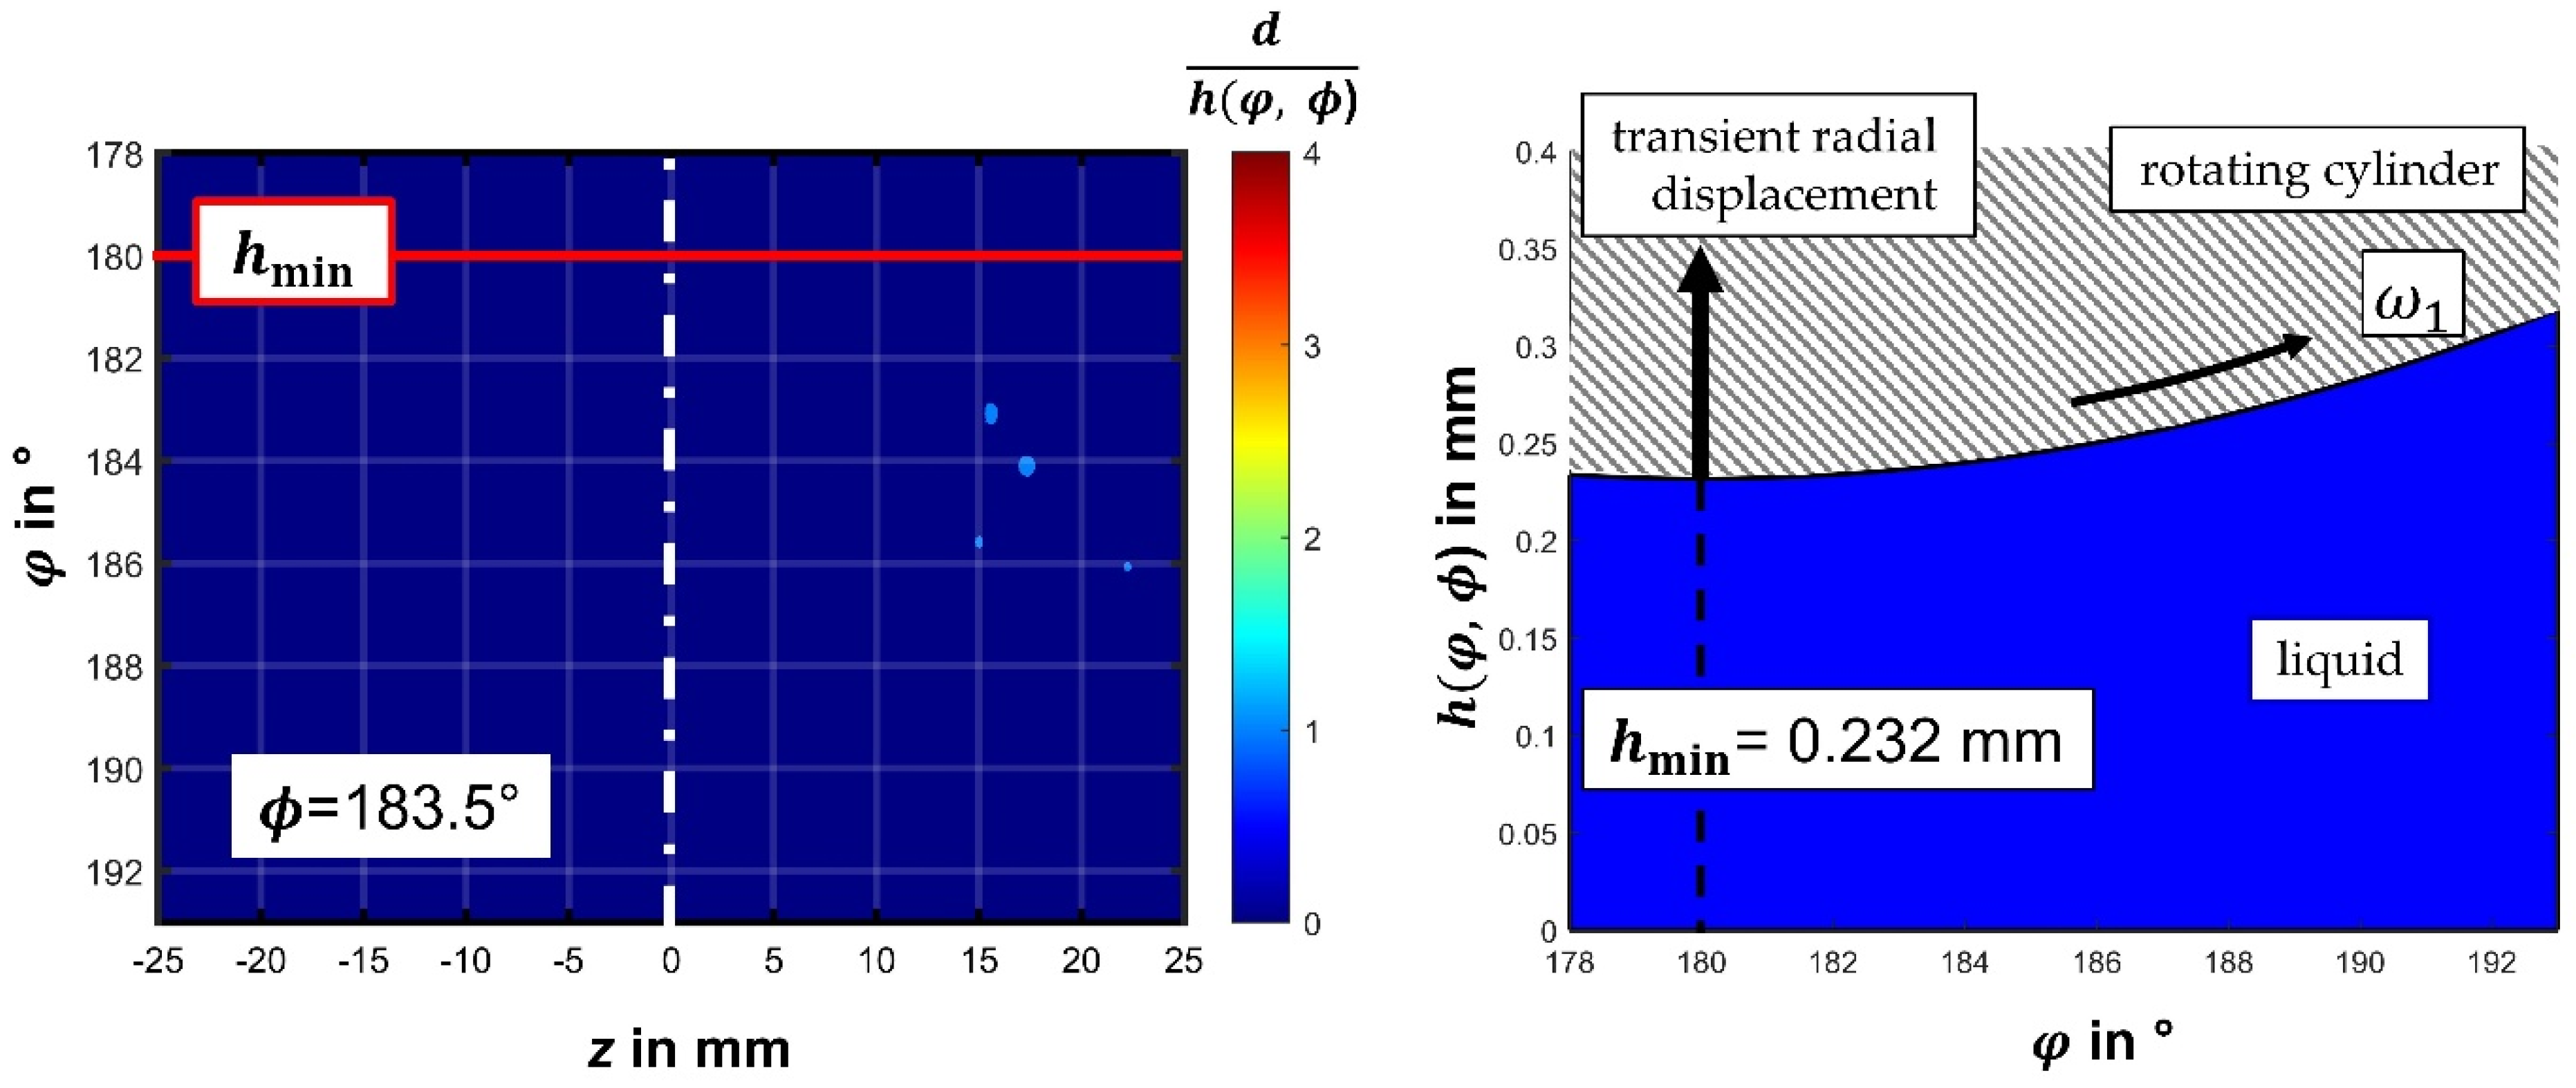
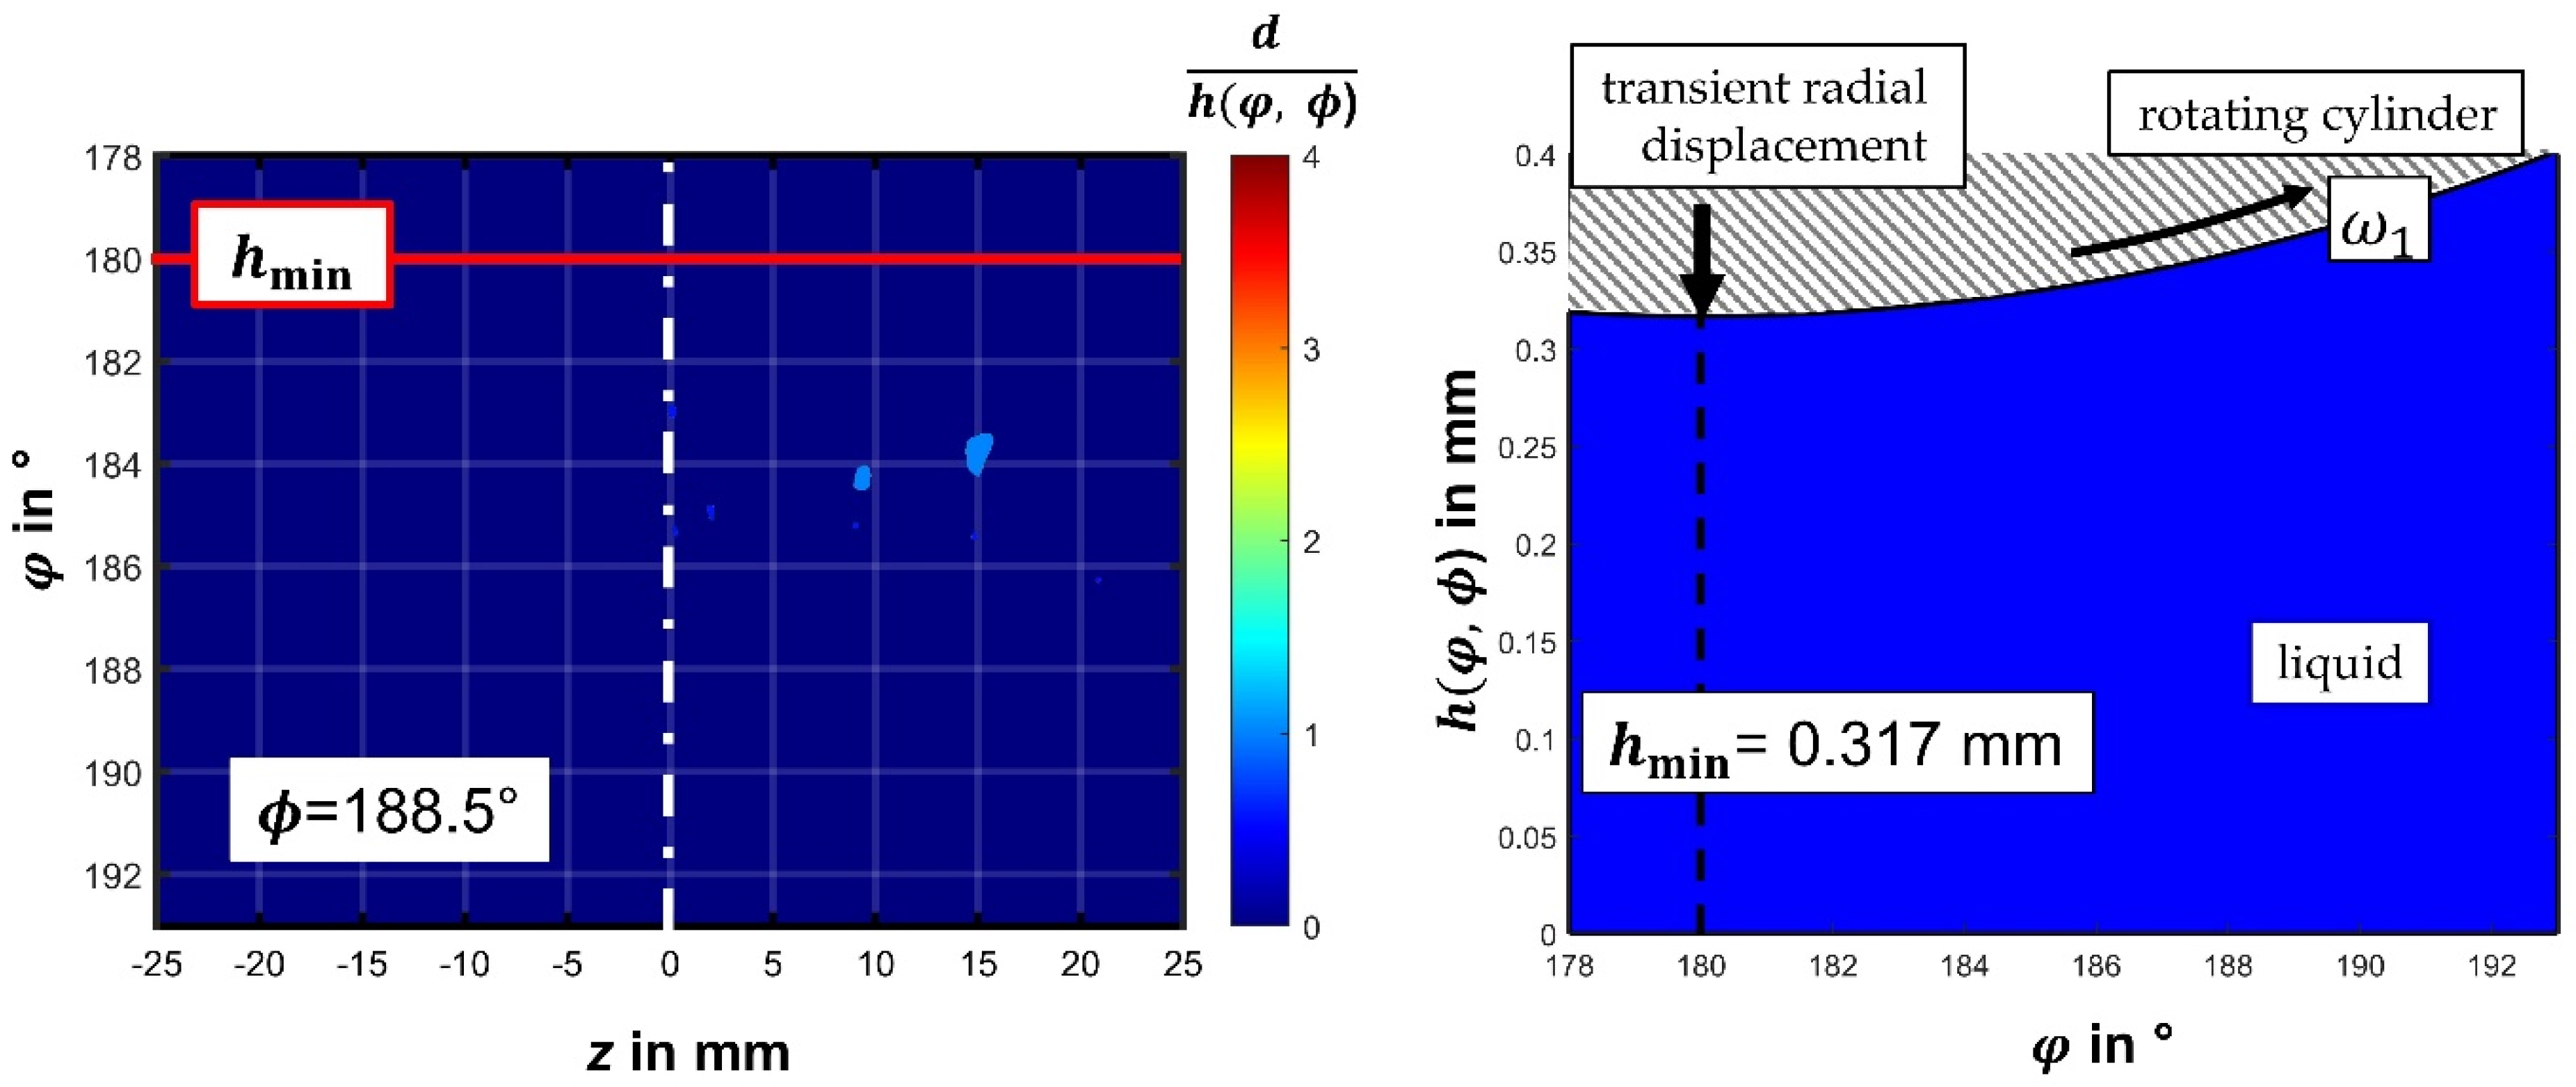
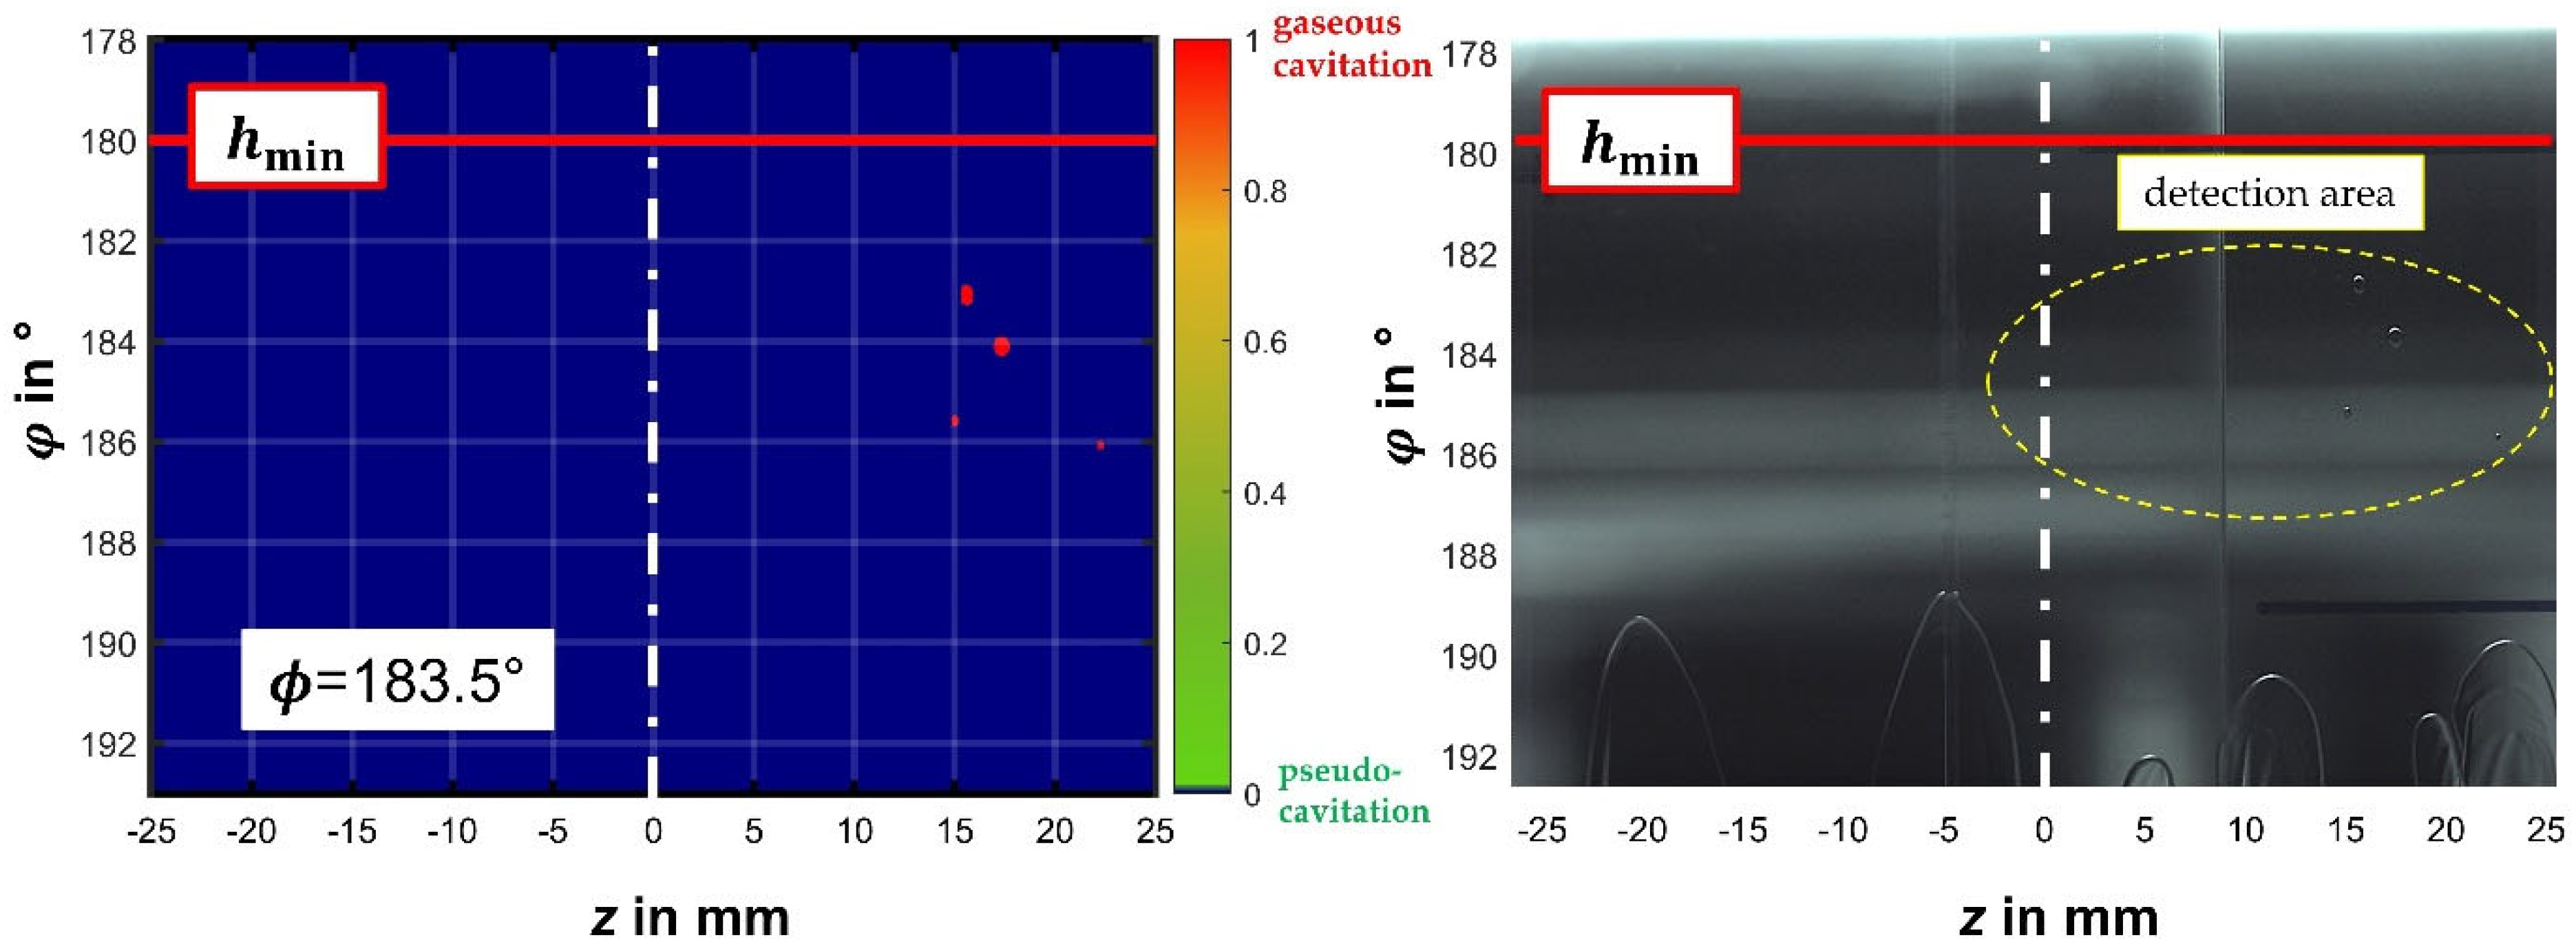
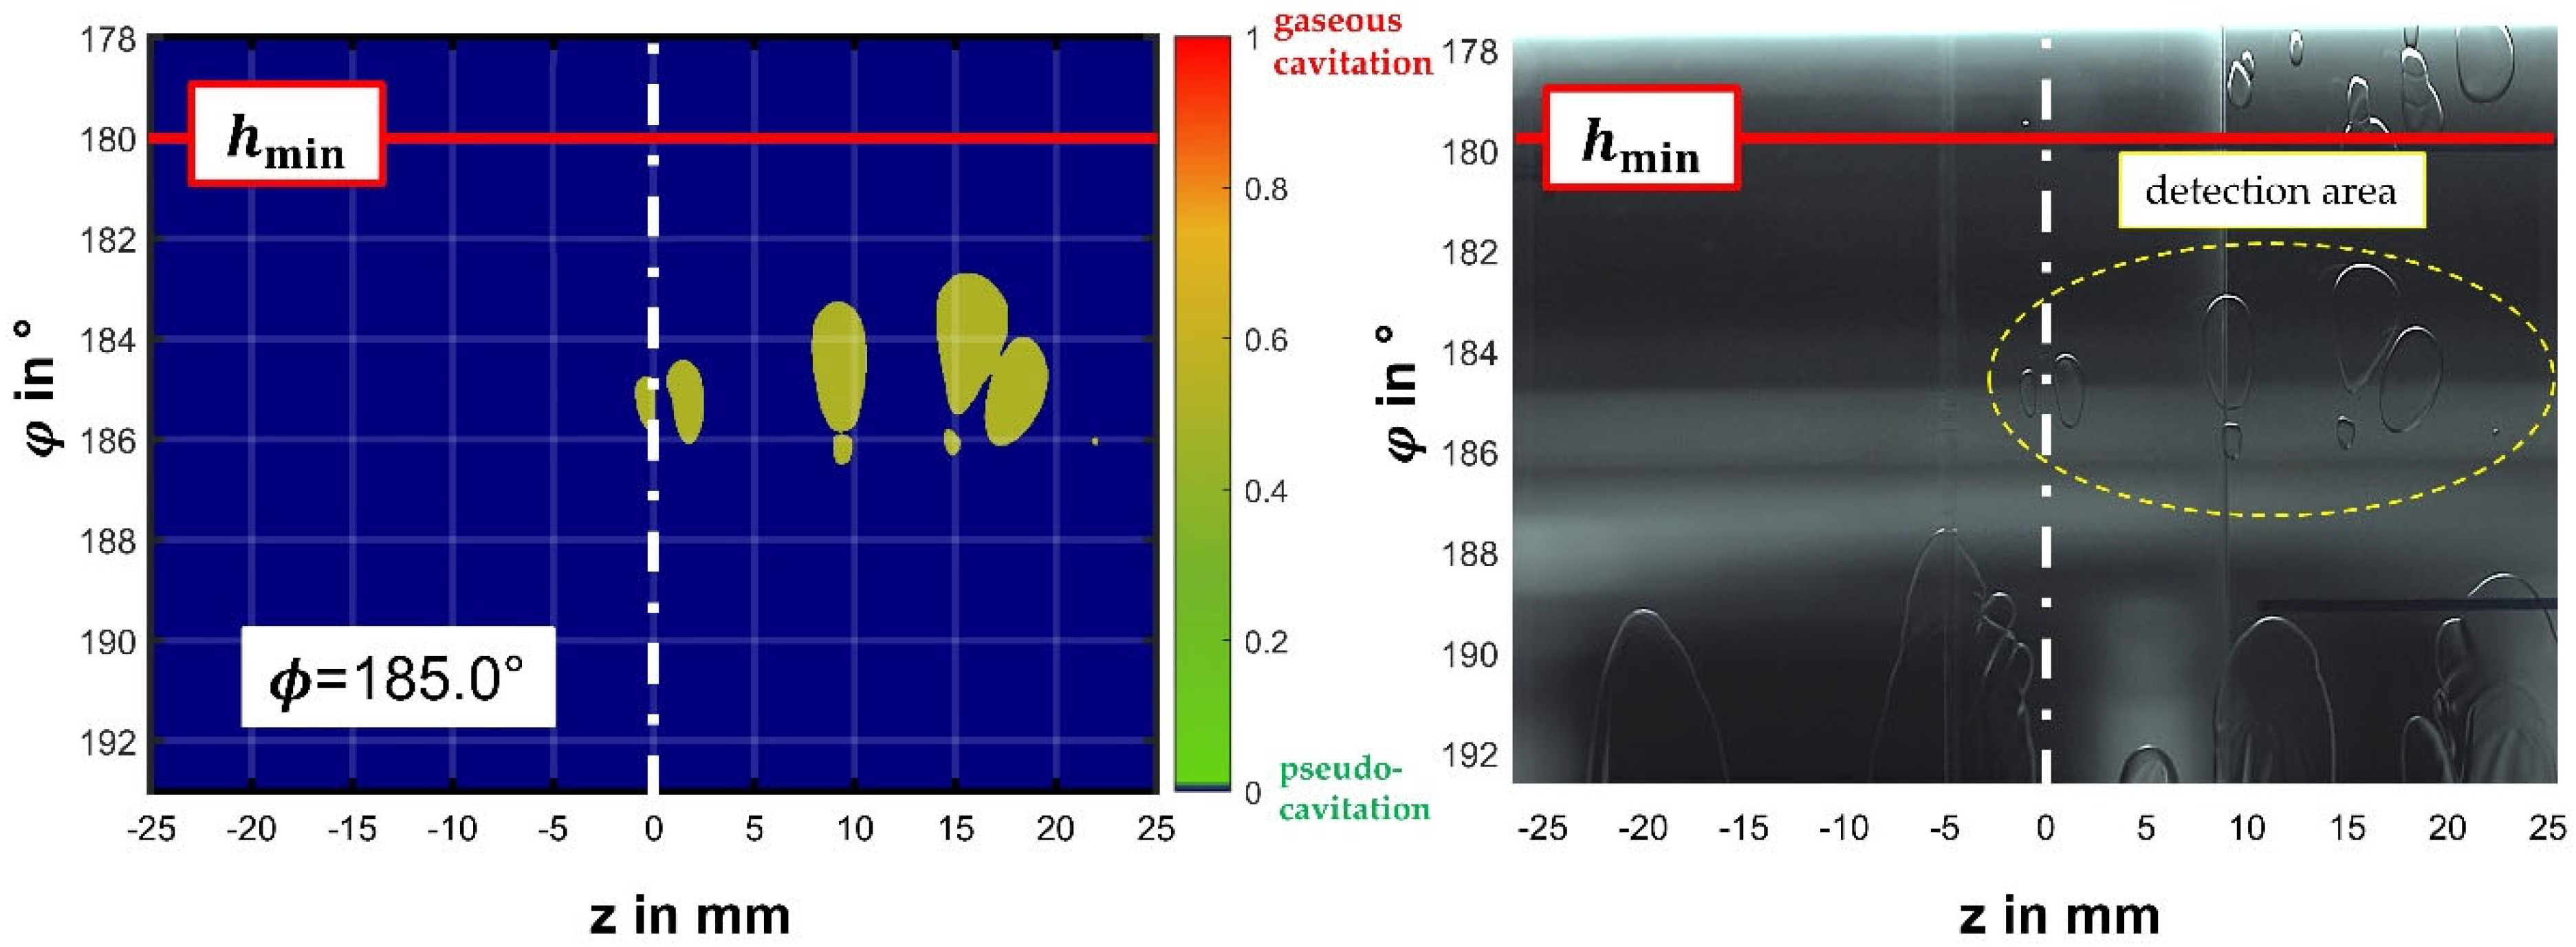
4.1. High-Speed Photography—Raw Material

The transient formation of bubbles in the lubricant film downstream of the minimal film thickness is triggered by a radial displacement of the rotating cylinder 1 inside the cavity 2. The following Figure 8, Figure 9, Figure 10 and Figure 11 show digital photography collected with a speed of 10,000 fps for the circumferential section downstream from H min to a Sommerfeld angle of 193° and within ±25 mm symmetrically to the equator. The image on the left of Figure 8, Figure 9, Figure 10 and Figure 11 is color-coded, indicating the bubble diameter in relation to the transient, local film thickness. The transient development of the film thickness is displayed in the graph on the right that also indicates the momentary value of the minimum film thickness and the distribution of the thickness vs. the Sommerfeld angle downstream from the H min .
The following Figure 12, Figure 13, Figure 14 and Figure 15 show digital photography collected with a speed of 10,000 fps for the circumferential section downstream from H min to a Sommerfeld angle of 193° and within ±25 mm symmetrically to the equator. The image on the left of Figure 12, Figure 13, Figure 14 and Figure 15 is color-coded, indicating the proportion of gaseous cavitation in relation to the total increase in bubble volume. Herein, gaseous cavitation is the difference between the recorded bubble volume and isothermal expansion due to pseudo-cavitation. The photography on the right captures the bubble development itself at the indicated rotational angle. The current digital camera detects the bubbles of a diameter of 100 µm and larger.

4.2. High-Speed Photography—Evaluation by Digital Imaging

Figure 16 summarizes the results of image processing. The left y-axis shows the mass flow rate of released gas from the fluid which is displayed by the yellow curve (1). It stands to reason that initially there needs to be a higher release rate to engender bubbles that can spherically increase in size according to Equation (16) while the bubble diameter is smaller than the film thickness. When a bubble touches the walls its active surface is reduced to its circumferential surface and that is restricting the gas transfer. At a rotational angle of approx. 186°, the radial displacement of the inner cylinder reverses and consequently the fluid pressure increases and gaseous cavitation ceases altogether. However, bubbles may still increase in size due to pseudo-cavitation. This is in agreement with [19], who found that gas absorption demands a much longer time and released gas accumulates from cycle to cycle. In relation to the right y-axis, the red curve 2 represents the gaseous volume normalized according to Equation (24). After the inception of bubbles, pseudo-cavitation sets in and the green curve 3 captures the isothermal expansion of the gas, which is purely pseudo-cavitation. In summary, the major fraction of the increase in the gaseous volume is indeed caused by pseudo-cavitation. For the normalized gaseous volume, we write
γ = V g V tot .
The fact that released gas is accumulated becomes clearly visible by displaying the gas mass rather than the volume of the gas because the volume strongly depends on pseudo-cavitation, whereas the mass remains constant if there is no mass flow rate between liquid and bubble. Figure 17 evolves directly from Figure 16 with the gas mass on the right y-axis. Moreover, the experimental data show that the gas mass remains also constant while the bubbles decrease in size. This result confirms the observations of [18], who found that gas release is a fast process, but absorption evolves 10,000 times slower. We note that the cycle time of the present experiment is 0.5 s and the process time for bubble development is just a fraction of the cycle time, which is indicated by the graph of the normalized gaseous volume in Figure 16. Bubble development is forced by transient radial displacement and has a duration of 6° in rotational angle, resulting in a total process time of 8.3 ms, and merely a half of the process time remains for the gas to re-dissolve into the liquid. In other words, the mass flow rate M ˙ must be zero.

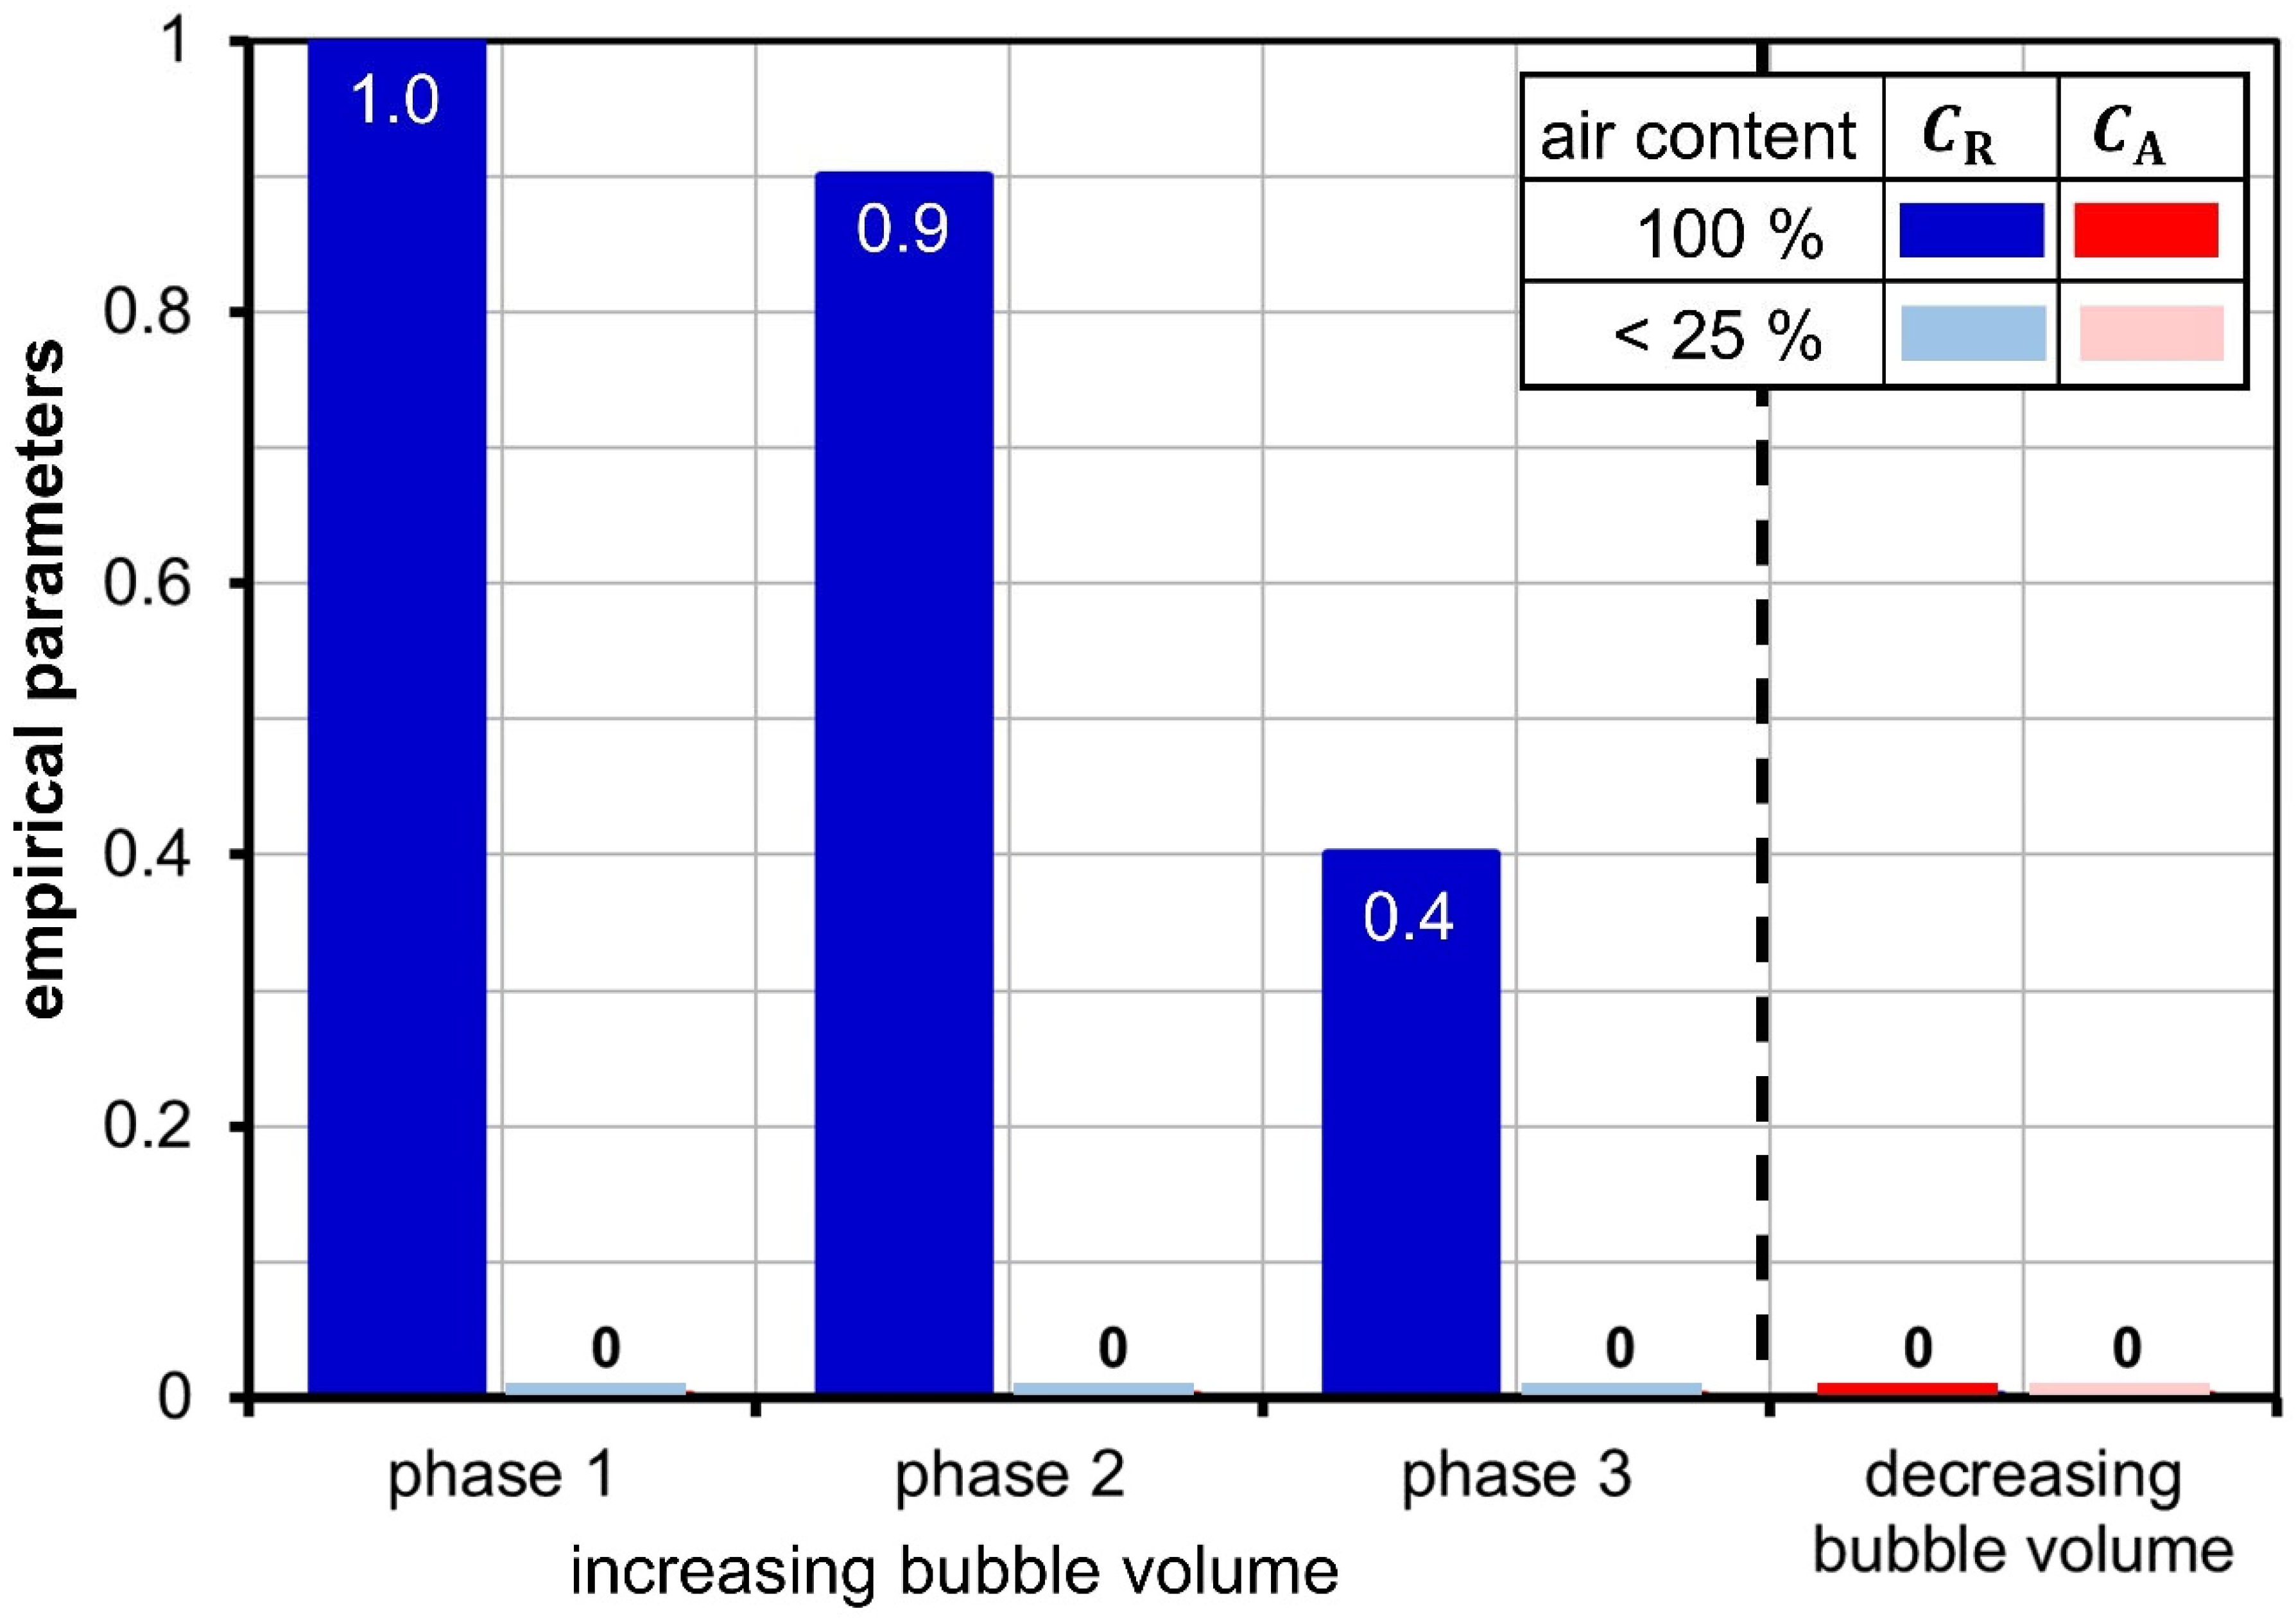
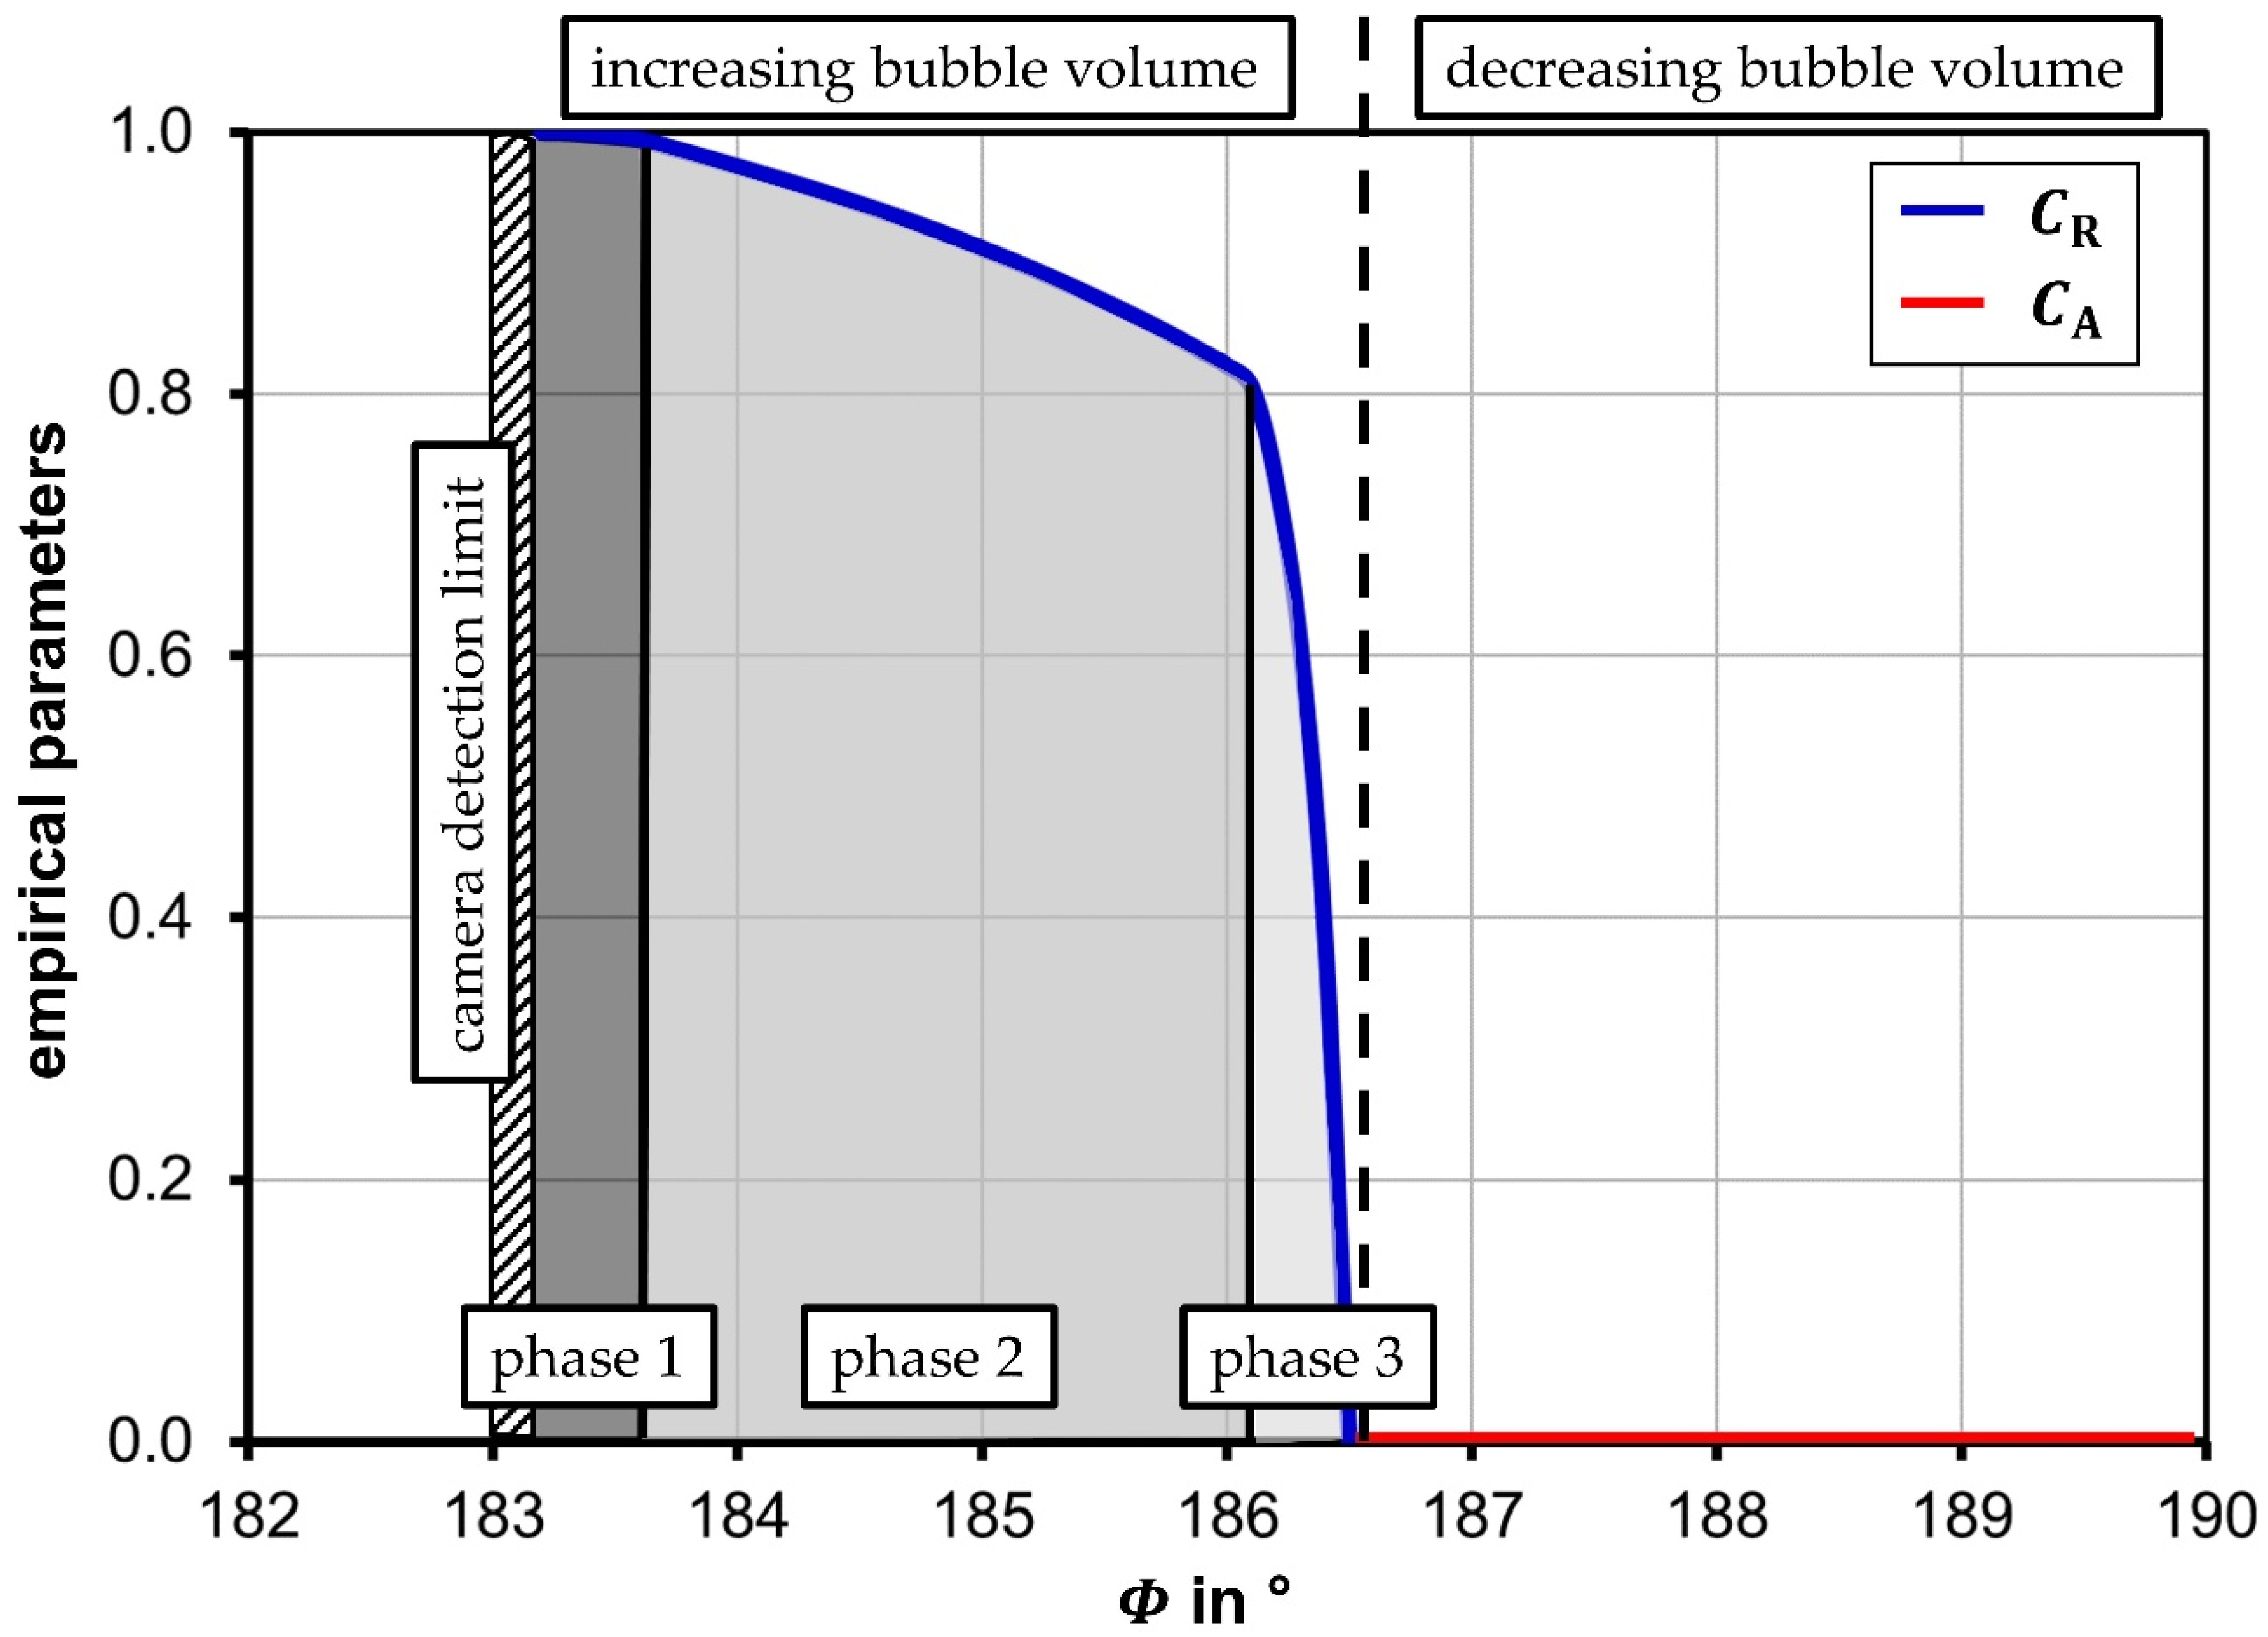
4.3. Empirical Parameters of the Schneer-Sauer Model

With the measured properties of the mass flow rate, the bubble growth rate and the transient fluid volume, the empirical parameters for increasing bubbles C R when gas is released from the liquid and for decreasing bubbles C A when gas dissolves into the liquid can be computed by means of Equation (22). The result is displayed in Figure 18. The initial part of phase 1 is not yet fully determined due to an insufficient resolution of the camera and must be subject to further research. However, phase 1 of the bubble growth when bubbles have a diameter that is less than the film thickness is reliably detected. Data reveal that C R has a value of 1 and it stands to reason that initially gaseous cavitation must be dominant, because at first a bubble has to be engendered before it can expand by pseudo-cavitation. The second phase of bubble growth is characterized by a declining value of C R . It can be surmised that during the expansion of the bubble, the mass flow rate must decrease due to a simultaneously shrinking active surface because only the circumferential area is a liquid–gas interface, while the head sides of the bubble are facing the solid walls of inner cylinder and cavity, respectively. The third phase of bubble growth shows a strong decline of C R and pseudo-cavitation becoming the dominant process. After a rotational angle of 186.5°, the bubbles begin to shrink, and during the whole remaining duration of bubble development no mass flow was detected, and thus, the empirical constant for absorption C A must be zero. All experiments that provided data for Figure 18 were carried out with a fluid consisting of paraffin which contained 100% of dissolved air in relation to its saturation level.
Additionally, experiments were carried out using a cured fluid consisting of paraffin containing a reduced amount of air at 25% in relation to the saturaion level. The goal of these experiments was emulating a fluid free of gaseous cavitation and was designed to prepare for future research targeting vaporous cavitation that is negatively affected by gaseous cavitation. Available photography shows clearly no sign of bubble inception at all. Consequently, all empirical parameters must vanish, which is displayed by Figure 19 summarizing the results of both fluids. The values for C R are averaged per phase, respectively.

5. Discussion

This work presents the experimental results of cavitation based on the high-speed photography of a lubricant-type flow in the eccentric gap between a rotating cylinder and a cylindrical cavity. The eccentricity and thus the film thickness was dynamically varied by means of a newly developed mechanism causing gaseous cavitation and pseudo-cavitation downstream of the minimum film thickness. The observed type of cavitation was similar to the process of suction cavitation typical for journal bearings. Particularly, the inception of bubbles was captured, confirming the assumption that in the early phase of bubble development gaseous cavitation is dominant. Moreover, the unprecedented time resolution of the high-speed imaging system provided the digital photography of the entire bubble development, from inception to the end of the shrinking process in detail. Based on these data, the authors established the existence of three phases that divide the process of bubble growth which are sequentially showing firstly gaseous cavitation, followed secondly by gaseous and pseudo-cavitation that are co-existing and ending thirdly with pure pseudo-cavitation. Additionally, the data confirm other sources that the shrinking process of bubbles is entirely pseudo-cavitation and due to the shortness of the process time no mass flow rate appears, which is related to a dissolving of gas by the bubble carrying liquid. In other words, gas that is once released accumulates from cycle to cycle.
In addition to the results obtained by image processing and by applying quantitative data such as displacement, pressure and temperature measurement, the authors accrued data for the application in numerical simulations. The computation of two-phase flows based on the volume-of-fluid model utilizes the Schneer–Sauer model, which in turn includes empirical factors for bubble increase and decrease. The current results show that during the increase in bubbles, the value of the empirical factor varies according to the phase of the process and the form of cavitation dominating the particular phase. Moreover, it was found that the saturation level of the gas in the fluid has a strong effect on the result. Other parameters, such as the bubble diameter in relation to the film thickness, need further investigation to deepen the understanding of their effects. However, a set of experiments confirms that at very low air content gaseous cavitation ceases altogether.
Future studies will aim at the investigation of vaporous cavitation and thus it is an important result to provide conditions that are free of gaseous cavitation because sources state unanimously that gaseous cavitation weakens vaporous cavitation. Moreover, the new mechanism will enable the research of vaporous cavitation in particular during the inception of bubbles, which is yet not fully understood but could be critical with respect to material erosion.

Author Contributions

Conceptualization and methodology, P.R.; software, M.S.; validation, T.B., J.A. and P.R.; formal analysis, P.R.; camera and optical resources, J.A.; experiments and data curation, T.B.; writing—original draft preparation, P.R.; writing—review and editing, P.R., J.A., T.B. and M.S.; visualization, M.S.; supervision and project administration, P.R.; funding acquisition, P.R. All authors have read and agreed to the published version of the manuscript.

Funding

This research is funded by the Deutsche Forschungsgemeinschaft (DFG, German Research Foundation)—proj. no. 462581008.

Acknowledgments

The authors wish to acknowledge the constant support of Wolfgang Viöl, Vice President of Research and Transfer at the HAWK Goettingen.

Conflicts of Interest

The authors declare that there is no conflict of interest.

Nomenclature

A image area
B cylinder height, fluid film width
C A coefficient for gas absorption
C R coefficient for gas release
d diameter of bubble
d ˙ bubble expansion velocity
E 0 static eccentricity
E 1 dynamic eccentricity
e 1 resulting eccentricity
e 1 rigid eccentricity
e el elastic displacement
H 0 clearance between cylinder 1 and cavity 2
H min absolute minimal fluid film thickness
h 
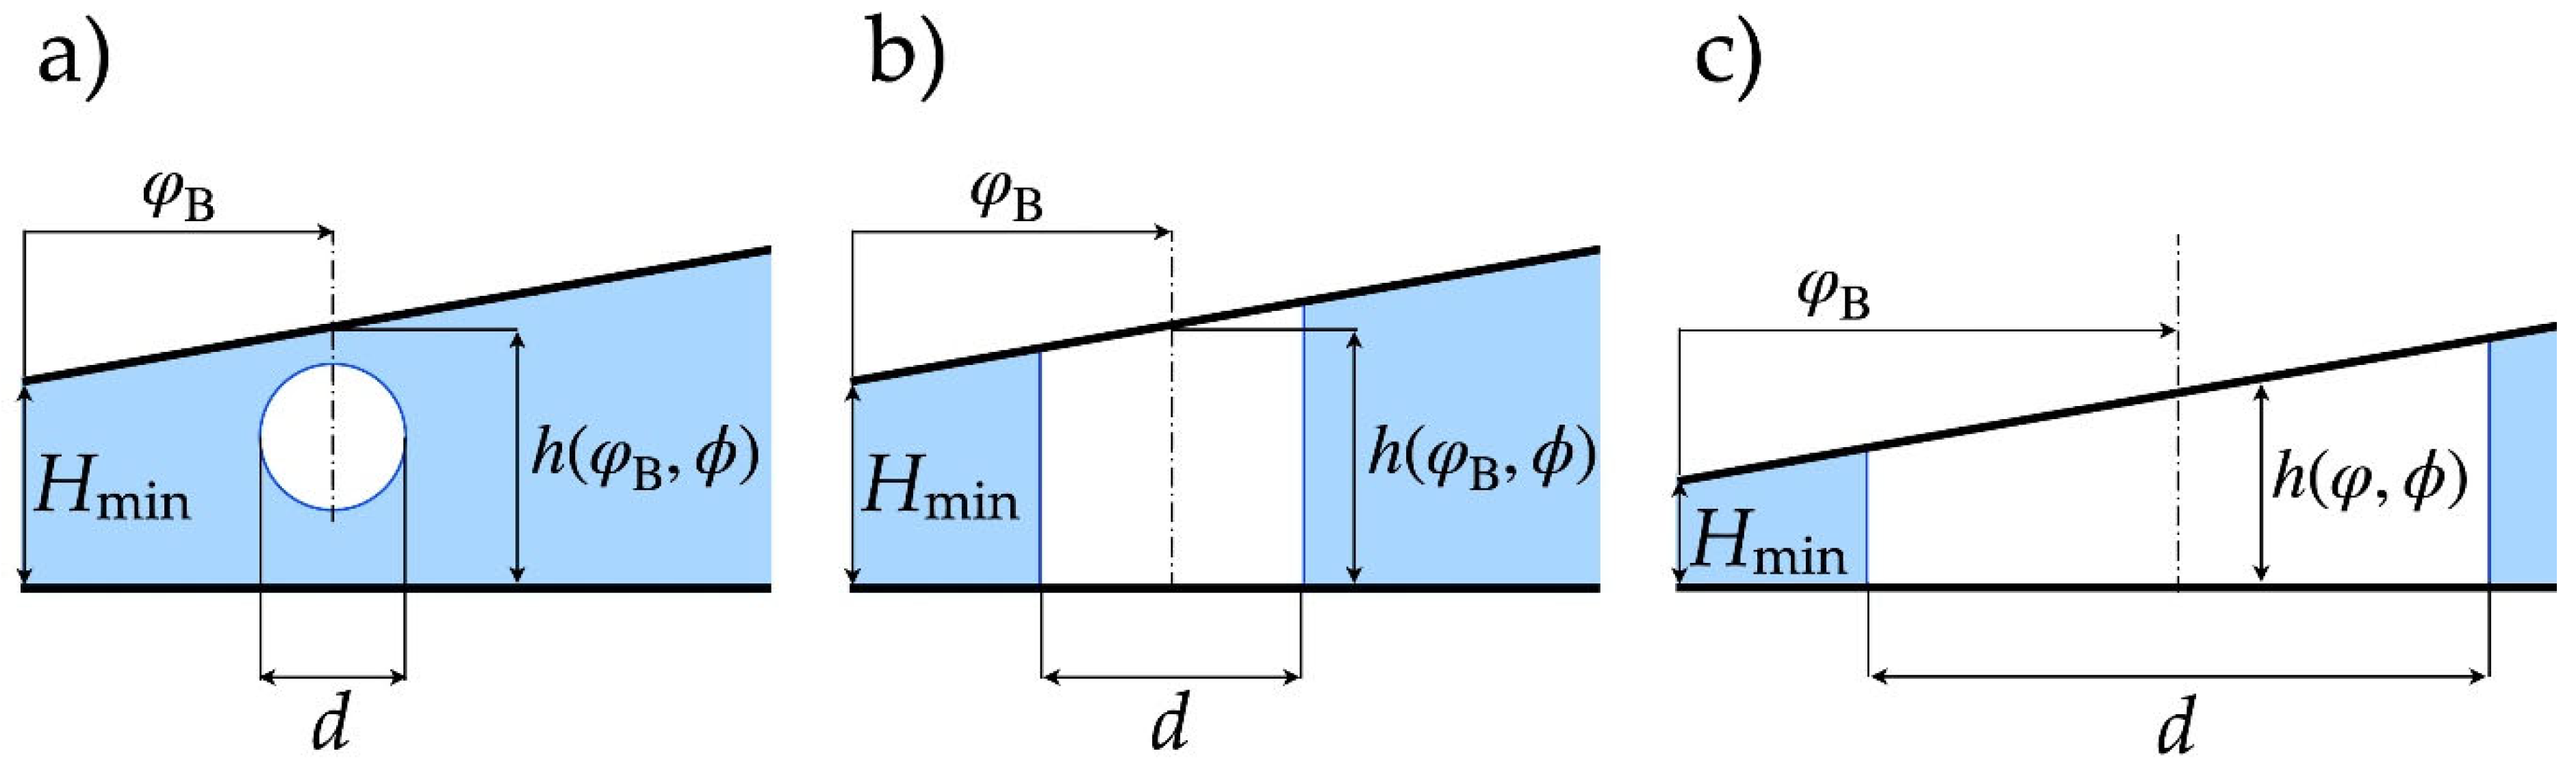
local, transient film thickness
h ˙ displacement velocity
h min momentary minimal fluid film thickness
h min rigid minimal fluid film thickness
Δ h min elastic change of fluid film thickness
m ¯ density averaged fluid mass
M ˙ + mass flow per unit volume during expansion
m ˙ + mass flow during expansion
M ˙ mass flow per unit volume during shrinking
m g mass of released gas
m l liquid mass
p local pressure
p g equilibrium pressure of a gas dissolved in the liquid
p v vapor pressure
Δ p pressure difference
R 1 radius of inner cylinder
R 2 radius of cavity
R e Reynolds number
t time
u fluid velocity
V B bubble volume
V g gaseous volume
V tot time-dependent volume
x , y , z coordinates
Greek Symbols
α volume fraction
β lateral displacement of minimum film thickness
β resulting lateral displacement of minimum film thickness
Δ β elastic lateral displacement of minimum film thickness
γ normalized gaseous volume
ε 0 relative static eccentricity
ε 1 relative dynamic eccentricity
λ eccentricity ratio
ν kinematc viscosity
μ 0 dynamic viscosity
ρ local density
ρ 0 reference density
ρ g gas density
ρ l liquid density
φ Sommerfeld angle
ϕ rotational angle
Ψ normalized clearance
ω 1 rotational speed of inner cylinder
Mathematical Operators
nabla operator
sgn signum function
Δ difference

References

  1. Wilson, R.W. Cavitation damage in plane bearings. In Cavitation and Related Phenomena in Lubrication, Proceedings of the 1st Leeds-Lyon Symposium on Tribology, Leeds, UK, 14–17 September 1974; Dowson, D., Godet, M., Taylor, C.M., Eds.; Mechanical Engineering Publications Ltd.: London, UK, 1975; pp. 177–184. ISBN 0-85298-324-7. [Google Scholar]
  2. Borbe, P.C. Beitrag zur Werkstoffzerstörung durch Strömungskavitation in Kalten und Warmen Brauchwässern. Ph.D. Thesis, Universität Hannover, Hannover, Germany, 1968. [Google Scholar]
  3. Mottyll, S. Numerical 3D Flow Simulation of Cavitation at Ultrasonic Horns and Assessment of Flow Aggressiveness, Erosion Sensitive Wall Zones and Incubation Time. Ph.D. Thesis, Ruhr-Universität Bochum, Bochum, Germany, 2017. [Google Scholar]
  4. Peters, A. Numerical Modelling and Prediction of Cavitation Erosion Using Euler-Euler and Multi-Scale Euler-Lagrange Methods. Ph.D. Thesis, Universität Duisburg-Essen, Duisburg, Germany, 2019. [Google Scholar]
  5. Peters, A.; El Moctar, O. Numerical assessment of cavitation-induced erosion using a multi-scale Euler–Lagrange method. J. Fluid Mech. 2020, 894, 1–53. [Google Scholar] [CrossRef]
  6. Lyu, X.; Zhu, Y.; Zhang, C.; Hu, X.; Adams, N.A. Modeling of Cavitation Bubble Cloud with Discrete Lagrangian Tracking. Water 2021, 13, 2684. [Google Scholar] [CrossRef]
  7. Rosenberg, M.D. Gaseous-Type Cavitation in Liquids; Acoustic Research Laboratory Harvard University: Havard, MA, USA, 1953. [Google Scholar]
  8. Graf, G.; Kollmann, K. Untersuchungen der Hauptlager eines 8-Zylinder-4-Takt-Schiffsdieselmotors. In FVV-Forschungsbericht; Nr. 2-211/10; FVV: Frankfurt am Main, Germany, 1964; pp. 1–69. [Google Scholar]
  9. Dowson, D.; Taylor, C.M. Cavitation in Bearings. Annu. Rev. Fluid Mech. 1979, 11, 35–65. [Google Scholar] [CrossRef]
  10. Braun, M.J.; Hendricks, R.C. An Experimental Investigation of the Vaporous/Gaseous Cavity Characteristics of an Eccentric Journal Bearing. ASLE Trans. 1984, 27, 1–14. [Google Scholar] [CrossRef]
  11. Brewe, D.E. Theoretical Modeling of the Vapor Cavitation in Dynamically Loaded Journal Bearings. J. Tribol. 1986, 108, 628–637. [Google Scholar] [CrossRef] [Green Version]
  12. Sun, D.C.; Brewe, D.E. A High Speed Photography Study of Cavitation in a Dynamically Loaded Journal Bearing. J. Tribol. 1991, 113, 287–292. [Google Scholar] [CrossRef]
  13. Leonard, B.; Sadeghi, F.; Cipra, R. Gaseous Cavitation and Wear in Lubricated Fretting Contacts. Tribol. Trans. 2008, 51, 351–360. [Google Scholar] [CrossRef]
  14. Xing, C. Analysis of the Characteristics of a Squeeze Film Damper by Three-Dimensional Navier-Stokes-Equations: A Numerical Approach and Experimental Validation. Ph.D. Thesis, University of Akron, Akron, OH, USA, 2009. [Google Scholar]
  15. Braun, M.J.; Hannon, W.M. Cavitation formation and modelling for fluid film bearings: A review. Proc. Inst. Mech. Eng. Part J J. Eng. Tribol. 2010, 224, 839–863. [Google Scholar] [CrossRef]
  16. Osterland, S.; Müller, L.; Weber, J. Influence of Air Dissolved in Hydraulic Oil on Cavitation Erosion. Int. J. Fluid Power 2021, 2021, 373–392. [Google Scholar] [CrossRef]
  17. Chen, Y.L.; Israelachvili, J. New Mechanism of Cavitation Damage. Science 1991, 252, 1157–1160. [Google Scholar] [CrossRef]
  18. Zhou, J.; Vacca, A.; Manhartsgruber, B. A Novel Approach for the Prediction of Dynamic Features of Air Release and Absorption in Hydraulic Oils. J. Fluids Eng. 2013, 135, 091305. [Google Scholar] [CrossRef]
  19. Pendovski, D.; Pischinger, S. Dynamic Oil Pressure in Connecting Rod Bearings and Their Influence on Innovative Cranktrain Technologies; SAE International: Warrendale, PA, USA, 2019. [Google Scholar] [CrossRef]
  20. Reinke, P.; Schmidt, M.; Beckmann, T. Advanced Model Experiment for the Research of Journal Bearings with Cavitation; SAE International: Warrendale, PA, USA, 2019. [Google Scholar] [CrossRef]
  21. Gläser, H. Schäden an Gleit-und Wälzlagerungen, 1st ed.; Verlag Technik: Berlin, Germany, 1990; ISBN 978-3-3410-0798-3. [Google Scholar]
  22. Garner, D.R.; James, R.D.; Warriner, J.F. Cavitation Erosion Damage in Engine Bearings: Theory and Practice. J. Eng. Power 1980, 102, 847–857. [Google Scholar] [CrossRef]
  23. Engel, U. Schäden an Gleitlagern in Kolbenmaschinen. In Schäden an Geschmierten Maschinenelementen: Gleitlager, Wälzlager, Zahnräder, 2nd ed.; Bartz, W., Ed.; Expert-Verlag: Renningen, Germany, 1992; pp. 364–365. ISBN 978-3-8169-0255-3. [Google Scholar]
  24. Reinke, P.; Ahlrichs, J.; Beckmann, T.; Schmidt, M. Bubble Dynamics in a Narrow Gap Flow under the Influence of Pressure Gradient and Shear Flow. Fluids 2020, 5, 208. [Google Scholar] [CrossRef]
  25. Kahlert, W. Untersuchungen über den Einfluß der Trägheitskräfte bei der Hydrodynamischen Schmiermitteltheorie. Ph.D. Thesis, Technical University Braunschweig, Braunschweig, Germany, 1946. [Google Scholar]
  26. Reinke, P.; Schmidt, M.; Beckmann, T. The cavitating Taylor-Couette flow. Phys. Fluids 2018, 30, 104101. [Google Scholar] [CrossRef]
  27. Eagles, P.; Stuart, J.T.; Diprima, R.C. The effects of eccentricity on torque and load in Taylor-vortex flow. J. Fluid Mech. 1978, 87, 209–231. [Google Scholar] [CrossRef]
  28. DiPrima, R.C. A Note on the Stability of Flow in Loaded Journal Bearings. ASLE Trans. 1963, 6, 249–253. [Google Scholar] [CrossRef]
  29. Ferziger, J.H.; Perić, M. Numerische Strömungsmechanik, 1st ed.; Springer: Berlin/Heidelberg, Germany, 2008; pp. 460–472. ISBN 978-3-540-67586-0. [Google Scholar]
  30. Sauer, J. Instationär Kavitierende Strömungen—Ein Neues Modell, Basierend auf Front Capturing (VoF) und Blasendynamik. Ph.D. Thesis, Universität Karlsruhe, Karlsruhe, Germany, 2000. [Google Scholar]
  31. Schnerr, G.H.; Sauer, J. Physical and numerical modelling of unsteady cavitation dynamics. In Proceedings of the 4th International Conference on Multiphase Flow, New Orleans, LA, USA, 27 May–1 June 2001; Michaelides, E.E., Ed.; Elsevier: New Orleans, LA, USA, 2002; Volume 1, p. 12. [Google Scholar]
Figure 1. Experiment: Couette apparatus consisting of cylinder 1 rotating inside the transparent cavity 2, motor 3, linear traversing guide 4, rocker mechanism 5 and actuator 6 for radial displacement.
Fluids 07 00159 g001
Figure 2. Optical access into the fluid film; viewing area located downstream of minimum film thickness.
Fluids 07 00159 g002
Figure 3. Main parameters of experiment and Couette flow.
Fluids 07 00159 g003
Figure 4. Elastic behavior of the Couette apparatus: rigid system vs. elastic system [24] with increased film thickness Δ h min and elastic lateral displacement of minimum film thickness Δ β at steady state with constant rotating speed ω 1 .
Fluids 07 00159 g004
Figure 5. Elastic behavior of the Couette apparatus: rigid system vs. elastic system with increased film thickness Δ h min and elastic lateral displacement of minimum film thickness Δ β during the introduction of a radial displacement of the cavity 2 while the cylinder 1 rotates with constant rotating speed ω 1 .
Fluids 07 00159 g005
Figure 6. Stability diagram of the Taylor–Couette flow developed from Reinke et al. [26].
Fluids 07 00159 g006
Figure 7. Phases of bubble growth in a narrow gap flow: (a) inception phase with gaseous cavitation, (b) interim phase with a combination of gaseous and pseudo-cavitation, (c) final phase of bubble growth with solely pseudo-cavitation.
Fluids 07 00159 g007
Figure 8. Bubble size in relation to local film thickness during phase 1, rotational angle ϕ = 183.5 ° after initiation of transient radial displacement, inception of bubbles by solely gas cavitation, fluid: paraffin containing 100% dissolved air.
Fluids 07 00159 g008
Figure 9. Bubble size in relation to local film thickness during phase 2, rotational angle ϕ = 185.0 ° after initiation of transient radial displacement, simultaneous gas and pseudo-cavitation, fluid: paraffin containing 100% dissolved air.
Fluids 07 00159 g009
Figure 10. Bubble size in relation to local film thickness during phase 3—final stage of bubble increase, rotational angle ϕ = 186.3 ° after initiation of transient radial displacement, solely pseudo-cavitation, fluid: paraffin containing 100% dissolved air.
Fluids 07 00159 g010
Figure 11. Bubble size in relation to local film thickness with decreasing bubble volume, rotational angle ϕ = 188.5 ° after initiation of transient radial displacement, solely pseudo-cavitation, fluid: paraffin containing 100% dissolved air.
Fluids 07 00159 g011
Figure 12. Phase 1: inception of bubbles by solely gas cavitation, rotational angle ϕ = 183.5 ° after initiation of transient radial displacement, fluid: paraffin containing 100% dissolved air.
Fluids 07 00159 g012
Figure 13. Phase 2: bubble growth due to simultaneous gas and pseudo-cavitation, rotational angle ϕ = 185.0 ° after initiation of transient radial displacement, fluid: paraffin containing 100% dissolved air.
Fluids 07 00159 g013
Figure 14. Phase 3: bubble growth by solely pseudo-cavitation, rotational angle ϕ = 186.3 ° after initiation of transient radial displacement, fluid: paraffin containing 100% dissolved air.
Fluids 07 00159 g014
Figure 15. Bubbles decreasing in size by solely pseudo-cavitation, rotational angle ϕ = 188.5 ° after initiation of transient radial displacement, fluid: paraffin containing 100% dissolved air.
Fluids 07 00159 g015
Figure 16. Description of the process of deducing the mass flow rate for bubble growth after initiation of transient radial displacement, fluid: paraffin containing 100% dissolved air.
Fluids 07 00159 g016
Figure 17. Mass flow rate for bubble growth and total mass of released gas after initiation of transient radial displacement, fluid: paraffin containing 100% dissolved air.
Fluids 07 00159 g017
Figure 18. Empirical parameters according to Schneer–Sauer model for bubble growth (gas release) and bubble decrease (absorption) after initiation of transient radial displacement, fluid: paraffin containing 100% dissolved air.
Fluids 07 00159 g018
Figure 19. Empirical parameters according to Schneer–Sauer model for bubble growth after initiation of transient radial displacement in relation to volume of dissolved air, fluid: paraffin.
Fluids 07 00159 g019
Table 1. Cavitation overview.
IssueHydraulic SystemsLubricant Films
fluidwateroil
viscositylowhigh
compressibilityyes, mixture of water and gas bubbles [6]no
type of flowturbulent (Re > 2000)Stokes flow (Re · Ψ < 1)
dissolved gasnegligible [4]relevant [10,16,18,19]
dimensions3D isometric domain
characteristic length >> bubble diameter
2D domain
film thickness ≈ bubble diameter
variability of fluid domainnoyes, dynamic displacement of adjacent walls
type of cavitationtype is defined by the bubble formation in the fluid: cloud, sheet, line, according to [4,6]type is related to bearing failure assessment [21,22,23]:
suction cavitation
exit cavitation
impact cavitation
flow cavitation
indicator for material erosionpressure fluctuations, unsteady condition of bubble distribution [4,5,6]dynamic increase in fluid film thickness caused by the displacement of adjacent walls [8]
form of cavitationfull cavitation
partial cavitation
inertia cavitation
gaseous cavitation
vaporous cavitation
pseudo-cavitation [14]
Table 2. Physical parameters of the experiment.
SymbolValueDefinitionDescription
B 111.0 mm cylinder height
E 0 3.417 mm static eccentricity
E 1 0.030 mm dynamic eccentricity
H 0 3.62 mm R 2 R 1 clearance between cylinder and cavity
H min 0.173 mm R 2 R 1 E 0 E 1 absolute minimal fluid film thickness
R 1 146.44 mm radius of inner cylinder
R 2 150.06 mm radius of cavity
ε 0 94.40% E 0 H 0 relative static eccentricity
ε 1 0.83% E 1 H 0 relative dynamic eccentricity
λ 0.88% E 1 E 0 eccentricity ratio
Ψ 2.47% H 0 R 1 normalized clearance
ω 1 12.6 1/s rotational speed of inner cylinder
Re30.7 ω 1 R 1 2 Ψ ρ 0 μ 0 Reynolds number
Properties of Paraffin at 20 °C
ρ 0 874 kg/m3 density
μ 0 190 mPa s dynamic viscosity
ν 217 mm2/s kinematic viscosity
Publisher’s Note: MDPI stays neutral with regard to jurisdictional claims in published maps and institutional affiliations.

