Article

A Hydrodynamic Analog of the Casimir Effect in Wave-Driven Turbulent Flows

by
Mahdi Davoodianidalik
1,
Hamid Kellay
2 and
Nicolas Francois
1,3,*
1
Research School of Physics, The Australian National University, Canberra 2601, ACT, Australia
2
Laboratoire Ondes et Matiere d’Aquitaine, UMR 5798, CNRS, Universite de Bordeaux, 33405 Talence, France
3
ARC Training Centre for M3D Innovation, Research School of Physics, The Australian National University, Canberra 2601, ACT, Australia
*
Author to whom correspondence should be addressed.
Fluids 2022, 7(5), 155; https://doi.org/10.3390/fluids7050155
Submission received: 15 March 2022 / Revised: 19 April 2022 / Accepted: 19 April 2022 / Published: 27 April 2022
(This article belongs to the Special Issue Nonlinear Wave Hydrodynamics, Volume II)

Abstract

:
We present experimental results on a fluctuation-induced force observed in Faraday wave-driven turbulence. As recently reported, a long-range attraction force arises between two walls that confine the wave-driven turbulent flow. In the Faraday waves system, the turbulent fluid motion is coupled with the disordered wave motion. This study describes the emergence of the fluctuation-induced force from the viewpoint of the wave dynamics. The wave amplitude is unaffected by the confinement while the wave erratic motion is. As the wall spacing decreases, the wave motion becomes less energetic and more anisotropic in the cavity formed by the walls, giving rise to a stronger attraction. These results clarify why the modelling of the attraction force in this system cannot be based on the wave amplitude but has to be built upon the wave-fluid motion coupling. When the wall spacing is comparable to the wavelength, an intermittent wave resonance is observed, and it leads to a complex short-range interaction. These results contribute to the study of aggregation processes in the presence of turbulence and its related problems such as the accumulation of plastic debris in coastal marine ecosystems or the modelling of planetary formation.

1. Introduction

An interaction force might arise between two walls that locally confine a fluctuating medium. The generation of such force depends on the way that the fluctuations of the medium are modified by the presence of the walls [1]. The seminal work of Casimir describes the emergence of an attractive force between two conducting plates confining the quantum fluctuations of the electromagnetic field [2]. Analog effects to the Casimir force, also called fluctuation-induced forces, have been observed in numerous systems spanning from the quantum to macroscopic scale, and showing fluctuations of very diverse nature in equilibrium or in non-equilibrium conditions [3,4,5,6,7,8,9].
Hydrodynamic turbulence is a classic example of a chaotic motion observed in macroscopic flows [10]. Turbulent fluctuations are usually conceived as eddies mingling with each other, in a process that transfers kinetic energy over a broad range of scales [11]. This transfer of energy is dominated by the fluid inertia and referred to as the energy cascade. The interaction of turbulent eddies with solid boundaries is an active domain of research. Interesting discoveries concern the control of turbulence by its destabilisation in pipe flows [12], the existence of a relation linking the turbulent energy spectrum and wall friction drag [13,14], and the turbulence-driven propulsion [15,16,17]. Recent numerical studies have shed light on the existence of fluctuation-induced forces between two walls locally confining ideal hydrodynamic turbulence [18]. Experimental evidence of an attraction force mediated via turbulent fluctuations was reported in Faraday wave-driven turbulence [19].
Faraday waves are nonlinear parametrically excited waves observed at a liquid surface [20]. In highly dissipative fluids, these waves can self-organise into various motifs which have been extensively studied [21,22,23,24,25,26,27]. Such analysis based on the viewpoint of wave patterns is very fruitful; however, there are reasons to study the motion of the fluid particles of which the Faraday waves are comprised, i.e., to study wave-driven flows in this wave system. On one hand, relating the dynamic of nonlinear waves to the underlying fluid motion is a notoriously difficult problem of free surface hydrodynamics [28,29,30]. On the other hand, Faraday waves produce an erratic fluid motion at the surface of weakly viscous liquids [31,32,33]. It has been shown that those wave-driven turbulent flows resemble in many respects two-dimensional (2D) turbulence [34,35,36]. A mechanism has been uncovered that explains the unexpected emergence of 2D turbulence in this system: the energy initially injected into the vertical motion of the wave is converted into chaotic horizontal fluid motion via the generation and interaction of horizontal surface vortices [37,38,39]. In fully developed turbulence, it was shown that the turbulent fluid motion is directly coupled with the disordered wave motion [40].
In a previous study, a force mediated via turbulent fluctuations was reported and studied from the viewpoint of the wave-driven turbulent flow [19]. This long-range interaction depends on several features of the confined turbulent flow: its kinetic energy, its anisotropy and the energy injection rate. The attraction mechanism was shown to rely on the coupling of the cavity with coherent flow structures resembling meandering rivers.
Here, we exploit the coupling of the wave horizontal motion and turbulent flow in the Faraday waves to present original results describing the fluctuation-induced force from the viewpoint of the wave dynamics. The attraction force is directly related to the reduction and growing anisotropy of the turbulent wave agitation in the bounded region. The wave chaotic motion depends directly on the kinetic energy of the confined turbulent flow, and it is not simply related to the wave amplitude. We discuss how these findings offer new insights into the modelling of Casimir-like effects induced by turbulent waves. For the narrowest cavities studied, the relation between the wave motion and the wave-driven flows becomes complex due to a wave resonance; in that case, the presence of the attraction force is better understood from the flow viewpoint.

2. Materials and Methods

2.1. Generation of Faraday Waves and Wave-Driven Flows

Faraday waves are nonlinear parametrically excited waves that appear at the surface of a liquid vertically shaken [20]. The waves are generated in a circular container with an inner diameter of 290 mm. The container is filled with water up to its brim (the contact line is pinned to the wall edge with no meniscus, and the water depth is 85 mm). The container is vertically vibrated by a computer-controlled electrodynamic shaker. The forcing is monochromatic with a frequency set at f s = 60 Hz. At this frequency, the Faraday wavelength is λ = 8.8 mm. The vertical acceleration a is fixed at a = 1 g. The onset of the Faraday wave instability is observed at a t = 0.5 g.
At the surface of water, Faraday waves produce horizontal chaotic flows. The low viscosity of water enables the observation of these chaotic flows at relatively low values of the acceleration a above the threshold a t . The wave-driven turbulent motion shows Gaussian velocity statistics, it has no mean flow component and its dynamics is slow compared to the wave frequency. This wave-driven turbulence shows striking similarities with 2D turbulence [34,39,41,42]. Different aspects of the transfer of energy and enstrophy in this system have been studied [34,35,39,43,44,45]. One essential aspect is the presence at the fluid surface of an inverse energy cascade, or the transfer of energy from an intermediate forcing length scale L f towards larger length scales. This process determines the kinetic energy U f 2 of the horizontal flow. It is fueled by the generation and nonlinear interaction of horizontal vortices whose size is L f = λ / 2 , where λ is the Faraday wavelength [37,38]. In these experiments, the Faraday wavelength is set to λ = 8.8 mm. The energy injection rate ϵ in the horizontal turbulent flow is controlled by the vertical acceleration a imposed by the shaker [46]. One essential feature of this wave-flow system is the coupling of the 2D turbulent flow with the chaotic wave motion [40].

2.2. Characterisation of the Wave Field Topography and of the Wave-Driven Flows

To visualise the surface elevation, we employed the technique of diffusive light imaging. The fluid surface is illuminated by an LED panel placed underneath the transparent bottom of the container; 2 % percent of milk added to water provides sufficient contrast to obtain a high-resolution reconstruction of the topography of the wave field (see Figure 1c,d). In these experiments, the dynamic range of our images (16 bits) allows us to resolve a 20 μm change in the fluid elevation.
The liquid surface is seeded with floating tracers (50 μm diameter) to visualise the horizontal fluid motion. We use surfactant to reduce the particle propensity to aggregate. A high-resolution video camera (Andor Zyla) is used to record the motion of the microscopic fluid tracers. Videos are recorded at a 16-bit resolution and at a high frame rate. The typical field of view is a 8 × 8 cm 2 domain, imaged at 120 Hz with a resolution of 100 μm. Images of particle streaks are used to show qualitatively the turbulent flow field in the cavity (see Figure 1e). This figure has been produced by processing raw images using basic functions of the ImageJ software (version 1.52a), and the trajectories are followed over 4 wave periods. The quantitative data analysis of the flow is performed using particle imaging velocimetry (PIV) and particle tracking velocimetry (PTV) algorithms as described in [37].

2.3. Manufacturing of the Floating Beams

Floating beams are used to confine locally the turbulent flow. The beams are 3D-printed on an Ultimaker 2 printer (Ultimaker B.V., Utrecht, Netherlands) and made of thermoplastic (ABS). The beam dimensions are: length L b = 100 mm, width w b = 10 mm and thickness t b = 2 mm. The ratio of the beam width over the Faraday wavelength is w b / λ 1 . The beams are printed with solid exterior walls and a patterned inner structure. The exterior walls are 2 mm thick. The inner pattern is a honeycomb motif of which the volume fraction can be changed from 25 % to 80 % . This allowed us to adjust the buoyancy of the beam so that, when it is placed on the liquid surface, there is no meniscus on the beam edges. A beam is printed with a 2-mm-diameter hole at each of its extremity. These holes are required to couple the beam to the force probes.

2.4. Force Measurements

In these experiments, we use optical fiber cantilevers as force probes to measure hydrodynamic forces exerted on one of the walls forming the confining cavity. The cavity is formed of two floating beams. One beam is held in place by two rigid posts while the other is connected to two flexible optical fibers (see Figure 1a). Both the posts and fibers pass through holes printed in the beams, and the diameter of the holes is large compared to the diameter of the post and that of the fiber; this ensures that no vertical force is exerted on the beams.
The optical fiber cantilever has been used as a velocimetry probe in turbulent soap film channels [47], and also as a force probe in the context of microscale rheology of flowing polymer solutions [48,49]. Here, this technique is used to measure hydrodynamics attraction force mediated by turbulent fluctuations; in our experiments, these forces are typically in the μ N range. A schematic of the force measurement setup is shown in Figure 1a. The fiber deflection d = W 0 w ( t ) is measured over time, where W 0 is the initial width of the cavity. To ensure accurate measurements of the time-averaged deflection d , the instantaneous gap w ( t ) is measured at a 60 Hz sampling rate for 5 min. The measurement of d gives access to the mean elastic force F e exerted by the fiber cantilever on the moving beam.
The two glass fibers are 75 mm long and have a diameter d f of 125 μm. The deflection d of the fiber is in the range 0.2 mm < d < 20 mm and is measured with a spatial resolution of 0.1 mm. Since the deflection is smaller than the fiber length, we use Hooke’s law to derive the time averaged elastic force exerted by the two fibers: F e = 2 × 3 π E d f 4 d / ( 64 L 3 ) with the Young modulus of glass E = 75 GPa and L = 75 mm the fiber length. (Given these parameters, the inverse of the fiber resonance frequency is smaller than the average time scale of the hydrodynamics fluctuations; therefore, we can neglect fiber inertia effects.) In these conditions, the time averaged elastic force F e balances the hydrodynamic attraction force F acting on the beam.
The features of the fibers (length, diameter) are chosen according to two criteria:
  • a high-resolution measurement of forces typically in the range of (2–200) μN.
  • to ensure the fluctuations of the position of the moving beam are smaller than the mean beam spacing W.
We can measure the evolution of the mean hydrodynamic attraction force F over a broad range of cavity width W by starting each experimental run from a different initial gap W 0 . The fibers are connected to magnetic supports that allow for controlling precisely the value of the initial gap W 0 . Given the geometry of the fiber cantilever and the size of our statistical sampling of the beam position, the resolution of the measurement of the mean attraction force is 1 μN. There is a region in the centre of the container where we could not detect any attraction between an isolated beam and the edge of the container. This region is circular with a diameter of ≈100 mm. This observation allowed us to measure the attraction between the beams and neglect the influence of the finite size of the container by using the following protocol. During an experiment, the moving beam is placed in this central region at the surface of the water while the fixed beam is placed at a distance W 0 away. The smallest attraction force was measured for a beam separation of 90 mm and its magnitude was 3 μN.

3. Results

3.1. Long-Range Attraction Force

We observe that two floating rigid beams placed in the turbulent flow attract each other. To characterise this attraction force, we have used the experimental setup shown in Figure 1a and described in Section 2. The cavity formed by the beams confines the turbulent fluctuations, and it is also dynamically coupled with the external turbulent flow via the moving beam. We investigated the evolution of the hydrodynamic interaction force as the beams are brought closer to each other. Figure 1b shows the interaction force F as a function of the beam spacing W. Both F and W are time-averaged quantities. The force is attractive (positive values) and shows a monotonic increase for decreasing values of the mean gap. The force is detected for beam spacings much larger than the typical autocorrelation length of the unbounded turbulent velocity field, which is ∼ λ / 2 [19,36]. This highlights the long-range nature of the interaction mediated by the turbulent fluctuations. In wave-driven turbulence, there is a strong coupling between the wave horizontal dynamics and the fluid particles dynamics. Figure 1c–e show snapshots capturing the typical topography of the wave field and its flow counterpart, the wave-driven turbulent flow. The typical wave number spectrum of the flow kinetic energy shows a k 5 / 3 scaling, indicating the presence of an energy cascade [37,39].
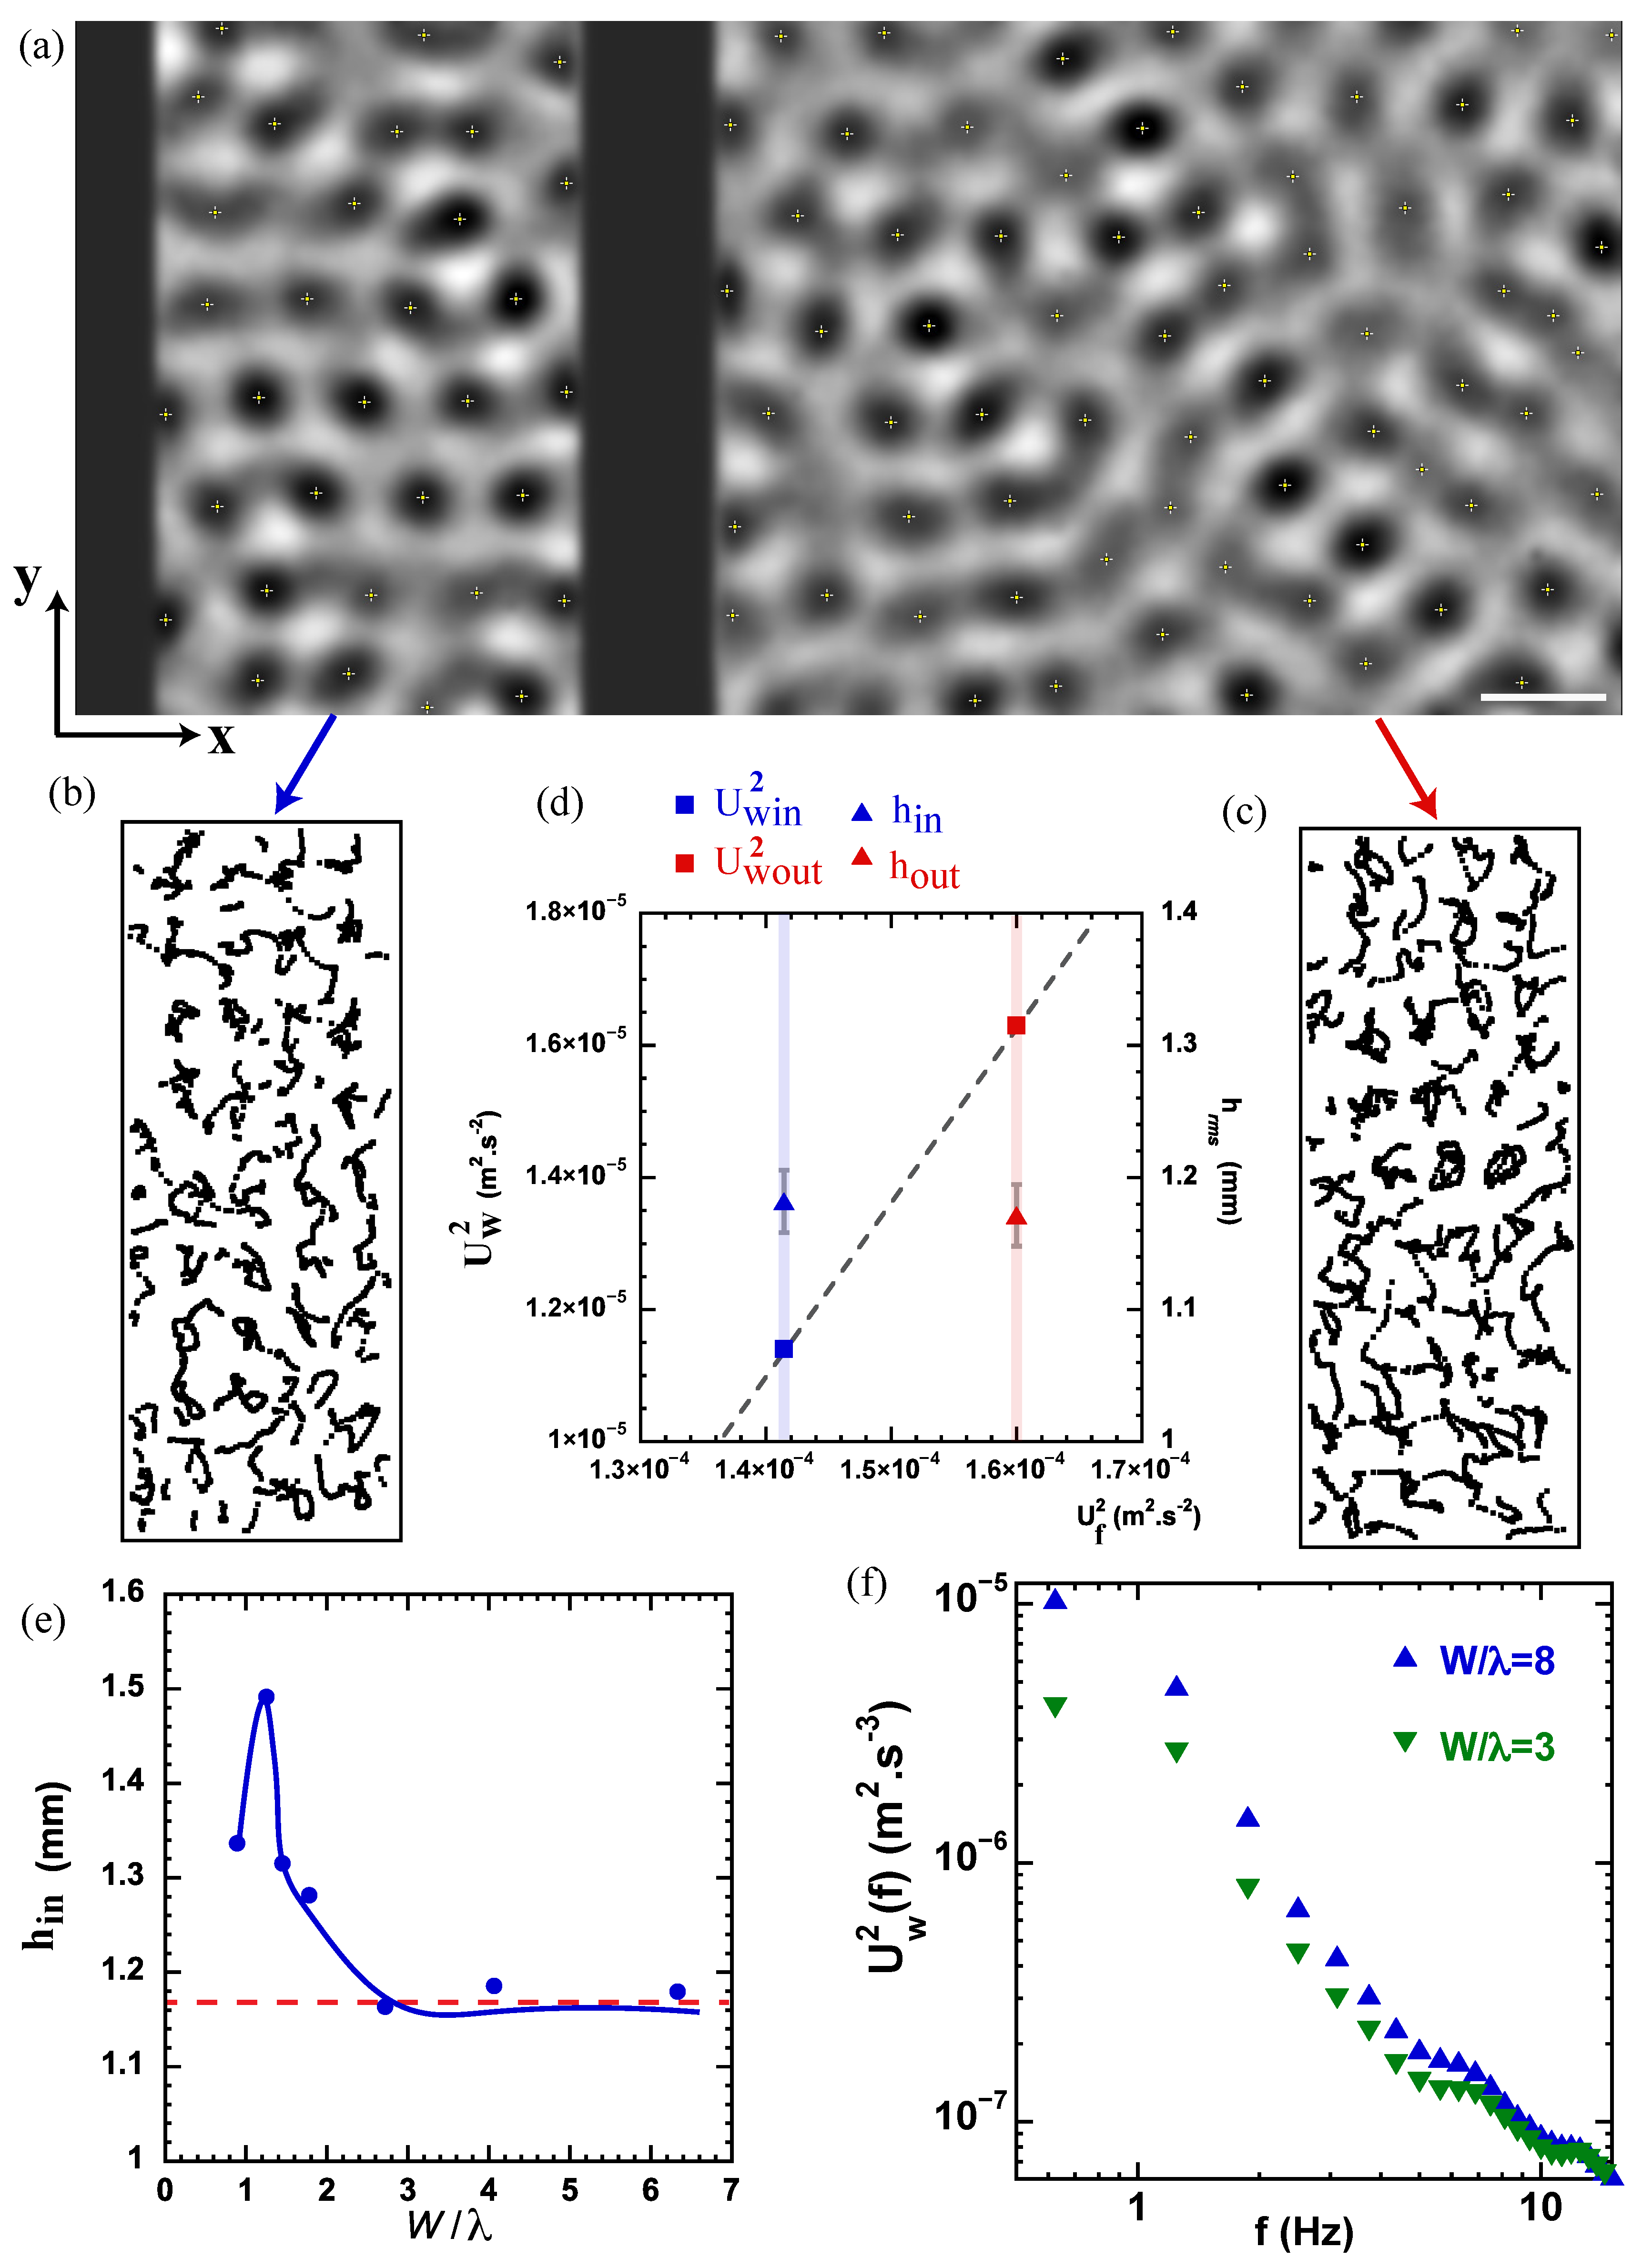
To relate the attraction force to the wave dynamics, several features of the wave field have been measured such as the wave amplitude and the wave horizontal motion (see Figure 2). The r.m.s value of the wave amplitude is measured outside and within the cavity formed by the beams. The statistical averaging of both quantities (r.m.s values called h o u t and h i n , respectively) is computed both over time and space. Figure 2e shows the evolution of h i n as a function of the beam separation W / λ . When the gap is larger than W / λ > 2.5 , the wave amplitude measured within the cavity is identical to that measured in the unconfined domain: h i n h o u t . At smaller beam spacing, h i n becomes larger than h o u t . A peak value of the wave elevation was measured at W / λ 1.2 , and it corresponds to the wave resonance discussed in Section 3.2.
To characterise the horizontal dynamics of the waves, we followed the method described in [40]. We track over time the position of wave peaks (e.g., local maxima of the wave field as shown in Figure 2a). The motion of these maxima is analysed by using particle tracking velocimetry. In a sense, we track the horizontal motion of the local wave phase. Trajectories of the local wave peaks are shown in Figure 2b,c, and those trajectories were measured respectively within and outside the cavity. It clearly appears that the horizontal wave motion is erratic on both sides of the moving beam. When the gap is larger than W / λ > 2.5 , the wave amplitude is unaffected by the confinement, but the wave erratic motion is. This is detected on the variance of the fluctuations of the wave horizontal velocity U w 2 . Figure 2d shows that the turbulent horizontal motion of the wave is weaker in the cavity while the wave elevation measured within and outside the cavity is identical.
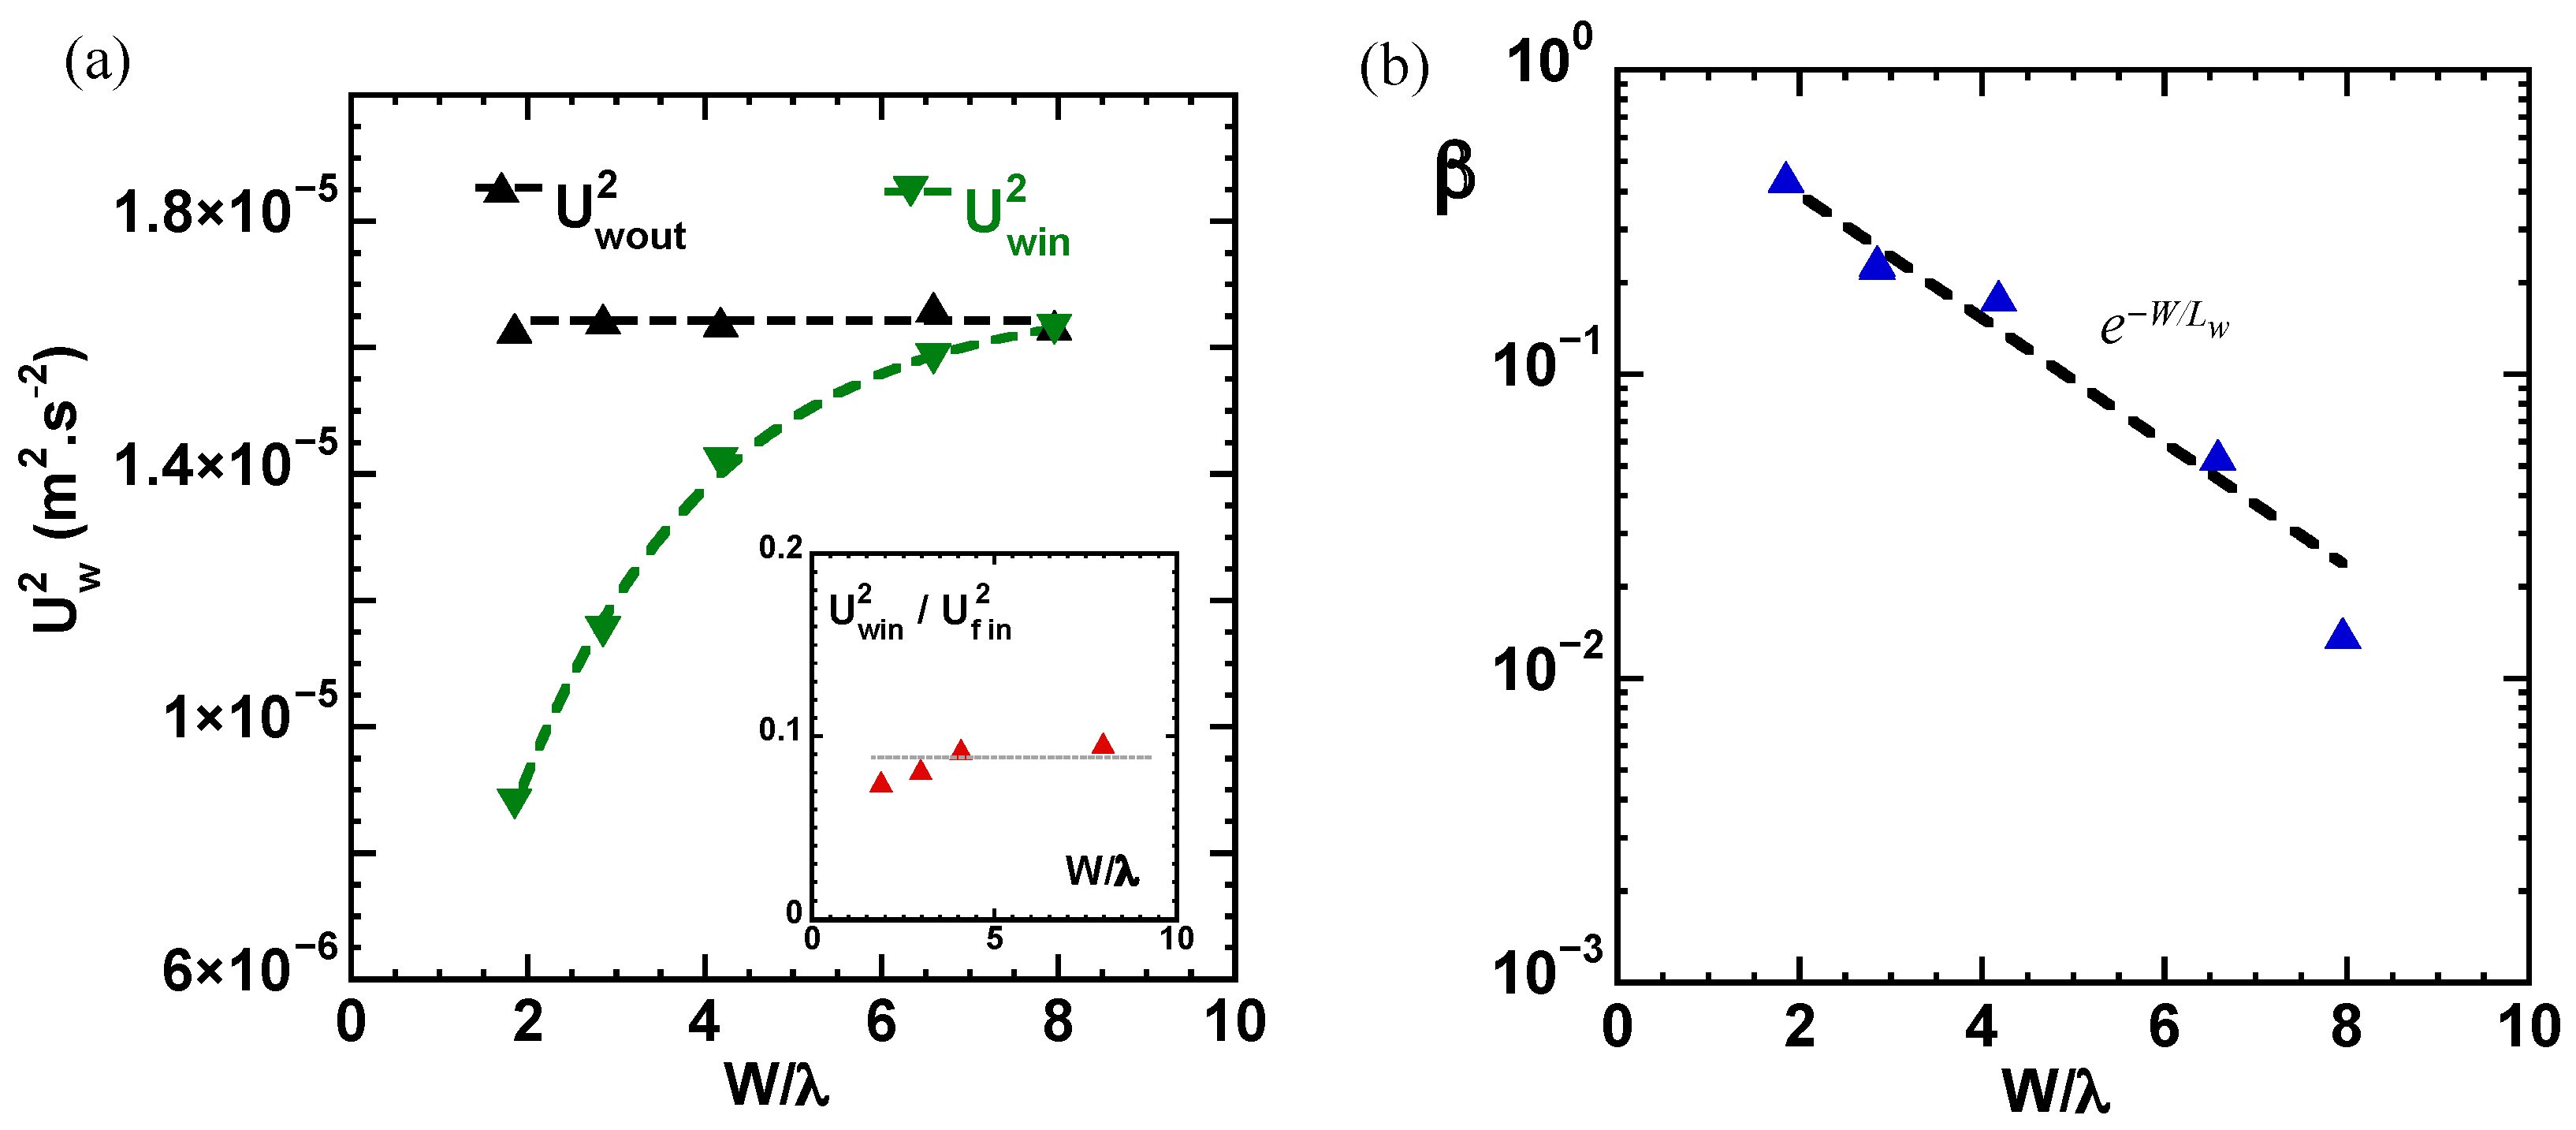
The effect is also identified on the frequency power spectrum of the horizontal wave velocity (see Figure 2f). Such power spectra measured in the unconfined domain present a broad band at frequencies lower than the subharmonic frequency f s / 2 = 30 Hz. This band indicates a transfer of energy towards slower temporal scales and is related to the inverse energy cascade [50]. The energy stored in this low-frequency band is reduced by the geometrical confinement. Figure 3a shows how the total wave kinetic energy U w i n 2 in the bounded domain decreases as the beam spacing W is reduced. In the confined domain, we note (see inset Figure 3a) that the wave kinetic energy U w i n 2 is directly proportional to the turbulent kinetic energy U f i n 2 of the wave-driven flow. This reduction of the energy fluctuations of a wave field invites analogies with Casimir-like effects.
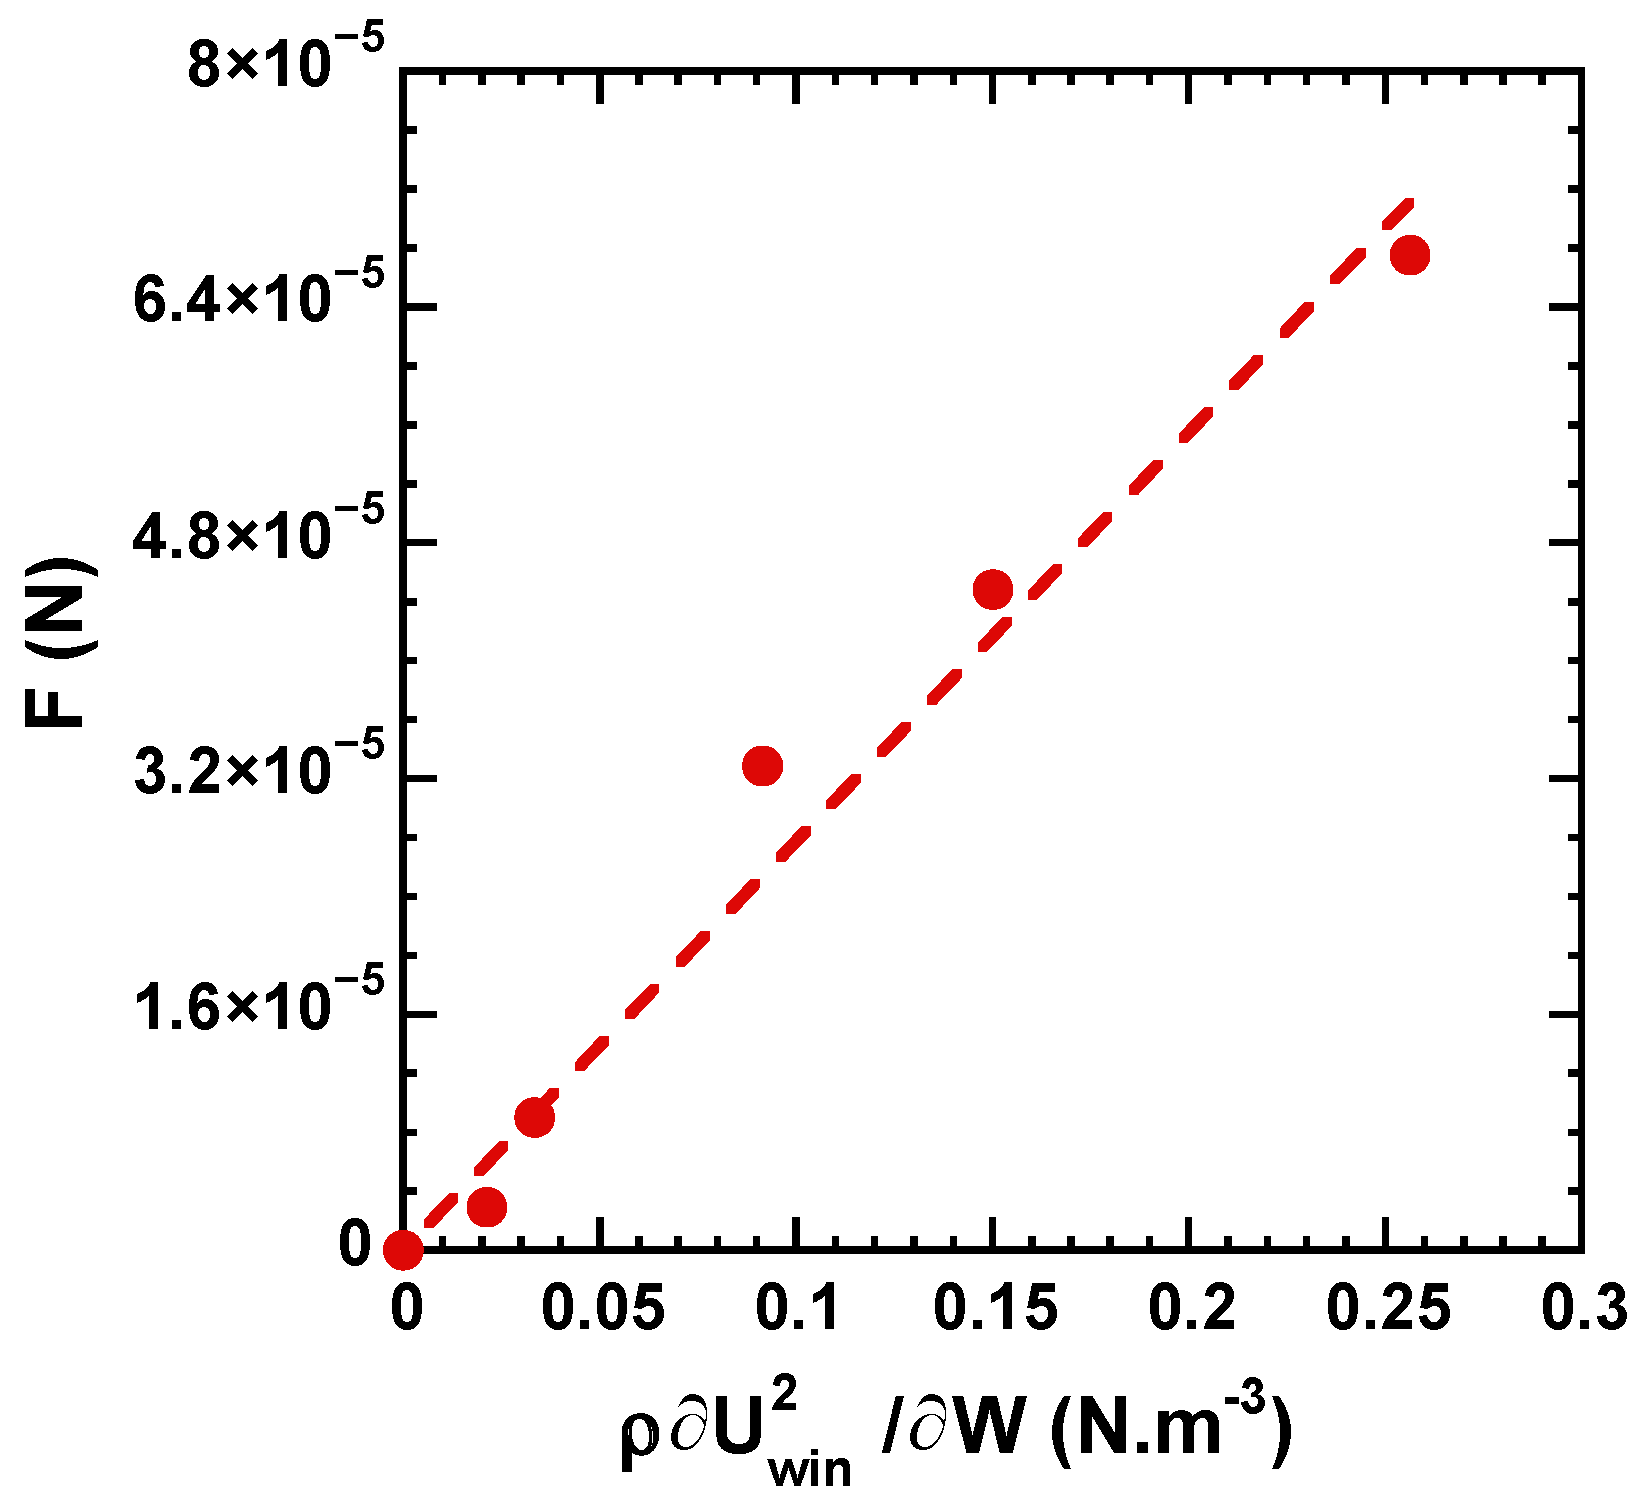
In Figure 4, we compare the force F to the derivative of the wave kinetic energy U w 2 with respect to the separation ρ U w i n 2 / W (which is the typical functional used to describe a Casimir effect [1]). The two quantities are linearly dependent. From the viewpoint of the wave-driven flow, it was shown in [19] that the attraction force appears as a result of both the reduction of kinetic energy and the symmetry breaking of the confined turbulent flow. To quantify the presence of an asymmetry in the wave motion, we use the parameter β = ( U w y 2 U w x 2 ) / U w 2 , which is zero in the unbounded wave field. When computed in the cavity, β increases exponentially with the decrease in the separation as β e x p ( W / L w ) as shown in Figure 3b, where L w is a characteristic length scale. The parameter β characterises quantitatively a reduced activity of the wave motion in the direction transverse to the walls.
On the basis of the model introduced in [19], the attraction force can be modelled as: F t = α A L w ( ρ U w i n 2 / W ) , where A = L b t b is the area of the beam’s vertical cross section and α is a constant factor describing the coupling of the wave dynamics with the turbulent fluid motion. We found α 50 , which originates from two factors: (1) the wave kinetic energy is related to the flow kinetic energy via the relation U w 2 U f 2 / 10 [40], and (2) the length scale L w is roughly five times smaller than the length scale characterising the flow anisotropy [19]. The collisions of the waves with the two sides of the beam produce a momentum transfer. In our modelling, the force reads as F t L w × U w i n 2 / W . The second factor describes the imbalance between the momentum carried by the external waves versus that of the confined waves. The length L w conveys a reduced wave agitation in the direction transverse to the walls and implies a less efficient momentum transfer by the confined waves, giving rise to a stronger attraction.

3.2. Short-Range Interaction at the Faraday Wavelength

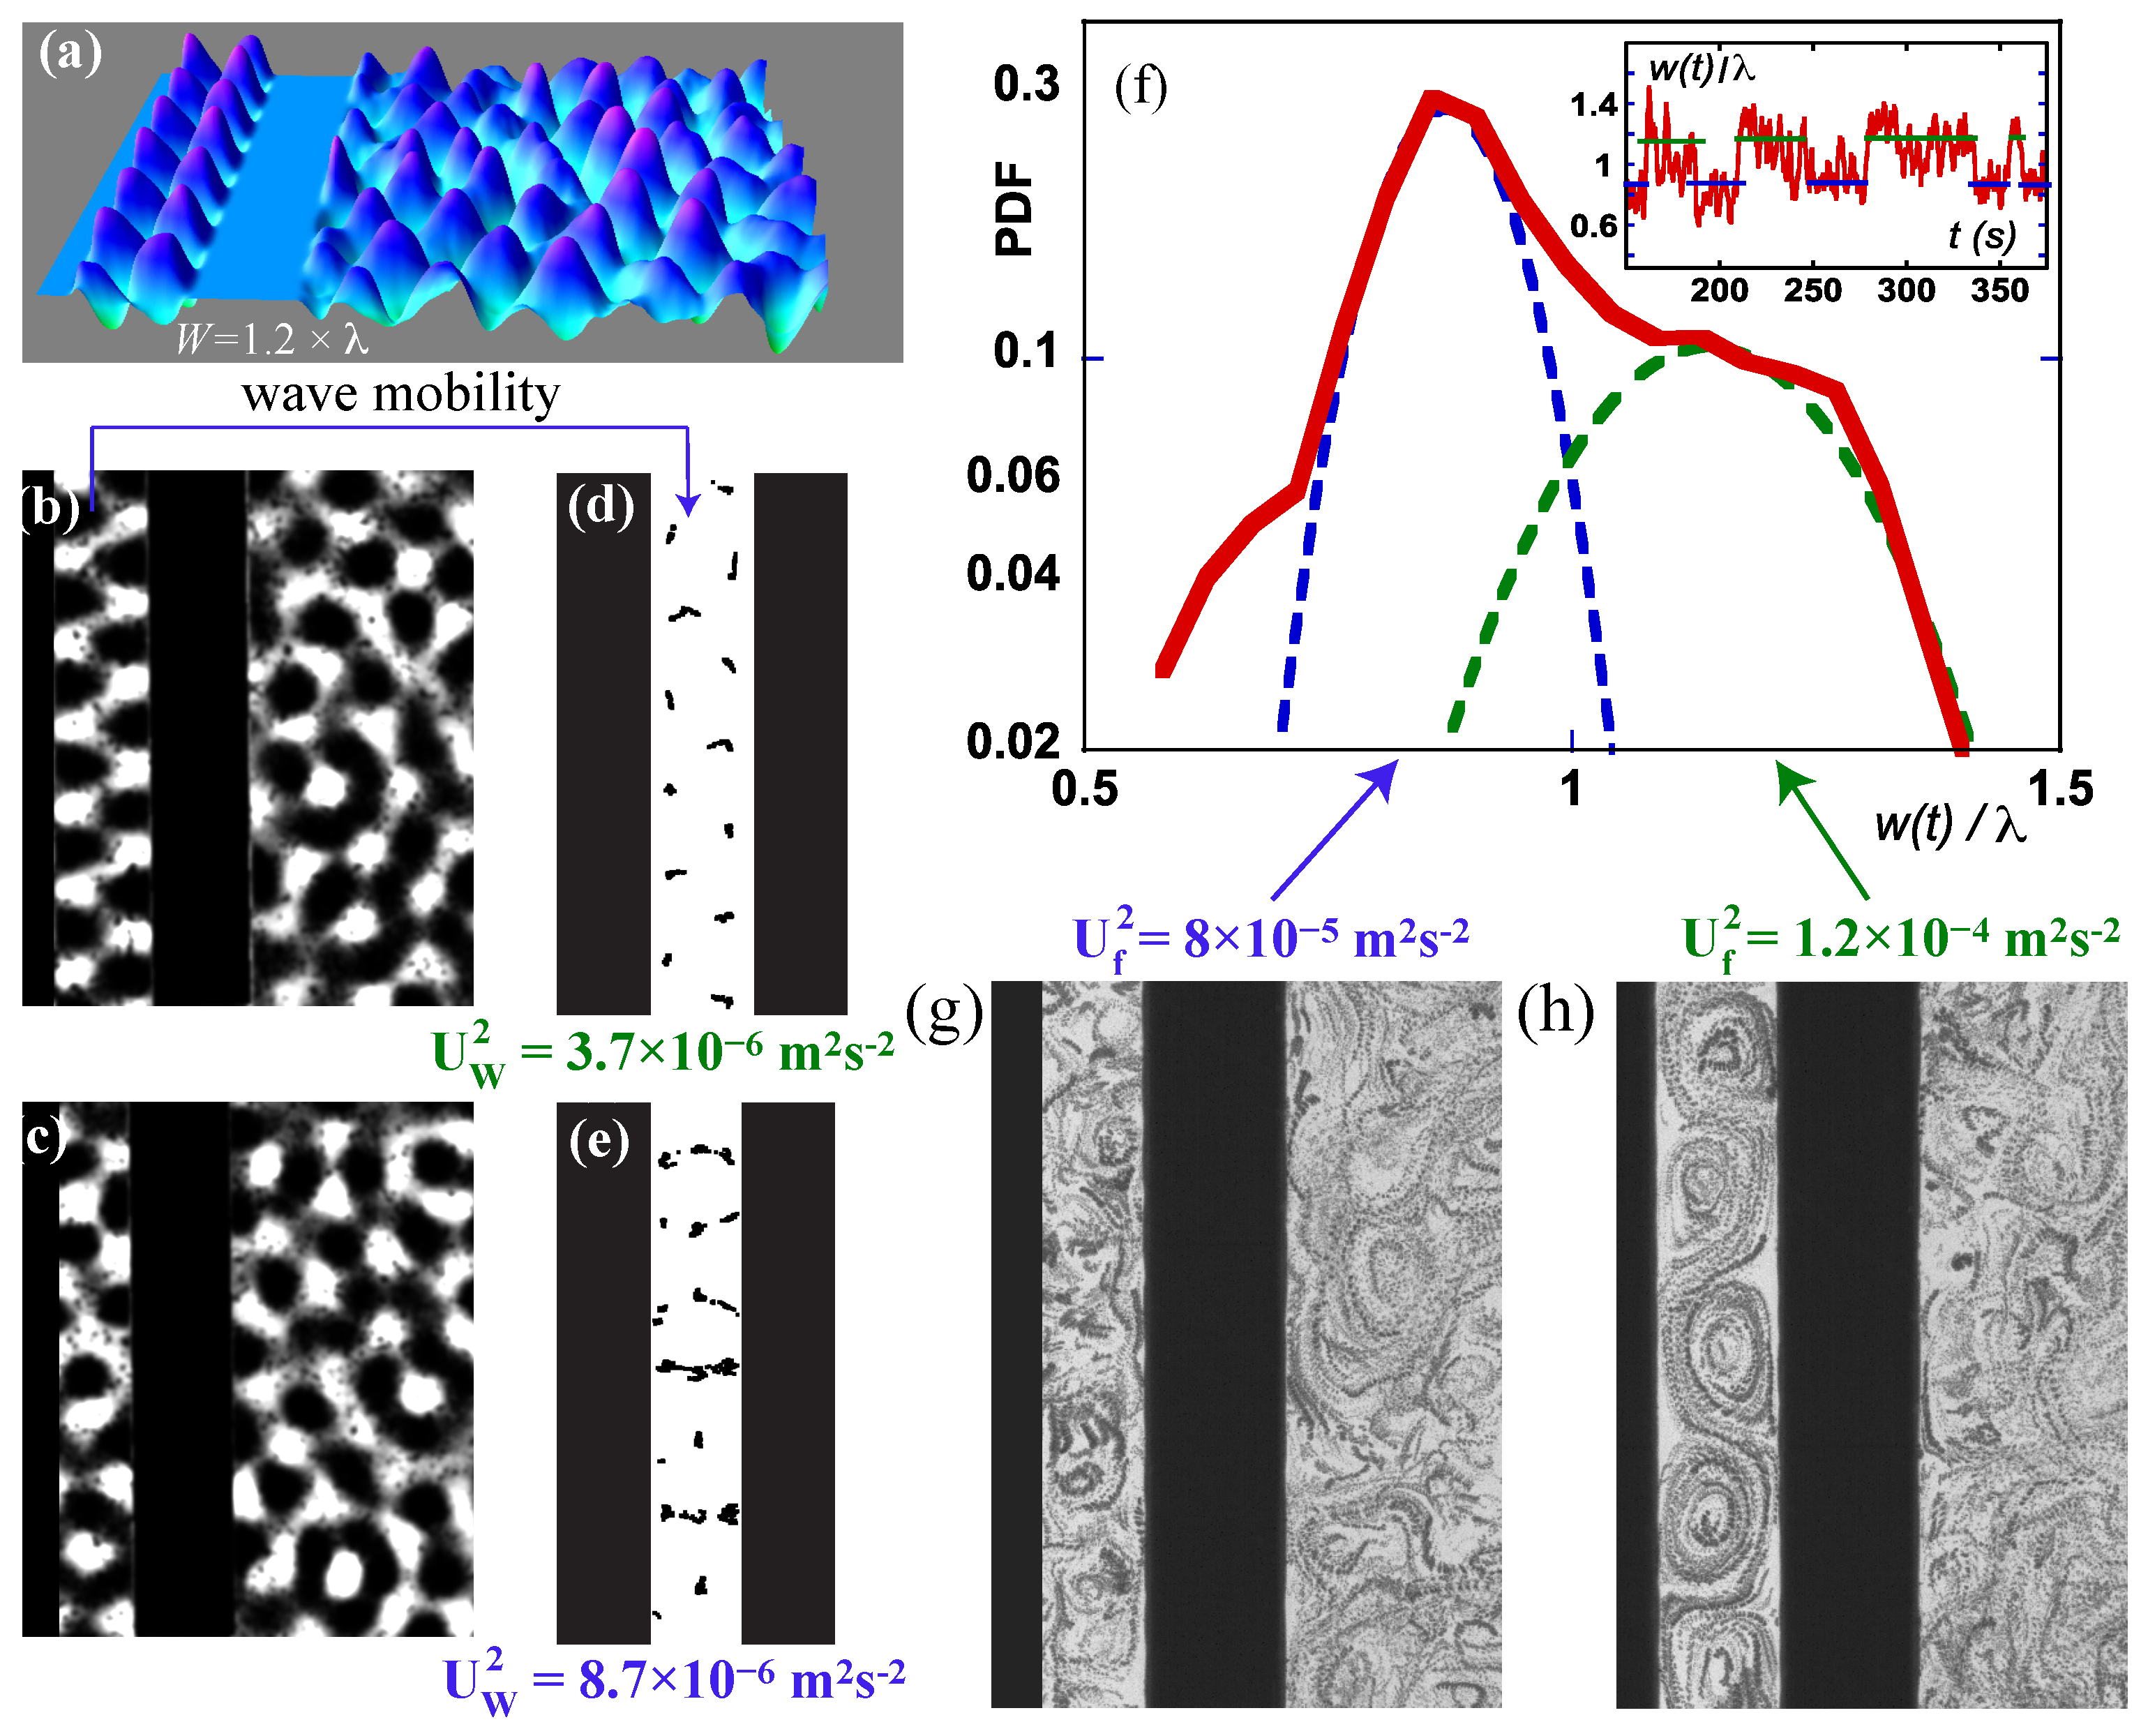
As the separation decreases to values close to the Faraday wavelength, a phenomenon of wave resonance is observed as shown in Figure 5a. More precisely, we observe successive transitions in the wave spatial structure between a disordered and an ordered state. The latter consists of a periodic wave pattern, which is reminiscent of a resonant mode of an optical cavity (see Figure 5a,b). The disordered state is characterised by unstable waves of which a transient motif is shown in Figure 5c. The onset of these resonant events can clearly be identified in the evolution of the wave amplitude versus the beam spacing (see Figure 2e). It is also observed on changes in the wave horizontal motion. Figure 5d,e show trajectories of the local wave peaks measured for resonant and disordered waves, respectively. The resonant waves show a much-reduced horizontal mobility compared to the disordered waves. Quantitatively, we measured U w 2 = 3.7 e 6 m 2 .s 2 during a resonant event and U w 2 = 8.7 e 6 m 2 .s 2 for the disordered state. The succession of resonant events and disordered states conspires to produce a complex short-range interaction between the beams as shown in Figure 5f. The inset of Figure 5f illustrates the typical dynamics of the instantaneous separation distance w ( t ) between the beams in this regime. It shows that the moving wall remains stable around w 1 1.2 × λ or w 2 0.8 × λ for extended periods of time. The position w 1 corresponds to the wave resonance. This dynamic results in a bimodal probability density function (PDF) of the distance w ( t ) . It is important to note that our previous model of the attraction force based on the wave horizontal dynamics breaks down in this high-confinement regime ( W λ ). Indeed, it predicts the opposite of our observations: the largest beam spacing w 1 should have corresponded to the disordered waves, which show the strongest wave agitation.
To understand the attraction force in a resonant cavity, one has to turn back to the point of view based on the wave-driven flows [19]. Each wave state has a clear signature on the structure of the confined flow. The resonant mode generates a periodic alley of vortices while the disordered state produces a chaotic flow as shown in Figure 5g,h. There is a direct connection between the two flow states and the metastable positions of the moving beam. The periodic flow has a high kinetic energy and generates the largest separation w 1 , and it is associated with a weaker attraction than the less energetic chaotic flow observed when the beam separation is w 2 . We conclude that the direct relation between the velocity fluctuations of the wave and that of the turbulent flow, measured in unbounded flows in [40] and exploited here for large beam spacings, does not hold anymore in the case of a resonant cavity; indeed, the almost immobile resonant waves generate periodic flows with higher energy than the flow produced by the disordered waves.

4. Discussion

In Faraday wave-driven turbulence, there is a strong coupling between the wave horizontal dynamics and the fluid particles dynamics. This coupling has been exploited to shed light on the presence of a fluctuation-induced force in this wave system. Actually, the results presented here extend the observations made in [40] to the case of partially confined surface flows and confirm that the wave turbulent agitation (characterised by the horizontal phase velocity) is directly dependent on the fluid kinetic energy accumulated over the inertial range by the inverse energy cascade (see the inset of Figure 3a). Consequently, the modelling of the attraction force in this system cannot be based on the wave amplitude only but has to be built upon the wave–fluid motion coupling.
These results highlight fundamental differences with a previous work concerning a pure wave effect observed in Faraday waves [8]. In this previous study, a model was proposed for an attraction force mediated by the fluctuations of the wave amplitude. In our experiments, according to the model developed in [8], there should be no interaction between the beams when the beam separation is larger than W / λ > 2.5 because the r.m.s wave amplitude measured within the cavity is identical to that measured in the unconfined flow domain. In stark contrast, we do observe an attraction force that is directly related to the changes in the kinetic energy of the wave horizontal motion. The latter is decoupled with the wave amplitude fluctuations and actually coupled with the kinetic energy of the 2D turbulent flow.
We also emphasise that no wave-driven hydrodynamic turbulence could be generated in the experiments reported in [8]. Indeed, the confinement of the wave field at the container size inhibits the inverse energy cascade and therefore prevents the development of a 2D turbulent flow. In [8], the ratio of the diameter of the container D c to the wavelength λ is D c / λ = 4.5 while fully developed 2D turbulence is observed when this ratio is larger than 15 [37]. Note that D c / λ 35 in our experiments for which λ = 8.8 mm. Hence, the attraction force reported in [8] is a pure wave effect. The latter is studied for separation distances W / λ < 0.5 when the wave motion is negligible between the beams. The study reports a force dependent on the external wave amplitude and independent of the separation W. The absence of a turbulent flow is reflected in the fact that no attraction force is reported when the plates are separated by a distance W larger than a wavelength and a half: W / λ > 1.5 .
In contrast, the turbulence-driven attraction force is a long-range effect observed for separation distances of up to W / λ 12 , and we report in Figure 1b that the attraction is strongly dependent on W. This dependence reflects the link between the force and the flow kinetic energy stored by the inverse energy cascade within the cavity [19]. In our experiments, as shown in [37,40], 2D turbulence governs both the fluid particle motion and the disorder in the wave field. In these conditions, the emergence of the Casimir-like effect can be described from both the flow viewpoint and the wave viewpoint.
This wave-flow dual picture holds until the wall spacing becomes comparable to the wavelength and a wave resonance within the cavity produces a complex short-range interaction. Interestingly, from the flow viewpoint, the counterpart of a resonant wave field is an alley of periodic highly-energetic vortices. The latter can be interpreted as a resonance of the forcing mechanism of the 2D wave-driven flow [37].

5. Conclusions

In summary, these experiments shed light on an interaction force mediated by the chaotic motion of hydrodynamic waves. In Faraday wave-driven turbulence, the emergence of a Casimir-like attraction force can be described from both the wave and the flow viewpoint. Moreover, its modelling requires understanding the wave–flow coupling. The attraction force reported here echoes different self-propulsion phenomena reported recently and observed when wave-driven turbulence is only partially confined [15,16,17]. This hydrodynamic analog of the Casimir effect also contributes to the growing body of research on hydrodynamic analogs of quantum effects observed in the Faraday wave system [51,52].

Author Contributions

Conceptualisation, N.F. and H.K.; methodology, M.D., H.K. and N.F.; software, M.D.; formal analysis, M.D. and N.F.; writing—original draft preparation, N.F.; writing—review and editing, M.D., H.K. and N.F.; supervision, N.F. All authors have read and agreed to the published version of the manuscript.

Funding

This research was funded by the Australian Research Council’s DECRA Grant (Grant No. 160100742).

Acknowledgments

We thank Horst Punzmann, Hua Xia and Michael Shats for countless discussions over many years.

Conflicts of Interest

The authors declare no conflict of interest.

References

  1. Kardar, M.; Golestanian, R. The “friction” of vacuum, and other fluctuation-induced forces. Rev. Mod. Phys. 1999, 71, 1233–1245. [Google Scholar] [CrossRef] [Green Version]
  2. Casimir, H.B. On the attraction between two perfectly conducting plates. Proc. K. Ned. Akad. Wet. 1948, 51, 793–795. [Google Scholar]
  3. Bonn, D.; Otwinowski, J.; Sacanna, S.; Guo, H.; Weddam, G.; Schall, P. Direct observation of colloidal aggregation by critical Casimir forces. Phys. Rev. Lett. 2009, 103, 156101. [Google Scholar] [CrossRef] [PubMed]
  4. Ray, D.; Reichhardt, C.; Olson Reichhardt, C.J. Casimir effect in active matter systems. Phys. Rev. E 2014, 90, 013019. [Google Scholar] [CrossRef] [PubMed] [Green Version]
  5. Hertlein, C.; Helden, L.; Gambassi, A.; Dietrich, S.; Bechinger, C. Direct measurement of critical Casimir forces. Nature 2008, 451, 172–175. [Google Scholar] [CrossRef] [PubMed]
  6. Lee, A.A.; Vella, D.; Wettlaufer, J.S. Fluctuation spectra and force generation in nonequilibrium systems. Proc. Natl. Acad. Sci. USA 2017, 114, 9255–9260. [Google Scholar] [CrossRef] [Green Version]
  7. Boersma, S.L. A maritime analogy of the Casimir effect. Am. J. Phys. 1996, 64, 539–541. [Google Scholar] [CrossRef]
  8. Denardo, B.C.; Puda, J.J.; Larraza, A. A water wave analog of the Casimir effect. Am. J. Phys. 2009, 77, 1095. [Google Scholar] [CrossRef] [Green Version]
  9. Zuriguel, I.; Boudet, J.F.; Amarouchene, Y.; Kellay, H. Role of fluctuation-induced interactions in the axial segregation of granular materials. Phys. Rev. Lett. 2005, 95, 258002. [Google Scholar] [CrossRef] [Green Version]
  10. Tennekes, H.; Lumley, J.L. A First Course in Turbulence; Cambridge Massachusetts Press: Cambridge, MA, USA, 1972. [Google Scholar]
  11. Kolmogorov, A.N. The local structure of turbulence in incompressible viscous fluid for very large Reynolds’ numbers. Dokl. Akad. Nauk SSSR 1941, 30, 301–305. [Google Scholar]
  12. Kuhnen, J.; Song, B.; Scarselli, D.; Budanur, N.B.; Riedl, M.; Willis, A.P.; Avila, M.; Hof, B. Destabilizing turbulence in pipe flow. Nat. Phys. 2018, 14, 386–390. [Google Scholar] [CrossRef]
  13. Tran, T.; Chakraborty, P.; Guttenberg, N.; Prescott, A.; Kellay, H.; Goldburg, W.; Goldenfeld, N.; Gioia, G. Macroscopic effects of the spectral structure in turbulent flows. Nat. Phys. 2010, 6, 438–441. [Google Scholar] [CrossRef] [Green Version]
  14. Vilquin, A.; Jagielka, J.; Djambov, S.; Herouard, H.; Fischer, P.; Bruneau, C.-H.; Chakraborty, P.; Gioia, G.; Kellay, H. Asymptotic turbulent friction in 2D rough-walled flows. Sci. Adv. 2021, 7, 5. [Google Scholar] [CrossRef] [PubMed]
  15. Francois, N.; Xia, H.; Punzmann, H.; Shats, M. Rectification of chaotic fluid motion in two-dimensional turbulence. Phys. Rev. Fluids 2018, 3, 124602. [Google Scholar] [CrossRef]
  16. Yang, J.; Davoodianidalik, M.; Xia, H.; Punzmann, H.; Francois, N. Passive propulsion in turbulent flows. Phys. Rev. Fluids 2019, 4, 104608. [Google Scholar] [CrossRef]
  17. Francois, N.; Xia, H.; Punzmann, H.; Shats, M. Nonequilibrium thermodynamics of turbulence-driven rotors. Phys. Rev. Lett. 2020, 124, 254501. [Google Scholar] [CrossRef]
  18. Spandan, V.; Putt, D.; Ostilla-Mónico, R.; Lee, A.A. Fluctuation-induced force in homogeneous isotropic turbulence. Sci. Adv. 2020, 6, 14. [Google Scholar] [CrossRef] [Green Version]
  19. Davoodianidalik, M.; Punzmann, H.; Kellay, H.; Xia, H.; Shats, M.; Francois, N. Fluctuation-induced interaction in turbulent flows. Phys. Rev. Lett. 2022, 128, 024503. [Google Scholar] [CrossRef]
  20. Faraday, M. On the Forms and States Assumed by Fluids in Contact with Vibrating Elastic Surfaces. Phil. Trans. R. Soc. Lond. 1831, 121, 299. [Google Scholar]
  21. Douady, S. Experimental Study of the Faraday Instability. J. Fluid Mech. 1990, 221, 383. [Google Scholar] [CrossRef]
  22. Kudrolli, A.; Gollub, J.P. Patterns and Spatiotemporal Chaos in Parametrically Forced Surface Waves: Systematic Survey at Large Aspect Ratio. Physica D 1996, 97, 133. [Google Scholar] [CrossRef]
  23. Edwards, W.S.; Fauve, S. Patterns and Quasipatterns in the Faraday Experiment. J. Fluid Mech. 1994, 278, 123. [Google Scholar] [CrossRef]
  24. Goldman, D.I.; Shattuck, M.D.; Moon, S.J.; Swift, J.B.; Swinney, H.L. Lattice Dynamics and Melting of a Nonequilibrium Pattern. Phys. Rev. Lett. 2003, 90, 104302. [Google Scholar] [CrossRef] [PubMed] [Green Version]
  25. Epstein, T.; Fineberg, J. Necessary Conditions for Mode Interactions in Parametrically Excited Waves. Phys. Rev. Lett. 2008, 100, 134101. [Google Scholar] [CrossRef] [Green Version]
  26. Huepe, C.; Ding, Y.; Umbanhowar, P.; Silber, M. Forcing function control of Faraday wave instabilities in viscous shallow fluids. Phys. Rev. E 2006, 73, 016310. [Google Scholar] [CrossRef] [Green Version]
  27. Shani, I.; Cohen, G.; Fineberg, J. Localized Instability on the Route to Disorder in Faraday Waves. Phys. Rev. Lett. 2010, 104, 184507. [Google Scholar] [CrossRef]
  28. Batchelor, G.K. An Introduction to Fluid Dynamics; Cambridge Massachusetts Press: Cambridge, MA, USA, 1967. [Google Scholar]
  29. Longuet-Higgins, M.S. Mass Transport in Water Waves. Phil. Trans. R. Soc. 1953, A245, 535. [Google Scholar]
  30. Punzmann, H.; Francois, N.; Xia, H.; Falkovich, G.; Shats, M. Generation and reversal of surface flows by propagating waves. Nat. Phys. 2014, 10, 658–663. [Google Scholar] [CrossRef] [Green Version]
  31. Ramshankar, R.; Berlin, D.; Gollub, J.P. Transport by Capillary Waves. Part 1. Particle Trajectories. Phys. Fluids A 1990, 2, 1955. [Google Scholar] [CrossRef] [Green Version]
  32. Mesquita, O.N.; Kane, S.; Gollub, J.P. Transport by Capillary Waves: Fluctuating Stokes Drift. Phys. Rev. A 1992, 45, 3700. [Google Scholar] [CrossRef] [Green Version]
  33. Hansen, A.E.; Schroder, E.; Alstrom, P.; Andersen, J.S.; Levinsen, M.T. Fractal Particle Trajectories in Capillary Waves: Imprint of Wavelength. Phys. Rev. Lett. 1997, 79, 1845. [Google Scholar] [CrossRef]
  34. Francois, N.; Xia, H.; Punzmann, H.; Shats, M. Inverse energy cascade and emergence of large coherent vortices in turbulence driven by Faraday waves. Phys. Rev. Lett. 2013, 110, 194501. [Google Scholar] [CrossRef] [PubMed]
  35. von Kameke, A.; Huhn, F.; Fernandez-Garcia, G.; Munuzuri, A.P.; Perez-Munuzuri, V. Double cascade turbulence and Richardson dispersion in a horizontal fluid flow induced by Faraday waves. Phys. Rev. Lett. 2011, 107, 074502. [Google Scholar] [CrossRef] [PubMed]
  36. Xia, H.; Francois, N.; Punzmann, H.; Shats, M. Lagrangian scale of particle dispersion in turbulence. Nat. Commun. 2013, 4, 2013. [Google Scholar] [CrossRef]
  37. Francois, N.; Xia, H.; Punzmann, H.; Ramsden, S.; Shats, M. Three-dimensional fluid motion in Faraday waves: Creation of vorticity and generation of two-dimensional turbulence. Phys. Rev. X 2014, 4, 021021. [Google Scholar] [CrossRef] [Green Version]
  38. Francois, N.; Xia, H.; Punzmann, H.; Fontana, P.W.; Shats, M. Wave-based liquid-interface metamaterials. Nat. Commun. 2017, 8, 14325. [Google Scholar] [CrossRef] [PubMed] [Green Version]
  39. Xia, H.; Francois, N. Two-dimensional turbulence in three-dimensional flows. Phys. Fluids 2017, 29, 111107. [Google Scholar] [CrossRef] [Green Version]
  40. Francois, N.; Xia, H.; Punzmann, H.; Shats, M. Wave-particle interaction in the Faraday waves. Eur. Phys. J. E 2015, 38, 106. [Google Scholar] [CrossRef]
  41. Kraichnan, R. Inertial ranges in two-dimensional turbulence. Phys. Fluids 1967, 10, 1417. [Google Scholar] [CrossRef] [Green Version]
  42. Boffetta, G.; Ecke, R.E. Two-dimensional turbulence. Annu. Rev. Fluid Mech. 2012, 44, 427. [Google Scholar] [CrossRef]
  43. Francois, N.; Xia, H.; Punzmann, H.; Faber, B.; Shats, M. Braid entropy of two-dimensional turbulence. Sci. Rep. 2015, 5, 18564. [Google Scholar] [CrossRef] [PubMed] [Green Version]
  44. Colombi, R.; Schluter, M.; von Kameke, A. Three-dimensional flows beneath a thin layer of 2D turbulence induced by Faraday waves. Exp. Fluids 2021, 62, 8. [Google Scholar] [CrossRef]
  45. Colombi, R.; Rohde, N.; Schluter, M.; von Kameke, A. Coexistence of Inverse and Direct Energy Cascades in Faraday Waves. Fluids 2022, 7, 148. [Google Scholar] [CrossRef]
  46. Xia, H.; Francois, N.; Punzmann, H.; Shats, M. Tunable diffusion in wave-driven two-dimensional turbulence. J. Fluid Mech. 2019, 865, 811–830. [Google Scholar] [CrossRef] [Green Version]
  47. Kellay, H.; Wu, X.-L.; Goldburg, W.I. Experiments with turbulent soap films. Phys. Rev. Lett. 1995, 74, 3975. [Google Scholar] [CrossRef]
  48. Francois, N.; Lasne, D.; Amarouchene, Y.; Lounis, B.; Kellay, H. Drag enhancement with polymers. Phys. Rev. Lett. 2008, 100, 018302. [Google Scholar] [CrossRef] [Green Version]
  49. Francois, N.; Amarouchene, Y.; Lounis, B.; Kellay, H. Polymer conformations and hysteretic stresses in nonstationary flows of polymer solutions. EPL (Europhys. Lett.) 2009, 86, 34002. [Google Scholar] [CrossRef] [Green Version]
  50. Francois, N.; Xia, H.; Punzmann, H.; Combriat, T.; Shats, M. Inhibition of wave-driven two-dimensional turbulence by viscoelastic films of proteins. Phys. Rev. E 2015, 92, 023027. [Google Scholar] [CrossRef] [Green Version]
  51. Couder, Y.; Protiere, S.; Fort, E.; Boudaoud, A. Dynamical phenomena: Walking and orbiting droplets. Nature 2005, 437, 208. [Google Scholar] [CrossRef]
  52. Bush, J.W. Pilot-wave hydrodynamics. Ann. Rev. Fluid Mech. 2015, 47, 269–292. [Google Scholar] [CrossRef] [Green Version]
Figure 1. (a) Schematics of the experimental setup; (b) attraction force F versus non-dimensional mean separation W / λ at fixed vertical acceleration a = 1 g. Both quantities are time averaged. (c) 3D instantaneous visualization of the wave field topography for a beam spacing W > 2.5 × λ ; (d) top view of the Faraday waves using diffusive light imaging technique. Peaks and troughs appear as dark and white blobs. The floating beams appear as black rectangles (beam width = 10 mm). (e) the wave-driven flow, fluid particle streaks reveal the interacting eddies of the turbulent flow. Wave number spectral analysis of the flow kinetic energy reveals a k 5 / 3 scaling indicating the presence of an energy cascade.
Fluids 07 00155 g001
Figure 2. (a) An image of the Faraday waves using the diffusive light imaging technique. Peaks and troughs appear as dark and white blobs. Local wave maxima are detected (white crosses within the dark blobs), and their motion is tracked using PTV techniques (scale bar = 10 mm). (b,c) trajectories of the wave peaks tracked over 50 Faraday wave periods; (d) variance of the wave horizontal velocity U w 2 and r.m.s wave elevation h versus the turbulent flow energy U f 2 measured inside (index i n , blue color) and outside (index o u t , red color) of the cavity; (e) r.m.s value of the wave amplitude h i n measured in the cavity versus gap width W / λ at fixed vertical acceleration a = 1 g. The red dotted line indicates the r.m.s value of the wave amplitude in the unbounded domain; (f) Frequency power spectrum of the fluctuations of the wave horizontal velocity.
Fluids 07 00155 g002
Figure 3. (a) Wave horizontal kinetic energies measured in the unbounded ( U w o u t 2 ) and the confined ( U w i n 2 ) domains versus W / λ at a fixed vertical acceleration a = 1 g. Inset: Ratio of the wave horizontal kinetic energy U w i n 2 over the flow kinetic energy U f i n 2 inside the cavity; (b) flow anisotropy parameter for the wave motion β = ( U w y 2 U w x 2 ) / U w 2 versus W / λ .
Fluids 07 00155 g003
Figure 4. Experimentally measured force F versus ρ U w i n 2 / W .
Fluids 07 00155 g004
Figure 5. (a) 3D instantaneous visualisation of a resonant wave field for a beam spacing W = 1.2 × λ . (b,c) diffusing light images of the resonant wave mode and disordered waves in the high-confinement regime; (d,e) trajectories of the wave peaks measured inside the cavity for the resonant waves and the chaotic waves at fixed vertical acceleration a = 1 g; (f) PDF of the instantaneous gap w ( t ) when the mean separation is W λ . The PDF can be modelled by two Gaussian distributions centred on w 1 and w 2 with different variances. Inset: Dynamics of the time-varying gap w ( t ) . (g,h) Fluid particle streaks show the wave-driven flows in disordered waves and during a wave resonance at high-confinement.
Fluids 07 00155 g005
Publisher’s Note: MDPI stays neutral with regard to jurisdictional claims in published maps and institutional affiliations.