Abstract
Most of the perforated tile flow CFD models in the literature so far assume the air velocity coming out of the tile openings (pores) is uniform. However, in typical applications, such as data centers and indoor environments, perforated tile or diffuser outflow can be highly non-uniform due to many reasons (e.g., spatial variation of plenum pressure or varying local tile geometrical patterns). For an ideal (uniform) tile flow velocity that has the same flow rate as the non-uniform tile flow velocity, the tile flow momentum of the latter will always be greater because momentum scales with velocity squared. To illustrate the effect of tile flow velocity distortion, two generic CFD cases (one with uniform velocity and the other with non-uniform velocity) with multiple openings model are presented here. Their CFD results are compared to the momentum source model results and validated against previously published data of an isolated tile flow measurement. The momentum source model is one of the simplest/most practical CFD models that uses a body-force value for correcting the momentum deficit between perforated and fully open areas. Initially, the momentum source model results show good agreement with results of the uniform velocity case only. Thus, due to velocity distortion (non-uniform velocity) in the tile flow, the CFD results presented in this paper show a potential reason to modify the body-force value in the momentum source model with an adjustment factor (C). Several values of C factor are numerically investigated for the present distorted tile flow CFD case, and the best match is found to be at C, equaling approximately 1.6.
1. Introduction
Previous CFD investigations in various configurations ignored the perforation effect on the flow and temperature distributions. In particular, the air flow exiting perforated surfaces (tile or diffuser) was modeled as uniform velocity based on fully open area (i.e., Iyengar et al. [1]). In these models, the actual mass flux is conserved but the actual momentum flux is not (due to perforation effect), and hence, the CFD simulations tend to predict a poor/incorrect mixing level between the tiny jets from perforated surface and surrounding air. Thus, the incorrect perforated surface modeling results in a large deviation between the CFD predictions and experimental results [1].
One of the simplest perforated surface modeling methods is the momentum source model that was employed in many previous CFD research works (i.e., [2,3,4,5]) without the need to resolve the geometric details of perforated surfaces in the computational domain. In the context of RANS simulations, the momentum source model corrects for the jet momentum deficit between the actual momentum (due to perforation) and inlet momentum (based on full tile area) by adding a source term (body-force term) in the mean-flow momentum equations. The main input to the body-force term (to be explained later) is the tile perforation percentage. Although the tile flow non-uniformity (distortion) is not accounted for in this momentum source model, it is a simple, yet reasonably accurate perforated tile modeling method. The study of Abdelmaksoud [6] employed the momentum source method for perforated tile and rack exit doors modeling in data center research. The CFD simulations output was compared against experimental results of temperature distribution inside the entire data center. A nearly 1.5 °C RMS error was obtained with a coarse CFD grid size in the order of 4 inches in the entire computational mesh. Hu and Fanning [7] applied the momentum source method to simulate anisotropic flow in a wire-wrapped pin-bundle channel. The CFD simulations were compared to experimental data. Reasonably accurate predictions of velocity, temperature and pressure were achieved. Deng et al. [8] integrated the momentum source model to the first cell adjacent to the diffuser surface in indoor air flow simulation. The computational effort required to resolve the diffuser geometric details was reduced, and good agreement between computational results and experimental data was achieved. Phan et al. [9] evaluated the momentum source method via using a body force and modified body force for tile flow modeling in data center simulations. Both the body-force and modified body-force models showed good agreement with the experimental data.
Another common model developed by Nielsen [10] is the box method, which is relatively more complicated than the momentum source method, in which boundary conditions are imposed at an imaginary box surface around the diffuser. Three types of data can be used for the boundary conditions: experimental measurements (as has been performed by Srebric and Chen [11,12]), analytical correlations (Nielsen [10] and Huo [13]) or simulated parameters (Cehlin and Moshfegh [14] and Martinez-Almansa et al. [15]). However, the drawbacks of applying this method include determining the imaginary box size, and it is not suitable for low Reynolds numbers (i.e., displacement ventilation). In low Reynolds numbers, the buoyancy effect is very important near the perforated surface outflow.
An alternative diffuser modeling method is the direct description of perforated surface geometry details. However, it is not a practical method due to its large computing resource requirements and may impose convergence difficulty [16,17]. Therefore, most of the CFD research utilizes one of the above-mentioned approaches or any other approximate method for perforated surface modeling in the computational domain.
Based on the literature review, it can be concluded that most of the CFD research uses the momentum source method for perforated surfaces (tiles or diffusers) modeling due to the lower input requirement (body-force value) and less significant computational effort (can be employed with coarse mesh). Note, the momentum source model assumes that the perforated surface outflow is uniform and symmetrical. However, none of these previous studies investigated the effect of outflow distortion (non-uniformity in velocity magnitude between small jets) on the perforated surfaces and the validity of using the momentum source model in this case. In this paper, a numerical investigation of velocity field in a distorted outflow (from a perforated tile with geometry details modeling) is compared against to results of uniform outflow, momentum source and experimental data to illustrate a potential reason to modify the body-force input for the momentum source method in CFD simulations.
2. Tile Flow Experiment
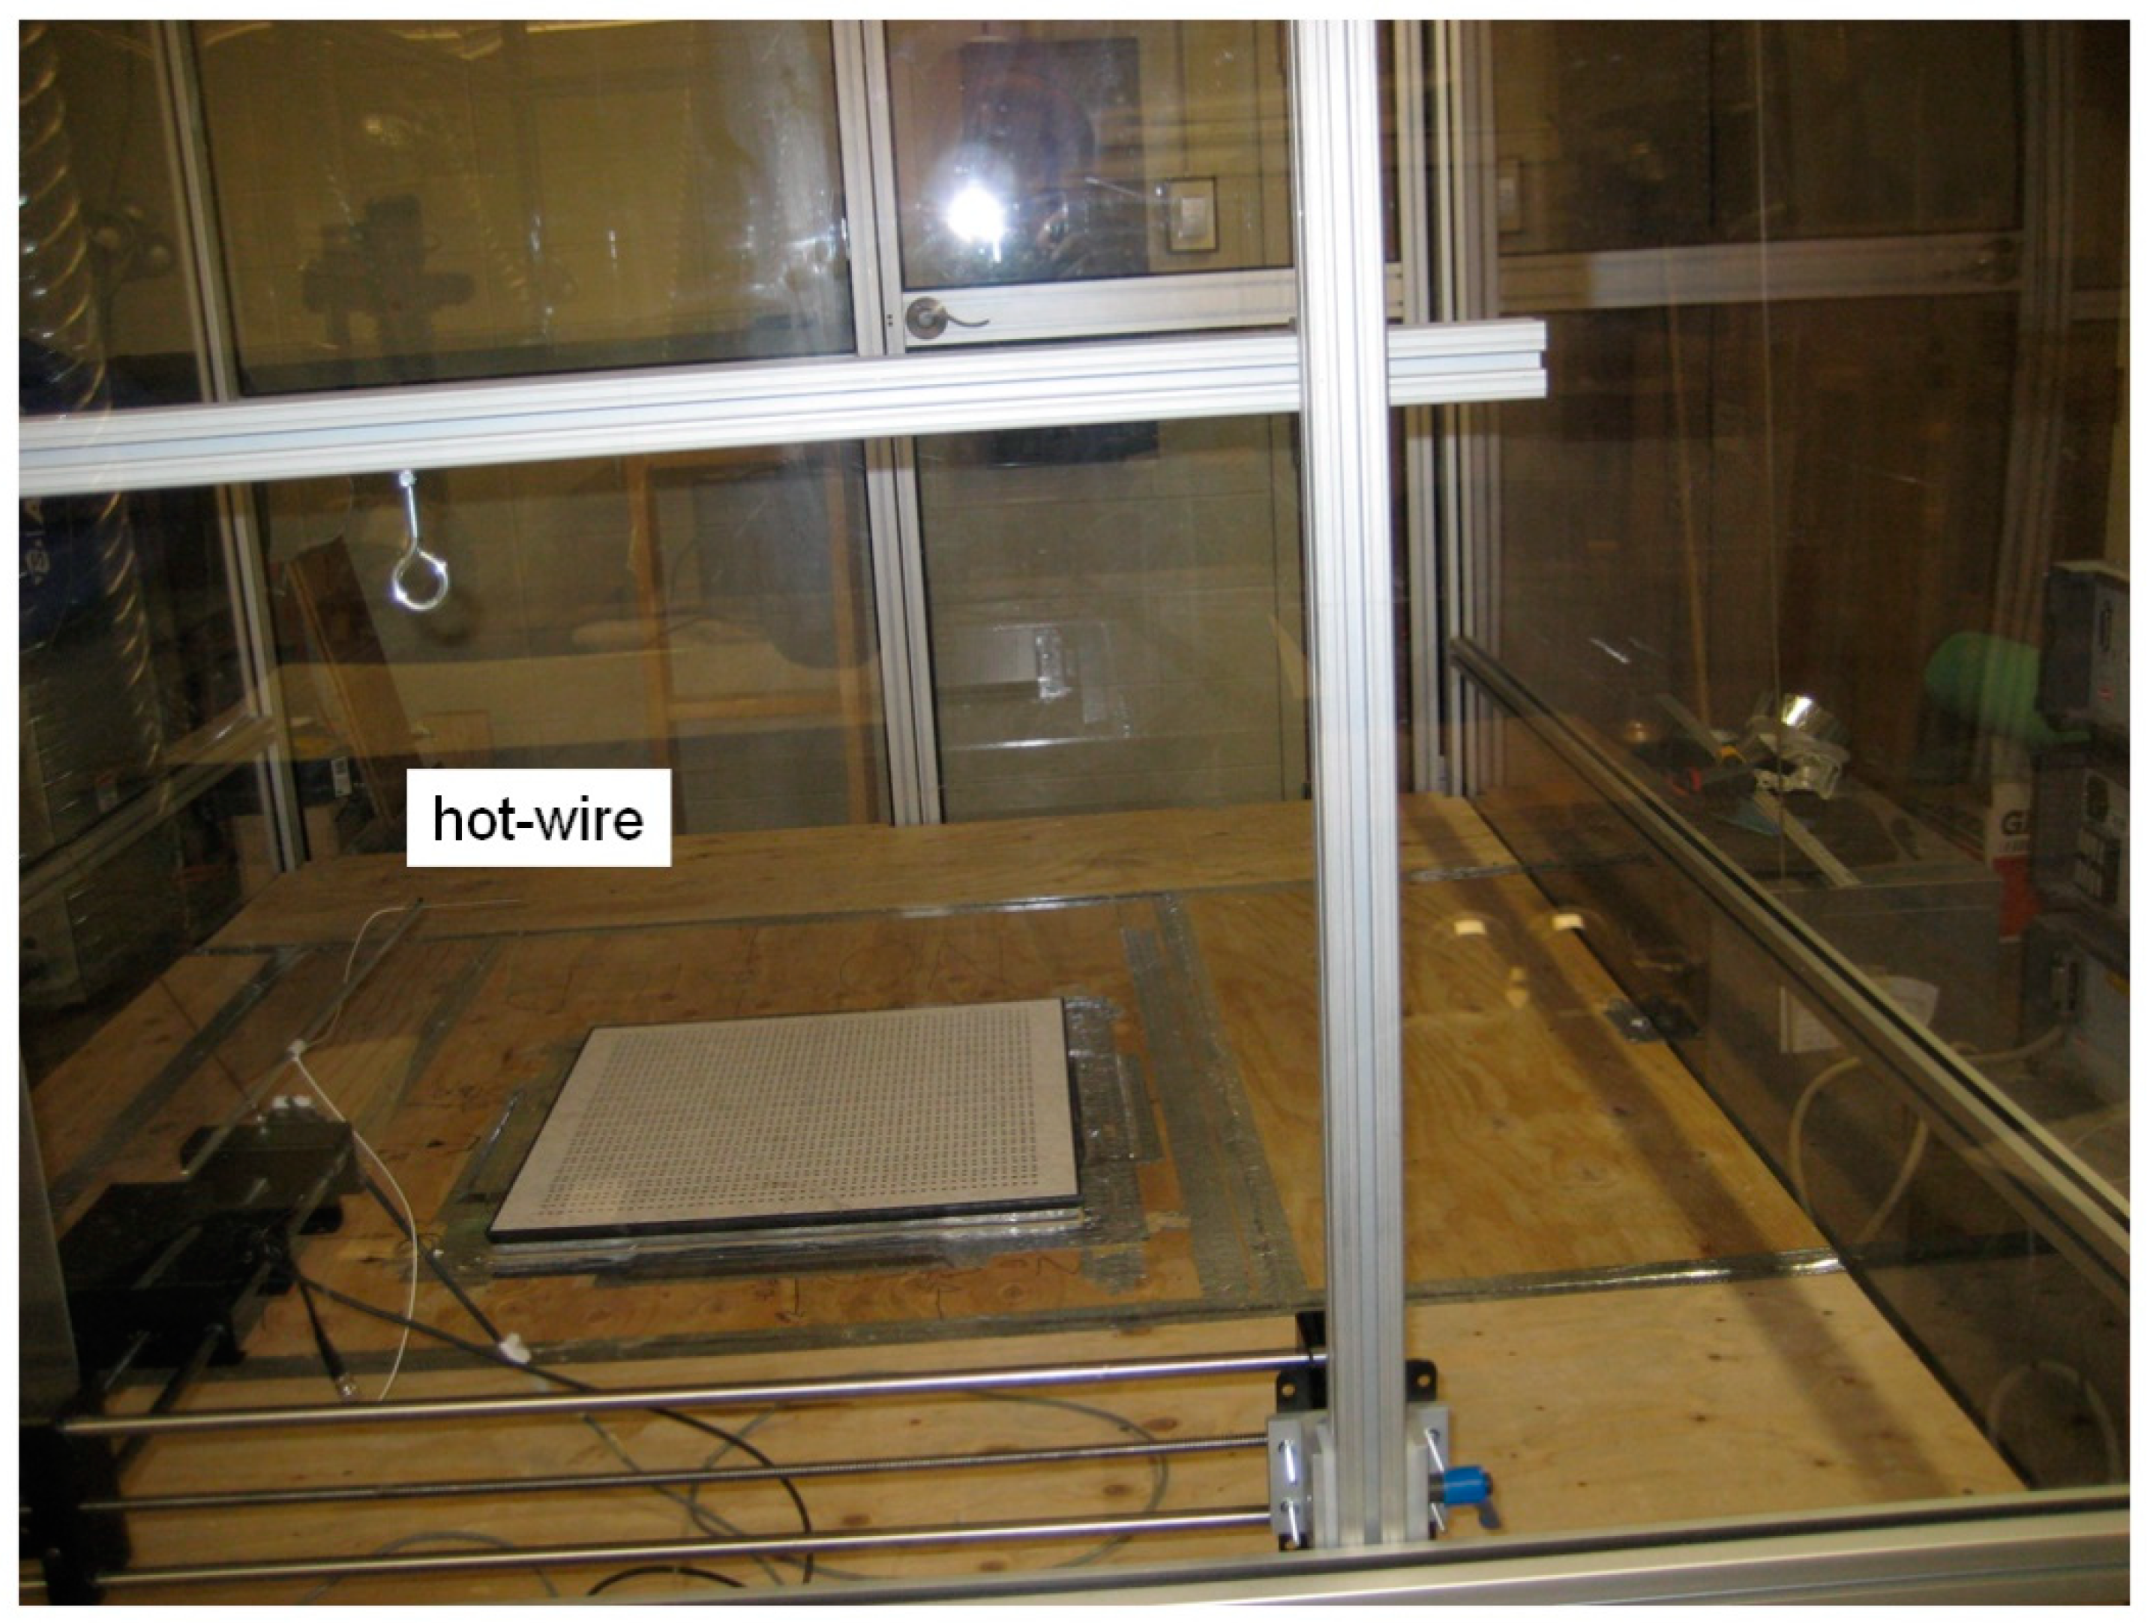
An experimental study was carried out by Abdelmaksoud [6] to quantify the flow field coming off an isolated/single perforated tile. Figure 1 shows the test chamber used to perform the experiment. The chamber dimensions are 6.7 ft × 8.7 ft × 8.2 ft, and the ceiling exhaust grill and floor perforated tile are placed in the center of the chamber. The ceiling exhaust grill is 4 ft × 4 ft, while the perforated tile is 2 ft × 2 ft, with perforation percentage of 25%.

Figure 1.
Air velocity measurement for an isolated tile in a small chamber (Reprinted with permission from [Abdelmaksoud, W.A.], [Ph.D. Thesis]; published by [Syracuse University], [2012]).
In general, the air flow coming from the plenum entering the space can be turbulent, with potentially large non-uniformities in both magnitude and direction. In order to obtain high-quality and uniform outflow data for the CFD modeling of the perforated tile, considerable care was taken to ensure that the plenum flow entering the test chamber through the tile is vertical and uniform. This is achieved by installing a large resistance honeycomb between the plenum and the tile, resulting in a plenum gauge pressure of ~0.5 inches of water.
A fixed air flow rate of 1000 cfm was circulated in the chamber between the perforated tile and exhaust grill by a blower. The tile flow rate was measured by using a TSI flow hood (model EBT721 with accuracy of ±4%) placed vertically on the perforated tile surface, then removed to perform the velocity measurements. A hot-wire anemometer probe was used to conduct velocity measurements with an estimated error of 3%. The measurements were repeated to ensure repeatability and statistically converged experimental data. A traverse system, holding the hot-wire probe, was used to obtain the velocity profiles at several heights. The traverse system (with accuracy of 2%) was controlled by a laptop to move it in the horizontal planes of 1 ft, 2 ft and 3 ft from the perforated tile surface. Finally, to ensure that the experiment was performed under steady isothermal condition, the facility was run for two hours before the data were conducted.
3. Tile Flow Modeling
Two models for the perforated tile are investigated here. One is the momentum source model, and the other is the multiple openings model. In momentum source model, the idea is to correct the initial tile flow momentum in the vertical direction via a volumetric body-force field in a volume () of 24 in × 24 in × 4 in above the 2 ft × 2 ft perforated tile area (A). The correct level of initial tile flow momentum is important with respect to being able to correctly predict the level of mixing between the tile flow and the surrounding air in indoor air simulations. The imposed body-force-per-unit volume (Fy) is calculated according to the following equation:
where ρ is the air density, Q is the volume flow rate issuing from the tile (1000 cfm), and σ is the tile perforation (25%).
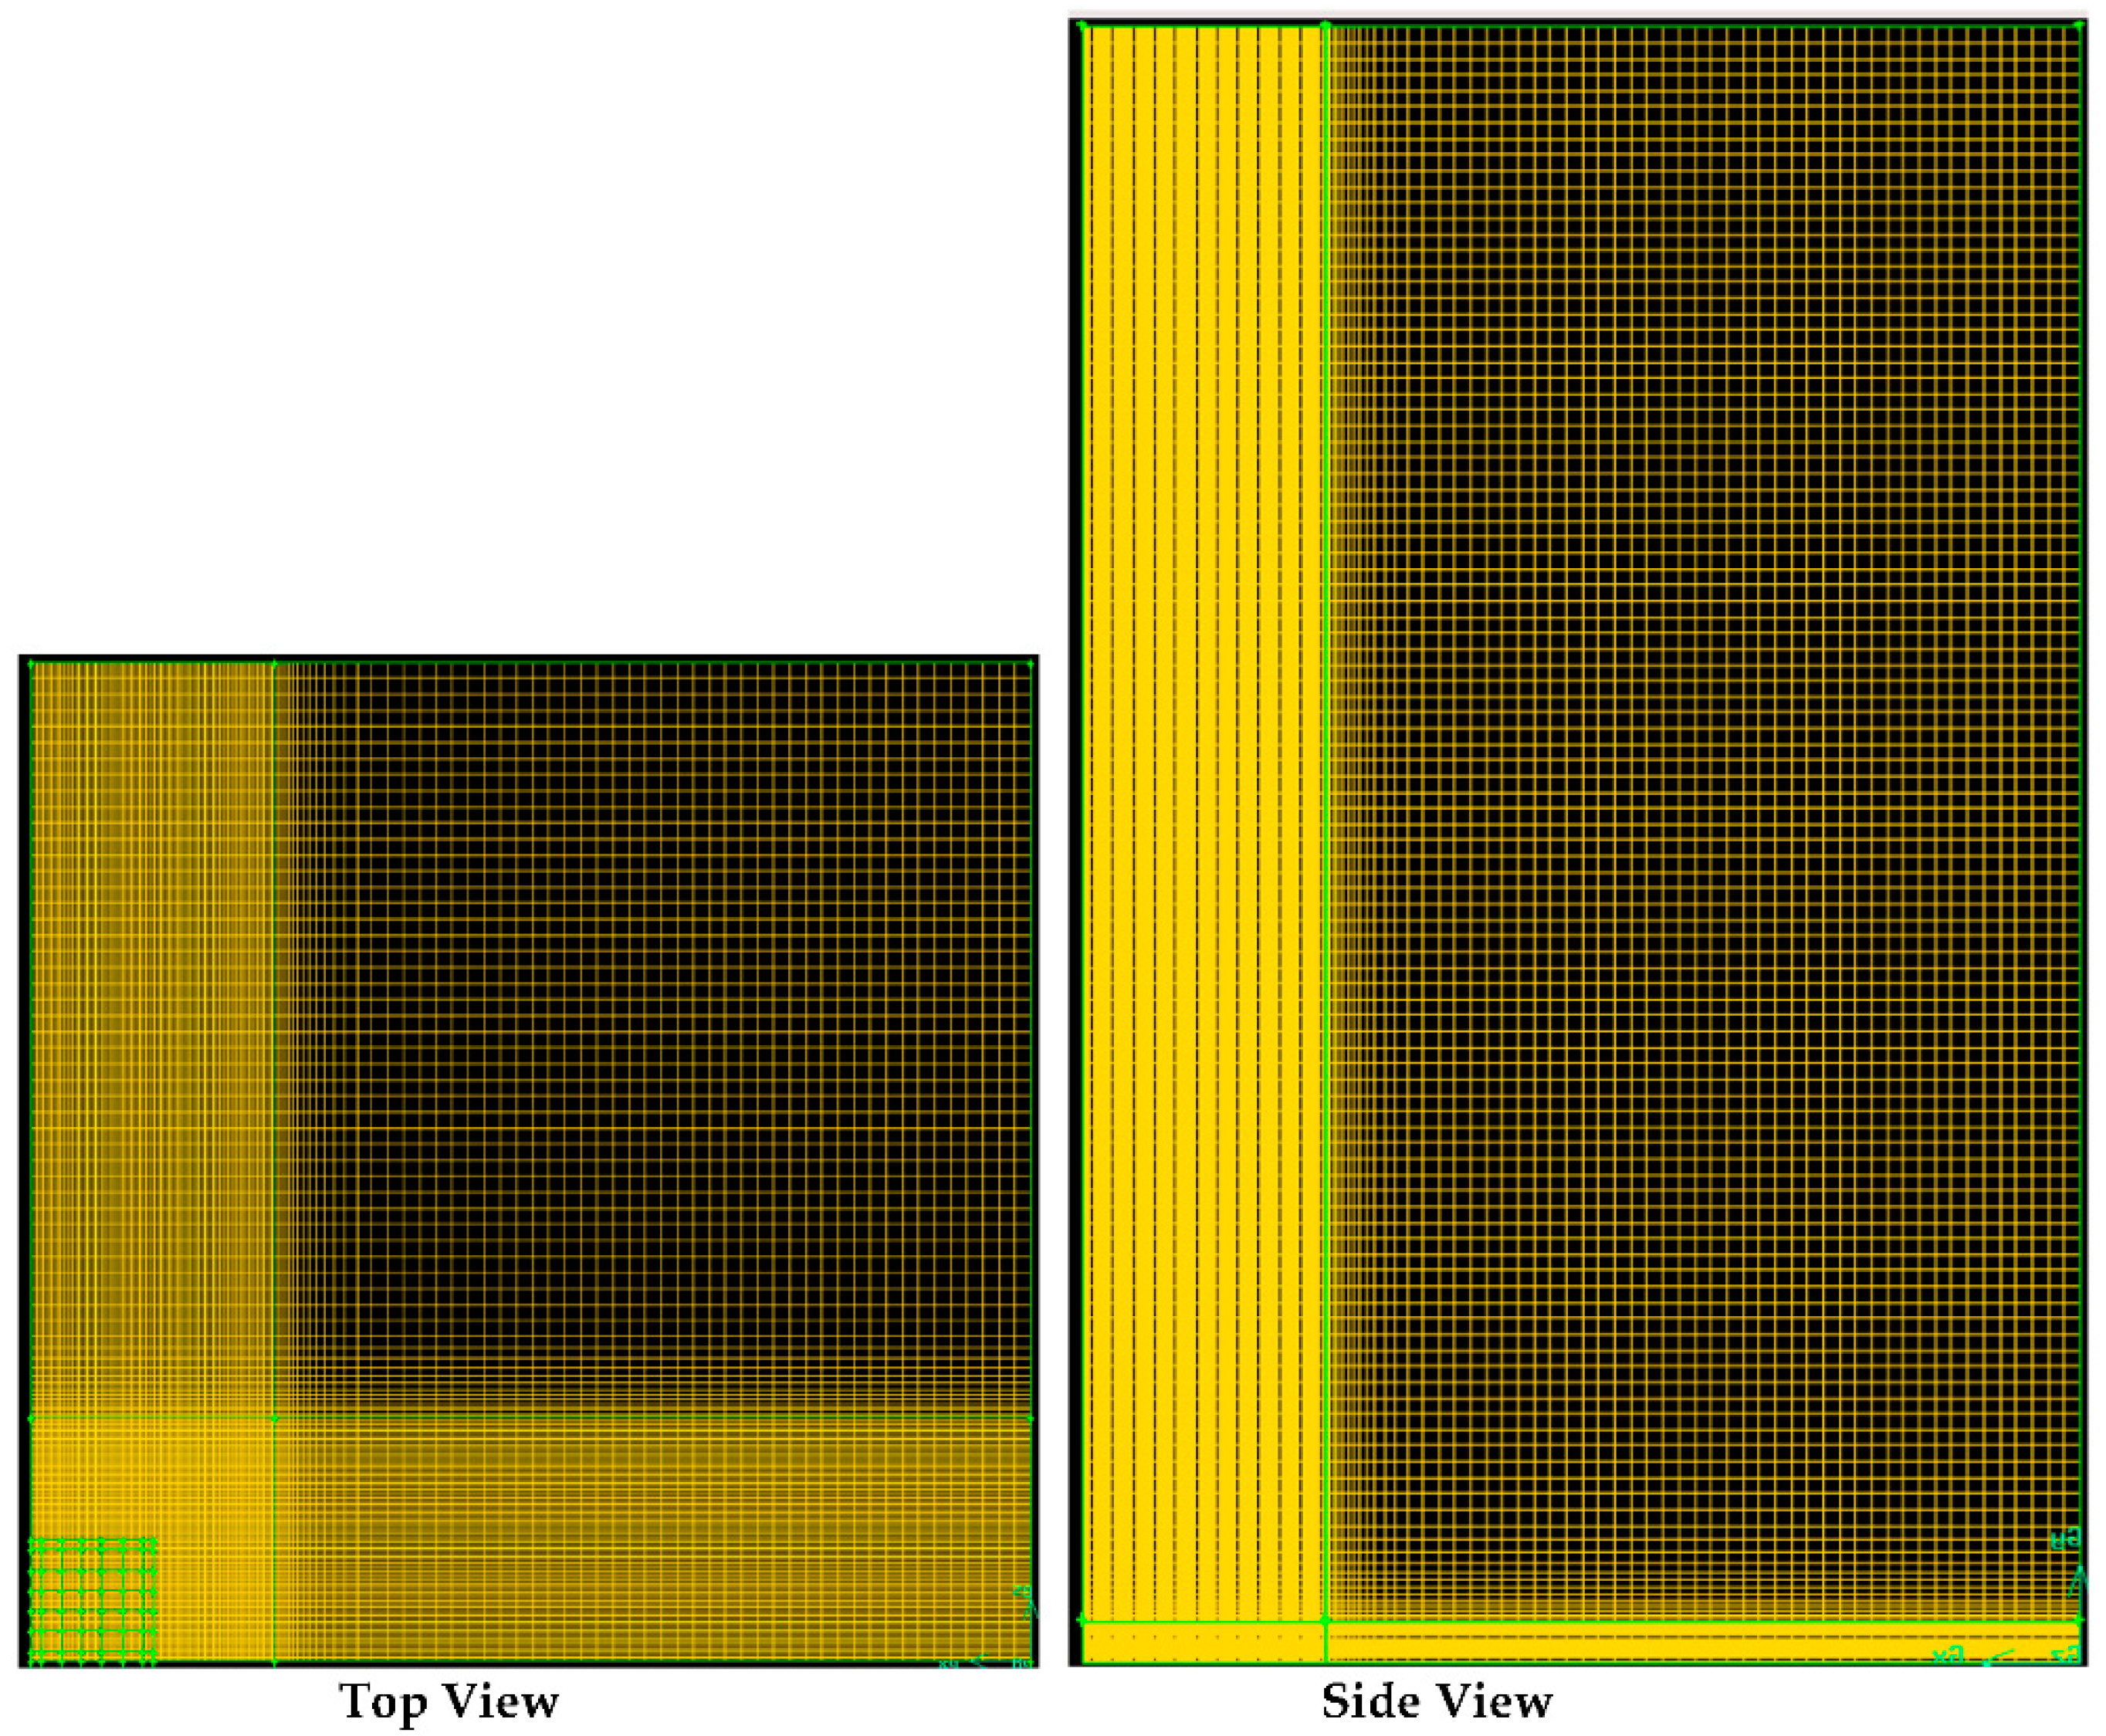
The other implemented tile model is the multiple openings model where the tile perforation is presented by a number of small square openings (36 openings) in the 2 ft × 2 ft tile area. This model accurately predicts the temperature field around the tile region, as it allows for entrainment of the surrounding air through the small gaps between the small tile openings. Note, the multiple openings model (the most accurate model) is not practical for large domains (computationally prohibitive). Therefore, simplified models (such as momentum source) for perforated tiles are always being employed in CFD research. Figure 2 describes the computational domain and boundary conditions of the studied test chamber shown in Figure 1. Due to symmetry, only one-quarter of the tile (with nine openings) and test chamber is simulated. To ensure accurate simulations, each tile opening was resolved with a grid size of 10 × 10 cells, which was found to accurately predict the spread of jet flow and the length of its potential core [6]. A structured grid was employed in the entire 3-D domain with 4 million total number of grid cells. The computational domain was discretized using structured elements with very fine grid cells near the walls and above the tile flow area. This very fine grid grows with a stretching ratio of 1.1 to reach relatively coarser grid, away from the wall surface and shear layers (see Figure 3). The very fine grid cells near the walls were employed to reach the recommended y+ values, in the order of 1, for enhanced wall treatment modeling [18]. The CFD solver employed the realizable k-ε turbulence model, which accurately predicts the jet flow characteristics [19]. The values of Reynolds number in the present study ranged between 17,470 and 26,155, according to cases. The governing equations of air flow in the investigated domain are given by
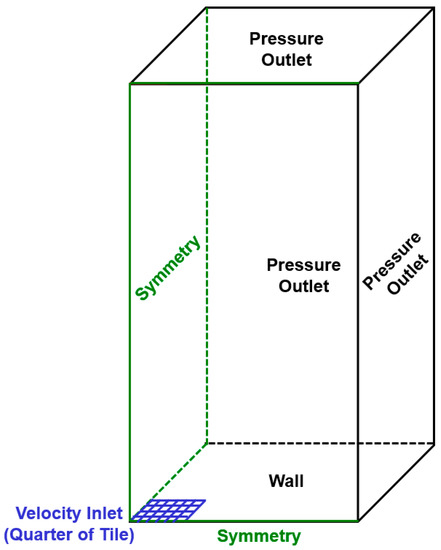
Figure 2.
Computational domain for multiple openings tile model.
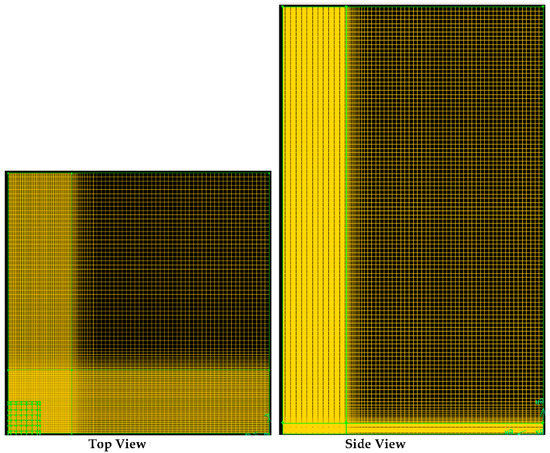
Figure 3.
Top and side views for the used mesh in CFD simulations.
mass conservation:
momentum conservation:
k conservation:
ε conservation:
where xi and xj are the Cartesian coordinates; u is the air velocity; p is the air pressure; ρ is the air density; μ is the air dynamic viscosity; μt is the turbulent viscosity; ν is the air kinematic viscosity; k is the turbulent kinetic energy; ε is the turbulent dissipation rate; Gk is the turbulent kinetic energy generation; σk and σε are the turbulent Prandtl numbers for k and ε, respectively; and C2 is model constant [20]. All the CFD simulations in the present study were performed using the commercial CFD software package (ANSYS FLUENT 16). The ANSYS preprocessor for geometry and mesh was used to create the geometric models and meshing. The CFD software was employed to solve the governing equations (i.e., conservation of mass, momentum and turbulence equations) with an accurate second-order scheme. The algorithm of the semi-implicit method for pressure-linked equations was utilized to resolve the coupling between the velocity and pressure fields. In this algorithm, the convective flux per unit mass through the computational cell from the so-called guessed velocity component faces is evaluated. Furthermore, a guessed pressure field is used to solve the momentum equations, and a pressure correction equation deduced from the continuity equation is adopted to obtain a pressure correction field, which is utilized for updating the velocity and pressure fields. To start the iteration process, the initial values of the guessed velocity and pressure fields are used. As the algorithm proceeds, the objective is to progressively improve these guessed fields. The process is iterated until the velocity and pressure fields converge. In all CDF simulations, there are two convergence criteria. First, all flow computation residuals for continuity, velocity components, turbulence kinetic energy and dissipation rate should be below 1E-4 level. Second, a value of velocity magnitude for a point that falls in an expected high-gradient-flow region is monitored during the computation until it reaches steady. The computational time is in the order of 20 h using 28 processors on a Beowulf system equipped with AMD 1.6 GHz Opteron processors. Table 1 summarizes the model boundary conditions and specifications used in the present CFD simulations.

Table 1.
CFD model boundary conditions and specifications.
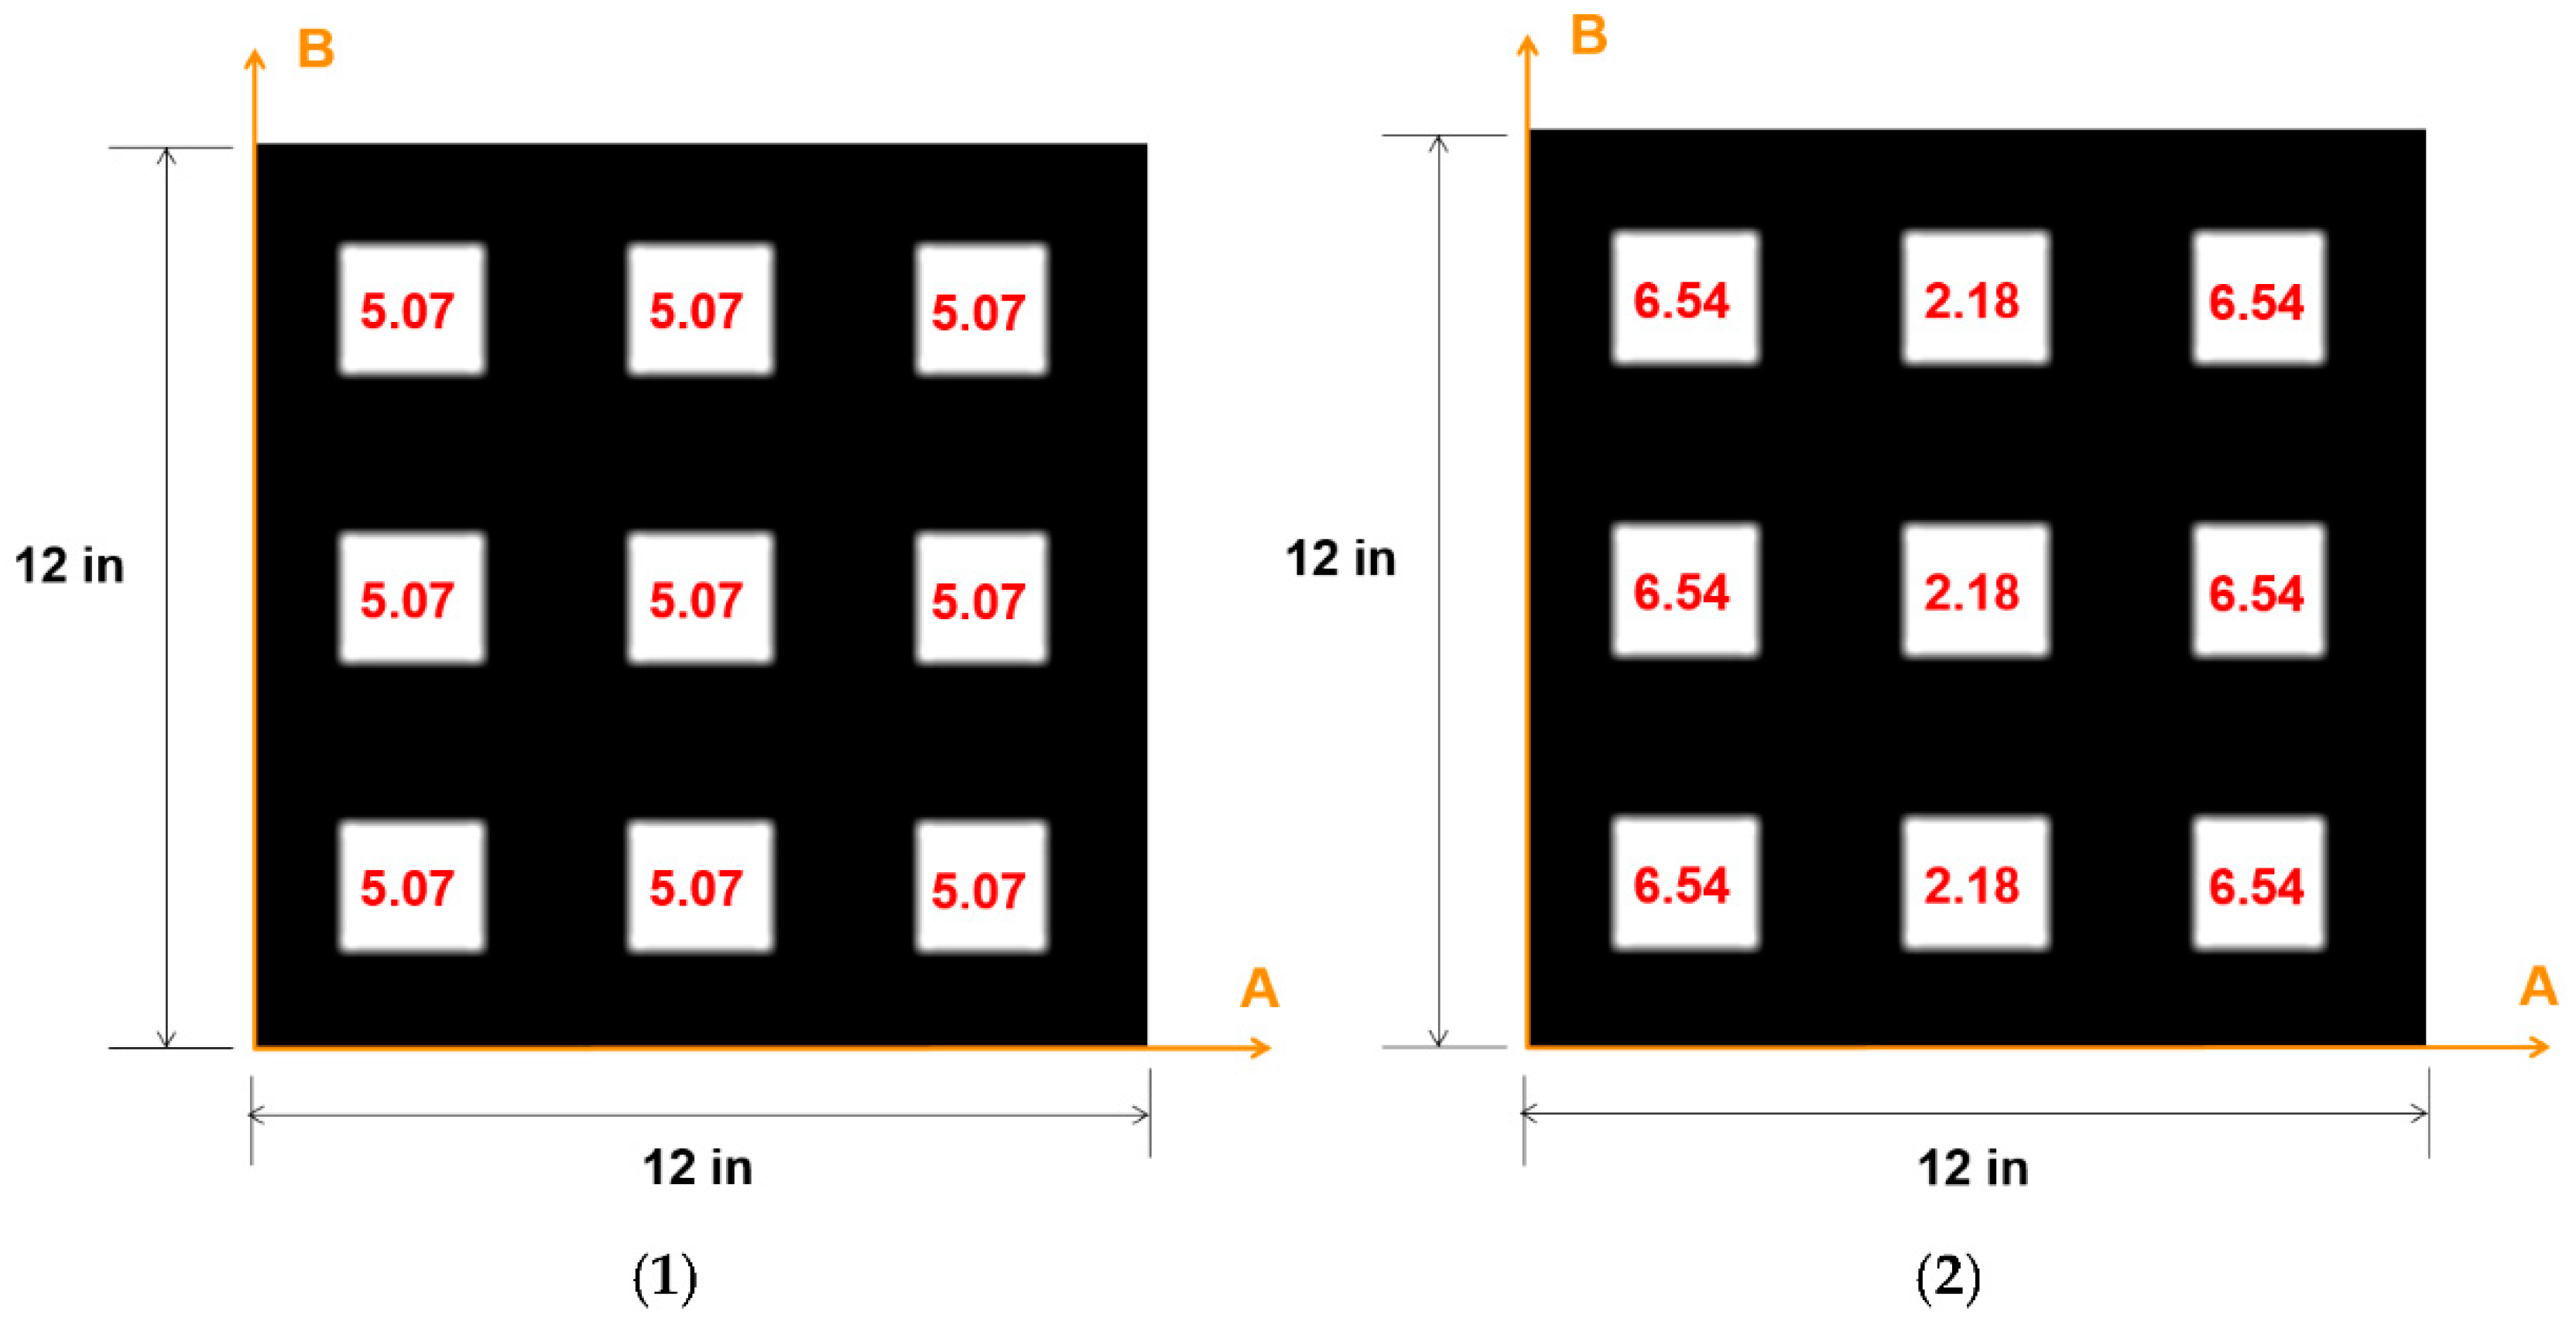
To illustrate the effect of tile flow velocity distortion, two generic CFD cases with the multiple openings model for the computational domain shown in Figure 2 are presented here: in one case, a uniform velocity issued from the nine openings at 5.07 m/s; for the other case, a non-uniform velocity issued from nine openings, with six openings having a velocity of 6.54 m/s and three openings having a velocity of 2.18 m/s (see Figure 4). This set of velocity distortions is arbitrarily selected, but the two cases have the same flow rate with different momentum. The non-uniform case (Case 2) has an average flow momentum ~17% higher than the uniform case (Case 1).
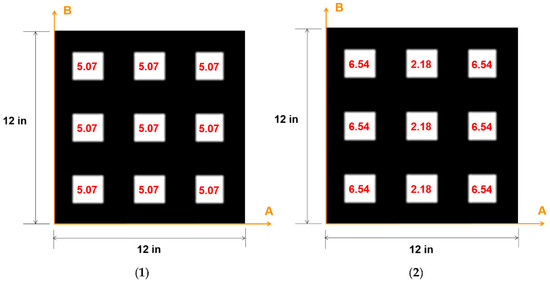
Figure 4.
Tile flow velocity distortion—numbers in the white areas are the velocity magnitudes issued from the openings: (1) uniform case, (2) non-uniform case.
4. Results and Discussion
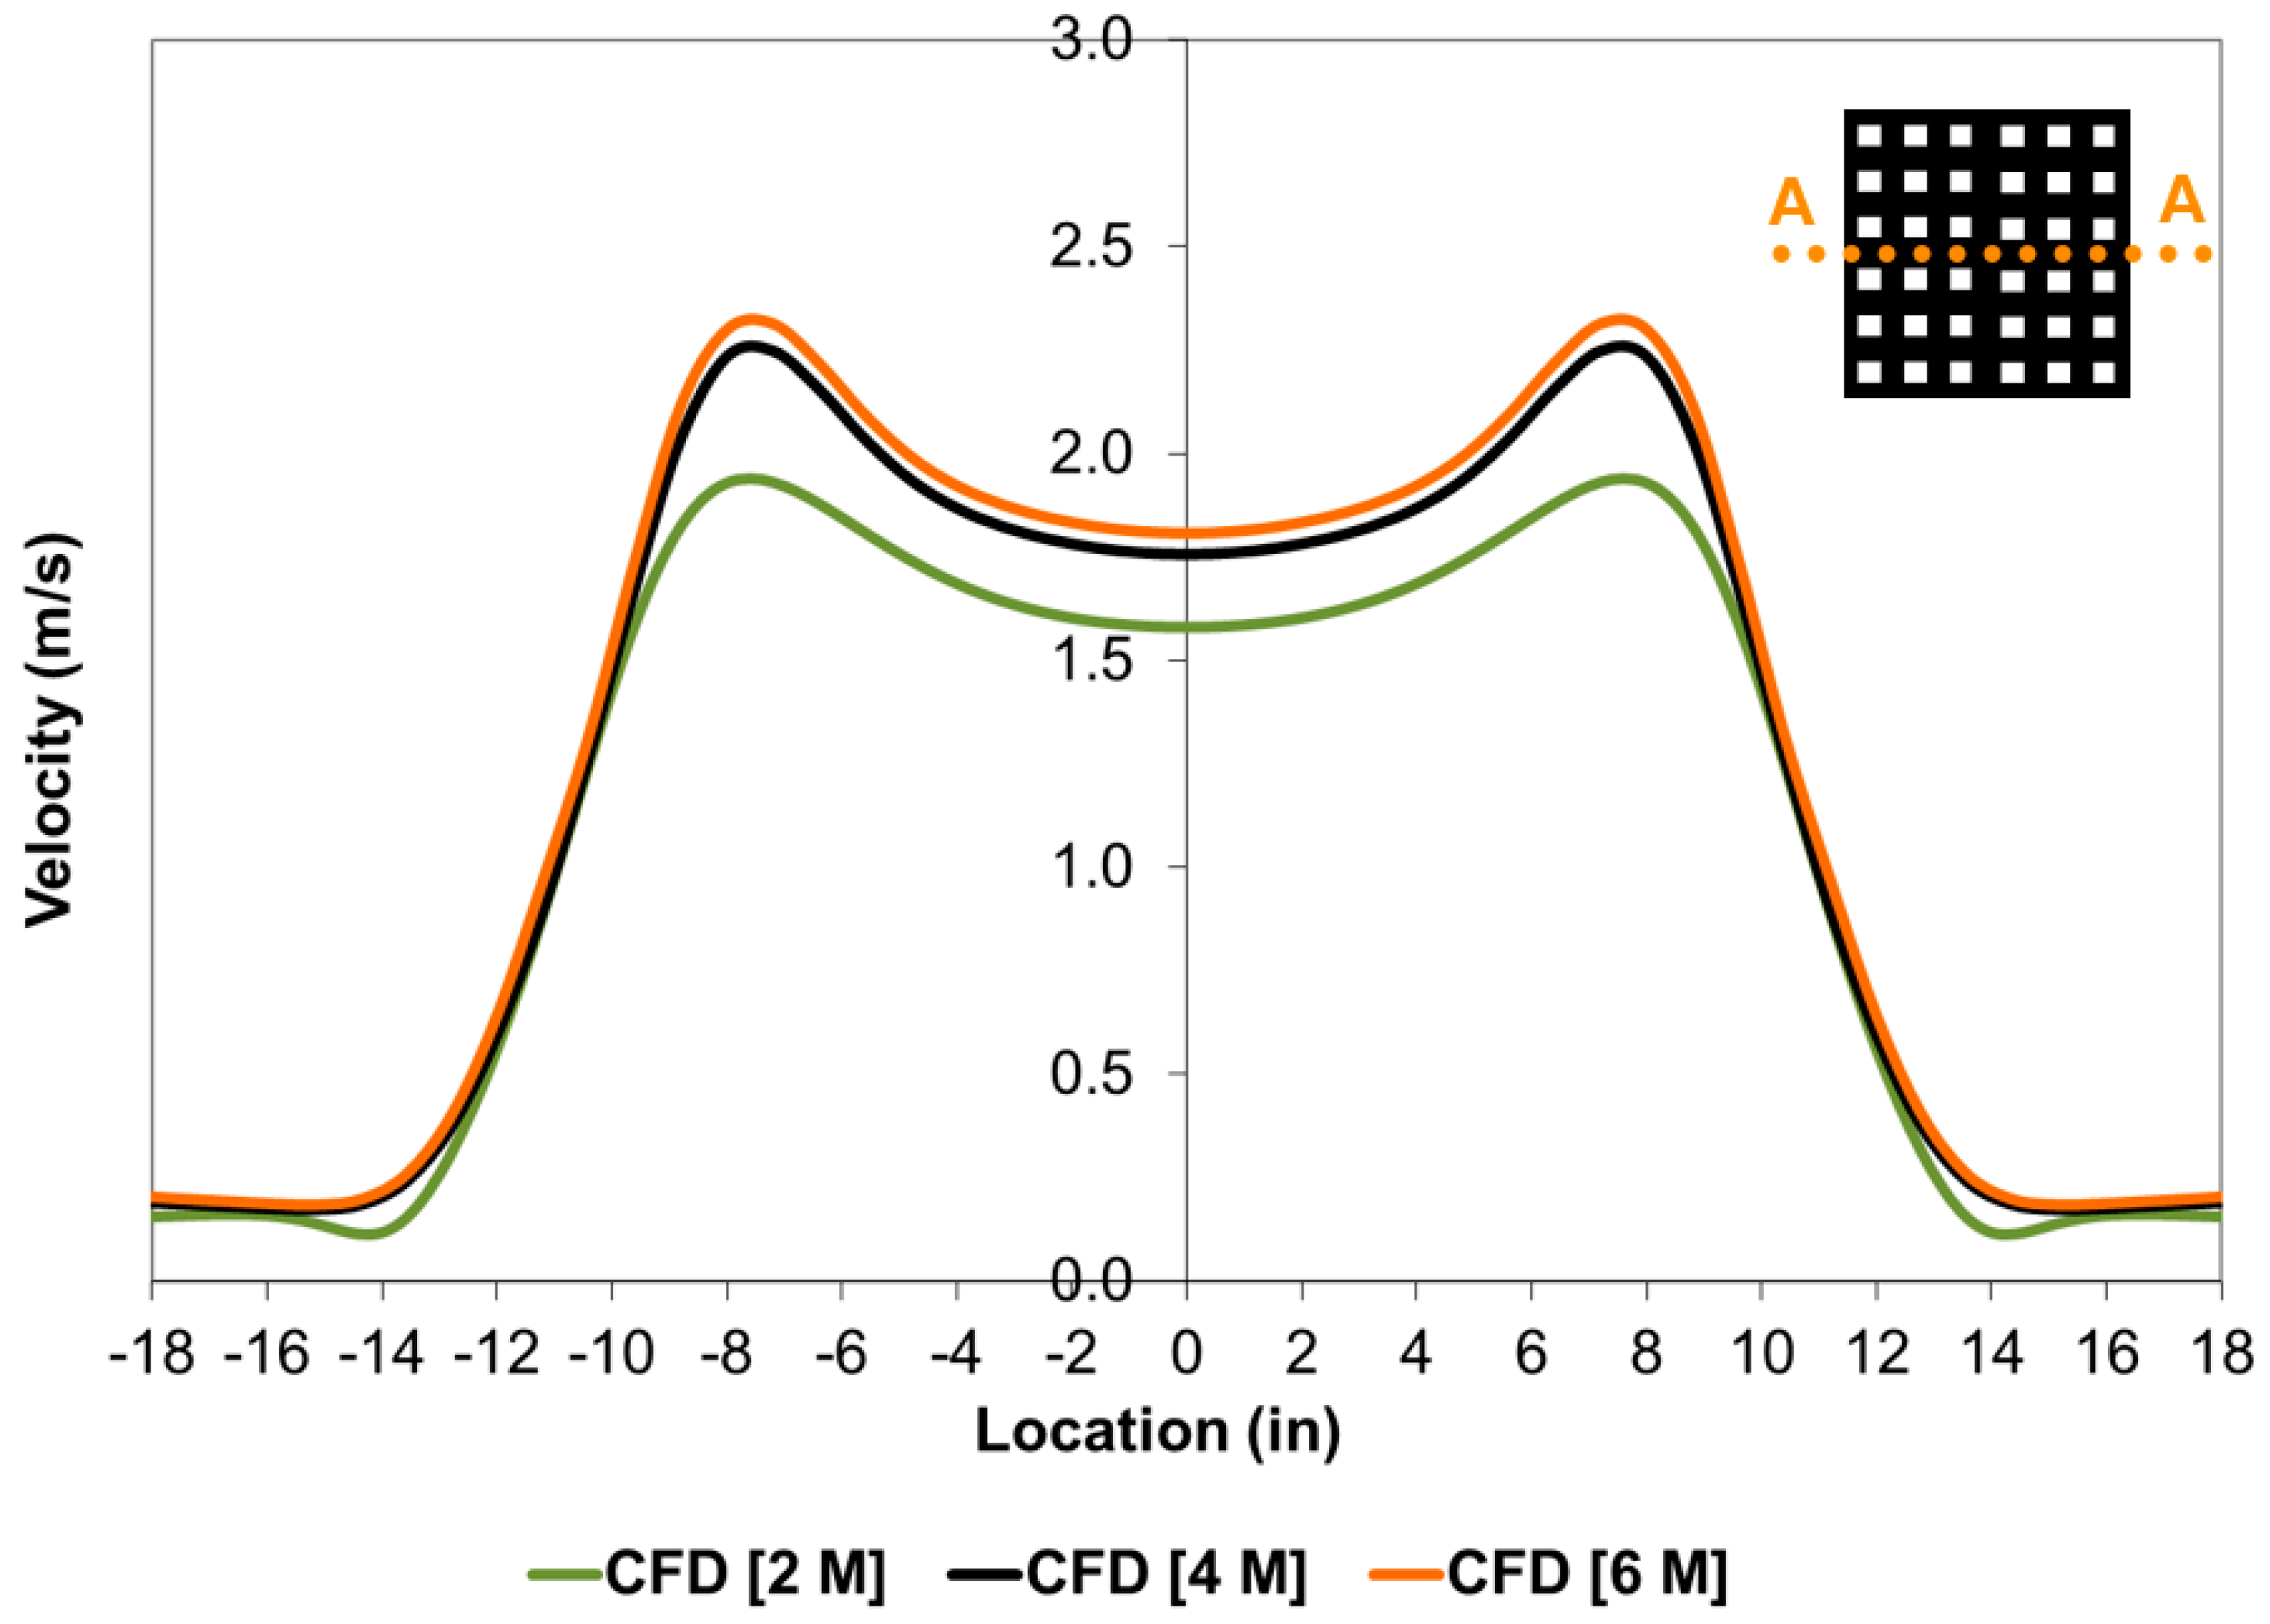
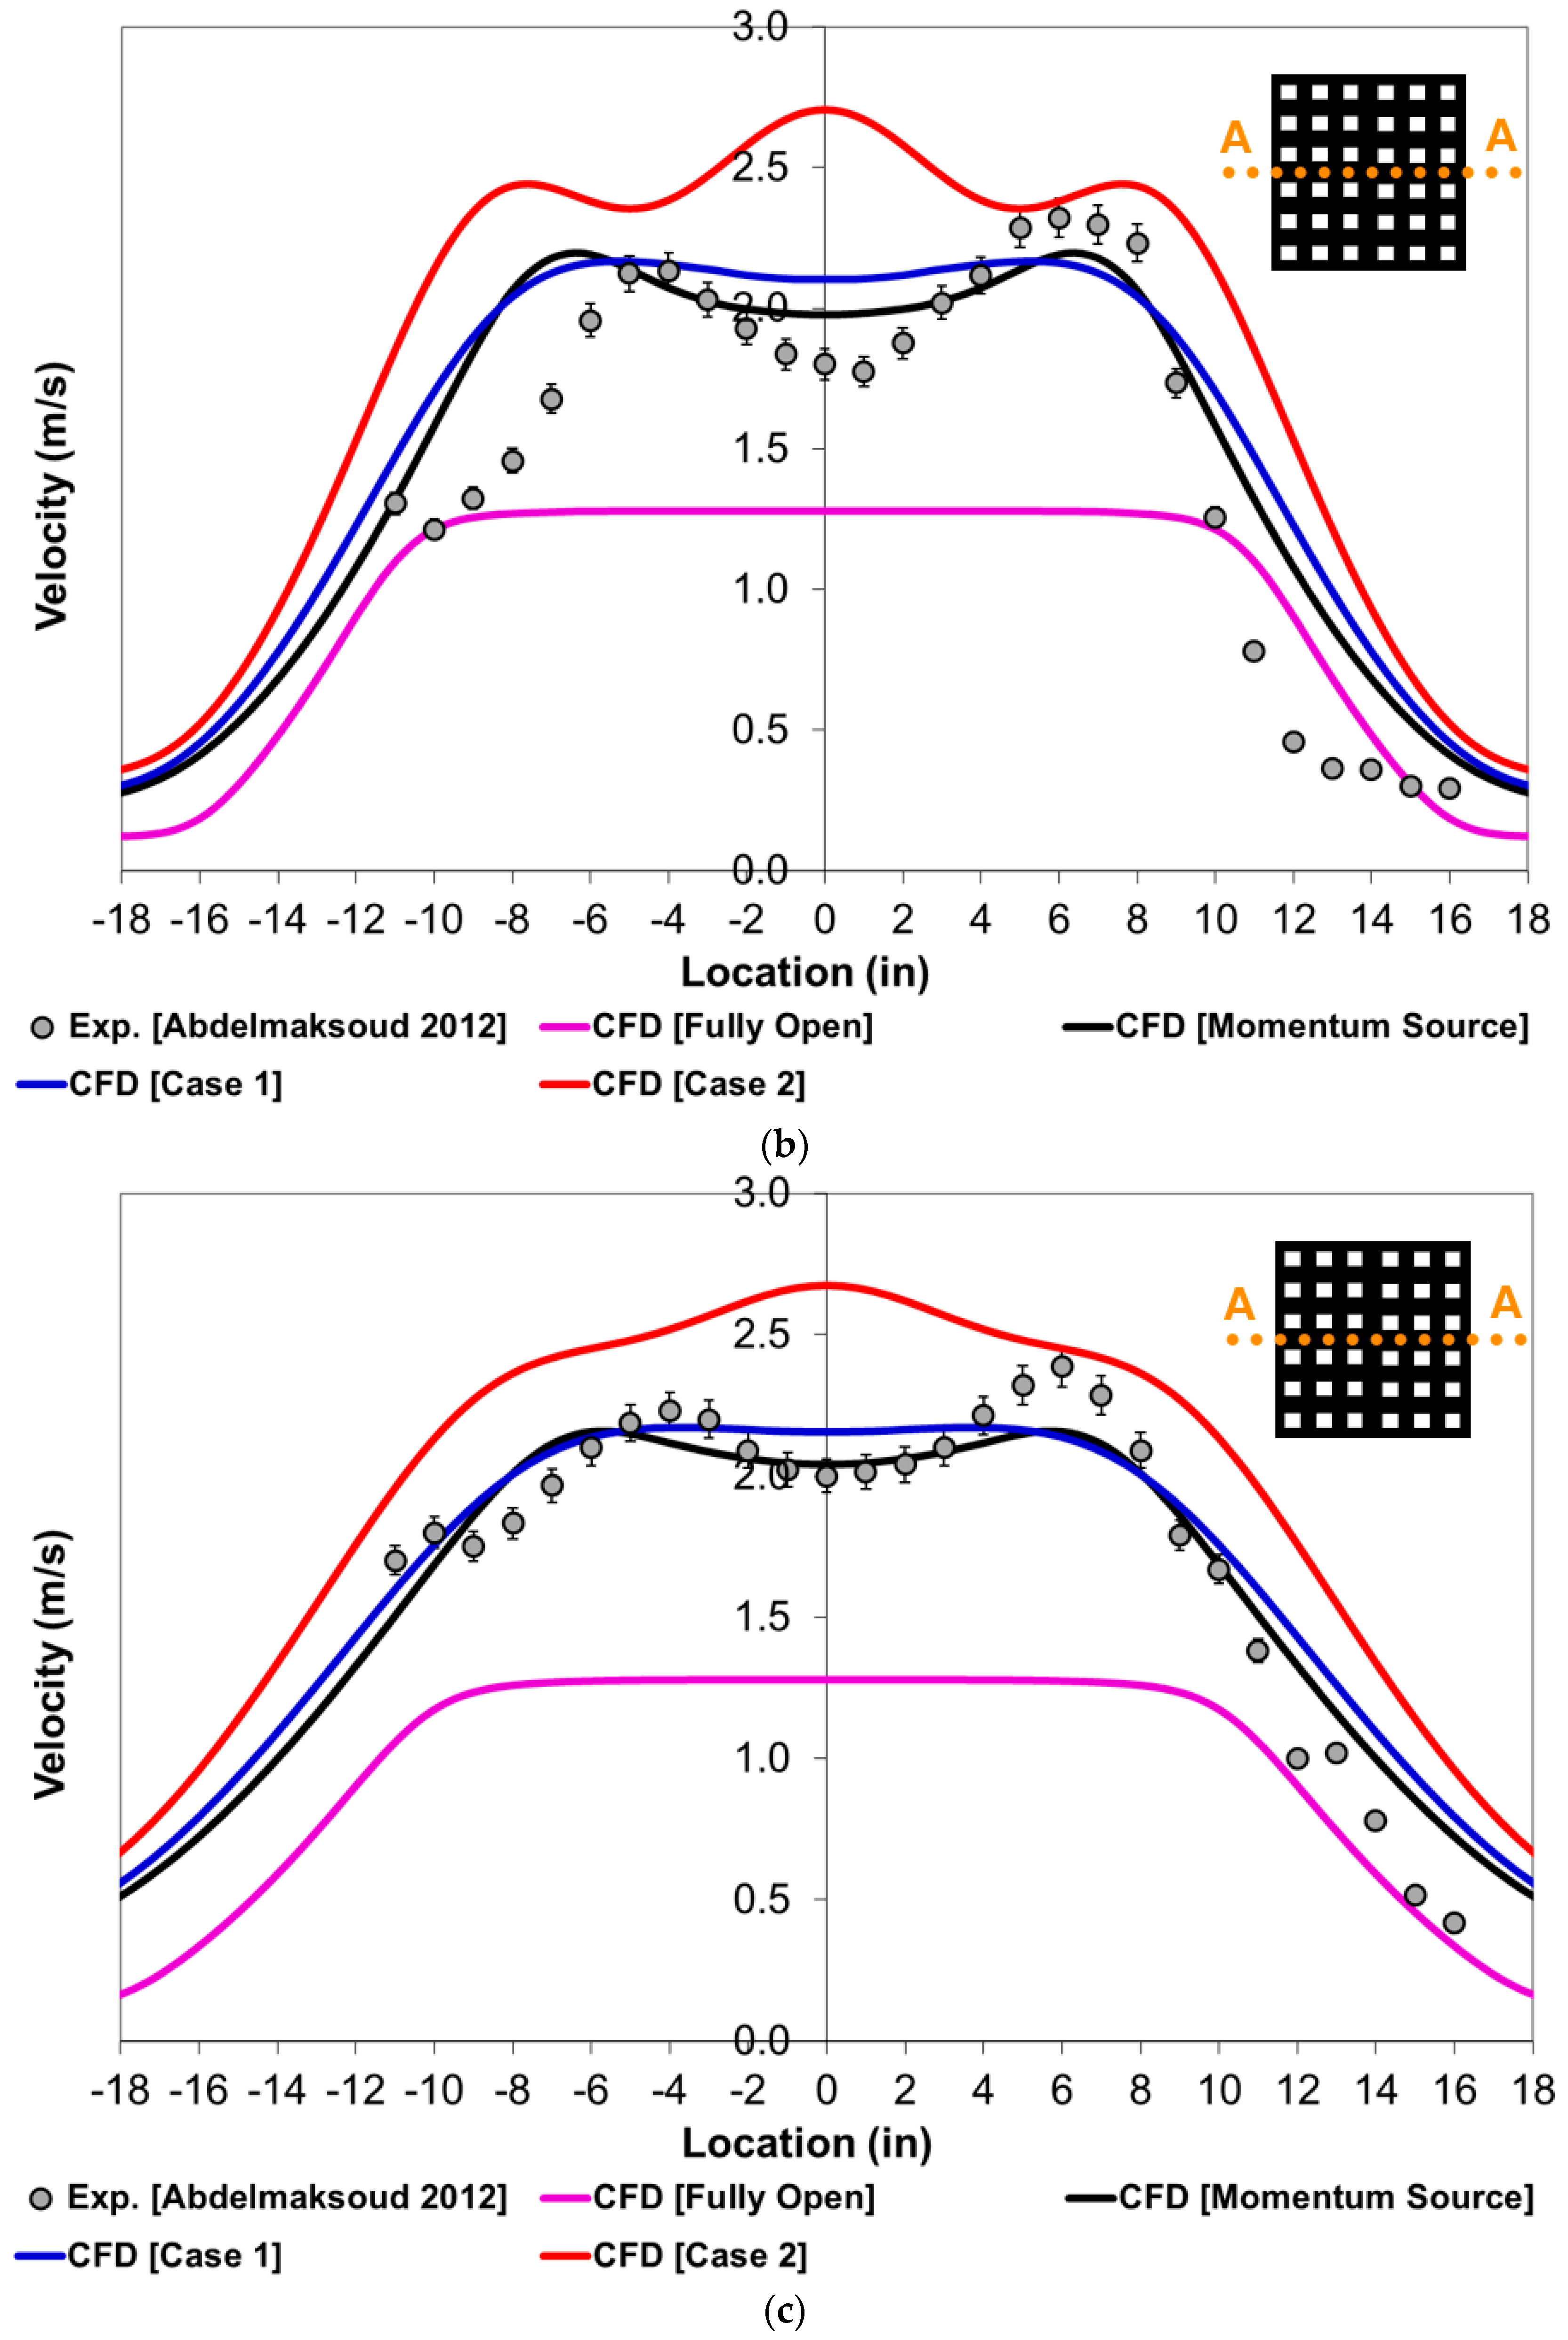
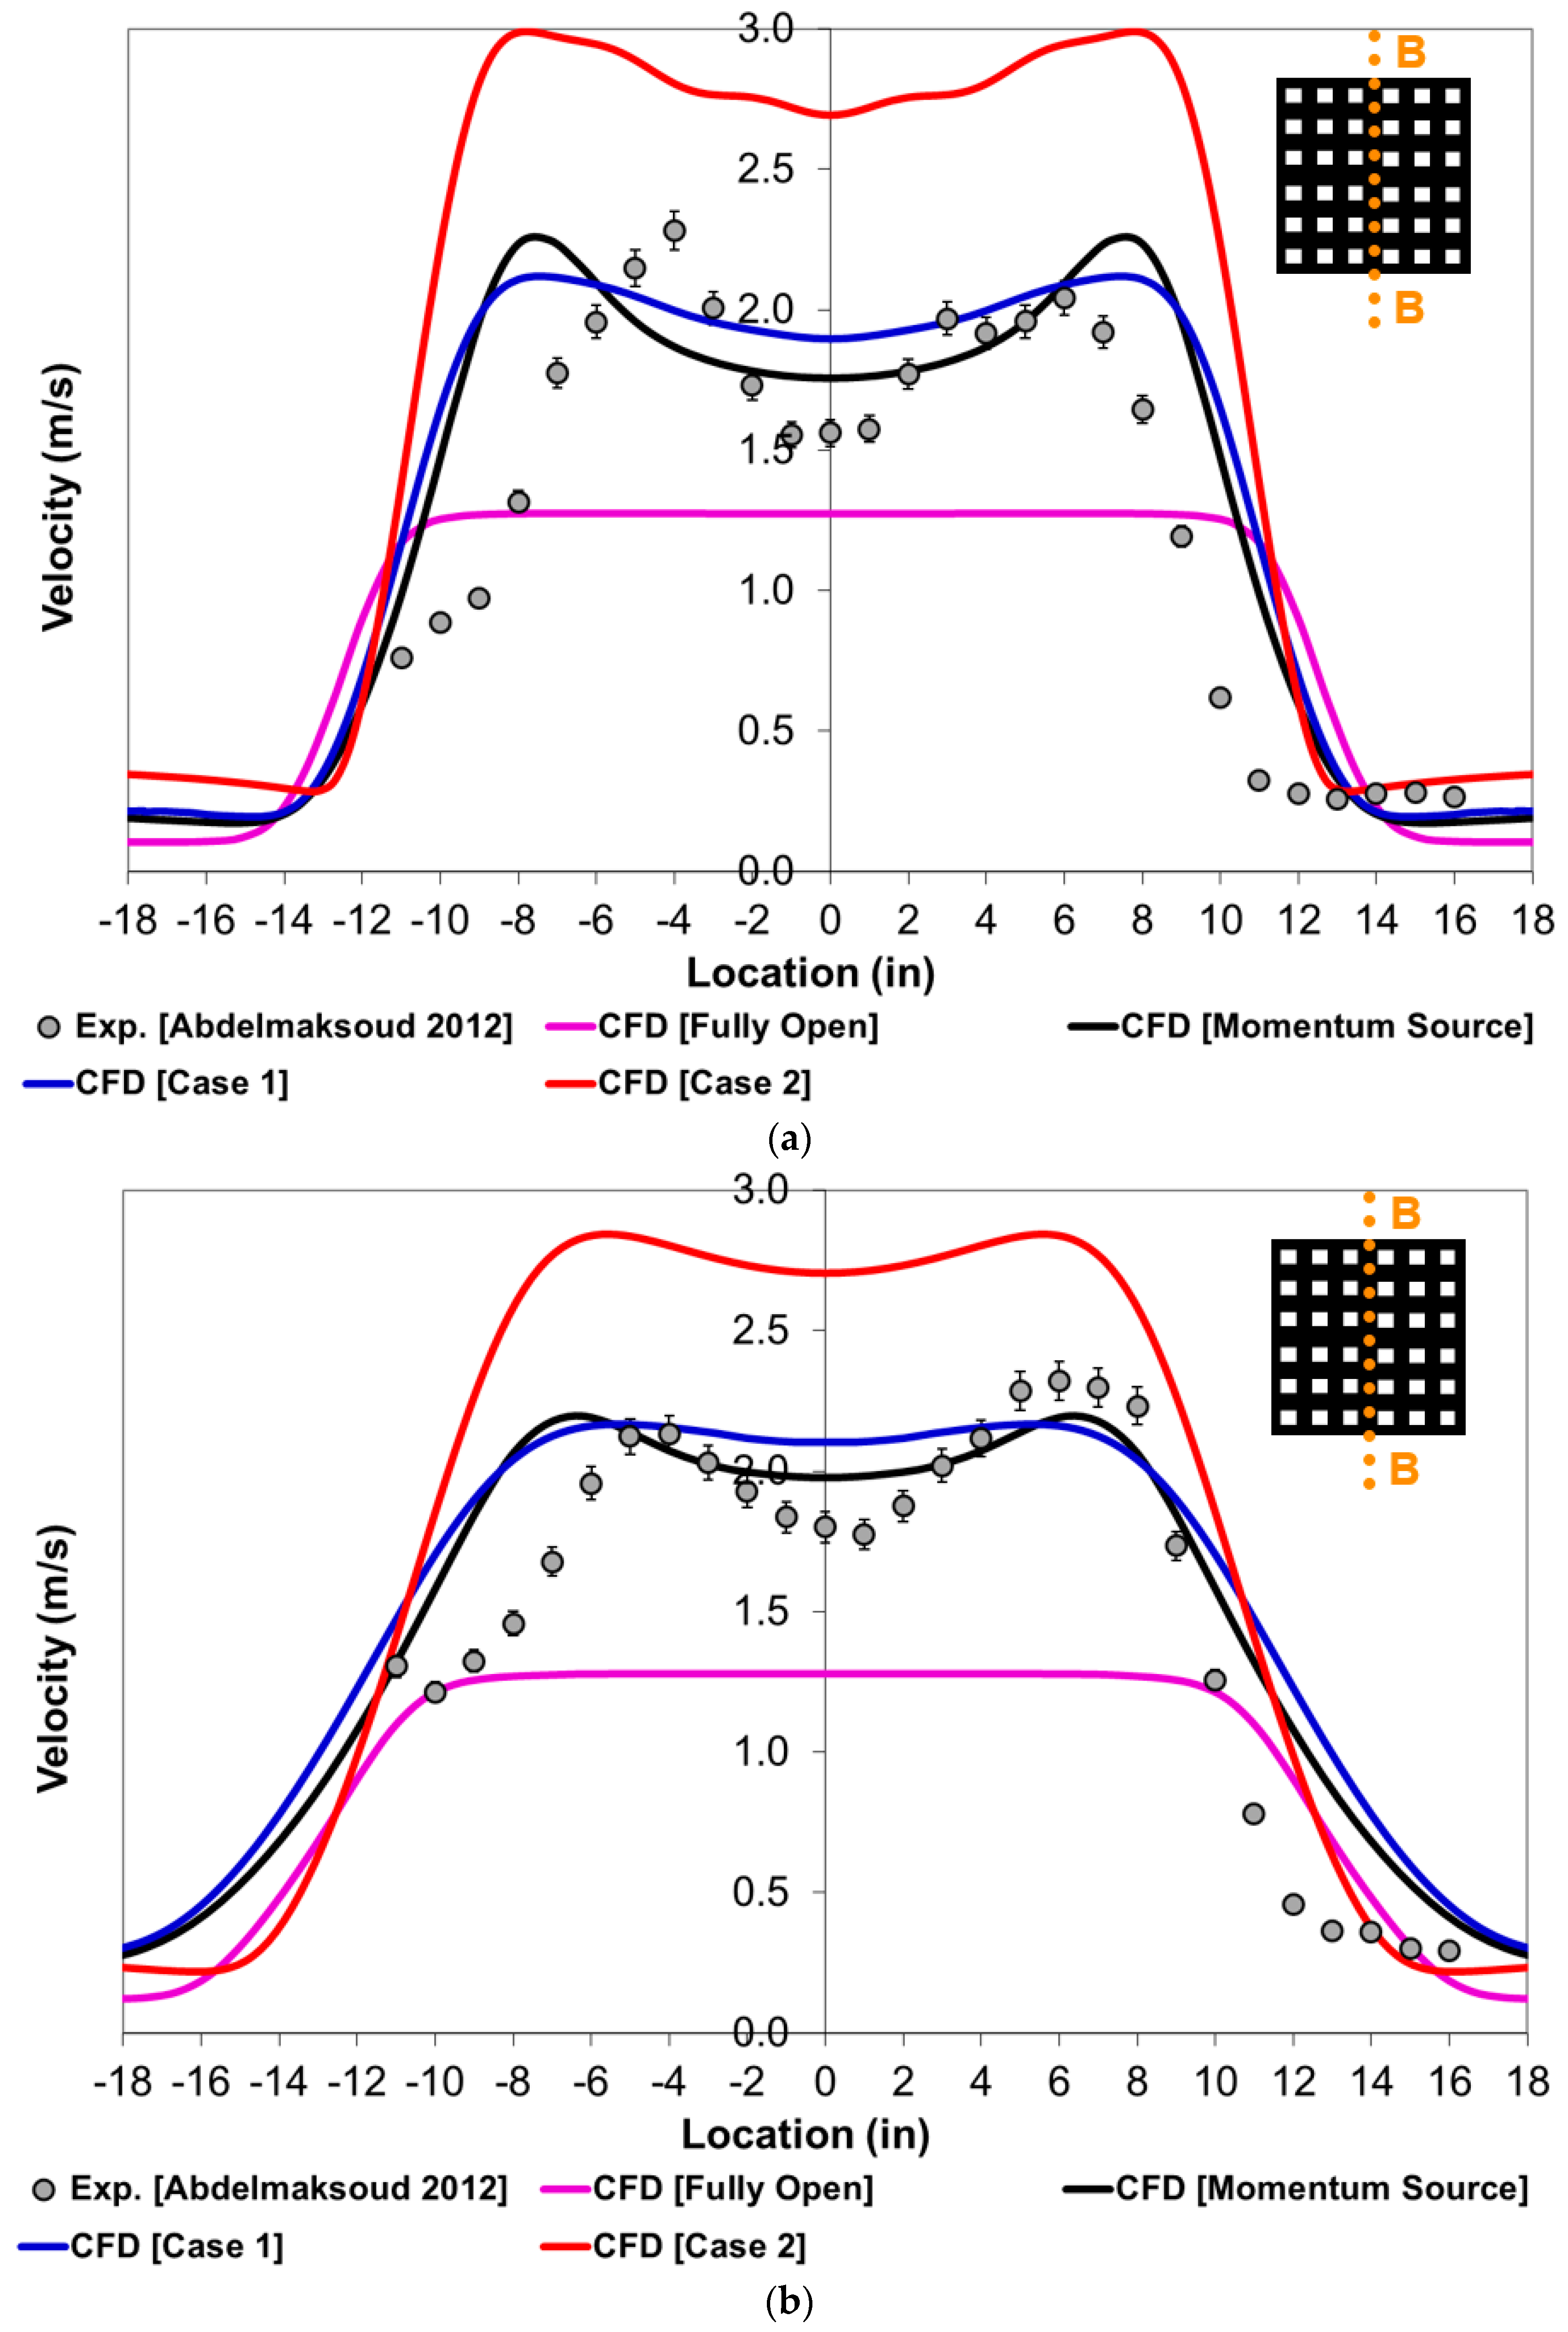
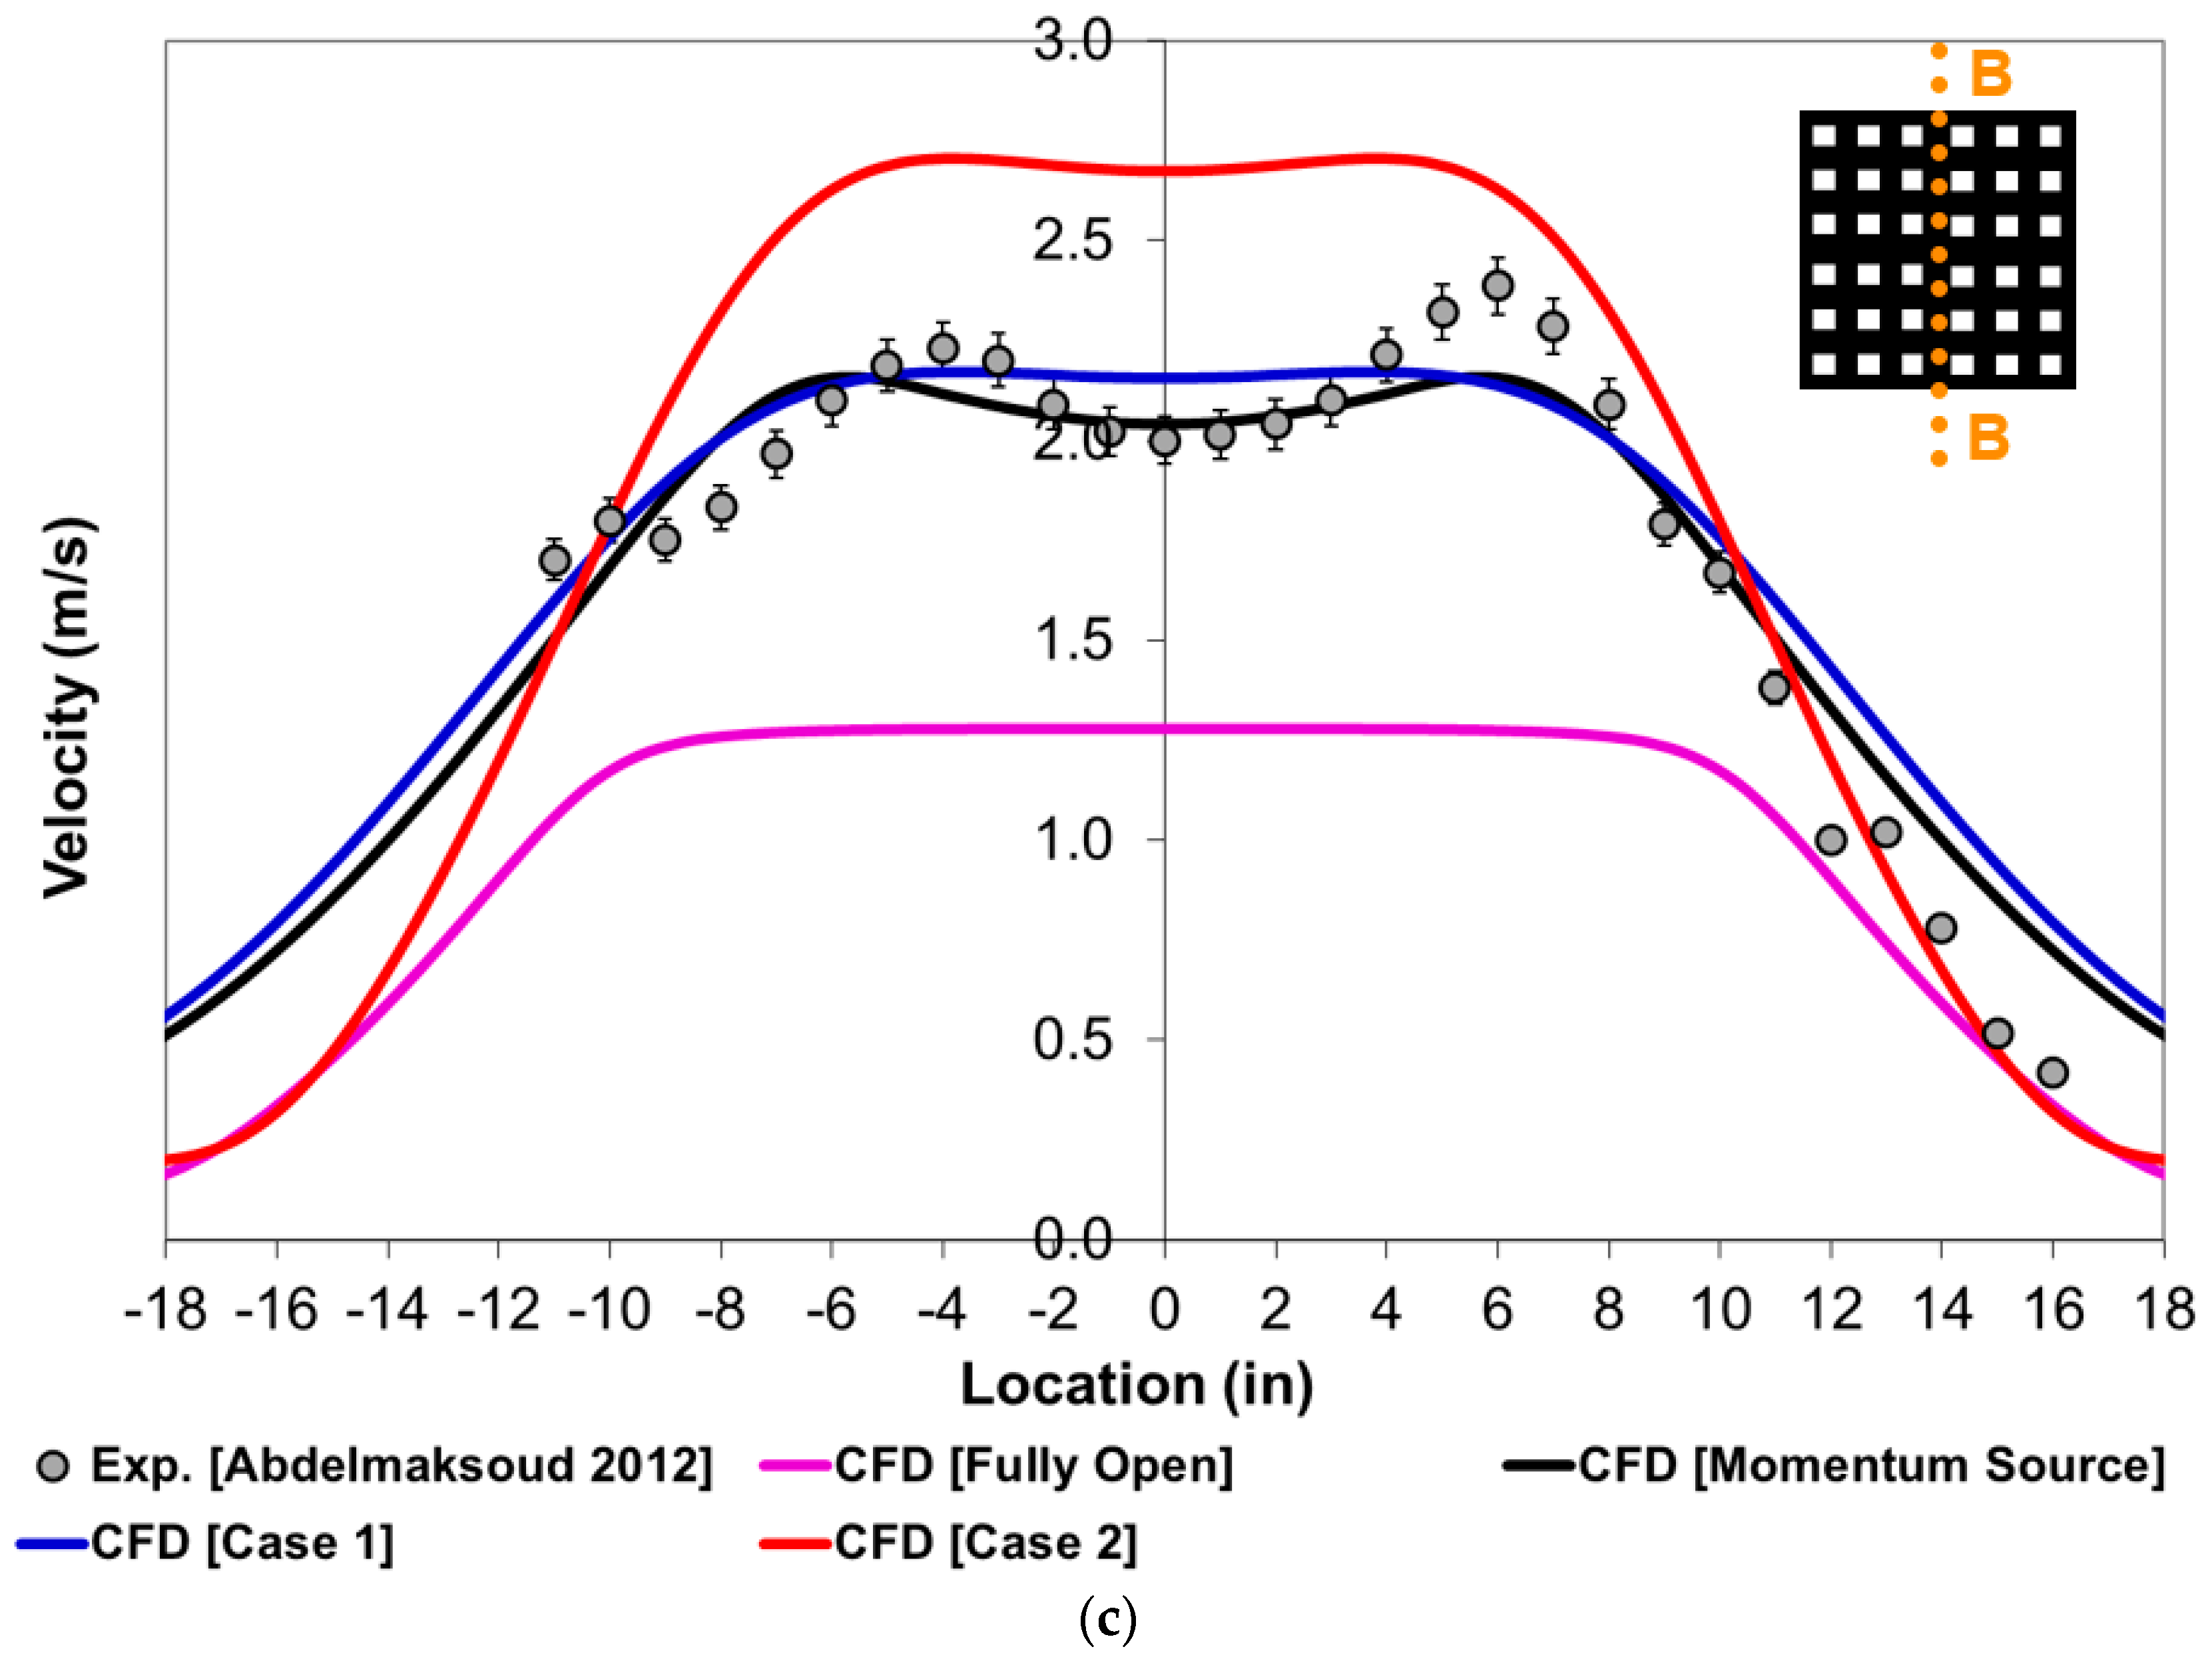
In this section, predicted velocity results of the various perforated tile models are presented and compared against experimental data to illustrate and discuss the tile flow distortion effect on the merged jets’ profile level and shape. Before validating the CFD model, a grid independence study was performed using three different grid sizes with 2, 4 and 6 million total cells for the CFD model with momentum source. Each grid size was created with the same mesh topology. The numerical results showed that the solution is grid independent when the total number of grid cells exceeded 4 million (Figure 5). In this case, the predicted values of velocity profiles are practically identical with those predicted when the total number of grid cells is 6 million. Accordingly, all the CFD simulations were performed using the mesh with 4 million grid cells. Figure 6 and Figure 7 show the predicted velocity profiles at heights of 1 ft, 2 ft and 3 ft for the fully open model, momentum source model and multiple openings model (uniform outflow and non-uniform outflow CFD cases) along two orthogonal lines (A-A and B-B) running through the tile center. The predicted velocity profiles are compared against experimental data conducted from the test chamber. The fully open model treats the tile as a single opening with 2 ft × 2 ft area, which ignores the perforation effect on mixing between the tile flow and surrounding air. The fully open model results are introduced here in order to represent the methodology of other researchers’ (i.e., Iyengar et al. [1]) modeling for perforated tile, which often assumes that the tile flow can be modeled as constant velocity based on a fully open tile (4 ft2 open area). In this case, mass flux is enforced at the expense of under-predicting momentum flux; the error in momentum flux can be as high as a factor of four for a 25% open perforated tile (1 ft2 actual open area). As a result, the flow rate of the air can be matched with measured data, but not the initial momentum flux of the tile flow entering the domain. Since jet entrainment is a strong function of its initial momentum flux, this error can be significant with respect to predicting the mixing of the surrounding room air into the tile core flow. The momentum source model corrects for the momentum deficit in the jet issuing from the entire face area of the perforated tile by adding a body-force field in the computational volume immediately above the tile face. The multiple openings model that has the correct initial momentum allows for the surrounding air to penetrate into the tile jets between the openings and results in more mixing between the surrounding air and the tile jets. One of the important observations from the collected velocity data is that the core velocity for a 25% perforated tile discharging 1000 cfm into the chamber is ~2 m/s (Figure 6 and Figure 7). This is greater than the 1.27 m/s value (based on a fully open tile), but it is also significantly lower than the velocity based on the perforated area (25%), which would have been 5.08 m/s. Since the velocity experimental data shows an equivalent potential core velocity of less than half this value, it is clear that a large portion of the jet initial momentum is lost during the merging of the small tiny jets (from tile pores) into a single merged jet and confirming the presence of large flow entrainment of surrounding air into the center of the tile via the gaps between the small openings (pores). The results with momentum source model and multiple openings model of Case 1 (uniform outflow) show good prediction of the velocity magnitude in the potential core, while the general shape of the velocity profile indicates that flow entrainment is captured with some accuracy (Figure 6 and Figure 7). Another interesting observation is that, compared to results of all CFD models, the experimental data show a narrow-width potential core. This is another conformation of large entrainment for surrounding air into center of the tile due to gaps between the tile pores. It is a challenging target to capture the exact shape of the velocity profiles due to the complex mixing between the air coming out from the tile face (through hundreds of pores) and surrounding air. This target is nearly achieved with the momentum source model and multiple openings model of Case 1, but far from the tile surface (3 ft height from the tile face). To accurately predict the exact shape of velocity profiles near the tile surface, the exact shape of perforated tile (number of pores and gaps) should be modeled, which is an impractical task, especially in big computational domains, such as data center applications. As expected, Case 2 (non-uniform outflow) velocity magnitudes in the potential core are always higher than the magnitudes in Case 1 because of its higher initial momentum (~17%). Again, imposing the correct level of initial tile flow momentum is important with respect to being able to correctly predict the level of mixing between the tile flow and the surrounding air in indoor CFD simulations. Another interesting observation is that, although the tile geometrical feature is symmetrical, the jet shape is non-symmetrical for Case 2 due to the asymmetrical nature of the velocity magnitude from the openings. This non-symmetry can be observed when comparing the velocity profiles along lines A-A and B-B at the same heights for Case 2.

Figure 5.
Grid independence study for velocity profiles at 1 ft height along line A-A.
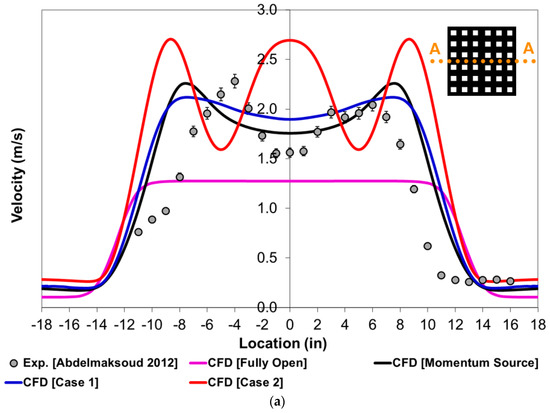
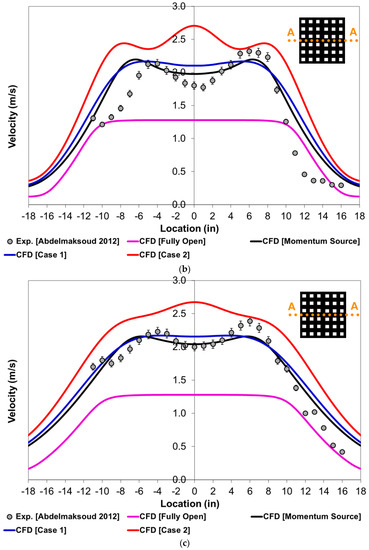
Figure 6.
(a)Tile flow distortion effect on velocity profiles at 1 ft height along line A-A. (b) Tile flow distortion effect on velocity profiles at 2 ft height along line A-A. (c) Tile flow distortion effect on velocity profiles at 3 ft height along line A-A.
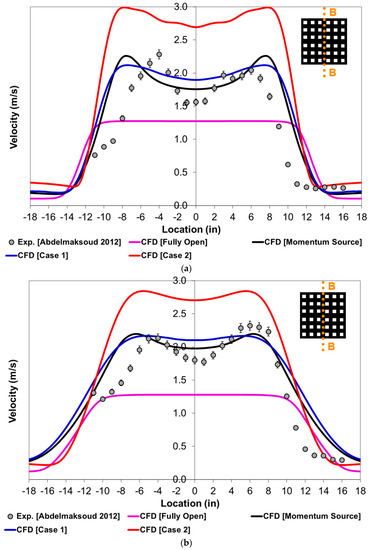
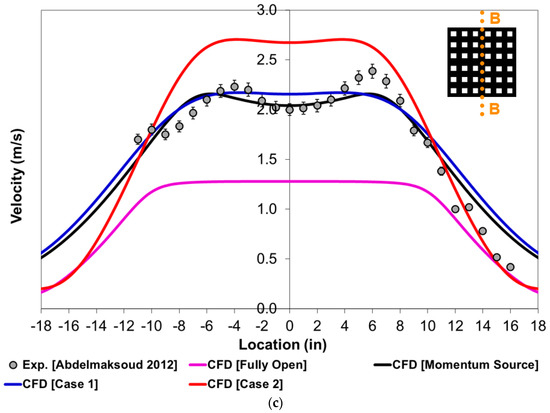
Figure 7.
(a) Tile flow distortion effect on velocity profiles at 1 ft height along line B-B. (b) Tile flow distortion effect on velocity profiles at 2 ft height along line B-B. (c) Tile flow distortion effect on velocity profiles at 3 ft height along line B-B.
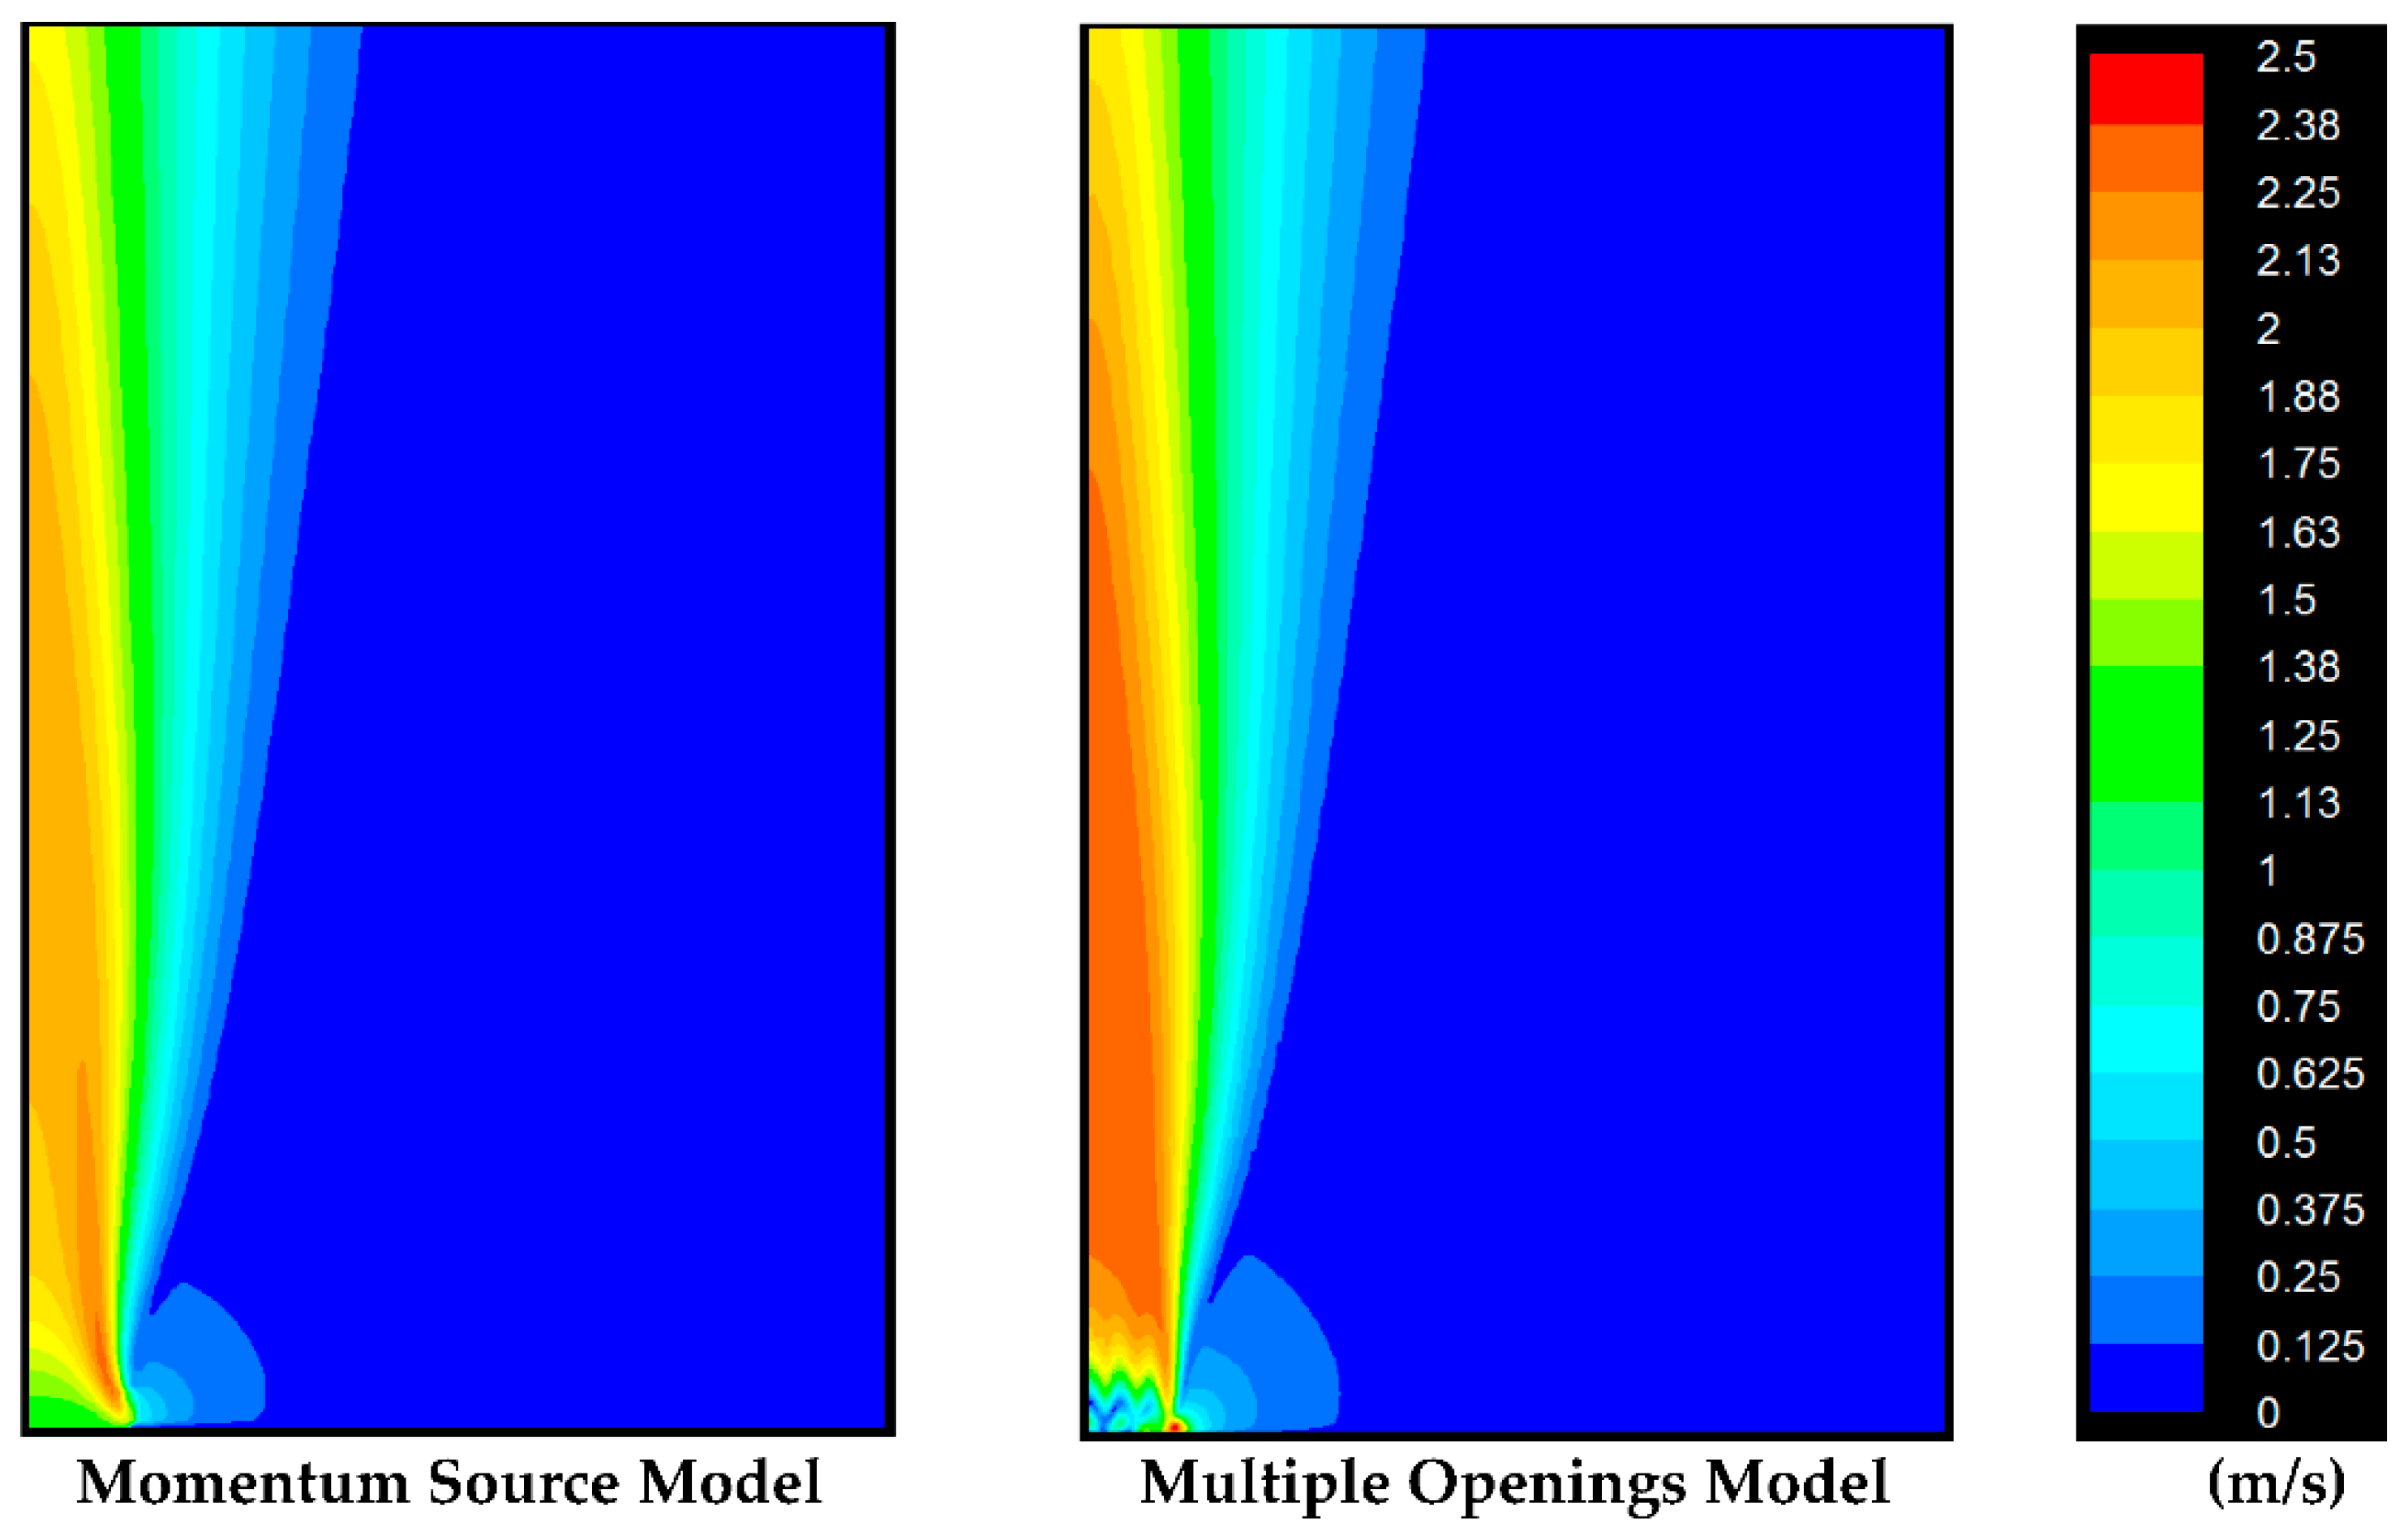
The results shown in Figure 6 and Figure 7 indicate that the velocity predictions by the momentum source model and multiple openings model (uniform outflow) are very much similar. Additionally, a comparison of velocity fields predicted by both models is presented in Figure 8, which shows a vertical plane cutting through the symmetry plane of the tile. It is observed that the entrainment effect near the tile surface is nearly comparable for the two models. Additionally, the predicted velocity field patterns are very much similar. Thus, the momentum source model, which is simpler and more practical, can be utilized instead of other complicated models to account for the momentum correction coming out from perforated surfaces. A detailed, pore-by-pore definition of the velocity boundary conditions at the tile surface in the CFD is a challenging task, and it is impracticable in large computational domains, such as data center and indoor environment applications.

Figure 8.
Velocity fields predicted by momentum source model and multiple openings model along vertical plane cutting through the symmetry plane of the tile.
Since the momentum source model discussed earlier did not account for the outflow non-uniformity from the different openings within the tile, a correction for tile flow distortion effect is necessary. For example, while Case 1 predicts a potential core velocity of ~2.2 m/s, the corresponding average velocity for Case 2 is higher. Thus, if we want the momentum source model to handle Case 2, an adjustment factor (C) to the body force in Equation (6) is necessary. The corrected body-force equation is expressed as follows:
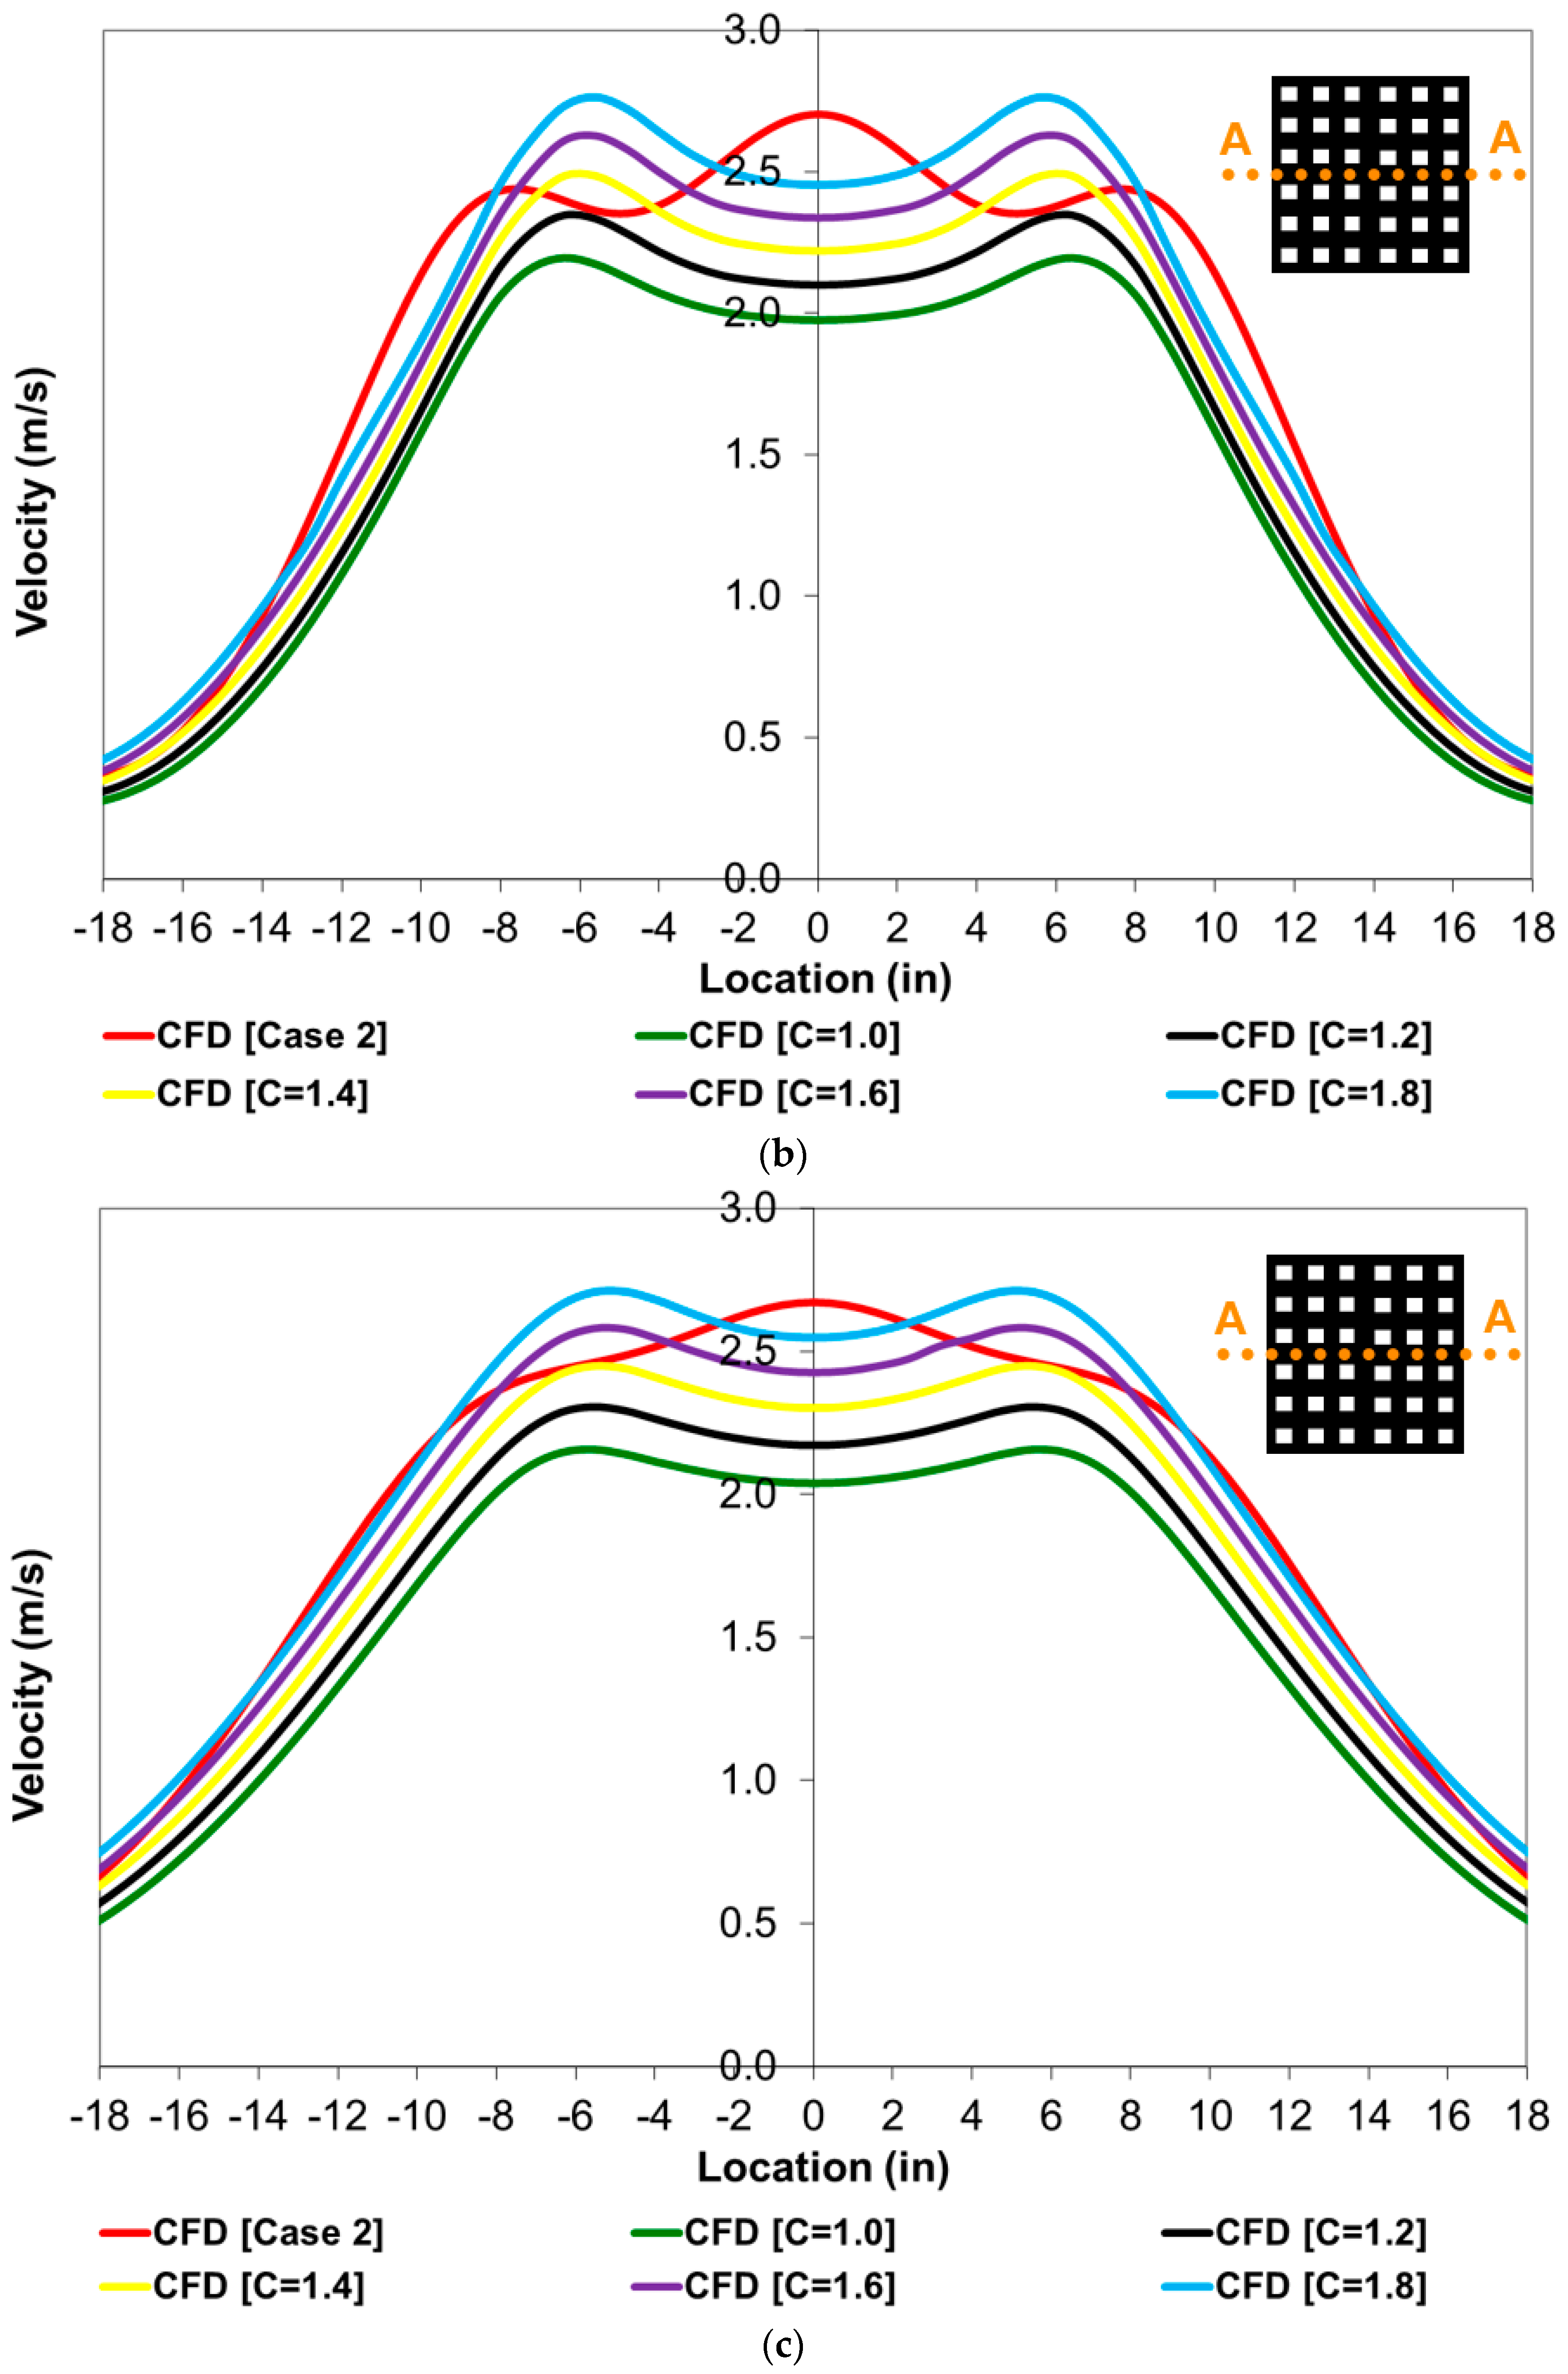
Figure 9 and Figure 10 show comparisons of Case 2 velocity profiles (red curves) against the momentum source model velocity profiles (green curves) at several values of the adjustment factor C (varying from 1.0 to 1.8). In order to find the best C factor that matches Case 2 results, momentum integration values over the tile area at different heights from the floor (1 ft, 2 ft and 3 ft) for the momentum source model results were compared against Case 2 momentum values calculated using the same approach. We found that C~1.6 will match Case 2 momentum values. Thus, the tile velocity distortion study presented here showed a potential reason to increase the body-force value in the momentum source model for tile flow CFD simulations.
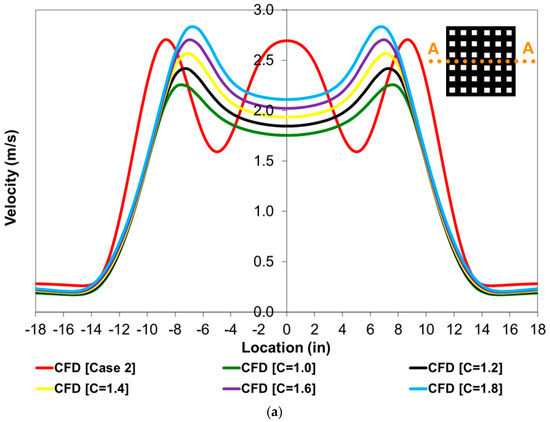
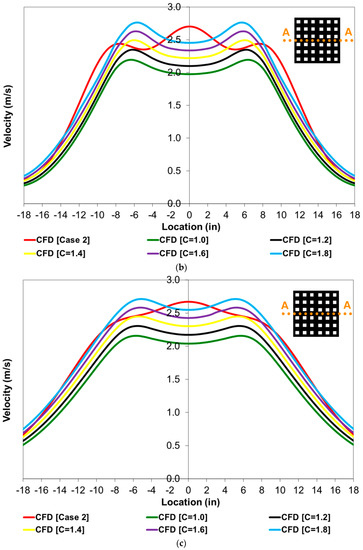
Figure 9.
(a) Velocity profiles at 1 ft height along line A-A for Case 2 and momentum source model results at different C values. (b) Velocity profiles at 2 ft height along line A-A for Case 2 and momentum source model results at different C values. (c) Velocity profiles at 3 ft height along line A-A for Case 2 and momentum source model results at different C values.
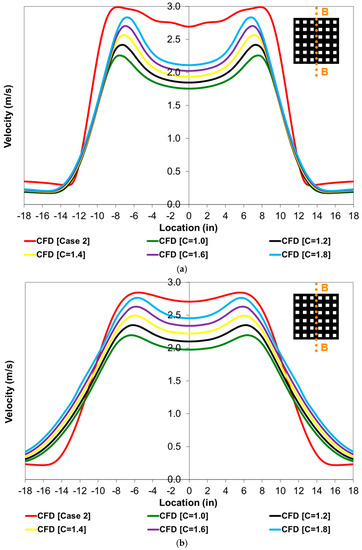
Figure 10.
(a) Velocity profiles at 1 ft height along line B-B for Case 2 and momentum source model results at different C values. (b) Velocity profiles at 2 ft height along line B-B for Case 2 and momentum source model results at different C values. (c) Velocity profiles at 3 ft height along line B-B for Case 2 and momentum source model results at different C values.
5. Summary and Conclusions
In this paper, combined experimental and numerical investigations were carried out to achieve a simplified CFD model for perforated tile/diffuser with a distorted outflow. The experimental data of air velocity magnitudes for an isolated perforated tile placed in a small test chamber were compared to the CFD results of two models for the perforated tile. One is a simple momentum source model (a practical but reasonably accurate model), and the other is a multiple openings model (a computationally prohibitive but very accurate model). For the multiple openings model, two CFD cases were investigated. In one case, a uniform velocity issued from the perforated tile pores was assumed. In the other case, with the same overall mass flow rate, a non-uniform velocity was assumed.
The CFD results showed that the momentum source model predicts the correct level of merged velocity magnitude in the potential core of Case 1 (uniform velocity) and experimental data, but it under-predicts the level of Case 2 (non-uniform velocity) because of its higher initial momentum. Thus, to handle Case 2 with the simple/practical momentum source model, an adjustment factor (C) to the body-force value was necessary. Several values of the adjustment factor C were numerically investigated, and we found that C~1.6 achieves the best match with Case 2 momentum values. In summary, it is concluded that modeling a distorted outflow from perforated tile/diffuser using the momentum source model to conserve both mass and momentum is appropriate but with an adjustment factor to the body-force value.
Funding
This work was funded by the Deanship of Scientific Research at Jouf University through research grant No (DSR-2021-02-0117).
Institutional Review Board Statement
Not applicable.
Informed Consent Statement
Not applicable.
Data Availability Statement
The data are available from the author upon reasonable request.
Acknowledgments
The author extends his appreciation to the Deanship of Scientific Research at Jouf University for funding this work through research grant No (DSR-2021-02-0117).
Conflicts of Interest
The author declares no conflict of interest.
Nomenclature
| CFD | Computational fluid dynamics |
| RANS | Reynolds-averaged Navier–Stokes |
| RMS | Root mean square |
| Volume of body-force field, m3 | |
| A | Perforated tile area, m2 |
| Fy | Body-force-per-unit volume, N/m3 |
| Q | Volume flow rate, m3/s |
| y+ | Dimensionless wall distance |
| xi and xj | Cartesian coordinates, m |
| u | Air velocity, m/s |
| p | Air pressure, Pa |
| C | Body-force adjustment factor due to tile flow distortion |
| k | Turbulent kinetic energy, m2/s2 |
| Gk | Turbulent kinetic energy generation, m2/s2 |
| C2 | Turbulence model constant |
| Greek symbols | |
| ρ | Air density, kg/m3 |
| σ | Fraction of tile perforation |
| μ | Air dynamic viscosity, kg/m.s |
| μt | Turbulent viscosity, kg/m.s |
| ν | Air kinematic viscosity, m2/s |
| ε | Turbulent dissipation rate, m2/s3 |
| σk | Turbulent Prandtl numbers for k |
| σε | Turbulent Prandtl numbers for ε |
References
- Iyengar, M.; Schmidt, R.; Hamann, H.; Van Gilder, J. Comparison between Numerical and Experimental Temperature Distributions in a Small Data Center Test Cell. In Proceedings of the IPACK2007, ASME InterPACK’ 07, Vancouver, BC, Canada, 8–12 July 2007. [Google Scholar]
- Gangisetti, K.; Claridge, D.; Srebric, J.; Paulus, M. Influence of reduced VAV flow settings on indoor thermal comfort in an office space. Build. Simul. 2016, 9, 101–111. [Google Scholar] [CrossRef]
- Abdelmaksoud, W.; Dang, T.; Khalifa, H.; Schmidt, R. Improved Computational Fluid Dynamics Model for Open-Aisle Air-Cooled Data Center Simulations. Electron. Packag. 2013, 135, 030901-1–030901-13. [Google Scholar] [CrossRef]
- Schwarz, W. Integrating ASHRAE-Funded Research into Air Flow Modeling Software. In Proceedings of the Seminar 25, ASHRAE Annual Meeting, Honolulu, HI, USA, 22–26 June 2002. [Google Scholar]
- Chen, Q. Simplified Diffuser Boundary Conditions for Numerical Room Air Flow Models; ASHRAE RP-1009 Final Report; ASHRAE: Atlanta, GA, USA, 2000. [Google Scholar]
- Abdelmaksoud, W.A. Experimental and Numerical Investigations of the Thermal Environment in Air-Cooled Data Centers. Ph.D. Thesis, Department of Mechanical and Aerospace Engineering, Syracuse University, Syracuse, NY, USA, 2012. [Google Scholar]
- Hu, R.; Fanning, T. A Momentum Source Model for Wire-Wrapped Rod Bundles—Concept, Validation, and Application. Nucl. Eng. Des. 2013, 262, 371–389. [Google Scholar] [CrossRef]
- Deng, B.; Wang, J.; Tang, J.; Gao, J. Improvement of the Momentum Method as the Diffuser Boundary Condition in CFD Simulation of Indoor Airflow: Discretization Viewpoint. Build. Environ. 2018, 141, 55–60. [Google Scholar] [CrossRef]
- Phan, L.; Hu, B.; Lin, C. An Evaluation of Turbulence and Tile Models at Server Rack Level for Data Centers. Build. Environ. 2019, 155, 421–435. [Google Scholar] [CrossRef]
- Nielsen, P. Representation of Boundary Conditions at Supply Openings; Technical Report, IEA, Annex 20, Research item 1.11; International Energy Agency: Paris, France, 1989.
- Srebric, J.; Chen, Q. A Method of Test to Obtain Diffuser Data for CFD Modeling of Room Airflow. ASHRAE Trans. 2011, 107, 108–116. [Google Scholar]
- Srebric, J.; Chen, Q. Simplified Numerical Models for Complex Air Supply Diffusers. HVACR Res. 2002, 8, 277–294. [Google Scholar] [CrossRef]
- Huo, Y.; Haghighat, F.; Zhang, J.S.; Shaw, C.Y. A Systematic Approach to Describe the Air Terminal Device in CFD Simulation for Room Air Distribution Analysis. Build. Environ. 2000, 35, 563–576. [Google Scholar] [CrossRef]
- Cehlin, M.; Moshfegh, B. Numerical modeling of a complex diffuser in a room with displacement ventilation. Build. Environ. 2010, 45, 2240–2252. [Google Scholar] [CrossRef]
- Martinez-Almansa, J.J.; Fernandez-Gutierrez, A.; Parras, L.; del Pino, C. Numerical and Experimental Study of a HVAC Wall Diffuser. Build. Environ. 2014, 80, 1–10. [Google Scholar] [CrossRef]
- Yau, Y.H.; Poh, K.S.; Badarudin, A. A Numerical Airflow Pattern Study of a Floor Swirl Diffuser for UFAD System. Build. Environ. 2018, 158, 525–535. [Google Scholar] [CrossRef]
- Deng, B.; Zhang, Y.; Long, F. A Superficial Density Method to Describe the Diffuser Boundary Condition in CFD Simulation of Indoor Airflow. Build. Environ. 2018, 135, 280–285. [Google Scholar] [CrossRef]
- Blocken, B.; Stathopoulos, T.; Carmeliet, J. CFD Simulation of the Atmospheric Boundary Layer: Wall Function Problems. J. Atmos. Environ. 2007, 41, 238–252. [Google Scholar] [CrossRef]
- ANSYS. Lecture 7: Turbulence Modeling Introduction to ANSYS Fluent, Sales Conference Theme and Team Building; ANSYS: Canonsburg, PA, USA, 2015. [Google Scholar]
- ANSYS Inc. ANSYS Fluent 2013 Theory Guide 15; Southpointe 275 Technology Drive; ANSYS Inc.: Canonsburg, PA, USA, 2013. [Google Scholar]


Publisher’s Note: MDPI stays neutral with regard to jurisdictional claims in published maps and institutional affiliations. |
© 2022 by the author. Licensee MDPI, Basel, Switzerland. This article is an open access article distributed under the terms and conditions of the Creative Commons Attribution (CC BY) license (https://creativecommons.org/licenses/by/4.0/).