Abstract
On the basis of previous experimental and numerical studies, the windage operation of low-pressure turbine rear stage is investigated. The state of the steam within the rotor channel was correlated to measurements carried out downstream of the blades for different ventilation regimes. Considering very-low-volume flow conditions, the ventilation power was related to the drag force acting on the moving blades. A correlation was identified between the drag coefficient and a Reynolds number relative to the reverse flow height. This correlation can be used in order to predict the power loss of a last-stage moving blade operating at low load.
1. Introduction
It is generally recognized that, during low-load operation, steam-turbine rear stages may absorb power from the turbine shaft leading to the so-called “ventilation phenomenon”. The absorbed power is converted into heat [1], increasing the temperature of the ventilating stages. The resulting flow and blade-metal temperatures depend on the operational conditions, such as inlet mass flow and temperature, and condenser pressure, and some geometrical parameters such as blade height and pitch-to-chord ratio [2].
Despite this phenomenon having been studied since 1970 [3,4,5], its importance was mainly confined to the start-up and shut-down of the unit.
Today, with the growing role of renewables energy in the electricity market, steam turbine power plants operate more frequently at a low load [6,7].
Ventilation losses are generated by flow separation and the formation of recirculation zones in the last-stage moving blades [8].
Flow separation starts in correspondence of the blade hub, causing a limited separation in the diffuser cone, as described by Sauchev et al. [9]. There are two different zones that can be identified at the trailing edge of the last-stage moving blades (LSMBs): a reverse-flow region and a through-flow region (Figure 1) [8]. The separated region initially does not have any significant effect on the net power produced by the LSMB. As soon as the volumetric flow reduces, the recirculating region increases, and the reverse flow height increases accordingly [10]. The steam flow starts to be centrifugated in the radial direction, leading to an increase in negative power and flow temperature in correspondence of the tip region of the moving blade. As soon as the dimension of the through-flow region reduces, the net power associated with the last-stage blades decreases accordingly, as reported by Shnee et al. [5]. There is a point where the net power of the last-stage blades becomes negative, producing heat that leads to an increase in flow and blade metal temperatures [11].
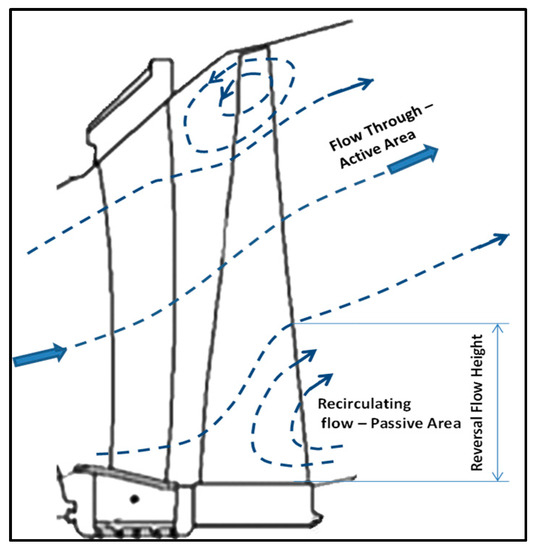
Figure 1.
Schematic representation of flow-reversal phenomenon [12].
The capability of accurately assessing the ventilation power and the resulting temperature rise is a key aspect in today’s energy market. It enables power plants to:
- Define and operate at the lowest admissible volumetric flow. This has a direct impact on the fixed and variable costs. Fixed costs are related to the potential modifications of the existing steam generator to allow for continuous low-load operation, and in defining the size of any potential auxiliary boiler that can run only when a low load is required [13].
- Run continuously at a low load to avoid cycling operation, which usually has an impact on the lifetime of key mechanical components such as turbine shafts, economizers, and reheater and superheater tubes.
- Optimize hood sprays, minimizing the risk of trailing edge erosion. A cooling system based on water sprays is installed at the low-pressure turbine exhaust. A temperature sensor is installed within the flow path to provide the signal for the automatic start and control of the spray-water quantity. The sizing of the nozzle sprays and the amount of sprayed water must be related to the ventilation power: if the ventilation power is underestimated, there would not be enough water to cool down the exhaust and the LSMB. The unit may trip for high temperature. If the ventilation power is overestimated, the resulting hood sprays are oversized. The injected water does not evaporate because not enough heat is produced by the ventilation power experienced by the LSMB. The droplets sprayed in the exhaust are dragged by the recirculating flow, eroding the trailing edge of the LSMB. This contributes to the degradation of the LSMB performance over the time, and could lead to the generation and propagation of cracks at the trailing edge of the last moving blades. This issue can be critical for blades characterized by high dynamic stresses in correspondence of the root or for moving blades produced from materials that have low fracture toughness such as titanium. Therefore, even when using hood spays, it is very important to assess the ventilation power in the most accurate way. In addition, hood sprays have no effect on the penultimate stages [14].
- Place the expansion line of the low-pressure turbine in the superheated region to avoid water droplet erosion.
In previous works, the authors investigated in depth the windage phenomenon, characterizing it and introducing several useful correlations for turbine design [14,15]. In [16], different ventilation regimes were identified. In particular, for very-low-flow coefficients, the separated flow occupies most of the rotor channel. In this condition, the blade moves in a stagnant fluid, dissipating power because of the drag resistance. The aim of the present paper is to correlate the drag force intensity to the thermofluidic dynamic conditions of the flow by introducing a characteristic drag coefficient. Such a relationship can be useful in developing models able to predict the operational conditions of turbines running at a very low load.
Some details of both the plots and the mathematical relationships cannot be shown for confidentiality reasons.
2. Experimental and Numerical Methods
In previous works, the low-load phenomenon has been investigated in detail through both experimental and numerical analyses.
Below is shown only a brief summary of the experimental and numerical campaigns carried out. Please refer to the references for more details and insights.
2.1. Experimental Setup
The experimental approach was widely described in [14]. Low-volume tests were carried out in a scaled model steam turbine, which was the same as that described by Megerle in [17]. The maximal output power generated by the steam turbine was between 6 and 8 MW, depending on the condenser pressure and the size of the last-stage blades.
The steam turbine is characterized by four stages (two front stages and two rear stages) and a radial diffuser, which is about 1/3 of the full size. Its configuration and equipment allow for performing detailed measurements relative to the ventilation power absorbed by the penultimate and last stages. Temperature, pressure, and velocity measurements along the blade span were taken on the different planes of CS52, CS61, and CS62, and at the different circumferential locations of S05, S06 and S07 (Figure 2).
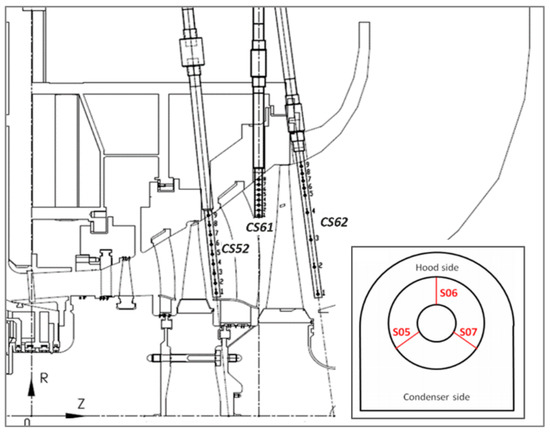
Figure 2.
Detailed view of the model steam turbine rear stages and rake temperature measurements [18].
Pressure and velocity measurements were performed with a conventional pneumatic probe or using a dynamic pressure sensor. Temperature measurements were taken with thermocouples of type K installed on a rake. The thermocouples on rake CS62 were not regularly located: the radial pitch in the tip region was rather small in order to ensure the measurement of the maximal flow temperature [12].
2.2. Numerical Setup
The numerical setup was extensively described in previous works, for example, in [12,19]. Briefly, 3D calculations were performed by means of the ANSYS CFX code. The ensemble averaged Navier–Stokes equations coupled to the energy equation and the SST turbulence model were solved by means of an implicit element-based finite-volume formulation. A streamline curvature correction was also considered in order to overcome some drawbacks due to the eddy viscosity approach.
Steam properties were calculated on the basis of the IAPWS-97 steam table [20].
The whole scaled turbine and the exhaust box were modelled in ANSYS ICEM-CFD and ANSYS Turbogrid, with the front stages as a single pitch, and the rear stages as a full annulus.
By means of the multiple-mixing-plane approach [21], each stage was modelled with 4 sectors, as shown in Figure 3, discretizing in each of them a single stator and a rotor blade.
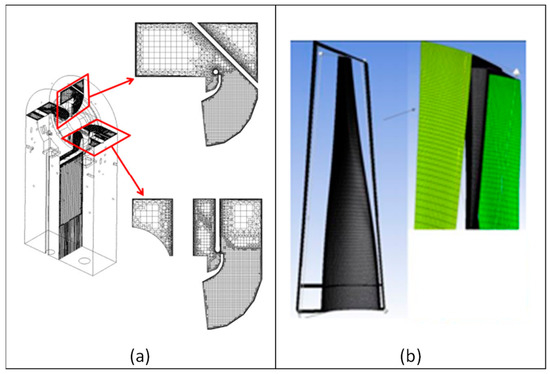
Figure 3.
Grid details. (a) Multiple mixing plane at the interface between the LSMB and the diffuser and (b) last-stage moving blade discretization [19].
As the authors in [12] showed, the CFD model is able to reproduce windage phenomena in the turbine rear stages well. For example, the maximal temperature difference between measurements and calculations was about 10 °C for each considered test case, while the reverse flow height was always well-predicted.
3. Results
3.1. Low-Load Tests
Different sets of rear stages were tested with different thermodynamic boundary conditions and rotational speed levels.
All tests were performed below 10% of the steam turbine nominal load. Therefore, the resulting thermodynamic state of the steam at the last-stage blade outlet was superheated for all the test cases, as reported by Mambro et al. [15].
A summary of the different last-stage blade layout is reported in Table 1, while Table 2 shows some details of the rear stage that are analyzed in this paper [17]. In particular, the low-load test cases reported in Table 3 are considered.

Table 1.
Experimental setup of low-pressure turbine rear stages and diffuser.
Table 2.
Main last-stage design parameters for the reference exhaust area.
Table 3.
Summary of some representative test cases.
Referring to Table 3, the flow coefficient is defined as:
where is the average axial velocity at the exhaust, and is the blade rotational velocity calculates at the midsection. The reference temperature Tref is the minimal tested steam turbine inlet temperature. The reference pressure pref is the minimal tested condenser pressure.
3.2. Experimental and Numerical Results
Figure 4 shows the distribution of measured axial velocities downstream of the LSMB. They were derived from the direct measurement of the absolute velocity and the rotational speed on the measurement plane. Conventionally, the crossing point between the velocity distribution and the zero axial velocity determines the so-called reverse-flow height [15]. Figure 4 also shows that the reverse-flow height increased when the flow coefficient decreased.
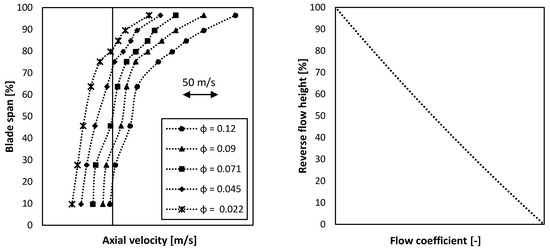
Figure 4.
Distribution of the axial velocity along the blade span. (left) Mean values on CS62 plane; (right) mean reverse flow height. Axial velocity and flow coefficient values are not shown for confidentiality reasons.
The extension of the reverse-flow height also influenced the temperature field, as shown in Figure 5. The measured temperature distribution shifted towards higher values as soon as the flow coefficient decreased. For each test case, as per usual for low-volume-flow operation, the maximal temperature was reached in the upper part of the blade.
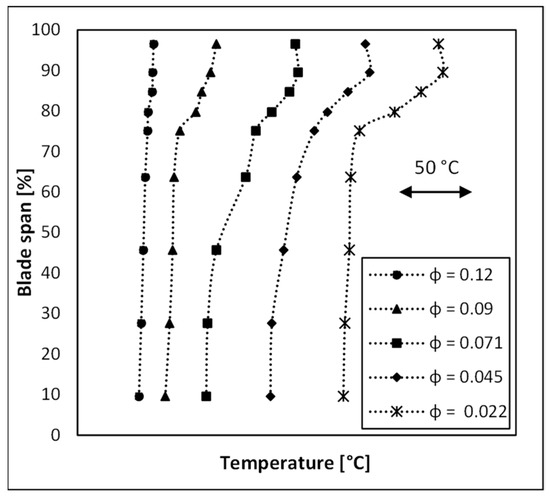
Figure 5.
Measured temperature downstream of the LSMB. Temperature values are not shown for confidentiality reasons.
The CFD analyses carried out in [15,16,19] better clarify the experimental results (Figure 6). According to the characteristic ventilation regimes identified in [16], the first two test cases fell within the highest ventilation zone where the recirculating flow downstream of the LSMB was predominant compared to the through-flow area (Zone A). Test Case 3 was characterized by a significant reverse-flow area, but it was still comparable to the active area; the LSMB ventilated, and the overall net power was negative (zone B). Test Cases 4 and 5 fell within the transitional region where the flow started to separate to the hub. The recirculating flow region was negligible; thus, the overall net power produced by the LSMB was positive even though rather small (Zone C).
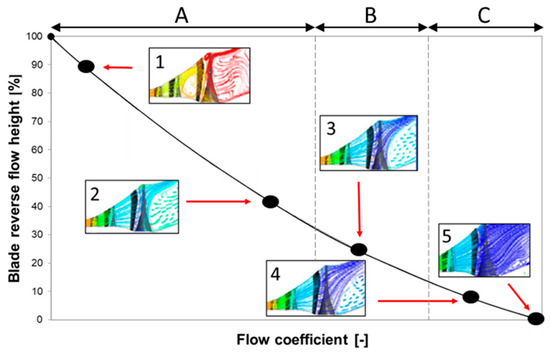
Figure 6.
Schematic representation of the variation in blade reverse-flow height for different flow coefficients. (1–5) show the flow field for the different test cases [16].
When the flow separated to the hub, the recirculating fluid was pushed along the blade span by the centrifugal action. The blade rotated in a stagnant fluid and was subjected to a resistant force that delivered power to the fluid; this power (i.e., the ventilation power) was converted into heat. The extension of the reverse-flow height influenced the ventilation power produced by the blades and the amount of generated heat. The flow coefficient was smaller, and the reverse-flow height and generated heat were larger.
Maximal temperatures were reached at the tip of the blade where the centrifugal action that compressed the fluid against the machine casing was maximal, as shown in Figure 7. A secondary vortex tended to form at the tip of the blade; however, this secondary recirculation area was much smaller than the main recirculation area.
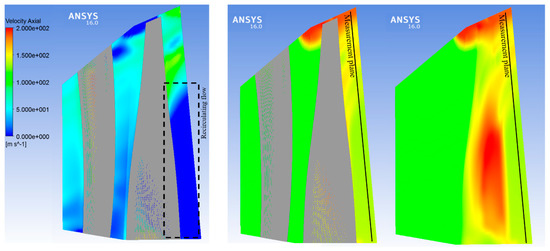
Figure 7.
Test Case 2—calculated axial velocity and flow temperature field.
At the blade tip, numerical results also show that the axial velocity field pushed the fluid towards the measurement rake placed downstream of the LSMB. Then, the temperature transducers grasped the maximal temperatures reached in the blade channel.
At the hub, instead, the axial velocities were equal to or less than zero. The measurement rake detected the fluid temperature coming from the exhaust, which was significantly smaller than that inside the blade channel.
However, the radial distribution of the temperature within the majority of the reverse-flow height could be assumed to be uniform both in the blade channel and downstream of the trailing edge, where the measurement rake was located.
Referring to the reverse flow region, Figure 8 shows the difference between the mean temperature calculated into the blade channel and the measured one downstream the blade. For high-enough flow coefficients, there was still a steam expansion between the rotor channel and downstream of the blade (Zone C, Figure 6). The more the flow coefficient reduced, the more the stagnant fluid remaining into the blade channel was compressed, increasing the steam temperature, as shown in Figure 7.
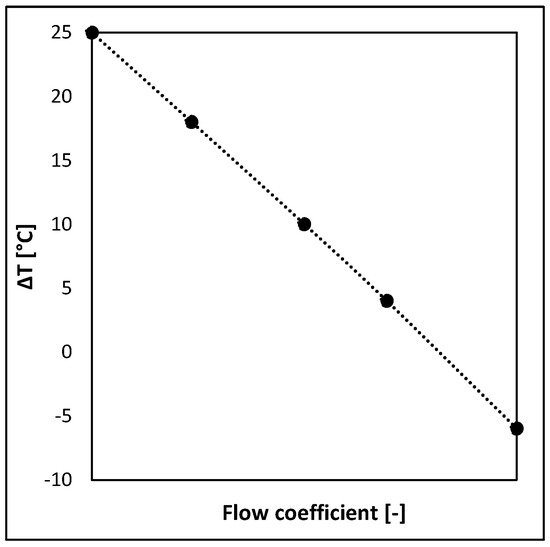
Figure 8.
Difference in temperature between calculated data within the blade channel and measurements downstream of the blade. Flow coefficient values are not shown for confidentiality reasons.
The trend shown in Figure 8 is of key importance to build up a transfer function that allows for the assessment of the flow temperature in the reverse-flow region inside the blade channel where the ventilation phenomena occur from the measured temperature in the exhaust via the rake. This difference depends on the flow coefficient via a linear function.
This correlation can be useful in estimating the properties of steam recirculating within the moving blade channel, starting from data measured downstream of the trailing edge.
Drag Coefficient Estimation
At windage operation, the LSMB delivers work to the steam. This power can be expressed as:
where is the power dissipated to move the blade through the stagnant fluid, while is the power that the steam flow delivers to the blades moving through the active area.
For very-low-volume flows, such as for test cases within Zone A, could be neglected, i.e., the measured ventilation power could be considered to be significantly predominant compared to the active power.
Following this approach, the ventilation power due to viscous drag on a blade rotating at rotational speed is given by:
where is the frictional force on the blade in the reverse-flow height; is the radius of the pressure center, approximated to be equal to the mean radius of the reverse-flow height.
The frictional force can be calculated according to Equation (4):
where is a drag coefficient, is the kinetic energy per volume unit, and is the characteristic area that is the wetted airfoil area. This is calculated as the airfoil perimeter at the midsection of the reverse-flow height multiplied by the latter, as shown in Figure 9.
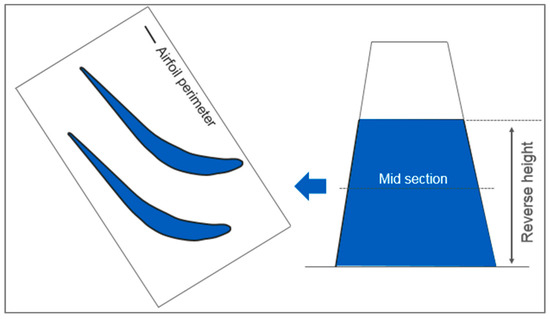
Figure 9.
Schematic representation of the airfoil perimeter at the midsection and reverse-flow height.
is calculated according to Equation (5):
where
is the average rotational speed of the blade in the reverse flow area, while is the mean steam density in the reverse-flow height.
Lastly, starting from the measured data, the drag coefficient could be calculated according to Equation (7):
A relationship between the drag coefficient and a Reynolds number was identified for the last-stage blades of different sizes, pitch-to-chord ratios, and rotational speed levels, as shown in Figure 10, which shows the results relative to a wide range of mass flows, inlet temperatures, and condenser pressures always running the LSMB in windage conditions (i.e., the LSMB always delivering work to the fluid).
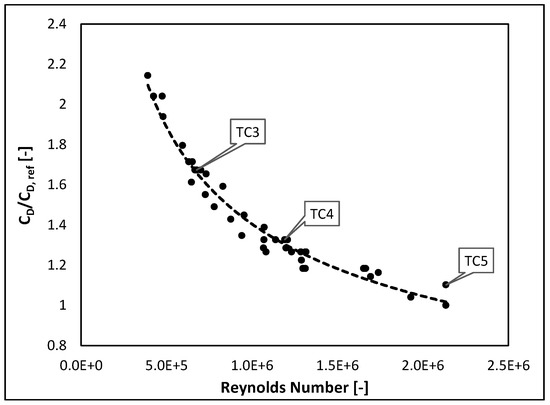
Figure 10.
Calculated drag coefficient vs. Reynolds number for different steam turbine last-stage blades—values per blade. CD,ref is the minimal drag coefficient found.
The Reynolds number was related to the reverse-flow height according to Equation (8):
where is the outer diameter of the reverse-flow height, and is the mean value of the kinematic viscosity of the steam recirculating in this region.
The kinematic viscosity (Equation (8)) and steam density (Equation (5)) were calculated from the condenser pressure and the flow temperature in the reverse-flow height.
The condenser pressure could be used with good approximation because there was practically no pressure recovery in the turbine exhaust due to the separated flow coming from the rear-stage turbine.
According to the measurements and CFD calculations, the flow temperature could also be assumed to be rather uniform in the LSMB channel. This temperature was estimated by correcting the temperature measured downstream of the stage by means of the relationship shown in Figure 8.
As highlighted by the markers relative to Test Cases 3–5, increased with the ; thus, extreme windage regimes are characterized by the highest values of .
Figure 10 also highlights a clear link between the drag coefficient and the Reynolds number for cases in which the recirculation area does not affect the whole blade span (Test Case 3).
This link can be expressed according to Equation (9), for which a coefficient of determination equal to 0.97 was found.
4. Conclusions
The results presented in this paper are useful in further understanding the behavior of low-pressure turbines operating in windage conditions. In particular, the found relationships can be useful in assessing the ventilation power that the last moving blade delivers to the fluid.
Temperature data measured downstream of the blade were correlated to the mean temperature of the recirculating steam within the blade channel. For high ventilation regimes, this allows for calculating the drag force opposite to the blade motion and the relative blade drag coefficient. A large number of experimental tests prove that this drag coefficient is well-correlated to a Reynolds number defined for the reverse blade height. This good correlation was found not just for extreme windage conditions, but also for each operating condition in which the turbine delivers mechanical power to the steam.
Author Contributions
Conceptualization, A.M., F.C. and E.G.; methodology, A.M. and F.C.; formal analysis, A.M., F.C., E.G. and D.L.; investigation, A.M.; data curation, A.M., F.C., E.G. and D.L.; writing—original draft preparation, A.M., F.C., E.G. and D.L.; writing—review and editing, A.M., E.G. and D.L.; supervision, F.C. and E.G. All authors have read and agreed to the published version of the manuscript.
Funding
This research received no external funding.
Data Availability Statement
Not applicable.
Conflicts of Interest
The authors declare no conflict of interest.
Nomenclature
| A | Characteristic area |
| Cax | Axial velocity |
| CD | Drag coefficient |
| CD,ref | Reference drag coefficient |
| CFD | Computational fluid dynamics |
| Drev | Outer diameter of the reverse flow height |
| F | Frictional force on the blade in the reverse flow height |
| K | Kinetic energy per volume unit |
| LSMB | Last-stage moving blades |
| P | Power delivered to the steam by the LSMB at windage operation |
| Pa | Active power |
| Pv | Ventilation power |
| R | Mean radius of reverse flow height |
| ReRFH | Reynolds number calculated as: |
| RFH | Reverse flow height |
| T | Inlet temperature |
| TC | Test case |
| Tref | Reference temperature |
| Uav | Average circumferential velocity of the blade |
| Urev | Average rotational speed of the blade in the reverse flow area |
| α, β | Constant values |
| υ | Mean value of the kinematic viscosity of the steam recirculating in the reverse flow area |
| p | Condenser pressure |
| pref | Reference pressure |
| ρ | Mean steam density in the reverse flow height |
| Flow coefficient calculated as: | |
| ω | Rotational speed |
References
- Sigg, R.; Heinz, C.; Casey, M.; Sürken, N. Numerical and experimental investigation of a low-pressure steam turbine during windage. Proc. Inst. Mech. En.g Part A J. Power Energy 2009, 223, 697–708. [Google Scholar] [CrossRef]
- Beevers, A.; Havakechian, S.; Megerle, B. On the Prediction and Theory of the Temperature Increase of Low Pressure Last Stage Moving Blades During Low Volume Flow Conditions, and Limiting it Through Steam Extraction Methods. J. Turbomach. 2015, 137, 101002. [Google Scholar] [CrossRef]
- Neuimin, V.P. Ventilation process in a stage of an axial turbomachine. Energomashinostronie 1982, 11, 7–12. [Google Scholar]
- Lagun, V.; Simoyu, L.; Frumin, Y.Z.; Povolots, L.; Sukharev, F. Distinguishing features of operation of lpc last stages at low loads and under no-load conditions. Therm. Eng. 1971, 18, 30. [Google Scholar]
- Shnee, Y.; Ponomarev, V.; Bystritskii, L. An experimental investigation of partial operating conditions of turbine stages. Energomashinostroenie 1977, 11, 10–14. [Google Scholar]
- Brouwer, A.S.; van den Broek, M.; Seebregts, A.; Faaij, A. Operational flexibility and economics of power plants in future low-carbon power systems. Appl. Energy 2015, 156, 107–128. [Google Scholar] [CrossRef]
- Eser, P.; Singh, A.; Chokani, N.; Abhari, R.S. Effect of increased renewables generation on operation of thermal power plants. Appl. Energy 2016, 164, 723–732. [Google Scholar] [CrossRef]
- Steltz, W.G. An approach to resolving the very low flow in low pressure steam turbines. In Proceedings of the 1999 International Joint Power Generation Conference; American Society of Mechanical Engineers: Burlingame, CA, USA, 1999; Volume 2. [Google Scholar]
- Sauchev, I.; Neuimin, V.; Zhuchenko, L. Flow separation at blade root in axial flow turbines. Energomashinostroenie 1979, 3, 9–12. [Google Scholar]
- Basirico, J.; Zhou, B.; Mujezinovic, A.; Starodubtsev, Y.; Frolov, B. Testing of Full Speed No Load Operating Conditions in a Subscale Steam Turbine Test Vehicle. In Proceedings of the ASME 2011 Turbo Expo: Turbine Technical Conference and Exposition, Vancouver, BC, Canada, 6–10 June 2011; American Society of Mechanical Engineers: Vancouver, BC, Canada, 2011; pp. 2455–2461. [Google Scholar] [CrossRef]
- Filippenko, V.; Frolov, B.; Chernobrovkin, A.; Zhou, B.; Mujezinović, A.; Slepski, J. Analyses of temperature distribution on steam turbine last stage low pressure buckets at low flow operations. In Proceedings of the ASME 2011 Turbo Expo: Turbine Technical Conference and Exposition, Vancouver, BC, Canada, 6–10 June 2011; American Society of Mechanical Engineers: Burlingame, CA, USA, 2011; pp. 2463–2469. [Google Scholar] [CrossRef]
- Mambro, A.; Congiu, F.; Galloni, E. Influence of the snubber on temperature distribution at last stage blade exit of a steam turbine during low volume flow operations. Appl. Therm. Eng. 2019, 150, 937–952. [Google Scholar] [CrossRef]
- Mambro, A.; Congiu, F.; Piraccini, F. Application of GE Low Load Package on an Existing District Heating Power Plant: A Case Study. In Proceedings of the ASME 2020 Power Conference collocated with the 2020 International Conference on Nuclear Engineering, Virtual, 4–5 August 2020; American Society of Mechanical Engineers: Burlingame, CA, USA, 2020; Volume 83747, p. V001T09A003. [Google Scholar]
- Mambro, A.; Congiu, F.; Galloni, E.; Canale, L. Experimental study and modelling of the ventilation power and maximum temperature of low-pressure steam turbine last stages at low load. Appl. Energy 2019, 241, 59–72. [Google Scholar] [CrossRef]
- Mambro, A.; Galloni, E.; Congiu, F.; Maraone, N. Modelling of low-pressure steam turbines operating at very low flowrates: A multiblock approach. Appl. Therm. Eng. 2019, 158, 113782. [Google Scholar] [CrossRef]
- Mambro, A.; Congiu, F.; Galloni, E. Influence of stage design parameters on ventilation power produced by steam turbine last stage blades during low load operation. Therm. Sci. Eng. Prog. 2022, 28, 101054. [Google Scholar] [CrossRef]
- Megerle, B. Unsteady Aerodynamics of Low Pressure Steam Turbines Operating under Low Volume Flow Conditions. Ph.D. Thesis, Ècole Polytechnicque Fédérale de Lauseanne, Lausanne, Switzerland, 2014. [Google Scholar]
- Mambro, A.; Galloni, E.; Congiu, F. Assessment of the heat transfer coefficient for the prediction of ventilation power in steam turbine last stages operating at low load. Therm. Sci. Eng. Prog. 2020, 18, 100542. [Google Scholar] [CrossRef]
- Mambro, A.; Congiu, F.; Galloni, E. CFD Modelling of Steam Turbine Last Stage Blades at Low Load Using Multiple Mixing Plane Approach. In Turbo Expo: Power for Land, Sea, and Air; American Society of Mechanical Engineers: Burlingame, CA, USA, 2020; p. V009T23A012. [Google Scholar]
- Cooper, J.R.; Dooley, R.B. Revised Release on the IAPWS Industrial Formulation 1997 for the Thermodynamic Properties of Water and Steam; The International Association for the Properties of Water and Steam: Lucerne, Switzerland, 2007. [Google Scholar]
- Stein, P.; Pfoster, C.; Sell, M.; Galpin, P.; Hansen, T. Cfd modeling of low pressure steam turbine radial diffuser flow by using a novel multiple mixing plane based coupling: Simulation and validation. In Turbo Expo: Power for Land, Sea, and Air; American Society of Mechanical Engineers: Burlingame, CA, USA, 2015; Volume 56796, p. V008T26A020. [Google Scholar]


Publisher’s Note: MDPI stays neutral with regard to jurisdictional claims in published maps and institutional affiliations. |
© 2022 by the authors. Licensee MDPI, Basel, Switzerland. This article is an open access article distributed under the terms and conditions of the Creative Commons Attribution (CC BY) license (https://creativecommons.org/licenses/by/4.0/).