Abstract
To better understand the role of particle inertia on the heat transfer in the presence of a thermal inhomogeneity, Eulerian–Lagrangian direct numerical simulations (DNSs) have been carried out by using the point–particle model. By considering particles transported by a homogeneous and isotropic, statistically steady turbulent velocity field with a Taylor microscale Reynolds number from 37 to 124, we have investigated the role of particle inertia and thermal inertia in one- and two-way coupling collisionless regimes on the heat transfer between two regions at uniform temperature. A wide range of Stokes numbers, from 0.1 to 3 with a thermal Stokes-number-to-Stokes-number ratio equal to 0.5 to 4.43 has been simulated. It has been found that all moments always undergo a self-similar evolution in the interfacial region between the two uniform temperature zones, the thickness of which shows diffusive growth. We have determined that the maximum contribution of particles to the heat flux, relative to the convective heat transfer, is achieved at a Stokes number which increases with the ratio between thermal Stokes and Stokes number, approaching 1 for very large ratios. Furthermore, the maximum increases with the thermal Stokes-to-Stokes number ratio whereas it reduces for increasing Reynolds. In the two-way coupling regime, particle feedback tends to smooth temperature gradients by reducing the convective heat flux and to increase the particle turbulent heat flux, in particular at a high Stokes number. The impact of particle inertia reduces at very large Stokes numbers and at larger Reynolds numbers. The dependence of the Nusselt number on the relevant governing parameters is presented. The implications of these findings for turbulence modelling are also briefly discussed.
1. Introduction
The dynamics of small particles suspended in a turbulent flow has attracted the interest of the scientific community since the pioneering works by Taylor and Richardson because particle-laden and droplet-laden turbulent flows are an inherent feature of most environmental and industrial flows. These flows are still an active research area [1,2], and in the last few decades the possibility to perform numerical simulations, due to ever-increasing high-performance computing capabilities, has allowed researchers to obtain significant progress in the understanding of the mechanisms behind the observed phenomenology. Even if until today direct numerical simulations (DNS) of complex flows or high Reynolds number flows are not yet possible, significant insight can still be obtained from the investigation of simple and idealized archetypal flow configurations. Indeed, turbulent particle-laden flows are a multi-scale and multi-physics phenomenon, and many aspects of these flows have not yet been fully understood. This is particularly evident when the thermal interaction between the particles and the carrier flow is taken in consideration, because the resulting flow is the outcome of a non-trivial interaction between particle inertia, particle thermal inertia, heat transport, and momentum and heat feedback of the particles on the carrier fluid. The experimental studies of particle-laden turbulent flows are somewhat limited, primarily due to the difficulties in Lagrangian measurements, which have to rely on imaging techniques to measure particle motion [2], either particle image velocimetry (PIV) or particle tracking velocimetry (PTV), which in some cases can be combined to measure both particle and fluid velocities (e.g., [3]). However, the measure of temperature introduces additional complexities and, to our knowledge, there is no general and reliable way to measure particle temperature. The few works which present temperature statistics, such as [4], are normally limited to the mean and variance of the temperature of the carrier flow whereas in general, often only bulk properties are reported. Therefore, the most noticeable advances are due to the possibility to carry out numerical simulations.
After the pioneering works by Jaberi [5], in recent years, many works have considered some aspects of the fluid–particle temperature coupling by using direct numerical simulations, mainly within the point–particle approach valid for small sub-Kolmogorov particles, which is a frequent situation in many applications. In this approach, particles are explicitly tracked, whereas the carrier flow is normally solved in an Eulerian grid, even if meshless Lagragian methods can be used as well (e.g., [6]). For example, Zonta et al. [7] investigated a particle-laden channel flow, with the aim of modelling the modification of heat transfer in microdispersed fluids, observing that particle inertia can lead to an increase or decrease of the wall heat flux. Kuerten et al. [8] considered a similar setup with larger dispersed particles and observed a stronger modification of the carrier fluid temperature statistics induced by the presence of particles, and Rousta and Lessani [9] investigated the particle-wall thermal interaction at a very high Stokes number, including the effect of finite-time thermal transfer during collisions with the wall. Zamansky et al. [10] considered that turbulence induced by the buoyancy was generated by the heating of particles, analyzing the flow driven by the thermal plumes produced by the heated particles. In such a case, an increase of particle inertia increased the inhomogeneity of the flow and the effects of the fluid-particle coupling were enhanced by the tendency of particles to cluster on the advected scalar fronts. Béc et al. [11] carried out DNSs of heavy particles in a homogeneous turbulent flow, and showed that particles tend to cluster on the fronts of the temperature field, producing an anomalous scaling. Pournasari et al. [12] showed the importance of the particle heat-mixing parameter (i.e., the ratio between the thermal relaxation time to the particle thermal relaxation time in the two-way coupling regime), and developed the leading order approximation for the ensemble averaged heat transfer between the two phases in a homogeneous flow. Finally, Carbone et al. [13] have numerically investigated the multiscale aspects of fluid–particle thermal interaction in homogeneous and isotropic turbulence and the modulation of the carrier flow temperature by the particle thermal feedback, showing the dominance of caustics at small scales, whereas Saito et al. [14] have developed a theoretical model, based on the Langevin equation, to predict the modulation of fluid temperature by particles. Other works, e.g., [15,16], have introduced some effect of finite size particles by means of interface-resolved simulations. However, up to now numerical constraints do not allow us to simulate a significant number of large particles, due to the complex structure of the flow around each particle and in its wake, which produces nontrivial effects even in simple configurations [17,18]. Heat transfer plays a major role in all phase change processes, as when a gas is seeded by small droplets. Kumar et al. [19,20] examined how the spatial distribution of water droplets in air is affected by large-scale inhomogeneities in the fluid temperature and supersaturation fields, considering the transition between homogeneous and inhomogeneous mixing. In this situation, the leading role in the thermal interaction between droplets and air is the release or absorption of the latent heat of evaporation due to the condensation or evaporation of water vapour. Other works, e.g., [21,22], considered droplet dynamics at a temperature/humidity interface in the absence of mean shear. Langevin models have often been used to obtain theoretical predictions (e.g., [14,23]). However, due to the preponderance of latent heat release and absorpotion, and the small size of droplets, their thermal inertia is normally neglected, thus underestimating the size spectrum broadening [24].
However, despite these studies, with the exception of channel flow, little attention has been paid to thermal interaction in nonhomogeneous flows, for which there is no theory predicting the outcome of thermal interaction. Therefore, the present work aims to analyze the fluid–particle thermal interaction in the simplest inhomogeneous flow configuration, where heat is transferred between two regions at different temperatures by a statistically homogeneous and isotropic velocity field. We discuss the role of particle inertia and thermal inertia in both one-way and two-way coupling regimes, and show how it affects the heat transfer, measured through the Nusselt number. We consider that the flow is seeded by a suspension of monodisperse, nonbuoyant rigid spherical particles, which are assumed to have sub-Kolmogorov size so that the point–particle paradigm can be used. This is an archetypal configuration which can help to highlight the most fundamental consequences of the presence of particles with a finite inertia and thermal inertia. Moreover, the present flow configuration provides a simple benchmark to check the parametrization of turbulent transport in Reynolds-averaged equations (RANS) or the subgrid modelling in the large eddy simulation (LES). The physical model and its numerical solution are described in Section 2, the results of the simulations are presented in Section 3, and the implications for turbulence modelling in Section 4.
2. Method
2.1. Governing Equations
In this section, we present the physical model which has been used to simulate the dynamics of a particle-laden turbulent flow within the point–particle paradigm. We consider a statistically stationary, homogeneous and isotropic turbulent flow, governed by the incompressible Navier–Stokes equations. For mild temperature variations, the temperature field can be considered a passive scalar advected, together with the suspended particles, by the turbulent velocity field. Therefore, the continuity, momentum, and energy balance equations for the carrier flow are [13]
Here, is the fluid velocity, is the pressure, is the fluid temperature, and are the fluid density and specific heat at constant pressure, and are the kinematic viscosity and thermal diffusivity, is a forcing term to keep the velocity field in a statistically steady state, and finally, is the particle heat feedback on the flow (see [13]). In this study, we consider a two-way thermal coupling between the fluid and particles, but only one-way momentum coupling (i.e., no momentum feedback is taken into account as in [13,14], because it has a minor effect on the flow statistical behaviour [13], contrary to channel flow, [25]). The dynamics of heavy (i.e., with a density much higher than the one of the fluid, ), rigid inertial particles with radius R much smaller than any flow scale, is governed by the following equations:
where , , and are position, velocity, and temperature of the p-th particle, respectively. Here and are the momentum and thermal relaxation times, given by
where R, , and are the radius, density, and specific heat of each particle. Equation (4) is a simplification of the Maxey–Riley equation for the motion of small particles in a fluid [26] when particle density is much higher than fluid density, so that all other contributions to the force by the fluid on the particle other than the Stokes drag can be neglected, conditions which are met in many applications where liquid or solid particles are suspended in gases. Equation (5) can be obtained in the same conditions under which Equation (4) is valid. In a turbulent flow, this particle representation is appropriate whenever particle size is much smaller than all dynamically significant flow length scales, i.e., much smaller than the Kolmogorov length scale. Finally, from Equation (5), following [13], the thermal feedback per unit volume by the particles on the fluid phase is given by
where is the total number of particles.
2.2. Flow Configuration and Numerical Solution
We consider the heat transfer between two adjacent regions with different temperatures and , uniform within each region, within a homogeneous and isotropic velocity field which is kept statistically steady by the body force . Ideally, we have two half-spaces at temperature and . The initial temperature difference will generate a mixing layer across the separating plane which thickens over time, due to diffusion and convection. In this situation, two highly intermittent sublayers bounding a well-mixed central part of the mixing layer between the two regions are expected to emerge [27].
We solve the problem (1)–(5) in a parallelepiped domain with size , , and in directions , and , respectively. The temperature is initially equal to in the half domain and initially equal to in the half domain. Periodic boundary conditions are applied in all directions. Although periodic boundary conditions in all directions are appropriate for the statistically homogeneous velocity field, they cannot be used for the temperature. Therefore, in order to simulate in a consistent way a single temperature mixing layer, the temperature field is decomposed as
where . Analogously, the particle temperature is decomposed as
In this way, we can apply periodicity to and , i.e., particles which exit the domain reenter in the opposite side with the same velocity and the same reduced temperature . With regard to particles, this introduces no spurious values in direction, because the temperature of the particles which enter and exit has the same probability density function.
The equations are made dimensionless by using the shorter size of the domain over as a length scale, a velocity scale derived from the imposed kinetic energy dissipation , and the half temperature difference between the two regions as a temperature scale (see Appendix A). Thus, the dimensionless domain has a size, where n is the aspect ratio of the domain. In most simulations, an aspect ratio of two has been used.
The spatial derivatives of the carrier flow field partial differential equations, (3) and (10) are discretized with a Fourier–Galërkin pseudo-spectral method, by which the aliasing error introduced by the non-linear convective terms is removed by means of the 3/2 rule [28]. Forcing is applied of a single wavenumber, i.e., to all wavevectors with the same modulus, , by means of a so called deterministic large-scale forcing [13,19], which, in the wavenumber space, takes the form
where is the imposed mean energy injection per unit time, which is equal to the mean dissipation once a statistically steady state is reached, and is the forced wavenumber. A hat indicates the Fourier transform of a variable. The value of determines the scale at which energy is injected, and, therefore, the large scales of the motion. A second-order exponential Runge–Kutta time integration method has been used for both fluid and particles, in order to ensure consistency between the two phases [13]. A recent novel numerical framework [29,30], based on inverse and forward non-uniform fast Fourier transforms with a fourth-order B-spline basis, has been used to interpolate fluid velocity and temperature at particle positions and to compute particle feedback. The fluid velocity field is initialized by running a simulation of an isotropic flow with no particles until a statistically steady state is obtained. Then, the flow is seeded by randomly distributed particles and the initial temperature difference is imposed. In order to avoid a discontinuity between the two halves of the domain, the step is smoothed by means of a hyperbolic tangent, in a way similar to [22,27], i.e., the initial temperature is
where coefficient a is chosen such as to smooth the step over the length a few grid sizes in order to avoid the Gibbs phenomenon when the discrete Fourier transform is carried out. Initial particle velocity and temperature have been assumed equal to those of the carrier fluid at particle position. As regards the temperature, this is equivalent to assume that particles have resided in the two uniform temperature regions long enough to reach thermal equilibrium with the carrier flow.
2.3. Flow Parameters
In dimensionless form, the problem is governed by the Reynolds number, which represents the ratio of inertial forces to viscous forces, the Prandtl number , which represents the ratio between momentum and thermal diffusivity, the Stokes number , which compares the particle momentum relaxation time to the Kolmogorov time scale , the thermal Stokes number of the particles , and by the particle-to-fluid heat capacity ratio
where is the volume fraction (see Appendix A). Given the large number of parameters, the set of simulations needed to cover the whole parameter space requires considerable computational resources, in particular when the thermal two-way coupling is taken into account, because in such a case each combination of St and must be simulated separately. Therefore, in the present study we restrict our attention to the heat transfer at a low to moderate Reynolds number, i.e., we simulated four Taylor microscale Reynolds numbers ( is the root mean square velocity and is the Taylor microscale), ranging from 37 to 124, leaving the extension at higher Reynolds numbers, at which a fully developed inertial range exists, to future explorations. However, because the mixing of a scalar through a sharp scalar interface is mainly driven by the large scales of the flow [27], and the largest eddies are considered the most important in thermal coupling [14], these Reynolds numbers should be high enough to quantify the heat transfer between the two homogeneous regions in a developed turbulent flow. Flows at different Reynolds numbers have been obtained by varying the grid resolution and by modulating the wave number at which the forcing is applied. The main parameters of the simulations are listed in Table 1. In order to allow the temperature mixing layer to develop without being confined by the domain, an aspect ratio from 2 to 3 of the domain has been used; that is, the dimensionless domain is in directions and but or in direction . Therefore, the parallelepiped domain has been discretized with grid points at and with grid points at higher Reynolds numbers, with the same resolution in all directions. Because the code is dealiased through the 3/2 rule, this implies that the maximum simulated wavenumber is and not , where N is the nominal number of points in and directions. Note that, consistently, all convective terms as well as fluid interpolation at particle position is computed on a times finer grid, i.e., on a grid at and grid at higher Reynolds numbers.

Table 1.
Dimensionless flow parameters of carrier phase flow fields; is the Taylor microscale Reynolds number, is the Kolmogorov length scale, is the root mean square of fluid velocity fluctuations, is the large-eddy-turnover time, is turbulent kinetic energy, is grid spacing by considering only active Fourier modes after dealiasing.
The particles seeding the flow are monodisperse, i.e., they are all identical, with the same physical properties (radius, density, specific heat) and, thus, the same relaxation times (Equation (6)). The role of particle inertia is determined by the Stokes number and, analogously, particle thermal inertia is measured through the thermal Stokes number . The ratio , which is the ratio between the momentum and thermal relaxation times, depends only on the thermal properties of the carrier fluid and suspended particles. For example, in air this ratio is between 0.5 and 1 for metallic particles and soot, whereas it is approximately 2 for organic material particles, like wood or oils, slightly above 2 for ice particles and approximately 4.43 for pure water droplets. Therefore, we have carried out sets of simulations in each of which, while we cover a wide range of St, from 0.1 to 3, the ratio is kept fixed to a value 0.5 and 4.43, with a Prandtl number equal to 0.71, in order to cover a parameter range which is representative of particles suspended in air. All the parameters relevant to particles are in Table 2.

Table 2.
Particle parameters in dimensionless code units for one-way and two-way coupling regimes.
A particle volume fraction is used in all simulations, which is large enough for two-way momentum coupling between the particles and fluid to be relevant, but still small enough to allow to neglect particle collisions and particle–particle interactions, which begin to be significant when the volume fraction is larger than . Two-way coupling is appropriate at such a volume fraction [31], but nevertheless we considered also one-way coupling. Indeed, not considering collisions, particles behave independently one from each other and one-way coupling simulations are possible: the relatively high volume fraction allows just for a larger statistical ensemble of particles and it is not meant to represent such a particle concentration.
2.4. Averages
The velocity field is homogeneous and isotropic, whereas the temperature field in homogeneous only in directions and . Therefore, all averages are taken as plane averages on planes. Eulerian averages on particles have been computed by considering only particles whose position in direction lays between and , where is the grid spacing in physical space. Because the temperature field is unsteady, no time average is possible. All simulations have been repeated three times by using uncorrelated different initial velocity fields in order to increase the statistical ensemble and thus obtain more accurate statistics. This is enough for first- and second-order single point statistics. However, an even larger ensemble would be necessary to explore higher-order moments and two-point statistics.
3. Results and Discussion
3.1. One-Way Coupling
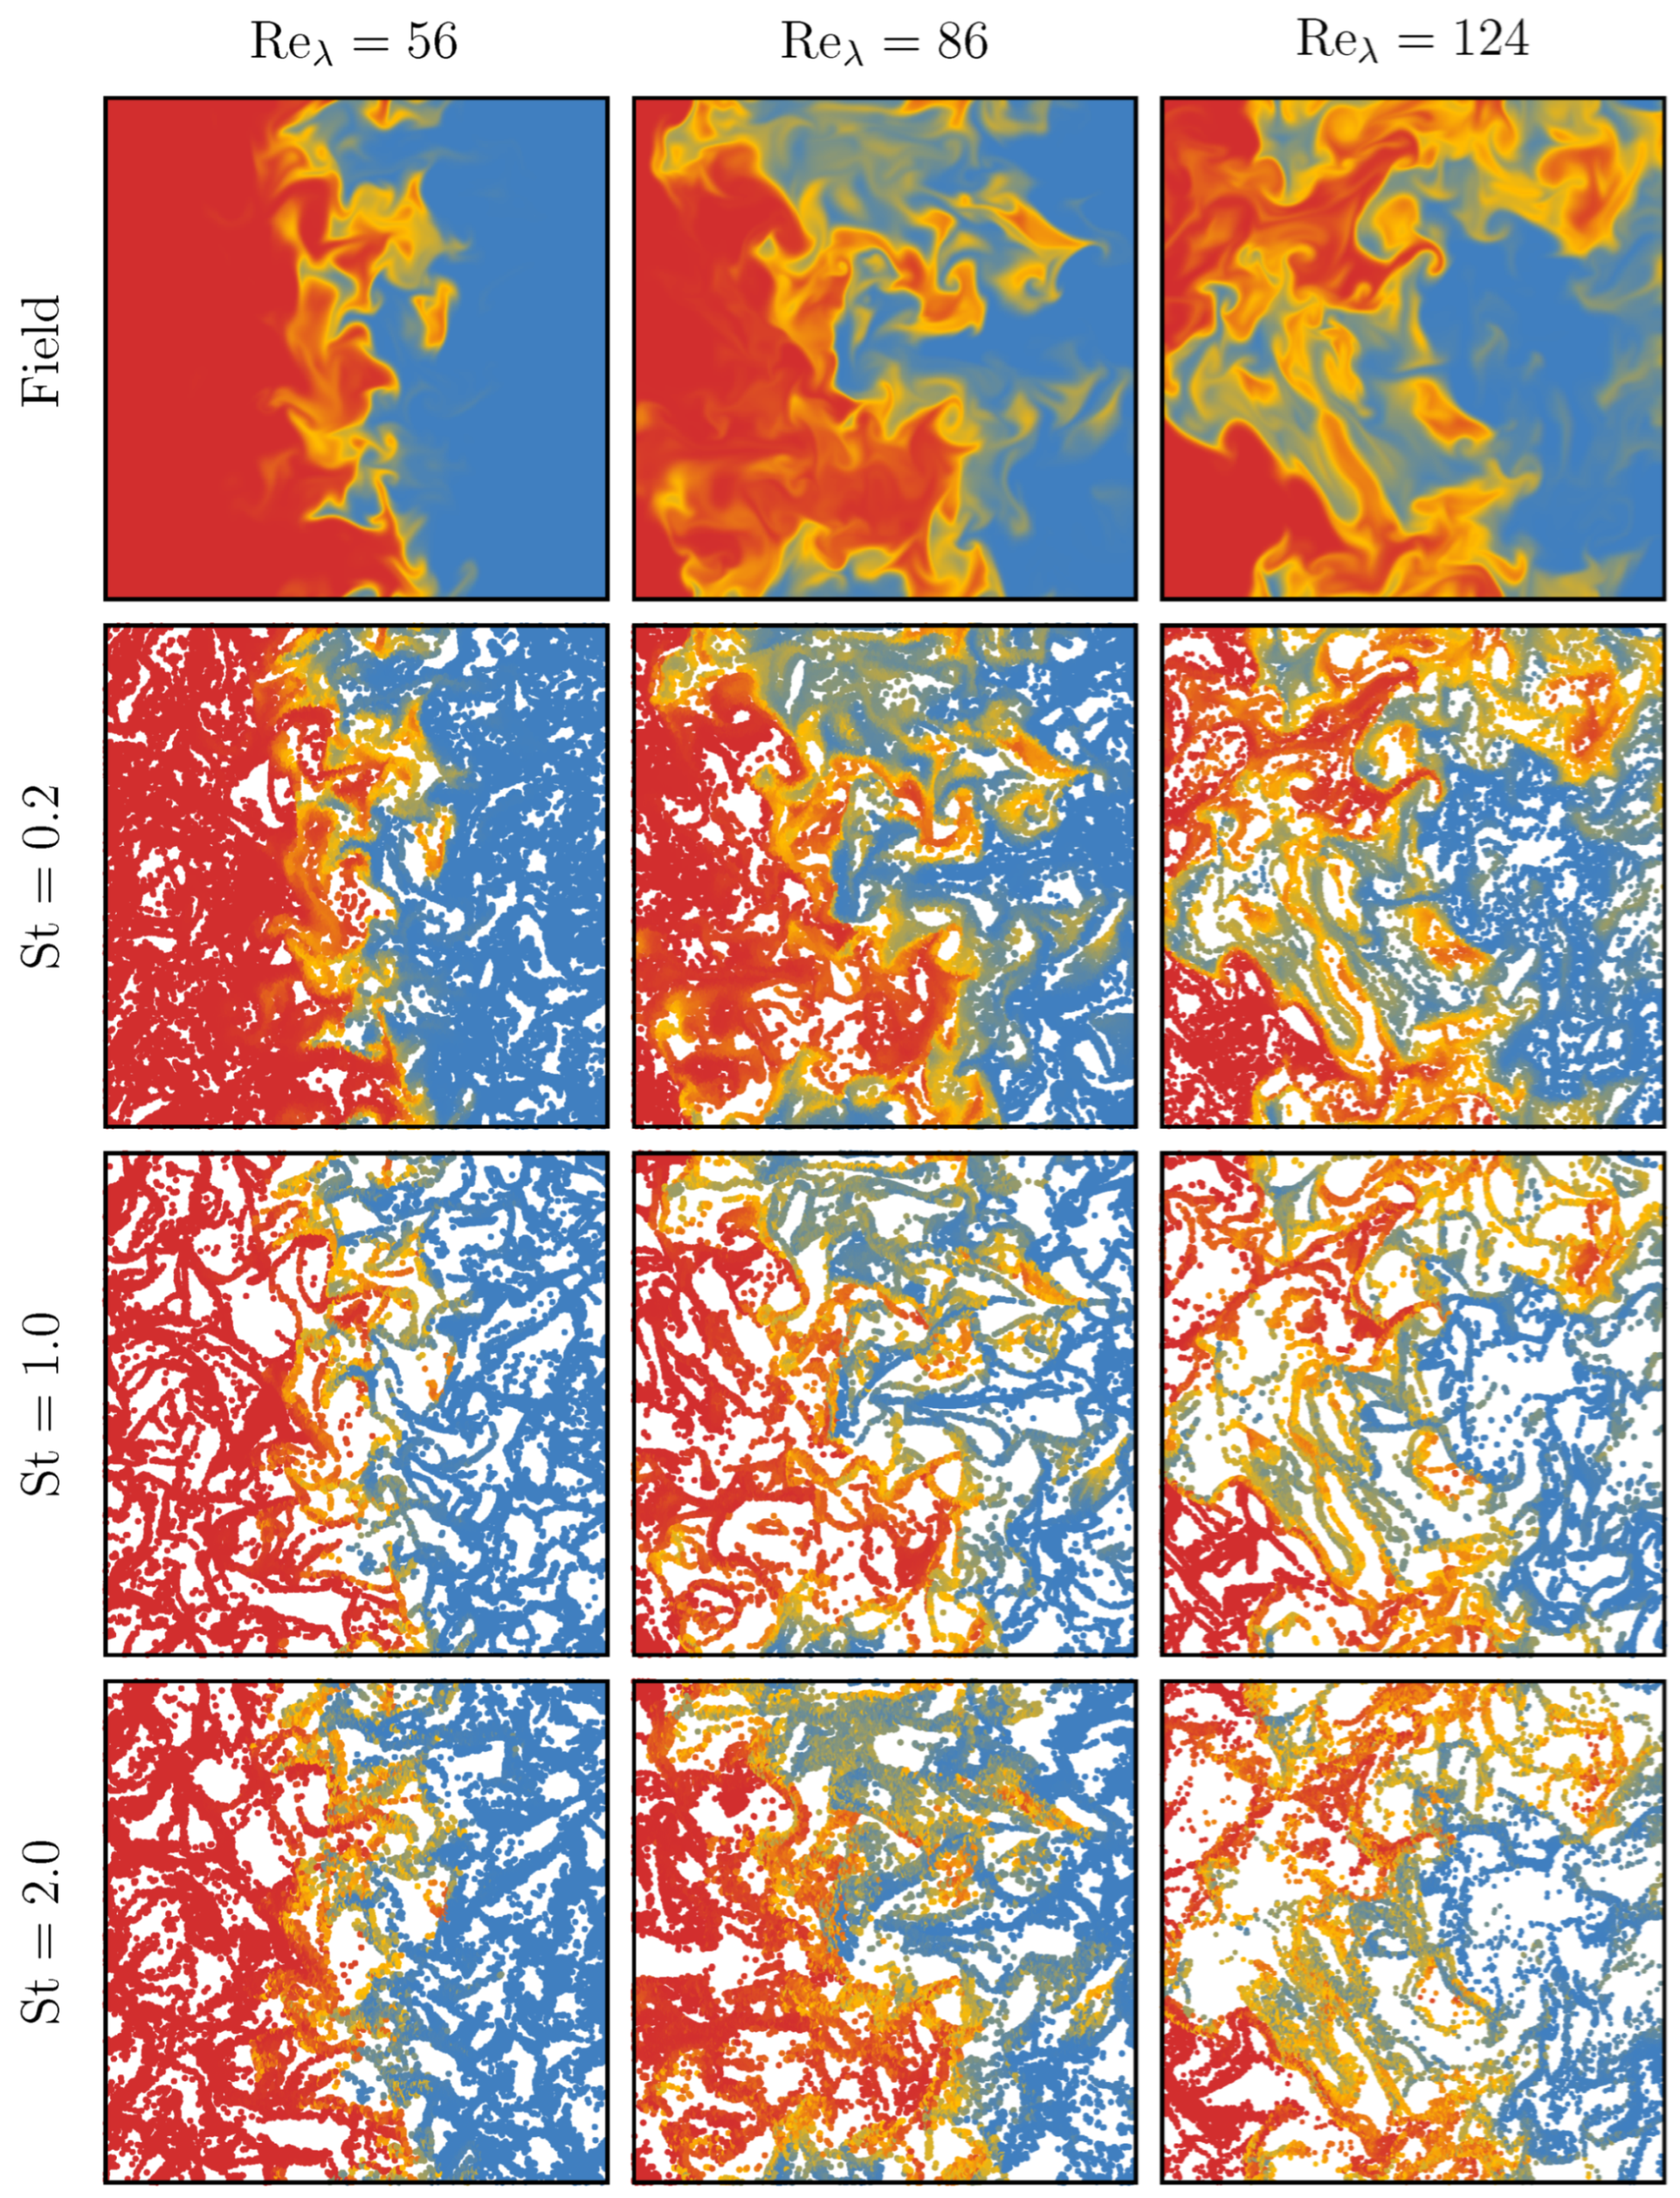
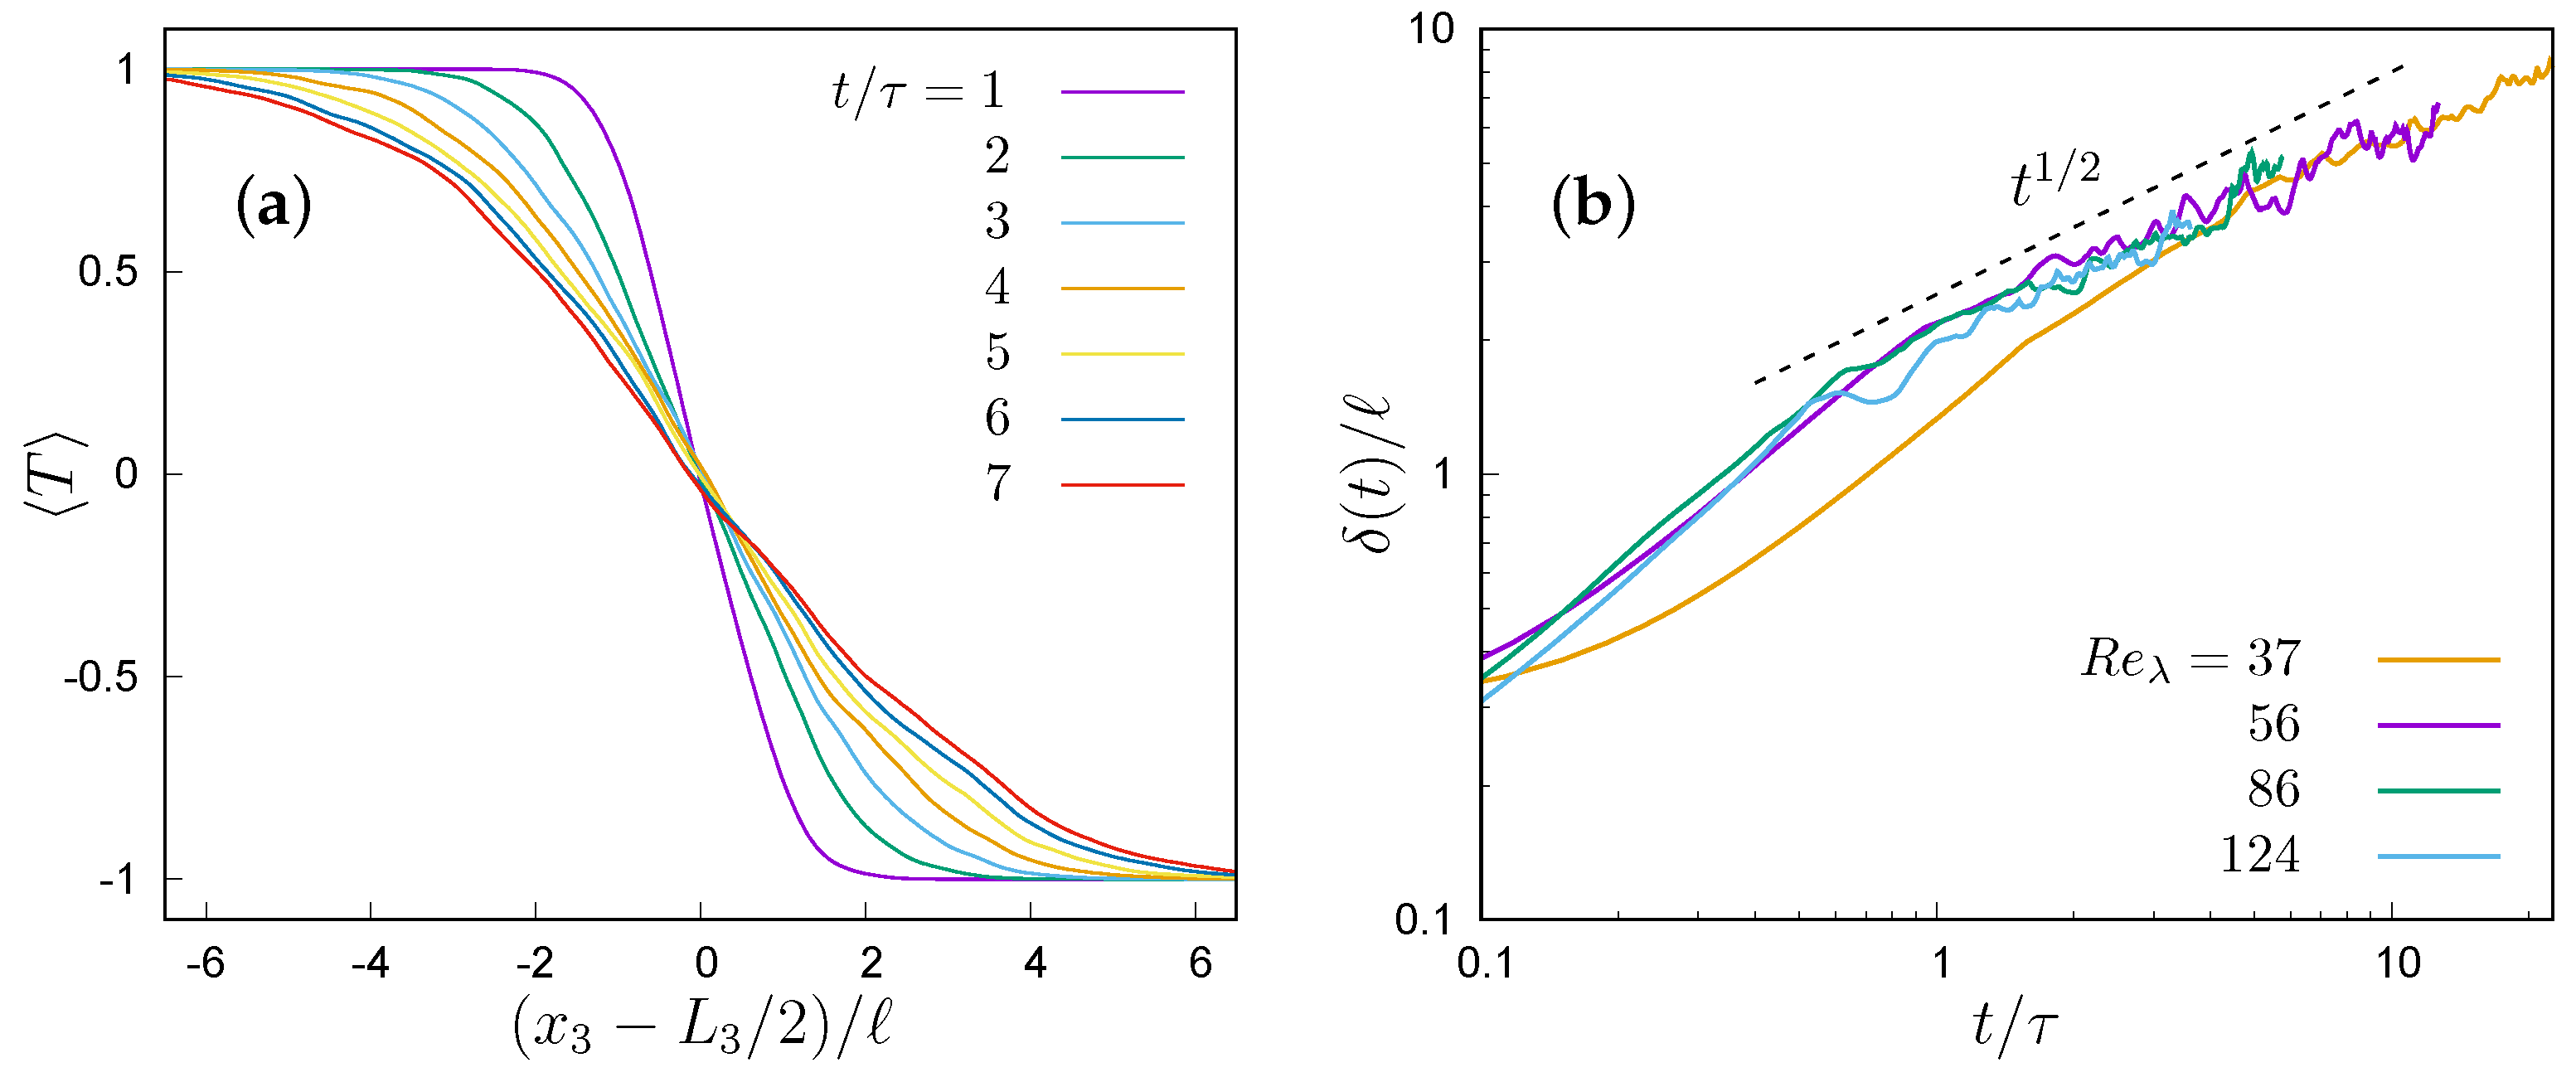
First, we present the results in the one-way coupling regime. Essentially, in this configuration the surface which initially separates the two regions at uniform temperature is spread by turbulent eddies and a mixing region with high temperature variance is generated, exposing the advected particles to different temperatures, even if they do not modify the temperature of the carrier flow. A visualization of the temperature field and of particle temperature is shown in Figure 1 for at three Stokes numbers, 0.2, 1, and 2. The effect of clustering, which is milder at the lower Stokes number, is clearly visible at . Particles, advected by the flow, can move across the separation between the two regions, thus being exposed to different temperature, being heated or cooled in the process. The width of the region where all these processes occur can be measured by considering the mean temperature distribution of the carrier flow (Figure 2a); we define the temporal mixing layer thickness as
which gives a measure of the thickness of the layer with a relevant mean temperature gradient, where varies from to . This definition, which has a simple geometrical interpretation, is analogous to the vorticity thickness in thin shear flows, and is different from the one used in the study of shearless mixings (e.g., [27]), but it has the advantage of being independent of the shape of the mean temperature profile and is not involves in any arbitrary definition of the border of the layer. Anyway, all possible definitions are equivalent if the mean temperature evolves self-similarly, because any definition leads to the same temporal evolution. Self-similarity is observed after a short transient of about one eddy turnover time . The length of the initial transient is almost independent from the Reynolds number but shows a weak dependence from the initial profile of mean temperature, so that the simulation at , where the coarser resolution (Table 1) imposes a more smoothed temperature step (Equation (13)). After such an initial transient, the mixing layer thickness shows an almost diffusive growth or, more precisely, , which shows the dominant role of the large-scale eddies (Figure 2b), in agreement with the studies on the spreading of shearless mixings in a decaying turbulence, e.g., [27].
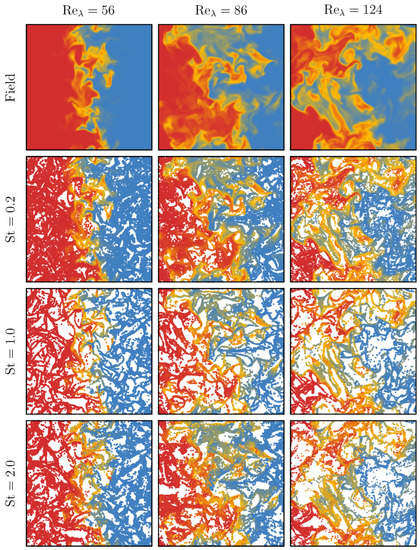
Figure 1.
Visualization of the dimensionless fluid temperature at in a plane, normal to the initial temperature gradient, in the central portion of the computational domain (a square in dimensionless units) in the one-way coupling regime. The top panels show the temperature of the carrier flow, while each subsequent row shows the temperature of the particles close to such a plane for three different Stokes numbers at . In order to have a similar number of particles in the visualization, the thickness of the layer, in which the particles are shown, increases with the Stokes number. The size of particles is out of scale. The red colour corresponds to the maximum temperature in the domain, and the blue colour to the lowest.
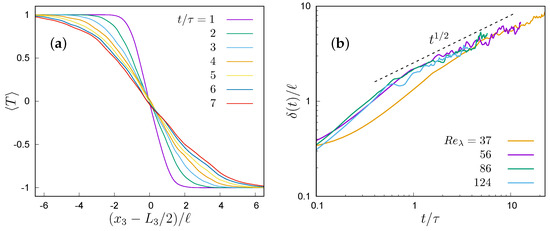
Figure 2.
One-way coupling. (a) Time evolution of the dimensionless mean fluid temperature at ; (b) Growth of the mixing layer thickness at different (both panels at ).
Indeed, after the initial transient during which velocity–temperature correlations are created and particles cluster according to their inertia, a self-similar stage of evolution is observed, during which all single-point statistics of the carrier fluid and of the suspended particles collapse when properly rescaled, i.e., the distance from the centre of the domain (position of the initial temperature discontinuity) with , and the amplitude of higher moments and velocity–temperature correlations with powers of .
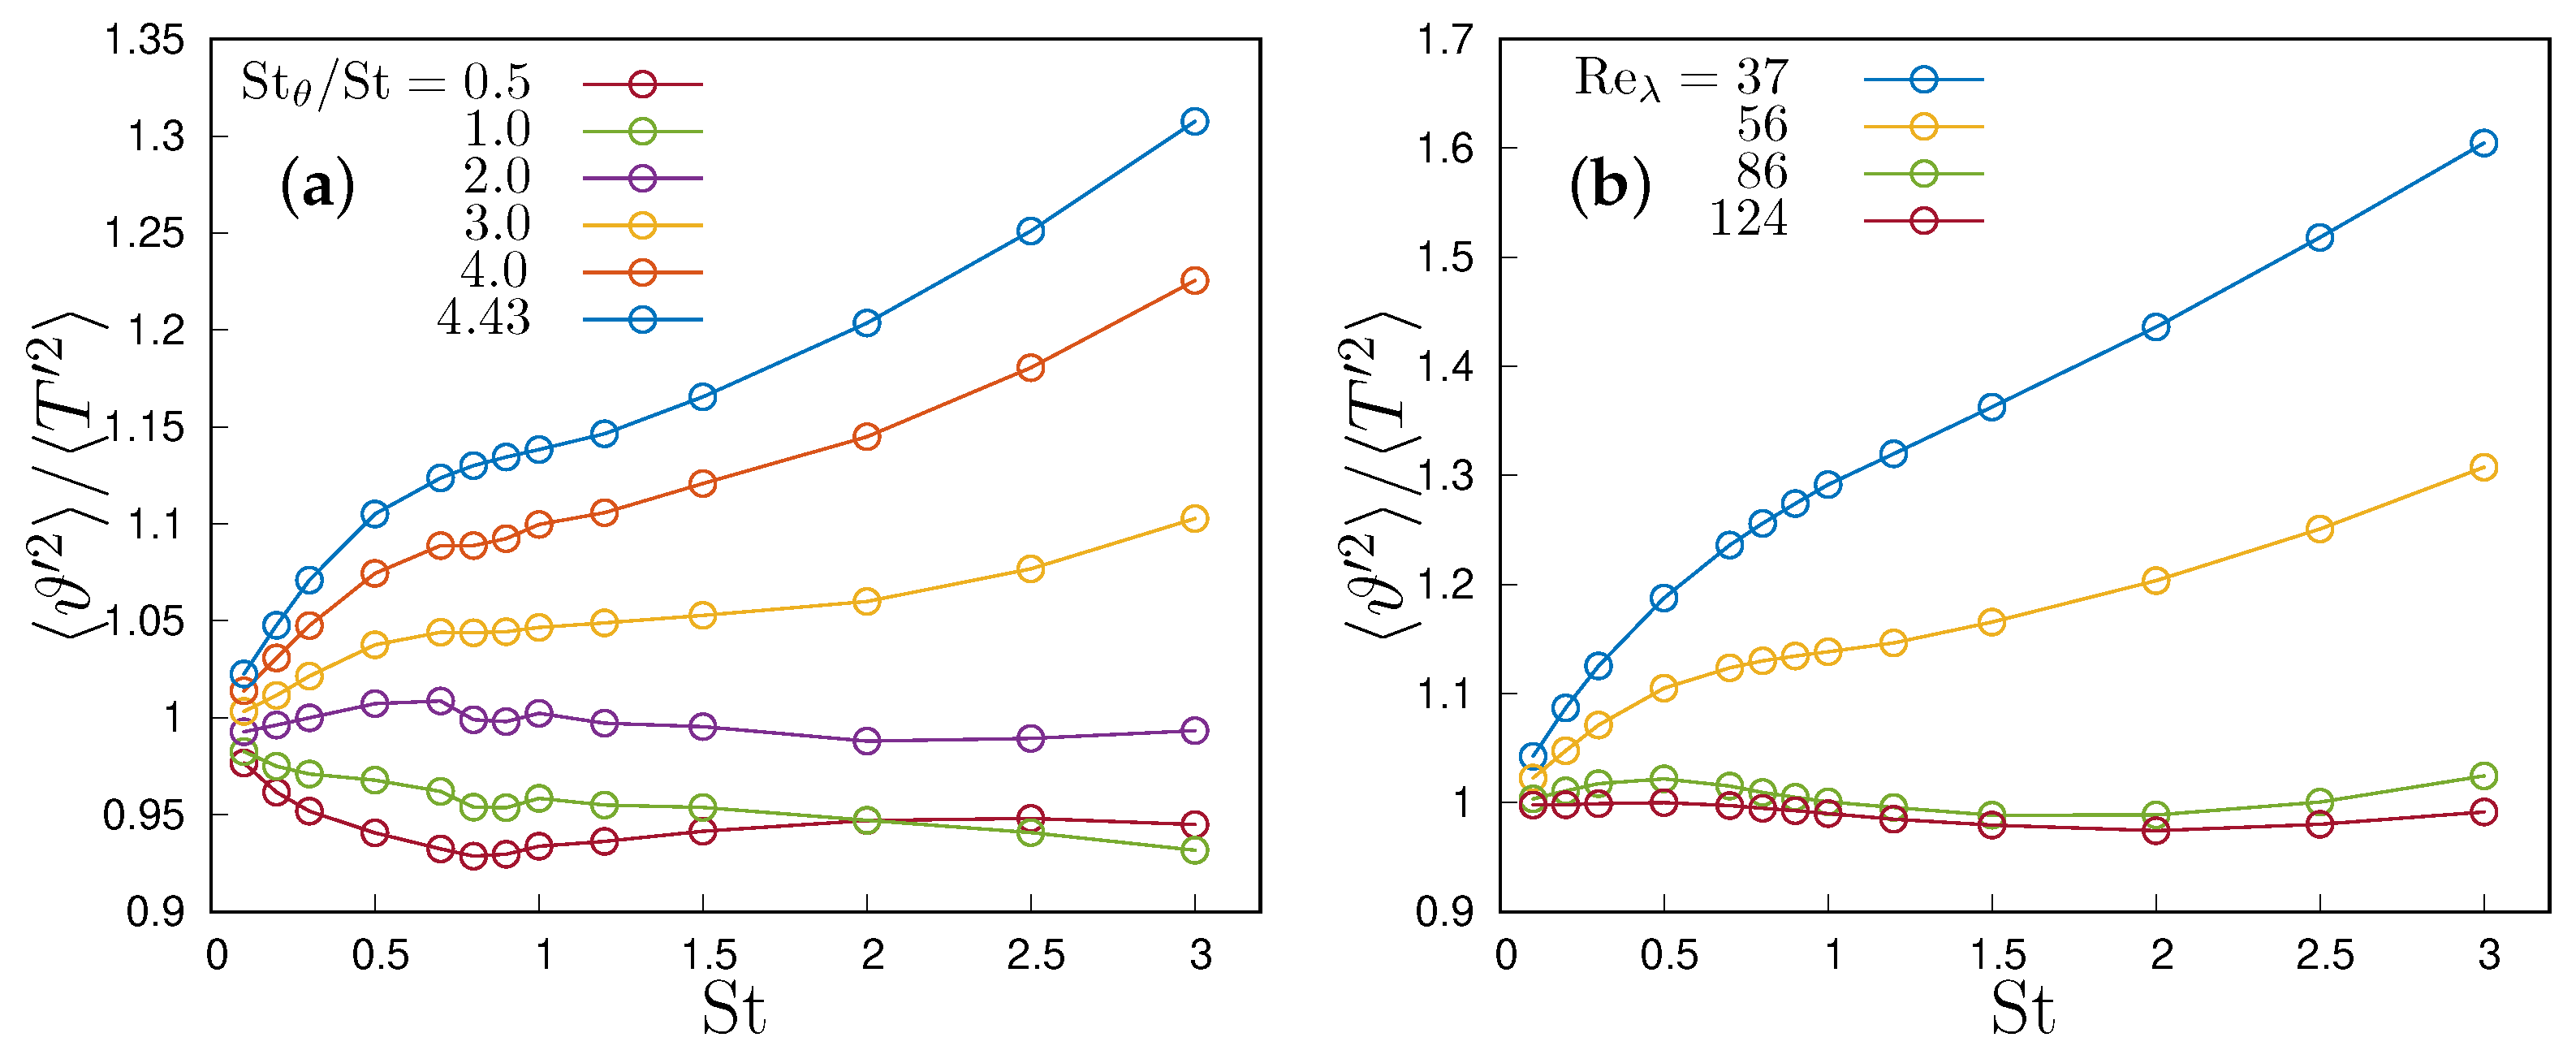
As shown in [27], a region with high variance develops in the centre of the domain. The temperature variance distribution show a self-similar stage of evolution when position is normalized with and their values are normalized with . Indeed, temperature fluctuations are generated by the interaction between the two regions at different temperature but tend to decay due to the reduction of the mean temperature gradient which acts as a forcing for temperature fluctuations. Figure 3 compares the variance of the fluid and particle temperature, in Figure 3a for different at the same Reynolds number, , in Figure 3b for different Reynolds number with the same ratio, equal to 4.43. In fact, even if the mean temperature of the particles at a given position is almost identical to the flow temperature at all Stokes numbers (i.e., variations are smaller than the uncertainty), particle inertia tends to increase the variance of the temperature (Figure 3) due to the larger relaxation time which allows particles to keep their temperature for longer times. In our simulations, and St are not independent, so that particles with higher inertia also have higher thermal inertia. Therefore, for fluid and particle temperature tend to behave in the same way, and their variances tend to be identical. The particle temperature variance increases with the Stokes number when is larger than 2, whereas it remains around one at lower ratios (Figure 3a). This effect reduces and tends to vanish when the Reynolds number increases (Figure 3b). We could attribute this effect to the pre-eminence of large-scale motions in the generation of the temperature mixing layer, so that the ratio between the particle relaxation time and the eddy turnover time is and reduces with an increasing Reynolds number, so that particle relaxation reduces with respect to the flow timescale which determines the process. As observed by Zaichik et al. [32], the increase in the variance of particle temperature with respect to fluid temperature variance is a characteristic feature of flows with a mean temperature gradient, because the particulate phase has no dissipation mechanism, as opposed to the carrier flow phase. In fact, homogeneous turbulence with a uniform mean temperature produces the opposite effect, and decreases when particle inertia increases [5,32].
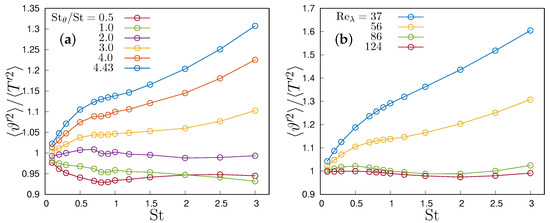
Figure 3.
Particle temperature variance to fluid temperature variance ratio against Stokes number in one-way coupling simulations for (a) different thermal Stokes number to Stokes number ratios , and (b) different Taylor microscale Reynolds numbers at .
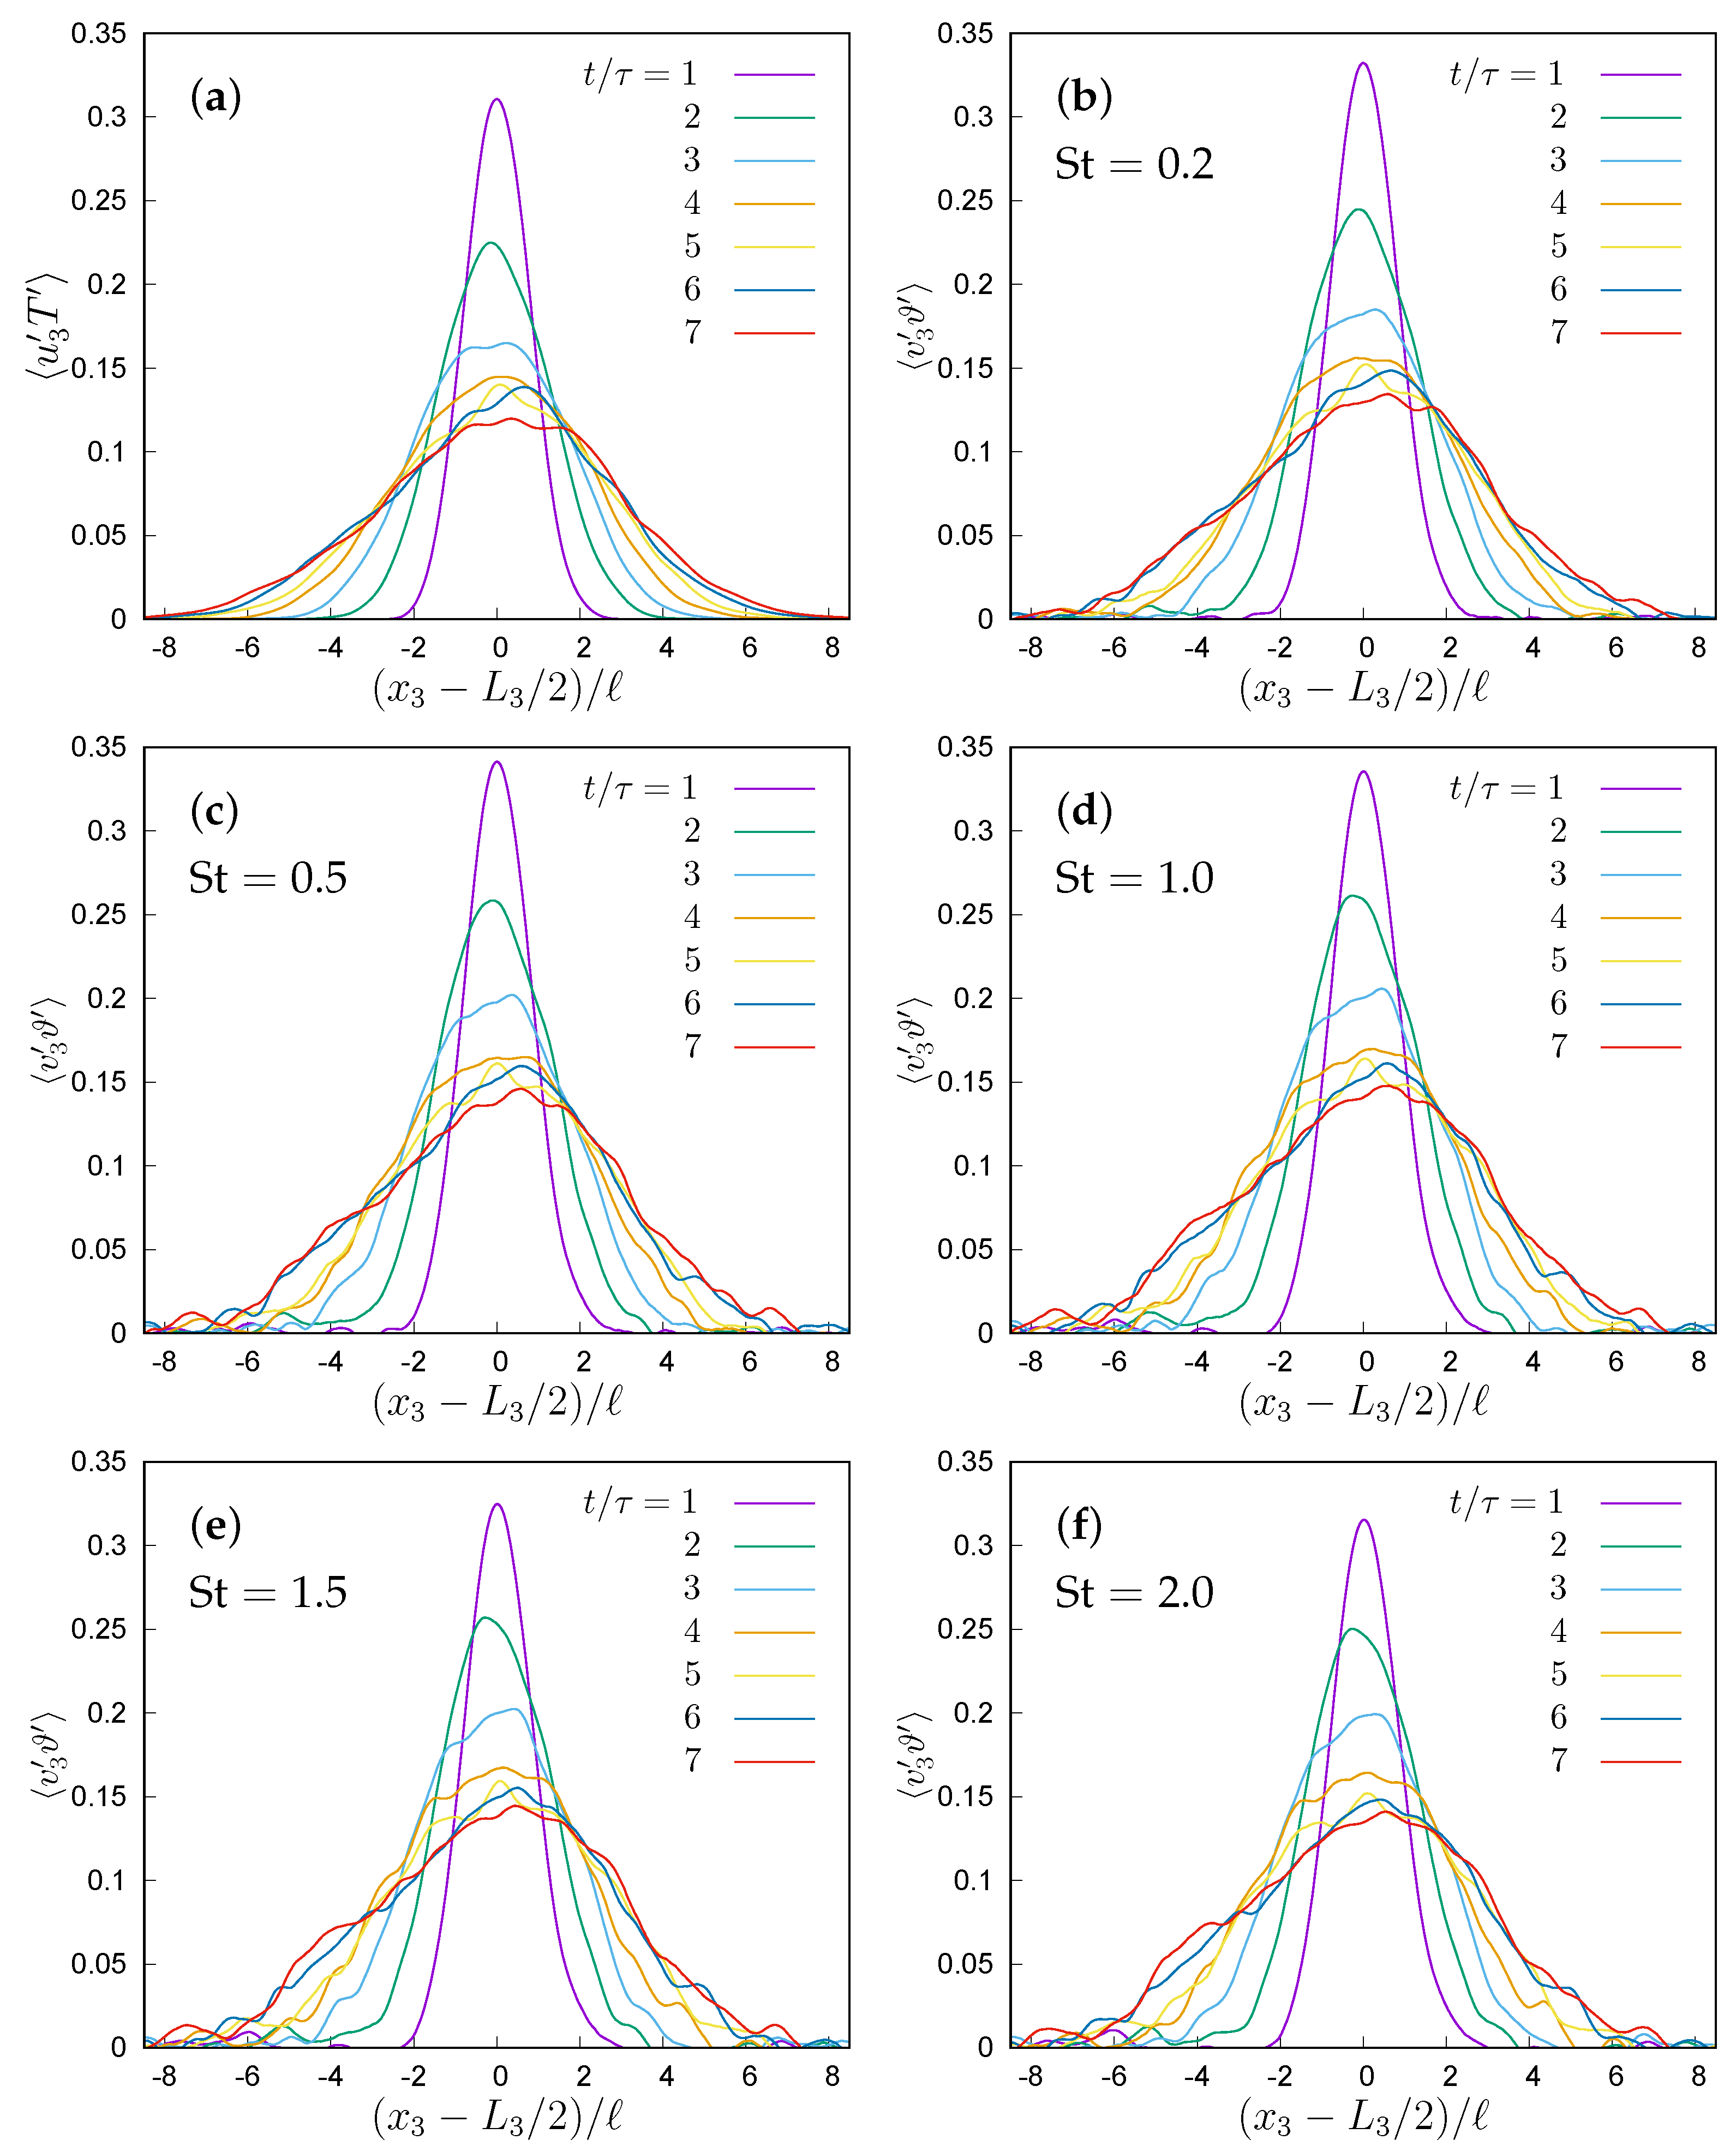
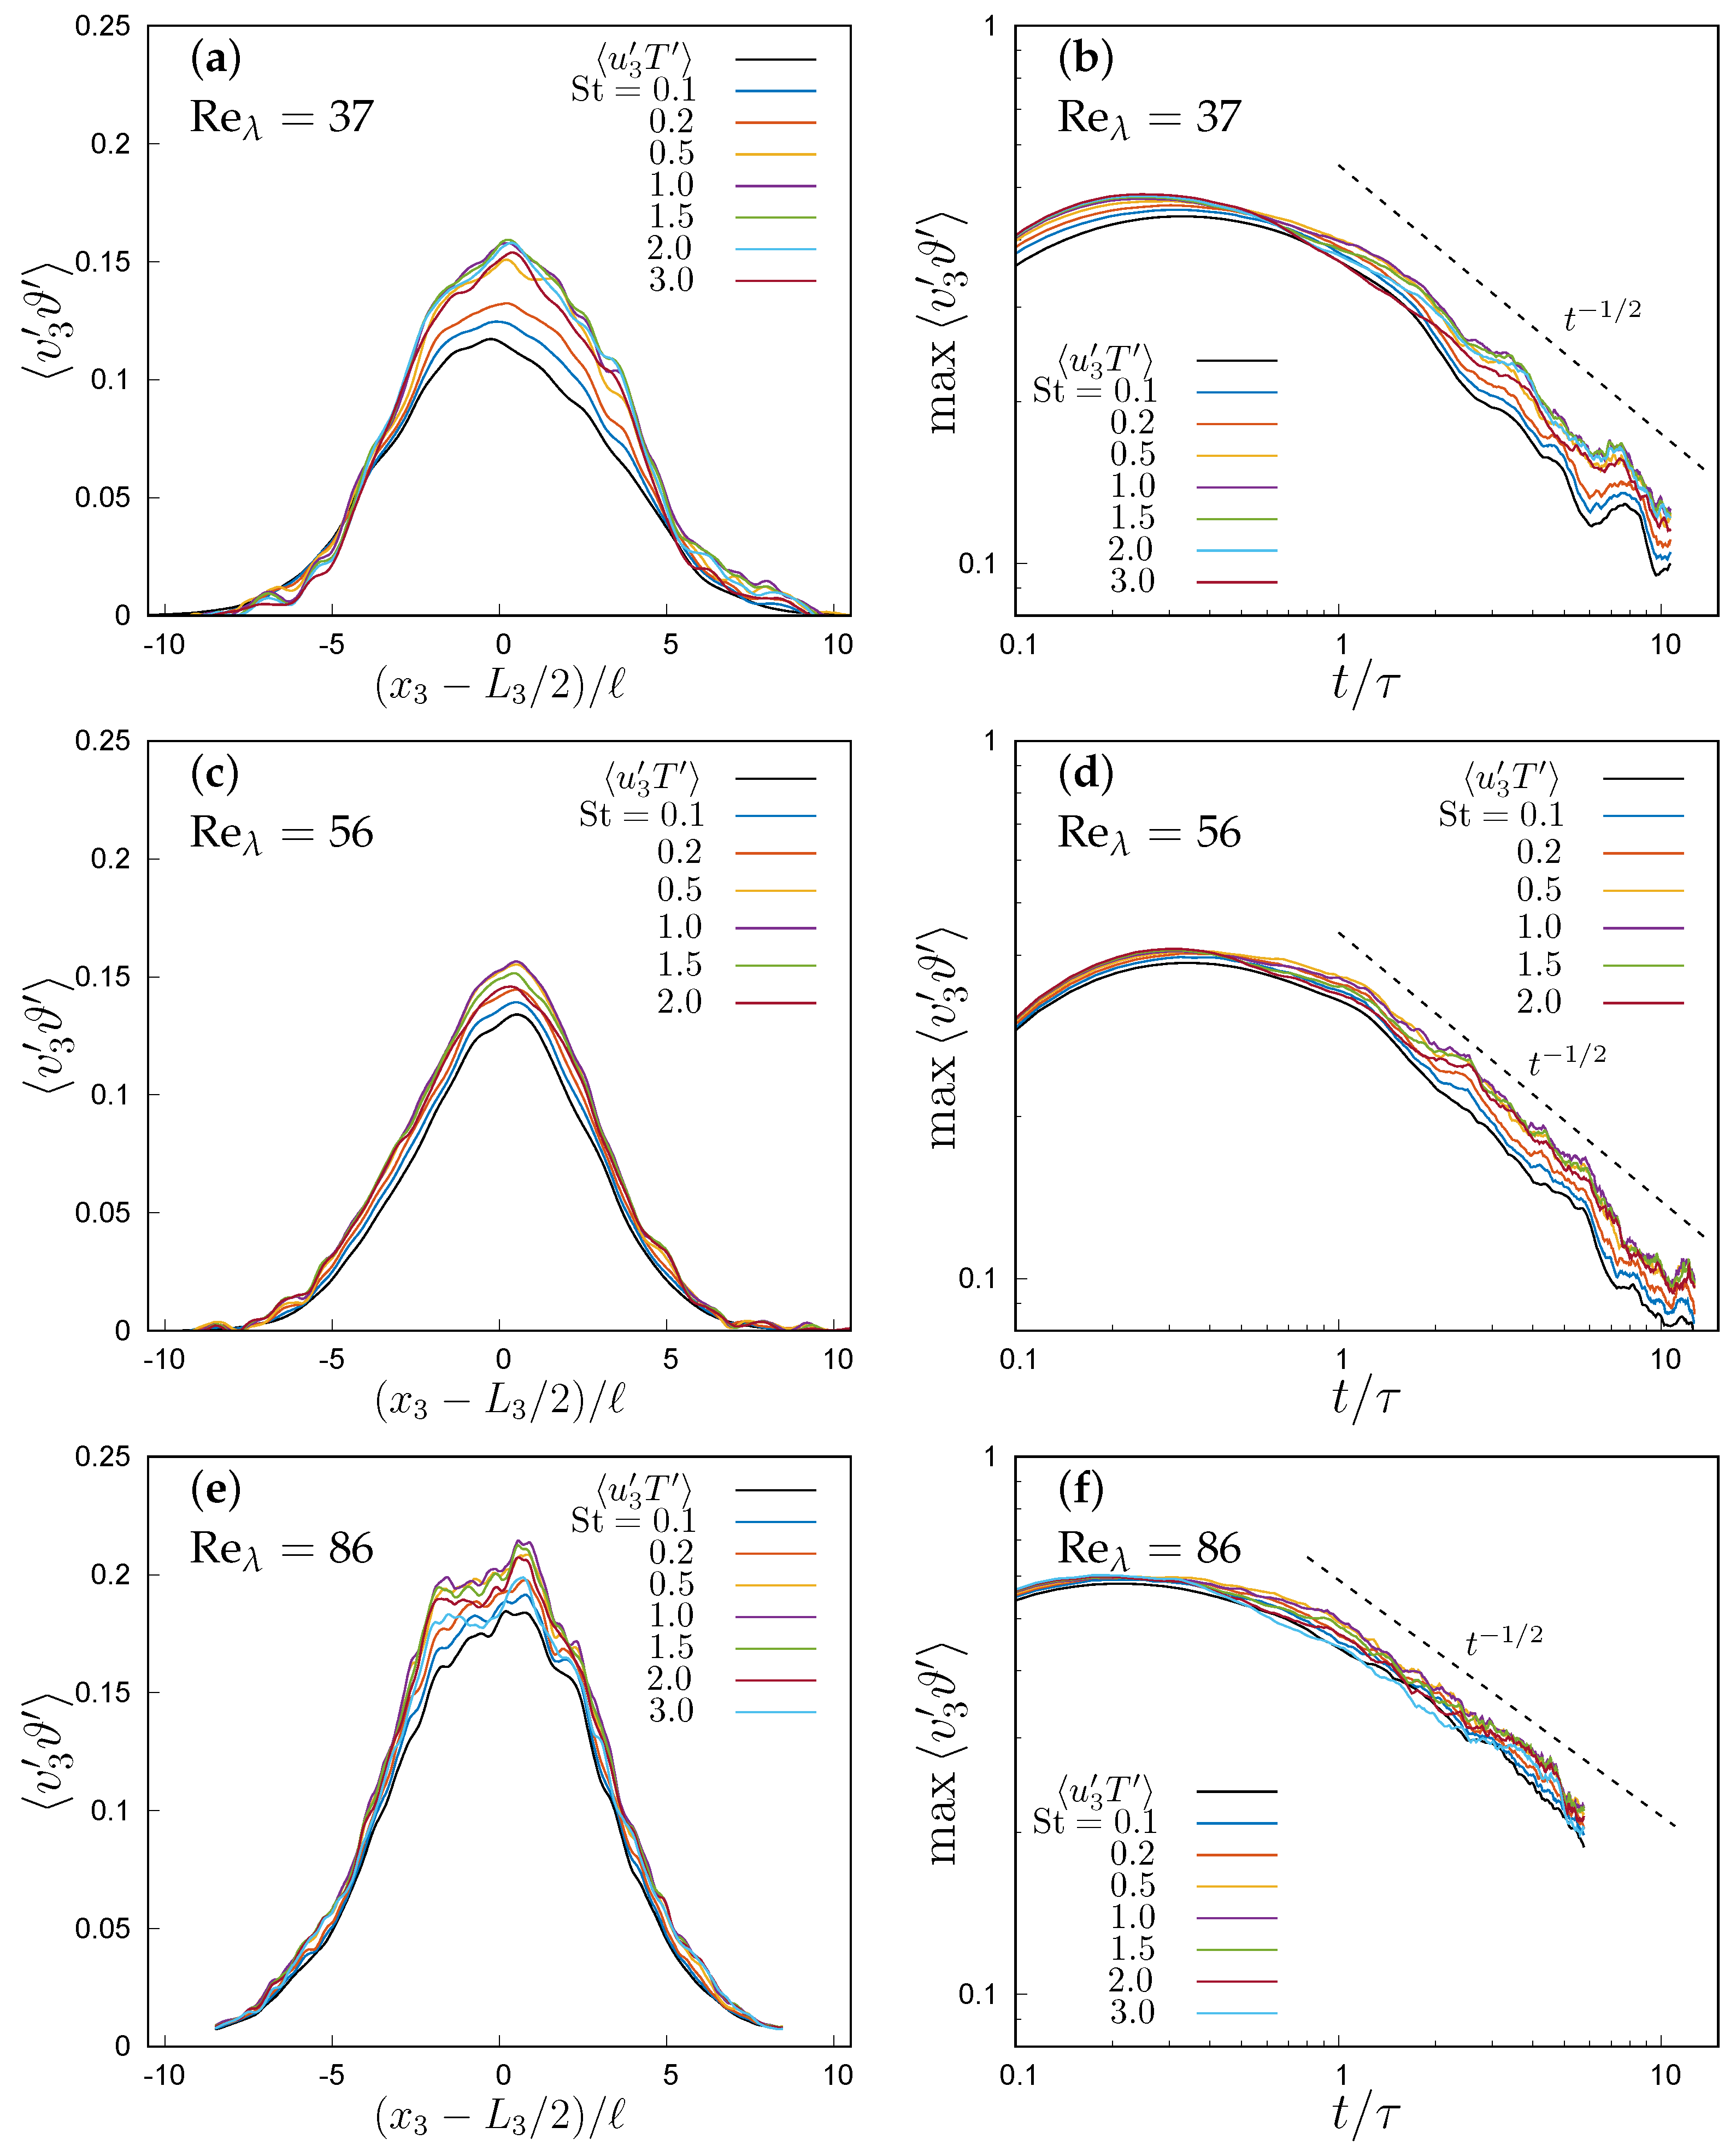
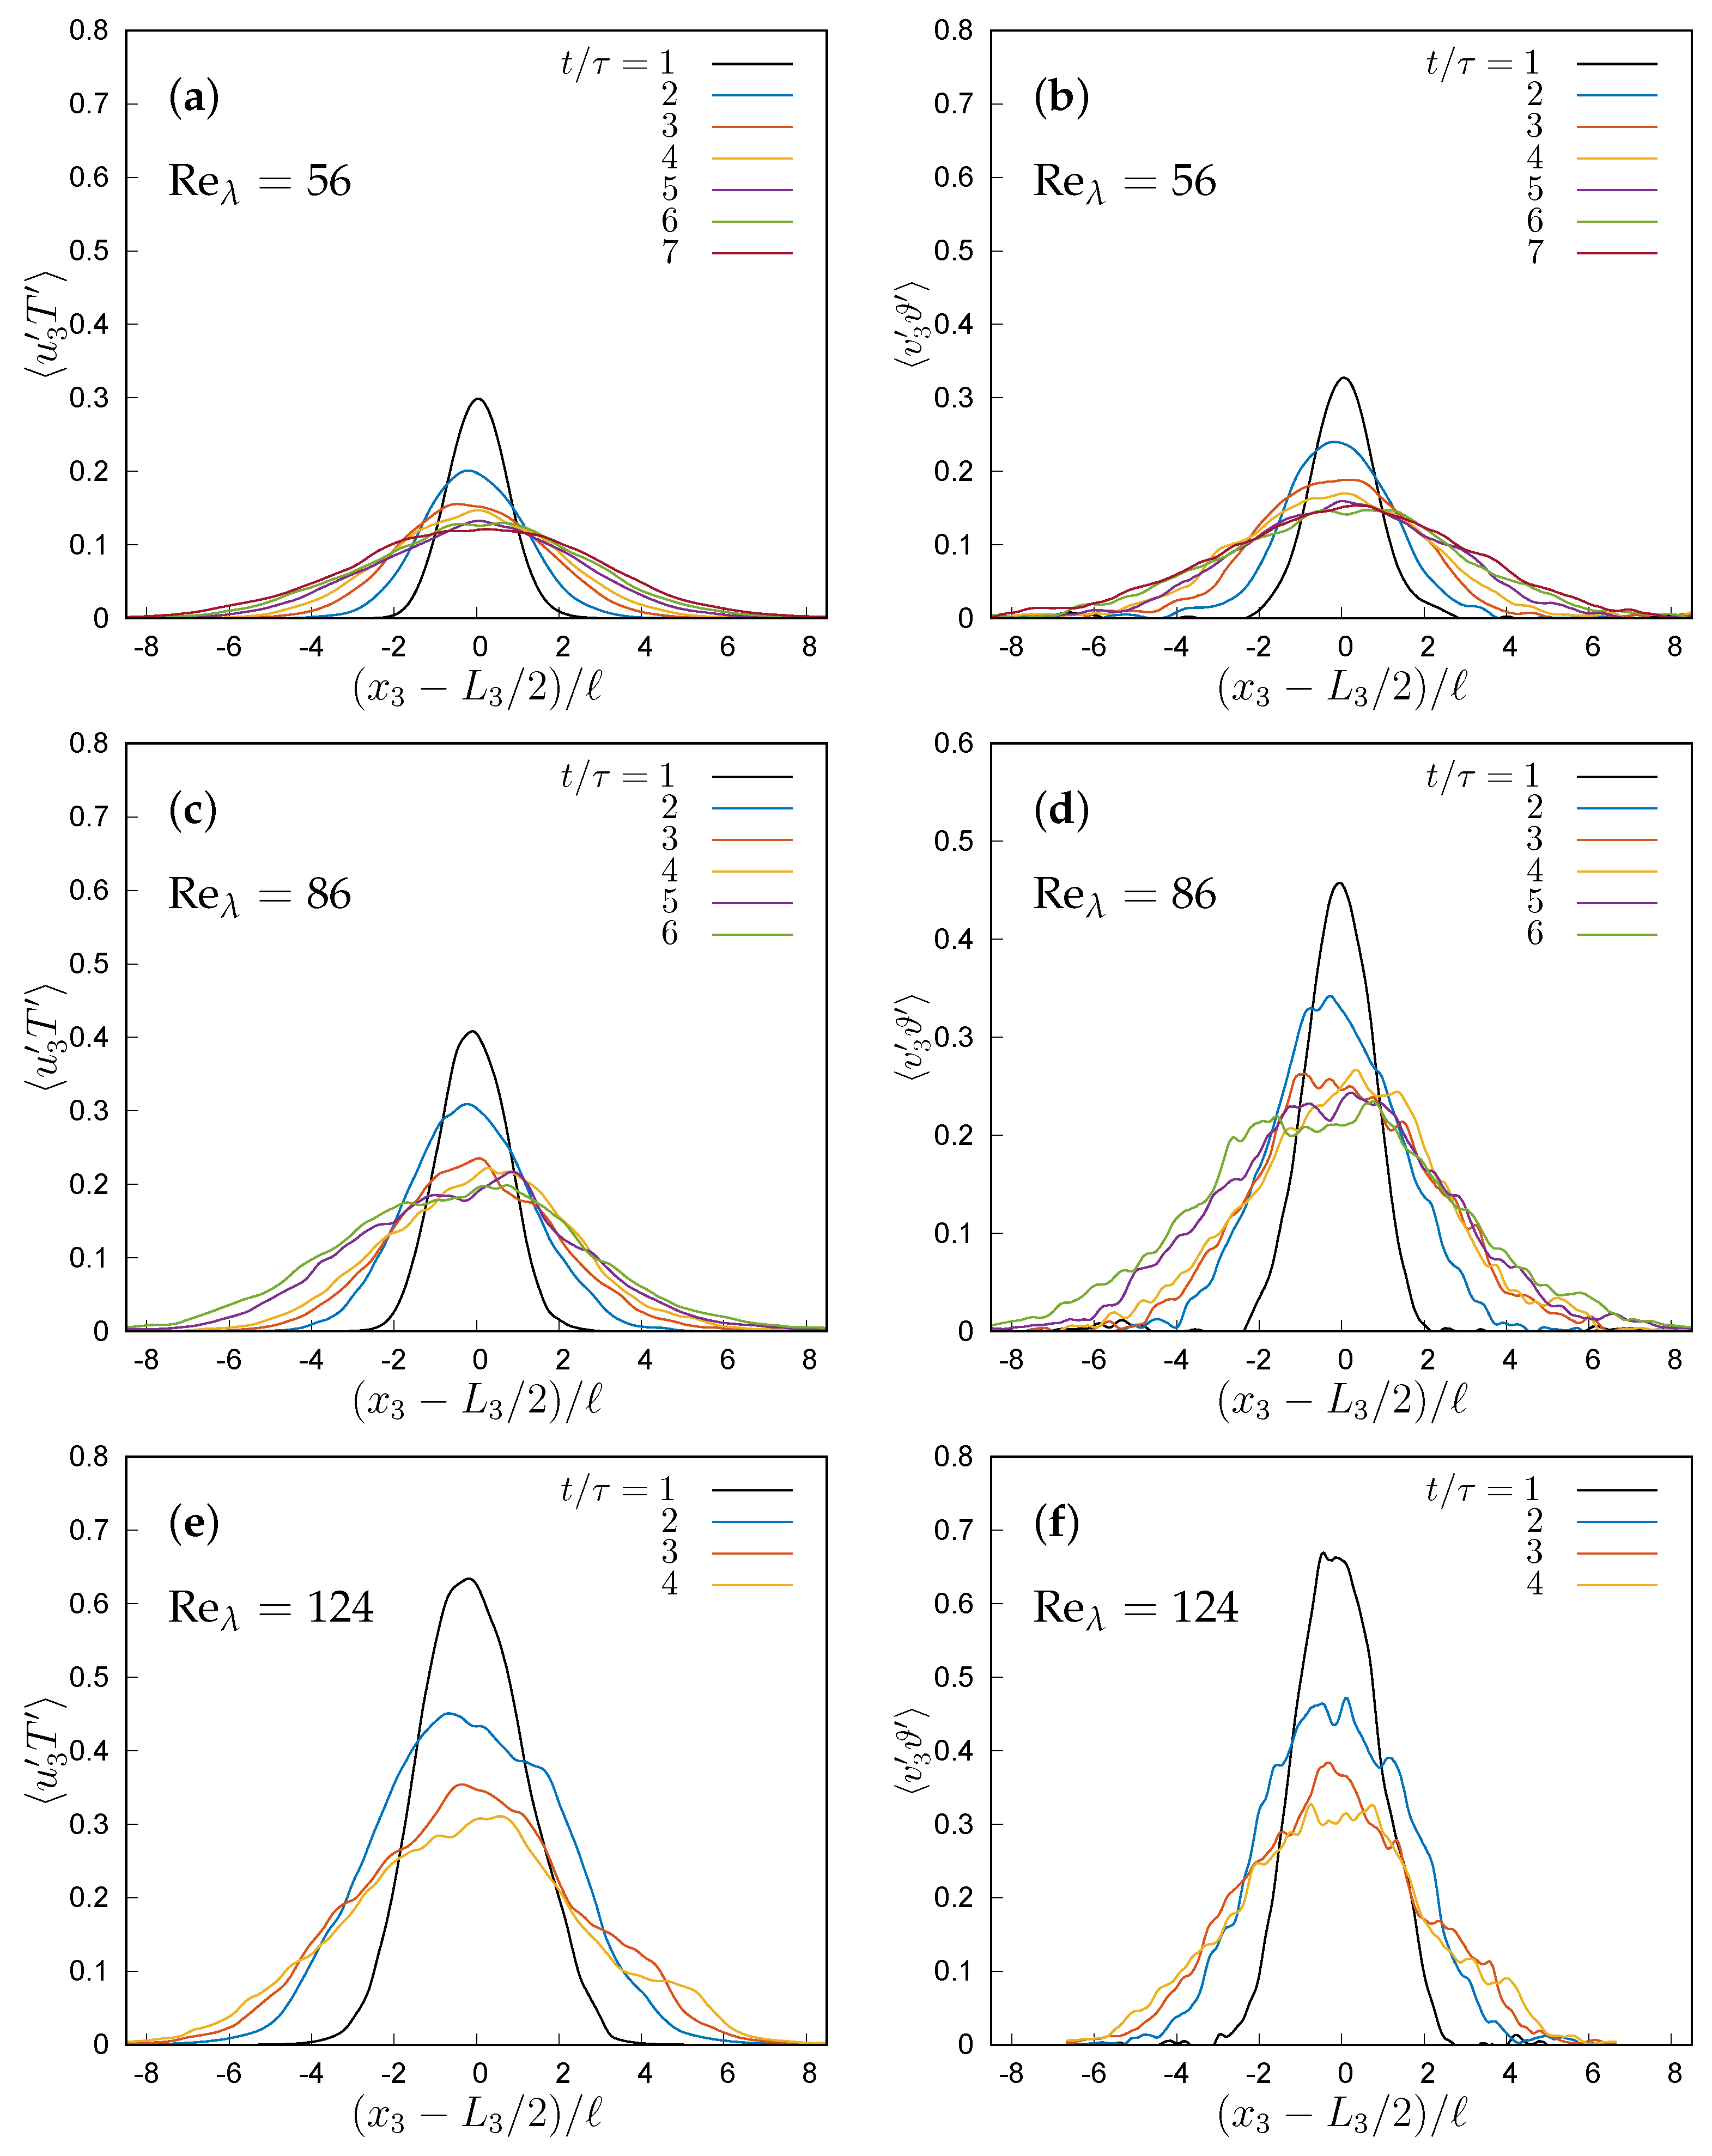
However, the most important single-point statistics are the correlations between temperature and velocity fluctuations because they are proportional to the heat transfer between the two flow regions at different temperature, whose quantification is our main aim. Figure 4 shows the time evolution of the spatial distribution of the fluid and particle temperature-velocity correlation at for and different Stokes number, while Figure 5 shows the same correlations at a fixed instant, , for different Reynolds and Stokes numbers, and the time evolution of their maxima. The maximum of the correlation decreases with time as , i.e., like the inverse of , due to the thickening of the temperature layer which reduces the amplitude of temperature fluctuations (Figure 6). An increase of particle inertia leads to an increase of particle velocity–temperature correlation up to about and then a decrease for higher St at the same time and Reynolds number. This translates into a different modulation of the heat transfer. The heat flux (actually, the flux of enthalpy) in the direction of the temperature inhomogeneity can be decomposed into the contribution of thermal diffusion, convection by fluid velocity, and transport associated with the particle motion. All these contributions are maximum in the centre of the domain (i.e., at the position of the initial temperature step), and, in the self-similar stage, reduce in time as while the mixing layer grows and the driving mean temperature gradient reduces. Inertial particles can carry large temperature differences at long distances; therefore, they can give a significant contribution to the heat transfer.
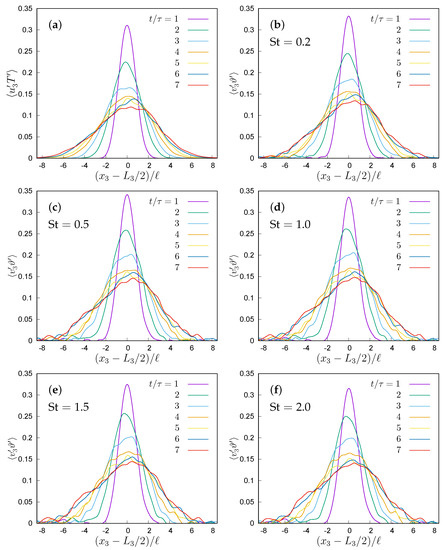
Figure 4.
One-way coupling simulations at and . Time evolution of (a) the fluid velocity and temperature correlation and the particle velocity and temperature correlation for (b) , (c) , (d) , (e) and (f) .
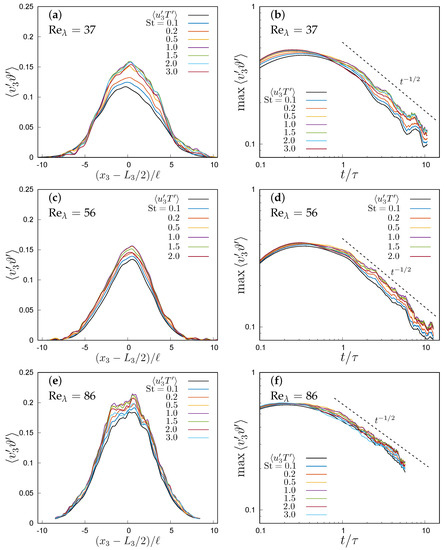
Figure 5.
One-way coupling simulations with . (a) Spatial distribution of velocity and temperature correlation at and and (b) time evolution of the maximum correlation for . The same quantities are shown for (c,d) and (e,f).
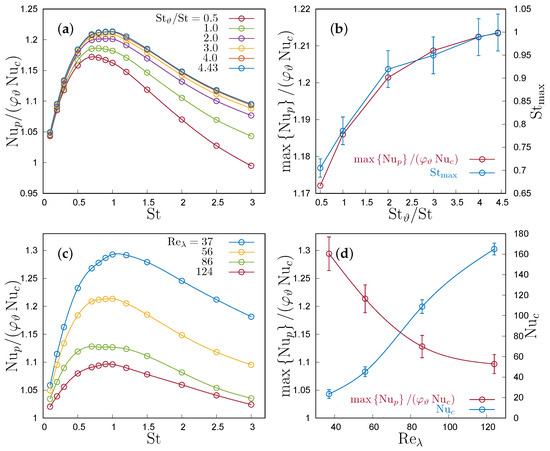
Figure 6.
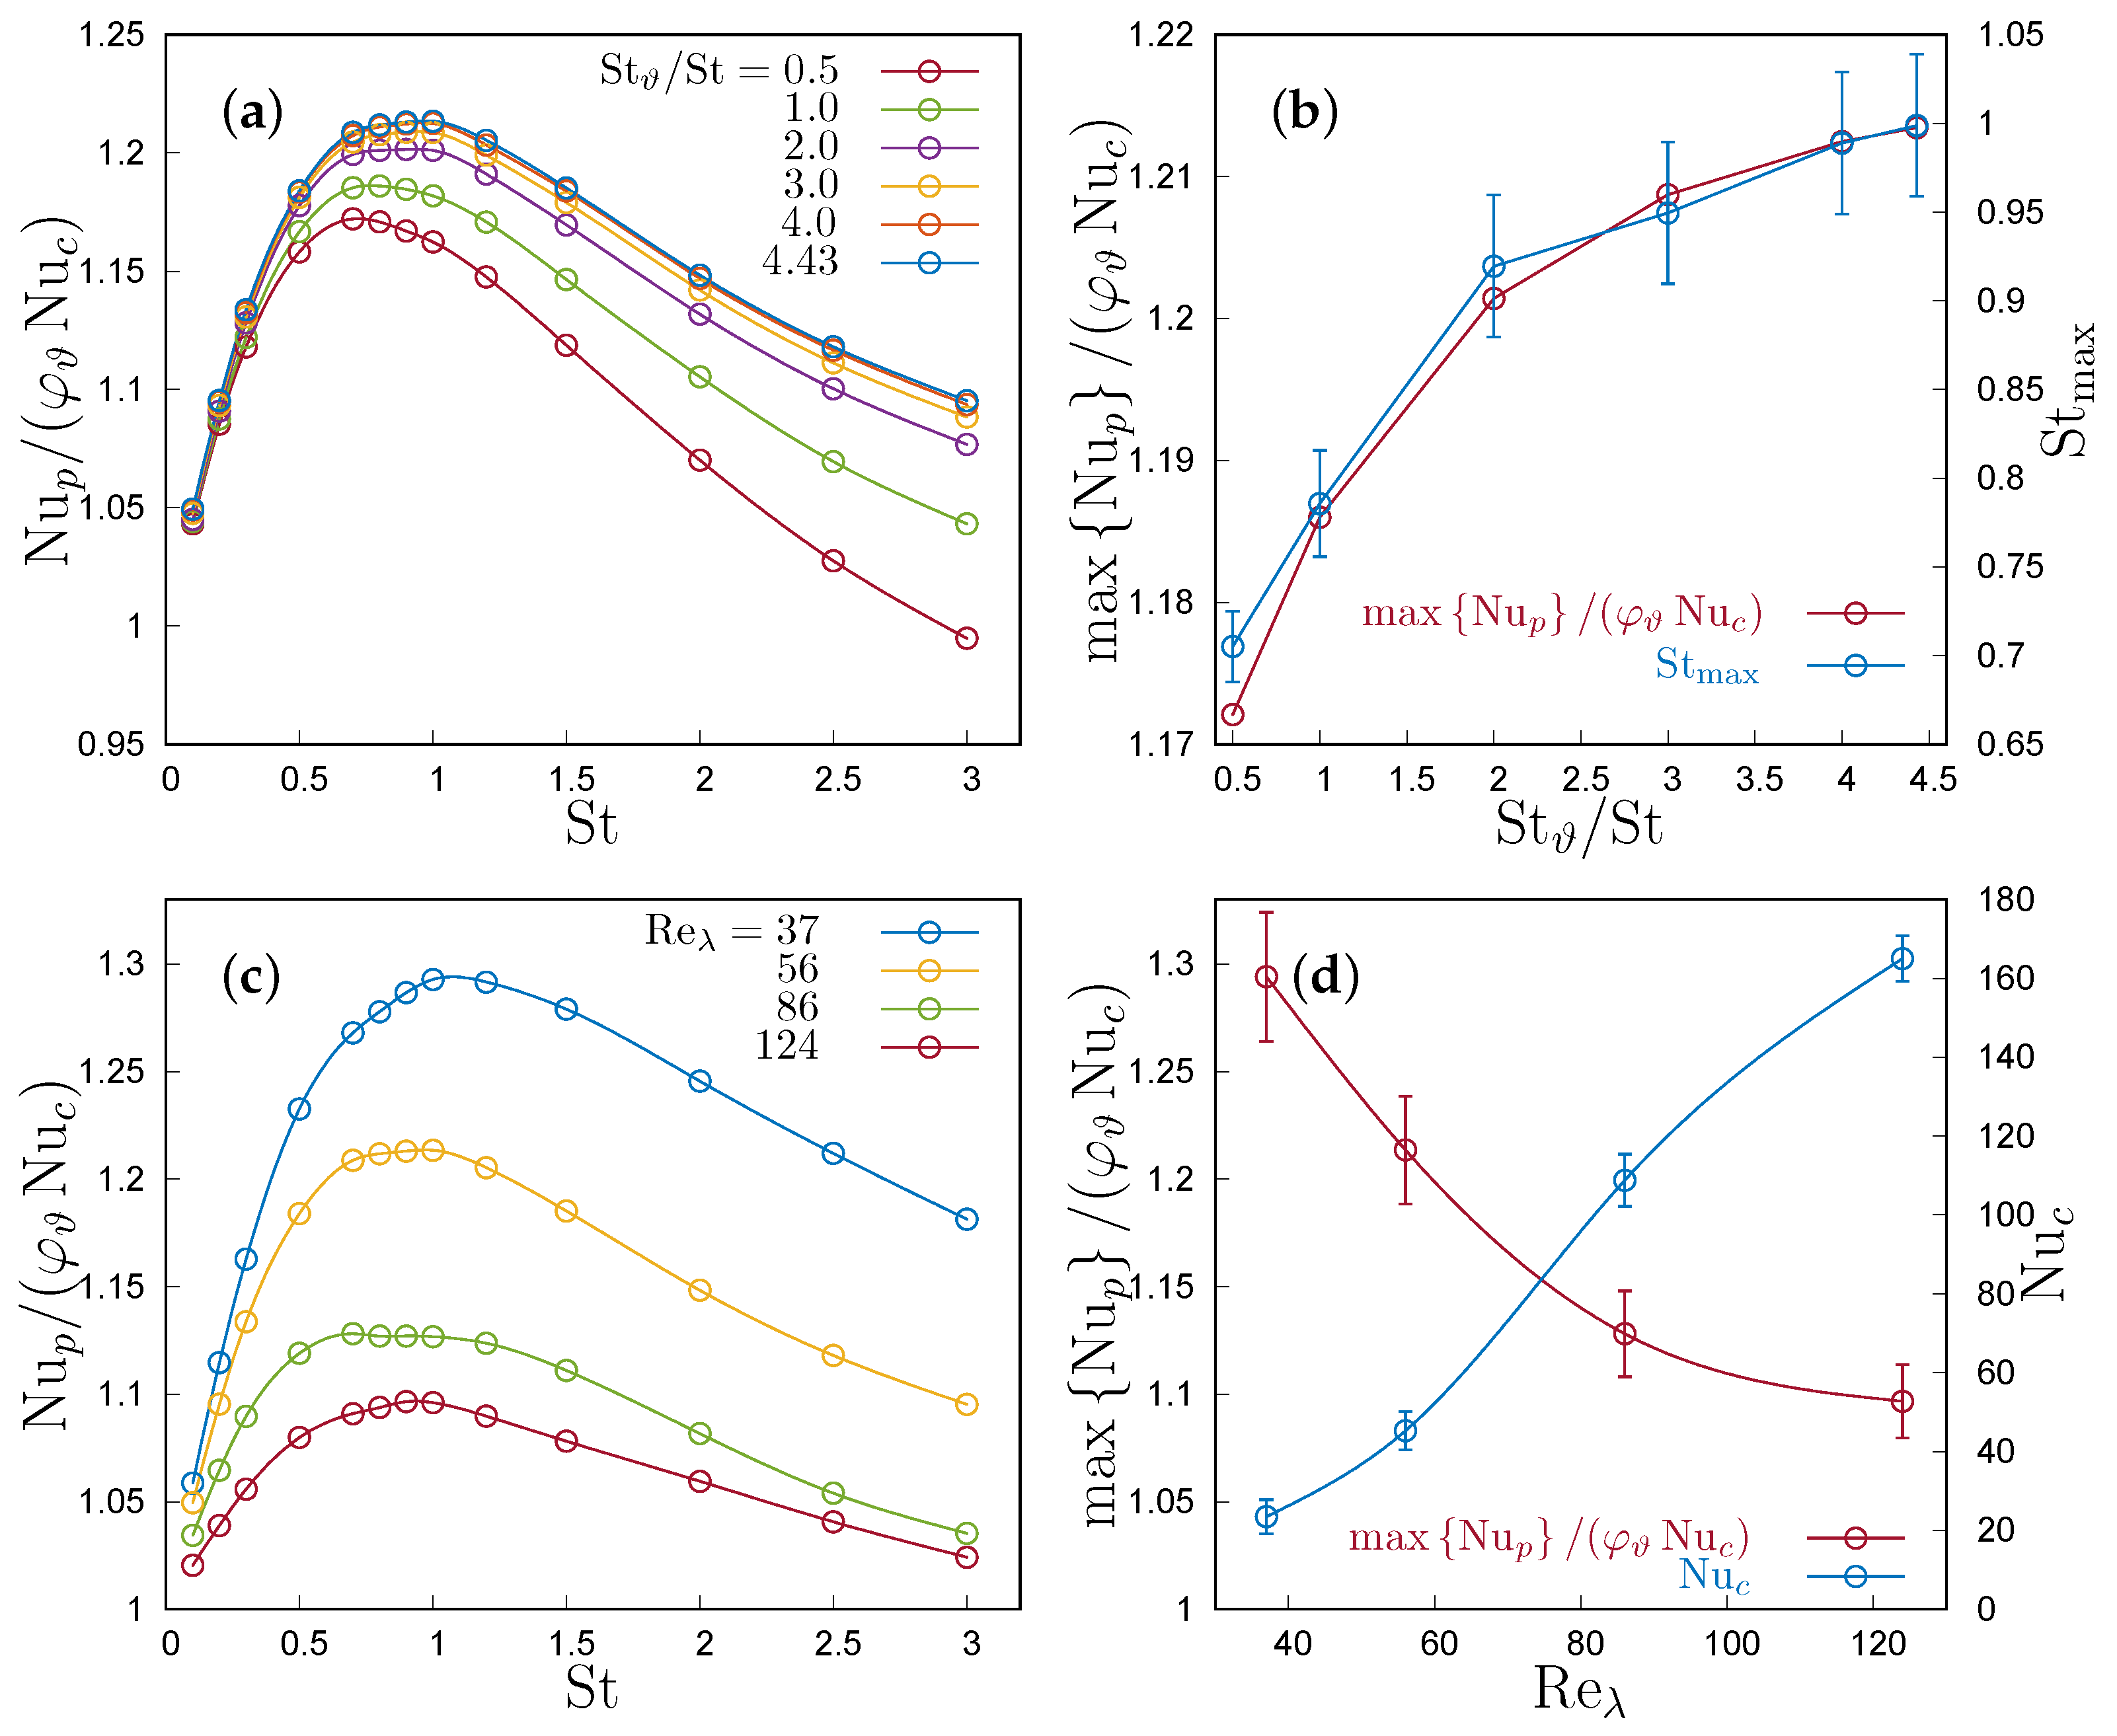
One-way coupling regime. (a) Particle contribution to the Nusselt number, as a function of the Stokes number at ; is the fluid convection contribution to the Nusselt Number, is the particle-to-fluid heat capacity ratio. (b) Maximum particle Nusselt number and the corresponding Stokes number as function of Stokes number to thermal Stokes number ratio at . (c) Particle motion contribution to the Nusselt number, as a function of the Stokes number and Reynolds number at . (d) Variation of convective Nusselt number in terms of Taylor Reynolds number at .
To quantify the effect of each parameter on the heat transfer, we use the Nusselt number, Nu, customarily defined as the ratio of the heat transfer to heat transfer by the thermal diffusion in a static, nonmoving, system. By using the mixing thickness as a length scale, which is the only length scale dynamically significant for the heat transfer in the present flow configuration, the Nusselt number remains constant in the self-similar stage of evolution of the mixing. By using standard dimensional analysis to the system of Equations (1)–(5) and (7), the Nusselt number Nu, can be written as
where Re is the Reynolds number, the Prandtl number, St and the Stokes and thermal Stokes number, and is the ratio between particle heat capacity and fluid heat capacity. As observed above, the heat flux per unit surface and unit time is given by the sum of heat flux due to diffusion, convection, and particle motions, , where, from Equations (1)–(5),
Therefore, the Nusselt number can be written as
where and are the convective and particle contributions, given by
where the tilde indicates dimensionless variables (see Appendix A). The ratio is the relevant indicator of the enhancement of the heat transfer due to the presence of particles. In the one-way coupling regime, the carrier fluid temperature is not modified by the presence of particles; therefore, the convective heat flux depends only on fluid properties and on the underlaying turbulence, so that . Therefore, in the one-way coupling regime, only is affected by particle inertia and thermal inertia. However, particle velocity and temperature in the collisionless one-way coupling regime are determined by the carrier flow and by their relaxation times (6), but particles do not interact with each other in any way, either directly with collisions, or indirectly through the carrier fluid, so that the correlation is not affected by particle density but only by the fluid-to-particle action. As a consequence, the ratio in (22) can depend only on Re and Pr and particle inertia, so that we can infer that is a linear function of , i.e., . We remark that the existence of a self-similar stage implies that the Nusselt number does not depend on time, because all fluxes have the same temporal evolution. The heat flux between the two homothermal regions is evaluated at the centre of the domain, i.e., at the plane initially separating the two regions, which is also where the gradient of the mean temperature of the carrier fluid is maximum. Figure 6a shows the particle contribution of particle motion to the Nusselt number as a function of the Stokes number in the one-way coupling regime for different ratios between thermal Stokes number and Stokes number at fixed Reynolds number, , whereas Figure 6c shows the particle contribution to the Nusselt number for different Reynolds numbers but for a fixed thermal Stokes-to-Stokes number ratio . When the Stokes number approaches zero, particles behave as passive tracers and, because the thermal Stokes number also approaches zero, they tend to be also in thermal equilibrium with the local carrier fluid; thus, in this limit. The heat flux has a maximum when the Stokes number approaches one, a situation which corresponds to the maximum clustering of particles. In the investigated ranges of , this maximum is not achieved at , but at a smaller Stokes number, which increases with , from around 0.6 when increasing to almost 1 when , as is shown in Figure 6b for the simulation at . This trend is present for all Reynolds numbers, suggesting that the maximum heat transfer due to particles is achieved at only in the asymptotic limit for . The maximum increases monotonically with the ratio, which makes particles with high thermal capacities able to significantly increase the heat flux. However, because the ratio can easily be of order for liquid or solid particles in a gas, the particle-to-fluid heat capacity ratio can be of order even for small sub-Kolmogorov particles in dilute suspensions and, thus, the presence of particles can most often significantly enhance the overall heat flux even in the range of validity of one-way coupling. It is evident, however, that the heat transfer enhancement due to particles is much more strongly affected by St than by alone, as indicated by the data in Figure 6a,c. Indeed, in the investigated range of particle-to-fluid thermal capacity ratio, the maximum particle Nusselt number changes by around 5% for the same Reynolds number. For , the particle velocity dynamics becomes increasingly nonlocal, reducing clustering and the heat flux. From the investigated range of the Stokes number it is not possible to infer an asymptotic limit for . However, in such a limit, particle dynamics becomes uncorrelated from the dynamics of the carrier fluid. Therefore, their dynamics can be only determined by particle collisions and one can expect that, in such a condition, particles behave like molecules and, as a consequence, the heat transport approaches a diffusive limit, leading again to . This is compatible with the present simulations. The rate of approach to such a limit appears to depend on the ratio, and is significantly slower for high values of . However, because we are considering a collisionless particle-laden flow, such an asymptotic limit cannot be reproduced by current simulations.
It should be noted that, unlike the Rayleigh–Bénard problem analysed by Park et al. [33], the effect of preferential concentration and clustering exhibits itself not only in the thermal coupling, but already in the one-way regime in the absence of any modulation of the carrier flow by particles.
Even if the Ratio reduces with the Reynolds number, the particle contribution to the heat transfer increases, because grows when grows. Our results suggest that when independently from the Stokes number. The dependence of the convective Nusselt number on the Reynolds number is shown in Figure 6d. Anyway, when the Reynolds number is increased, the particle Nusselt number increases less than the convective Nusselt number, so that the ratio reduced (see Figure 6c,d). By fitting the data in Figure 6d, one can infer that the maximum particle Nusselt number scales as
with .
3.2. Two-Way Coupling
We expect these findings to hold, at least qualitatively, in the two-way coupling regime. However, because inertial particles tend to preferentially concentrate in the advected scalar fronts where the gradient of temperature is large, they act to smooth the temperature gradients. Thus, we expect that particle thermal feedback would lead to a potential reduction of the overall Nusselt number. Therefore, in order to ascertain how the modulation of the fluid temperature due to the thermal feedback from particles influences the overall heat transfer, we have repeated the simulations by considering the two-way thermal coupling.
We carried out two-way simulations only for and for a fixed volume fraction , which implies also that heat capacity ratio is kept constant. In this situation, we have only two free governing parameters—the Stokes number and the Reynolds number.
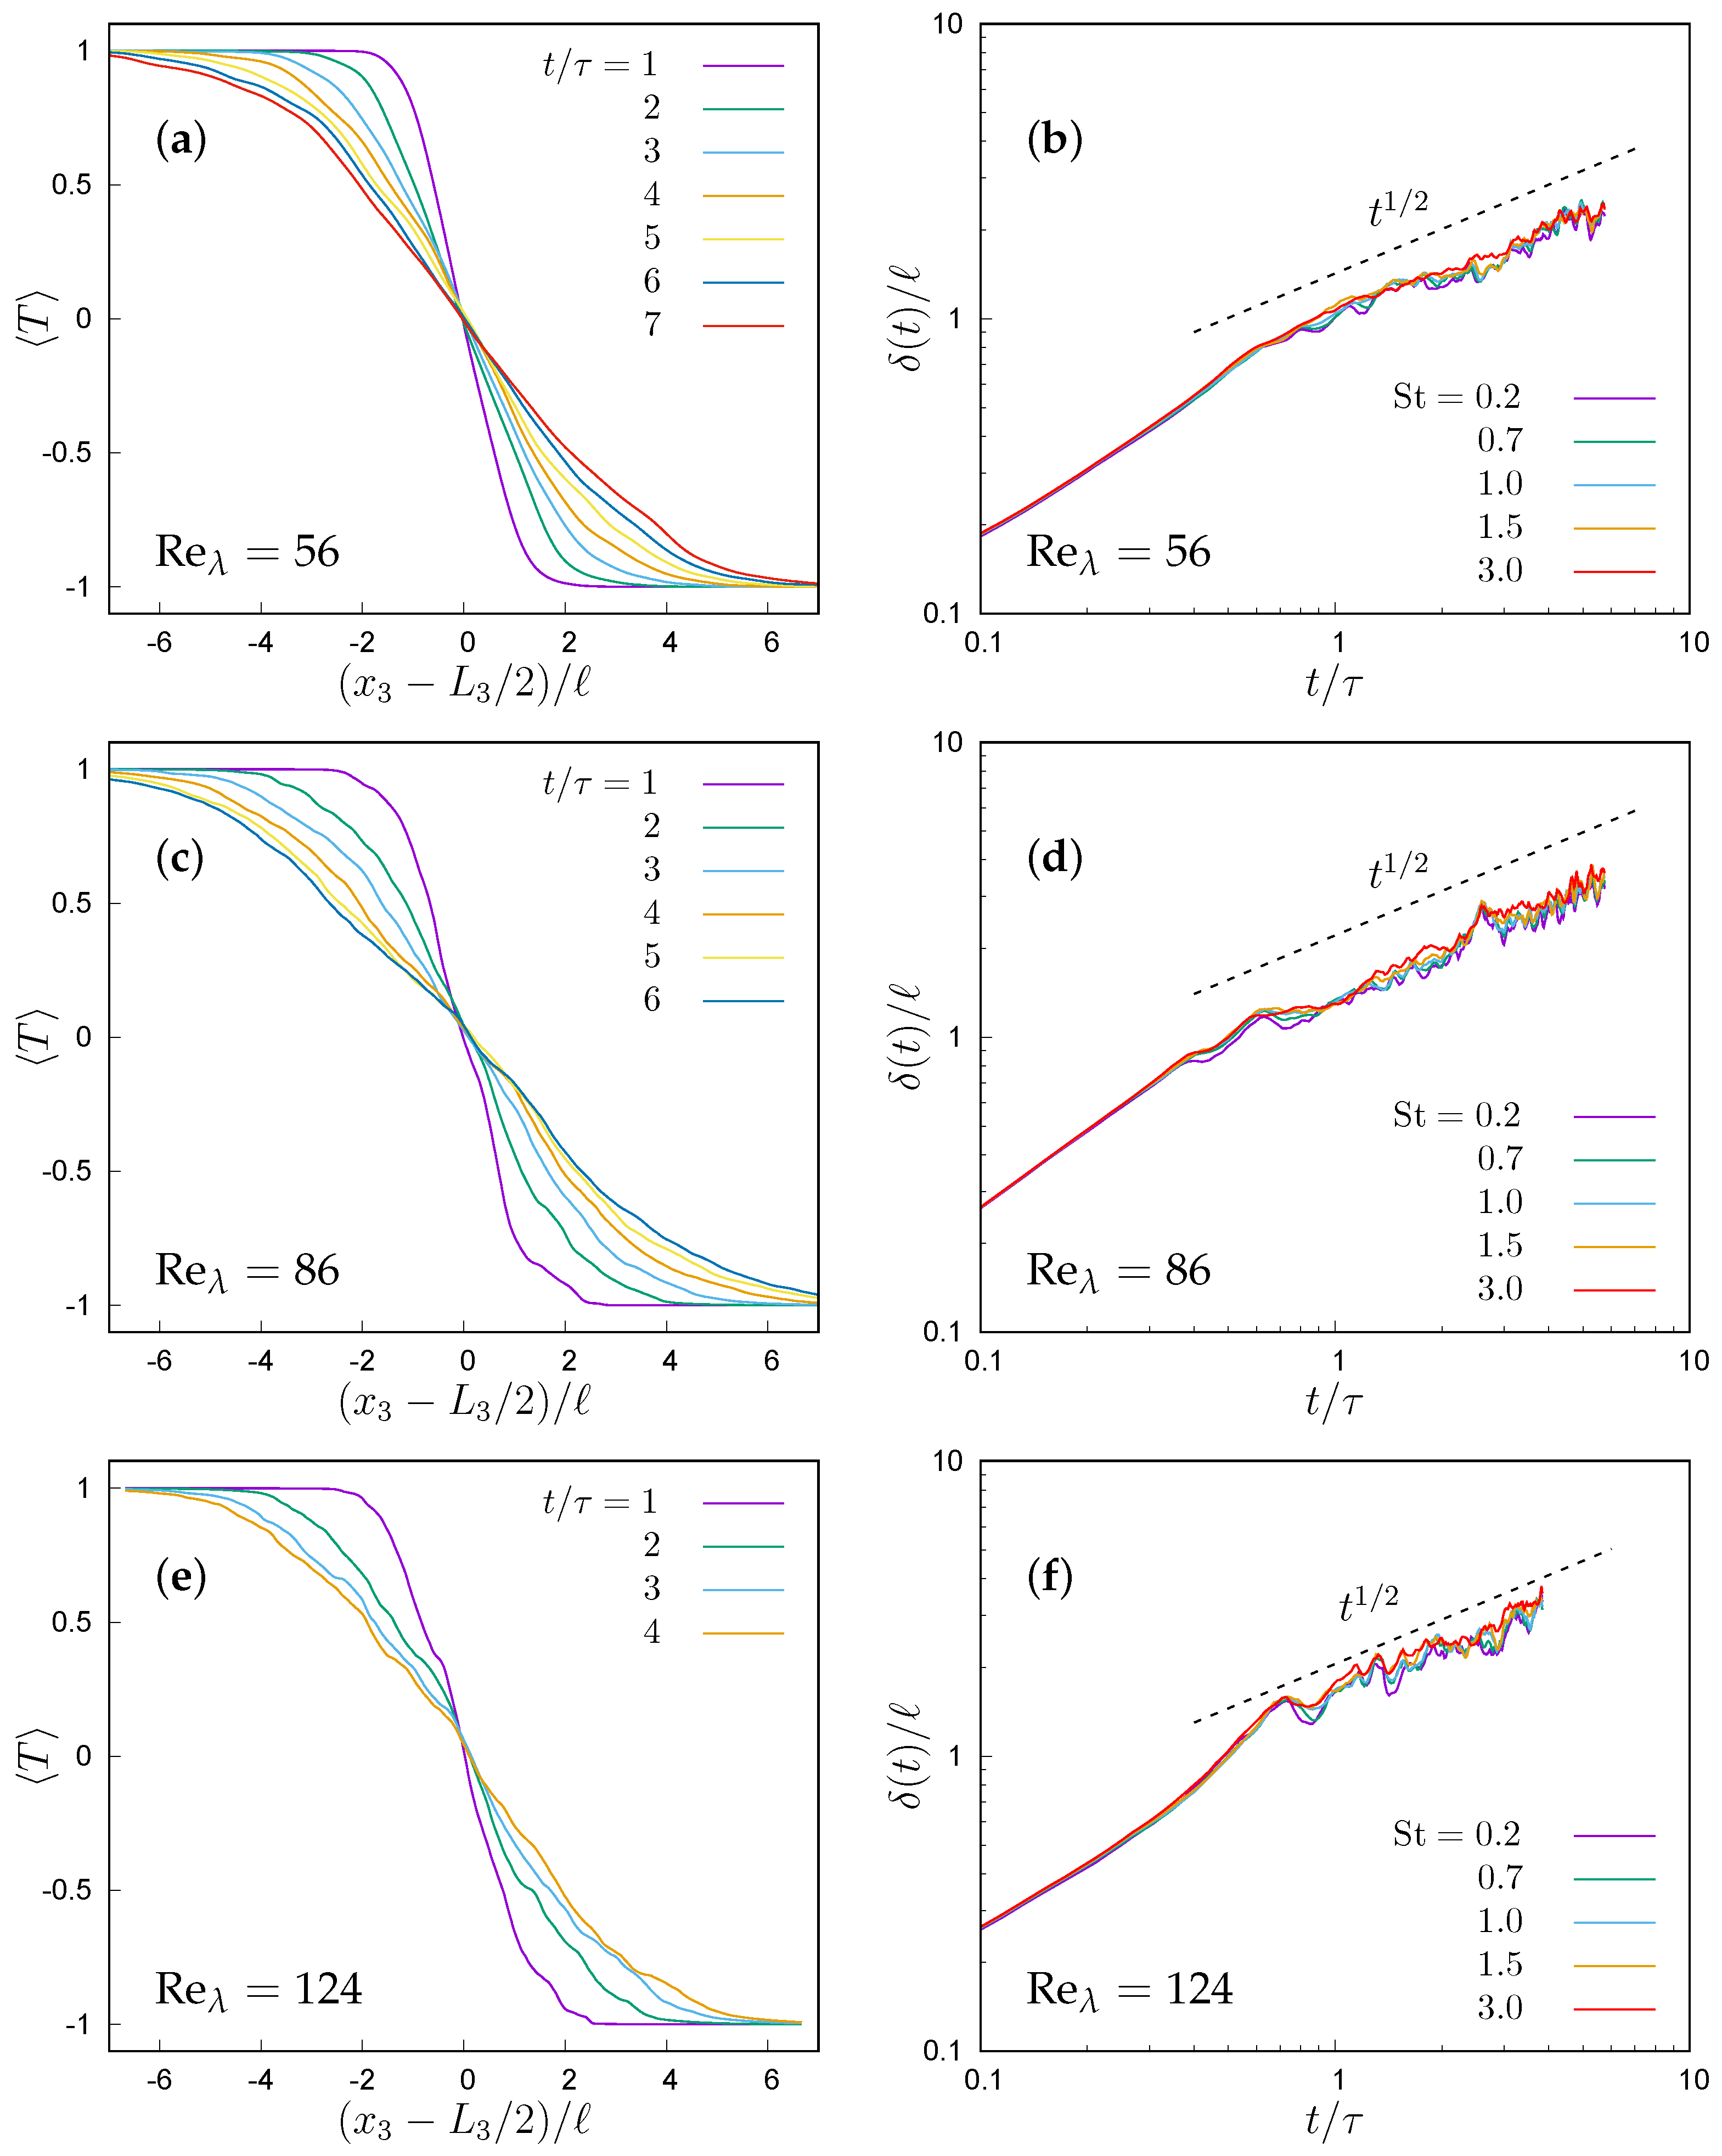
As shown in Figure 7, also in the two-way coupling regime the temporal mixing layer thickness shows a growth, independent of the particle Stokes number. A higher particle inertia produces a slight increase of the thickness, up to about 10% at , a sign that more massive particles are able to transport heat at longer distances, thus reducing the mean temperature gradient of the carrier flow through their feedback. Even if the ability of thermal feedback to reduce the fluid temperature variance has been observed in homogeneous turbulence [13,14]; those results cannot be directly applied in present flow configuration, because the presence of a large initial temperature inhomogeneity makes particles produce temperature fluctuations with their feedback when they cross the initial interface. Moreover, ref. [14] considers particle with a thermal inertia but with no inertia, so that they move like passive tracers, whereas the ability of inertial particle to cross temperature fronts has a relevant influence on small-scale statistics [13], and should have an even larger impact in this flow wherein the initial temperature difference between the two homogeneous regions drives the thermal exchange. Indeed, the effect of particle inertia is mainly seen in the second-order moments. Moreover, second-order moments evolve self-similarly when the growth is reached.
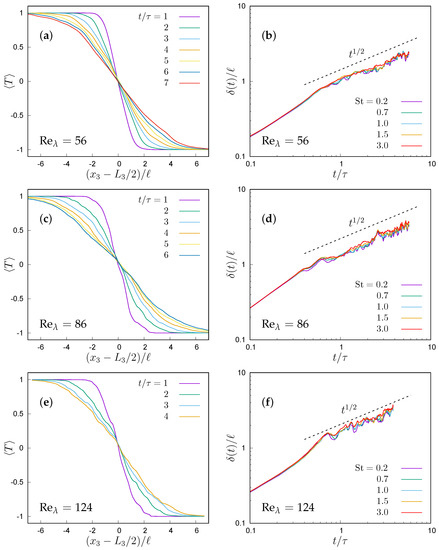
Figure 7.
Two-way coupling with : (a,c,e) time evolution of the dimensionless mean fluid temperature at and different ; (b,d,f) growth of the mixing layer thickness at different Stokes numbers and Taylor microscale Reynolds numbers.
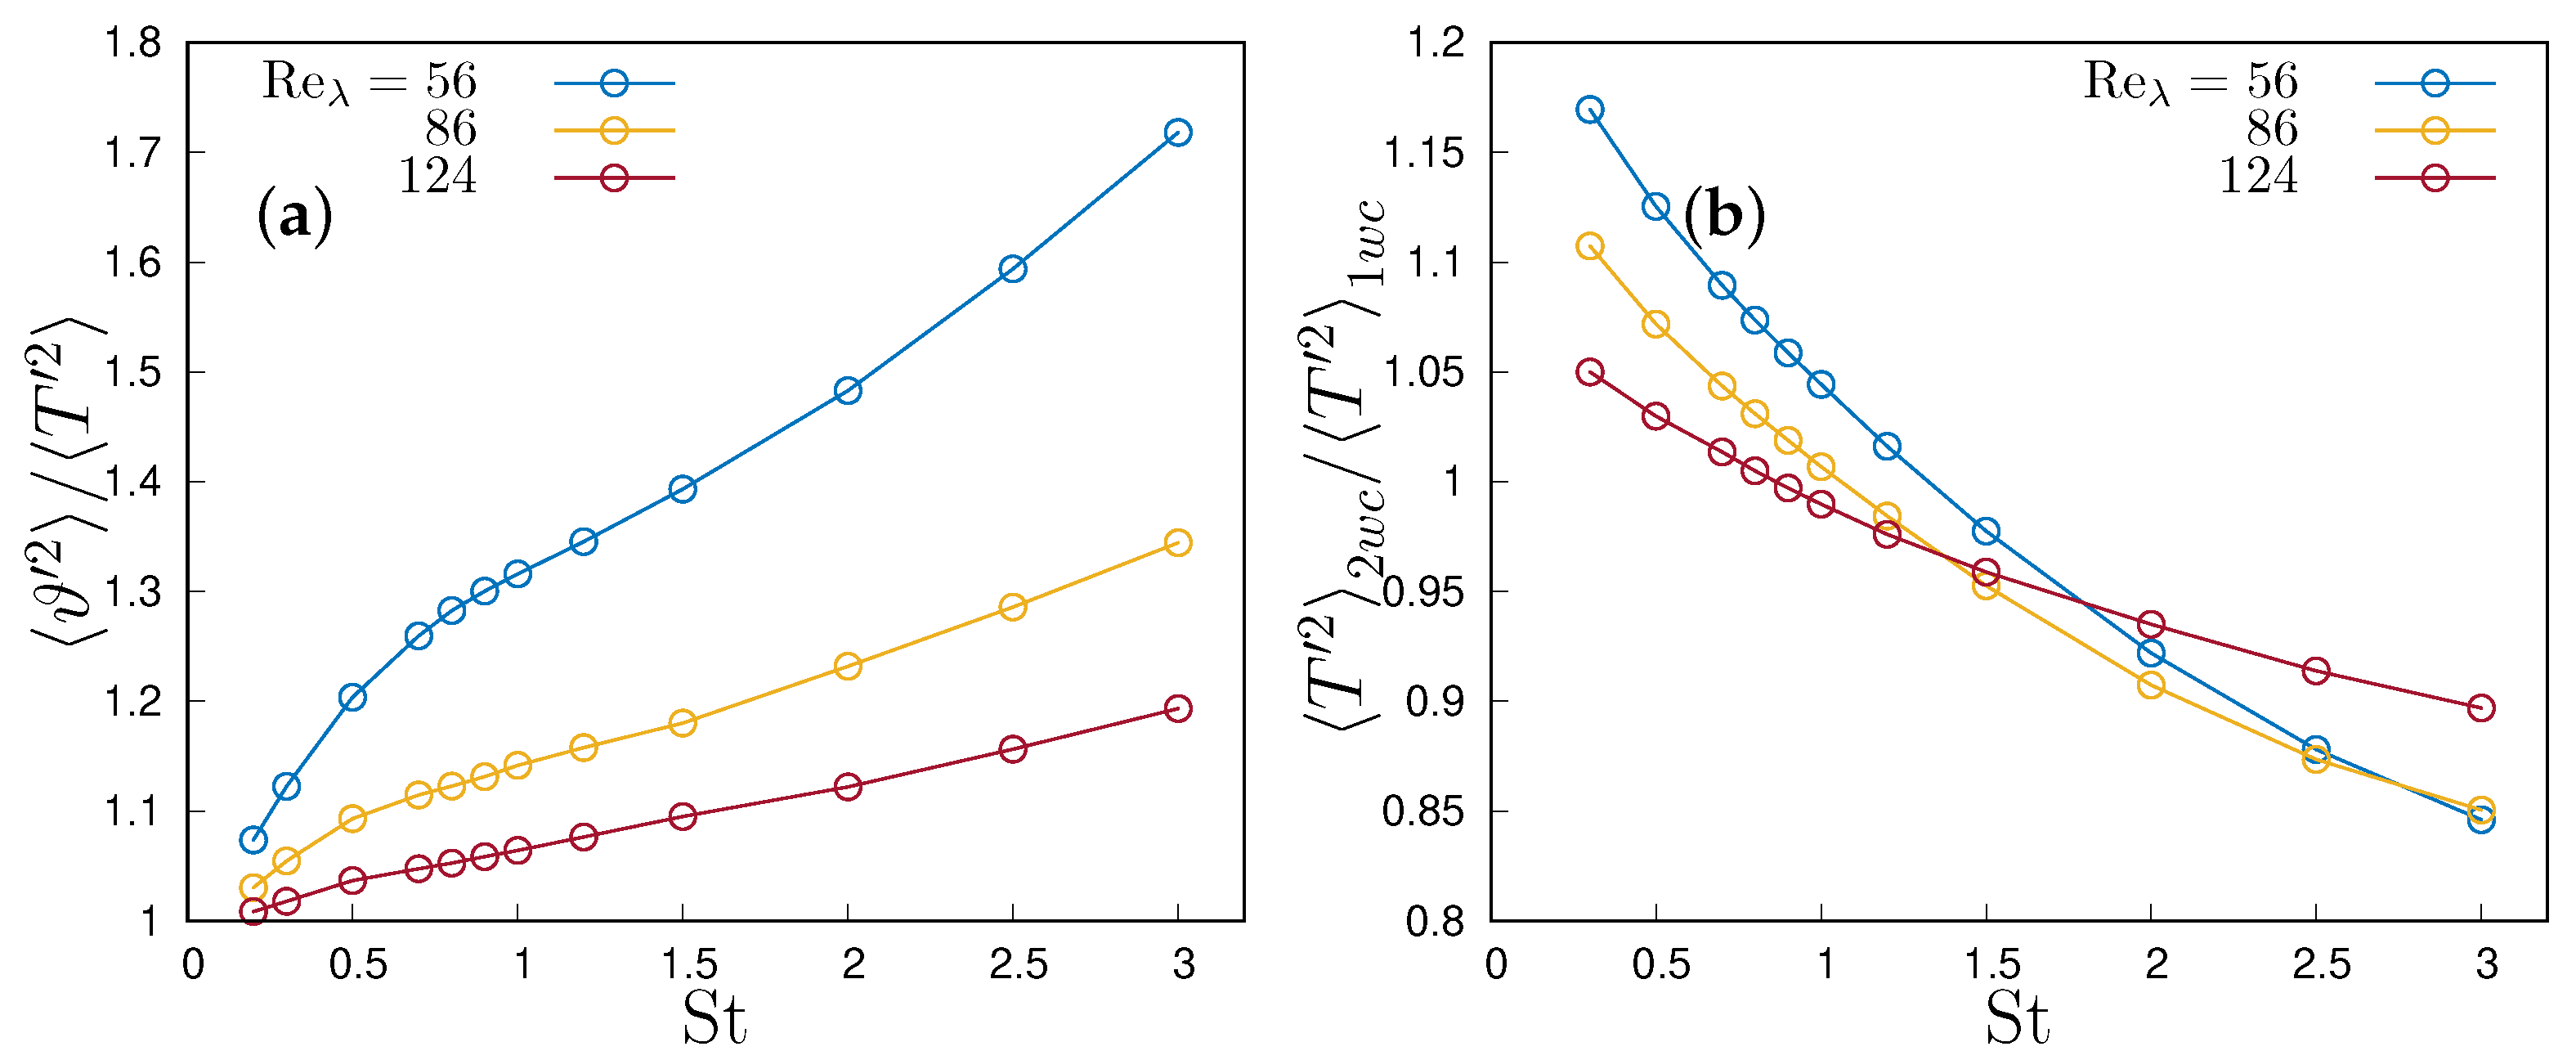
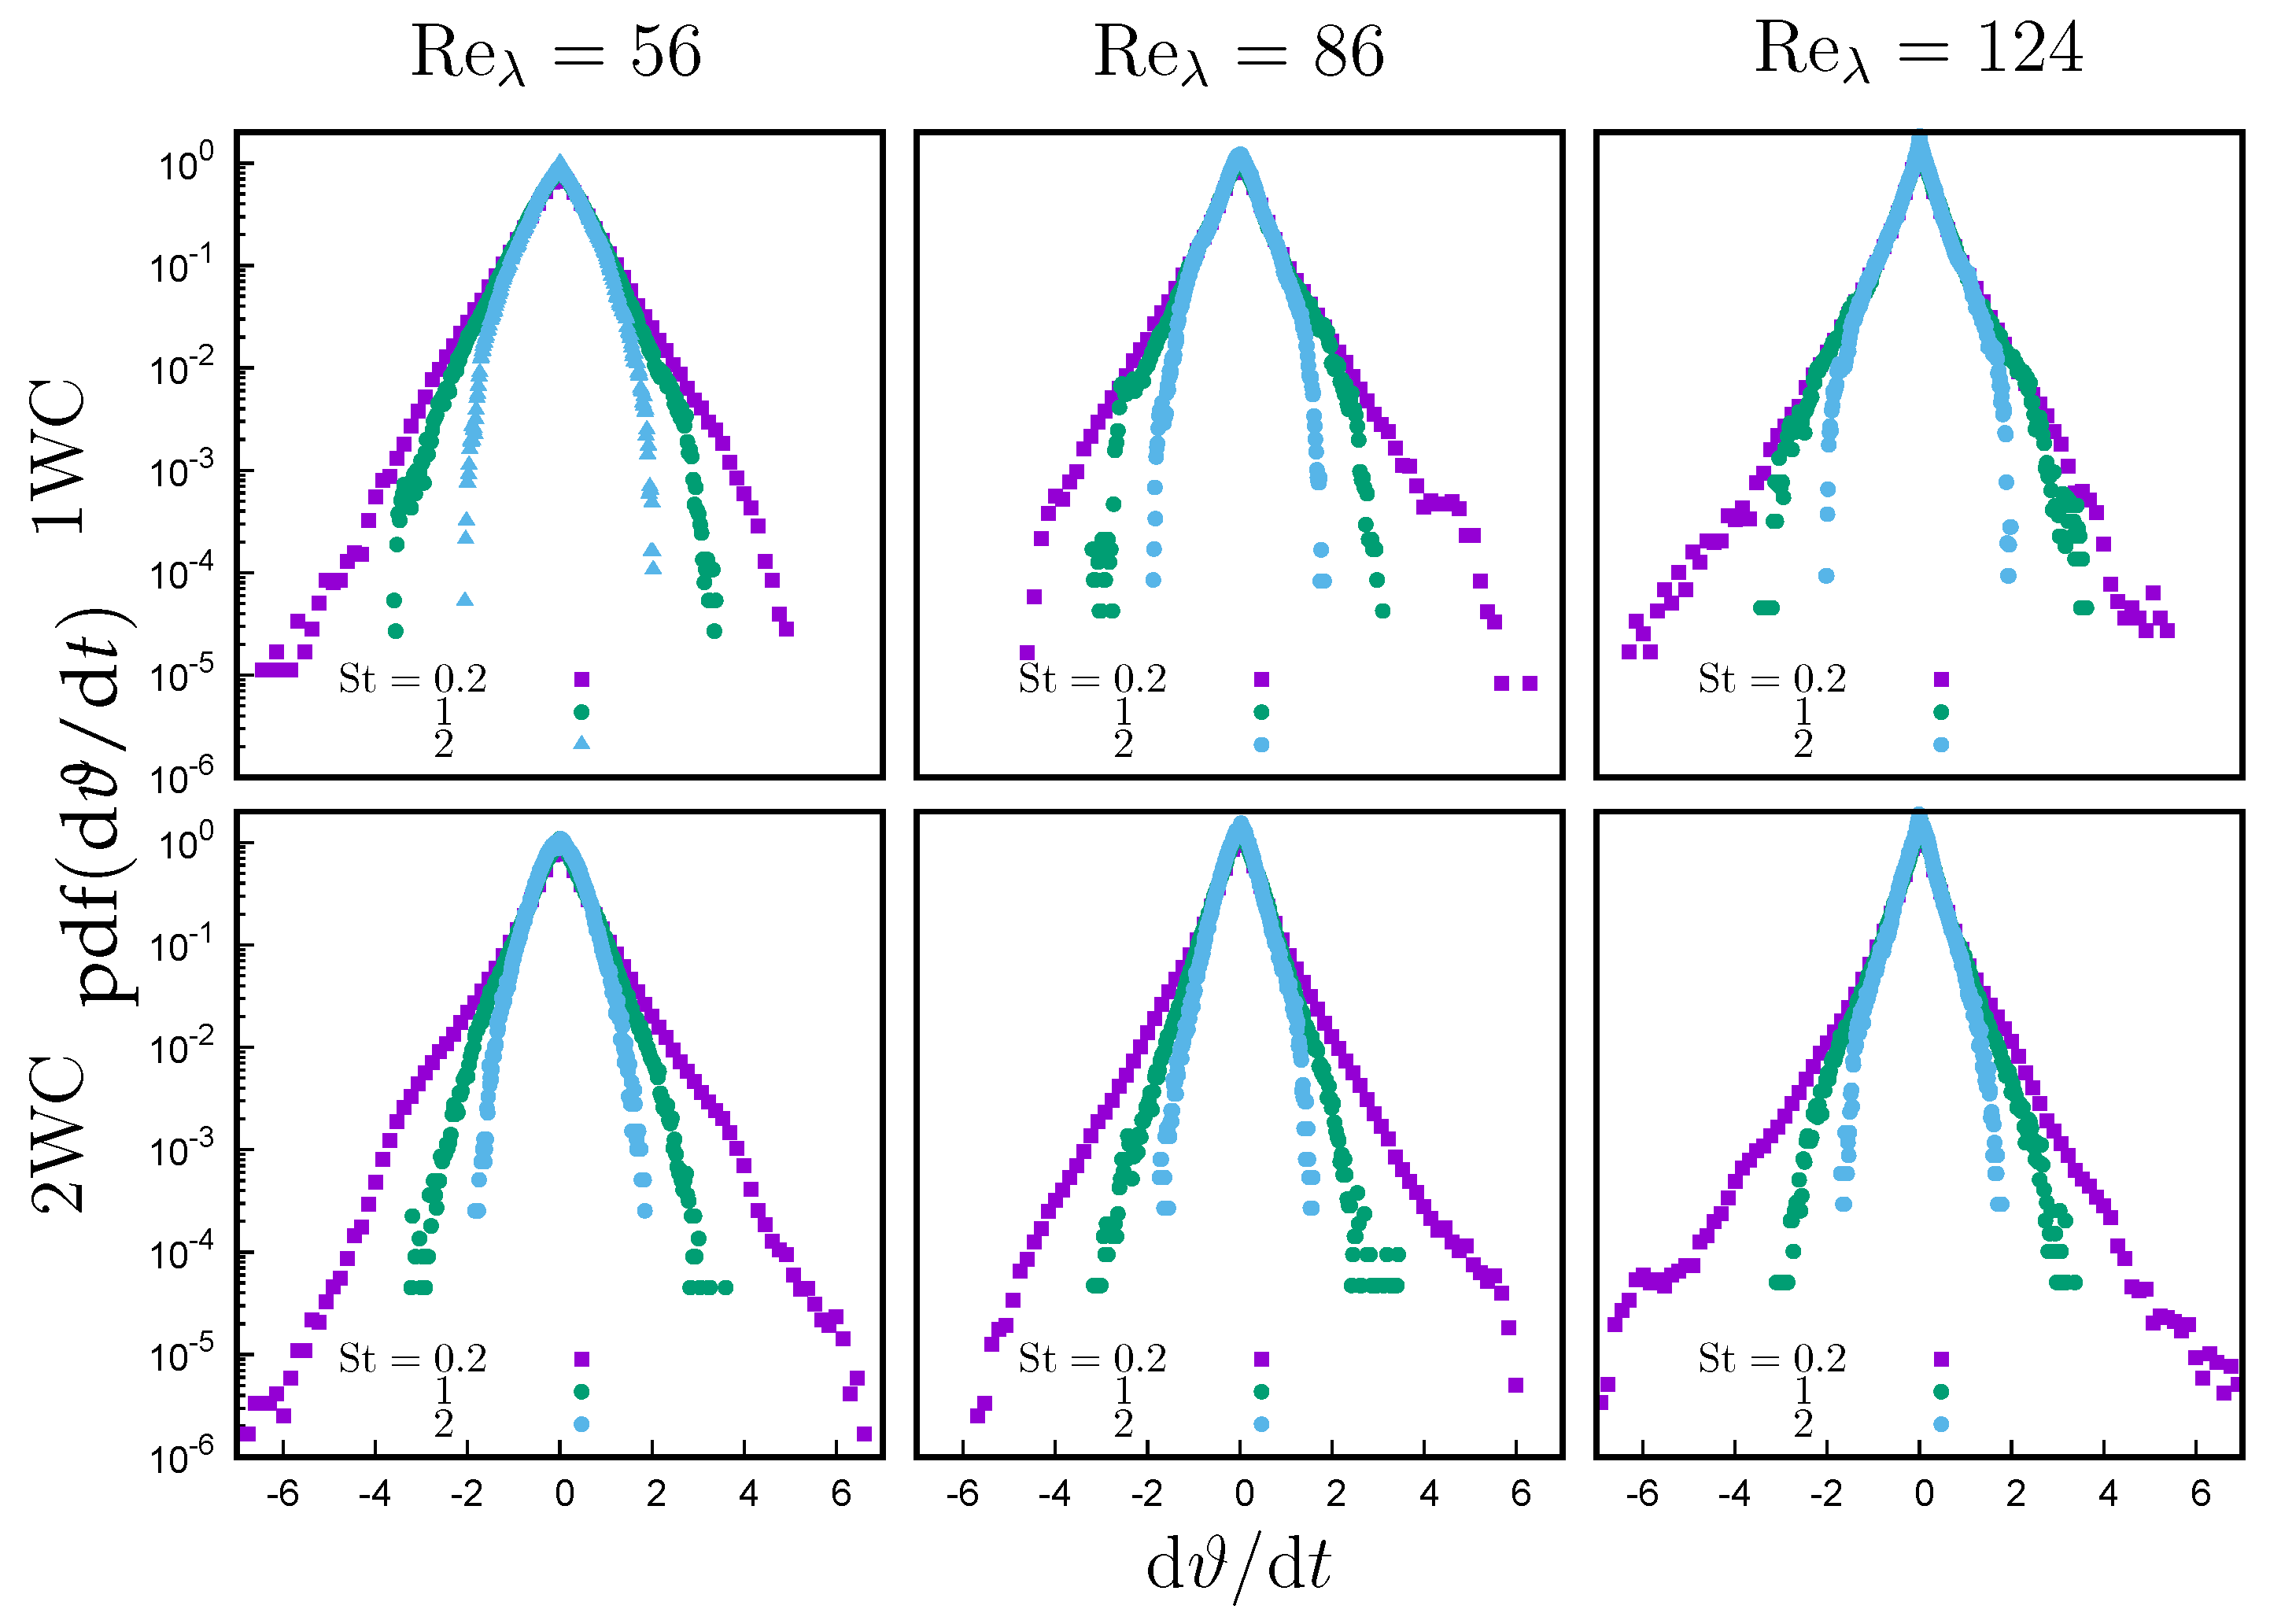
Figure 8b shows the modulation of the maximum fluid temperature variance, i.e., the one in the centre of the mixing layer, as a function of the Stokes number, showing how it reduces for increasing inertia. Particle temperature variance increases with particle inertia, because the longer thermal relaxation time allows them to move through the large temperature region keeping their original temperature. Moreover, this effect is enhanced by thermal feedback which tends to reduce the temperature difference between the particle and the surrounding fluid. This becomes even more evident by comparing particle temperature variance with fluid temperature variance (Figure 8a), or by looking at the probability density function of the rate of change of particle temperature, . Figure 9 shows the probability density function in the central part of the domain at the same dimensionless time for different Stokes numbers and . As observed in [13], the main effect of the thermal feedback is to reduce the tails of the probability density function, due to the modulation of the carrier flow temperature, which reduces the fluid–particle temperature difference and makes very quick variations of the particle temperature less likely to be present. The shape of this probability density function depends on the particle inertia. When the Stokes number increases, the probability density function becomes narrower. This can be explained by observing that, as the Stokes number increases, particles are slower to respond to changes in the temperature field, producing an effect which is analogous to the observed filtering of velocity due to their inertia. This implies that extreme derivatives of the temperature are unlikely to be present at higher inertia, even if the particle temperature can differ strongly from the local temperature of the carrier flow. Therefore, intermittency of particle temperature, as measured by the kurtosis, reduces with the Stokes number and with two-way coupling.
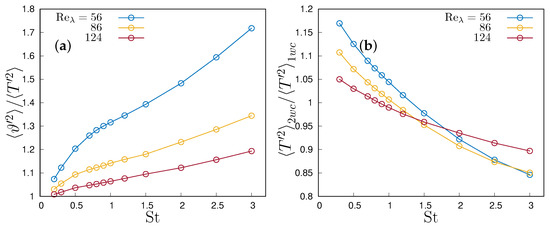
Figure 8.
(a) Particle temperature variance to fluid temperature variance ratio in two-way coupling simulations. (b) Two-way coupling fluid temperature variance to one-way coupling fluid temperature variance ratio in terms of the Stokes number for different Taylor microscale Reynolds numbers .
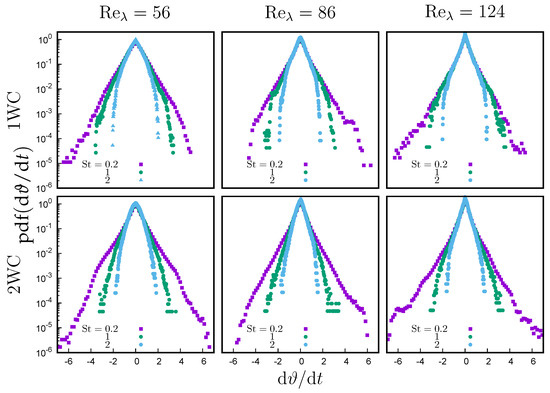
Figure 9.
Probability density function of the particle temperature derivative at in one-way and two-way coupling simulations for different Taylor microscale Reynolds numbers () and three different Stokes numbers.
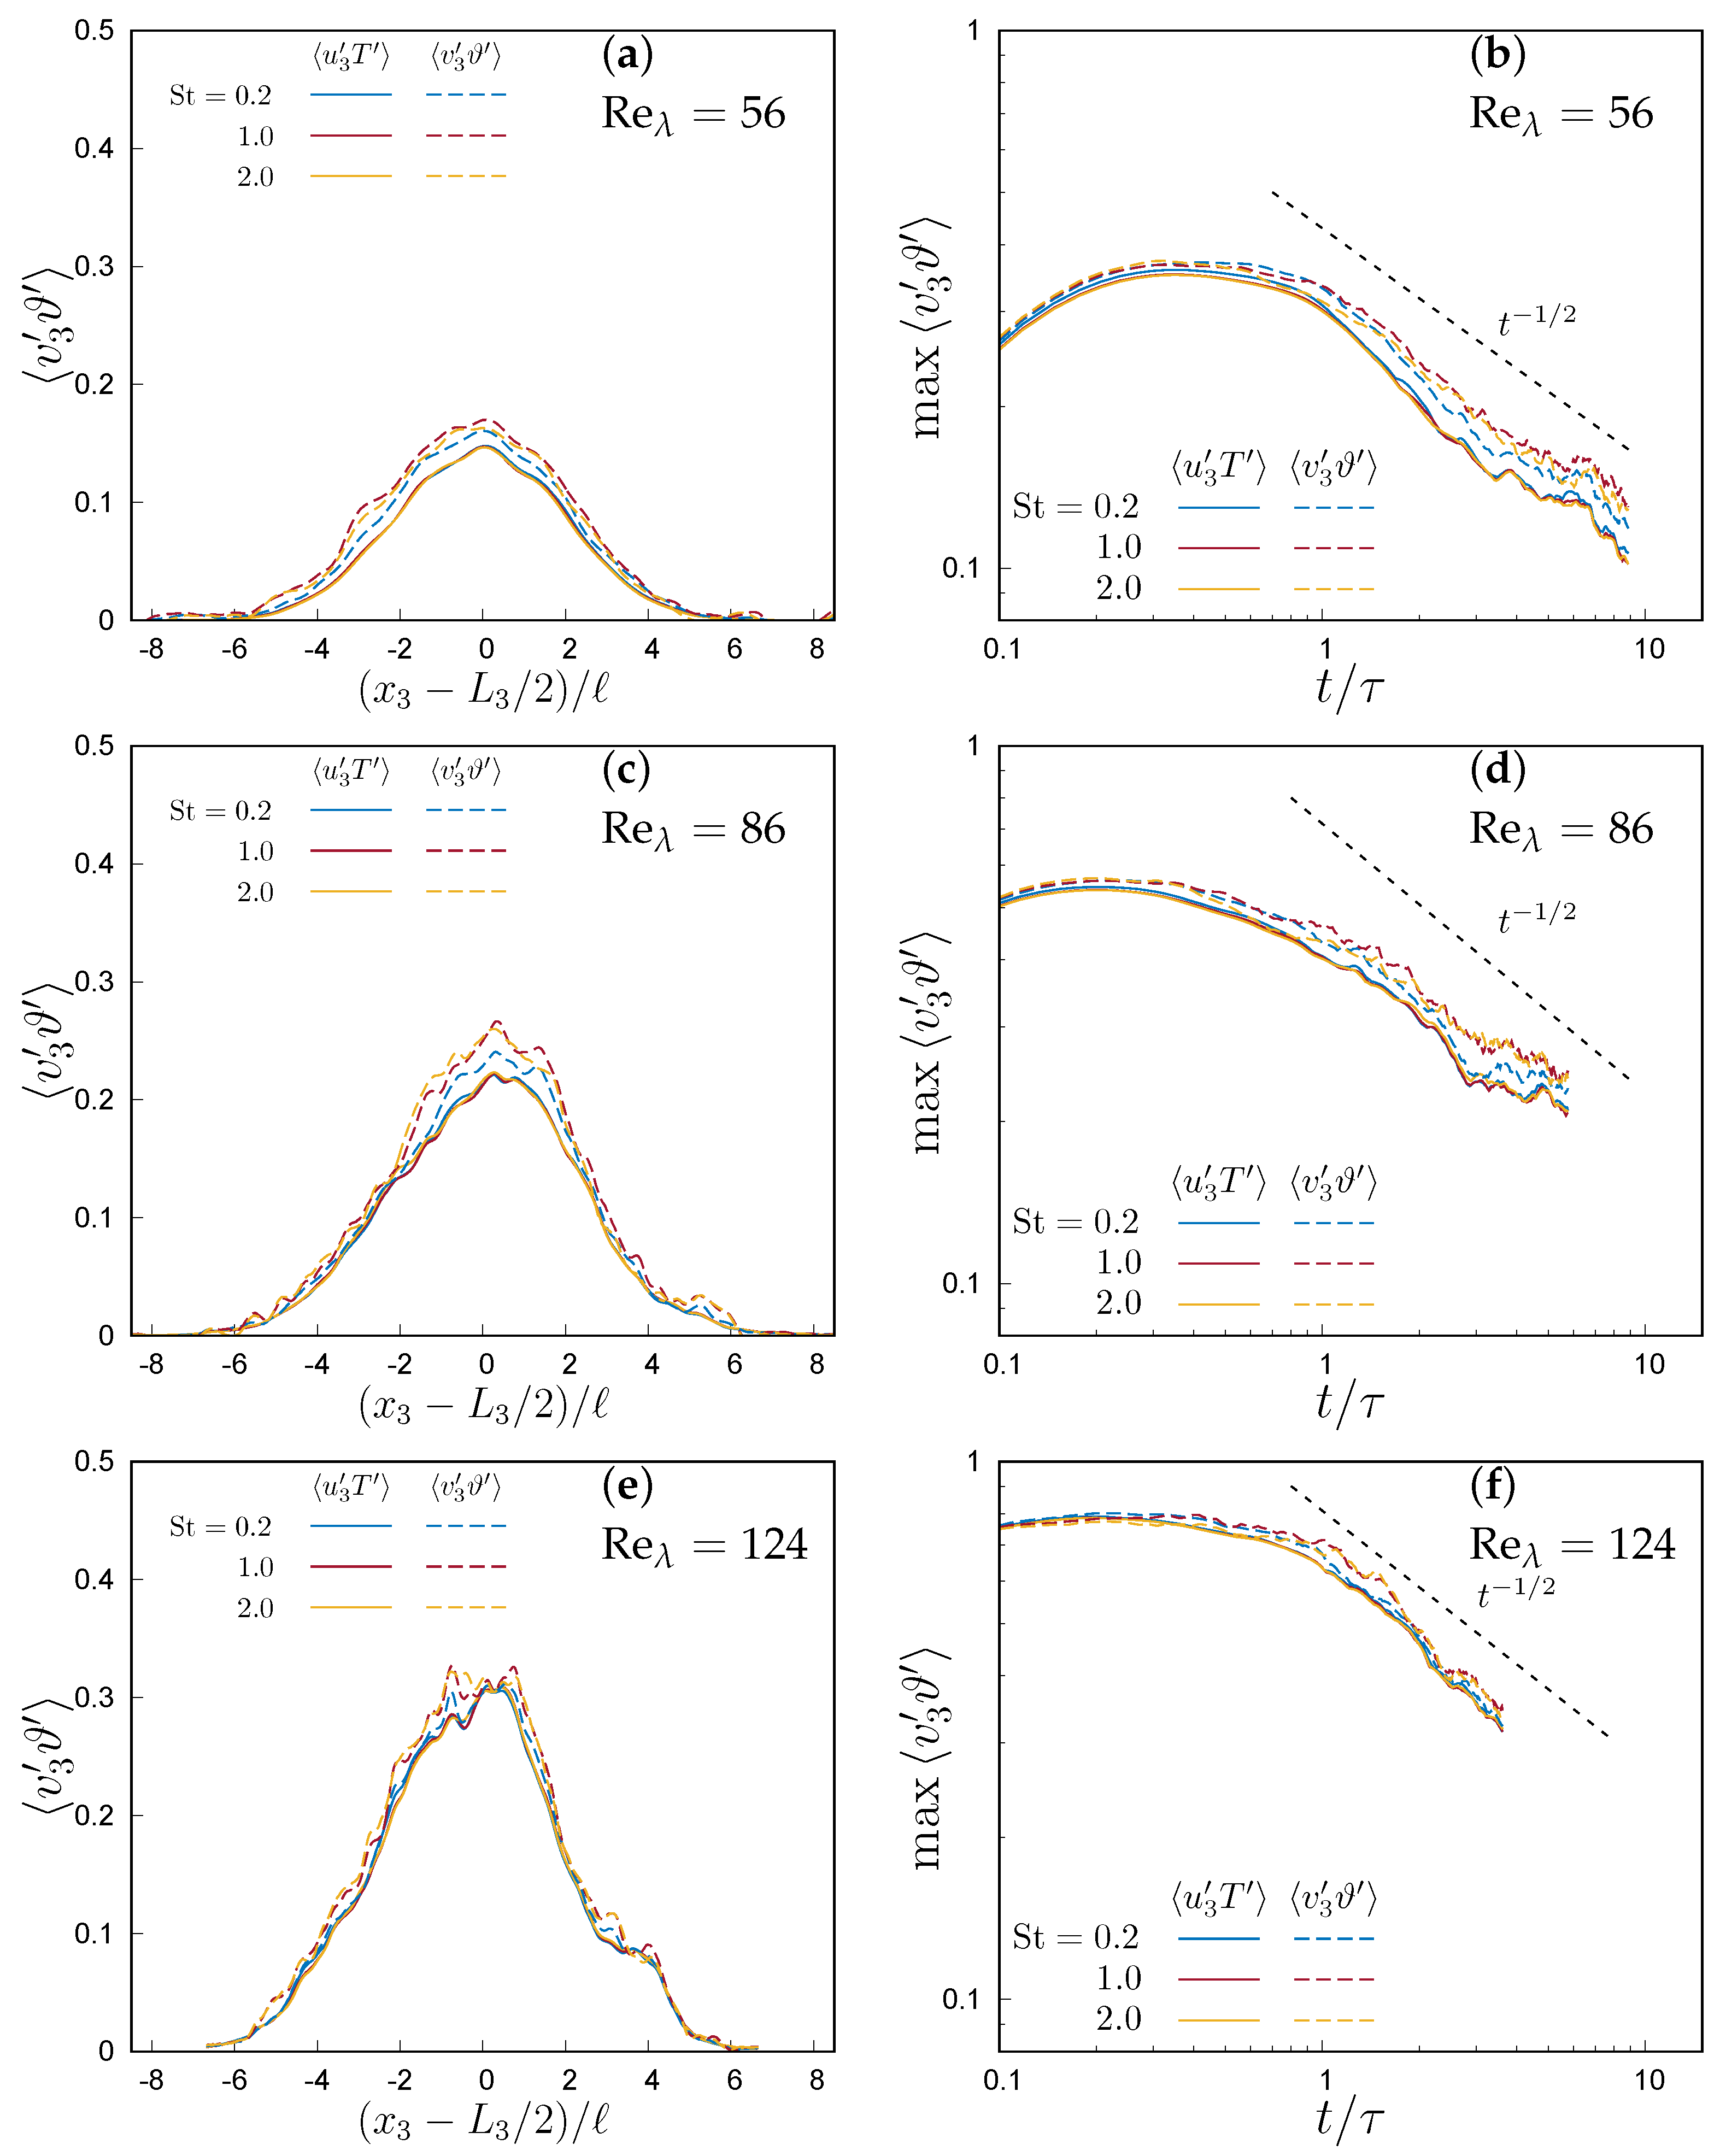
Therefore, it is natural to expect that, in this situation, particles can contribute more, with respect to fluid, to heat flux than in the one-way coupling regime. Figure 10 shows how also the velocity–temperature correlation of both fluid and particle evolves self-similarly. Figure 11 compares the field and particle velocity–temperature correlation (left panels) and shows their decay (right panels). One can note that the particle temperature–velocity correlation is always higher than fluid temperature–velocity correlation, producing a higher net flux per unit specific heat capacity, with a maximum for a Stokes number near unity. The overall effect can be quantified through a corresponding variation of the Nusselt number, which can still be expressed as in (16) as
where and are the particle and convective contributions to the heat transfer, defined in (21) and (22). However, in the two-way coupling regime, the temperature of the carrier flow is not only the outcome of the carrier flow conditions, but is also modified by particles. Thus, depends also on Stokes/thermal Stokes numbers and on the thermal heat capacity ratio, whereas in the same time particle, thermal feedback creates a particle–particle indirect interaction mediated by the carrier flow and cannot be factored out in . Therefore, there is a nonlinear dependence on and a single simulation cannot allow us to extrapolate the behaviour at all heat capacity ratios. This implies that both and are functions of all the dimensionless governing parameters, i.e., and .
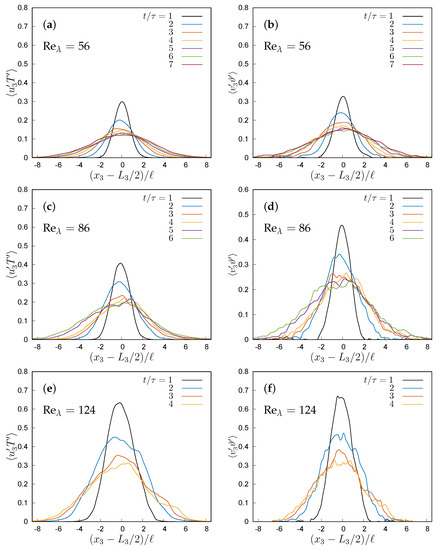
Figure 10.
Two-way coupling with : (a,c,e) time evolution of the fluid velocity and temperature correlation; (b,d,f) time evolution of the particle velocity and temperature correlation and different .
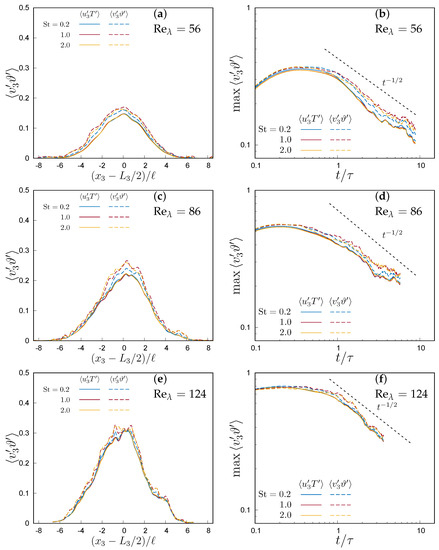
Figure 11.
Two-way coupling. (a,c,e) Spatial distribution of fluid and particle velocity-temperature correlations at ; (b,d,f) maximum correlation at different Stokes numbers and different Taylor microscale Reynolds numbers.
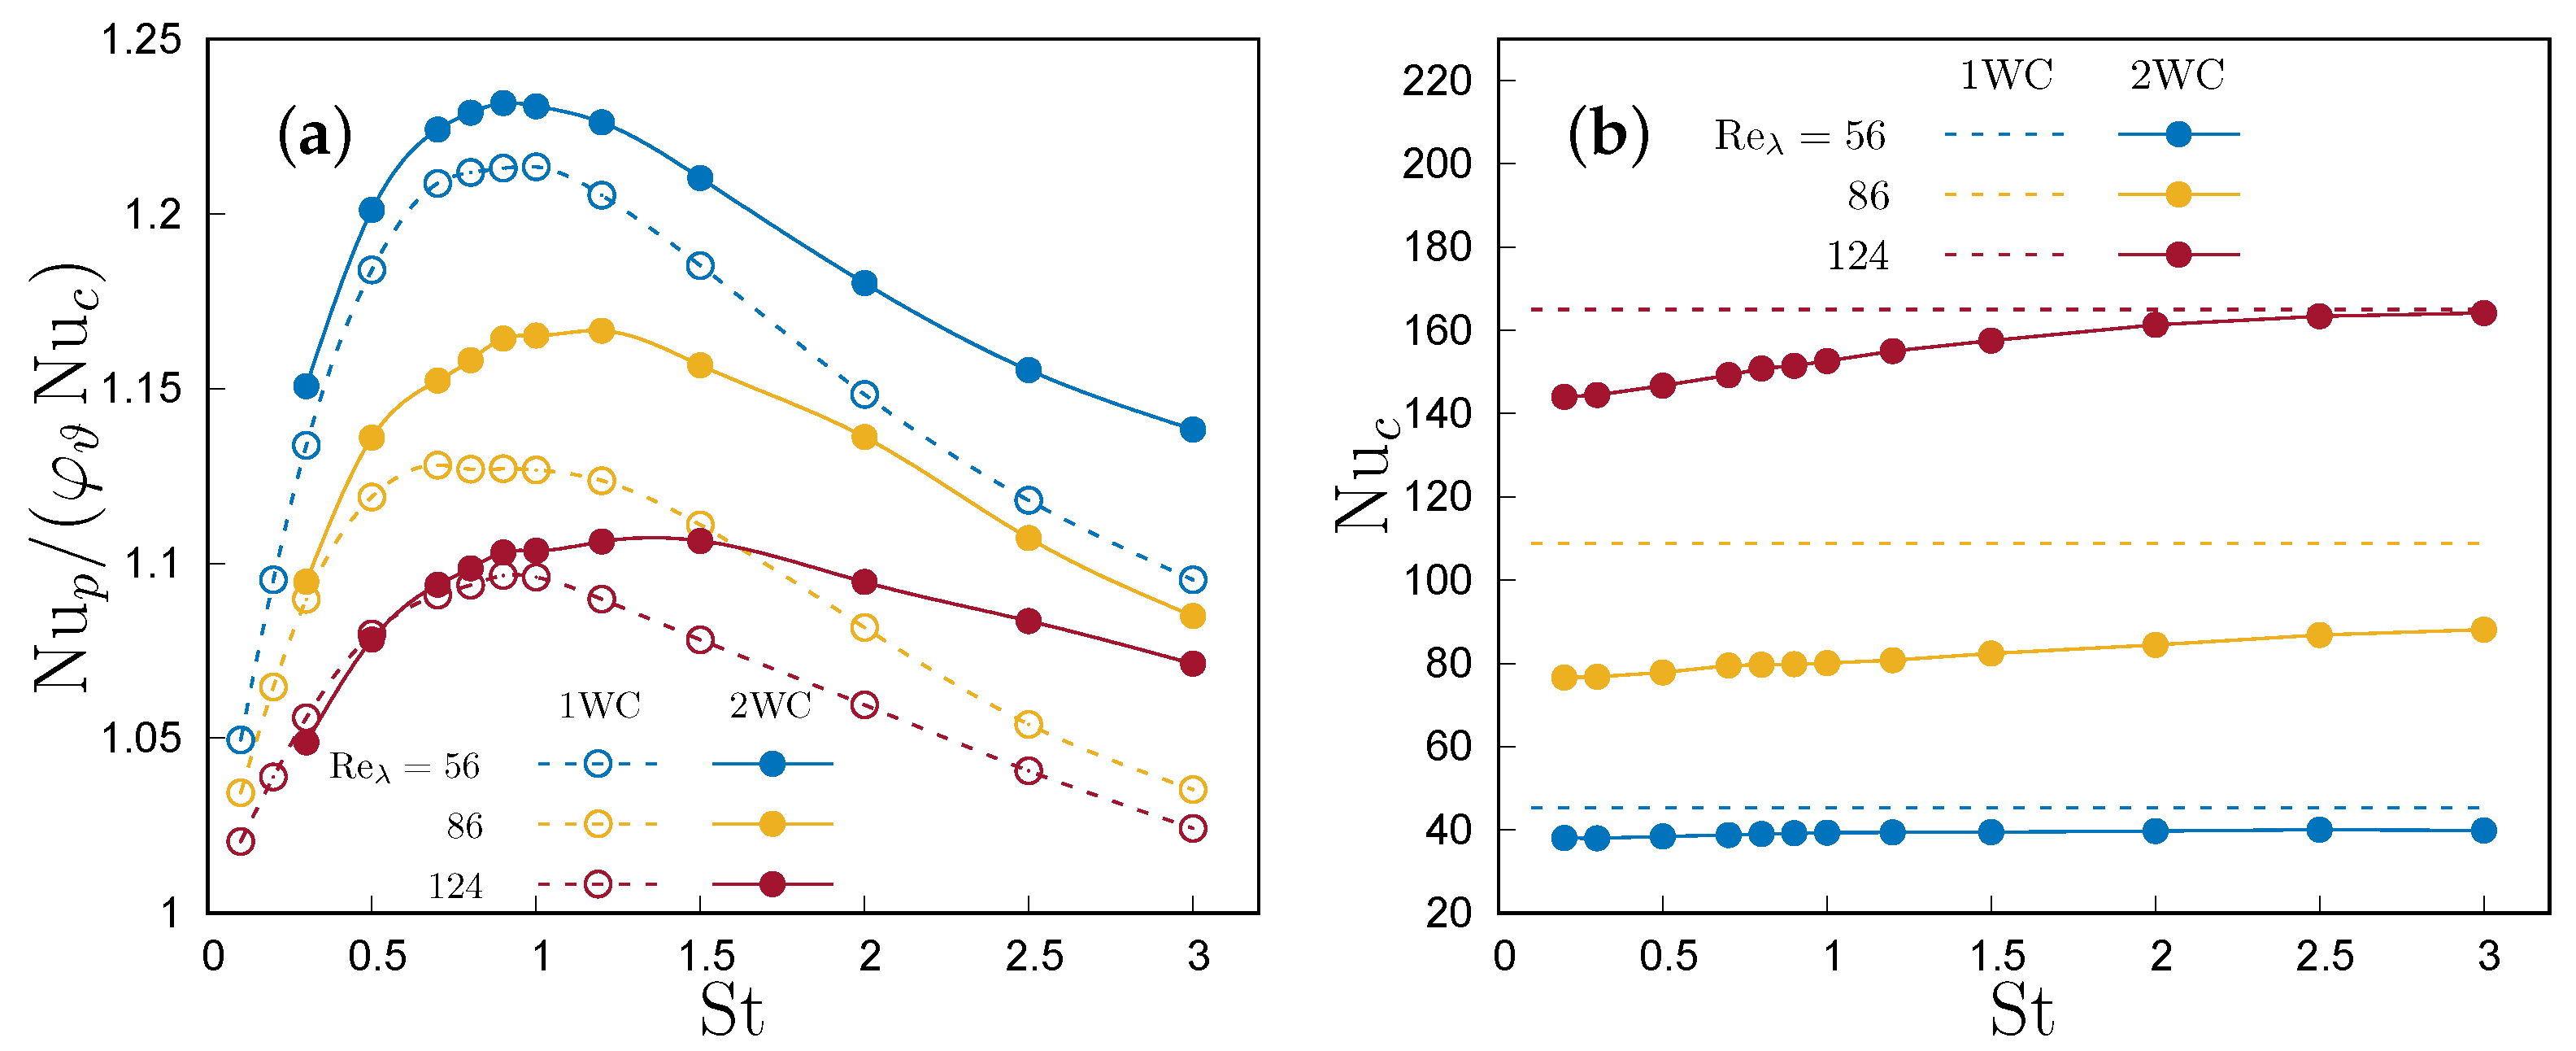
Figure 12 compares the particle and convective Nusselt numbers with the corresponding one-way coupling simulations with the same parameters. The overall qualitative behaviour is similar, with a maximum of at , but the ratio is always larger than in the one-way coupling, in particular its tend to diverge when . It can also be observed that the ratio between the particles’ heat transfer and the convective heat transfer shows a similar trend with respect to as in the one-way coupling.
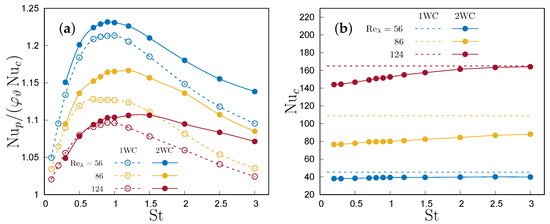
Figure 12.
(a) Particle contribution to the Nusselt number as a function of the Stokes number at different Taylor microscale Reynolds numbers. (b) Convective Nusselt number as a function of the Stokes number. In both panels, continuous lines indicate two-way coupling, and dashed lines indicate one-way coupling.
The convective Nusselt number increases when the Stokes number increases, and tends to the the value of a flow unseeded by particles (or not affected by the presence of particles as in the one-way coupling) for . The fluid temperature is modulated by the heat exchange with particle, and the thermal relaxation time of the fluid can be inferred from Equation (3) as
This gives the order of magnitude of the time needed by particle feedback to change fluid temperature. By replacing the definition of , Equation (6), this timescales coincides with the one deduced by Pouransari and Mani [12], except for a numerical factor . Because the temperature mixing is driven by the large scales of the flow, the timescale of the evolution of the mixing is the eddy turnover time . Thus, given that in homogeneous and isotropic turbulence [34], the ratio of these two timescales is given by
(which, apart from an irrelevant numerical constant, corresponds to the heat-mixing parameter introduced in [12] and to inverse of the Damköhler number used in [14]). This implies that, for , the modulation of fluid temperature by particles occurs on a timescale much longer that the the timescale on which the mixing layer evolves, so that the effect of the presence of particles on fluid temperature statistics becomes less relevant on the overall heat transfer. The dependence of makes this effect more important at lower Reynolds numbers than at higher Reynolds numbers.
4. Implications for Turbulence Modelling
The findings of experiments and direct numerical simulations of simple flow configuration where all parameters can be independently varied are useful also as a benchmark to validate and improve existing Reynolds averaged Navier–Stokes (RANS) or large-eddy simulation (LES) turbulence models which include heat transfer. In the present flow configuration, it is immediate to deduce the model consistency and model coefficients of a RANS model, as it requires one to only know up to second-order single-point statistics, and some basic conclusions can be drawn from the results of Section 3. As an example, we can use a eddy diffusivity model, even if it tends to perform quite poorly in unconfined flows. In such an approach, the heat transport due to turbulent fluctuations is modelled as through the introduction of a thermal eddy diffusivity , where is the eddy kinematic viscosity (the kinetic energy is normally called k in these models), a model coefficient, and a so-called turbulent Prandtl number, which is another model coefficient. In present flow, because the velocity field is statistically steady and homogeneous, is constant both in space and time, and also, as a consequence, as a constant turbulent Prandtl number is assumed.
This leads to a growth of the temperature mixing layer thickness and a reduction of the heat flux, which is consistent with the results of present simulations. More specifically, in such a case , when the same definition of introduced in (15) is used, whereas , so that it is possible to infer the value of , and therefore the model coefficient , from simulations. From the data in Figure 6d and Figure 12b, we can conclude that is between 0.13 and 0.21, depending on the Reynolds number. This is up to 0.5 times higher than the expected value by using the most common coefficients, and . The discrepancy can be due to the moderate Reynolds number of the simulation but can also indicate a limitation of the model when there is no mean shear.
When particles are represented as a continuum phase in an Eulerian–Eulerian two-phase modelling approach (see, e.g., [35,36,37]), they are described by a particle number density, a particle mean velocity and a particle mean temperature fields, which are a function of space and time. By carrying out a Reynolds average of these equations, one needs to model the turbulent heat fluxes as well. According to the simulations presented in Section 3, we can conclude that it is possible to write, in our flow configuration,
where . The values of F can be extrapolated from the data of Figure 6 and Figure 12, a fitting of all the curves shown can produce analytic expressions to be used in a model. By introducing an eddy diffusivity model for the fluid heat flux, one would obtain an eddy diffusivity model for as well. Note that this modelling hypothesis would produce a constant particle eddy thermal diffusivity in the simulated flow, which is consistent with the self-similarity of the flow statistics. Moreover, in the present flow configuration, where a mean shear is absent, such a model would correspond to the leading terms of the model proposed by [36]. Notice also that, at least within the model, all parameters needed to determine F are known, because a local estimate of the the Taylor microscale and the Kolmogorov scale can be obtained from the turbulent kinetic energy and dissipation, and the volume fraction can be deduced from the particle number density, whereas the remaining data are just the physical properties of the particles, i.e., particle size and particle to fluid density and specific heat ratios. Such an analysis can be carried out in detail for any model.
In the case of LES subgrid models, the heat transport coefficients cannot be immediately deduced from the average quantities but their determination requires us to perform LES simulations, even if a priori tests on the consistency of the models can be carried out from the full flow and particle data, as in [38].
5. Conclusions
Heat transfer enhancement of dispersed inertial solid particles in a mixing layer between two forced homogeneous isotropic turbulent regions has been numerically investigated by means of point–particle Euler–Lagrange direct numerical simulation. In this way, we can extend existing works, where the only inhomogeneous flows which have been analysed in detail are channel or duct flows. A wide range of Stokes and thermal Stokes numbers, which cover the most likely physical properties of suspensions of particles in air, have been simulated at low to moderate Reynolds numbers in both one- and two-way coupling in absence of collisions. Our results show that the spreading of the initial temperature difference due to turbulent motions occurs through a self-similar evolution for both fluid and particle single-point statistics in all cases. The thickness of the thermally inhomogeneous zone where the heat transfer takes place shows a diffusive growth, whereas the temperature variance and temperature–velocity correlations of both particle and fluid phases reduce as . We have quantified the heat transfer through the Nusselt number, which remains constant in the self-similar evolution. The main result is the determination of the particle contribution to the overall heat transfer in both one- and two-way coupling regimes, leading to the quantification of the particle Nusselt number as function of the relevant dimensionless governing parameters, i.e., the Reynolds number and the Stokes and thermal Stokes numbers. We have found that the particle heat transfer at a fixed Reynolds number and thermal Stokes-to-Stokes number ratio is maximum at a Stokes number of the order one, which increases when the Stokes number ratio increases and tends to one for . The relative contribution of particles to the overall heat transfer reduces for increasing Reynolds numbers. In the two-way coupling regime, the modulation of fluid temperature by particles leads to a reduction of the convective heat flux and a concomitant increase of the particle heat flux. Indeed, thermal feedback reduces the fluid-particle differences and therefore allows particle to bring their temperature over longer distances. This also generates a higher particle temperature variance, while fluid variance tends to be damped by the additional dissipation brought by the temperature variance introduced by the thermal feedback [13]. The presence of particles is felt more at lower Reynolds number and its overall effect reduces for increasing Re, even if particles can still can provide a significant increase in heat flux compared to an unseeded flow. Of course, in any practical situation with high volume fractions, this increase in heat transfer leads to an increase in the effective viscosity of the suspension, which can be an unwanted effect in shear flows. We have also shown how our results provide useful quantitative information which enables us to build and benchmark turbulence models for particle-laden flows. Finally, it should be remarked that the data presented in Section 3.2 show that not all the phenomenology can be interpreted on the basis of a local homogeneity by invoking the known behaviour of particle–fluid thermal interaction in homogeneous and isotropic, statistically steady flows, because the timescale of fluid temperature modulation is of the same order of the time scale of the mixing development. Therefore, more attention should be paid on the dynamics of inhomogeneous flows, which would deserve further dedicated studies. In particular, to understand the role of thermal feedback in the two-way coupling regime, it could be useful not to fix the ratio but to treat St and as independent parameters.
Author Contributions
Conceptualization, H.R.Z.P. and M.I.; methodology, H.R.Z.P. and M.I.; software, H.R.Z.P. and M.I.; formal analysis, H.R.Z.P. and M.I.; investigation, H.R.Z.P. and M.I.; writing—original draft preparation, H.R.Z.P. and M.I.; writing—review and editing, H.R.Z.P. and M.I.; visualization, H.R.Z.P. and M.I.; supervision, M.I. All authors have read and agreed to the published version of the manuscript.
Funding
This research received no external funding.
Data Availability Statement
The data that support the findings of this study are available from the authors upon reasonable request.
Acknowledgments
The authors acknowledge the CINECA award IsC85_PATTI under the ISCRA initiative, for the availability of high performance computing resources and support.
Conflicts of Interest
The authors declare no conflict of interest.
Appendix A. Dimensionless Prolem Formulation
In this section we derive the dimensionless equations of the problem, Section 2, Equations (1)–(11). If we introduce a reference lenght scale L, a reference velocity scale U, from which the reference timescale is derived, as a temperature difference scale, and keep as density reference the carrier flow density , we can define the following dimensionless quantities (denoted by a tilde),
where is the mean temperature and is any reference pressure. Notice that and play no role in the problem. The continuity, momentum and energy balance equations for the carrier flow (1), (2) and (10) to be solved become
where is the Reynolds number, which represents the ratio between convection and diffusion of momentum, is the Prandtl number, ratio between momentum diffusivity and thermal diffusivity; is the dimensionless mean temperature gradient across the domain. The product is the Péclet number, ratio between the convective and diffusive heat transport. The dimensionless forcing in Equation (A2) is, from (12),
where is the dimensioneless mean energy dissipation rate, and is the dimensionless wavenumber. The particle feedback (7) becomes, in dimensionless variables,
which can be rewritten as
where is the dimensionless volume of the computational domain, , and is the particle-to-fluid heat capacity ratio, defined in (14). Analogously, the momentum and temperature equations for the particles, (4) and (11) become
where , , and are the dimensionelss position, velocity and modified temperature of the p-th particle, respectively. Here and are the dimensionless momentum and thermal relaxation times, which are related to the Stokes and thermal Stokes, numbers,
where is the dimensionless Kolmogorov microscale, determined by the Reynolds number once the forced wavelength has been fixed. The dimensionless fluid and particles temperatures and can be recovered from and as
Homogeneous and isotropic turbulence is defined by three parameters: the kinematic viscosity , the kinetic energy dissipation and the integral scale ℓ, from which all length, velocity and time scales can be deduced [34]. Therefore, the best choice of reference scales in the adimensionalization of the equation would be and . This choice would correspond to use the integral scale and a velocity proportional to the root mean square of velocity fluctuations as references. In this way the Reynolds number is equal to the integral scale Reynolds number. However, even if that choice would be physically sound, the integral scale is not known a priori but can be only estimated from the forced wavelength. Moreover, from a computational point of view, it is better to normalize the equations in order to have a fixed dimensionless domain with a size convenient for Fourier Transforms and spectral derivation, so that we choose , which, in our parallelepiped domain, makes the dimensionless domain to have sizes multiple of in each direction, i.e. if n is the aspect ratio , the dimensionless sizes of the computational box are and and the dimensionless volume is . Then, the velocity scale has been arbitrary chosen by fixing the dimensionless dissipation equal to 0.25.
Therefore, the problem is governed by five parameter: the Reynolds number Re, the Prandtl number Pr, the particle-to fluid heat capacity and the Stokes and thermal Stokes numbers St and . As the Reynolds number is based on an arbitrary length, all results are presented in terms of the Taylor microscale Reynolds number , based on the root mean square of velocity fluctuations as velocity scale and on the Taylor microscale , which represents the scale below which fluid viscosity begins to affect the dynamics of eddies in the flow, as lenght scale. Its value can be obtained a posteriori from the simulation, since .
The dimensionless formulation is the one used by the numerical code. Note that, for sake of simplicity, all tildes have been omitted in the figure labels.
References
- Elgobashi, S. Direct numerical simulation of turbulent flows laden with droplets or bubbles. Annu. Rev. Fluid Mech. 2019, 51, 217–244. [Google Scholar] [CrossRef]
- Brandt, L.; Coletti, F. Particle-Laden Turbulence: Progress and Perspectives. Annu. Rev. Fluid Mech. 2022, 54, 159–189. [Google Scholar] [CrossRef]
- Liu, H.; Feng, Y.; Zheng, X. Experimental investigation of the effects of particle near-wall motions on turbulence statistics in particle-laden flows. J. Fluid Mech. 2022, 943, A8. [Google Scholar] [CrossRef]
- Banko, A.J.; Villafañe, L.; Kim, J.H.; Eaton, J.K. Temperature statistics in a radiatively heated particle-laden turbulent square duct flow. Int. J. Heat Fluid Flow 2020, 84, 108618. [Google Scholar] [CrossRef]
- Jaberi, F. Temperature fluctuations in particle-laden homogeneous turbulent flows. Int. J. Heat Mass Transf. 1998, 41, 4081–4093. [Google Scholar] [CrossRef]
- Wang, Z.; Duan, G.; Koshizuka, S.; Yamaji, A. Chapter 18—Moving Particle Semi-implicit method. In Nuclear Power Plant Design and Analysis Codes; Wang, J., Li, X., Allison, C., Hohorst, J., Eds.; Woodhead Publishing Series in Energy; Woodhead Publishing: Cambridge, UK, 2021; pp. 439–461. [Google Scholar] [CrossRef]
- Zonta, F.; Marchioli, C.; Soldati, A. Direct numerical simulation of turbulent heat transfer modulation in micro-dispersed channel flow. Acta Mech. 2008, 195, 305–326. [Google Scholar] [CrossRef]
- Kuerten, J.G.M.; van der Geld, C.W.M.; Geurts, B.J. Turbulence modification and heat transfer enhancement by inertial particles in turbulent channel flow. Phys. Fluids 2011, 23, 123301. [Google Scholar] [CrossRef]
- Rousta, F.; Lessani, B. Near-Wall heat transfer of solid particles in particle-laden turbulent flows. Int. Commun. Heat Mass Transf. 2020, 112, 104475. [Google Scholar] [CrossRef]
- Zamansky, R.; Coletti, F.; Massot, M.; Mani, A. Turbulent thermal convection driven by heated inertial particles. J. Fluid Mech. 2016, 809, 390–437. [Google Scholar] [CrossRef]
- Béc, J.; Homann, H.; Krstulovic, G. Clustering, Fronts, and Heat Transfer in Turbulent Suspensions of Heavy Particles. Phys. Rev. Lett. 2014, 112, 234503. [Google Scholar] [CrossRef]
- Pouransari, H.; Mani, A. Particle-to-fluid heat transfer in particle-laden turbulence. Phys. Rev. Fluids 2018, 7, 074304. [Google Scholar] [CrossRef]
- Carbone, M.; Bragg, A.D.; Iovieno, M. Multiscale fluid–particle thermal interaction in isotropic turbulence. J. Fluid Mech. 2019, 881, 679–721. [Google Scholar] [CrossRef]
- Saito, I.; Watanabe, T.; Gotoh, T. Modulation of fluid temperature fluctuations by particles in turbulence. J. Fluid Mech. 2022, 931, A6. [Google Scholar] [CrossRef]
- Yousefi, A.; Ardekani, M.N.; Picano, F.; Brandt, L. Regimes of heat transfer in finite-size particle suspensions. Int. J. Heat Mass Transf. 2021, 177, 121514. [Google Scholar] [CrossRef]
- Ng, C.S.; Spandan, V.; Verzicco, R.; Lohse, D. Non-monotonic transport mechanisms in vertical natural convection with dispersed light droplets. J. Fluid Mech. 2020, 900, A34. [Google Scholar] [CrossRef]
- Albernaz, D.L.; Do-Quang, M.; Hermanson, J.; Amberg, G. Droplet deformation and heat transfer in isotropic turbulence. J. Fluid Mech. 2017, 820, 61–85. [Google Scholar] [CrossRef]
- Bhowmick, T.; Wang, Y.; Iovieno, M.; Bagheri, G.; Bodenschatz, E. Supersaturation in the Wake of a Precipitating Hydrometeor and Its Impact on Aerosol Activation. Geophys. Res. Lett. 2020, 47, e2020GL091179. [Google Scholar] [CrossRef]
- Kumar, B.; Schumacher, J.; Shaw, R.A. Cloud microphysical effects of turbulent mixing and entrainment. Theor. Comput. Fluid Dyn. 2013, 27, 361–376. [Google Scholar] [CrossRef]
- Kumar, B.; Schumacher, J.; Shaw, R.A. Lagrangian mixing dynamics at the cloudy–clear air interface. J. Atmos. Sci. 2014, 71, 2564–2580. [Google Scholar] [CrossRef]
- Götzfried, P.; Kumar, B.; Shaw, R.A.; Schumacher, J. Droplet dynamics and fine-scale structure in a shearless turbulent mixing layer with phase changes. J. Fluid Mech. 2017, 814, 452–483. [Google Scholar] [CrossRef]
- Bhowmick, T.; Iovieno, M. Direct numerical simulation of a warm cloud top model interface: Impact of the transient mixing on different droplet population. Fluids 2019, 4, 144. [Google Scholar] [CrossRef]
- Sardina, G.; Picano, F.; Brandt, L.; Caballero, R. Continuous Growth of Droplet Size Variance due to Condensation in Turbulent Clouds. Phys. Rev. Lett. 2015, 115, 184501. [Google Scholar] [CrossRef] [PubMed]
- Iovieno, M.; Carbone, M. On the condensational growth of droplets in isotropic turbulence. Springer Proc. Phys. 2019, 226, 265–270. [Google Scholar] [CrossRef]
- Liu, C.; Tang, S.; Dong, Y.; Shen, L. Heat Transfer Modulation by Inertial Particles in Particle-Laden Turbulent Channel Flow. J. Heat Transf. 2018, 140, 112003. [Google Scholar] [CrossRef]
- Maxey, M.R.; Riley, J.J. Equation of motion for a small rigid sphere in a nonuniform flow. Phys. Fluids 1983, 26, 883–889. [Google Scholar] [CrossRef]
- Iovieno, M.; Di Savino, S.; Gallana, L.; Tordella, D. Mixing of a passive scalar across a thin shearless layer: Concentration of intermittency on the sides of the turbulent interface. J. Turbulence 2014, 15, 311–334. [Google Scholar] [CrossRef]
- Canuto, C.; Hussaini, M.Y.; Quarteroni, A.; ZangHawking, T.A. Spectral Methods in Fluid Dynamics; Springer: Heidelberg, Germany, 1988. [Google Scholar] [CrossRef]
- Carbone, M.; Iovieno, M. Application of the Non-Uniform Fast Fourier Transform to the Direct Numerical Simulation of two-way coupled turbulent flows. WIT Trans. Eng. Sci. 2018, 120, 237–248. [Google Scholar] [CrossRef]
- Carbone, M.; Iovieno, M. Accurate direct numerical simulation of two-way coupled particle-laden flows through the nonuniform Fast Fourier Transform. Int. J. Safety and Sec. Eng. 2020, 10, 191–200. [Google Scholar] [CrossRef]
- Elghobashi, S. Particle-laden turbulent flows: Direct simulation and closure models. Appl. Sci. Res. 1991, 48, 301–314. [Google Scholar] [CrossRef]
- Zaichik, L.I.; Alipchenkov, V.M.; Avetissian, A.R. A Statistical model for predicting the heat trasnfer of solid particles in turbulent flows. Flow Turbul. Combust 2011, 86, 497–518. [Google Scholar] [CrossRef]
- Park, H.J.; O’Keefe, K.; Richter, D.H. Rayleigh-Bénard turbulence modified by two-way coupled inertial, nonisothermal particles. Phys. Rev. Fluids 2018, 3, 034307. [Google Scholar] [CrossRef]
- Monin, A.S.; Yaglom, A.M. Statistical Fluid Mechanics; MIT Press: Cambridge, MA, USA, 1975. [Google Scholar]
- Pandya, R.; Mashayek, F. Non-isothermal dispersed phase of particles in turbulent flow. J. Fluid Mech. 2003, 475, 205–245. [Google Scholar] [CrossRef]
- Mashayek, F.; Pandya, R. Analytical description of particle/droplet-laden turbulent flows. Prog. Energy Combust. Sci. 2003, 29, 329–378. [Google Scholar] [CrossRef]
- Reeks, M.W. The Development and Application of a Kinetic Theory for Modeling Dispersed Particle Flows. J. Fluids Eng. 2021, 143, 080803. [Google Scholar] [CrossRef]
- Moreau, M.; Simonin, O.; Bédat, B. Development of gas-particle Euler-Euler LES approach: A priori analysis of particle sub-grid models in homogeneous isotropic turbulence. Flow Turbul. Combust. 2010, 84, 295–324. [Google Scholar] [CrossRef]
Publisher’s Note: MDPI stays neutral with regard to jurisdictional claims in published maps and institutional affiliations. |
© 2022 by the authors. Licensee MDPI, Basel, Switzerland. This article is an open access article distributed under the terms and conditions of the Creative Commons Attribution (CC BY) license (https://creativecommons.org/licenses/by/4.0/).

