Article

Effect of Axial and Radial Flow on the Hydrodynamics in a Taylor Reactor

by
Sebastian A. Altmeyer
Castelldefels School of Telecom and Aerospace Engineering, Universitat Politècnica de Catalunya, 08034 Barcelona, Spain
Fluids 2022, 7(10), 336; https://doi.org/10.3390/fluids7100336
Submission received: 4 September 2022 / Revised: 30 September 2022 / Accepted: 14 October 2022 / Published: 20 October 2022

Abstract

:
This paper investigates the impact of combined axial through flow and radial mass flux on Taylor–Couette flow in a counter-rotating configuration, in which different branches of nontrivial solutions appear via Hopf bifurcations. Using direct numerical simulation, we elucidate flow structures, dynamics, and bifurcation behavior in qualitative and quantitative detail as a function of axial Reynolds numbers ( R e ) and radial mass flux ( α ) spanning a parameter space with a very rich variety of solutions. We have determined nonlinear properties such as anharmonicity, asymmetry, flow rates (axial and radial) and torque for toroidally closed Taylor vortices and helical spiral vortices. Small to moderate radial flow α initially decreases the symmetry of the different flows, before for larger values, α , the symmetry eventually increases, which appears to be congruent with the degree of anharmonicity. Enhancement in the total torque with α are elucidated whereby the strength varies for different flow structures, which allows for potential better selection and control. Further, depending on control parameters, heteroclinic connections (and cycles) of oscillatory type in between unstable and topological different flow structures are detected. The research results provide a theoretical basis for simple modification the conventional Taylor flow reactor with a combination of additional mass flux to enhance the mass transfer mechanism.

1. Introduction

Starting with the pioneering work of G. I. Taylor [1], the flow in the gap between two concentric independently rotating cylinders, i.e., Taylor–Couette flow [2] has been the subject of intense theoretical, numerical and experimental investigations. Understanding of such a type of flow is both of scientific interest, i.e., the revealing of various hydrodynamic stabilities [1,2], and of practical interest for many engineering applications in rotating machinery.
To date, the list of applications of Taylor flow in reactors and other devices is continuously growing with developments in industrial production such as centrifugal extractors [3], biological reactors [4], and filtration devices, just to name a few. Thereby, they cover a wild field, spanning from an industrial point of view, with filtering suspension and water purification via reverse osmosis [5,6,7,8,9] towards medical use for blood filtration [10,11,12]. Other examples to mention are the lubricating flow between rotating shafts in turbopumps, in rocket engines, in multi-spool turbofan engines and in the bearing housing of low and high bypass aircraft engines [13,14] and eventually nuclear main pump [15].
Over the years, numerous configurations have been used to enhance the heat and mass transfer capacity of vortex flow within reactors. Several theoretical and mathematical models were evaluated to test the flow and mass transfer characteristics of flow reactors with respect to different operating parameters. Models were established first for pure liquid [16,17] and later expanded to liquid solid reaction [18,19] to study the suspension distribution characteristic of catalysts within the flow reactor as well as two phase flows.
On the fundamental side, numerical studies of the Taylor–Couette flow in the ultimate flow regime [20] unveiled that flow transitions are delayed in the wide gap, resulting from the combined effects of the stabilizing curvature of the inner cylinder and the reduced shear. Other works focused on improving the classical setup of the Taylor flow reactor through structural changes. Numerous works studied modifications and changes in the rotor shape or extra added internal baffles [21,22] as well as incorporating of annular fins along the inner cylinder [23] which all in common detected a reduction in the smooth critical Reynolds number. Further, changing the roughness of the cylinder wall in the Taylor reactor allows to control the wavelength of the Taylor vortices [24].
The presence of a radial through-flow in the annulus between two differentially rotating porous cylinders modifies the absolute stability of the Taylor vortex flow (TVF) as investigated in various works [25,26,27,28,29,30,31]. All these works, whether experiments or numerical simulations, come to the same conclusion: both converging radial flow and sufficiently strong diverging flow have a stabilizing effect on the Taylor instability, while weak to moderate diverging flow destabilizes the system [25,27,31]. Mainly focused on stability behavior, to date, less attention has been given to internal modifications of the flow structures itself. A gap, which the current work closes by calculating symmetry and degree of anharmonicity.
The present paper examines the combined effect of axial through flow and radial mass flux (injection and suction through the cylinder walls) and the resulting interaction and modifications in hydrodynamics. The key motivation for this work is the fact that typical separation devices, such as rotating filtration [12], vortex flow reactors [32,33], oil-sand separation in the petroleum industry [34] is using a radial mass flux to fulfill their duty. However, in order to be efficient, these devices have to work continuously in order to perform the separation, while the mixture enters at one side and the “clean” flow exits at the other. Thus, an intrinsic axial flow is present at all times. A finite radial mass flux not only enhances the total torque of all flow states, more importantly the enhancement is different in strength depending on the flow structure. This allows for better potentially selection and therefore provides a further possibility for control.
The problem formulation and numerical approach are presented in Section 2. Section 3 examines the bifurcation behavior and parameter space for R e and α . Then, the flow dynamics of distinct flow states is analyzed, velocity profiles, anharmonicity, asymmetry and torque are discussed, culminating with a conclusion in Section 4.

2. Materials and Methods

2.1. Governing Equations

Considering the flow driven in the annular gap between two independently rotating cylinders [1,2] (Figure 1), with the inner cylinder of radius R i rotating at angular speed ω i and the outer cylinder of radius R o rotating at angular speed ω o . In the present study, we consider in the axial direction periodic boundary conditions which are set to λ / ( R o R i ) = 1.6 ( λ being the axial wavelength), corresponding to an axial wavenumber k = ( 2 π / λ ) = 3.927 . The fluid in the annulus is assumed to be Newtonian, isothermal, and incompressible with kinematic viscosity ν .
The non-dimensional Navier–Stokes equations governing the flow are
t u + ( u · ) u = p + 2 u , · u = 0 ,
where u = ( u , v , w ) is the velocity in cylindrical coordinates ( r , θ , z ) and the corresponding vorticity is × u = ( ξ , η , ζ ) . The system is governed by the following independent non-dimensional parameters:
Inner [ Outer ] Reynolds number : R e i [ o ] = ω i [ o ] R i [ o ] d / ν ,
Axial Reynolds number : R e = w APF ( r ) ( see below ) ,
Radial Reynolds number : α = u i R i / ν ( = u o R o / ν , owing to continuity ) ,
Radius ratio : b = R i / R o .
In this study, we assume a wide gap with a fixed radius ratio b = 0.5 . The length and time scales of the system are set by the gap width d = R o R i and the diffusion time d 2 / ν , respectively. The pressure in the fluid is normalized by ρ ν 2 / d 2 . Additionally, the inner and outer Reynolds numbers (Equation (2a,2b)) are fixed to R e i = 120 and R e o = 75 (corresponding ratio μ = R e i / R e o = 1.62 ), respectively, while varying either the axial Reynolds number R e (Equation (7)) or the radial Reynolds number α (Equation (2c)). Boundary conditions on the cylindrical surfaces are
u ( r i , θ , z , t ) = ( u i , R e i , 0 )
u ( r o , θ , z , t ) = ( u o , R e o , 0 )
(with u o = b u i ), respectively, where the non-dimensional inner and outer radii are r i = R i / d and r o = R o / d .
The governing equations (Equation (1)) and the boundary conditions (Equation (3a,3b)) are invariant under arbitrary rotations R α about the axis, arbitrary axial translation Z l and with respect to time translations ϕ t 0 . The actions of these symmetries on the velocity field are
R α ( u , v , w ) ( r , θ , z , t ) = ( u , v , w ) ( r , θ + α , z , t ) ,
Z l ( u , v , w ) ( r , θ , z , t ) = ( u , v , w ) ( r , θ , z + l , t ) ,
ϕ t 0 ( u , v , w ) ( r , θ , z , t ) = ( u , v , w ) ( r , θ , z , t + t 0 ) .
These idealizations lead to a unique basic state, i.e., Circular Couette flow (CCF) which depends only on r. The system has S O ( 2 ) × O ( 2 ) symmetry, where S O ( 2 ) is the group of arbitrary rotations about the axis and O ( 2 ) is the group containing the reflection at any height z and translations in z direction. The mean, possibly zero, axial flux remains unchanged along the radial direction. All symmetries (Equation (4a,4b,4c)) are conserved with only the radial profiles of the CCF basic state depending on the parameter α .
It is worth mentioning that for finite axial through flow, R e 0 , the symmetry is also invariant under change between the two degenerated spiral vortex flows (left- and right-handed, L1-SPI and R1-SPI) together with inverting the axial flow direction R e :
L 1 - SPI ( R e , α ) = R 1 - SPI ( R e , α ) .

2.2. External Axial through Flow R e

External axial through flow throughout the annulus is enforced by a constant pressure gradient with size z p APF to the axial velocity component in the Navier–Stokes equations (Equation (1)). In the sub-critical regime (below the onset of any vortex structure), this pressure gradient forces an annular Poiseuille flow (APF) [35,36]. The radial profile of this axial through flow velocity is given by
w APF ( r ) = z p APF 4 r 2 + ( 1 + b ) ln r ( 1 b ) ln b + ( 1 + b ) ln ( 1 b ) ( 1 b ) ln b 1 ( 1 b ) 2 .
Its mean value can be used to define the axial through flow Reynolds number
R e : = w APF ( r ) = z p APF 8 1 b 2 + ( 1 + b 2 ) ln b ( 1 b ) 2 ln b ,
which describes the externally applied additional axial pressure gradient. Therefore, a positive [negative] R e indicates an upward [downward] axial through flow, w APF ( r ) , in the positive [negative] z direction, respectively (see Figure 1). It means that an axial through flow can be characterized by the axial Reynolds number R e , Equation (7).

2.3. Numerical Method

The Navier–Stokes Equation (1) are solved using a second-order time-splitting method with consistent boundary conditions for the pressure [37,38]. Our code G1D3 [39] is a combination of a finite-difference method in the radial and axial directions ( r , z ) and a Fourier–Galerkin expansion in the azimuthal direction ( θ ) with time splitting resulting in a decomposition
f ( r , θ , z , t ) = m f m ( r , z , t ) e i m θ
of all fields f { u , v , w , p } . For the parameter regime considered, the choice m m a x = 10 (with m being the azimuthal wavenumber) provides adequate accuracy. We use a uniform grid with spacing Δ r = Δ z = 0.02 and time steps Δ t < 1 / 3800 .
The system of coupled equations for the amplitudes f m ( r , z , t ) of the azimuthal normal modes is solved with the FTCS algorithm. The method of ‘artificial compressibility’ [40] has been used to adjust pressure and velocity fields iteratively to each other.
d p ( n ) = γ · u ( n ) ( γ ( 0 , 1 ) )
p ( n + 1 ) = p ( n ) + d p ( n ) ,
u ( n + 1 ) = u ( n ) Δ t ( d p ( n ) ) .
The velocity field u ( n + 1 ) is adapted by the pressure correction d p ( n ) in the nth iteration step being proportional to the divergence of u ( n ) . The iteration loop (Equation (9)) is executed for each azimuthal Fourier mode separately. The iteration stops when · u has become sufficiently small for each m mode considered. The magnitude of the total divergence never exceeded 0.02 and typically it was much smaller. After that, the next FTCS time step was executed.
For code validation, SPI solutions have been compared with experiments [41,42] and previous numerical simulations and close to the onset with Ginzburg-Landau results [43,44]. In addition, the non-linear primary bifurcating solutions (TVF and SPI) were compared with the respective stability boundaries of the linearized NSE obtained by a shooting method [44,45]. The bifurcation thresholds for both primary vortex structures in TCS were found to lie about 0.5% below the respective linear stability thresholds, whereby the mesh size has been continuously reduced towards finer discretizations until no further variation in the results and thus deviation from the linear thresholds could be detected. Further investigation of the nonlinear solutions change when varying m m a x and/or the grid spacing revealed that typical SPI frequencies have an error of less than about 0.2%. Time steps were always well below the von Neumann stability criterion and by more than a factor of 3 below the Courant–Friederichs–Lewy criterion.
For diagnostic purposes, we also evaluate the complex mode amplitudes f m , n ( r , t ) obtained from a Fourier decomposition in the axial direction.
f m ( r , z , t ) = n f m , n ( r , t ) e i n k z .

2.4. Parameters Setting and Quantities

Motivated by operating conditions of reactors and to ensure avoidance of turbulence transitions, we explore the parameter space within R e [ 20 , 20 ] and α [ 20 , 20 ] . That is, for the fixed inner and outer Reynolds numbers ( R e i = 120 or R e 0 = 75 ), the effects of the axial and radial through flow on the dynamics of various flow states will be investigated.
As a global measure for characterizing the flow state, we use the modal kinetic energy, E k i n , defined by
E k i n = m E m = 1 2 0 2 π Γ / 2 Γ / 2 r i r o u m u m * r d r d z d θ ,
where u m (u m * ) is the m-th (complex conjugate) Fourier mode, Equation (8), of the velocity field, respectively. Thus, for the axisymmetric solutions ( m = 0 ), e.g., CCF and TVF, only E 0 is non-zero. We note that E k i n is constant (non-constant) for a steady (an unsteady) solution. For a diagnostic purpose, we consider the time-averaged quantity (over one period T) E ¯ k i n = 0 T E k i n d t and the time-averaged mode amplitudes | u ¯ m , n | . Note that when time-averaged quantities are studied, a period time of a particular solution has been considered. The period time of a solution depends on the parameters of a system, which are typically different for different flow structures. In addition, as a local measure to characterize the flow states, the azimuthal vorticity on the inner cylinder at symmetrically displaced two points on the mid-plane, η ± = ( r i , 0 , ± Γ / 4 , t ) , will be considered.

2.5. Nomenclature

The present study focuses on flow dynamics in a relatively short periodic domain with axial wavelength λ = 1.6 and counter-rotating cylinders. A common feature shared by most flows in the counter-rotating case, also in the absence of any radial flow is that they are non-axisymmetric. Typically m = ±1 for certain parameter regime. Usually these states correspond to helical spiral vortex flow (spiral, SPI). However, in the present study most states have a dominant m = 0 mode and appear with toroidally closed vortex structure. These are [modulated] wavy vortices [m]wTVF and [modulated] ribbon [m]RIB solutions, which the latter being superposition of SPIs with opposite chirality (although helical modes m = ±1 are dominant). Table 1 provides an overview of the various flows discussed in this work. Nomenclature, including main characteristics, dominant modes, and corresponding flow dynamics are indicated.

3. Results and Discussion

3.1. Variation with Axial Flow R e

Absence of Radial Flow ( α = 0 )

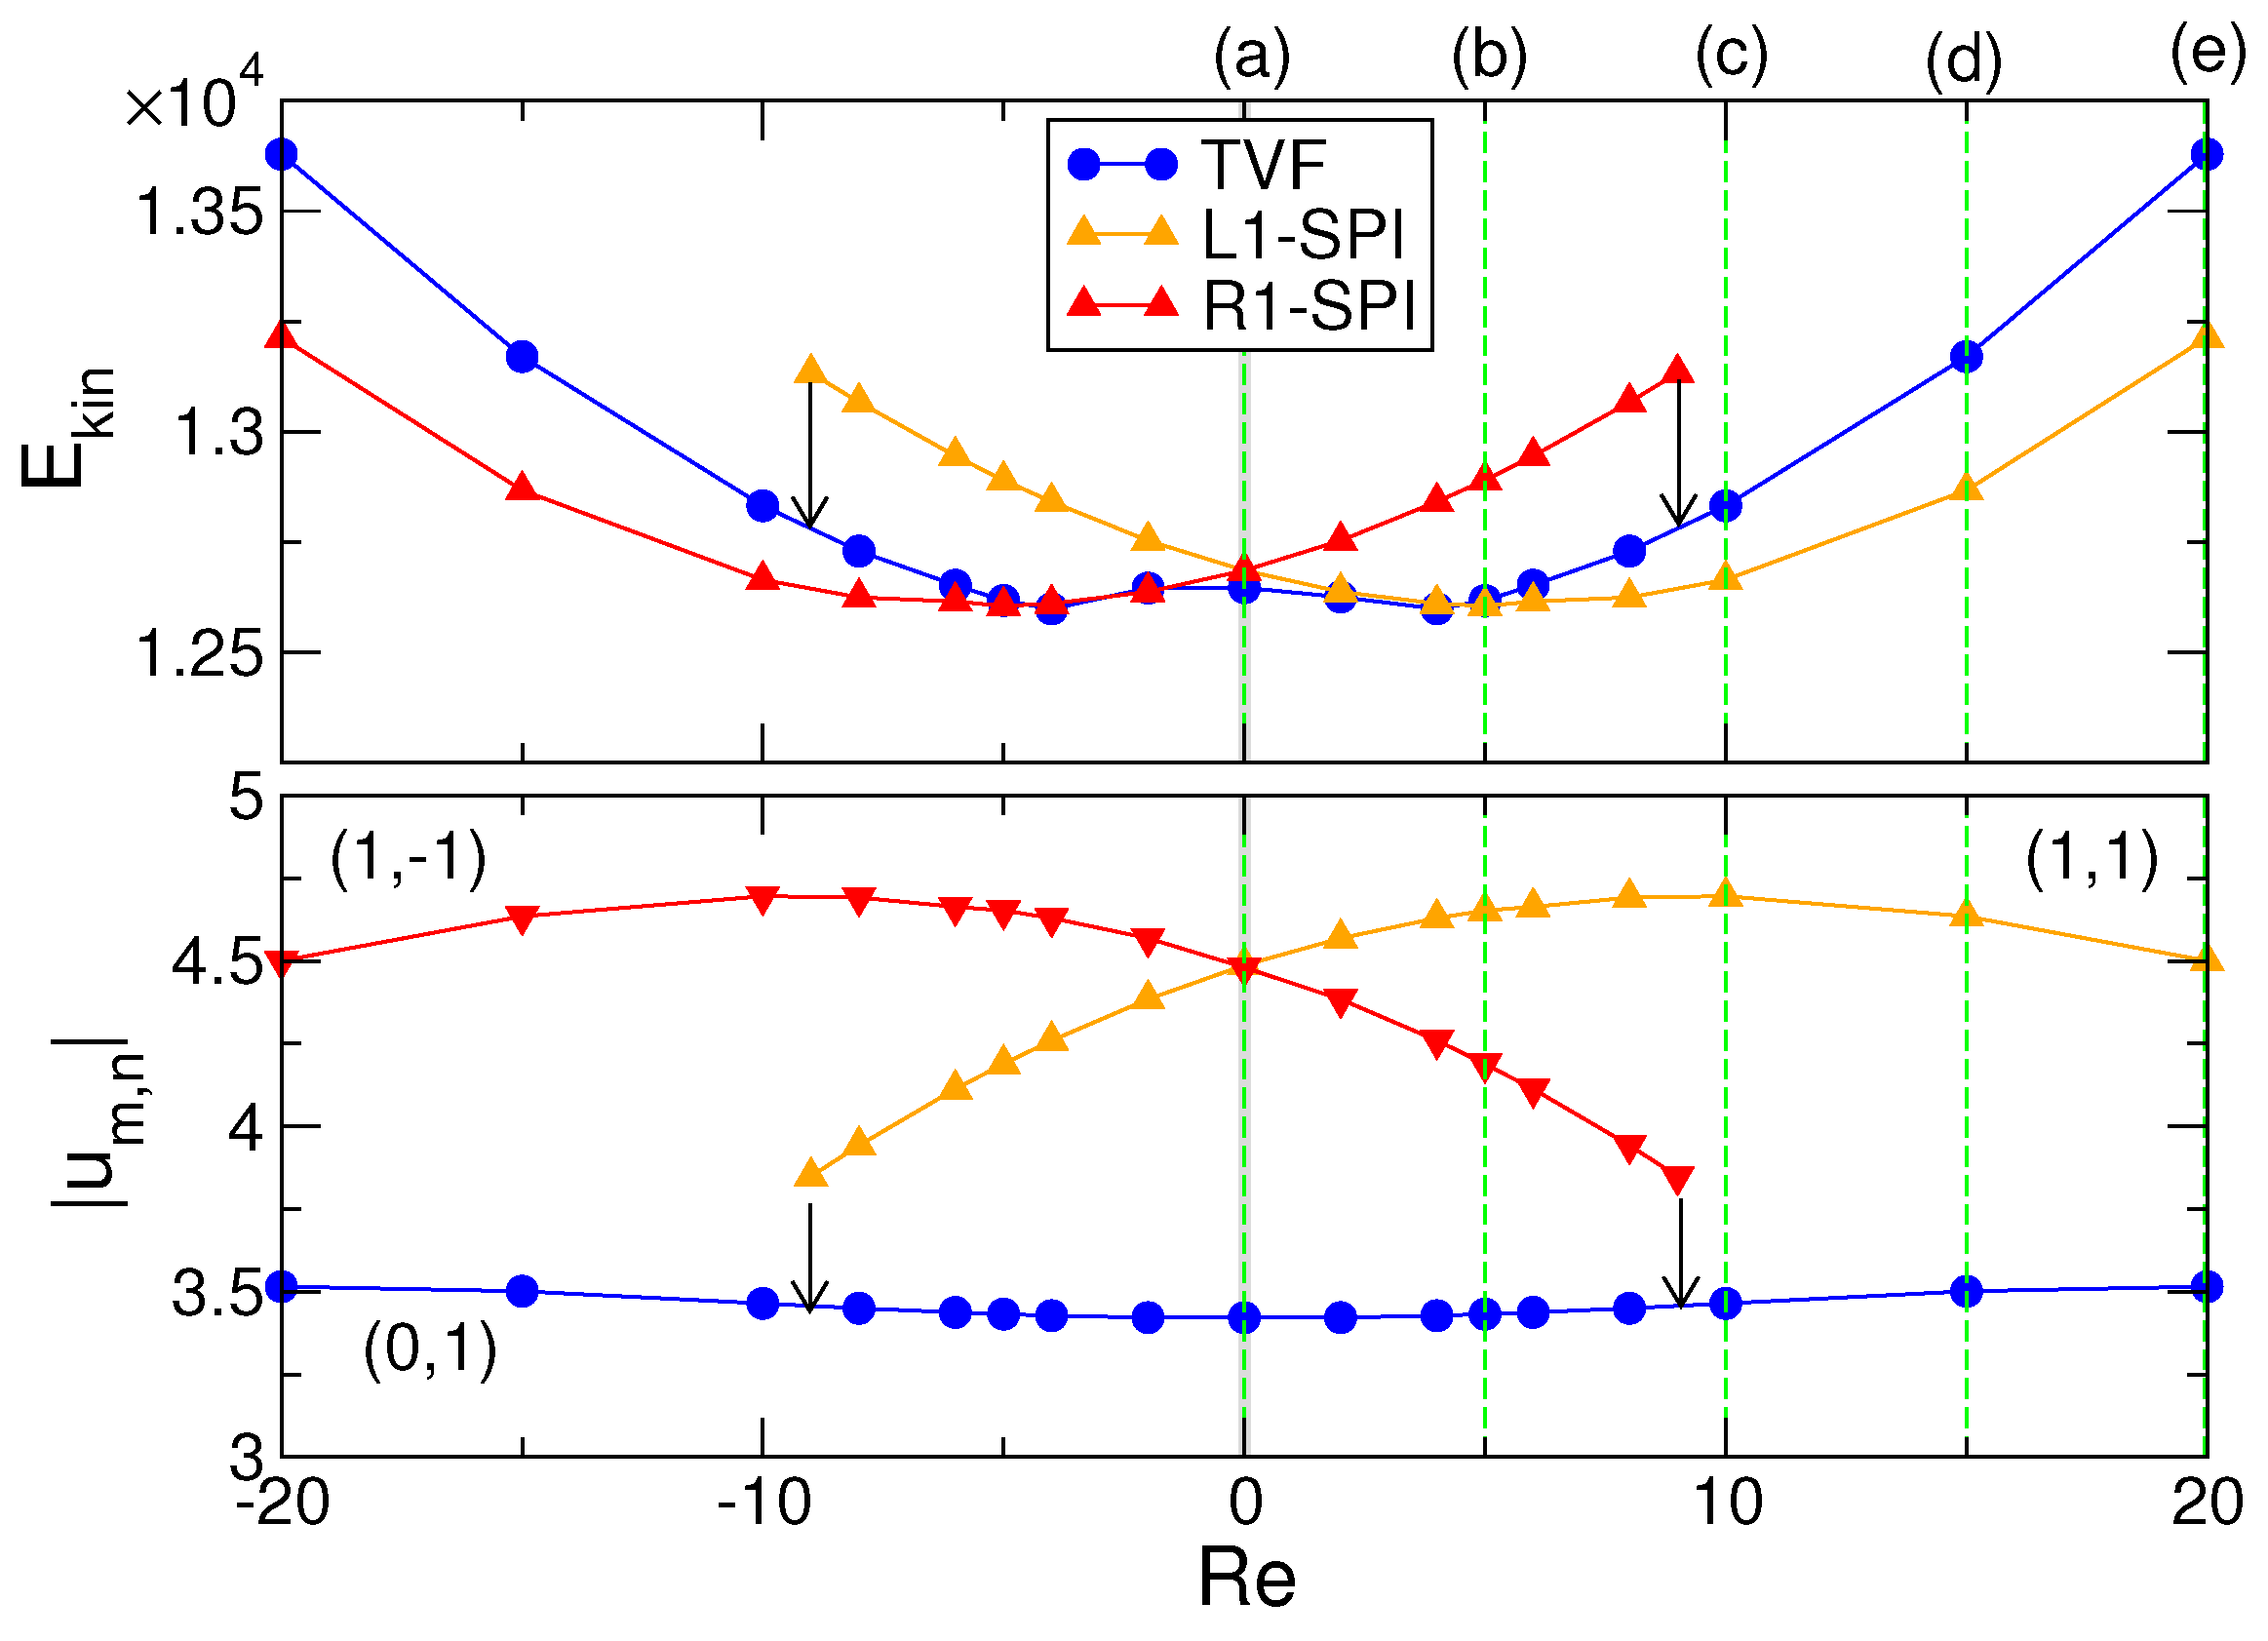
Before considering any combination of axial and radial flow, we look at the situation with only axial through flow for the given set of parameters. Figure 2 shows how the through-flow influences the different solutions, TVF (blue circles), L1-SPI (orange up-triangles), R1-SPI (red down-triangles) at the fixed characteristic driving combination R e i = 120 and R e o = 75 ( α = 0 ). Shown are variation with R e of the kinetic energy E k i n and the radial flow intensity at mid-gap ( | u m , n | = | u 1 , 1 | for L1-SPI, | u 1 , 1 | for R1-SPI, and | u 0 , 1 | for TVF). For this parameter combination, the three flow structures coexist stably when R e = 0 . Further TVF is stable over the whole parameter range [ 20 ; 20 ] . For R e = 0 the two spirals, L1-SPI and R1-SPI, are mirror images of each other and their radial velocities are the same and all respective axial velocities have the same magnitude but opposite direction (i.e., | u 1 , 1 | = | u 1 , 1 | ).
A finite through-flow R e 0 breaks the mirror symmetry between the L1-SPI and the R1-SPI and the radial flow amplitudes evolve with R e as shown in Figure 2. While for small through-flow, for 9.2 R e 9.2 the two SPIs coexist bistable (particular realization depending on initial conditions) with increasing R e one SPI becomes unstable. This through-flow enforced loss of stability appears when the phase velocity changes sign and reverts the originally adverse axial phase propagation of the corresponding SPI. Losing the stability, the through-flow preferably induces a transition to the stable TVF statem rather than to the remaining stable SPI state. Thus, when the through-flow destabilizes, e.g., L1-SPI, then typically the | u 0 , 1 | mode of TVF grow rather than the | u 1 , 1 | mode of R1-SPI.
Increasing R e initially slightly decreases E k i n for both TVF and L1-SPI, while E k i n strongly increases for larger R e .

3.2. Bifurcation Behavior with Radial Flow α

Figure 3 illustrates the branches of TVF (blue circles), L1-SPI (orange up-triangles), R1-SPI (red down-triangles) and different wTVF[ t ] (black [brown] squares) for four different values of axial through flow R e (indicated by the arrow in the phase diagram in Figure 2) with variation in radial flow α . Shown here are the same quantities (modal kinetic energy E ¯ k i n and the dominant radial flow field amplitudes | u ¯ m , n | ) as in Figure 2. Note that for time-dependent solutions the quantities are averaged over one period.
Starting with R e = 0 (Figure 3a) and increasing α the Circular Couette flow (CCF) basic state is succeeded by the symmetry degenerated spiral flow (L1-SPI & R1-SPI) that appears at α 1.65 via a primary Hopf bifurcation with a common, finite frequency out of CCF, as a consequence of the breaking of the O ( 2 ) symmetry (here in the axial direction). L1-SPI & R1-SPI coexist with increasing α before losing stability at α 8.72 and transition (indicated by the vertical arrows in Figure 2) towards a time-dependent wavy vortex flow 1-wTVF t . On the other hand, TVF that appears (later than SPI) via a circle pitchfork bifurcation out of CCF is unstable close to onset, but eventually becomes stabilized at α 1.1 . With increasing α , TVF coexists stable with L1-SPI and R1-SPI, before losing its stability at α 7.25 , when the helical modes ( 1 , 1 ) = ( 1 , 1 ) become finite to form a wavy Taylor vortex flow, 1-wTVF. For α 7.25 another incommensurable frequency appears resulting in the time-dependent state 1-wTVF t (i.e., the same solution to which SPI transitions to). Further, increasing α the helical mode ( 0 , 1 ) disappears at α 10.6 leaving a ribbon solution (RIB) as a superposition of L1-SPI and R1-SPI with equal mode amplitudes. Eventually, RIB destabilizes at α 13.5 leaving a heteroclinic cycle (hc), 1-RIB A B with alternation between two symmetry related 1-RIB A and 1-RIB B [31]. 1-RIB A B disappears for α 14.3 and the system goes back to the CCF basic state.
With a small axial through flow R e = 5 (Figure 3b) present, the Z 2 symmetry is broken and thus L1-SPI and R1-SPI are not degenerated anymore. R1-SPI, which is naturally propagating against the through flow R e , only exists in a certain range 0.6 α 4.6 . With decreasing α it loses stability against L1-SPI, which is naturally propagating in the same direction as the external applied through flow R e and with increasing α it loses stability against TVF. In addition, the former described 1-wTVF becomes modified and more complex as the helical modes ( 1 , 1 ) and ( 1 , 1 ) are not identical anymore generating a modulated wavy flow 1-mwTVF. Aside this flow structure modification, the general bifurcation behavior with α remains very similar to the case for R e = 0 . The main difference is the fact that only L1-SPI bifurcates stably out of CCF (here at α 1.7 ), while R1-SPI only becomes stabilized at larger α 0.6 . Further, 1-mwTVF t exists stably for a wider range before eventually disappearing at α 14.9 and leaving only the CCF basic state behind. Thus, here no 1-RIB or 1-RIB A B are present.
At larger R e = 10 (Figure 3c), the bifurcation behavior remains qualitative the same as observed for R e = 5 but with two main differences. First, no stable R1-SPI appears and, second, 1-mwTVF does not direct change into 1-mwTVF t with increasing α . Instead, a new region with a heteroclinic connection between the topological different solutions, the helical orientated 1-mwSPI and the toroidally closed 1-wTVF, is found. In this region ( 9.7 α 11.6 ) the system changes, alternating between these two flow states This scenario will be discussed in more detail in Section 3.5. For large α 14.95 , 1-mwTVF t disappears and leaving only the CCF basic state behind.
For larger R e = 20 (Figure 3d) the heteroclinic connection between 1-mwSPI and 1-mwTVF remains present and in fact appears over a wider range in 10.5 α 13.5 . In contrast to the former scenario at lower R e , with increasing α , the time dependent solution 1-mwTVF t looses its time dependence again at α 14.6 and by doing so, going back to 1-mwTVF state, which then finally disappears into the CCF basic state at α 15.45 . On the other side for inward directed flow α < 0 , TVF also becomes unstable against 1-mwTVF at α 0.15 similar as it does with increasing α at α 7.3 . At smaller α 0.65 1-mwTVF becomes unstable and transitions into the only remaining L1-SPI, as seen for TVF for other R e .

3.3. ( R e , α ) Parameter Space

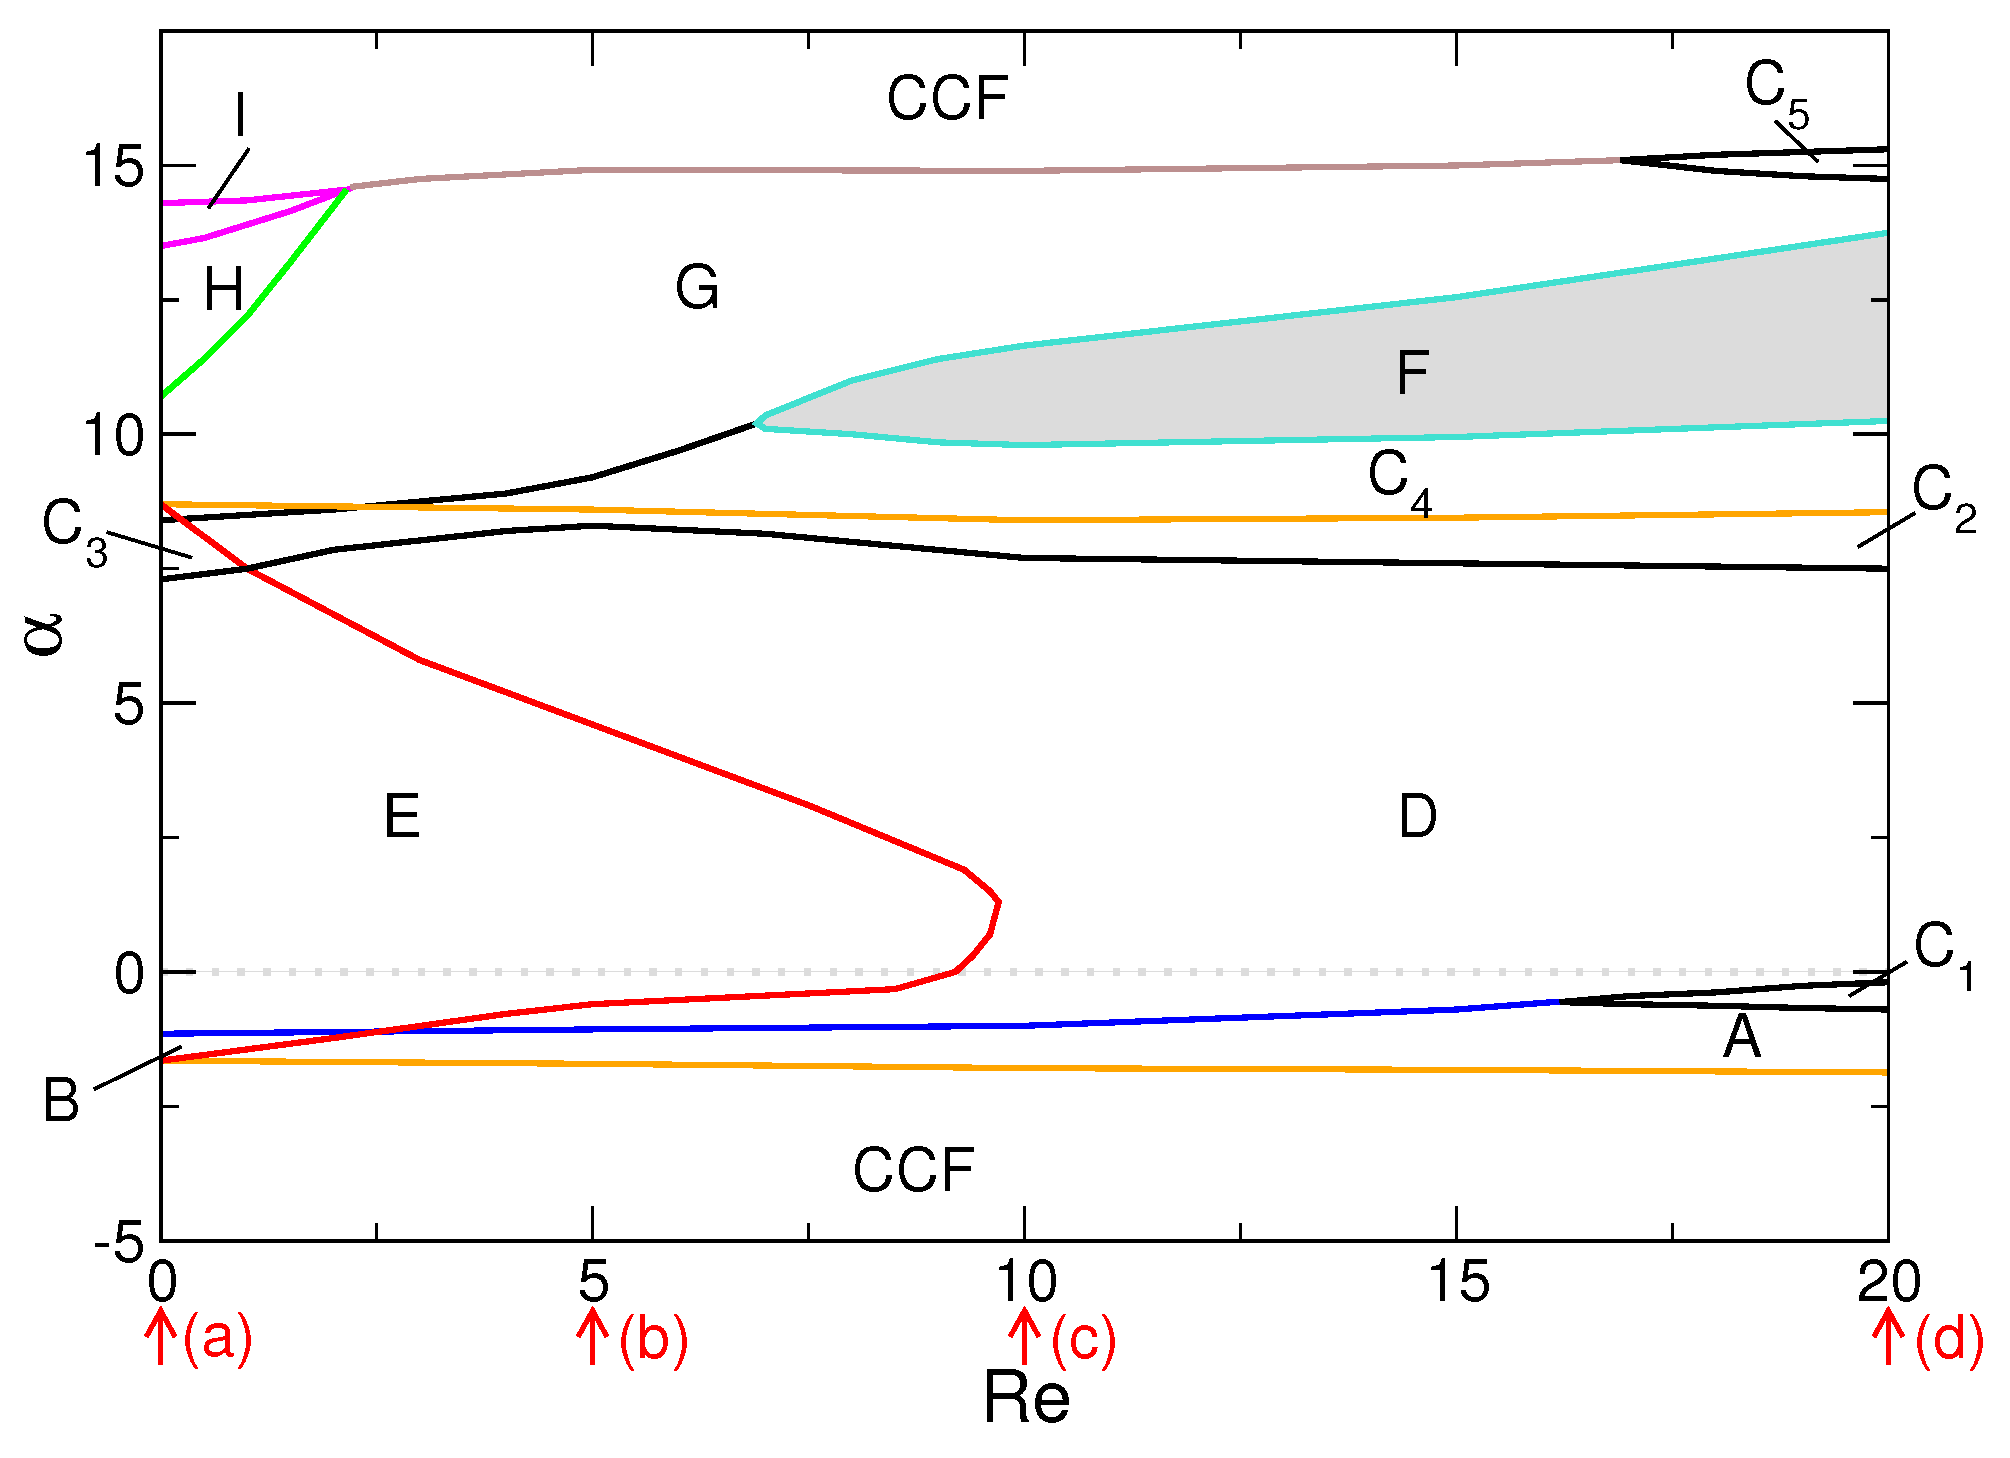
Figure 4 illustrates the ( R e , α ) parameter space investigated and provides an overview of all the solutions existing for here studied control parameters. A small arrow below the abscissa indicate those R e for which the bifurcation diagrams in Figure 3 were obtained. It is worth mentioning that Figure 4 only shows positive axial through flow R e 0 ; due to symmetry relations (Equation (5)) the phase diagram for negative axial through-flow R e 0 looks the same with exchange of L1-[mw]SPI and R1-[mw]SPI, respectively.
The different curves illustrate the stability thresholds separated in the various regions, labeled A-I, of various flow structures, as listed in Table 2 including their stability properties (stable (s), unstable or non-existing (-) heteroclinic cycle (hc), heteroclinic connection (hco)). To guide the eyes some boundaries are color coded; e.g. within the red line stable R1-SPI exist (including regions B, E, C 3 ), while between the orange lines stable L1-SPI exist (including regions A, B, C 1 , C 2 , C 3 , D, E).
Of special interest are the two regions in which heteroclinic cycles and connections were detected. Region I with 1-RIB A B [1-mRIB A B ] has been detailed studied in a previous work [31]. Region F, instead, shows a new heteroclinic connection between two topological different flow states, 1-mwTVF↔1-mwSPI, which will be presented in more detail later in Section 3.5.

3.4. Flow Dynamics, Structures and Heteroclinic Connections

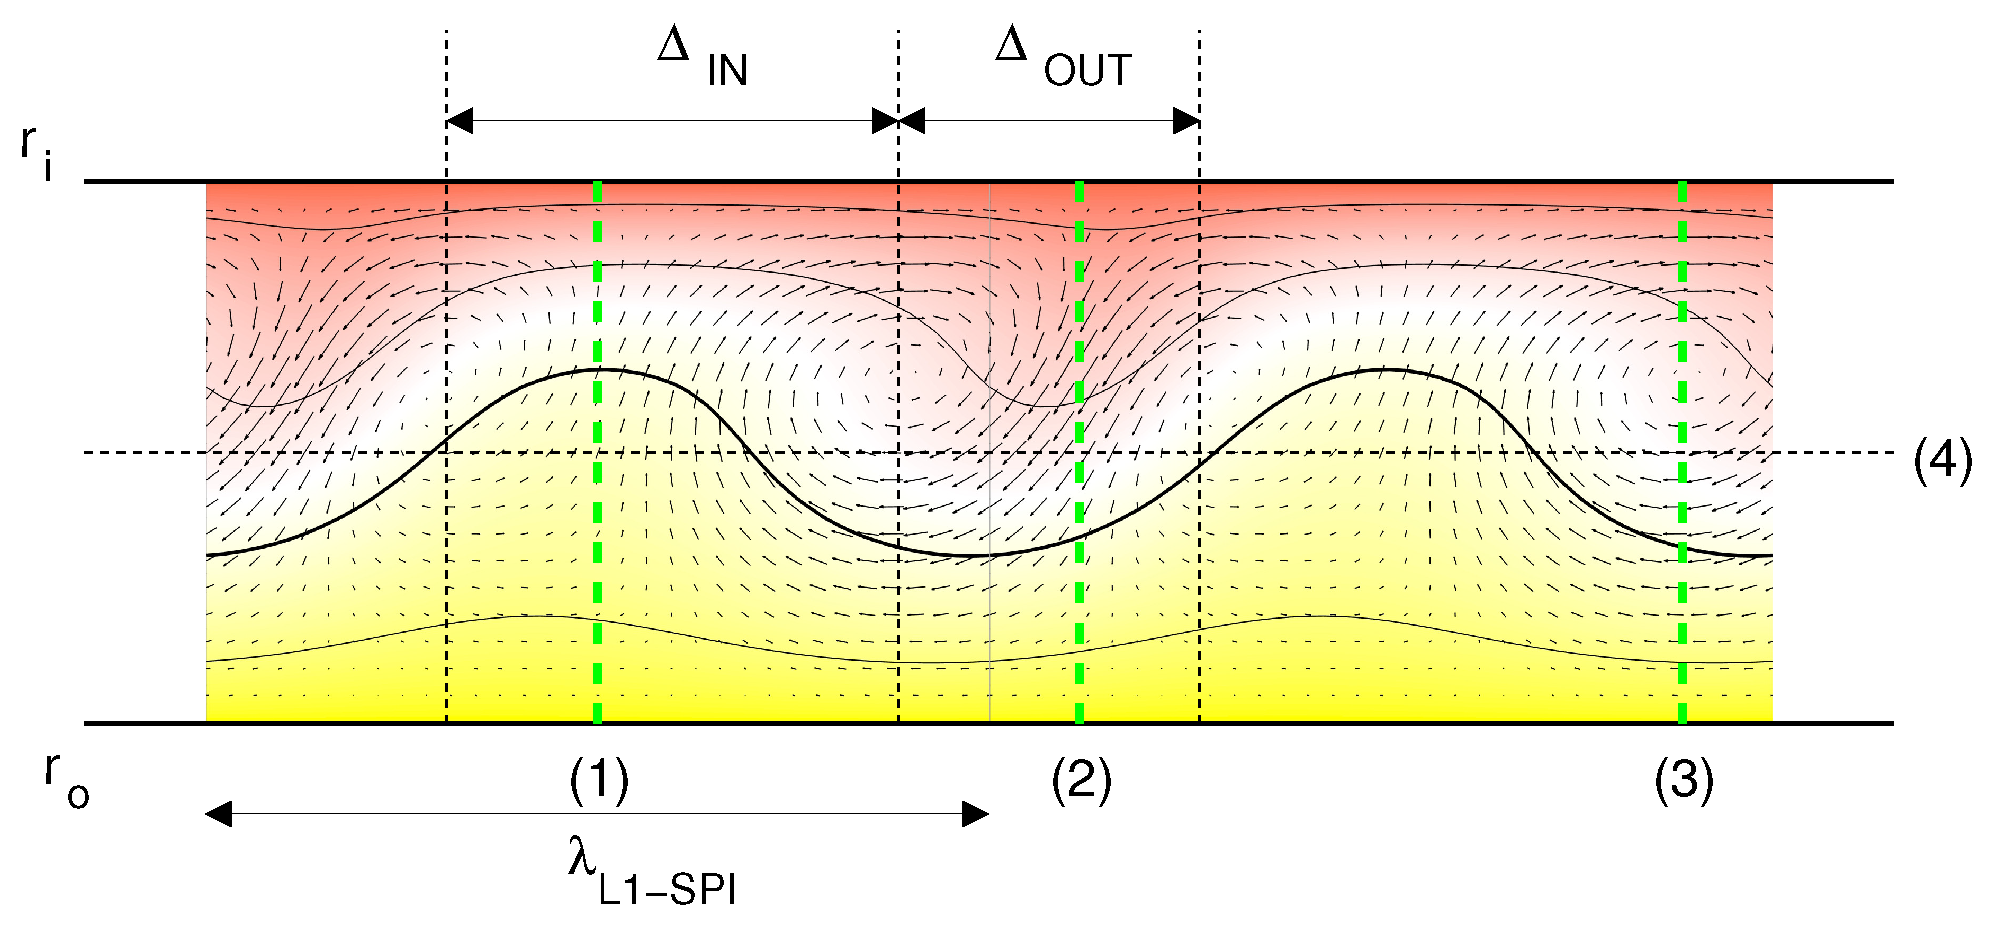
Next we have a closer look into the flow dynamics with variation in R e and α . Thereby, we restrict our studies mainly to the ‘pure’ solutions of TVF, L1-SPI and R1-SPI. The dynamics for the higher order solutions as presented in Figure 3 and Figure 4 is way more complex and beyond the scope of the present work. In the following, we consider different quantities as anharmonicity, asymmetry and flow rates to characterize the dynamics [46,47], similarities and differences between the flow states. The schematics in Figure 5 shows the position for different of these quantities on the example of a L1-SPI.

3.4.1. Anharmonicity

It is well-known and easy to imagine, that, in general, helical flow states, as SPIs, have crucial different nonlinear properties compared to the toroidal closed TVF. For instance, SPIs have a non-vanishing axial flow rate and are characterized by highly nonlinear properties such as asymmetry, which can be characterized by the following asymmetry parameter [46]
P = λ / 2 λ / 2 | u ( z ) u ( z ) | d z λ / 2 λ / 2 | u ( z ) + u ( z ) | d z
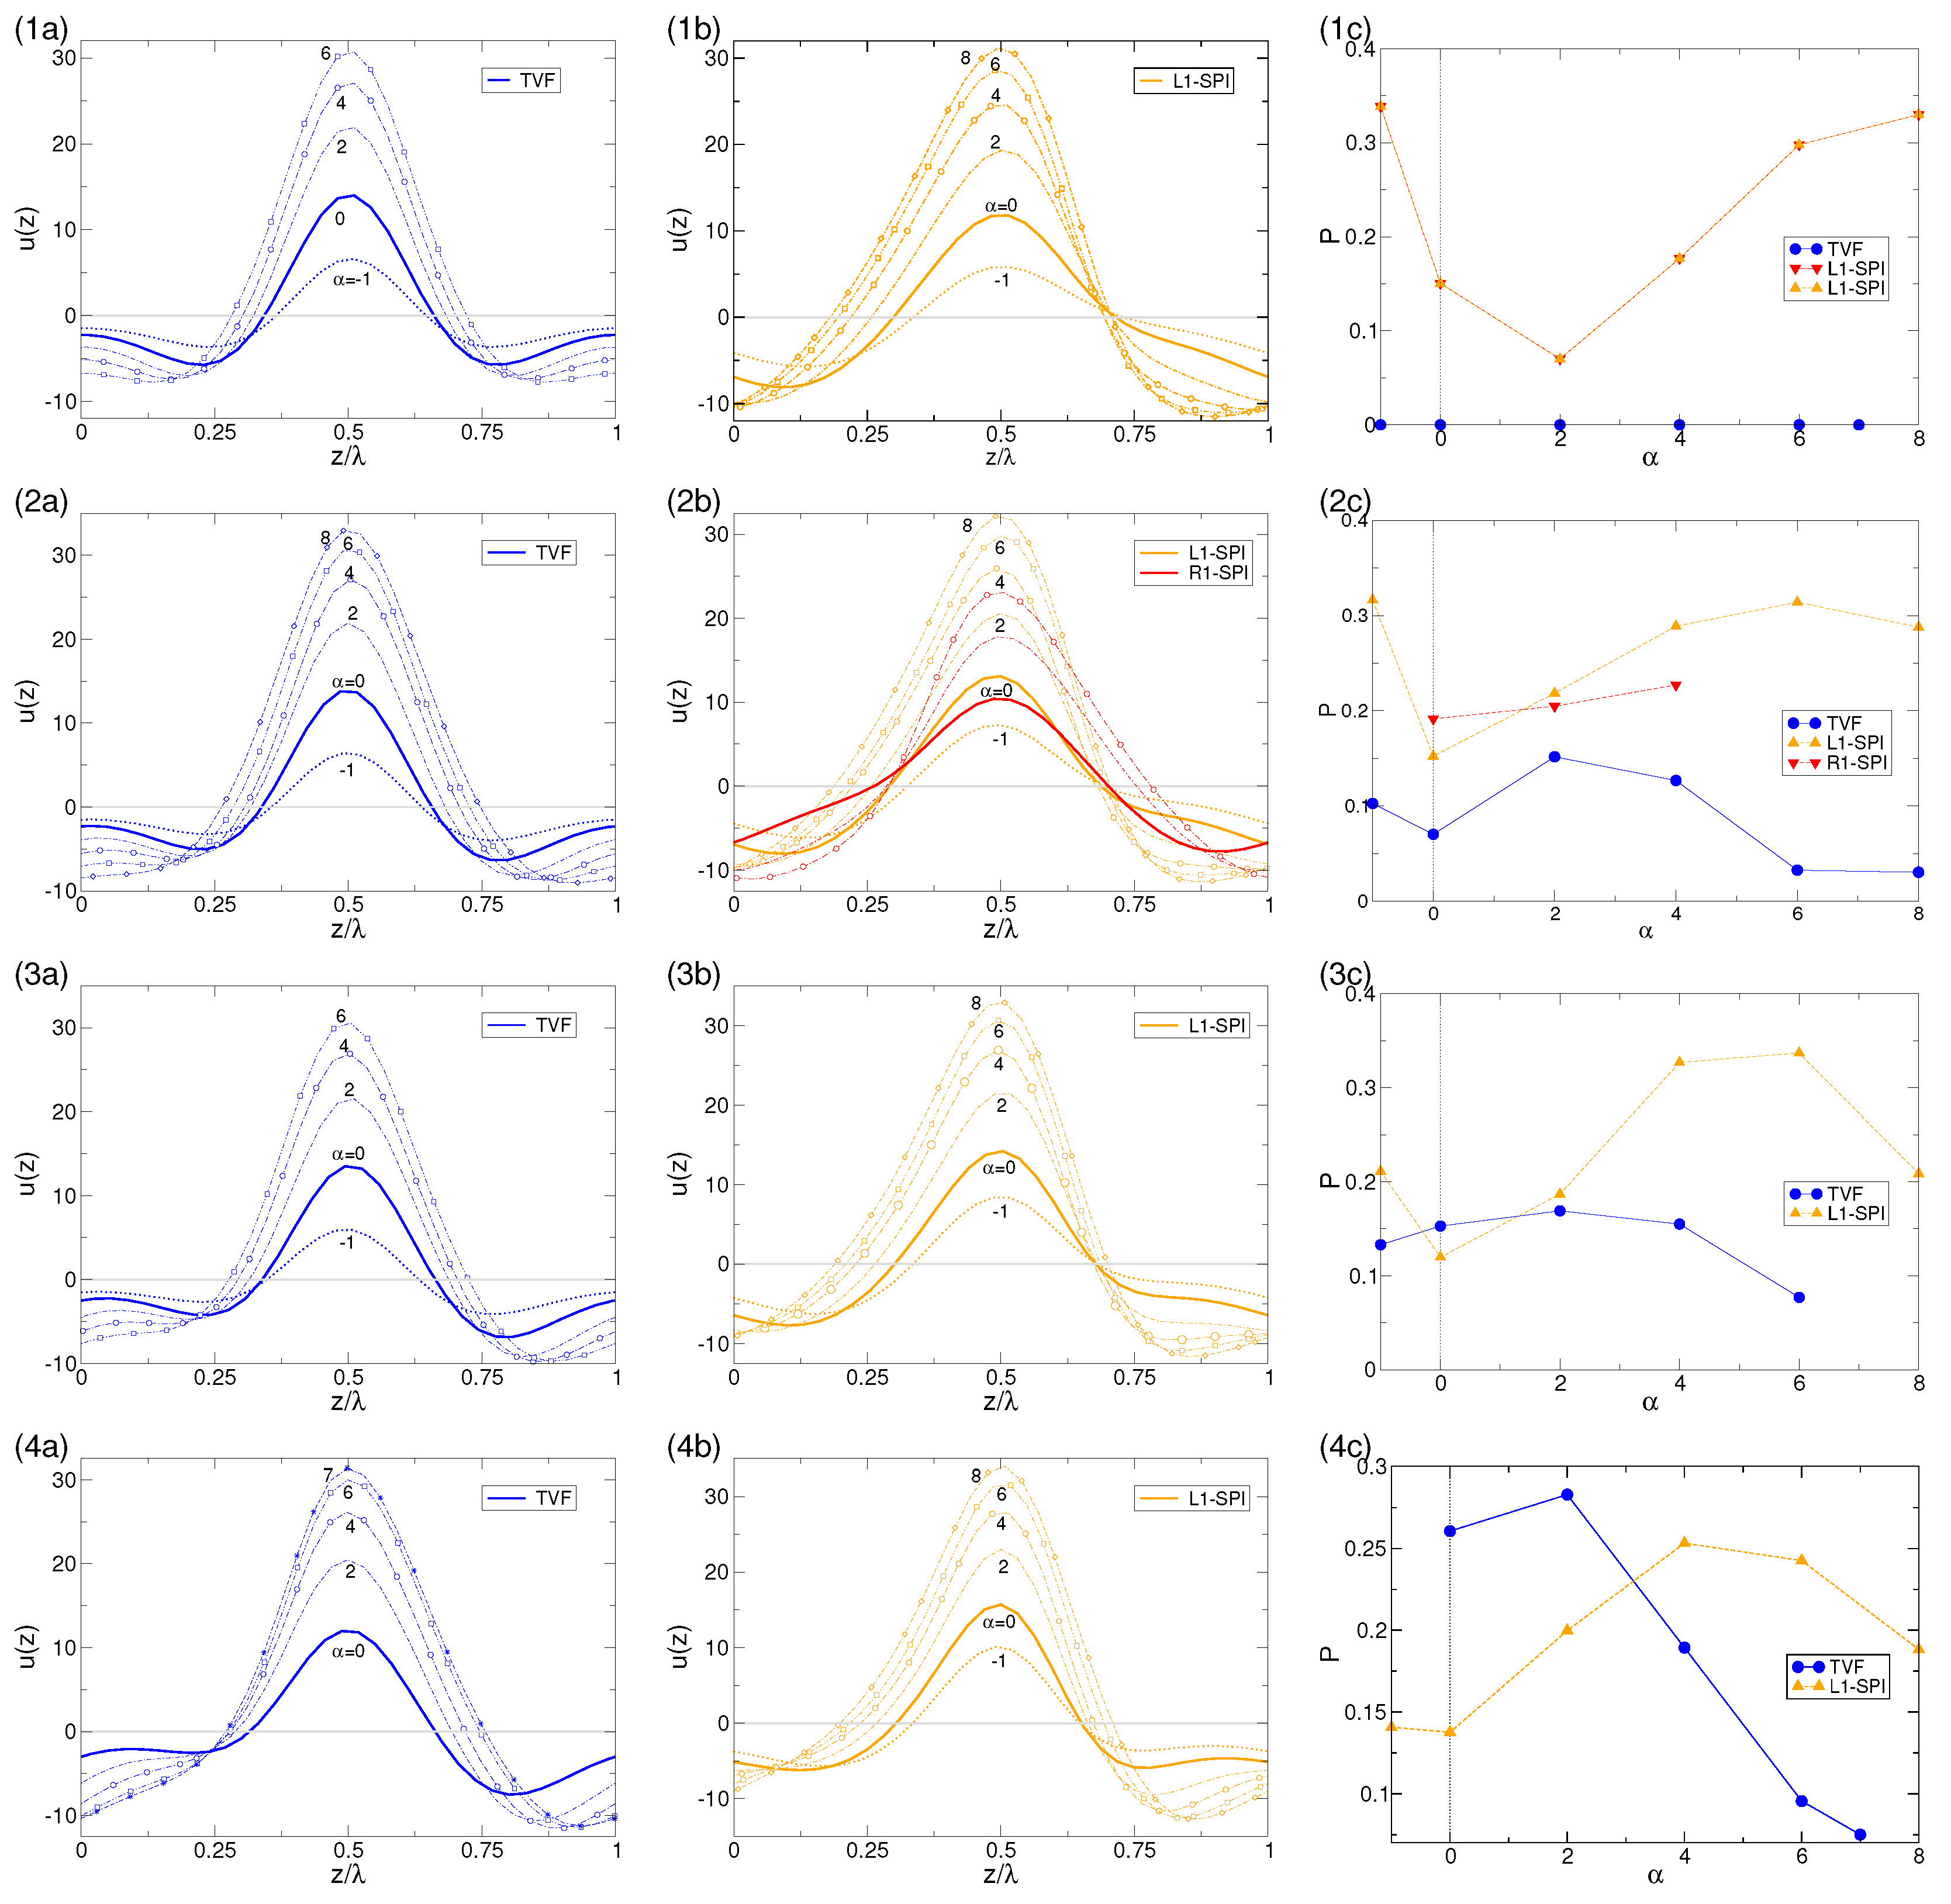
with λ being the axial pattern wavelength. Figure 6 shows the axial profiles of the radial velocity u ( z ) at the midgap position together with the asymmetry parameter P (Equation (12)) for TVF, L1-SPI, and R1-SPI at different R e and α as indicated. In the absence of axial through flow R e = 0 , TVF is fully symmetric and thus P is identical to zero for any radial flow α (Figure 6(1c)).
However, a finite axial flow R e 0 destroys the symmetry in u ( z ) of TVF and thus P > 0 . A positive radial outward directed flow α > 0 has the tendency to increase the symmetry of TVF, which has been destroyed by finite R e . Consequently, P decreases with larger α . This effect is observed for any R e as it becomes stronger with increasing  R e (Figure 6(2d)). For all, here studied R e , one observes a small increase in P for small/moderate α 2 before decreasing with larger α (Figure 6c).
In contrast to TVF, the helical SPIs are already asymmetric for R e = 0 (in Figure 6(1b) only L1-SPIs are presented, as R1-SPIs have identical properties for R e = 0 ). Either inward directed radial flow α < 0 as well as a moderate outward radial flow α > 0 increases the asymmetry P of L1-SPI. Only for sufficiently strong α 6 the asymmetry parameter P decreases (Figure 6c) and L1-SPI becomes more symmetric again. This is a similar effect as seen for TVF and can be explained by the fact that with larger α the flow structures (e.g., velocity profiles) are pushed towards the outer cylinder. As a result, there is less space in radial direction to allow for different (re-)circulation in the bulk. Qualitatively, R1-SPI (here only stable existing for R e = 5 with α [ 0 , 4 ] ) illustrates the same behavior, whereby the magnitude and range of the velocity profiles u ( z ) are smaller compared with L1-SPI. This can be explained by the direction of R e , which is opposite directed to the natural propagating direction of R1-SPI. Thus, R1-SPI is fighting against the wind of R e resulting in only a small stable range in α (see also Figure 2).
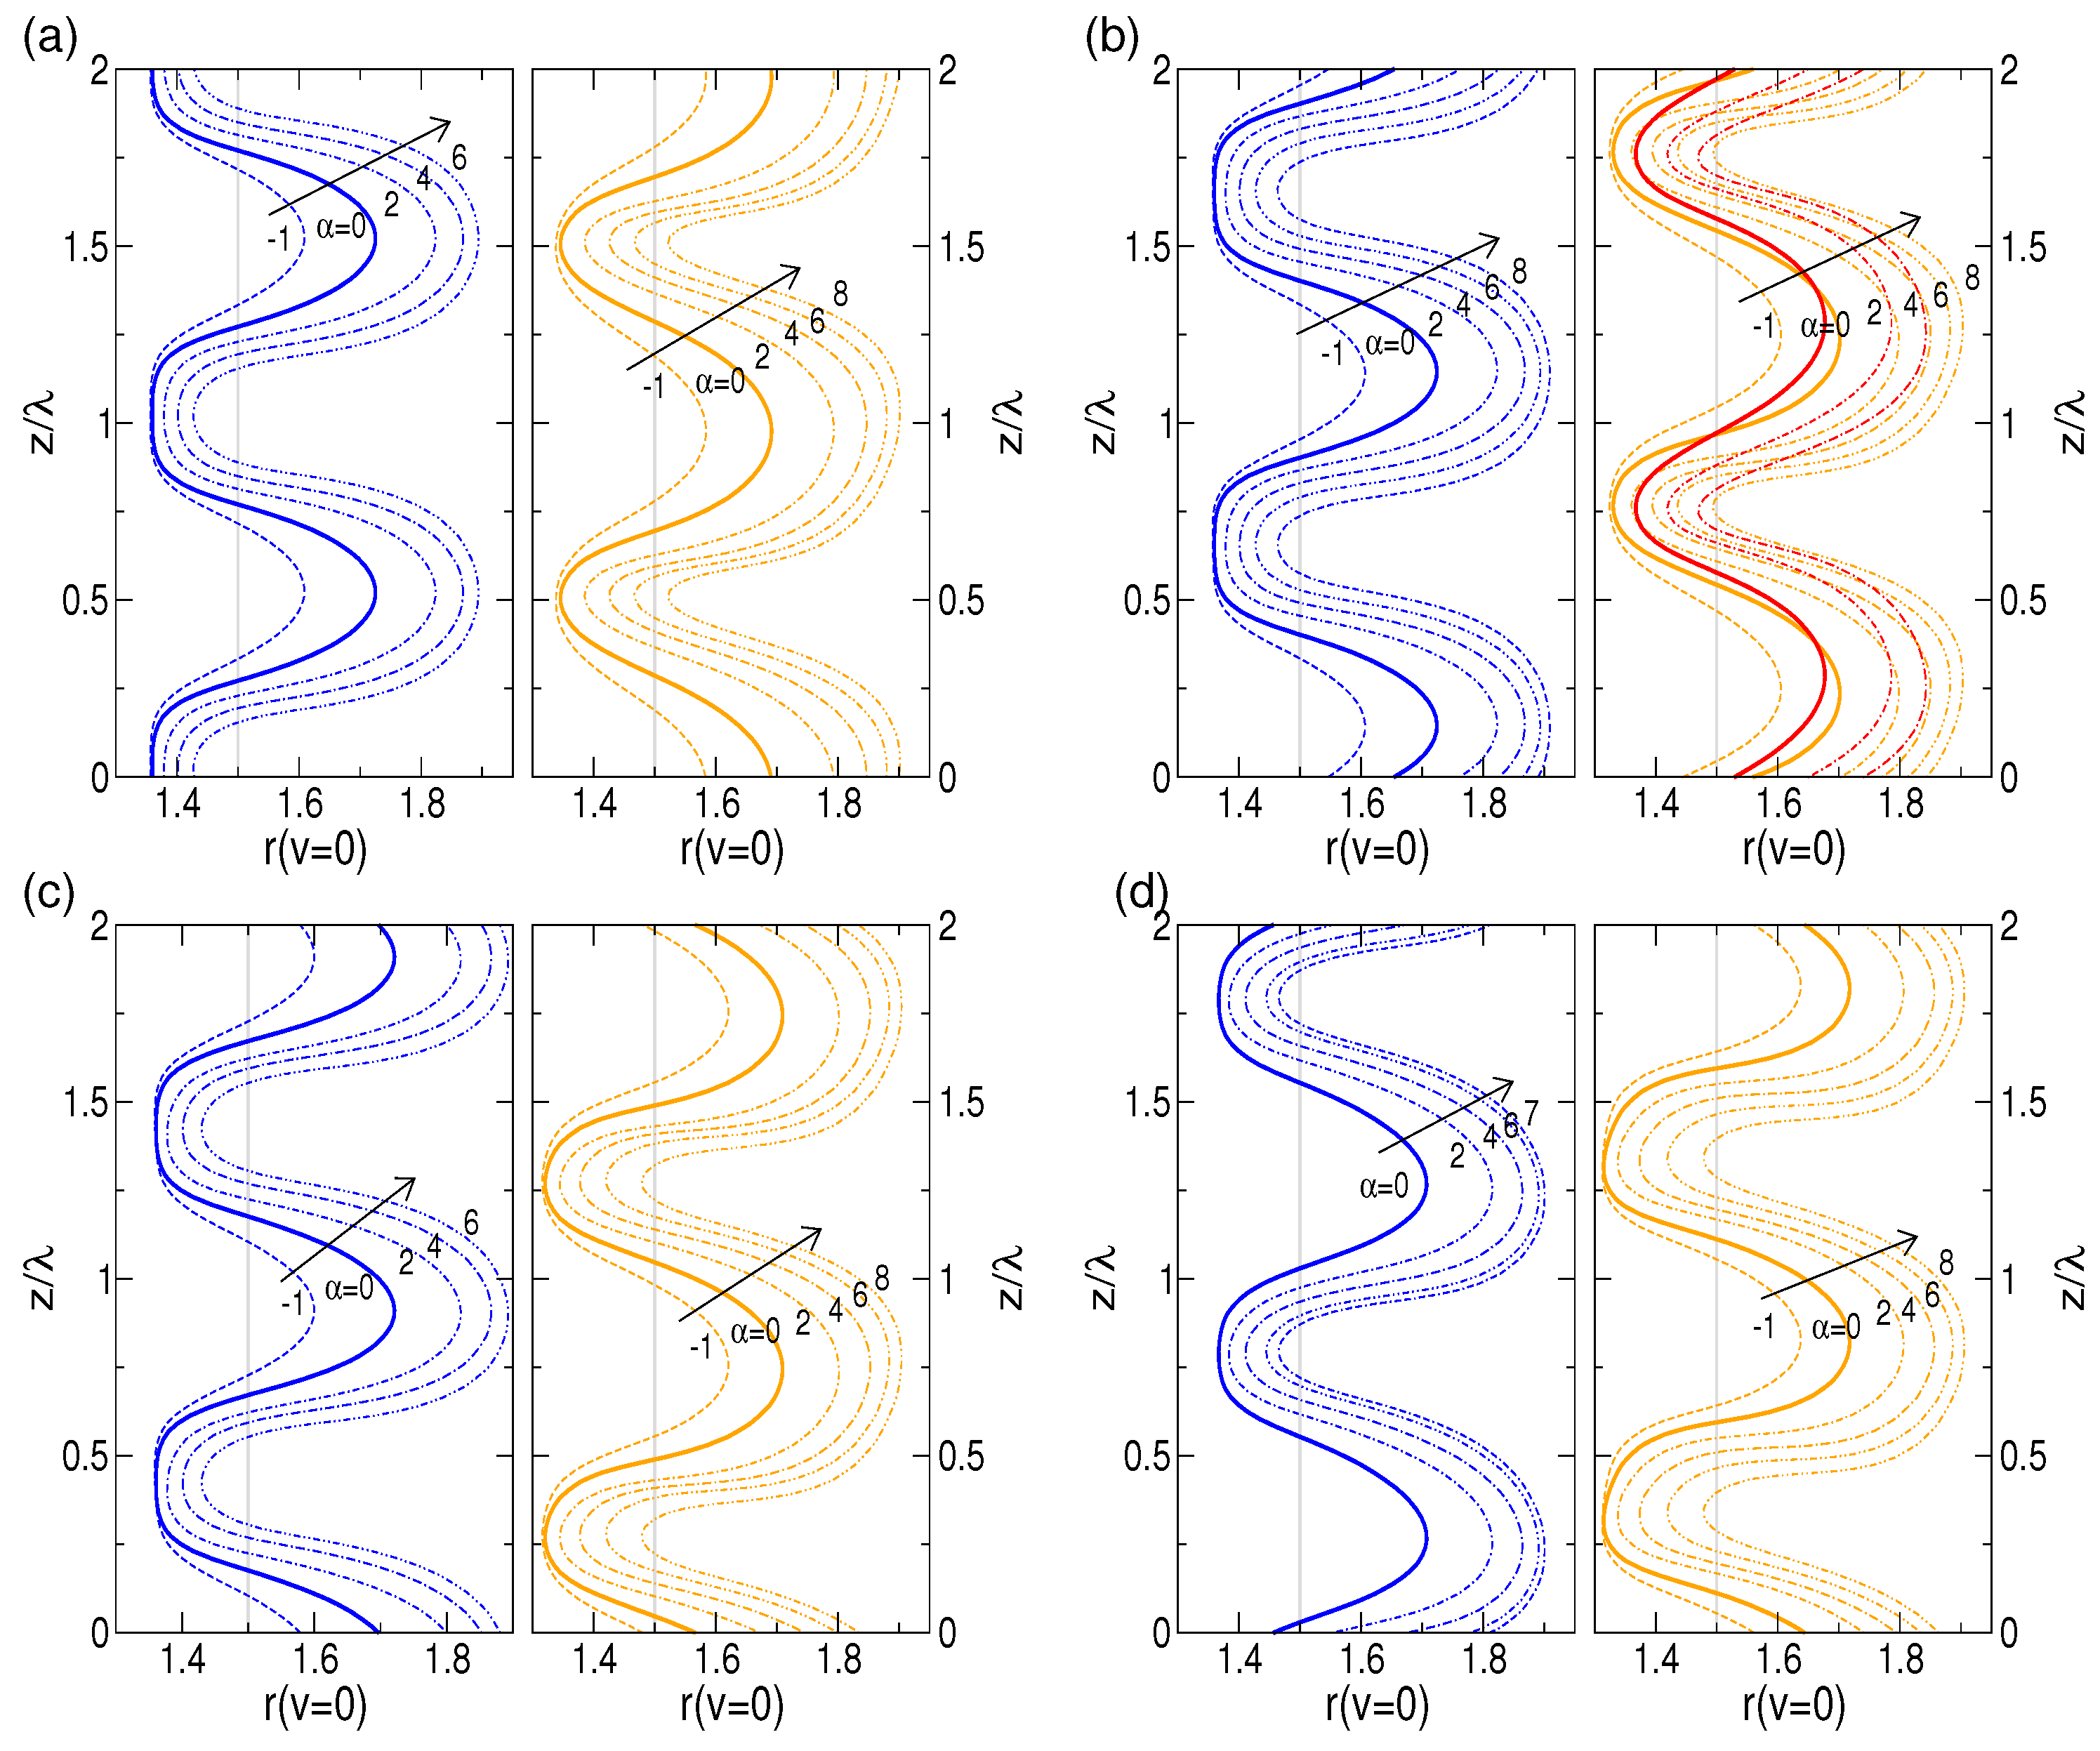
Another possibility to quantify the degree of anharmonicity δ = Δ I N / Δ O U T of the vortex flow is to use the ratio Δ I N / Δ O U T (see also Figure 5) between inflow and outflow regions in the gap [47]. Figure 7 illustrates the variation in width for Δ I N and Δ O U T as well the ratio δ for the same parameters shown in Figure 6. The velocity contour profiles shown in Figure 8 confirm the outward move of the dominant flow structure towards the outer cylinder with increasing α .
For any R e , the degree of anharmonicity δ decreases with increasing α (see also velocity profiles in Figure 6). While for TVF, mainly δ > 1 (except R e = 20 & α = 7 ), i.e., the inflow region is larger than the outflow region, for L1-SPI one detects δ < 1 for sufficiently strong radial flow α , depending on R e . This is a direct effect of larger α that forces this increase in Δ O U T . For R e = 5 (Figure 7b) R1-SPI loses stability at α 6 when δ 1 and transitions to TVF. All in common, the values of δ for the L1-SPI (and R1-SPI) remain lower than those for TVF.

3.4.2. Axial Mean Flow

As seen in Figure 2 L1-SPI [R1-SPI] reverts its propagation direction at R e [ ] 9.6 . This is a result of the through-flow enforced reversal of the phase velocity that destabilizes the SPI that propagates at small R e in the opposite direction, i.e., against the wind of the external applied through-flow R e .
Figure 9 shows how the radial profiles of the mean axial flow,
w 0 ( r ) = 1 2 π 0 2 π w ( r , θ , z , t ) d θ ,
of the different flow structures depend on R e and α . In the absence of axial through flow ( R e = 0 ) the mean axial flow for TVF is virtually unaffected by variation in α , it remains zero. In contrast, variation in α affects both mirror symmetric states of L1-SPI and R1-SPI in two ways. Increasing α results first in shifting the extreme of w 0 ( r ) into the center of the bulk towards the outer cylinder. Second, it enforces the absolute maxim of w 0 ( r ) (Figure 9a). For any finite axial through flow R e 0 , the mean profiles w 0 ( r , R e 0 ) of TVF are modified qualitatively in a similar way. Increasing α decreases the maximum values while, at the same time, the position of the extreme is moved outwards towards the outer cylinder.
Similar also the extreme of the profiles for L1-SPI (natural propagating into the direction of the external Through-flow R e ) are moved radial outwards with larger α , whereby the maximum values mainly increase (in contrast to TVF) and only large radial flow α = 8 become stagnated Figure 9b) or eventually slightly decrease (Figure 9c,d). It is remarkable that for larger R e and with increasing α the profiles w 0 ( r , R e 0 ) of the helical state L1-SPI become more and more similar to the profiles w 0 ( r , R e 0 ) of TVF. Main difference is the fact that the extreme are located at different radial positions, closer to the inner cylinder for L1-SPI and closer to the outer cylinder for TVF. This observation is also in agreement with the former described decrease in the asymmetry parameter P (Equation (12)) for L1-SPI at large values R e and α (Figure 6c), i.e., the flow becomes more symmetric again.
For the R1-SPI (Figure 9b) naturally propagating in the opposite direction as the external through-flow at R e = 0 , the maximal mean flow w 0 ( r ) is also moved radial towards the outer cylinder. Thereby, the extremes of R1-SPI are always much further outside than the corresponding one of L1-SPI. Moreover, the maximum values monotonically decrease with larger α similar to TVF.

3.5. Unstable States

As seen in the bifurcation diagrams in Figure 3 for some parameters the system is indefinite illustrating heteroclinic cycles, i.e., an alternating switch, between unstable solutions of [mw]SPI and [mw]TVF, respectively. Such cycles have been detected before for alternating transition between different ribbon solutions [31].
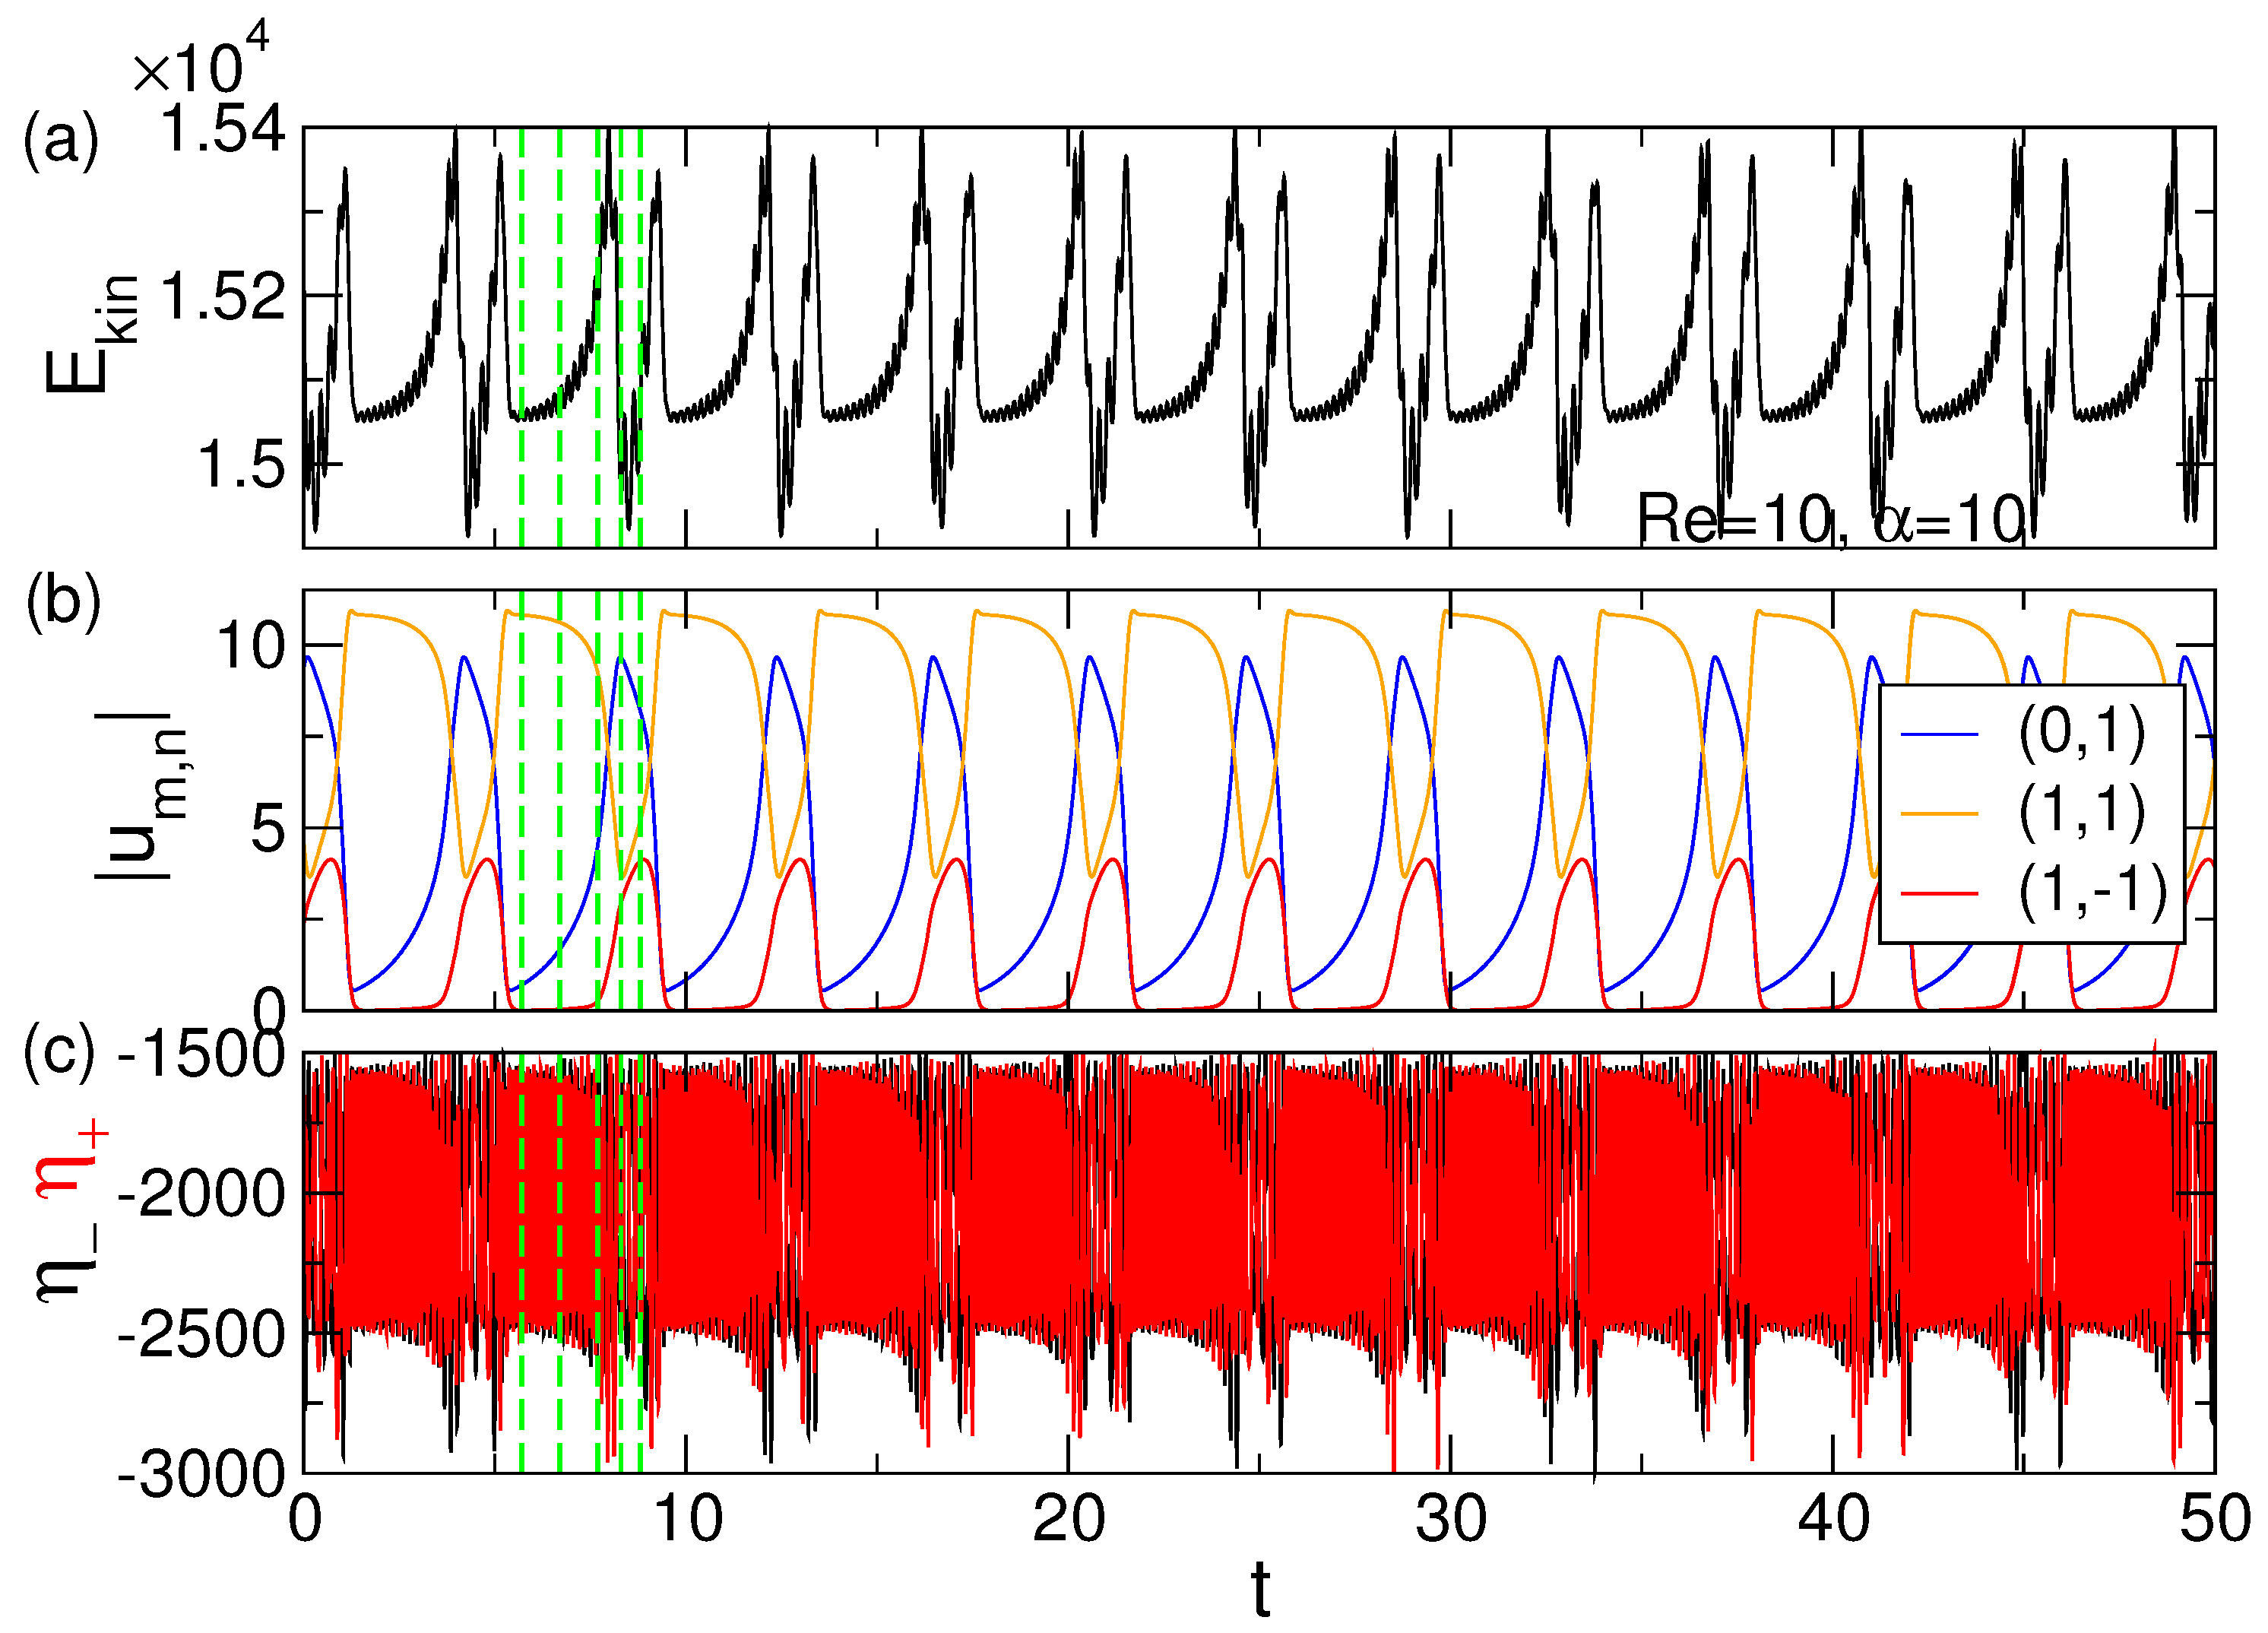
Exemplary Figure 10 shows time series visualizating the periodic change (switch) between L1-SPI and 1-wTVF at R e = 10 , α = 10 . Illustrated are global modal kinetic energy E k i n , dominant mode amplitudes | u m , n | together with local measures of the azimuthal vorticity η ± . There is a fixed alternating/period time, τ a , that only changes with modification in external parameters, e.g., α or R e . The larger α ( R e fixed) the shorter the time becomes that the flow remains in the unstable L1-SPI, before eventually transitioning into 1-mwTVF t at sufficiently strong α . Both time series of E k i n and in particular η ± suggest the heteroclinic cycle to be of an oscillatory type. Therefore, the oscillation amplitude in E k i n (and η ± ) changes within a single period. Initially being relatively small in L1-SPI it grows monotonically until being the largest when 1-mwTVF is present.
The main dynamics during the transition from L1-SPI toward 1-mwTVF (Figure 11) can be described as breakup and reconnection process of vortex pairs in the axial direction (see also Figure 12). First, the vortex pairs of L1-SPI start to meander and relocate in its axial position (direction), while moving closer together, which results in stretch and compression in the annulus. With increasing time, this oscillation and compression increase with the result that two vortex pairs of different levels connect and eventually breakup. Finally, the sections of the broken vortex pairs re-connect at the same level, forming the toroidally closed vortex structure 1-mwTVF. This process repeats as long as no other external parameters, e.g., α or R e are changed. Heteroclinic connections between different solutions are not uncommon and has been studied in various systems [48,49,50,51,52] in the past. As clearly visible in Figure 10, the modal kinetic energy E k i n shows two peak maxim during one period. The first at the formation of 1-mwTVF (Figure 12 between (3)–(4)) and the second at the elimination of 1-mwTVF, respectively. Both energy maxima appear at the points of breakup in the vortex structures. First, when the helical vortex structure breaks up (L1-SPI to 1-mwTVF) and second when the toroidal vortex structure breaks up (1-mwTVF to L1-SPI). As expected, at these points, the variations in η ± are also the largest.
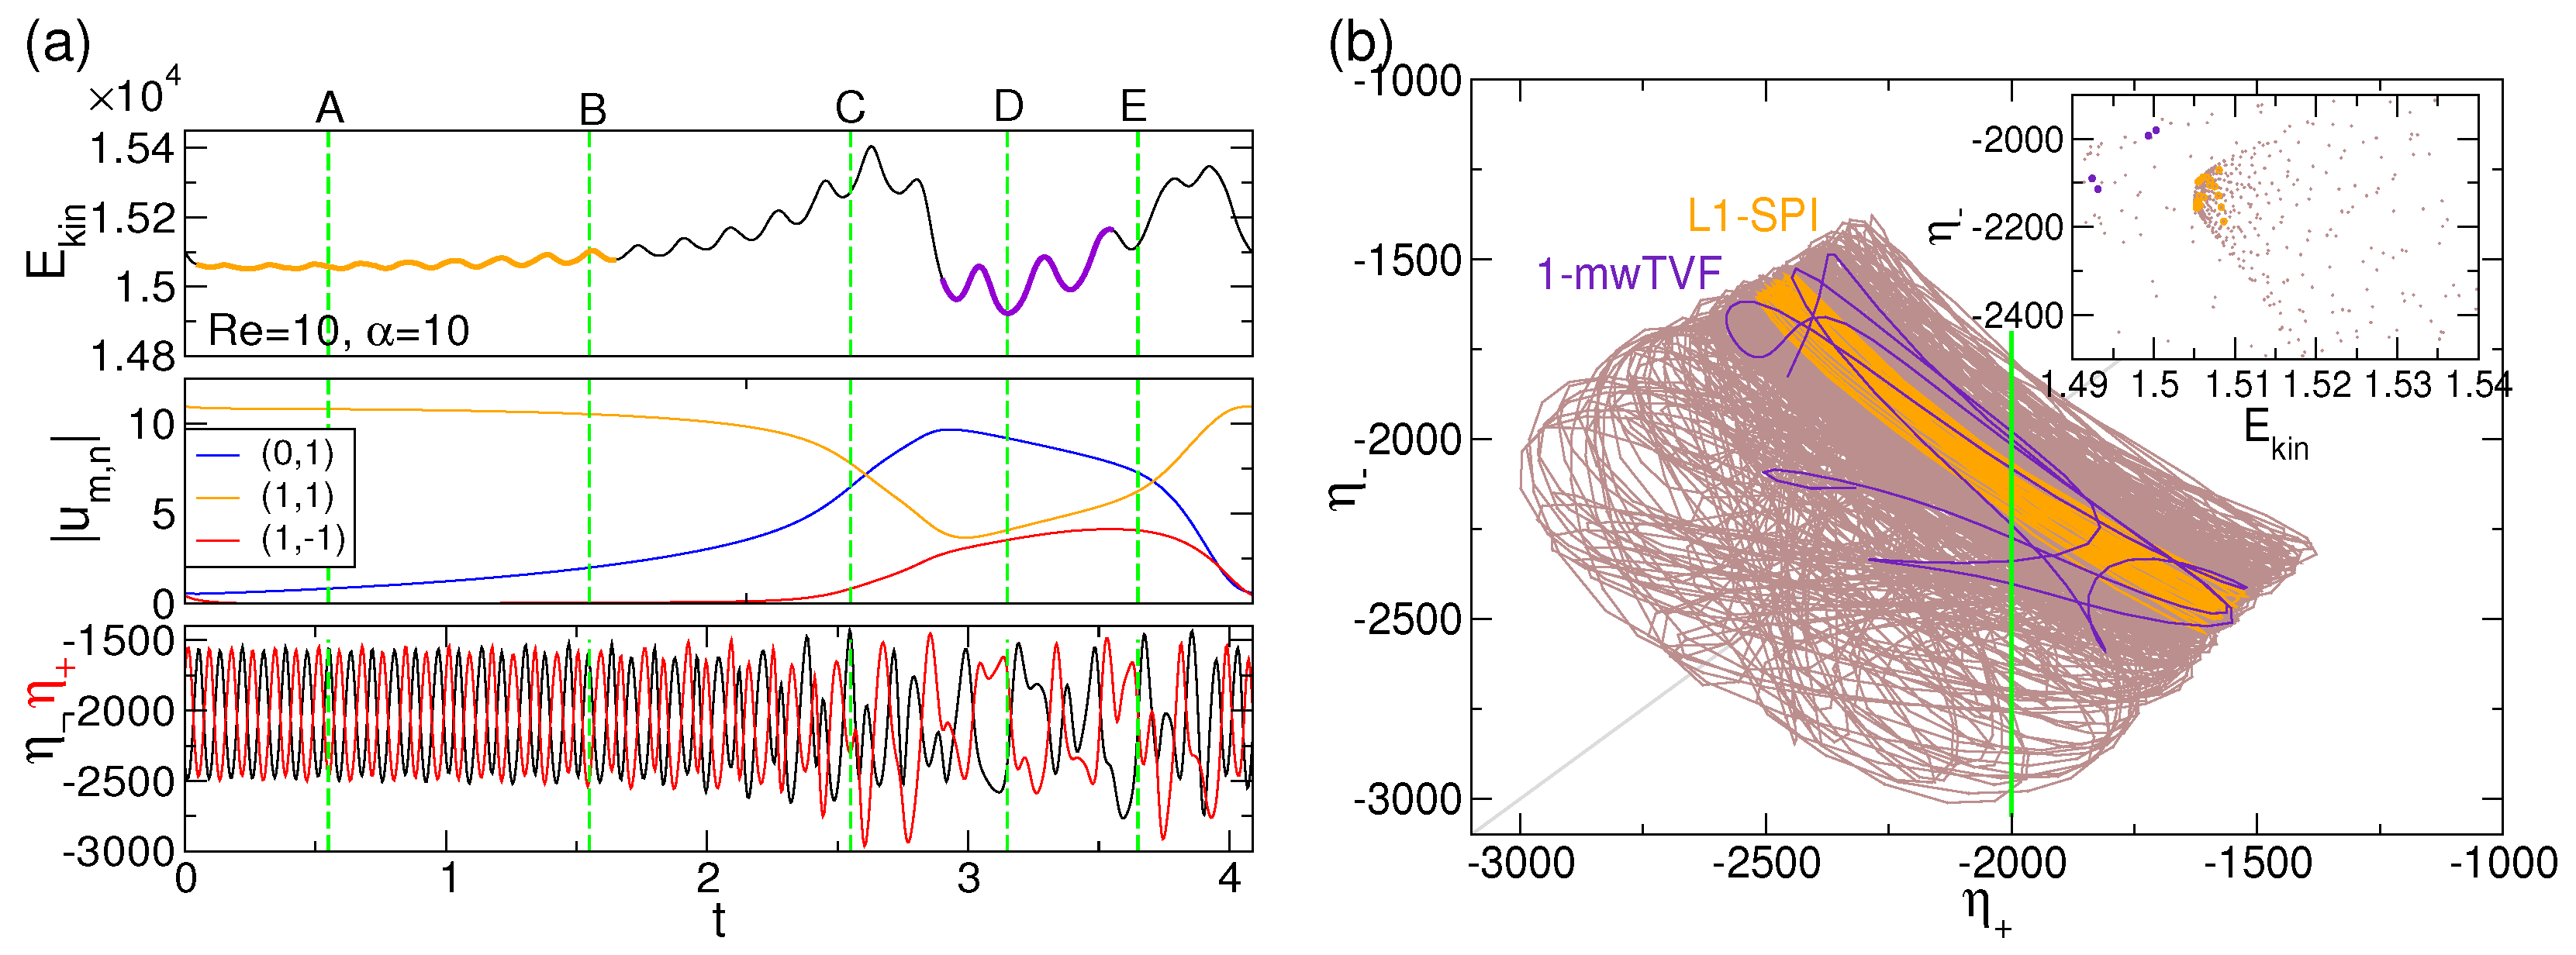
The phase portrait (Figure 11b) spanned by η + , and η illustrates the oscillatory type of connections. For better visibility the same color code is used in Figure 11a,b. Although L1-SPI is classical a limit cycle (periodic, 1-torus), due to the oscillatory type of connection it appears as quasi-periodic (2-torus) solution. This is the best visible in the corresponding Poincaré section ( η , E k i n ) , where a more or less closed circle can be detected for L1-SPI. In principle, the same also holds for 1-mwTVF; however, as τ a is quite short, and considering the phase trajectory explores a wider range in space, only a few points appear. The Poincaré section ( η , E k i n ) shows a cone-like structure indicating that the system is (oscillatory) approaching L1-SPI for most of the time.
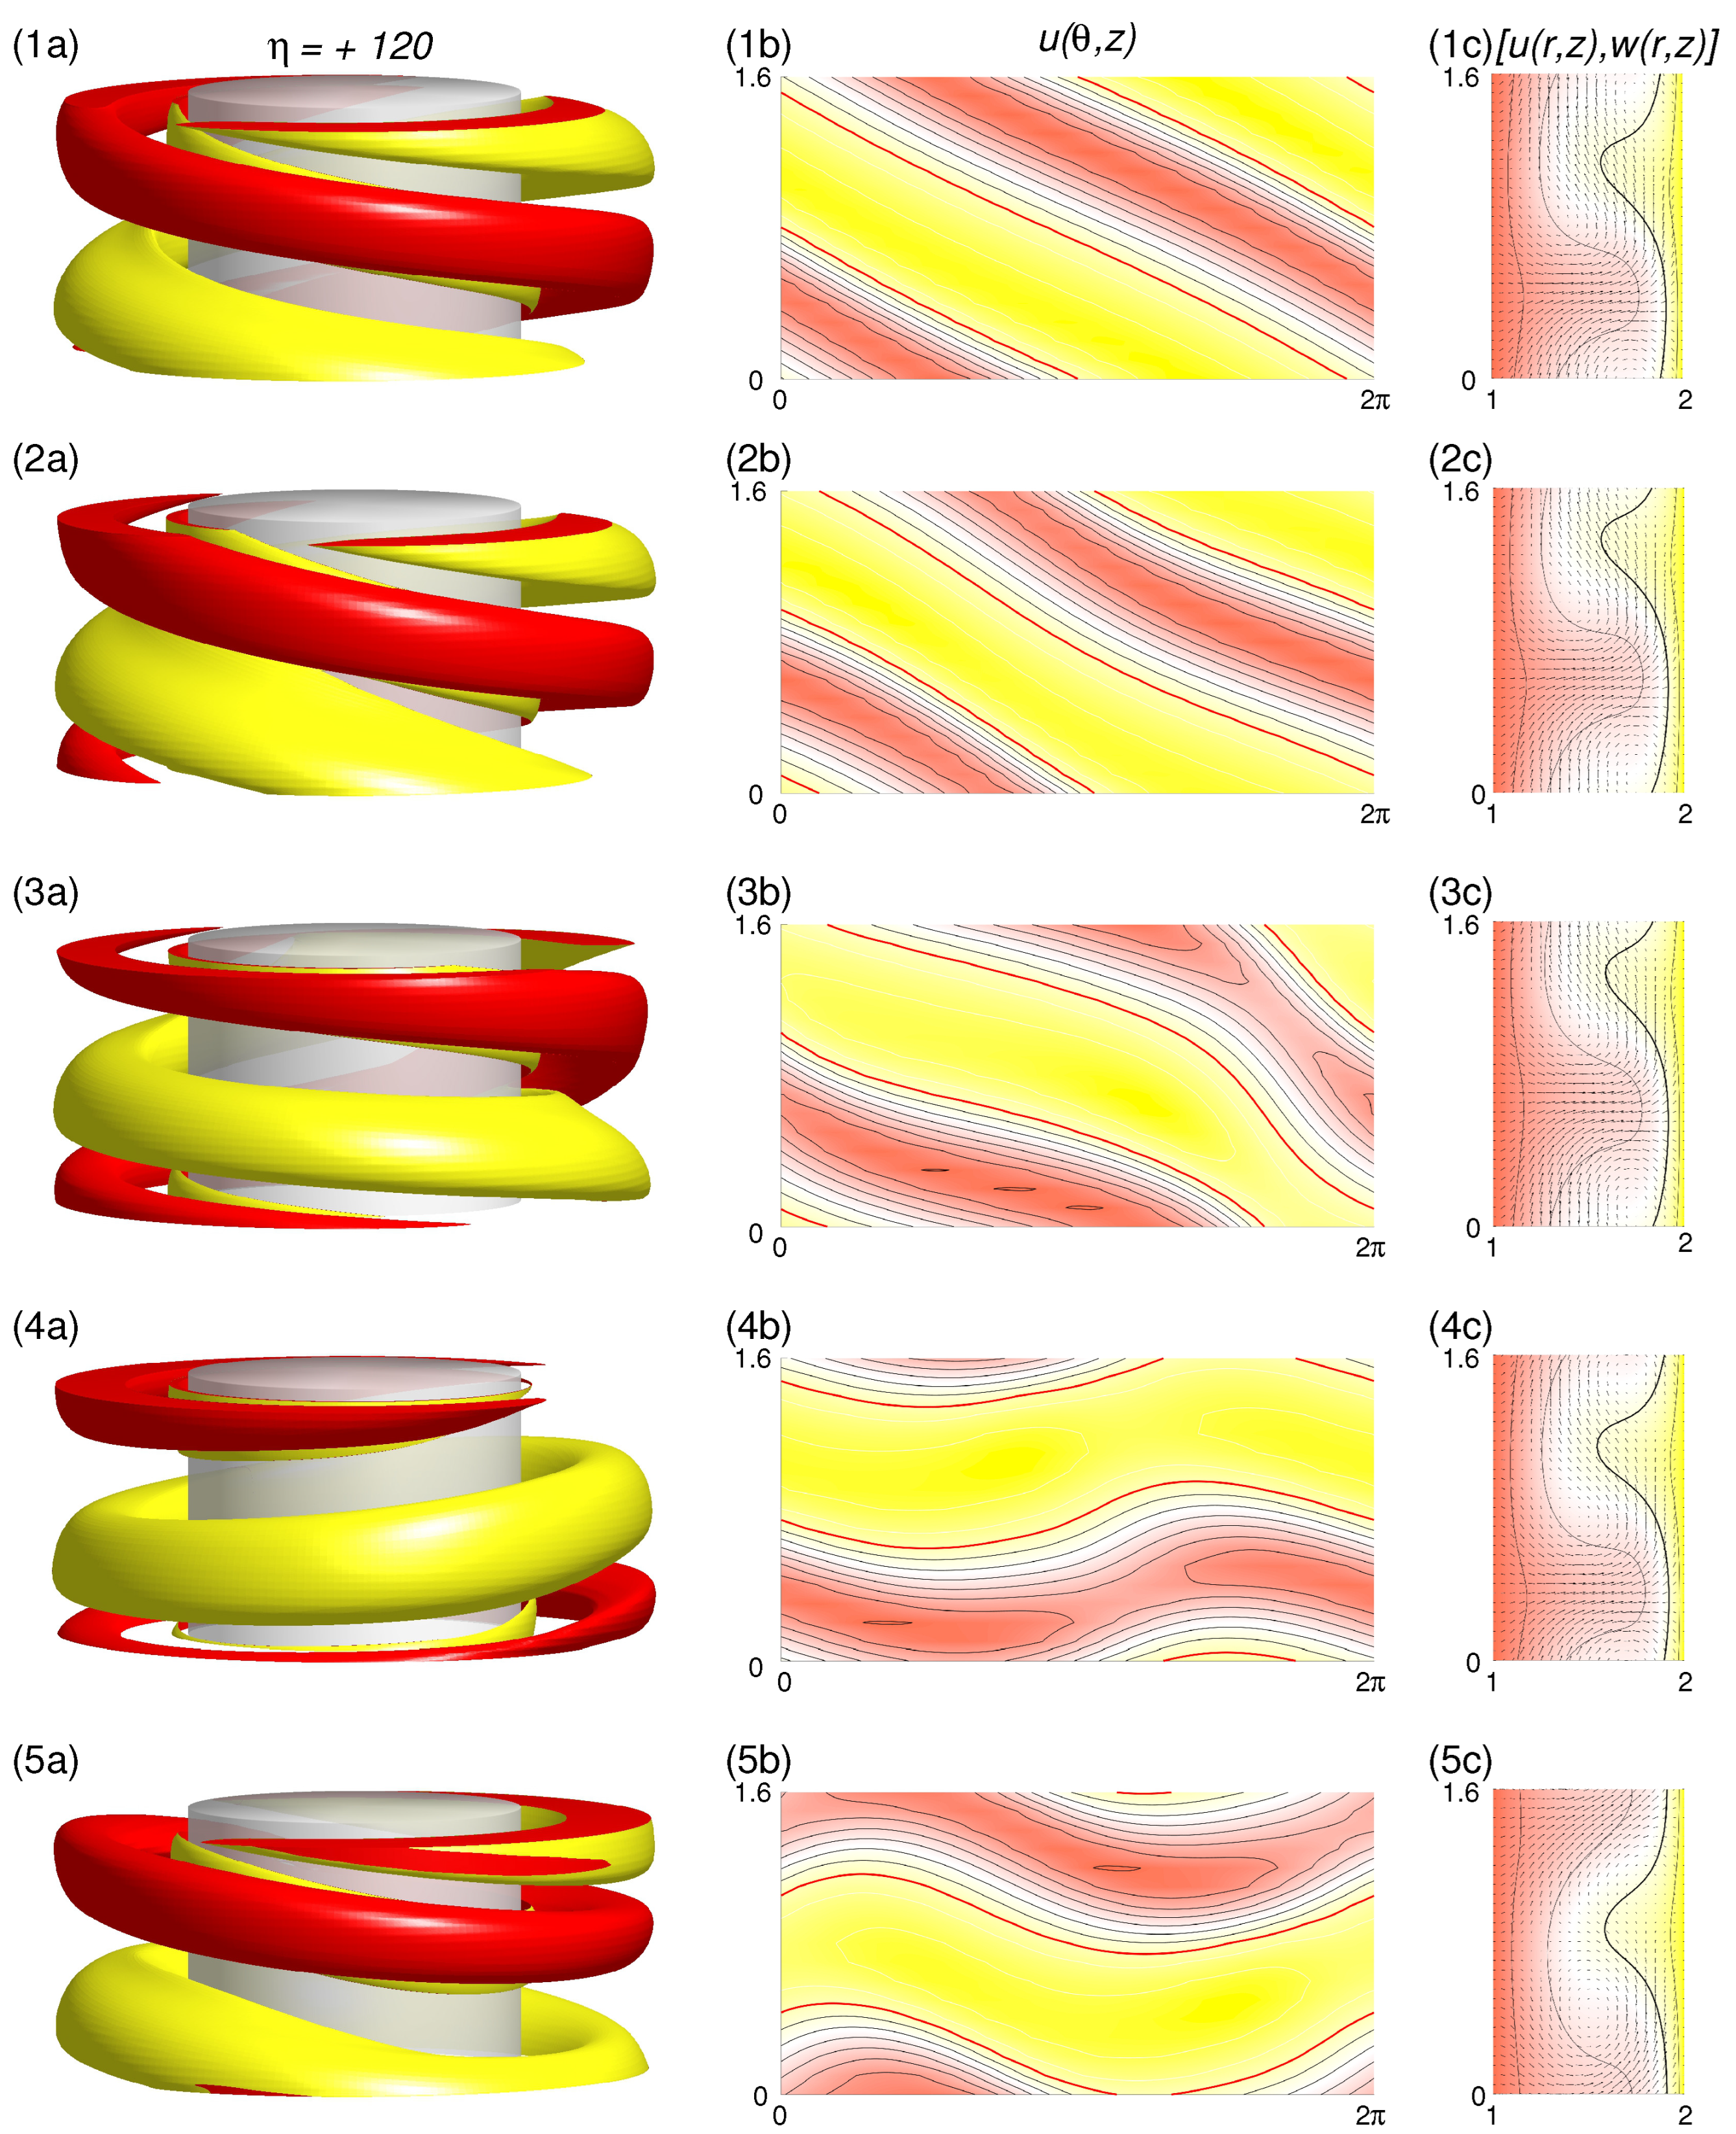
Further visualization of the distinctive flow structures appearing during the heteroclinic connection are presented in Figure 12 (times indicated (A)–(E) in Figure 11a). Both the vorticity η ( 1 ) and the radial velocity u ( θ , z ) ( 2 ) highlights the dominant contributions. The helical left-winding shape with dominant m = 1 mode can be observed for L1-mwSPI (Figure 12 ( 1 ) ) as well as the toroidally closed structure with dominant m = 0 mode for 1-mwTVF (Figure 12 ( 4 , 5 ) ). Starting with only minor modulated L1-mwSPI ( 1 ) (no pure L1-SPI due to always present and finite higher stimulated azimuthal modes m) the wavy-like modulation increases (2)–(3) before the helical orientated vortex tubes eventually break up and reconnect on the same level to form the toroidally closed structure of 1-mwTVF.
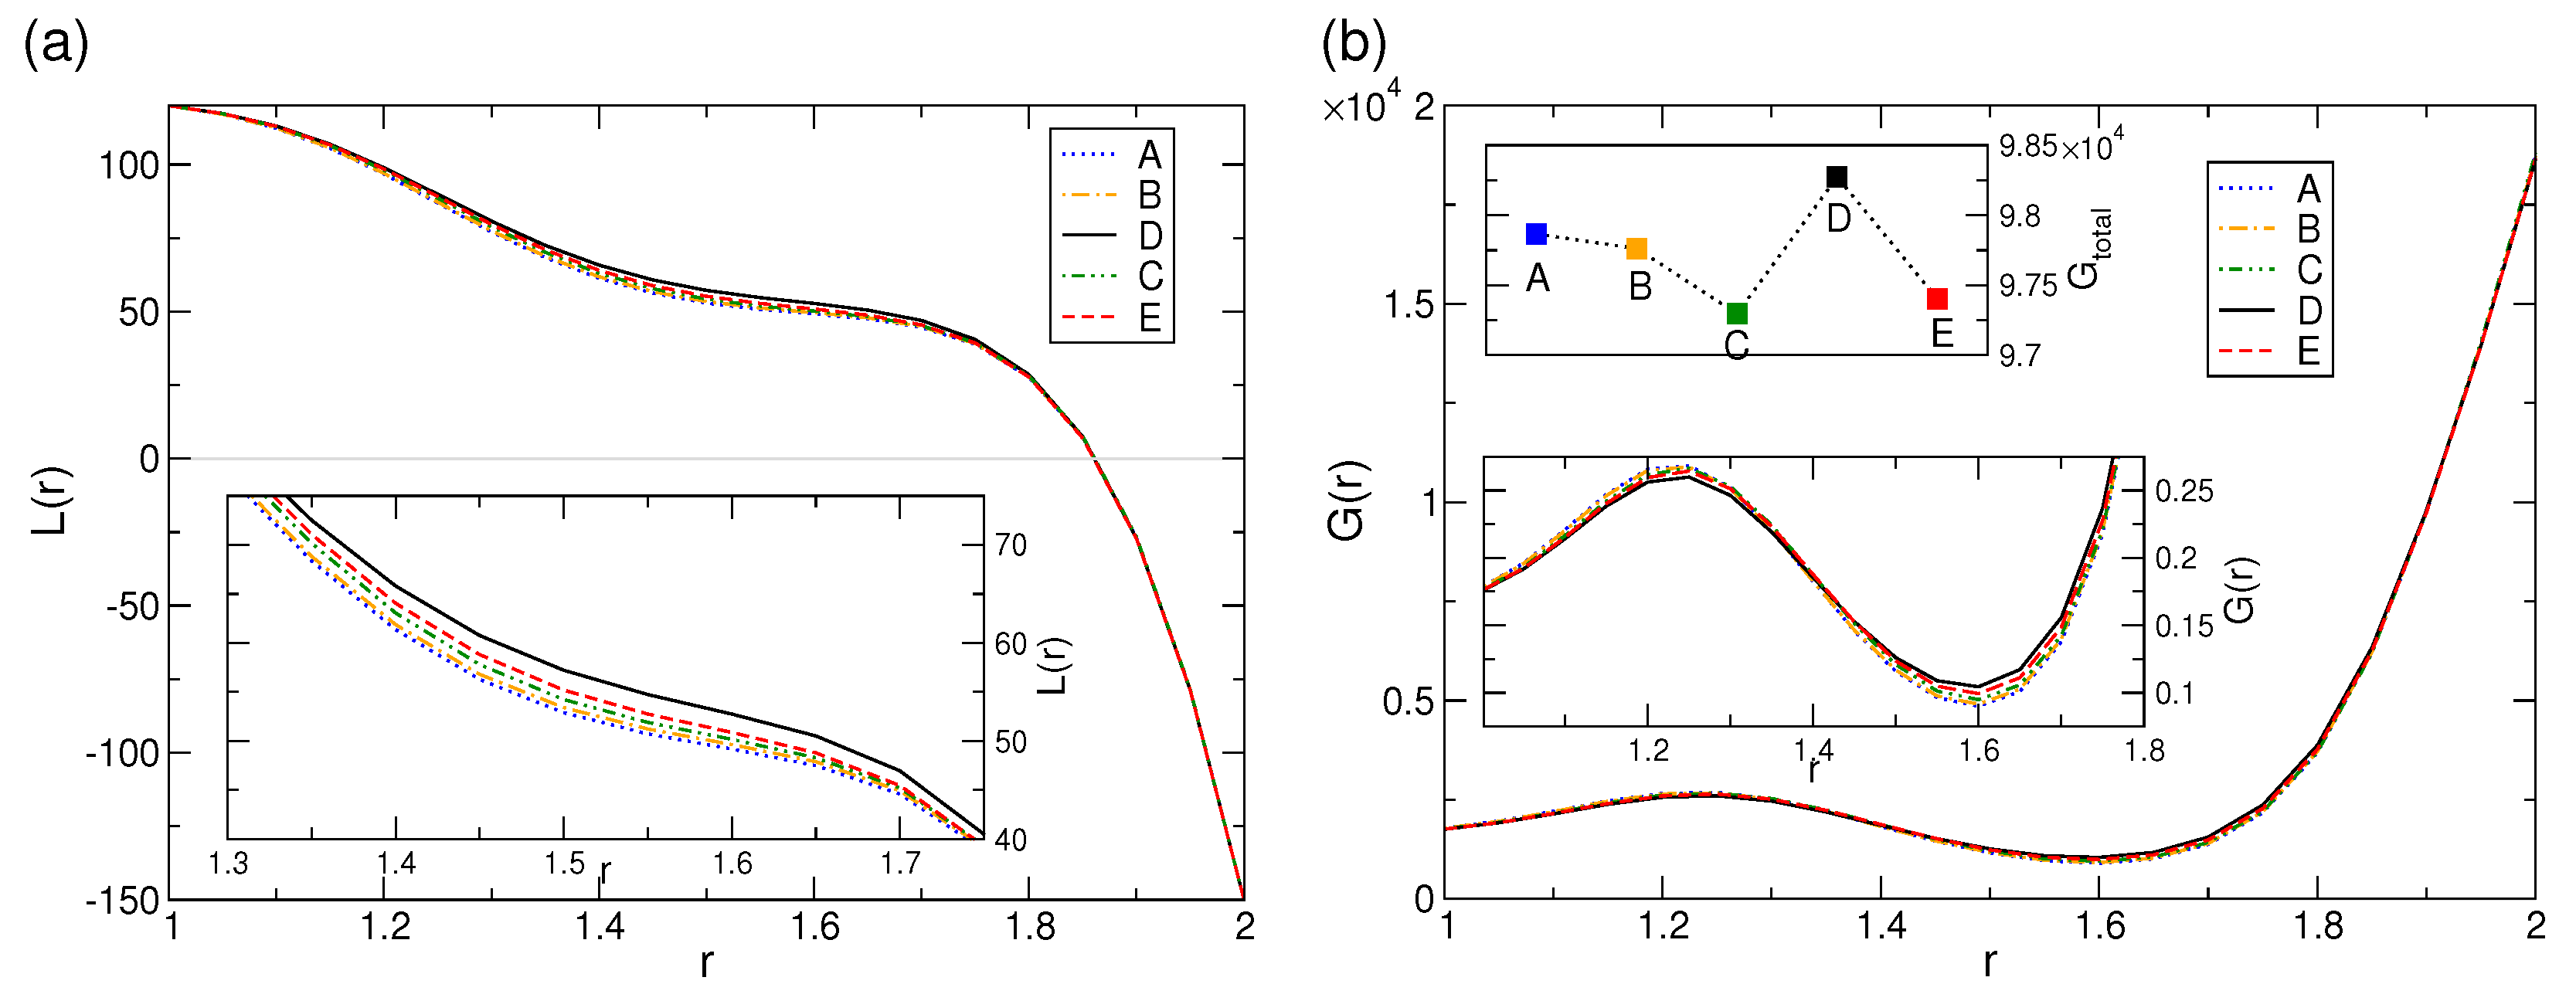
To further characterize the modification due to interaction of radial and axial flow, we examine the behavior of the angular momentum and torque within the heteroclinic connection. Figure 13a shows the mean (axially and azimuthally averaged) angular momentum L ( r ) = r v ( r ) θ , z / R e i , as a function of the radius r for the same instances of time as indicated (A)–(E) in Figure 11a). All curves show one main characteristic. In general, the angular momentum curves follow a monotonically varying trend. The profiles indicate typical behavior in that positive angular momentum decreases outward from the rotating inner cylinder to the counter-rotating outer cylinder. The angular momentum decreases with almost constant slope from the inner to the outer cylinder while showing a pronounced plateau-like shape in the bulk center region. Virtually all the differences are minor and the curves fall on top of each other, except for ( D ) when the flow appears to be in the unstable 1-mwTVF. Here, L is larger in general, and in particular in the center region. Figure 13b shows the corresponding variation of the dimensionless torque G = ν J w within the annulus. In calculating the torque, we used the fact that for a flow between infinite cylinders, the transverse current of the azimuthal motion, J ω = r 3 [ u ω A , t ν r ω A , t ] (with . . . A r d θ d z 2 π r l ), is a conserved quantity [53]. As seen for L ( r ) , the different curves almost fall on top of each other, with the same exception for ( D ) . Other than the angular momentum, the profiles of G ( r ) do not show a monotonically varying trend. G ( r ) increases near the inner cylinder, hereafter decreasing within the bulk to reach a minimum at about 0.6 d before finally strongly increasing towards the outer cylinder. More important evidence for the different dynamics can be seen in the total torque G total (inset in Figure 13b), which is monotonically increasing except at ( D ) when the flow structure of 1-mwTVF is present. This obvious difference in G total illustrates the differences in mass flow within the two topological different flow states, L1-mwSPI and 1-mwTVF, respectively.

Torque Variation with α

As seen before, the total torque G total undergoes strong changes within the heteroclinic connection, while changing between L1-mwSPI and 1-mwTVF. Figure 14 shows the dependence of G total with variation in α for different selected R e for the different main flow structures L1-SPI, R1-SPI and TVF.
Common features for all flow structures (L1-SPI, R1-SPI, and TVF) at any R e is the monotonically increasing G total with increasing α . In the absence and only moderate R e , the total torque G total for the helical state L1-SPI is always larger than for its corresponding toroidal closed cousin state TVF. Moreover, in absence ( R e = 0 ) and for small axial flow ( R e = 5 ), the total torque, G total , for the L1-SPI, is always larger than for 1-mwTVF. L1-SPI and R1-SPI differ due to the fact that one is blowing with the additional external applied R e , while for the other R e appears as headwind against which the flow structure is fighting against. The latter is the main reason for the narrow stable existence region of R1-SPI. However, at moderate R e = 10 , the curves for L1-SPI and 1-mwTVF basically fall together, before at larger numbers R e the situation becomes just inverted. Here the total torque G total of TVF is always larger than the one of its counterpart 1-mwTVF. For inward directed radial flow α < 0 the total torque shows first a stronger decrease, and second that G total is virtual indistinguishable between both flows.

4. Conclusions

In this paper, we have numerically investigated the combined effect of an externally imposed axial mass flux (axial pressure gradient, axial through flow R e ) together with a radial muss flux ( α ) in a wide gap Taylor–Couette flow with counter-rotating cylinders. This results in a more detailed picture of the effect of additional, combined imposed mass flux and its interaction on various solutions with modification of their spatio-temporal properties. The main results can be summarized as follows.
(1)
The ( R e , α ) parameter space (Figure 4) illustrates a very rich variety of flow structures.
(2)
For any finite axial through flow R e 0 an increase in α initial decreases the symmetry before it eventually increases the symmetry of the flow states, TVF and SPI (Figure 6). Similarly, the degree of anharmonicity δ = Δ I N Δ O U T decreases with increasing α for all (pure) states (Figure 7). Interestingly, with increasing α , the axial mean flow for helical SPI, natural propagating in the direction of the applied external axial flow R e becomes closer to the profile of toroidal TVF (Figure 9).
(3)
Depending on various system parameters, heteroclinic connections between two topological different unstable solutions (1-mwTVF↔1-mwSPI) are found. The connection between these states appears to be of oscillatory type.
(4)
Combination R e and α can result in significant enhancement in torque G total for different flow states, allowing for better selection between them (Figure 14).
The results presented in this study regarding spatio-temporal properties of velocity and vorticity fields of various flow states may open new perspectives in the study of transport properties of counter-rotating Taylor–Couette flow.

Funding

This work has been financed by the Spanish Governments under grant PID2019-105162RB-I00.

Informed Consent Statement

Not applicable.

Data Availability Statement

Not applicable.

Acknowledgments

S. A. is a Serra Húnter Fellow.

Conflicts of Interest

The author declares no conflict of interest.

Nomenclature

References

  1. Taylor, G.I. Stability of a viscous liquid contained between two rotating cylinders. Philos. Trans. R. Soc. Lond. A 1923, 223, 289. [Google Scholar]
  2. Chossat, P.; Iooss, G. The Couette–Taylor Problem; Springer: Berlin, Germany, 1994. [Google Scholar]
  3. Yin, J.; Liu, X.; Zhou, C.; Zhu, Z. Analysis and measurement of mixing flow field on side wall of large-scale mixing tank. Chem. Eng. 2021, 49, 73–78. [Google Scholar]
  4. Zhu, J.; Liu, D.; Tang, C.; Chao, C.Q.; Wang, C.L. Study of Slit Wall Aspect Ratio Effect on the Taylor Vortex Flow. J. Eng. Thermophys. 2016, 37, 1208–1211. [Google Scholar]
  5. Hallström, B.; Lopez-Leiva, M. Description of a rotating ultrafiltration module. Desalination 1978, 24, 273. [Google Scholar] [CrossRef]
  6. Kroner, K.H.; Nissinen, V. Dynamic filtration of microbial suspension using an axially rotating filter. J. Membr. Sci. 1998, 36, 85. [Google Scholar] [CrossRef]
  7. Belfort, G.; Pimbley, J.M.; Greiner, A.; Chung, K.Y. Diagnosis of membrane fouling using a rotating annular filter. 1. cell culture media. Membr. Sci. 1993, 77, 1. [Google Scholar] [CrossRef]
  8. Belfort, G.; Mikulasek, P.; Pimbley, J.M.; Chung, K.Y. Diagnosis of membrane fouling using a rotating annular filter. 2. dilute particule suspension of known particle size. J. Membr. Sci. 1993, 77, 23. [Google Scholar] [CrossRef]
  9. Wereley, S.T.; Akonur, A.; Lueptow, R.M. Particle-fluid velocities and fouling in rotating filtration of a suspension. J. Membr. Sci. 2002, 209, 469. [Google Scholar] [CrossRef]
  10. Ohashi, K. Rotation-induced Taylor vortex enhances filtrate flux in plasma separation. Trans. Am. Soc. Artif. Intern. Organs 1988, 34, 300. [Google Scholar]
  11. Lueptow, R.M.; Hajiloo, A. Flow in a rotating membrane plasma separator. Trans. Am. Soc. Artif. Intern. Organs 1995, 41, 182. [Google Scholar] [CrossRef]
  12. Beaudoin, G.; Jaffrin, M.Y. Plasma filtration in couette flow membrane devices. Artif. Organs 1989, 13, 43. [Google Scholar] [CrossRef] [PubMed]
  13. Aziz, M.; Owis, F.; Abdelrahman, M. Preliminary design of a transonic fan for a low by-pass turbofan engine. Int. Rev. Aerosp. Eng. 2013, 6, 114–127. [Google Scholar]
  14. Hassan, H.Z.; Gobran, M.H.; El-Azim, A.A. Simulation of a transonic axial flow fan of a high bypass ratio turbofan engine during flight conditions. Int. Rev. Aerosp. Eng. 2014, 7, 17–24. [Google Scholar] [CrossRef]
  15. Lei, M.; Li, M. High-Performance Manufacturing Principle and Application of Thrust Bearings of Primary Pump in Nuclear Power Plant. China Nucl. Power 2020, 13, 592–598. [Google Scholar]
  16. Giordano, R.C.; Giordano, R.L.C.; Prazeres, D.M.F.; Cooney, C.L. Analysis of a Taylor–Poiseuille vortex flow reactor–I: Flow patterns and mass transfer characteristics. Chem. Eng. Sci. 1998, 53, 3635–3652. [Google Scholar] [CrossRef]
  17. Giordano, R.L.C.; Giordano, R.C.; Prazeres, D.M.F.; Cooney, C.L. Analysis of a Taylor–Poiseuille vortex flow reactor–II: Reactor modeling and performance assessment using glucose-fructose isomerization as test reaction. Chem. Eng. Sci. 2000, 55, 3611–3626. [Google Scholar] [CrossRef]
  18. Resende, M.M.; Tardioli, P.W.; Fernandez, V.M.; Ferreira, A.L.O.; Giordano, R.L.C.; Giordano, R.C. Distribution of suspended particles in a Taylor-Poiseuille vortex flow reactor. Chem. Eng. Sci. 2001, 56, 755–761. [Google Scholar] [CrossRef]
  19. Resende, M.M.; Vieira, P.G.; Sousa, R., Jr.; Giordano, R.L.C.; Giordano, R.C. Estimation of mass transfer parameters in a Taylor–Couette-Poiseuille heterogeneous reactor. Braz. J. Chem. Eng. 2004, 21, 175–184. [Google Scholar] [CrossRef]
  20. Ostilla-Mónico, R.; Van der Poel, E.; Verzicco, R.; Grossmann, S.; Lohse, D. Exploring the phase diagram of fully turbulent Taylor–Couette flow. J. Fluid Mech. 2014, 761, 1–26. [Google Scholar] [CrossRef] [Green Version]
  21. Richter, O.; Menges, M.; Kraushaar-Czarnetzki, B. Investigation of mixing in a rotor shape modified Taylor Vortex reactor by the means of a chemical test reaction. Chem. Eng. Sci. 2009, 64, 2384–2391. [Google Scholar] [CrossRef]
  22. Deng, R.; Arifin, D.Y.; Chyn, M.Y.; Wang, C.H. Taylor vortex flow in presence of internal baffles. Chem. Eng. Sci. 2010, 65, 4598–4605. [Google Scholar] [CrossRef]
  23. Carlos Álvarez, M.; Vicente, W.; Solorio, F.; Mancilla, E.; Salinas, M.; Zenit, V.R. A study of the Taylor–Couette flow with finned surface rotation. J. Appl. Fluid Mech. 2019, 12, 1371–1382. [Google Scholar] [CrossRef]
  24. Bakhuis, D.; Ezeta, R.; Berghout, P.; Bullee, P.A.; Tai, D.; Chung, D.; Verzicco, R.; Lohse, D.; Huisman, S.G.; Sun, C. Controlling secondary flow in Taylor–Couette turbulence through spanwise-varying roughness. J. Fluid Mech. 2019, 883, 654–662. [Google Scholar] [CrossRef] [Green Version]
  25. Min, K.; Lueptow, R.M. Hydrodynamic stability of viscous flow between rotating porous cylinders with radial flow. Phys. Fluids 1994, 6, 144. [Google Scholar] [CrossRef]
  26. Chang, S.; Sartory, W.K. Hydromagnetic stability of dissipative flow between rotating permeable cylinders. J. Fluid Mech. 1967, 27, 65–79. [Google Scholar] [CrossRef]
  27. Kolyshkin, A.A.; Vaillancourt, R. Convective instability boundary of Couette flow between rotating porous cylinders with axial and radial flows. Phys. Fluids 1997, 9, 910–918. [Google Scholar] [CrossRef]
  28. Martinand, D.; Serre, E.; Lueptow, R. Absolute and convective instability of cylindrical Couette flow with axial and radial flows. Phys. Fluids 2009, 21, 104102. [Google Scholar] [CrossRef] [Green Version]
  29. Martinand, D.; Serre, E.; Lueptow, R. Linear and weakly nonlinear analyses of cylindrical Couette flow with axial and radial flows. J. Fluid Mech. 2017, 824, 438. [Google Scholar] [CrossRef]
  30. Johnson, E.C.; Lueptow, R.M. Hydrodynamic stability of flow between rotating porous cylinders with radial and axial flow. Phys. Fluids 1997, 9, 3687. [Google Scholar] [CrossRef]
  31. Altmeyer, S. Flow dynamics between two concentric counter-rotating porous cylinders with radial through-flow. Phys. Rev. Fluids 2021, 6, 124802. [Google Scholar] [CrossRef]
  32. Schwille, A. Mitra, D.; Lueptow, R.M. Design parameters for rotating cylindrical filtration. J. Membr. Sci. 2002, 204, 53. [Google Scholar] [CrossRef]
  33. Lee, S.; Lueptow, R.M. Rotating membrane filtration and rotating reverse osmosis. J. Chem. Eng. Jpn. 2004, 37, 471. [Google Scholar] [CrossRef]
  34. Masliyah, J.; Zhou, Z.J.; Xu, Z.; Czarnecki, J.; Hamza, H. Understanding water-based bitumen extraction from Athabasca oil sands. Can. J. Chem. Eng. 2004, 82, 628. [Google Scholar]
  35. Leite, R.J. An experimental investigation of the stability of Poiseuille flow. J. Fluid Mech. 1959, 5, 81. [Google Scholar] [CrossRef]
  36. Chandrasekhar, S. Hydrodynamic and Hydromagnetic Stability; Dover: New York, NY, USA, 1961. [Google Scholar]
  37. Hughes, S.; Randriamampianina, A. An improved projection scheme applied to pseudospectral methods for the incompressible Navier Stokes equations. Int. J. Numer. Methods Fluids 1998, 28, 501. [Google Scholar] [CrossRef]
  38. Mercader, I.; Batiste, O.; Alonso, A. An efficient spectral code for incompressible flows in cylindrical geometries. Comput. Fluids 2010, 39, 215. [Google Scholar]
  39. Altmeyer, S.; Hoffmann, C.; Heise, M.; Abshagen, J.; Pinter, A.; Lücke, M.; Pfister, G. End wall effects on the transitions between Taylor vortices and spiral vortices. Phys. Rev. E 2003, 81, 066313. [Google Scholar] [CrossRef] [Green Version]
  40. Peyret, R.; Taylor, T.D. Computational Methods in Fluid Flow; Springer: Berlin, Germany, 1983. [Google Scholar]
  41. Schulz, A.; Pfister, G. Physics of Rotating Fluids; Eghers, C., Pfister, G., Eds.; Springer: Berlin, Germany, 2000; Volume 549, p. 37. [Google Scholar]
  42. Altmeyer, S.; Hoffmann, C.; Heise, M.; Abshagen, J.; Pinter, A.; Pfister, G.; Lücke, M. End wall effects on the transitions between Taylor vortices and spiral vortices. Phys. Rev. E 2010, 81, 066313. [Google Scholar]
  43. Recktenwald, A.; Lücke, M.; Müller, H.W. Taylor vortex formation in axial through-flow: Linear and weakly nonlinear analysis. Phys. Rev. E 1993, 48, 4444. [Google Scholar]
  44. Altmeyer, S.; Hoffmann, C.; Lücke, M. Islands of instability for growth of spiral vortices in the Taylor–Couette system with and without axial through-flow. Phys. Rev. E 2011, 84, 046308. [Google Scholar]
  45. Pinter, A.; Lücke, M.; Hoffmann, C. Spiral and Taylor vortex fronts and pulses in axial through-flow. Phys. Rev. E 2003, 67, 26318. [Google Scholar]
  46. Hoffmann, C.; Lücke, M.; Pinter, A. Spiral vortices and Taylor vortices in the annulus between rotating cylinders and the effect of an axial flow. Phys. Rev. E 2004, 69, 056309. [Google Scholar] [CrossRef]
  47. Abchaa, N.; Crumeyrolle, O.; Ezerskya, A.B.; Mutabazi, I. Velocity field of the spiral vortex flow in the Couette-Taylor system. Eur. Phys. J. E 2013, 36, 20. [Google Scholar] [CrossRef]
  48. Guckenheimer, J.; Holmes, P. Structurally stable heteroclinic cycles. Math. Proc. Camb. Phil. Soc. 1988, 103, 189–192. [Google Scholar] [CrossRef] [Green Version]
  49. Melbourne, I.; Chossat, P.; Golubitsky, M. Heteroclinic cycles involving periodic solutions in mode interactions with O(2) symmetry. Proc. Roy. Soc. Edinb. 1989, 113A, 315–345. [Google Scholar] [CrossRef] [Green Version]
  50. Krupa, M.; Melbourne, I. Asymptotic stability of heteroclinic cycles in systems with symmetry. Ergod. Th. Dynam. Sys. 1995, 15, 121–147. [Google Scholar] [CrossRef]
  51. Krupa, M. Robust heteroclinic cycles. J. Nonlin. Sci. 1997, 7, 129–176. [Google Scholar] [CrossRef]
  52. Altmeyer, S. Non-linear dynamics and alternating ‘flip’ solutions in ferrofluidic Taylor–Couette flow. J. Magn. Magn. Mater. 2018, 452, 427. [Google Scholar] [CrossRef]
  53. Eckhardt, B.; Grossmann, S.; Lohse, D. Torque scaling in turbulent Taylor–Couette flow between independently rotating cylinders. J. Fluid Mech. 2007, 581, 221. [Google Scholar] [CrossRef]
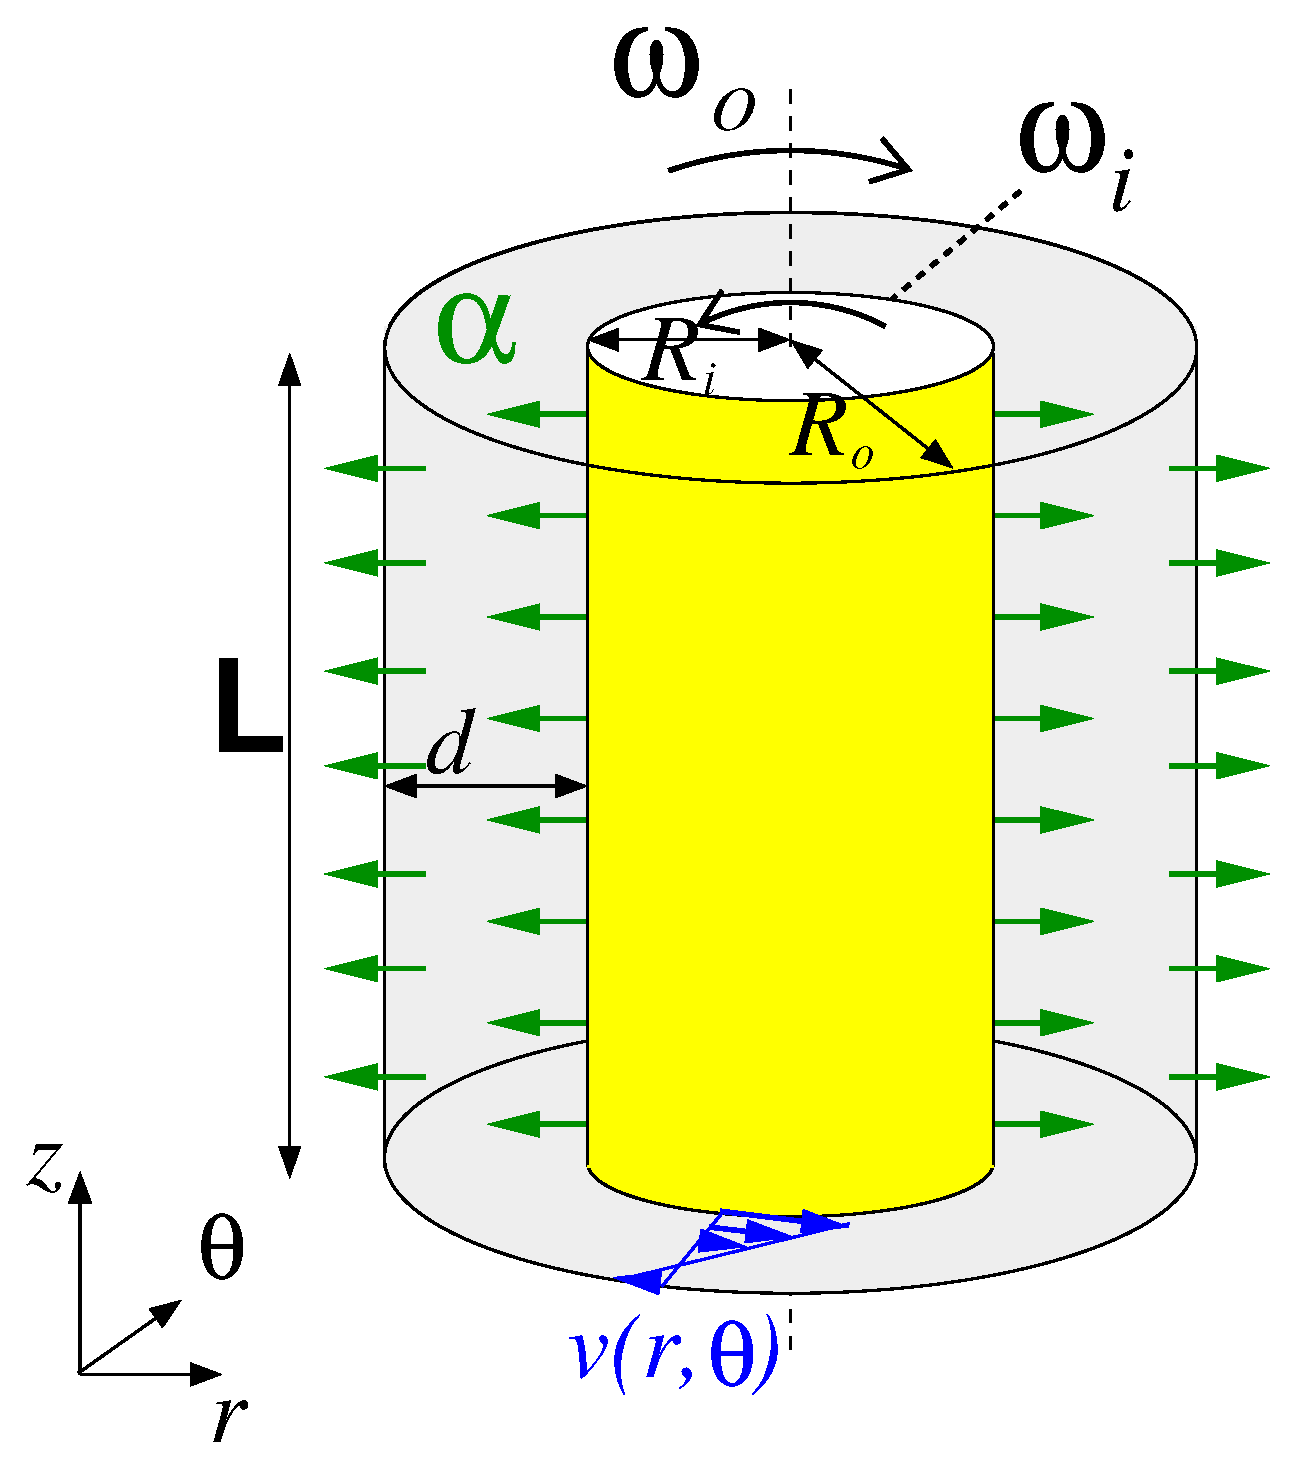
Figure 1. Schematics of the Taylor Vortex reactor illustrating a combination of radial and axial flow in counter-rotating configuration including sketch of laminar velocity profile v ( r , θ ) (not to scale). The radial flow can be directed outward ( α > O ) (illustrated), or inward ( α < O ) . The axial imposed mass flux R e is considered positive from bottom to top.
Fluids 07 00336 g001
Figure 2. Influence of an external through-flow R e in absence of radial flow ( α = 0 ) on different vortex structures. Shown are top modal kinetic energy E k i n and bottom primary Fourier amplitudes of the radial flow field at midgap r = 0.5 for L1-SPI ( u 1 , 1 ), R1-SPI ( u 1 , 1 ), and the TVF ( u 0 , 1 ). The dashed lines and letters (a–e) on top of the panel indicate the R e number at which bifurcation scenarios with variation in α are plotted in Figure 3. Vertical arrows indicate transitions after loss of stability, see text for details.
Fluids 07 00336 g002
Figure 3. Bifurcation diagrams for various vortex structures versus α for (a) R e = 0 , (b) R e = 5 , (c) R e = 10 , and (d) R e = 20 . Shown are top (time-averaged) modal kinetic energy E k i n (Equation (11)) and bottom the dominant (time-averaged) radial flow field amplitudes | u m , n | at mid-gap contributed from the modes ( m , n ) as indicated. Vertical arrows indicate the transition when one flow becomes unstable.
Fluids 07 00336 g003
Figure 4. ( α , R e ) parameter space illustrating various solutions as indicated in Table 2. The small vertical arrows below the abscissa (a–d) highlight the parameter range of which the bifurcation diagrams are presented in Figure 3, while the dotted horizontal line at α = 0  corresponds to Figure 2. To guide the eyes some boundaries are color coded; e.g. within the red line stable R1-SPI exist, while between the orange lines stable L1-SPI exist. See text for further explanation.
Fluids 07 00336 g004
Figure 5. Schematics illustrating the main flow positions exemplarily shown on a L1-SPI ( R e = 0 , α = 0 ): (1) inflow; (2) outflow; (3) vortex core; (4) mid-gap; Δ I N [ O U T ] regime of inflow [outflow] ( r = 0.5 ); r i [ o ] : inner [outer] cylinder radius.
Fluids 07 00336 g005
Figure 6. Flow dynamics for ( 1 ) R e = 0 , ( 2 ) R e = 5 , ( 3 ) R e = 10 , and ( 4 ) R e = 20 . Shown are axial profiles of the radial velocity u ( z ) at the midgap position for (a) TVF and (b) L1-SPI & R1-SPI and asymmetry parameter (c) P (see Equation (12)). In each case, the maximal radial outflow is chosen to lie at z = 0.5 λ . The L1-SPI [R1-SPI] is propagating in positive [negative] z direction (see also Figure 3).
Fluids 07 00336 g006
Figure 7. Degree of anharmonicity δ = Δ I N Δ O U T (see Figure 5) for various vortex structures versus α for (a) R e = 0 , (b) R e = 5 , (c) R e = 10 , and (d) R e = 20 .
Fluids 07 00336 g007
Figure 8. Azimuthal velocity contour profiles v = 0 in bulk gap ( 1 r 2 ) with variation of α as indicated for different flow states at (a) R e = 0 , (b) R e = 5 , (c) R e = 10 , and (d) R e = 20 (see also Figure 6. Note that the vertical gray lines at r = 1.5 indicates the mid-gap of the bulk. For better visibility two axial periods of the vortex profiles are shown.
Fluids 07 00336 g008
Figure 9. Radial profiles of the axial mean flow w 0 ( r ) (Equation (13)) of TVF, L1-SPI, and R1-SPI (see also Figure 6) for (a) R e = 0 , (b) R e = 5 , (c) R e = 10 , and (d) R e = 20 at α as indicated. The thick line refers to α = 0 . Note the change in amplitude of w 0 ( r ) (ordinate scaling) for larger R e . In (a) at R e = 0 the w 0 ( r ) = 0 for TVF and therefore not shown.
Fluids 07 00336 g009
Figure 10. Time series of (a) kinetic energy E k i n , (b) mode amplitudes | u m , n | of the dominant axial Fourier amplitudes of the azimuthal modes u m ( z , t ) (Equation (8)) of the radial flow at midgap, and (c) η ± illustrating the alternating transition scenario between the two unstable solutions 1-mwTVF and L1-wSPI, respectively. Control parameters R e = 10 , α = 10 .
Fluids 07 00336 g010
Figure 11. (a) Extraction of Figure 10 illustrating one single period of the heteroclinic connection (hco). (b) Phase portrait in ( η + , η ) plane (see text for further description). Exemplarily, orange and violet colors indicate the L1-SPI and 1-mwTVF, respectively, extracted from longtime sequence (brown color) of the flow dynamics (same color code is used in (a,b)). The inset shows the corresponding Poincaré section ( η , E k i n ) for η + = 2000 (vertical green line in ( b )). The dashed green lines with labels (A)–(E) illustrate time steps for which flow visualizations are shown in Figure 12. Control parameters: R e = 10 , α = 10 .
Fluids 07 00336 g011
Figure 12. Flow visualization of various flow pattern appearing within the transition scenario between the two unstable solutions 1-mwTVF and L1-wSPI, respectively. Snapshots (1)–(5) for times indicated (A)–(E) in Figure 11a. Shown are (a) isosurfaces of η [red (dark gray) and yellow (light gray) colors correspond to positive and negative values, respectively.] (b) the radial velocity u ( θ , z ) on an unrolled cylindrical surface in the annulus at mid-gap [red (yellow) color indicates in (out) flow with zero specified as white], (b,c) vector plot [ u ( r , z ) , w ( r , z ) ] of the radial and axial velocity components (including the color-coded azimuthal velocity v. The thick contour lines in (c) correspond to v = 0 .
Fluids 07 00336 g012
Figure 13. Variation in (a) the angular momentum L ( r ) = r v ( r ) θ , z / Re i and (b) the dimensionless torque G = ν J ω (see text for details) versus the radius r for solutions during the transition (indicated (A)–(E) in Figure 11(a). The insets in (a) show a close up of L ( r ) and in (b) shows the total torque G t o t a l .
Fluids 07 00336 g013
Figure 14. Dependence of the total torque G total with variation of α for different flow states at (a) R e = 0 , (b) R e = 5 , (c) R e = 10 , and (d) R e = 20 (cf. Figure 3).
Fluids 07 00336 g014
Table 1. Flow state nomenclature and abbreviations. From left to right: Abbreviation, flow state, dominant Fourier modes, and dynamics.
Abbreviation Flow StateModes m
(Dominant)
Dynamics
CCF Circular Couette flow 0
TVF Taylor vortex flow 0
1-[m]wTVF [modulated] 0 ± 1 rotating
wavy Taylor vortex flow
1-[m]wTVF t time-dependent [modulated] 0 ± 1 rotating
wavy Taylor vortex flow
L[R]1-SPI left- [right-] winding 1 [ 1 ] left-[right-]winding, rotating
spiral vortex flow
1-RIB ribbon ± 1 rotating
1-RIB A B alternating ribbon ± 1 ± 1 alternating A B , rotating
Table 2. Various regions, labeled A-I, as presented in the ( R e , α ) parameter space diagram in Figure 4 including their properties: stable (s), unstable or non-existent (-), heteroclinic cycle (hc), heteroclinic connection (hco). Note that the corresponding modulated flow states [·] indicated by “m” are present when R e 0 instead of their non-modulated mother state.
SolutionRegion
ABC 1 C 2 C 3 C 4 C 5 DEFGHI
TVF-------ss----
1-wTVF [1-mwTVF]--sssss------
1-wTVF t [1-mwTVF t ]----------s--
L1-SPIsssss--ss----
R1-SPI-s--s---s----
1-RIB, 1mRIB-----------s-
1-RIB A B [1-mRIB A B ]------------hc
1-mwTVF↔1-mwSPI---------hco---
Publisher’s Note: MDPI stays neutral with regard to jurisdictional claims in published maps and institutional affiliations.