Article

Numerical Simulation of an Air-Core Vortex and Its Suppression at an Intake Using OpenFOAM

1
School of Engineering, University of Energy and Natural Resources, BS-0061-2164 Sunyani, Ghana
2
AWD Consult Inc., South Portland, ME 04106, USA
3
College of Engineering, Mathematics and Physical Sciences, University of Exeter, Exeter EX4 4QF, UK
*
Author to whom correspondence should be addressed.
Fluids 2020, 5(4), 221; https://doi.org/10.3390/fluids5040221
Submission received: 14 October 2020 / Revised: 3 November 2020 / Accepted: 14 November 2020 / Published: 26 November 2020
(This article belongs to the Special Issue Selected Papers from the 15th OpenFOAM Workshop)

Abstract

:
A common challenge faced by engineers in the hydraulic industry is the formation of free surface vortices at pump and power intakes. This undesirable phenomenon which sometimes entrains air could result in several operational problems: noise, vibration, cavitation, surging, structural damage to turbines and pumps, energy losses, efficiency losses, etc. This paper investigates the numerical simulation of an experimentally observed air-core vortex at an intake using the LTSInterFoam solver in OpenFOAM. The solver uses local time-stepping integration. In simulating the air-core vortex, the standard kε, realizable kε, renormalization group (RNG) kε and the shear stress transport (SST) kω models were used. The free surface was modelled using the volume of fluid (VOF) model. The simulation was validated using a set of analytical models and experimental data. The SST kω model provided the best results compared to the other turbulence models. The study was extended to simulate the effect of installing an anti-vortex device on the formation of a free surface vortex. The LTSInterFoam solver proved to be a reliable solver for the steady state simulation of a free surface vortex in OpenFOAM.

1. Introduction

A common challenge faced by engineers in the hydraulic industry is the formation of free surface vortices at pump and power intakes, a phenomenon which may entrain air [1,2,3]. This undesirable phenomenon often results in several operational problems: noise, vibration, cavitation, energy losses, efficiency losses, etc. [4,5]. Free surface vortices have also seen beneficial applications in water vortex hydropower plant systems [6,7,8], water treatments [9], vortex drop shafts in sewer systems [10], vortex settling basins [11] and vortex confined chambers [12].
Free surface vortices involving incipient air-entrainment occur at low submergence depth, a depth often referred to as the critical submergence [2]. This implies that ensuring adequate submergence presents an efficient way to avert the occurrence of free surface vortices. Apart from ensuring adequate submergence during the design of intakes, the use of anti-vortex devices also provides another cost-effective means of suppressing the formation of free surface vortices [5,13].
Refs. [14,15,16,17] proposed analytical models to describe the key vortex characteristics. Several validation test cases on these analytical studies also exist in the literature [18,19,20]. Some researchers [21,22,23] have proposed mathematical models and design plots which predict the critical submergence of intakes. Time and cost constraints often render physical experimental modelling prohibitive and this has necessitated the use of numerical tools, which, in most instances, offer a reasonable complement. Numerical studies on free surface vortices have gained popularity due to the increasing trend of computational power [24]. According to [25], computational fluid dynamics (CFD) is capable of solving challenges associated with scale effects in model testing of free surface vortex problems through the simulation of the actual prototype with appropriate boundary conditions. In this regard, many studies have utilized CFD tools to simulate the occurrence of free surface vortices.
Ref. [7] numerically simulated a concentrated, full air-core vortex using the ANSYS-CFX tool and reported that the Reynolds stress model was the most suitable turbulence model. The velocity distribution in a vortex settling basin was also numerically assessed by [11] using FLOW-3D CFD software. The study reported a good agreement between the experimental and numerical results. Ref. [24] performed a numerical simulation of a free surface vortex formed in an intake channel of a small scale hydropower plant using the large eddy simulation (LES) model, where the free surface depression was successfully predicted. In a comparison study between the standard k ε and the RNG k ε turbulence models in simulating a vertical vortex, Ref. [25] found that the RNG k ε turbulence model provided a better prediction of the rapidly strained and curving streamline flows at the hydraulic intake. Free surface vortices in two geometric variations of a simplified intake were numerically simulated by [26] using the commercial ANSYS-CFX software along with the k ε turbulence model. Similarly, Ref. [27] numerically predicted a free surface vortex formation at the intake of a tidal power plant using the commercial ANSYS-CFX tool and with the shear stress transport curvature correction (SST-CC) turbulence model. Ref. [28] numerically quantified air entrainment rates as a result of intake vortices in different hydraulic conditions using the large eddy simulation (LES) model in the FLOW-3D CFD tool. The study observed a good agreement between the experimental and numerical results. Ref. [29] investigated key characteristics of a vertical vortex by utilizing the tracer technique and provided improved mathematical relations for the vortex by using the method of separation of variables.
A number of numerical studies have also been devoted to the simulation of free surface vortices in the presence of anti-vortex devices. For instance, Ref. [13] performed a numerical simulation of a Prosser disc and funnel-type anti-vortex devices using the large eddy simulation (LES) model and observed good agreement with experimental results. Ref. [30] looked into the efficacy of a rectangular anti-vortex plate at vertical pipe intakes, whereas [31] looked into the use of horizontal perforated and solid plates as anti-vortex devices. A detailed experimental assessment of 13 variant anti-vortex devices was conducted by [32] based on the physical model of the Siah Bisheh Pumped Storage Dam. Their study concluded that the horizontal plate anti-vortex device had the best performance. Some authors also looked into other types of anti-vortex devices—submerged water jets [33,34,35], rectangular plates [36] and funnel-shaped devices [37].
Despite the numerous research studies in this field, very little is known about the use of open-source CFD tools, such as OpenFOAM, for numerical simulation of free surface vortices. This study, therefore, presents a means by which free surface vortices could be numerically simulated using the OpenFOAM CFD tool. In this study, the steady state LTSInterFoam solver was used for the simulation of an experimentally observed air-core vortex. The solver uses local time-stepping integration and has, until now, been associated with studies involving the maneuverability of ships and boats. The study also investigated the performance of different turbulence models in predicting the occurrence of free surface vortices as well as the numerical simulation of the performance of an anti-vortex device installed at an intake.

Vortex Models

Vortex-related studies are often validated with either experimental data or analytical models. In this regard, this section focuses on the review of some selected mathematical vortex models.
Ref. [14] describes a vortex as being a solid rotating body comprising of an inner core and an outer free vortex. The equations for the tangential velocity of the inner core and outer core vortices are given by Equations (1) and (2), respectively.
r < r m   V θ = ω r = Γ 2 п r r m 2
r > r m   V θ = Γ 2 п r = ω r m 2 r
Refs. [17,20,38] also proposed other vortex models and these are given in Equations (3)–(5), respectively.
V θ = Γ 2 п r m 2 R 1 + 2 R 2
V θ = Γ 2 п r m R ( 1 + R 4 )
V θ = Γ 2 п r m 0.73 R 1 R + R 2
where V θ represents the tangential velocity; ω refers to the angular velocity of the vortex centre; r refers to the radius; r m is the radius at maximum tangential velocity; Γ refers to the constant circulation of the outer zone; and the normalised radius, R = r / r m .

2. Materials and Methods

2.1. Experimental Set-Up

The first set of numerical investigations involving an intake without an anti-vortex device was based on the experimental work by [39], as illustrated in Figure 1. The experimental work entails the formation of an air-core vortex at an intake. To be able to study the free surface vortex occurrence in the set-up shown in Figure 1, water was made to circulate in a closed-loop set-up, such that a constant water level was maintained at the elevation sump. The intake had a diameter ( D ) of 16 cm and the water level in the sump was adjusted by using the pump to vary the volume of water in circulation. Visualisation of flow within the prototype sump, intake geometry and the tunnel was made possible by the use of clear Perspex in these areas of interest. The set-up was initially made to run for several hours and readings were only taken when steady conditions had been attained at a constant water level. A stable air-core vortex was observed when the relative critical submergence, S / D , and intake Froude number, F r , were set at 1.5 and 0.6, respectively.
The second set of numerical investigations, which sought to assess the impact of installing an anti-vortex device, was based on the experimental work by [31]. Both studies implemented similar experimental set-ups but with an anti-vortex plate which has a 66% perforated opening installed at the intake of the experimental set-up by [31]. The plate had a thickness of 2 mm and measured 1.5D by 1D in length and width, respectively. The discharge flow and relative submergence for this experimental case were set at 0.015 m3/s and 1.5, respectively.

2.2. Numerical Approach

2.2.1. Governing Equations

The governing Reynolds-Averaged Navier–Stokes (RANS) equations that underline the LTSInterFoam solver are the continuity, transport of phase-fraction and the momentum equations which are given by Equations (6)–(8), respectively. The flow parameters are decomposed using the Reynolds decomposition approach such that u = u ¯ + u and p = p ¯ + p .
· u ¯ = 0  
α t + · ( α u ¯ ) = 0
( ρ u ¯ ) t + · ( ρ u ¯ u ¯ ) = p ¯ + ρ g + · [ μ e f f ( u ¯ + ( u ¯ ) T ) ]
where u refers to the velocity; u ¯ is the time-averaged velocity; u refers to the velocity fluctuation; p is the pressure;   p ¯ represents the time-averaged pressure; p is the pressure fluctuation; α represents the volume fraction which ranges from 0 to 1 (with cells filled with gas given a value of 0 whilst cells filled with liquid are assigned a value of 1); g is the acceleration due to gravity; and μ e f f is the effective viscosity.
Equations (9) and (10) are used to compute the density ρ and effective viscosity μ e f f of the fluid, respectively. The subscripts l and g in the equations represent liquid and gas respectively.
ρ = α ρ l + ( 1 α ) ρ g
μ e f f =   ( μ e f f ) l α + ( μ e f f ) g ( 1 α )
The turbulence models selected for the study are the Standard k ε [40], RNG k ε [41,42], realizable k ε [43], k ω [44,45] and the SST k ω [46,47] models. Additional equations used for computing the various parameters in the different turbulence models are available in the literature.

2.2.2. OpenFOAM Application and Procedures

The governing differential equations are discretized using the finite volume method (FVM) along with the local time stepping (LTS) scheme for temporal discretization in order to ensure a rapid steady-state solution. The pressure–velocity equations are resolved using the PIMPLE algorithm. The linearUpwind grad (U) was selected for the convection of U . The divergence related to k and ω was computed using the linearUpwind limitedGrad scheme, whilst for that of epsilon, the upwind scheme was selected. For the divergence of alpha, div (phi,alpha), and the compression of the interface, div(phirb,alpha), the van Leer and the linear schemes were applied, respectively. The Gauss linear corrected scheme was used for the Laplacian schemes.
The building and meshing of the geometries were done in CAD and cfMesh, respectively. The cells were mainly hexahedra, comprising of coarse (average cell size 0.08 m), medium (average cell size 0.02 m) and fine (average cell size 0.01 m) cells. The meshed geometry with its associated boundaries is shown in Figure 2.
In CFD analysis, boundary conditions are used to specify the spatial or temporal variable values or behavior required to produce a unique solution. The boundary conditions used for the simulation are provided in Table 1 where U , p _ r g h , a l p h a . w a t e r , n u t , k and o m e g a refer to the velocity, reduced pressure, phase fraction, turbulent viscosity, turbulence kinetic energy and specific rate of dissipation of turbulence kinetic energy, respectively. The fixedValue represents a Dirichlet Boundary Condition which is specified by the user. The pressureInletOutletVelocity boundary condition applies a zero-gradient for outflow, whilst the inflow velocity is the patch-face normal component of the internal-cell value. The fixedFluxPressure provides an adjustment to the pressure gradient, such that the flux on the boundary is the one specified by the velocity boundary condition. The totalPressure boundary condition is computed as static pressure reference plus the dynamic component due to velocity. The inletOutlet boundary condition provides a zero-gradient outflow condition for a fixed value inflow. The kqRWallFunction is the wall function for the turbulence kinetic energy while the nutkRoughWallFunction is the rough wall function for kinetic eddy viscosity and omegaWallFunction represents the wall function for frequency. The groovyBC boundary condition (contained in the swak4Foam library) was used to impose a constant water level.
The simulations were run on 28 cores (2 × 14 core Intel Xeon E5-2660 2.00 GHz) of a desktop workstation which has 256 GB RAM. The simulation convergence was assessed using a normalized residual value of order 1 × 10 5 . Visualisation of the numerical results was performed in ParaView.

3. Results and Discussions

3.1. Visualisation of the Air-Core Vortex

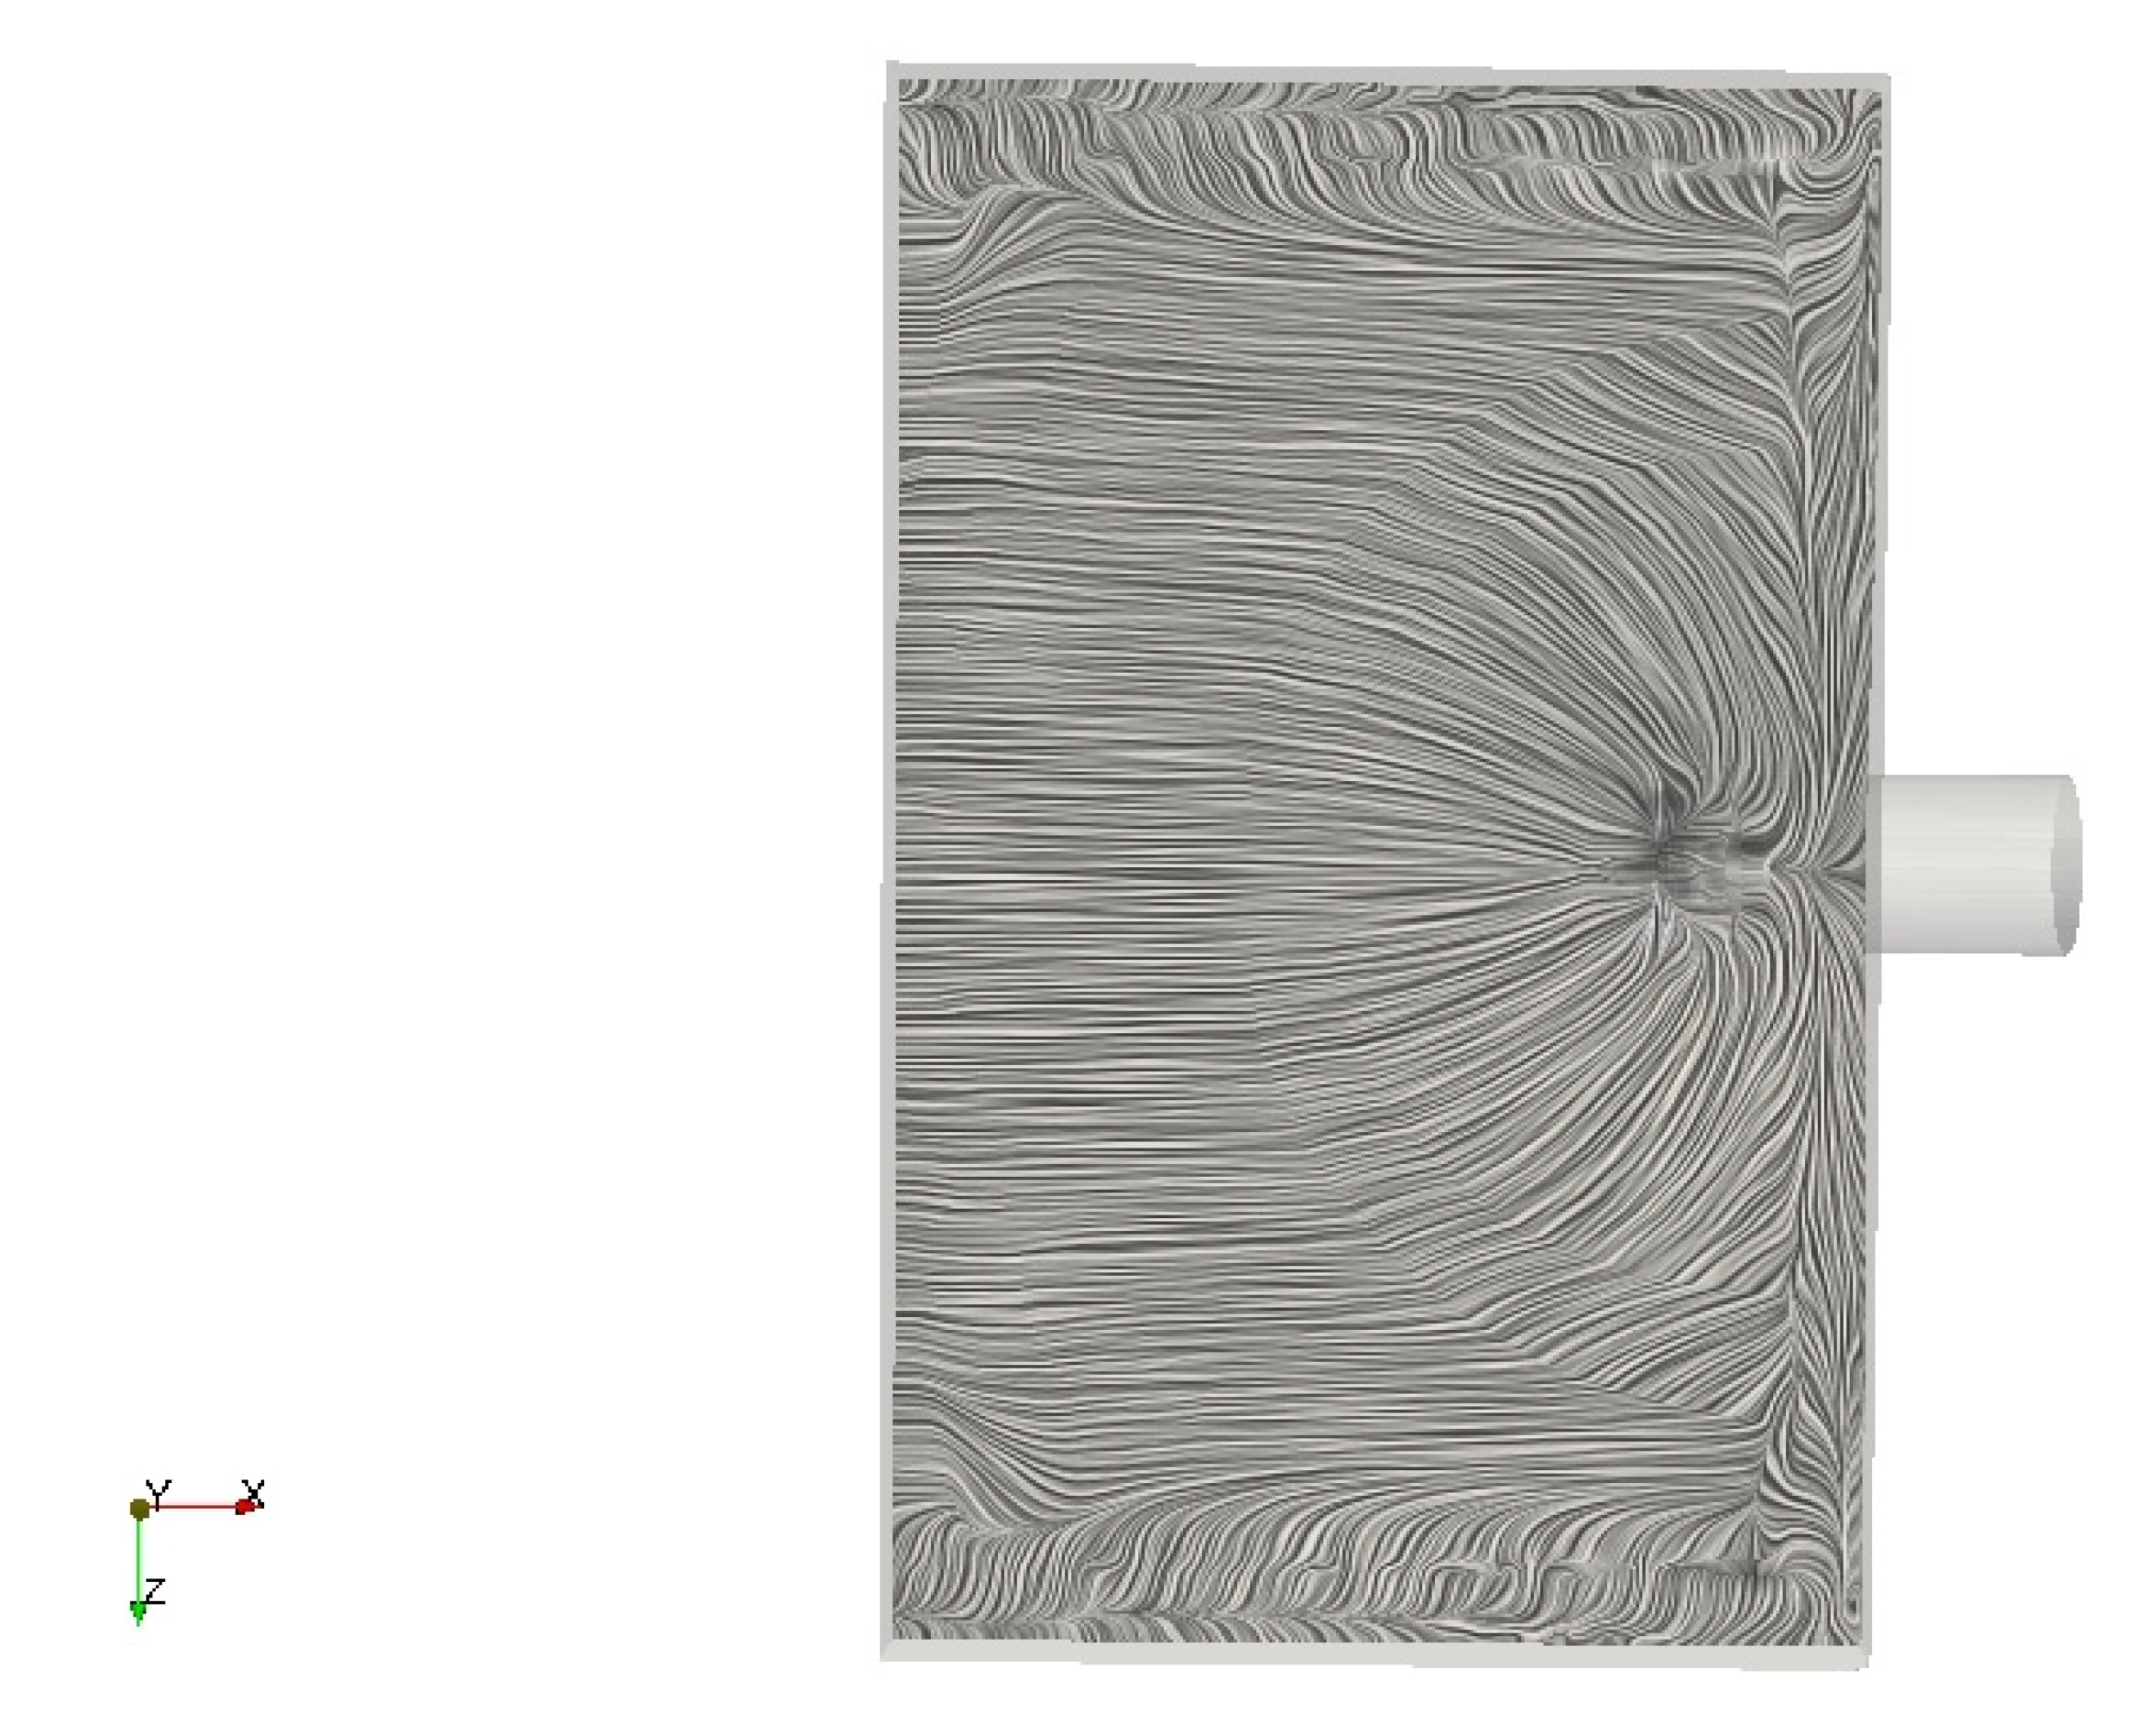
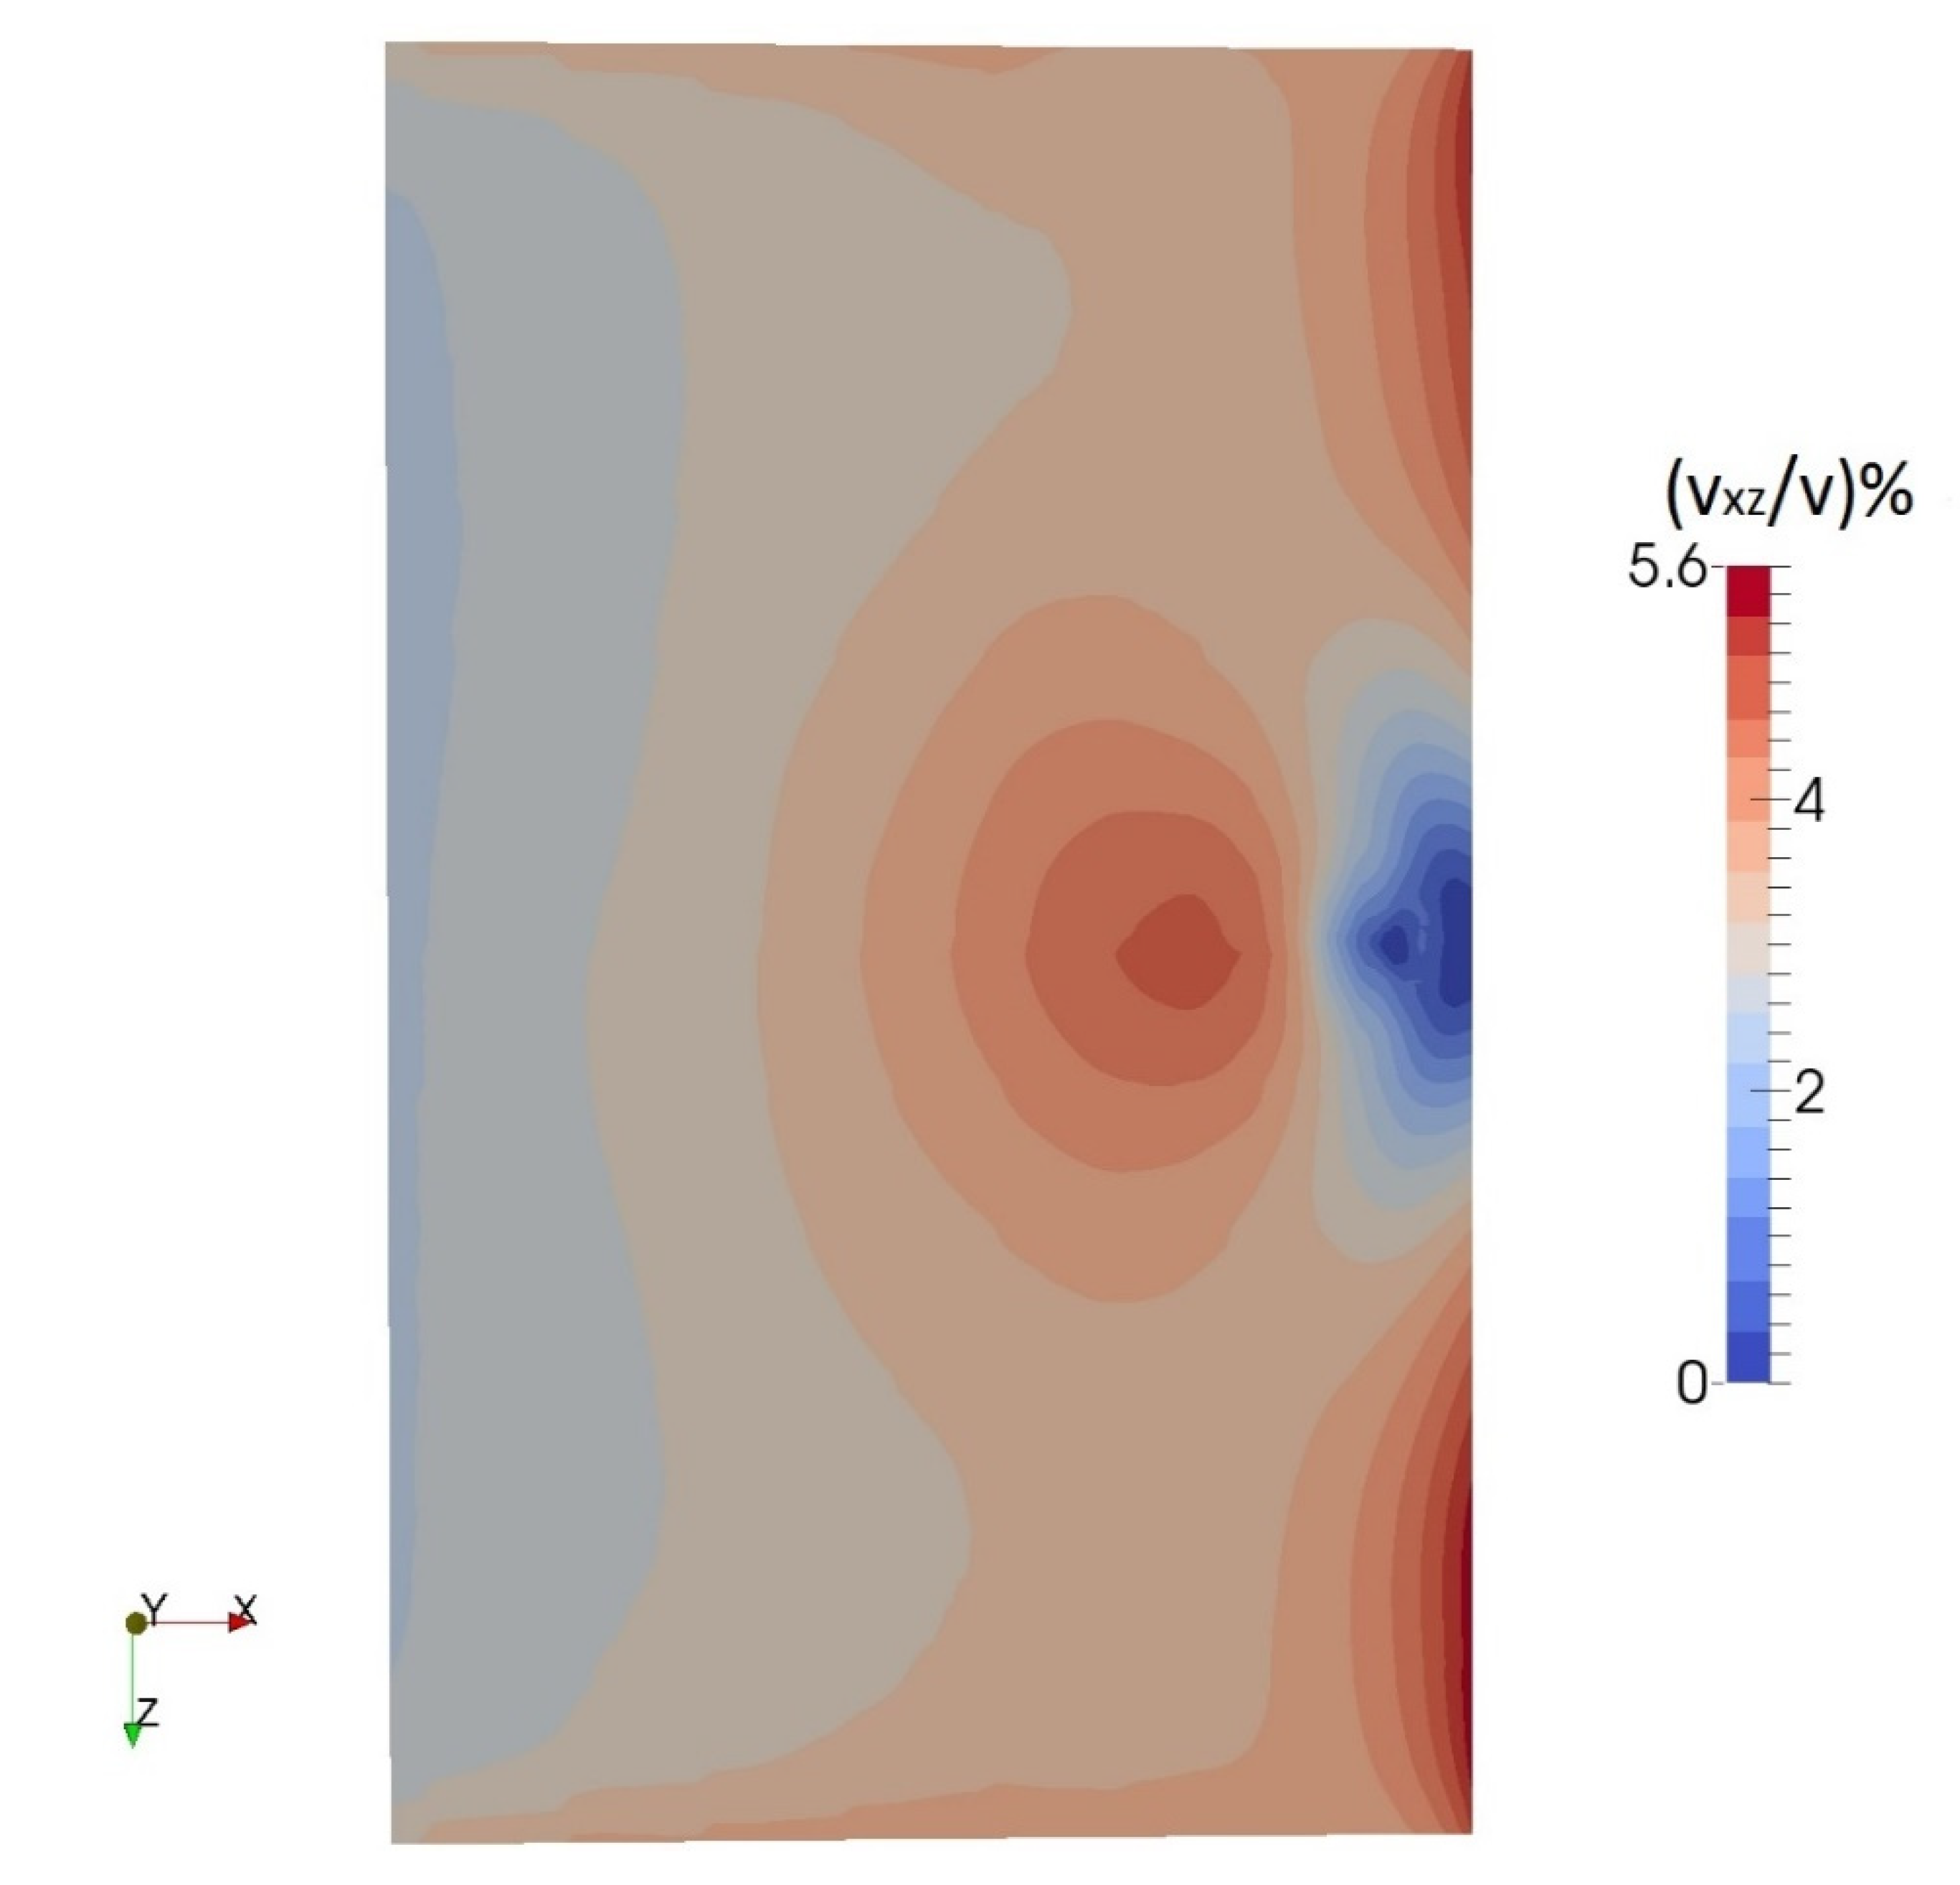
Using an isosurface of α = 0.96, the stable air-core vortex was depicted as a conical drop extending from the free surface towards the intake, as illustrated in Figure 3. In fluid flow, the presence of a vortex is often depicted by a roughly circular or spiral pattern of streamlines [48,49]. The streamlines, which were drawn with surface line integral convolution (Figure 4), exhibit a spiral pattern, thus confirming the presence of a vortex. The velocity vector plot (Figure 5) illustrates how the fluid flows spirally into the intake. From the observations in Figure 4 and Figure 5, the fluid flow can be described as moving spirally from the water surface towards the intake and also rotating around the vortex axis. The plot depicted in Figure 6 shows the contour plot of the normalized velocity field expressed as a percentage, ( V X Z / V ) % , where V X Z refers to the velocity in x-z plane whilst V is the intake flow velocity. The plot is made at a horizontal depth of D   ( 16   c m ) above the axis of the intake. The contours of the velocity field indicate the boundaries of the conical flow towards the intake [39].

3.2. Assessment of Different Turbulence Models

During the numerical simulation, the authors observed that the use of the standard k ε and RNG k ε models resulted in the development of flow instabilities at the free surface, especially at the upstream end. This phenomenon was particularly pronounced at the high-pressure gradient region, thus causing the numerical simulation to fail abruptly. This situation may be linked to the fact that adverse pressure gradient conditions often cause the standard k ε and RNG k ε models to exhibit poor performances [50].
On the other hand, the realizable k ε , k ω and the SST k ω models successfully predicted the occurrence of the air-core vortex. The realizable k ε model outperformed the other family of k ε models (standard k ε and RNG k ε ) due to its ability to perform well with rotation and separation flow, a situation which is linked to the inclusion of a realizability constraint on the predicted stress tensor of the realizable k ε model [43].
However, regarding the realizable k ε model, we observed an amount of unusual free surface deformation along the walls, although the simulation progressed successfully. This observation was generally absent when the k ω models were used. These observations may be attributed to the fact that the k ω models often exhibit better numerical prediction at the walls compared to the k ε models [43,48].
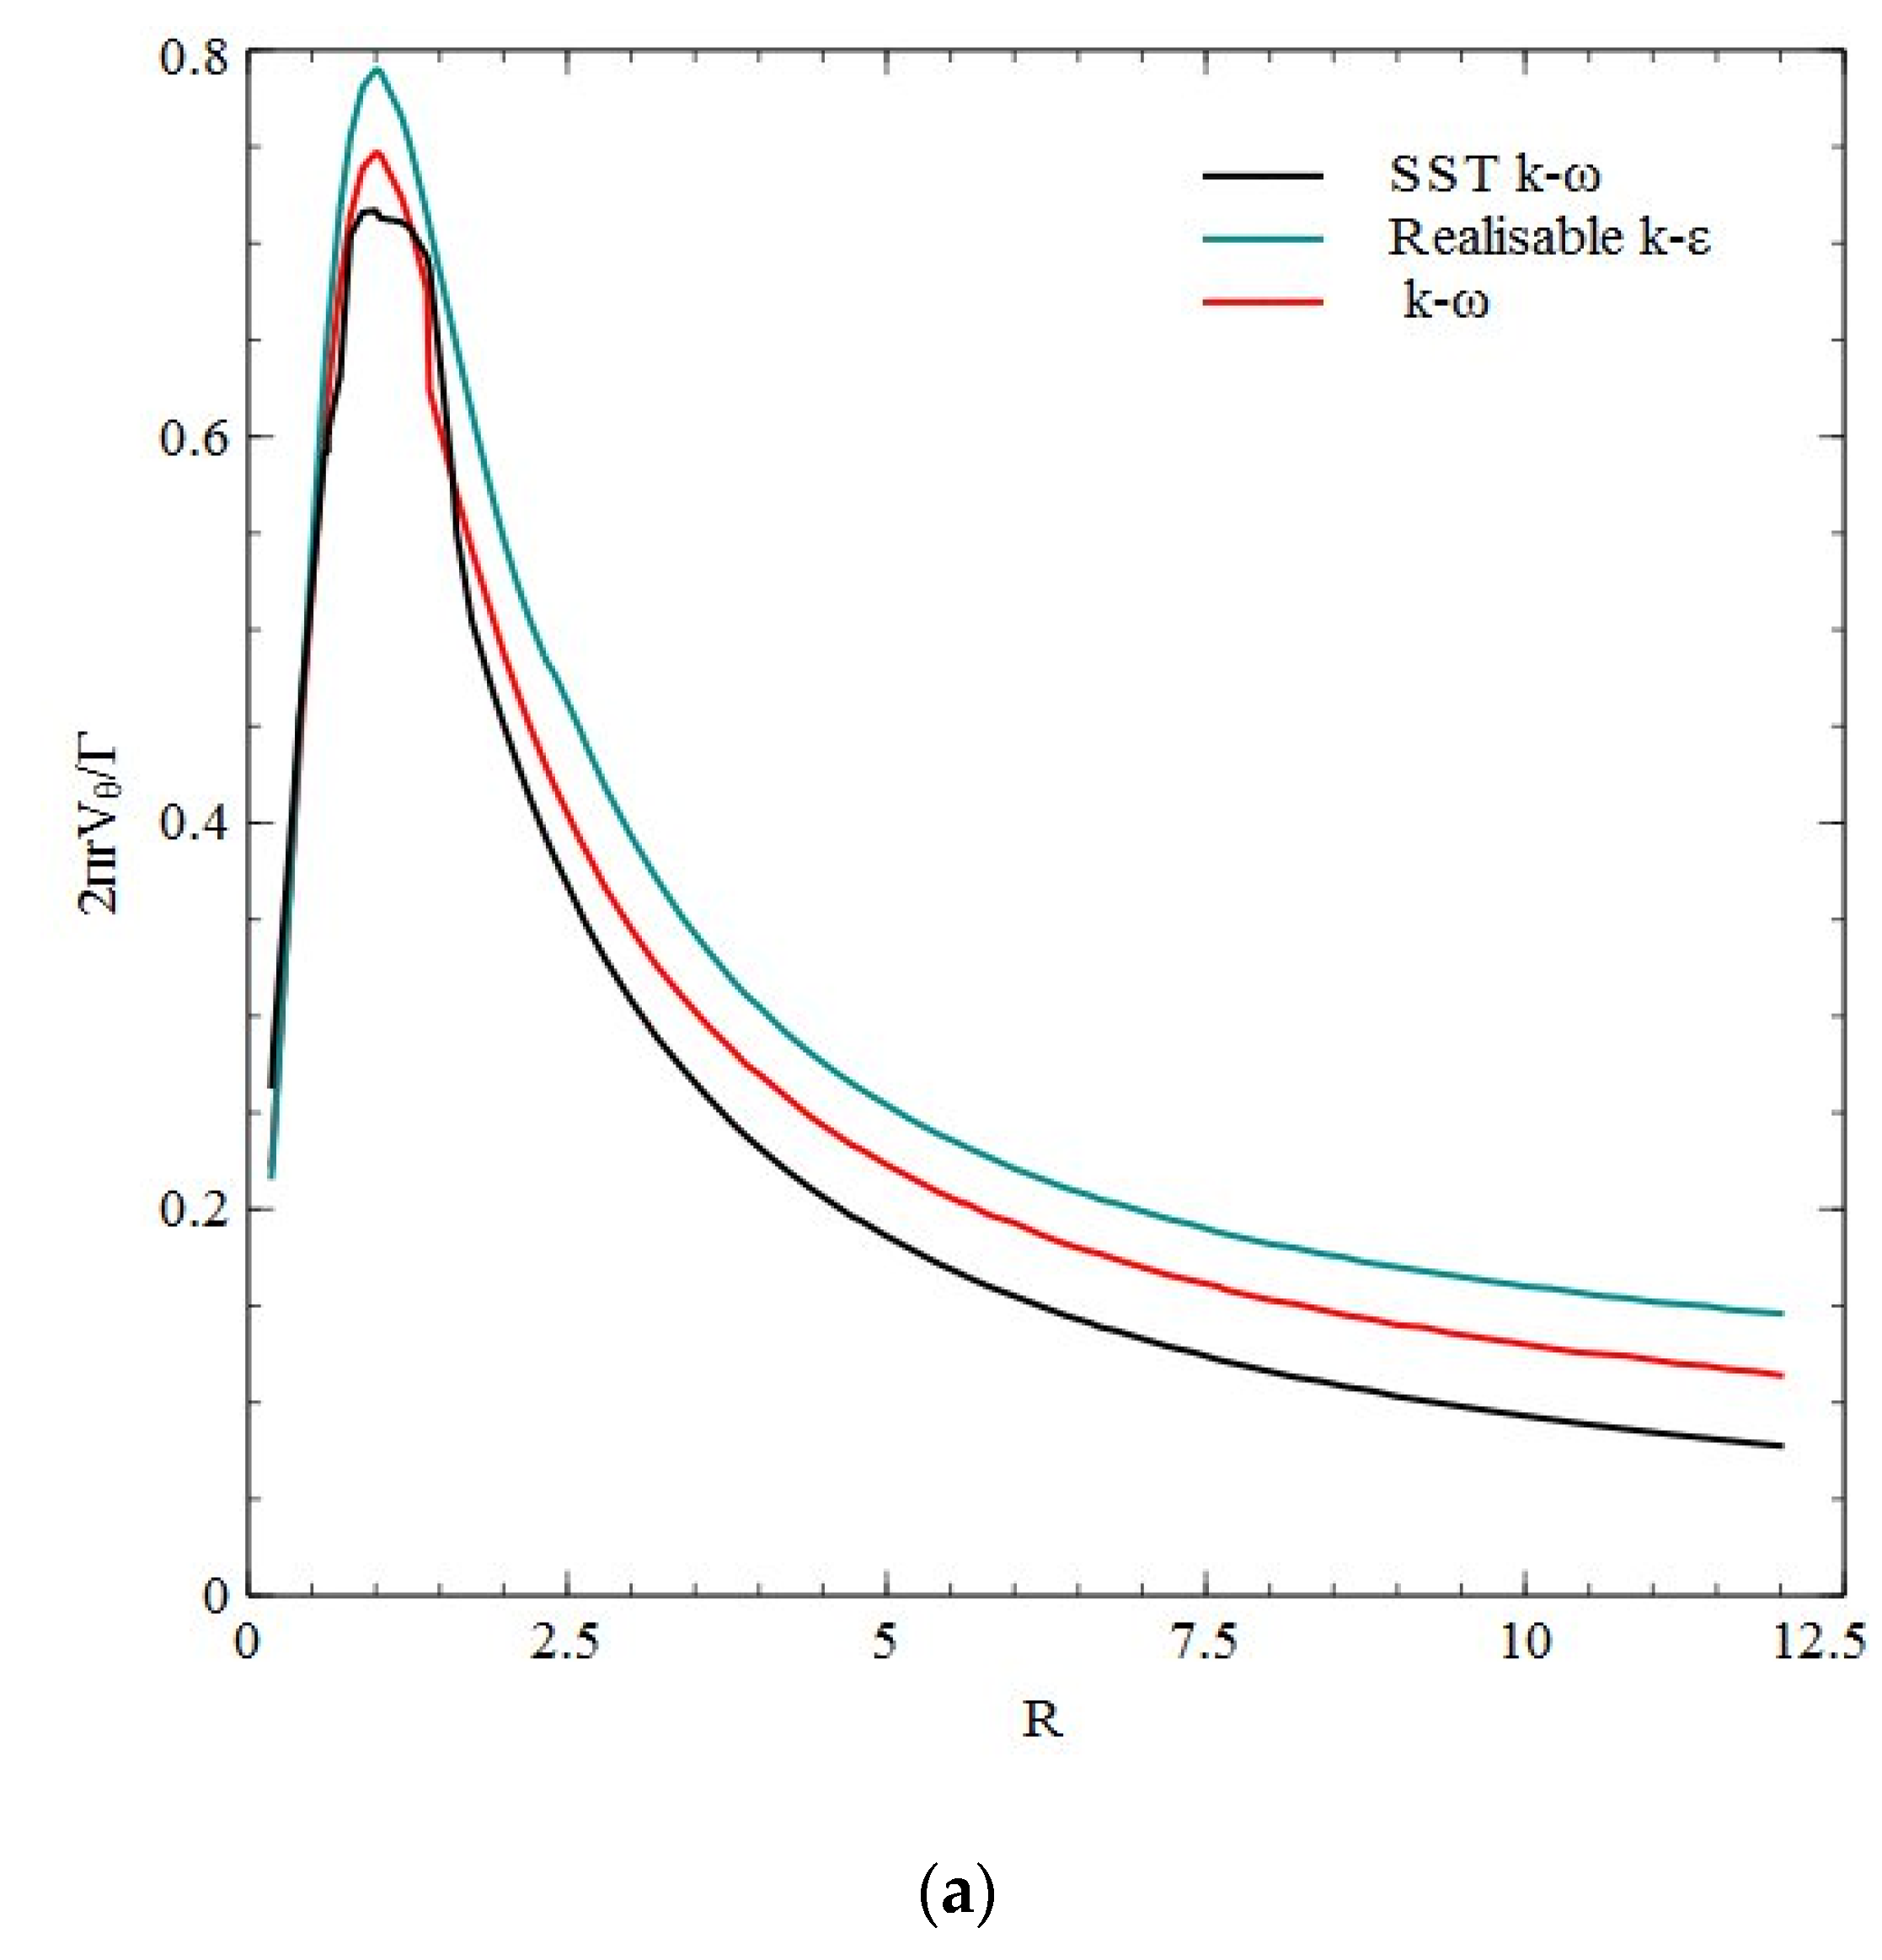
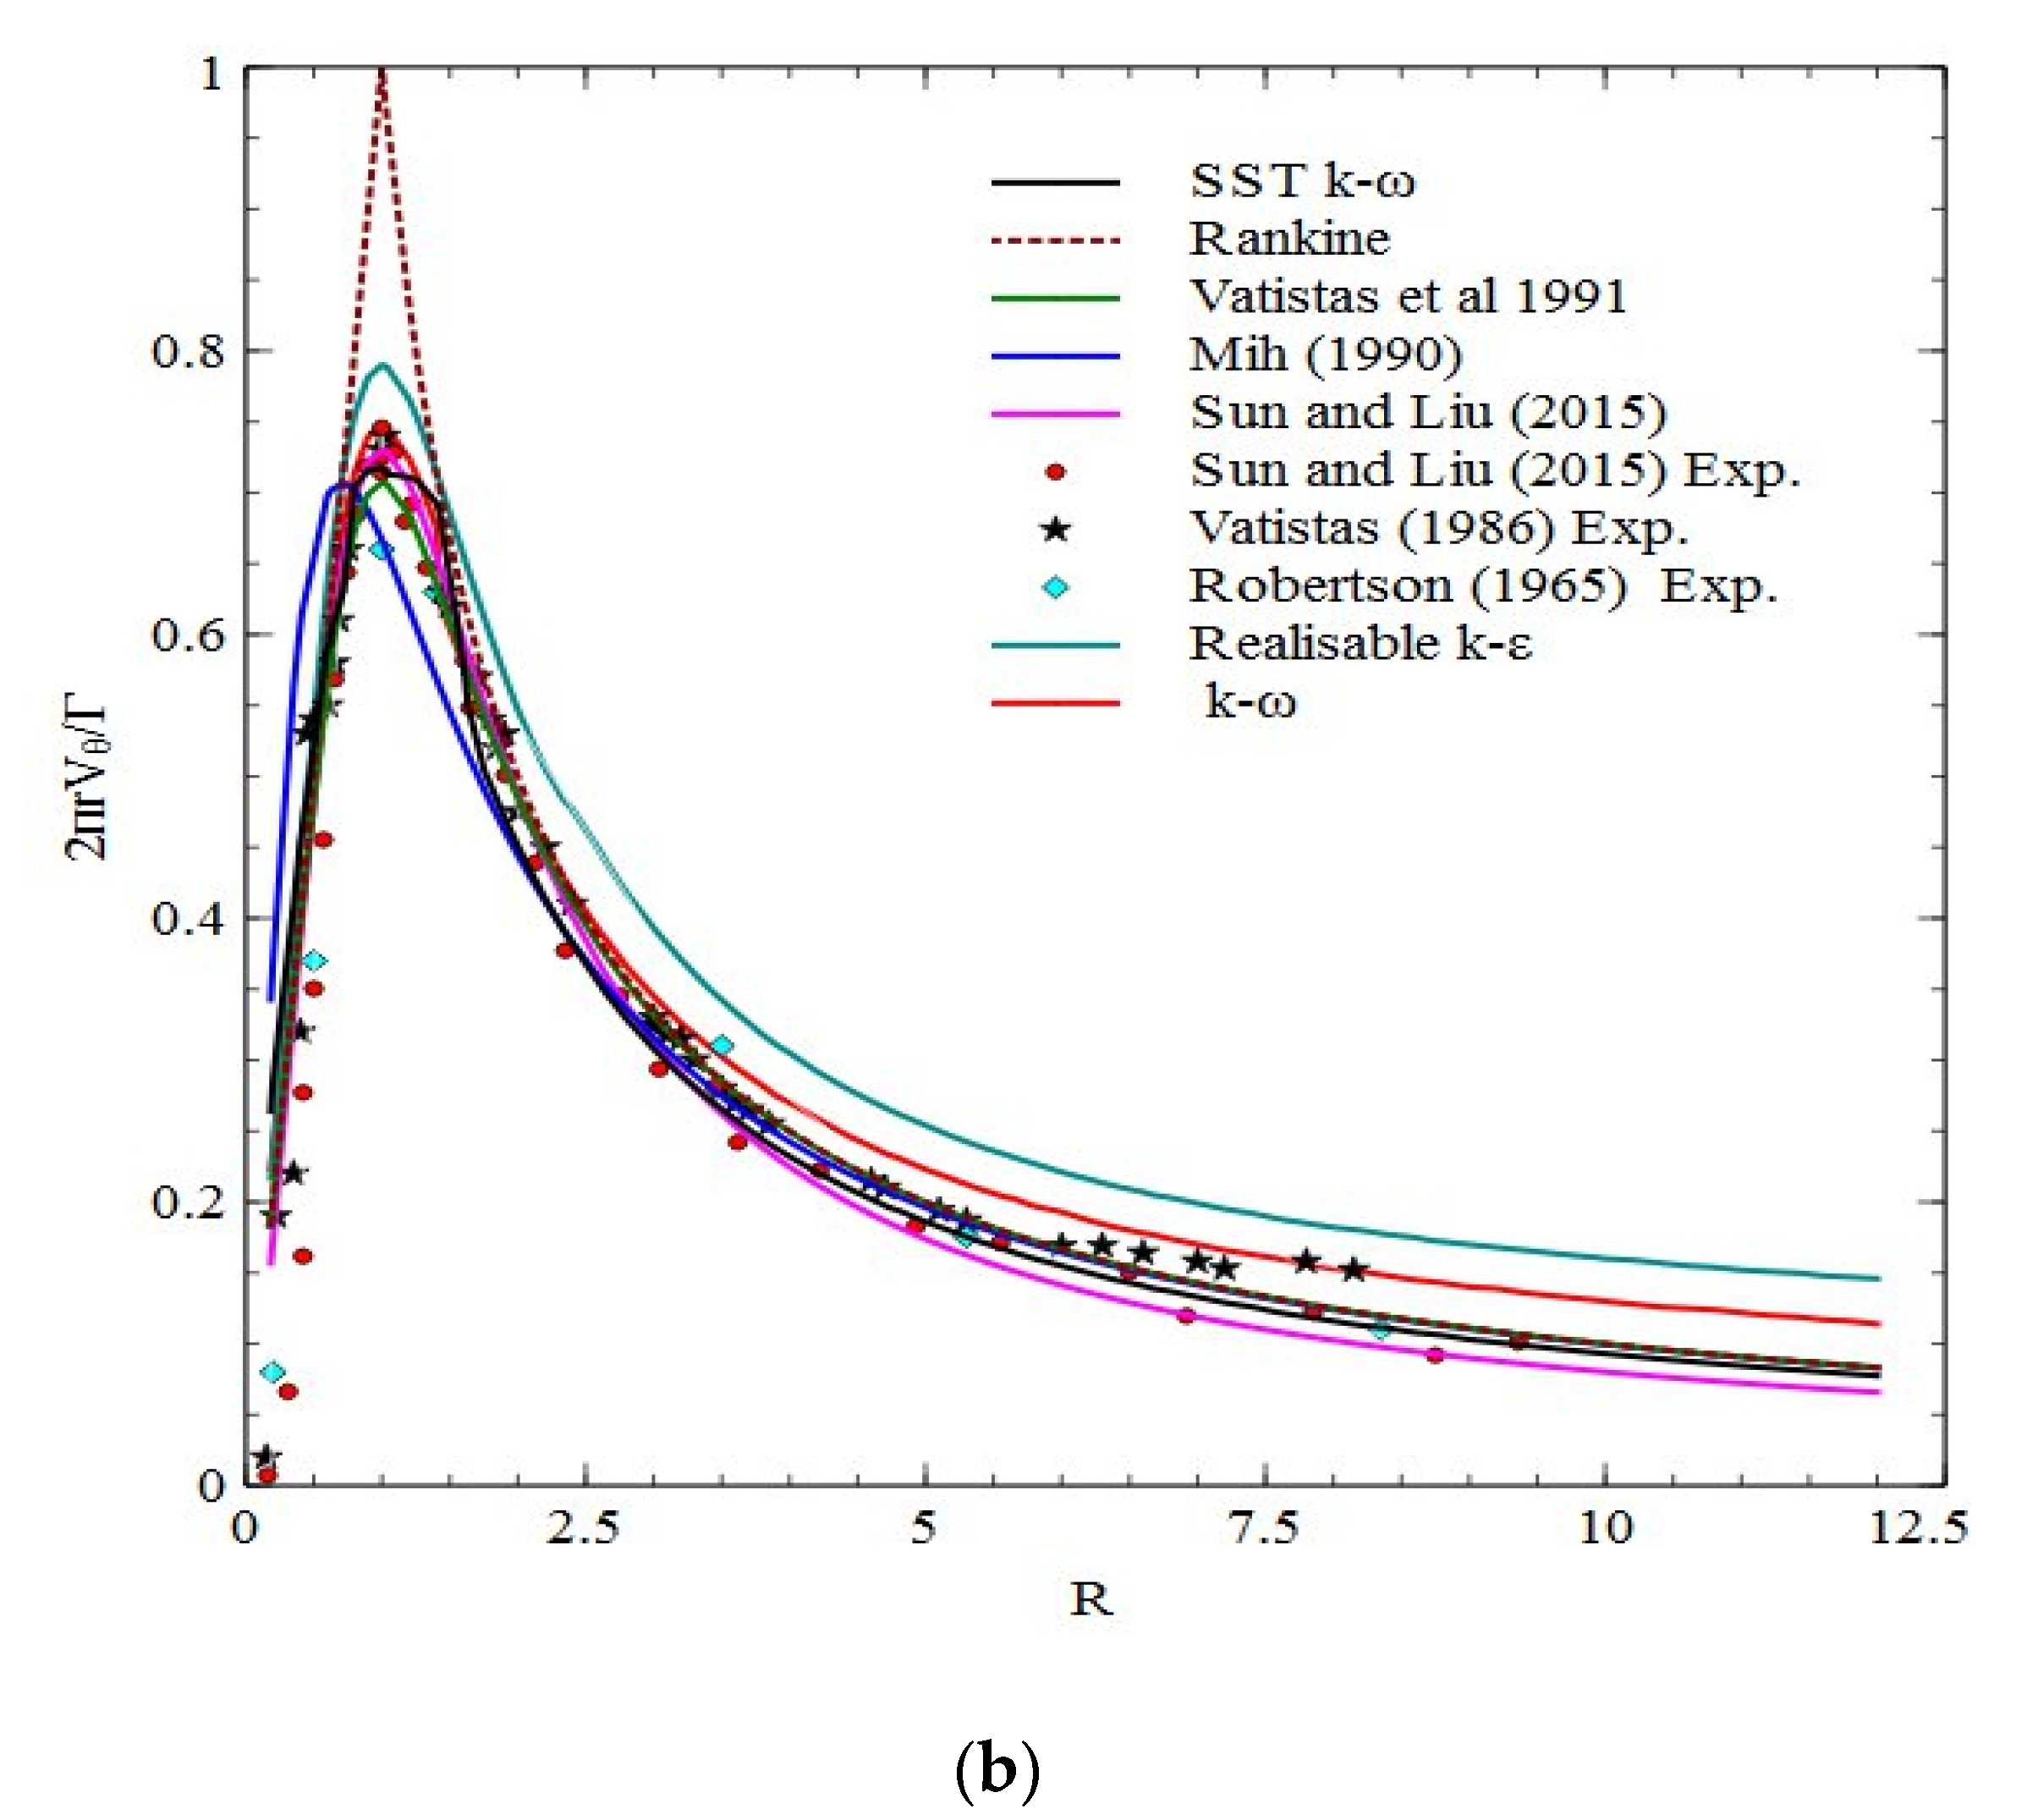
A comparison of results in terms of the normalized tangential velocity distribution from the three (3) different turbulence models (realizable k ε ,   k ω and the SST k ω models) has been illustrated in Figure 7a, where R refers to the normalized radius. From Figure 7b, the three (3) turbulence models were assessed by comparing the normalized tangential velocity distribution of the turbulence models with some selected analytical vortex models by [14,17,20,38] as well as other related experimental data by [12,20,51]. The plot showed a generally fair agreement with the realizable k ε model and the k ω model. However, an amount of over-prediction of the tangential velocity occurred at the outer core of the vortex. Furthermore, at the point of maximum tangential velocity ( R = 1 ), the realizable k ε model over-predicted the tangential velocity. The ability of the   k ω model to provide a better prediction at the boundary or near-wall layers could be the reason why the model outperformed the realizable k ε model [43,48]. The best agreement was, however, obtained from the SST k ω model, which outperformed the k ω model, and this could be attributed to the fact that even though the k ω model is suitable for moderate adverse pressure gradients, the model could exhibit some amount of failure with pressure-induced separation [52], which includes the formation of an air-core vortex. Furthermore, the SST k ω model has been found to be generally robust, with an enhanced performance in terms of flow at walls, adverse pressure gradients as well as flow separation [46,47,51,52,53,54]. From the illustration in Figure 7b, the ranking of the performance of the three turbulence models beginning from the most suitable model is, thus, SST k ω model, k ω model and realizable k ε model.

3.3. Suppression of Air Entrainment Using an Anti-Vortex Device

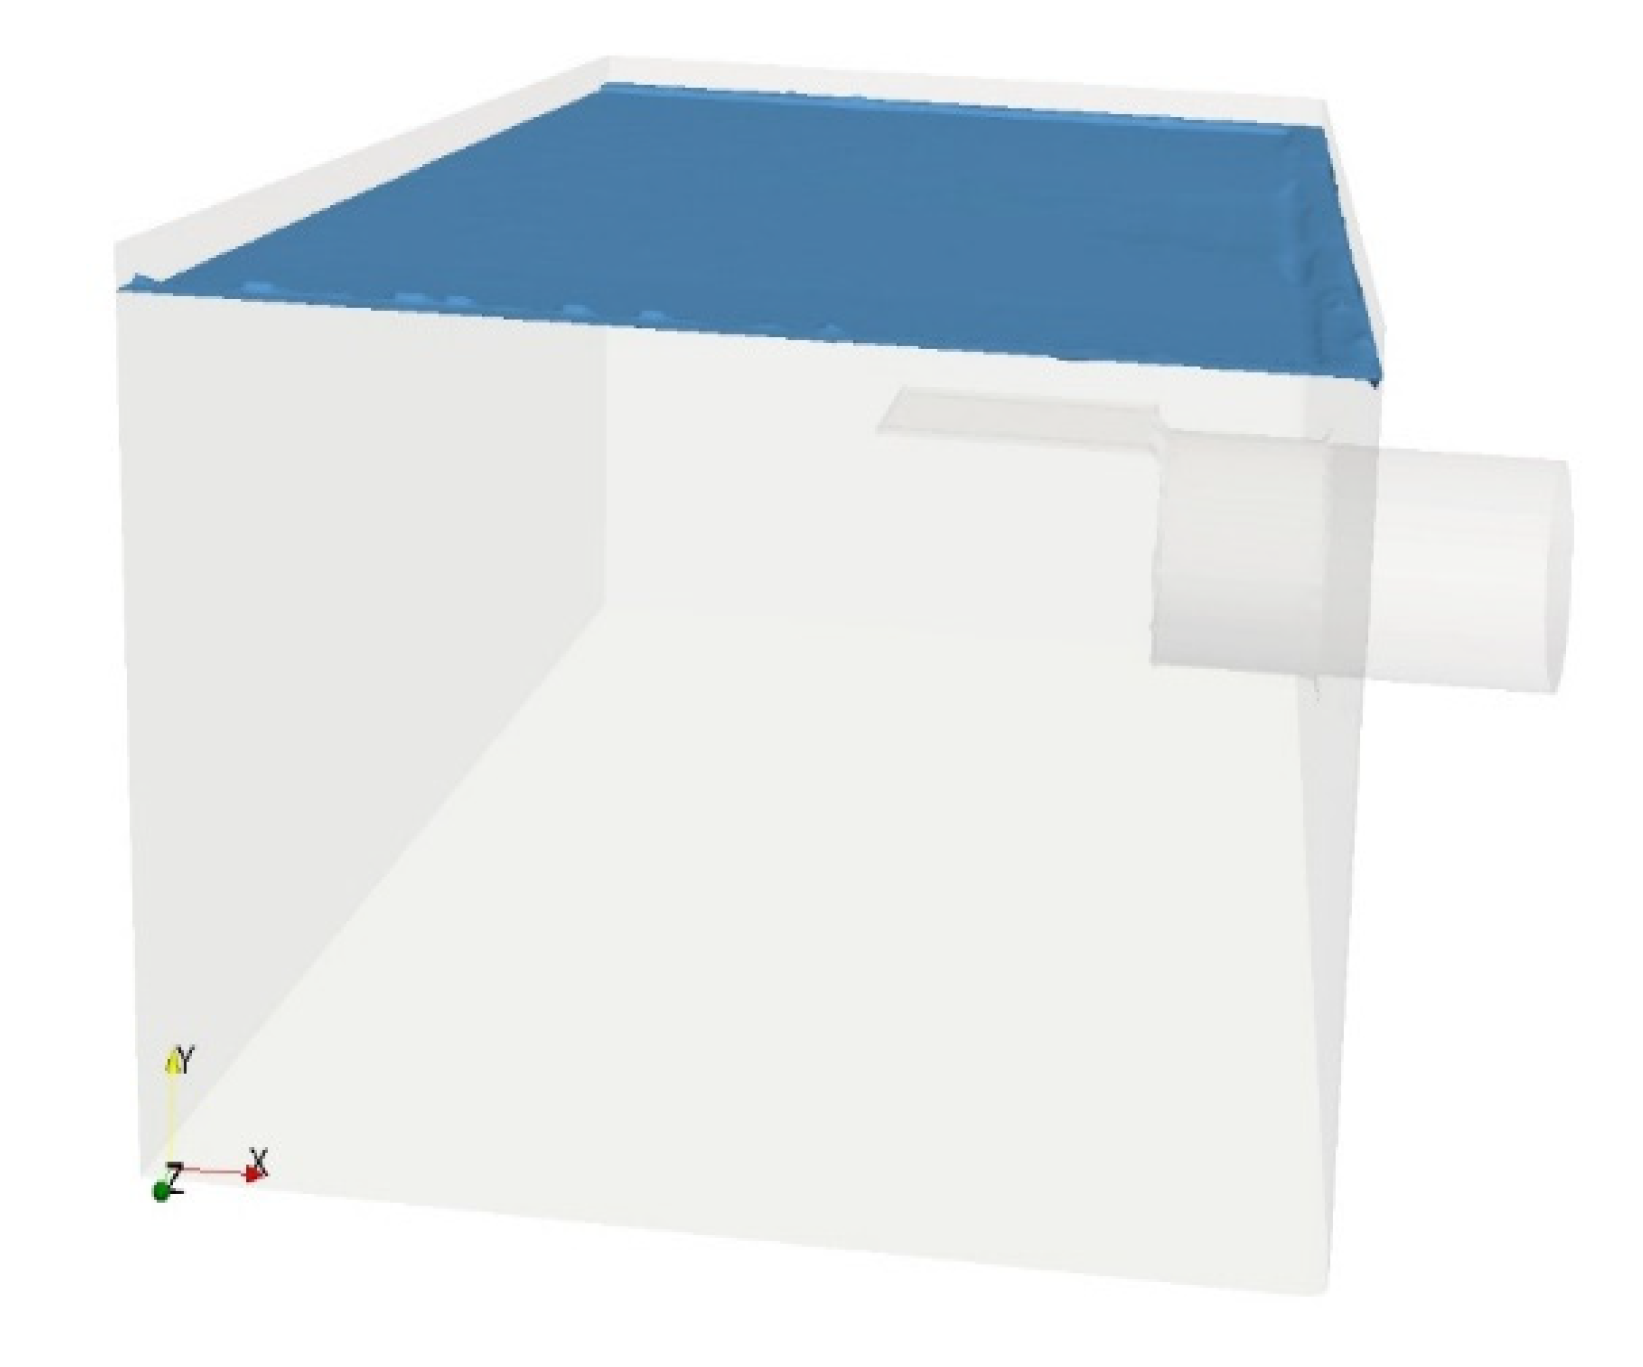
As reported by [31] and observed in Figure 8, the use of the anti-vortex plate resulted in the suppression of the air-core vortex. The region for the anticipated vortex only showed the formation of a slight depression. Ref. [31] observed a reduction of a Type 6 vortex (a stable air-core vortex) to a Type 1 vortex (coherent surface swirl) when a perforated plate serving as an anti-vortex device was installed. The anti-vortex device suppressed the formation of the air-core vortex by inducing turbulence and friction, which succeeded in cutting the path of the vortex core, thus ensuring a relatively smoother flow towards the intake [31]. The formation of the suppressed vortex is illustrated in Figure 8.

4. Conclusions

Optimizing the intake of a hydropower plant often involves the suppression or prevention of the formation of free surface vortices whose occurrence could jeopardize the operations at the facility. In general, numerical simulations have been found to be relevant to such interventions by providing a key complement to experimental studies. In this regard, the study investigated the numerical simulation of an experimentally observed air-core vortex using different turbulence models as well as the suppression of the air-core vortex at an intake. Based on the results from the study, the following conclusions have been drawn:
  • The new approach of using the LTSInterFoam solver, as highlighted in this study, proved to be a reliable means for the steady-state simulation of a free surface vortex at an intake. The LTSInterFoam solver, until now, has been associated with hydrodynamic studies involving ships. However, being a steady state solver, it is unable to account for the transient process of evolution of a free surface vortex.
  • The SST k ω model provided the best results compared to the other turbulence models.
  • The approach highlighted in this study can be used to investigate the effectiveness of an anti-vortex device in suppressing the formation of an air-core vortex.
The authors, thus, recommend that future studies explore the use of the interFoam solver in OpenFOAM to simulate the occurrence of free surface vortices in order to account for the transient process associated with the formation of free surface vortices.

Author Contributions

Conceptualization, R.A.; methodology, M.K.D. and G.T.; software, M.K.D. and G.T.; validation, M.K.D.; formal analysis, M.K.D.; investigation, M.K.D.; resources, G.T. and R.A.; data curation, M.K.D.; writing—original draft preparation, M.K.D.; writing—review and editing, M.K.D.; visualization, M.K.D.; supervision, G.T., S.G., R.A., M.A.-B. and E.A.O.; project administration, G.T., S.G. and R.A.; funding acquisition, M.K.D., G.T., S.G. and R.A. All authors have read and agreed to the published version of the manuscript.

Funding

This research was funded by the Commonwealth Scholarship Commission (CSC) funded by the UK Department for International Development, University of Exeter, UK and the AWD Consult Inc., South Portland, ME, USA.

Acknowledgments

The authors would like to acknowledge the support received from the Commonwealth Scholarship Commission (CSC) funded by the UK Department for International Development, University of Exeter, UK, AWD Consult Inc., South Portland, ME, USA. and the University of Energy and Natural Resources, Sunyani, Ghana. GRT was partly funded on this work by EPSRC Grant #EP/M022382/1 A CCP on Wave/Structure Interaction: CCP-WSI, and #EP/T026782/1 CCP-WSI+ Collaborative Computational Project on Wave Structure Interaction +.

Conflicts of Interest

The authors declare no conflict of interest. The funders had no role in the design of the study; in the collection, analyses, or interpretation of data; in the writing of the manuscript, or in the decision to publish the results.

References

  1. Guyot, G.; Pittion-Rossillon, A.; Archer, A. A free surface vortex modelling with a 3D CFD comparison between an experimental case and a numerical one. In Proceedings of the 3rd IAHR Europe Congress, Porto, Portugal, 14–16 April 2014. [Google Scholar]
  2. Yildirim, N. Critical submergence for a rectangular Intake. J. Eng. Mech. 2004, 130, 1195–1210. [Google Scholar] [CrossRef]
  3. Farell, C.; Cuomo, A.R. Characteristics and modeling of intake vortices. J. Eng. Mech. 1984, 110, 723–742. [Google Scholar] [CrossRef]
  4. Knauss, J. Swirling flow problems at intakes. In IAHR Hydraulic Structures Design Manual 1; Balkema: Leiden, The Netherlands, 1987; pp. 13–38. [Google Scholar]
  5. Rindels, A.J.; Gulliver, J.S. An Experimental Study of Critical Submergence to Avoid Free-Surface Vortices at Vertical Intakes; The University of Minnesota: Minneapolis, MN, USA, 1983. [Google Scholar]
  6. Mulligan, S.; Casserly, J.; Sherlock, R. Effects of geometry on strong free-surface vortices in subcritical approach flows. J. Hydraul. Eng. 2016, 142, 1–12. [Google Scholar] [CrossRef]
  7. Mulligan, S.; Casserly, J.; Sherlock, R. Experimental and numerical modelling of free-surface turbulent flows in full air-core water vortices. In Advances in Hydroinformatics; Gourbesville, P., Cunge, J.A., Caignaert, G., Eds.; Springer WaterSpringer: Singapore, 2016; pp. 549–569. ISBN 9789812876140. [Google Scholar]
  8. Shabara, H.M.; Yaakob, O.B.; Ahmed, Y.M.; Elbatran, A.H. CFD simulation of water gravitation vortex pool flow for mini hydropower plants. J. Teknol. 2015, 74, 77–81. [Google Scholar] [CrossRef] [Green Version]
  9. Levi, E. A fluidic vortex device for water treatment processes. J. Hydraul. Res. 1983, 21, 17–31. [Google Scholar] [CrossRef]
  10. Andoh, R.; Osei, K.; Fink, J.; Faram, M. Novel drop shaft system for conveying and controlling flows from high level sewers into deep tunnels. In Proceedings of the World Environmental and Water Resources Congress, Honolulu, HI, USA, 12–16 May 2008; pp. 1–9. [Google Scholar]
  11. Huang, T.-H.; Jan, C.-D.; Hsu, Y.-C. Numerical simulations of water surface profiles and vortex structure in a vortex settling basin by using FLOW-3D. J. Mar. Sci. Technol. 2017, 25, 531–542. [Google Scholar]
  12. Vatistas, G.H.; Lin, S.; Kwock, C.K. Theoretical and experimental studies on vortex chamber flows. AIAA J. 1986, 24, 635–642. [Google Scholar] [CrossRef]
  13. Rabe, B.K.; Najafabadi, S.H.G.; Sarkardeh, H. Numerical simulation of anti-vortex devices at water intakes. Proc. Inst. Civ. Eng.-Water Manag. 2016, 171, 18–29. [Google Scholar] [CrossRef]
  14. Rankine, W.J.M. Manual of Applied Mechanics; C. Griffen Co.: London, UK, 1858. [Google Scholar]
  15. Scully, M. Computation of Helicopter Rotor Wake Geometry and Its Influence on Rotor Harmonic Airloads; Massachusetts Institute of Technology: Cambridge, MA, USA, 1975. [Google Scholar]
  16. Burgers, J.M. A mathematical model illustrating the theory of turbulence. Adv. Appl. Mech. 1948, 1, 171–199. [Google Scholar]
  17. Vatistas, G.H.; Kozel, V.; Mih, W.C. A simpler model for concentrated vortices. Exp. Fluids 1991, 11, 73–76. [Google Scholar] [CrossRef]
  18. Hite, J.E.; Mih, W.C. Velocity of air-core vortices at hydraulic intakes. J. Hydraul. Eng. 1994, 120, 284–297. [Google Scholar] [CrossRef]
  19. Wang, Y.; Jiang, C.; Liang, D. Comparison between empirical formulae of intake vortices. J. Hydraul. Res. 2011, 49, 113–116. [Google Scholar] [CrossRef]
  20. Sun, H.; Liu, Y. Theoretical and experimental study on the vortex at hydraulic intakes. J. Hydraul. Res. 2015, 53, 787–796. [Google Scholar] [CrossRef]
  21. Gordon, J.L. Vortices at Intake. Water Power 1970, 22, 137–138. [Google Scholar]
  22. Reddy, Y.R.; Pickford, J.A. Vortices at Intakes in Conventional Sump. Water Power 1972, 24, 108–109. [Google Scholar]
  23. Prosser, M.J. The Hydraulic Design of Pump Sumps and Intake; British Hydromechanics Research Association: Cranfield, UK, 1977. [Google Scholar]
  24. Nakayama, A.; Hisasue, N. Large eddy simulation of vortex flow in intake channel of hydropower facility. J. Hydraul. Res. 2010, 48, 415–427. [Google Scholar] [CrossRef]
  25. Chen, Y.; Wu, C.; Wang, B.; Du, M. Three-dimensional Numerical Simulation of Vertical Vortex at Hydraulic Intake. Procedia Eng. 2012, 28, 55–60. [Google Scholar] [CrossRef] [Green Version]
  26. Suerich-Gulick, F.; Gaskin, S.; Villeneuve, M.; Holder, G.; Parkinson, E. Experimental and numerical analysis of free surface vortices at a hydropower intake. In Proceedings of the 7th International Conference on Hydroscience and Engineering, Philadelphia, PA, USA, 10–13 September 2006; pp. 1–11. [Google Scholar]
  27. Ahn, S.; Xiao, Y.; Wang, Z.; Zhou, X.; Luo, Y. Numerical prediction on the effect of free surface vortex on intake flow characteristics for tidal power station. Renew. Energy 2017, 101, 617–628. [Google Scholar] [CrossRef]
  28. Sarkardeh, H. Numerical calculation of air entrainment rates due to intake vortices. Meccanica 2017, 52, 3629–3643. [Google Scholar] [CrossRef]
  29. Chen, Y.; Wu, C.; Ye, M.; Ju, X. Hydraulic characteristics of vertical vortex at hydraulic intakes. J. Hydrodyn. Ser. B 2007, 19, 143–149. [Google Scholar] [CrossRef]
  30. Kabiri-Samani, A.R.; Borghei, S.M. Effects of anti-vortex plates on air entrainment by free vortex. Sci. Iran. 2013, 20, 251–258. [Google Scholar]
  31. Amiri, S.M.; Roshan, R.; Zarrati, A.R.; Sarkardeh, H. Surface vortex prevention at power intakes by horizontal plates. Proc. Inst. Civ. Eng. Manag. 2011, 164, 193–200. [Google Scholar] [CrossRef]
  32. Taghvaei, S.M.; Roshan, R.; Safavi, K.; Sarkardeh, H. Anti-vortex structures at hydropower dams. Int. J. Phys. Sci. 2012, 7, 5069–5077. [Google Scholar] [CrossRef]
  33. Monshizadeh, M.; Tahershamsi, A.; Rahimzadeh, H. Vortex dissipation using a hydraulic-based anti-vortex device at intakes. Int. J. Civ. Eng. 2017, 16, 1137–1144. [Google Scholar] [CrossRef]
  34. Monshizadeh, M.; Tahershamsi, A.; Rahimzadeh, H.; Sarkardeh, H. Comparison between hydraulic and structural based anti-vortex methods at intakes. Eur. Phys. J. Plus 2017, 132, 1–11. [Google Scholar] [CrossRef]
  35. Tahershamsi, A.; Rahimzadeh, H.; Monshizadeh, M.; Sarkardeh, H. A new approach on anti-vortex devices at water intakes including a submerged water jet. Eur. Phys. J. Plus 2018, 133, 1–11. [Google Scholar] [CrossRef]
  36. Borghei, S.M.; Kabiri-Samani, A.R. Effect of anti-vortex plates on critical submergence at a vertical intake. Sci. Iran. 2010, 17, 89–95. [Google Scholar]
  37. Trivellato, F. Anti-vortex devices: Laser measurements of the flow and functioning. Opt. Lasers Eng. 2010, 48, 589–599. [Google Scholar] [CrossRef]
  38. Mih, W.C. Discussion of Analysis of fine particle concentrations in a combined vortex. J. Hydraul. Res. 1990, 28, 392–395. [Google Scholar] [CrossRef]
  39. Sarkardeh, H.; Zarrati, A.R.; Jabbari, E.; Tavakkol, S. Velocity field in a reservoir in the presence of an air-core vortex. Proc. Inst. Civ. Eng. Manag. 2014, 167, 356–364. [Google Scholar] [CrossRef]
  40. Jones, W.P.; Launder, B.E. The prediction of laminarization with a two-equation model of turbulence. Int. J. Heat Mass Transf. 1972, 15, 301–314. [Google Scholar] [CrossRef]
  41. Yakhot, V.; Orszag, S.A. Renormalization group analysis of turbulence. I. Basic theory. J. Sci. Comput. 1986, 1, 3–51. [Google Scholar] [CrossRef]
  42. Yakhot, V.; Orszag, S.A.; Thangam, S.; Gatski, T.B.; Speziale, C.G. Development of turbulence models for shear flows by a double expansion technique. Phys. Fluids 1992, 4, 1510–1520. [Google Scholar] [CrossRef] [Green Version]
  43. Andersson, B.; Andersson, R.; Håkansson, L.; Mortensen, M.; Sudiyo, R.; Van Wachem, B. Computational Fluid Dynamics for Engineers; Cambridge University Press: Cambridge, UK, 2011. [Google Scholar]
  44. Wilcox, D. Reassessment of the scale-determining equation for advanced turbulence models. AIAA J. 1988, 26, 1299–1310. [Google Scholar] [CrossRef]
  45. Wilcox, D.C. Turbulence Modeling for CFD, 2nd ed.; DCW Industries: La Canada, CA, USA, 1998. [Google Scholar]
  46. Menter, F.R. Review of the shear-stress transport turbulence model experience from an industrial perspective. Int. J. Comput. Fluid Dyn. 2009, 23, 305–316. [Google Scholar] [CrossRef]
  47. Menter, F.R.; Carregal, F.J.; Esch, T.; Konno, B. The SST turbulence model with improved wall treatment for heat transfer predictions in gas turbines. In Proceedings of the International Gas Turbine Congress, Tokyo, Janpan, 2–7 November 2003. [Google Scholar]
  48. Robinson, S.K.; Kline, S.J.; Spalart, P.R. A review of quasi-coherent structures in a numerically simulated turbulent boundary layer. NASA Tech. Rep. 1989, TM-10, 1–44. [Google Scholar]
  49. Robinson, S.K. Coherent Motions in the Turbulent Boundary Layer. Annu. Rev. Fluid Mech. 1991, 23, 601–639. [Google Scholar] [CrossRef]
  50. Moukalled, F.; Mangani, L.; Darwish, M. The Finite Volume Method in Computational Fluid Dynamics. An Advanced Introduction with OpenFoam® and Matlab®; Thess, A., Moreau, R., Eds.; Springer International Publishing: New York, NY, USA, 2016; ISBN 0926-5112. [Google Scholar]
  51. Robertson, J.M. Hydrodynamics in Theory and Application; Prentice-Hall Inc.: Englewood Cliffs, NJ, USA, 1965. [Google Scholar]
  52. Menter, F.R. Zonal two-equation k-ω turbulence model for aerodynamic flows. AIAA Pap. 1993, 1993–2906. [Google Scholar]
  53. Menter, F.R.; Kuntz, M.; Langtry, R. Ten years of industrial experience with the SST turbulence model. Turbul. Heat Mass Transf. 2003, 4, 625–632. [Google Scholar]
  54. Menter, F. Two-equation eddy-viscosity turbulence models for engineering applications. AIAA J. 1994, 32, 1598–1605. [Google Scholar] [CrossRef] [Green Version]
Figure 1. Experimental set-up by [39].
Fluids 05 00221 g001
Figure 2. Meshed geometry with its associated boundaries.
Fluids 05 00221 g002
Figure 3. Vortex formed at the intake (side view).
Fluids 05 00221 g003
Figure 4. Streamlines illustrated with surface line integral convolution.
Fluids 05 00221 g004
Figure 5. Velocity vector plot.
Fluids 05 00221 g005
Figure 6. Velocity field plot.
Fluids 05 00221 g006
Figure 7. (a): Comparison of results from the three different turbulence models. (b): Comparison of the results from the different turbulence models with other studies.
Fluids 05 00221 g007aFluids 05 00221 g007b
Figure 8. A slight surface depression formed in the presence of the anti-vortex plate.
Fluids 05 00221 g008
Table 1. Boundary conditions.
VariableInletOutletWallsAtmosphere
UflowRateInletVelocityflowRateInletVelocityfixedValuepressureInlet-
OutletVelocity
p rghfixedFluxPressurezeroGradientzeroGradienttotalPressure
alpha.watergroovyBCzeroGradientzeroGradientinletOutlet
nutcalculatedcalculatednutkRoughWall-FunctionzeroGradient
kfixedValueinletOutletkqRWallFunctioninletOutlet
omegafixedValueinletOutletomegaWallFunctioninletOutlet
Publisher’s Note: MDPI stays neutral with regard to jurisdictional claims in published maps and institutional affiliations.