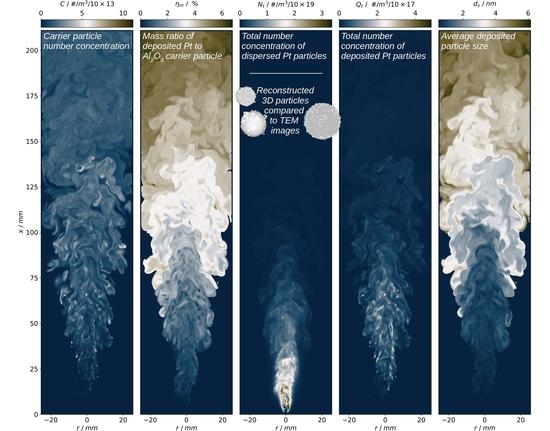
Article

Multiscale Simulation of the Formation of Platinum-Particles on Alumina Nanoparticles in a Spray Flame Experiment

1
Fluid Dynamics—Institute for Combustion and Gas Dynamics (IVG), University of Duisburg-Essen, 47057 Duisburg, Germany
2
Reactive Fluids—Institute for Combustion and Gas Dynamics (IVG), University of Duisburg-Essen, 47057 Duisburg, Germany
3
Center for Nano-Integration—CENIDE, University of Duisburg-Essen, 47057 Duisburg, Germany
4
Center for Computational Science and Simulation—CCSS, University of Duisburg-Essen, 47057 Duisburg, Germany
*
Author to whom correspondence should be addressed.
Fluids 2020, 5(4), 201; https://doi.org/10.3390/fluids5040201
Submission received: 9 October 2020 / Revised: 3 November 2020 / Accepted: 3 November 2020 / Published: 7 November 2020
(This article belongs to the Special Issue Modelling of Reactive and Non-reactive Multiphase Flows)

Abstract

:
Platinum decorated alumina particles have the potential of being a highly (cost-)effective catalyst. The particles are synthesized from platinum(II) acetylacetonate dissolved in a mixture of isopropanol and acetic acid with dispersed alumina carriers. The process is simulated by means of large eddy simulation with reaction kinetics and aerosol dynamics modeling. A two mixture fraction approach for tabulated chemistry with a thickened flame model is used to consider the complex reaction kinetics of the solvent spray combustion. Diffusion is described followings Ficks law with a unity Lewis number for the gas phase species, whereas the particle diffusion coefficients are calculated according to the kinetic theory. An extended model for aerosol dynamics, capable of predicting deposition rate and surface particle growth, is derived from the classical sectional technique. The simulations are compared and validated with product particle characteristics obtained from the experimental observations. Distributions for different locations within the simulation domain show the evolution of particle sizes deposited on the alumina particle surface, and transmission electron microscopy (TEM) images of the composite particles are shown in comparison to 3D particles ballistically reconstructed from simulation data. The ratio of deposited platinum on the alumina carrier particles and the mean diameters of the deposited particles are in good agreement with the experimental observation. Overall, the new method has demonstrated to be suitable for simulating the particle decoration process.

Graphical Abstract

1. Introduction

Platinum powders play an integral role as the catalyst for processes in the automotive, chemical and pharmaceutical industry. The efficiency of the catalyst is directly related to the free surface area. Composite nanoparticles are suitable to reduce the amount of platinum mass required to achieve a large surface area and provide a stable support structure at the same time. The production of composite nanomaterials puts high demands on the flexibility and reliability of the synthesis, and the flame spray pyrolysis [1,2] has shown to be a very good option for such a process. The SpraySyn burner is used in the present study [3,4], which allows mixing priorly generated (and possibly pre-processed) carrier particles into the precursor solvent, which reduces the process complexity by removing the step of carrier particle formation. The simulation of the entire synthesis requires the properly coupled numerical solution of a series of processes taking place at different scales: spray evaporation and combustion, convective transport, combustion and decomposition of the particle precursor, particle formation and growth. The modeling and simulation challenge is obvious and Buesser and Gröhn [5] pointed out, that the coupling between processes taking place at very different scales remains a challenge. The present work is devoted to an attempt of a numerical simulation that covers the scales from the operating synthesis device, down to the decoration of carrier particles with freshly formed nanoparticles. As these simulations require a large portfolio of models and solution methods, the following review is compact and limited to methods relevant for this work.
In the past, the flame spray pyrolysis was simulated using Reynolds-averaged Navier–Stokes (RANS), for example by Noriler et al. [6], Weise et al. [7] and Gröhn et al. [8]. The quality of the simulations usually suffered from a large uncertainty in the boundary conditions and the closure approaches between the turbulence, the reaction kinetics and the particle dynamics. To obtain spray and droplet boundary conditions, Weise et al. [7] conducted a direct simulation of the primary spray breakup prior to the main simulations. To compensate for the uncertainties in the breakup mechanism, they investigated the sensitivity of the simulation to this boundary condition. All these simulation approaches [6,7,8] used global reaction kinetics schemes for the combustion of the solvent and of the nanoparticle precursor. The particle dynamics were described using the monodisperse moment model introduced by Kruis et al. [9]. The results of these simulations appear to be in line with the experimental observation, but the prediction quality is difficult to assess. The over-simplification of the reaction kinetics, particle growth and formation physics, and their interaction with turbulent mixing may lead to compensating errors. In turn, large eddy simulation (LES) promises to provide a higher level of fidelity for the coupling of reaction kinetics and particle dynamics in the presence of turbulent mixing. Rittler et al. [10] showed an LES with tabulated chemistry approach, coupled with the monodisperse moment method model to predict the spray-flame synthesis of silica nanoparticles. This approach was also used for the assessment of the newly developed SpraySyn Burner [4]. Until now, these remained the only LES of the flame spray pyrolysis process. Very recently, Abdelsamie et al. [11] presented a direct numerical simulation (DNS) of the SpraySyn burner, but without modeling the particle dynamics. It should, however, be stressed that even with LES, closure modeling of nanoparticle synthesis is in its early development, and that more sophisticated models will be needed in the future. The present work is an attempt to demonstrate what can be achieved today, but is also meant to inspire future work and to improve the many closure models involved.
The mechanisms controlling particle evolution are a complex interplay of thermodynamic, chemical and mixing phenomena in time and space [12,13]. Only few analytical solutions for generic configurations of the initial and boundary conditions and reduced sets of particle properties exist [14]. The population balance equation (PBE) describing the dynamics of particle evolution is usually solved numerically, considering sets of constraining assumptions [15,16]. Among the large variety of solution methods, the sectional model is highly attractive for coupling with computational fluid dynamics (CFD), despite the unfavorable algorithmic complexity if more than a single particle property is considered. The fundamental idea of the sectional approach [17] is to distribute the particle size spectrum into fixed, discrete sections. As a result of its rather simple implementation, the standard sectional model is prominent for being an extension for CFD calculations, as resolved polydispersity is vital for modeling real flame synthesis processes and computational costs are moderate. The model has been applied to non-reactive direct numerical simulations (DNS) and large eddy simulations have been performed by Garrick et al. [18] and Loeffler [19]. Later, the sectional model was extensively utilized in the simulation of soot particle size distributions (PSDs) in turbulent and laminar flames [20,21,22,23].
The present paper describes the simulation of platinum particle synthesis and their subsequent deposition on alumina carrier particles; it is structured as follows: The next section presents the experiment, the synthesis setup and the employed characterization methods followed by the the models and numerical methods as a central topic of this work. The results, experiment and simulation of the synthesis process are discussed in Section 4, while the details on verification and validation of the proposed simulation strategy are discussed in the Appendix A.

2. Experimental

A solution with a concentration of 8 mM Platinum(II)acetylacetonate ( Pt ( acac ) 2 , 98% purity, Acros Organics, Fair Lawn, NJ, USA) in 50%-vol acetic acid (99.8% purity, for analysis, Acros Organics) and 50%-vol isopropanol (VWR Chemicals, Randor, PA, USA), was prepared. Aluminum oxide nanoparticles (3%-weight, Al 2 O 3 NanoGrain, Umicore, Brussels, Belgium) were dispersed in the solution using an ultrasonic homogenizer (UP200S, Hielscher, Teltow, Germany). The mixture was burnt in an enclosed spray-flame reactor (described in other publications [24,25]) by supplying the prepared dispersion to a two-fluid external-mixing atomizing nozzle at a flow rate of 2 mL/min, using a high precision syringe pump (neMESYS, Cetoni GmbH, Korbussen, Germany). Using a flow rate of 6 slm (standard liters per minute) of oxygen ( O 2 , Air Liquide, Paris, France) as atomizing gas, a fine spray of the supplied dispersion was formed. This spray is ignited by a premixed pilot flame of 2 slm methane ( CH 4 , Air Liquide, Paris, France, N25, 99.5% purity) and 4 slm oxygen ( O 2 , Air Liquide, Paris, France, technical). The pilot flame is stabilized on a sintered bronze plate and is surrounded by a sheath-gas flow of air (approx. 0.63 m/s at 25 °C), which also shields the flame from the walls of the reactor. Above the reaction zone, a quenching gas flow is supplied (80 slm, air) in order to freeze the aerosoldynamics, and to control the temperature before the collection of the particles in the filter of the system. The morphology and particle size of the synthesized materials were studied by TEM with a JEOL JEM-2200FS device (JEOL Ltd., Tokyo, Japan), which counts with a ZrO/W(100) field emission electron source (Schottky) at an accelerating voltage from 80 to 200 kV. The device counts with a point resolution up to 0.19 nm (ultra high resolution pole piece), a line resolution of 0.10 nm and a magnification range from ×50 to ×1,500,000. The TEM device has an integrated energy-dispersive X-ray spectroscopy (EDX) detector (windowless 80 mm 2 SDD X-MaxN 80 TLE Oxford Instruments detector with 0.21 sr solid angle, Oxford Instruments, High Wycombe, Buckinghamshire, UK) which allowed to identify the platinum and aluminum elemental distribution in the sample. Figure 1 shows example TEM and EDX images of a platinum-decorated alumina particle created in the described synthesis process.
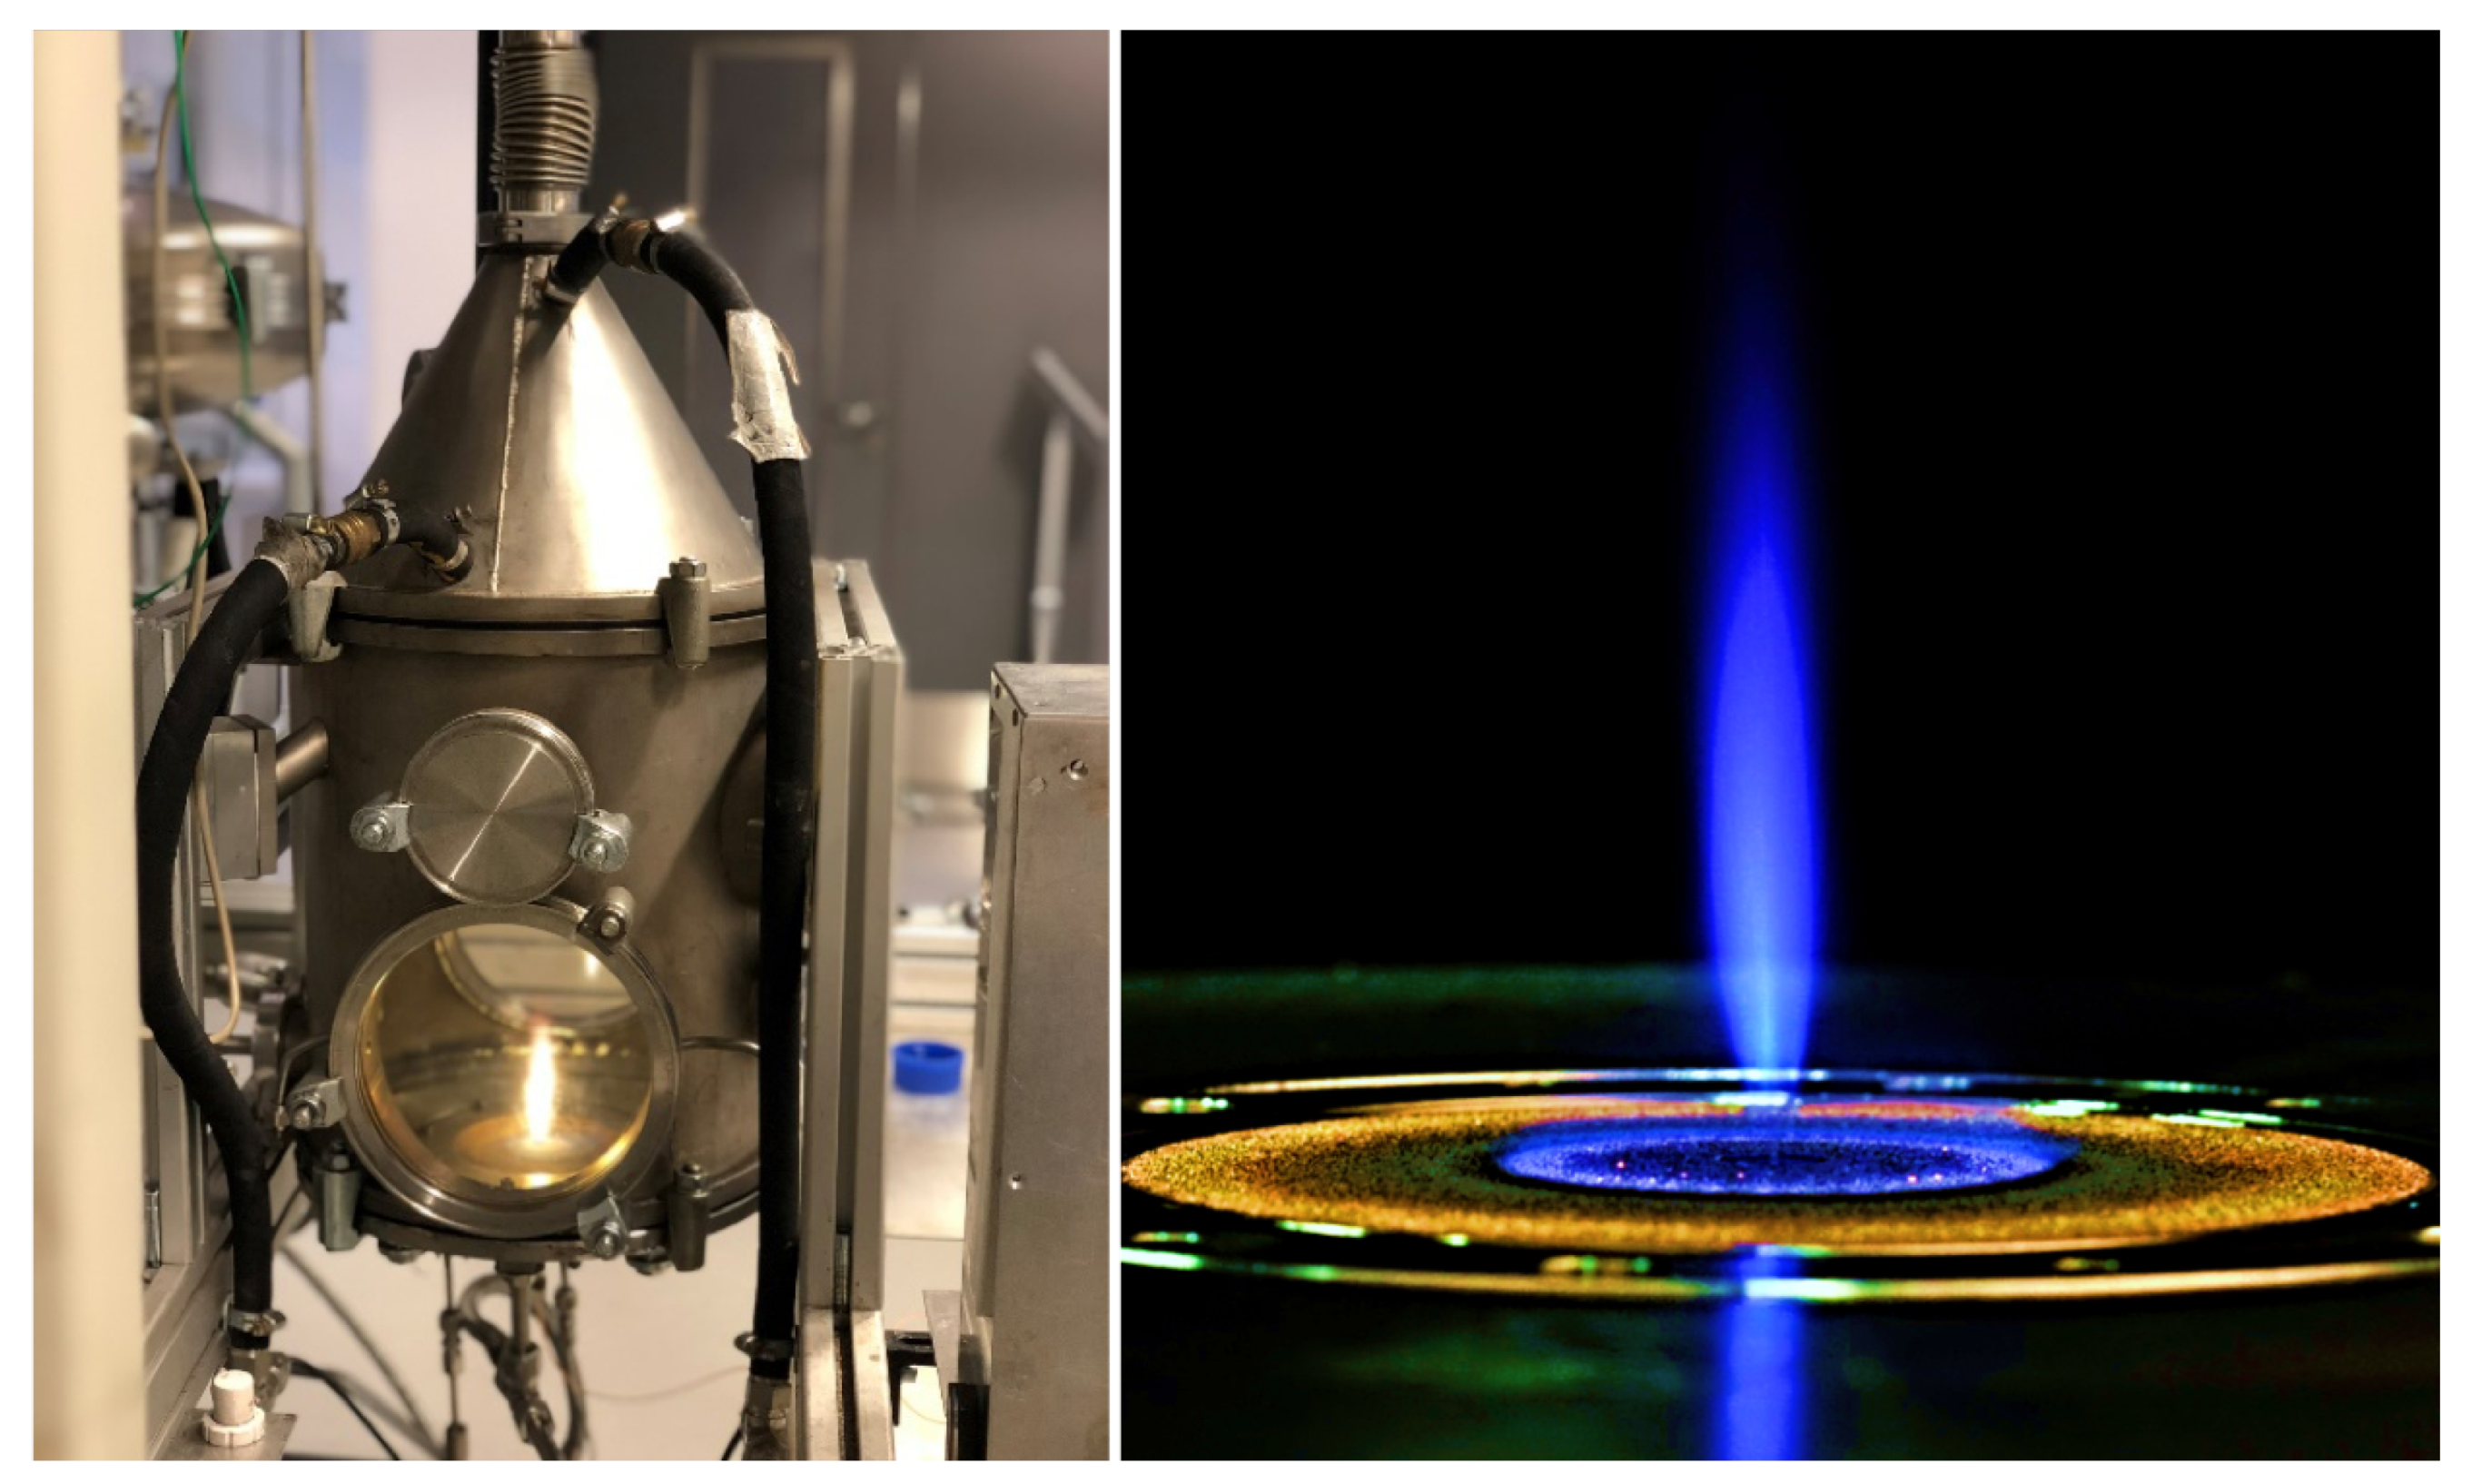
Figure 2 shows the experimental setup (left) and a close-up of the burner (right) in operation. For further details and sketches of the burner, the reader is referred to the work of Schneider et al. [4].

3. Modeling

The large eddy simulation (LES) of the reactive flow field uses an extended premixed flamelet generated manifolds approach (PFGM) [26,27]. A single-step global reaction is introduced for the decomposition of Pt ( acac ) 2 , based on observations reported in literature [28,29,30]. The tabulated chemistry is applied for the combustion of Pt ( acac ) 2 dissolved in a mixture of isopropanol and acetic acid. The sectional model is extended in order to account for interactions between the small sized (0.34–20.0 nm) platinum and the much larger (400 nm in average) alumina nanoparticles. Therefore, a second particle ensemble is introduced representing the particles deposited on the alumina particle surface (in the following referred to as carrier). As shown by Simonsen et al. [31], the deposited particle matter tends to reduce its free surface area due to surface coagulation. Thus, a two-dimensional coagulation model, based on the theory for free molecular collision, is derived to describe the particle motion on the carrier’s surface and which is in close agreement with the theory by Peev [32]. The goal is predicting tendencies for deposition rates and structure sizes of the deposited material in a real flame, without claiming predictions to come close to the accuracy reached by detailed molecular dynamics simulations.

3.1. Reaction Kinetics and Turbulence Chemistry Interaction

The role of the solvent is to stabilize the carrier particles in the liquid and to provide, through combustion, the controlled amount of energy to decompose the nanoparticle precursor into gas phase molecules. The mixture of 50%-vol isopropanol ( C 3 H 8 O ) and acetic acid ( CH 3 COOH ) enabled stable dispersions, but is unusual for general combustion purposes. In order to describe the combustion kinetics of this mixture, the “Primary Reference Fuels (PRF) + PAH” mechanism for high and low temperatures [33,34] was used, which includes 300 species and 11,790 reactions. The mechanism was extended by a single global reaction for the decomposition of Pt ( acac ) 2 into platinum and volatiles at 155 °C, based on the observations, which were found in the work of Utrianen et al. [28].
Pt ( acac ) 2 Pt + 2 CH 2 CHO + 2 HCCO + 2 CH 3
Due to the lack of data for the kinetics of the Pt ( acac ) 2 decomposition, the reaction rate expression was adjusted to the reported decomposition temperature and to remain within the kinetic collision limit, leading to:
k = 1.8 × 10 6 T 0.5 exp 7500 K / T
Platinum is a strong catalyst and may interact with the flame chemistry creating various ephemeral platinum intermediates [35]. This interaction is neglected in the current model due to lacking data for an implementation into the reaction mechanism. Moreover, platinum is known for its very high chemical stability justifying our assumption of pure platinum clusters as product from a flame synthesis. The reaction mechanism of the solvent mixture is complex and intractable in LES with a finite rate model (at least without extreme mechanism reduction). Instead, the premixed flamelet generated manifold approach (PFGM), as introduced by van Oijen et al. [26,36], has been applied by using a pre-generated table of one-dimensional, steady, premixed flame solutions [37,38]. Due to the presence of two fuel streams (pilot flame and spray), the PFGM approach had to be extended by an additional fuel mixture fraction ( f 2 ). Consequently, the dimensionality of the chemistry database is increased from two to three. The progress variable Y p is represented by a weighted linear combination of product- and fuel/precursor species consumption.
Y p = α i Y i + β i ( Y f , i Y i )
Here, the first and the second term on the right hand side (rhs) represent the product and fuel species contribution with their respective weighting factors α and β , while Y f , i denotes the mass fraction of the given fuel composition. We considered a progress variable combination of CO , CO 2 , H 2 and Pt (with α = 1 , 2 , 20 , 200 , respectively) together with consumption variables CH 4 , isopropanol and acetic acid ( β = 1 for each) to be suitable for the given case. The weighting is important, if species with different molar masses or concentrations contribute considerably to the progress variable. Due to the variable bounds of Y p , the more convenient scaled progress variable c is used for tabulation [26].
c = Y p Y p , m a x f 1 , f 2
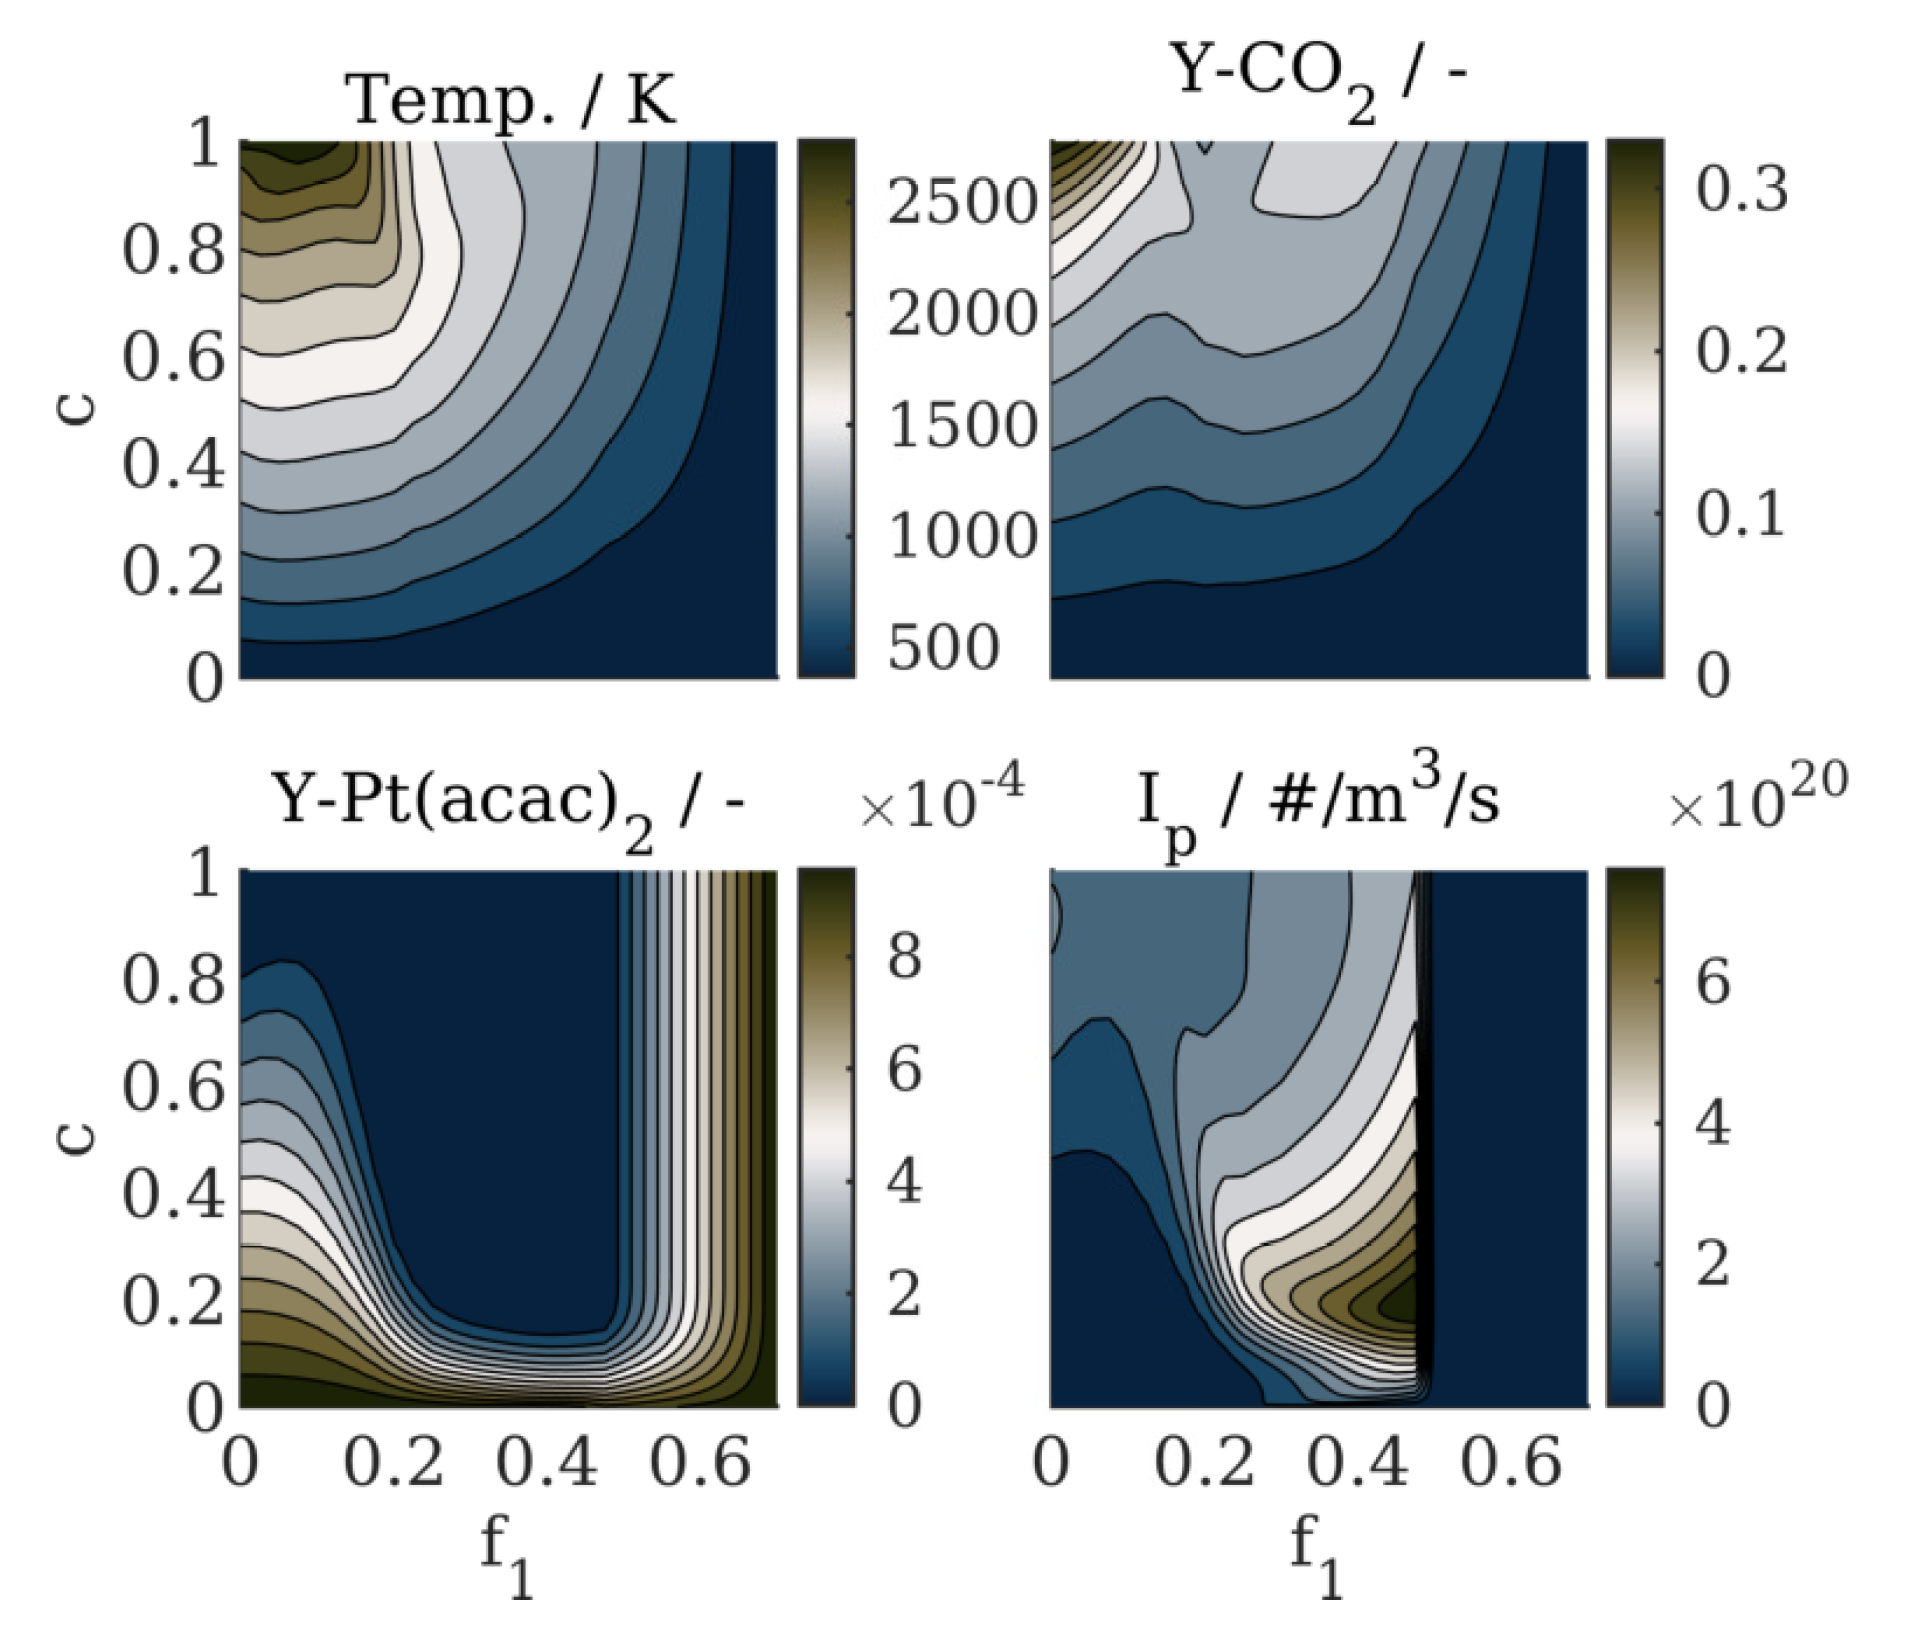
The scaled progress variable given by Equation (2) offers always a convenient range between 0 and 1 due to the division by the maximum value of the progress variable value Y p , m a x and corresponds to a given set of f 1 and f 2 . Figure 3 shows the data obtained by this procedure for 4 different quantities and conditioned for f 2 = 0.15 .
Considering a constant Lewis number of unity for the turbulent flow field, the conservation equations for the Favre averaged mixture fractions f i ˜ can be given as follows:
ρ ¯ f ˜ i t + · u ˜ ρ ¯ f ˜ i = · F D Ξ Δ λ c p + 1 Ω μ t S c t f ˜ i + Γ f , i
The quantities ρ ¯ and u ˜ denote the filtered spatially averaged density and the Favre averaged velocity vector [39]. The variables λ , c p , μ t and S c t represent the thermal conductivity, the isobaric heat capacity, the subgrid viscosity obtained by the sigma model [40] and the turbulent Schmidt number ( S c t = 0.7 ) of the gas mixture. The last term of Equation (3) adds mass fluxes due to spray evaporation:
Γ f , i = d ρ ¯ i d t e v a p
The variable ρ ¯ i denotes the averaged mass per volume of fuel i added to the gas phase. The evaporation source only contributes to the second mixture fraction, such that the first evaporation source vanishes, Γ f , 1 = 0 . The influence of turbulence on chemical sources is modeled by the artificial flame thickening approach (ATF, [41,42]) in combination with the sigma model [40] for modeling of the subgrid fluxes. Here, the thickening factor F D is calculated based on the normalized progress variable c:
F D ( c * , f i ) = ( d c / d x ) | c = c * ( d c ˜ / d x ) | c ¯ = c *
The denominator ( d c ˜ / d x ) | c ¯ = c * is computed by Gaussian filtering of the c-profile [43] at c * with a filter width of the LES cell size Δ . Subsequently, the flame sensor Ω is obtained by normalizing the thickening factor:
Ω = F D 1 F D , m a x 1
The variable F D , m a x = max ( F D ) denotes the maximum thickening factor of the laminar flame. The Charlette et al. [44] subgrid wrinkling factor Ξ Δ model with β = 0.5 is used in this work, including the modification by Wang et al. [45] for the compatibility with finer resolved LES.
Ξ Δ = 1 + min Δ f δ l 0 1 , Γ Δ u Δ f S l 0 β
With the filter width of Δ f = max ( n Δ , δ l 0 ) , the flame front is resolved on at least n (=8 in this work) grid points with a threshold of the laminar flame thickness δ l 0 . It is evaluated from the difference of the burned and the unburned gas temperatures ( T b and T u ) of the one dimensional laminar flame δ l 0 = ( T b T u ) / dT / dx during the step of FGM-table generation. The efficiency function Γ Δ introduced in the work of Charlette et al. [44] is used to model the effect of the net sub filter strain. Applying the ATF approach for the turbulence chemistry interaction, the conservation equation for the progress variable can be calculated similar to Equation (3):
ρ ¯ Y ˜ P t + · u ˜ ρ ¯ Y ˜ P = · F D Ξ Δ λ c p + 1 Ω μ t S c t Y ˜ P + Γ Y P
The term Γ Y P in Equation (8) is the sum of chemical reaction ω ˙ P and the evaporating fresh fuel (second term) given by:
Γ Y P = Ξ Δ F D ω ˙ P d ρ ¯ d t e v a p
The spray droplets are transported as Lagrangian particles and the model of droplet evaporation follows the implementation presented by Rittler et al. [10,46]. The conservation equation for the nucleated mass is then derived consistently with the progress variable Y p , Equation (8) and results in:
ρ ¯ Y ˜ I t + · u ˜ ρ ¯ Y ˜ I = · F D Ξ Δ λ c p + 1 Ω μ t S c t Y ˜ I + d ρ ¯ I d t
The last term of Equation (10) is the averaged mass source given for a certain combustion state. Due to the fact that the gas composition is shifted by spray evaporation and nucleating species are formed unevenly over the combustion progress, using a tabulated source term would lead to drastic errors in predicting the nucleating mass for the dispersed phases. Instead, it is obtained by tracking the change of the incepted particle mass Φ p per time step.
d ρ ¯ I d t = Ξ Δ F D ω ˙ I x i , t 1 Δ t Δ Φ p ( c , f i )
The incepted particle mass Φ p is tabulated and represents the produced nucleating matter per volume for a given condition ( f i , c ). It is obtained using the flamelet data:
Φ p ( c , f i ) = 0 x ( c , f i ) ω ˙ I u ρ d x ρ ( c , f i )
The quantity ω ˙ I represents the chemical net production rate of the incepted species, x the axial position and ρ the gas density, respectively. It should be mentioned that the ATF approach is implicitly included in the change of integral nucleated mass Δ Φ p ( c , f i ) and therefore not applied in the last term of Equation (11).

3.2. Modeling Nanoparticle Dynamics

The transport of nanoparticles within the CFD context is given by applying the Reynolds transport theorem on the PBE. In the case of LES coupled with the sectional model [17], this leads to an additional conservation equation for the filtered spacial averaged number concentration N ¯ k of every considered section (see. Loeffler et al. [19]) given by:
N ¯ k t + · u ˜ N ¯ k = · F D Ξ Δ D N k + 1 Ω ν t S c t N ¯ k + d N ¯ k d t
In this work, a second set of particles in the gas phase (alumina carrier particles of constant size), as well as the PBE of the particles deposited on the carrier particle surface must be considered. Therefore, conservation equations for the carrier particle number concentration C, Equation (14), and for the deposited particle number concentrations Q k , Equation (15), are derived by the same principle, with special attention to the diffusion term in Equation (15), which was checked for validity when used with Fick’s law [47].
C ¯ t + · u ˜ C ¯ = · F D Ξ Δ D C + 1 Ω ν t S c t C ¯ + d C ¯ d t
Q ¯ k t + · u ˜ Q ¯ k = · F D Ξ Δ D C + 1 Ω ν t S c t Q ¯ k + d Q ¯ k d t
For Equations (13) to (15), the kinematic subgrid viscosity is given by ν t = μ t / ρ , whereas the particle diffusion coefficient for each section D i and for the carrier particle D C are computed as proposed by Friedlander [48]. The last terms on the rhs of Equations (13) to (15) contain the changes by particle dynamics, i.e., coagulation between all particle classes and inception rates and will be explained in the following. Figure 4 sketches the general modeling strategy, where equally sized carrier particles suspended within the spray droplet are assumed to be released when the droplet collapses. The platinum precursor evaporates together with the fuel as a perfect mixture, whereas nucleation and coalescence take place within the gas phase until condensation on the carrier surface. Particle growth on the carrier surface is modeled kinetically, based on the coverage of deposited particle size classes.
Collisions between particle pairs i , j within the gas phase (i.e., for platinum particles) are described by the harmonic mean, Equation (16), of the collision frequencies β i , j f for the free molecular regime, Equation (17) and β i , j c for the continuum regime, Equation (18) [49,50].
β i j * = β i j c β i j f β i j c + β i j f
In the free molecular regime, the collision frequency is:
β i j f = 2.2 π k b T 2 1 / 2 1 m i + 1 m j 1 / 2 d c , i + d c , j 2
The particle mass is denoted by m i , while the foregoing multiplicator 2.2 is the van der Waals enhancement factor originally defined for soot particles [51], but successfully applied for other material systems [52,53]. The variables k b , T and d c , i stand for the Boltzmann constant, the gas phase temperature and the collision diameters of the particles [54]. In the continuum regime, the collision frequency is given as a function of the Cunningham slip correction factor C i [55]:
β i j c = 2 k b T 3 μ C i d c , i + C j d c , j d c , i + d c , j
Since particles in the present case are mainly of round shape, the collision diameter is equal to that of a spherical particle d c , i = d i .
The particle size discretization (see [17]) is kept equal for the particles dispersed in the gas phase as well as for the particles deposited on the carrier surface using 17 grid points. The section sizing follows the logarithmic rule v i = v 0 γ i 1 with the volume of the platinum monomers v 0 , the volume v i of particles corresponding to section i and the growth factor γ = 2.0 used to control the spacing between the sections. Changes for the dispersed platinum phase N k due to particle dynamics on mesoscopic scale are considered by the contributions:
d N k d t = d N k d t c , N d N k d t c , C + d N k d t I
The first term on the rhs denotes the change by collision with other platinum particles within the dispersed phase N k :
d N k d t c , N = 1 2 i , j = 1 k χ i j k β i j * N i N j i = 1 n β i k * N i N k
The size splitting operator χ i j k interpolates coagulation contributions of particle combinations, which fall in between the defined sections, while n indicates the number of sections chosen for the representation of the PSD [56,57]. Gas particle deposition onto the carrier surface is represented by the second term in Equation (19) and modeled as collision process following Equation (21), with C indicating the carrier particle number concentration.
d N k d t c , C = β i , C * N i C
Particle inception (third term in Equation (19)) only affects the first (monomer) section N 1 and is calculated by:
d N k d t I = d ρ ¯ I d t N A ρ P t δ d 1 ( d k )
Here, d ρ ¯ I / d t is given by Equation (11), N A is the Avogadro constant, ρ P t the density of platinum and δ d 1 the Dirac measure.
Deposited particle dynamics, which take place on the carrier particle surface, are realized by the contributions of on surface coagulation (first term, rhs) and particle deposition on the free carrier surface (second term, rhs).
d Q k d t = d Q k d t c + d Q k d t D
The approach for calculating the surface coagulation kernel is derived from the free molecular collision kernel (Equation (17)), assuming a rectangular pathway as projection of the typical cylindrical pathway on the carrier particle surface:
β i j Q = α c a c a r 2 2 k b T π 1 / 2 1 m i + 1 m j 1 / 2 d s , i + d s , j
The coagulation rate of deposited particles on the carrier particle surface per gas volume R i j Q is obtained by the following expression:
R i j Q = a c a r C q i q j β i j Q
Here, q i = Q i / C denotes the deposited particle number of section i per carrier particle, whereas a c a r is the carrier particle surface area. The model constant α c = 6.0 × 10 6 decreases the rate of coagulation to a level suitable for surface reactions. This concept is comparable to the van der Waals enhancement factor [51] in the case of free molecular collision, but accounts for the reduced particle motion by sticking. The first term of Equation (23), the surface coagulation, has additionally to account for collisions, which occur during the deposition process, i.e., platinum particle from the dispersed phase do not hit the free carrier surface, but other, already deposited, platinum particles. With all contributions included, it is calculated as:
d Q k d t c = i , j = 1 k χ i j k ξ i d N j d t c , C + 1 2 R i j Q i = 1 n ξ k d N i d t c , C + R i k Q
The deposition on the free carrier particle surface (second term Equation (23)) is given by:
d Q k d t D = ( 1 ξ t ) d N k d t c , C
The growth of deposited particle concentration Q k is a function of the surface coverage ξ i = c s , i / a c a r and the total surface coverage ξ t = ξ i 1 , whereas c s , i = x s , i q i is the surface area, which is covered by particles of section i. The simplified single particle projection area is given by x s , i = π / 4 d i 2 .
Collision among carrier particles is rarely observed within the experiments, therefore it is neglected in the modeling. Thus, the only contribution to the source term (Equation (14), last term rhs) is the alumina particle inception during the spray droplet collapse (see Figure 4). It is divided between the closest cells within the Eularian field according to trilinear weighting by the droplets position relative to the grid points. For a single collapsing spray droplet, the carrier particle source term is calculated by:
d C d t = 1 Δ t Δ v Y C m C M S 0
Since spray droplets shrink during the evaporation process, M S 0 represents the initialized droplet mass at the beginning of its life time, wheres Y C = 0.03 denotes the mass fraction of the carrier particle matter suspended in the spray liquid and Δ v is the constant cell volume of the discretized domain. The mass of a carrier particle m C is calculated by assuming a spherical shape and a given diameter d C . In order to reduce the complexity, it is held constant. Two simulations using different carrier particle sizes ( d C = 150 nm and d C = 400 nm) are performed and compared to investigate the impact of different carrier particle sizes d C . A meaningful variable for quantifying the efficiency of the deposition process is the particle loading η m :
η m = q i m i m c
It represents the ratio of the deposited mass loaded on a single carrier particle to its own mass m C .
The simulation strategy and its implementation was verified by generic one-dimensional test-setups. For details on this procedure, we refer to Appendix A, dynamics simulations.

4. Simulation Results

4.1. Numerical Setup

Two simulations were performed using the in-house code PsiPhi. The code is optimized for large eddy simulations and has been proven to perform well in massively parallel CFD calculations [43,46,58]. The code is based on a Cartesian, equidistant grid throughout the whole domain, leading to a very good performance for highly resolved LES [59] with high accuracy and superior stability for high order schemes compared to codes based on unstructured grids [58,60]. PsiPhi allows the use of finite rate chemistry as well as of tabulated chemistry within the context of PFGM [26,27], whereby the latter is used in the extended form as described earlier in this work. For the present simulations, a cuboid of 50 × 50 × 210 mm was chosen as computational domain, resolved by 33.6 million cells at a size of Δ = 0.25 mm, which captures the artificially thickened flame front [43]. An explicit three step Runge–Kutta scheme was used for time integration, while spatial derivatives for the momentum equations were approximated by a second order central differencing scheme. Spatial derivatives of the convective fluxes of the remaining scalars were calculated by a TVD-scheme applying the non-linear CHARM limiter [61].

4.2. Results

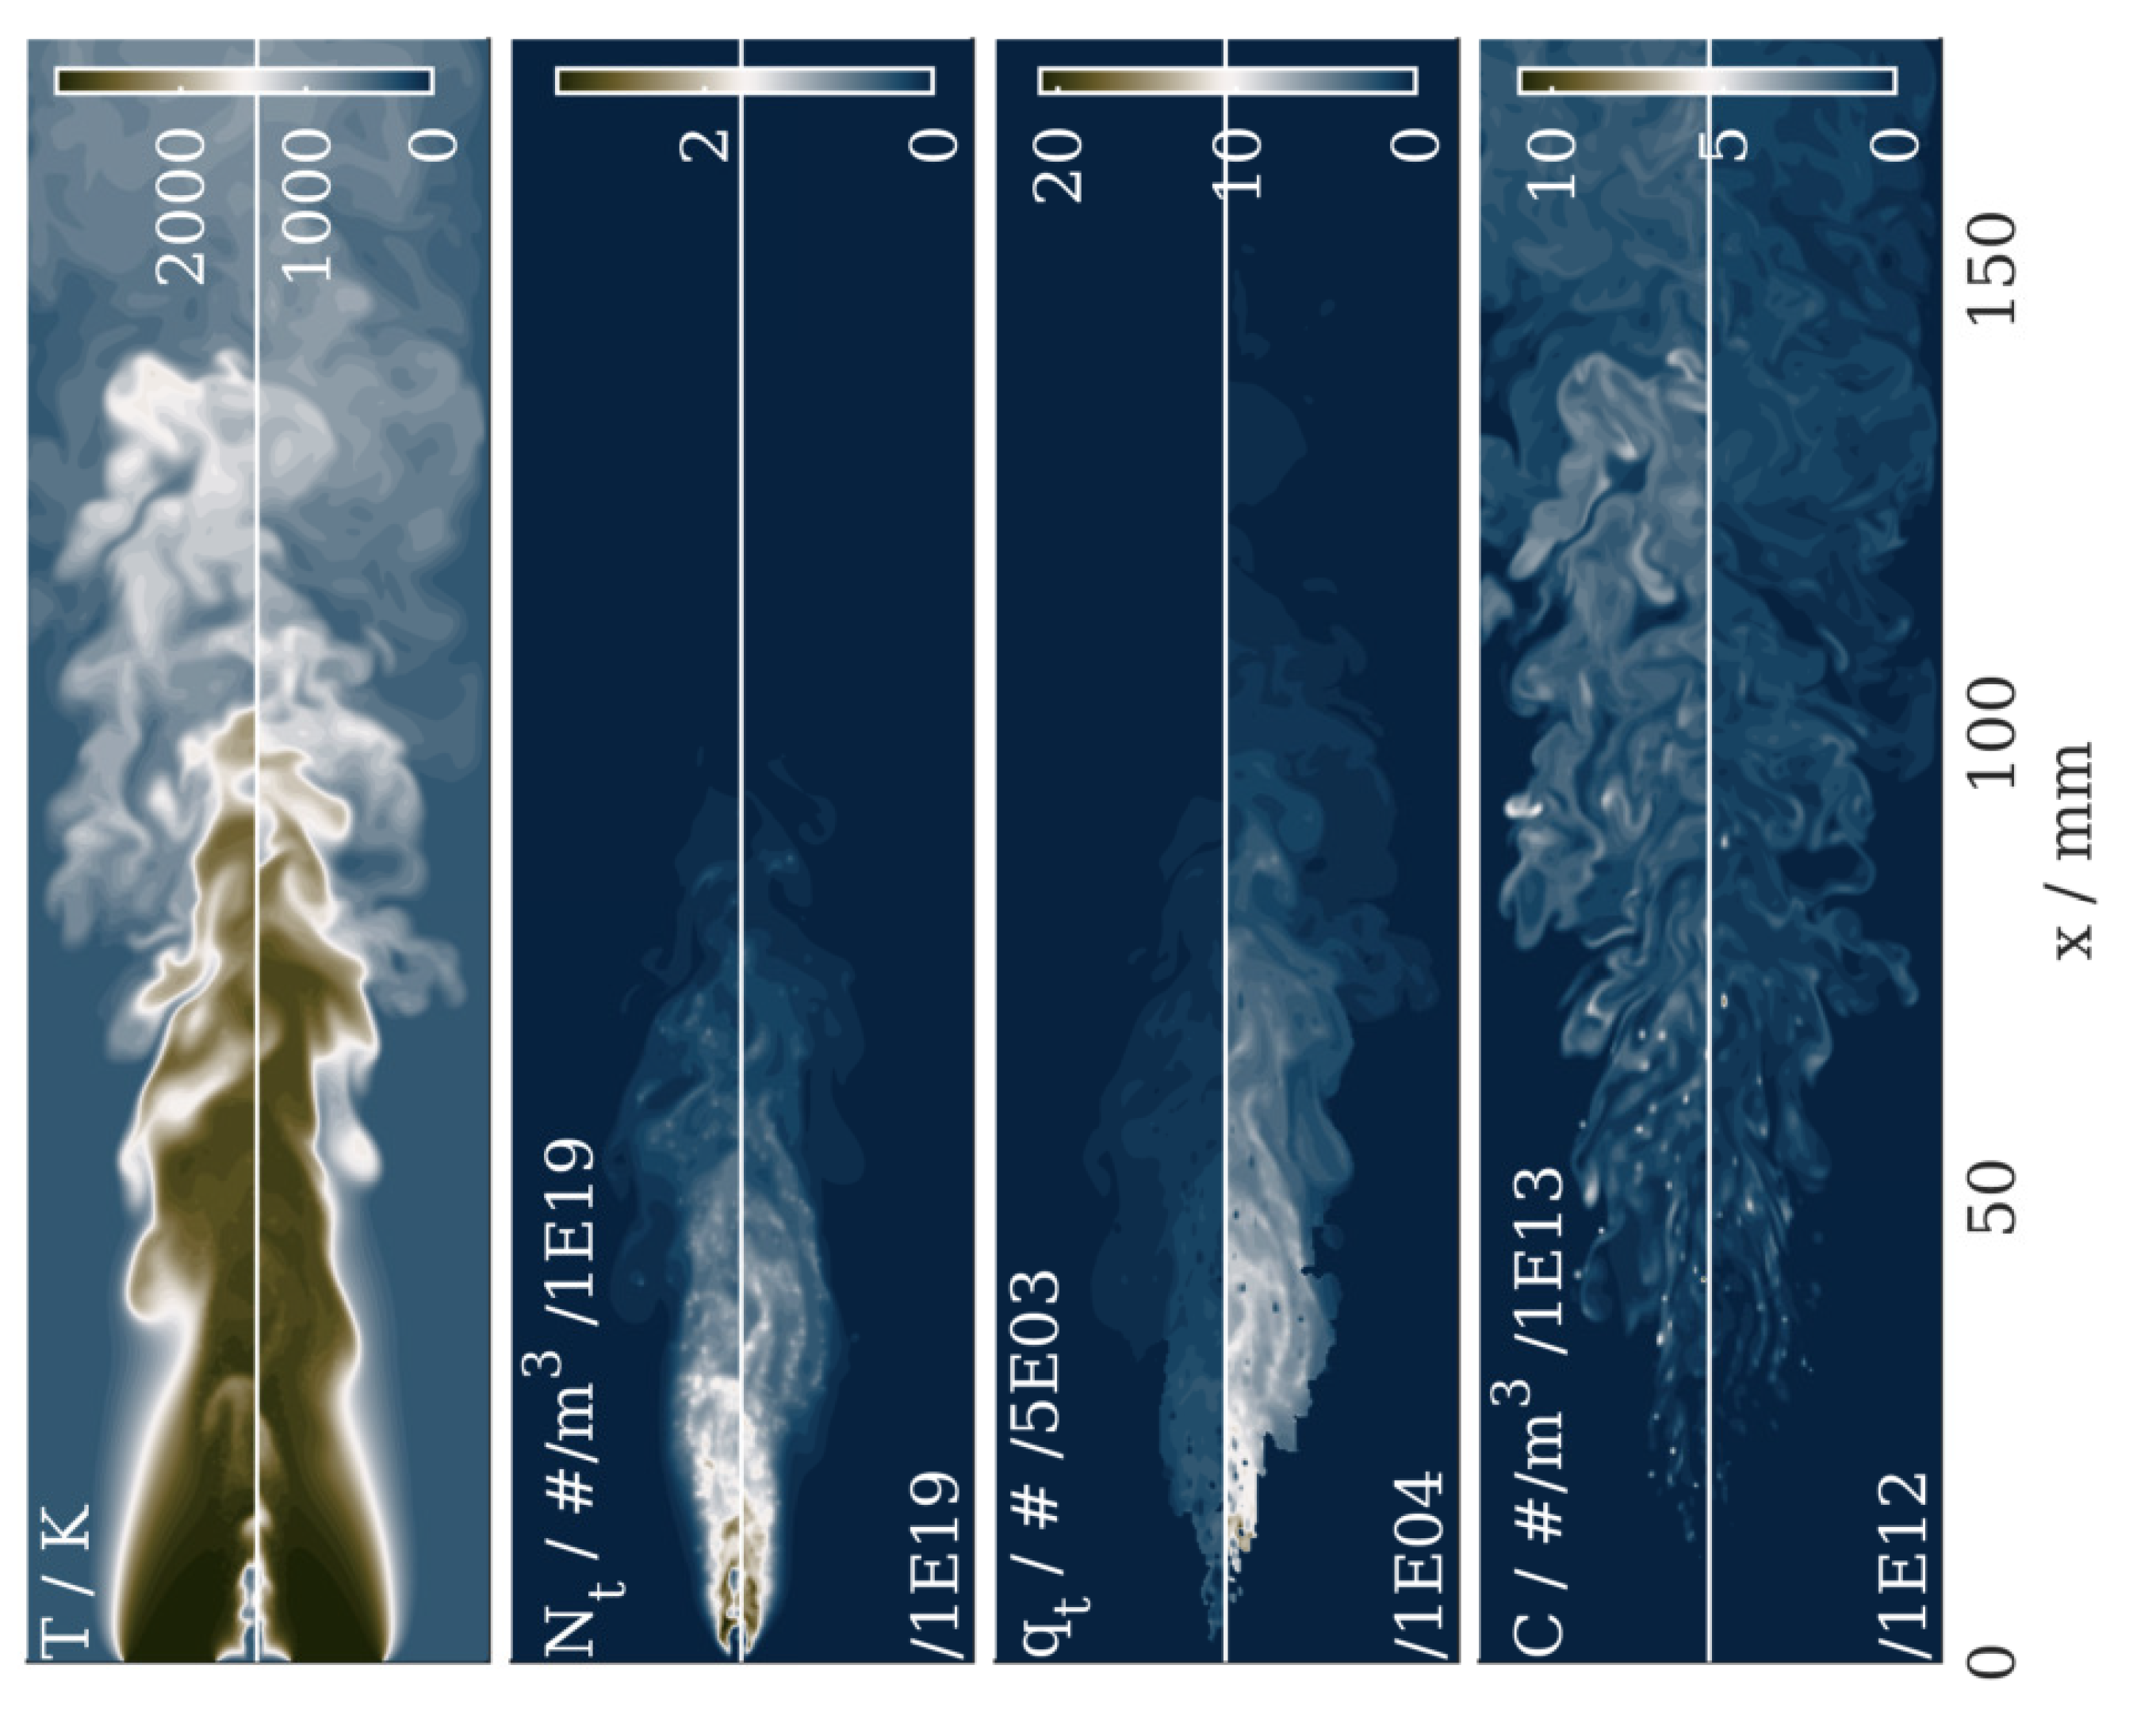
Figure 5 shows the instantaneous fields for the cases with carrier particle sizes of d C = 150 nm and d C = 400 nm. An area with high values of both N t (the dispersed particle number concentration) and q t (the deposited particle number) can be found after first carrier particles C are formed. Those areas indicate a high deposition rate, leading to a rapid decrease of dispersed particles ( N t ), which become deposited particles and therefore increase q t . A higher number of total deposited particles per carrier particle q t is observed for the large carrier particles ( d C = 400 nm). This is for two reasons: first, since the total mass of the carrier material is held constant, the carrier particle concentration drops for larger sized carrier particles and therefore, more platinum matter may deposit on a single carrier. Second, due to the wider surface of larger sized carrier particles, on-surface deposition rates decrease for the same amount of deposited particles compared to smaller carrier particles.
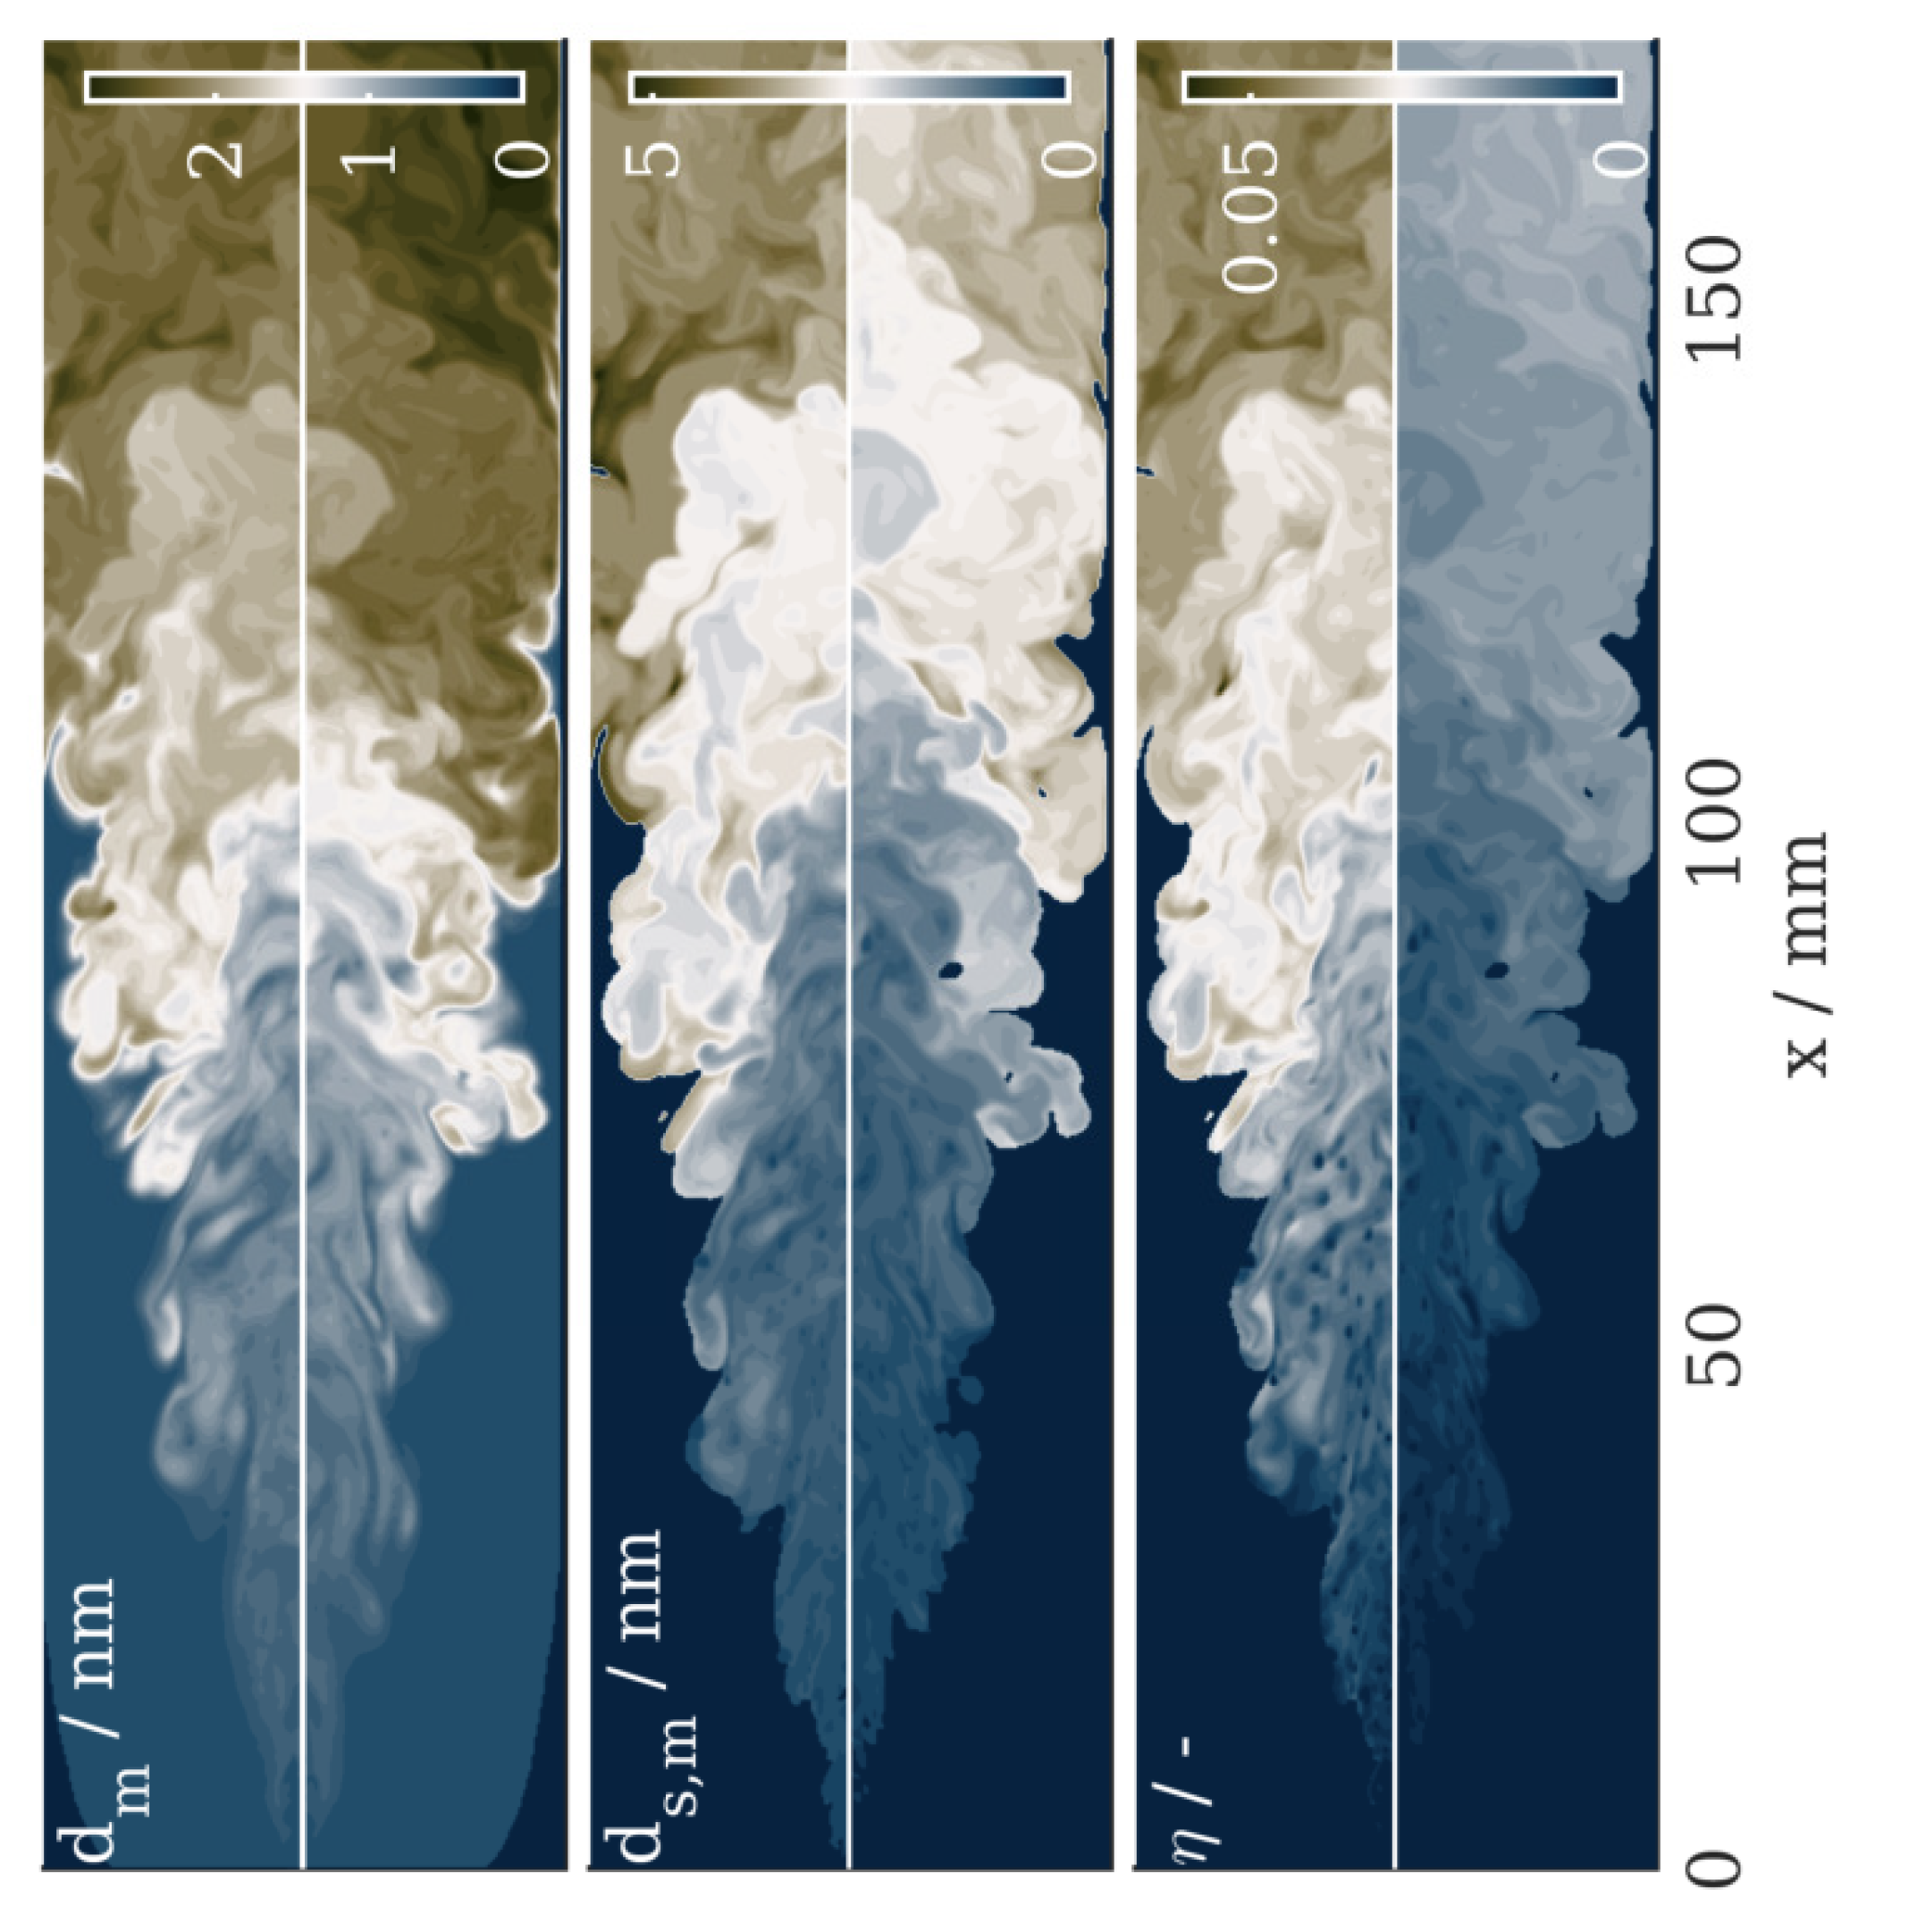
Fields for mean dispersed and deposited platinum particle diameters d a and d s , a , as well as for the particle load η m , are shown in Figure 6. In general, both particle sizes d a and d s , a exhibit a similar behavior for both carrier sizes and spatial deviations might result from turbulent fluctuations. Larger carrier particles with almost 10 times more captured particles show a lower particle loading due to their significantly larger mass (19 times the mass of the smaller carrier particles).
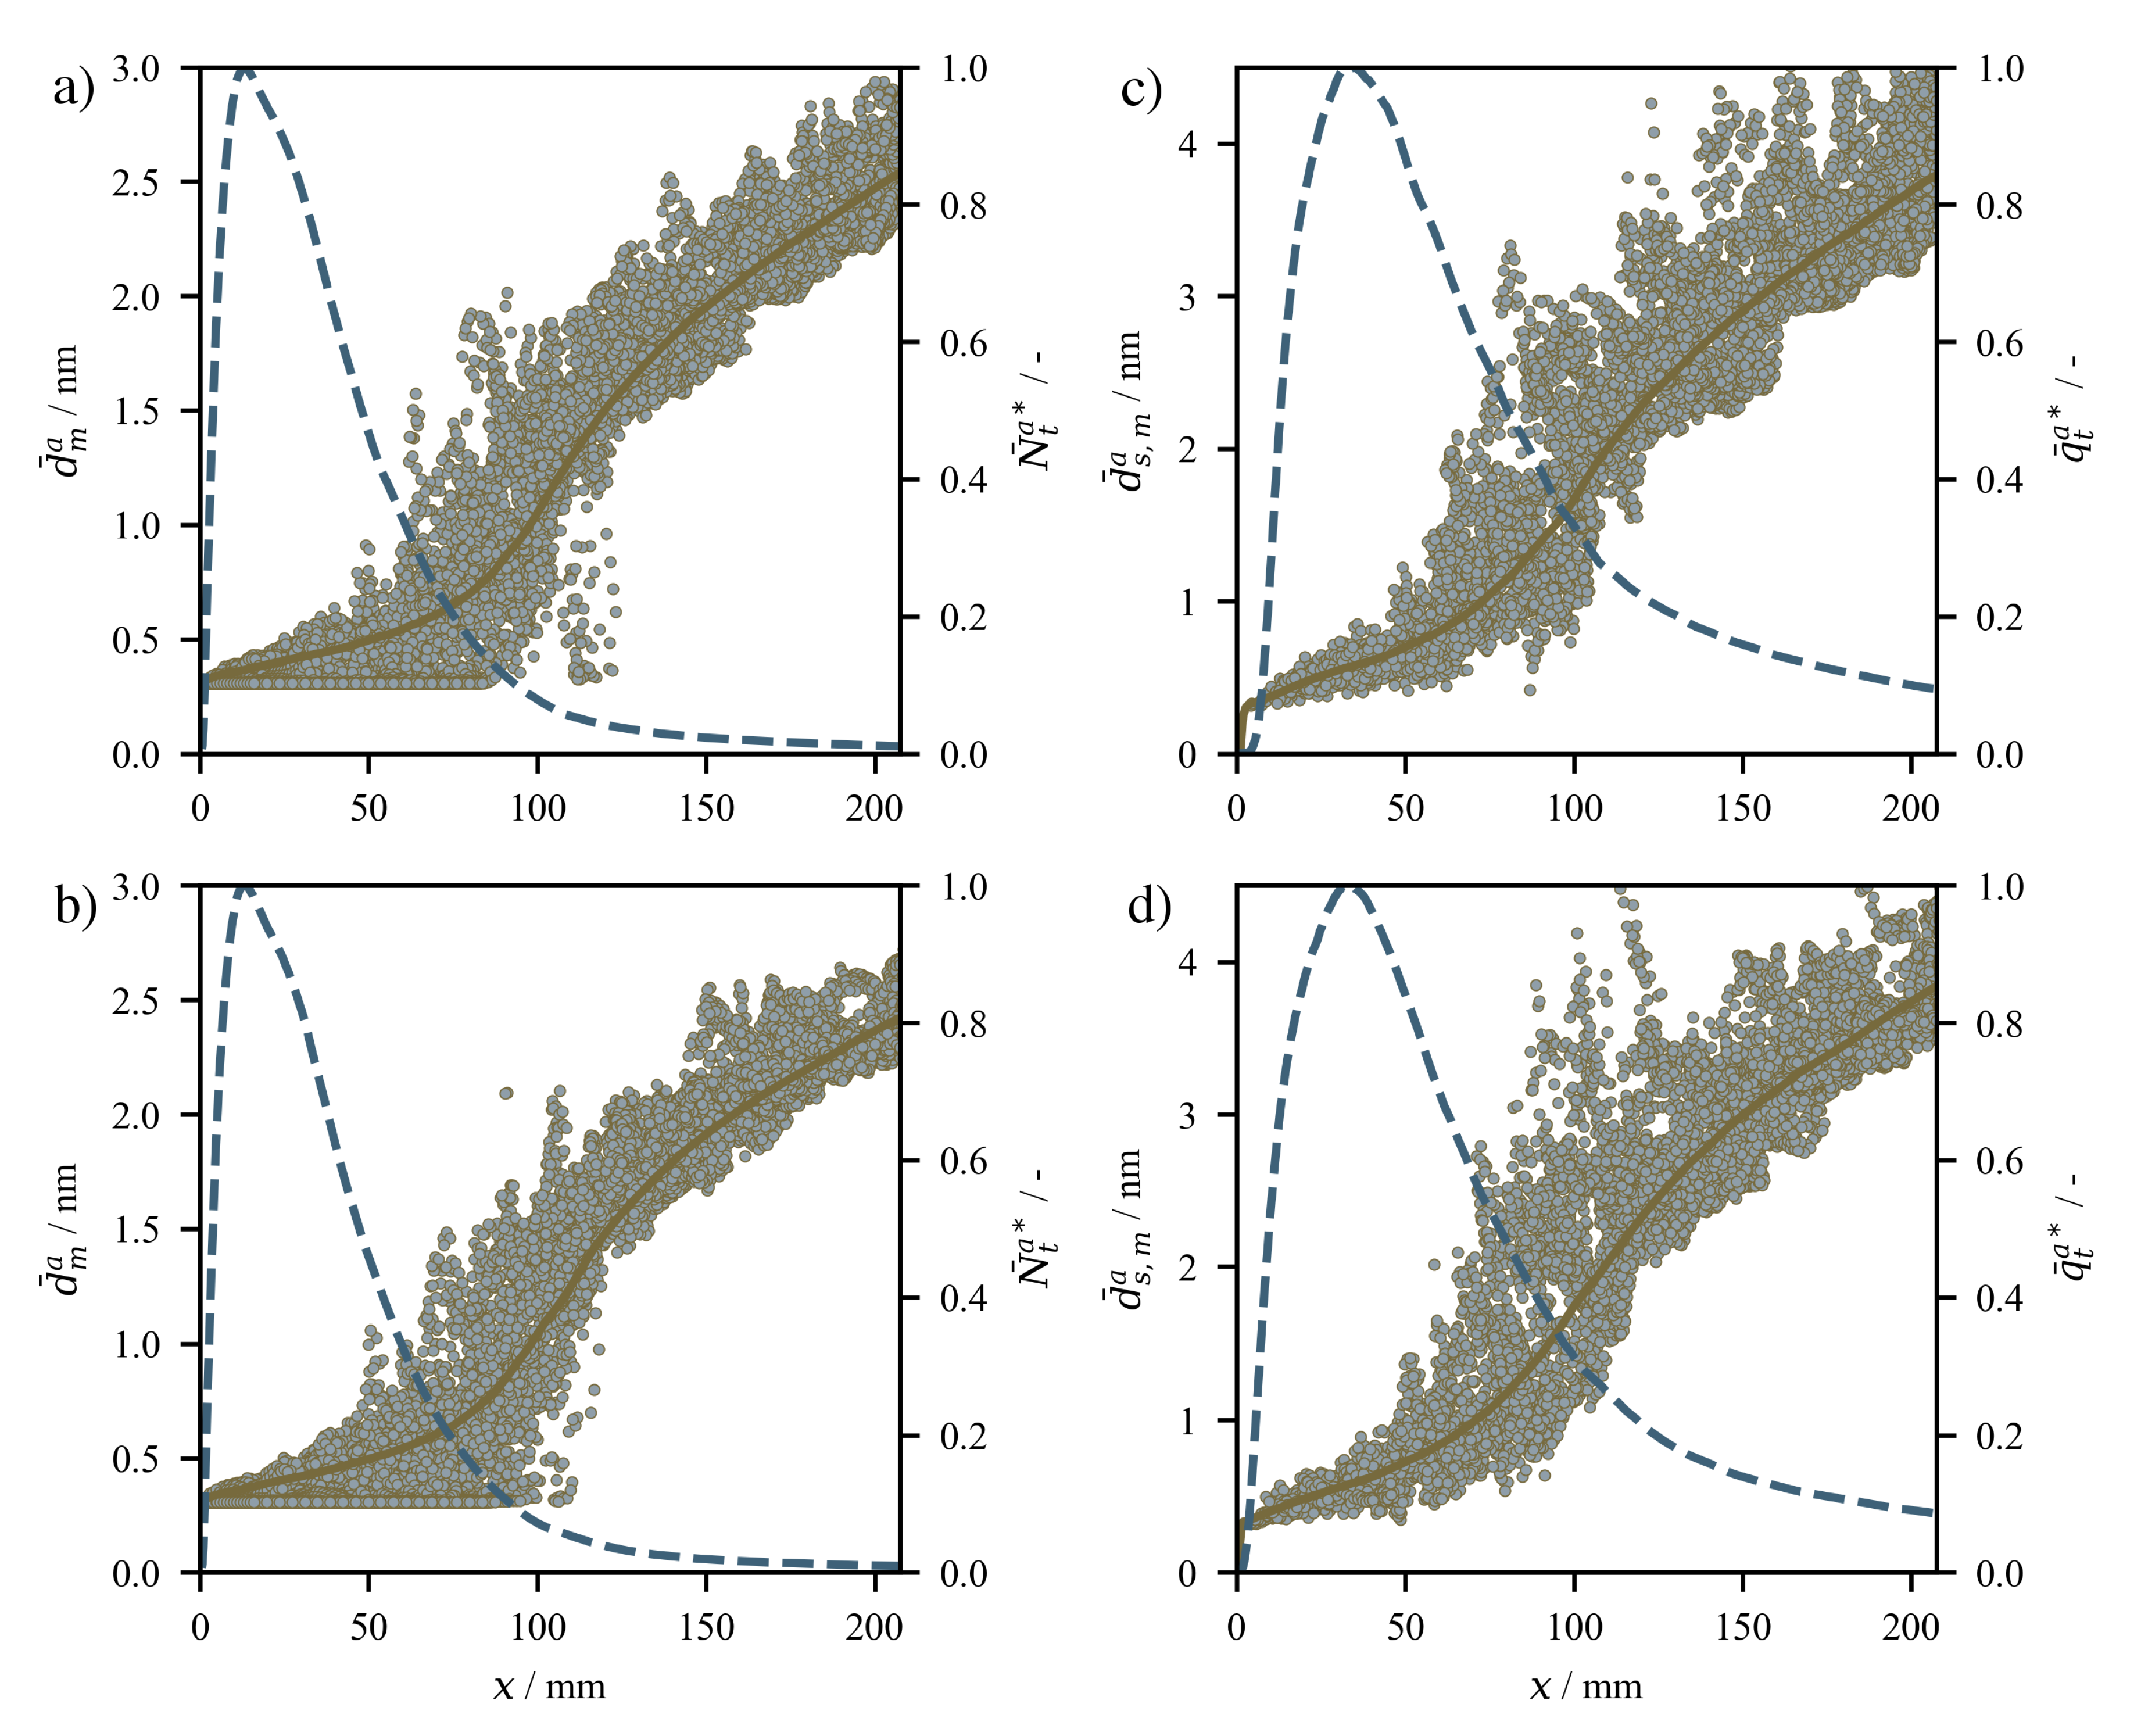
Further investigations are made regarding temporal averaged free and deposited mean particle sizes ( d ¯ m and d ¯ s , m ) in comparison to the normalized total number concentrations of free particles N ¯ t * = N ¯ t / N ¯ t , m a x and the normalized total number of deposited particles per carrier particle q ¯ t * = q ¯ t / q ¯ t , m a x . The line data shown in Figure 7 are volume averaged along y-z-plane for Δ x being the grid size:
ϕ a ( x , t ) = 1 V s Δ x , y , z ϕ ( x , y , z , t ) d y d z d x
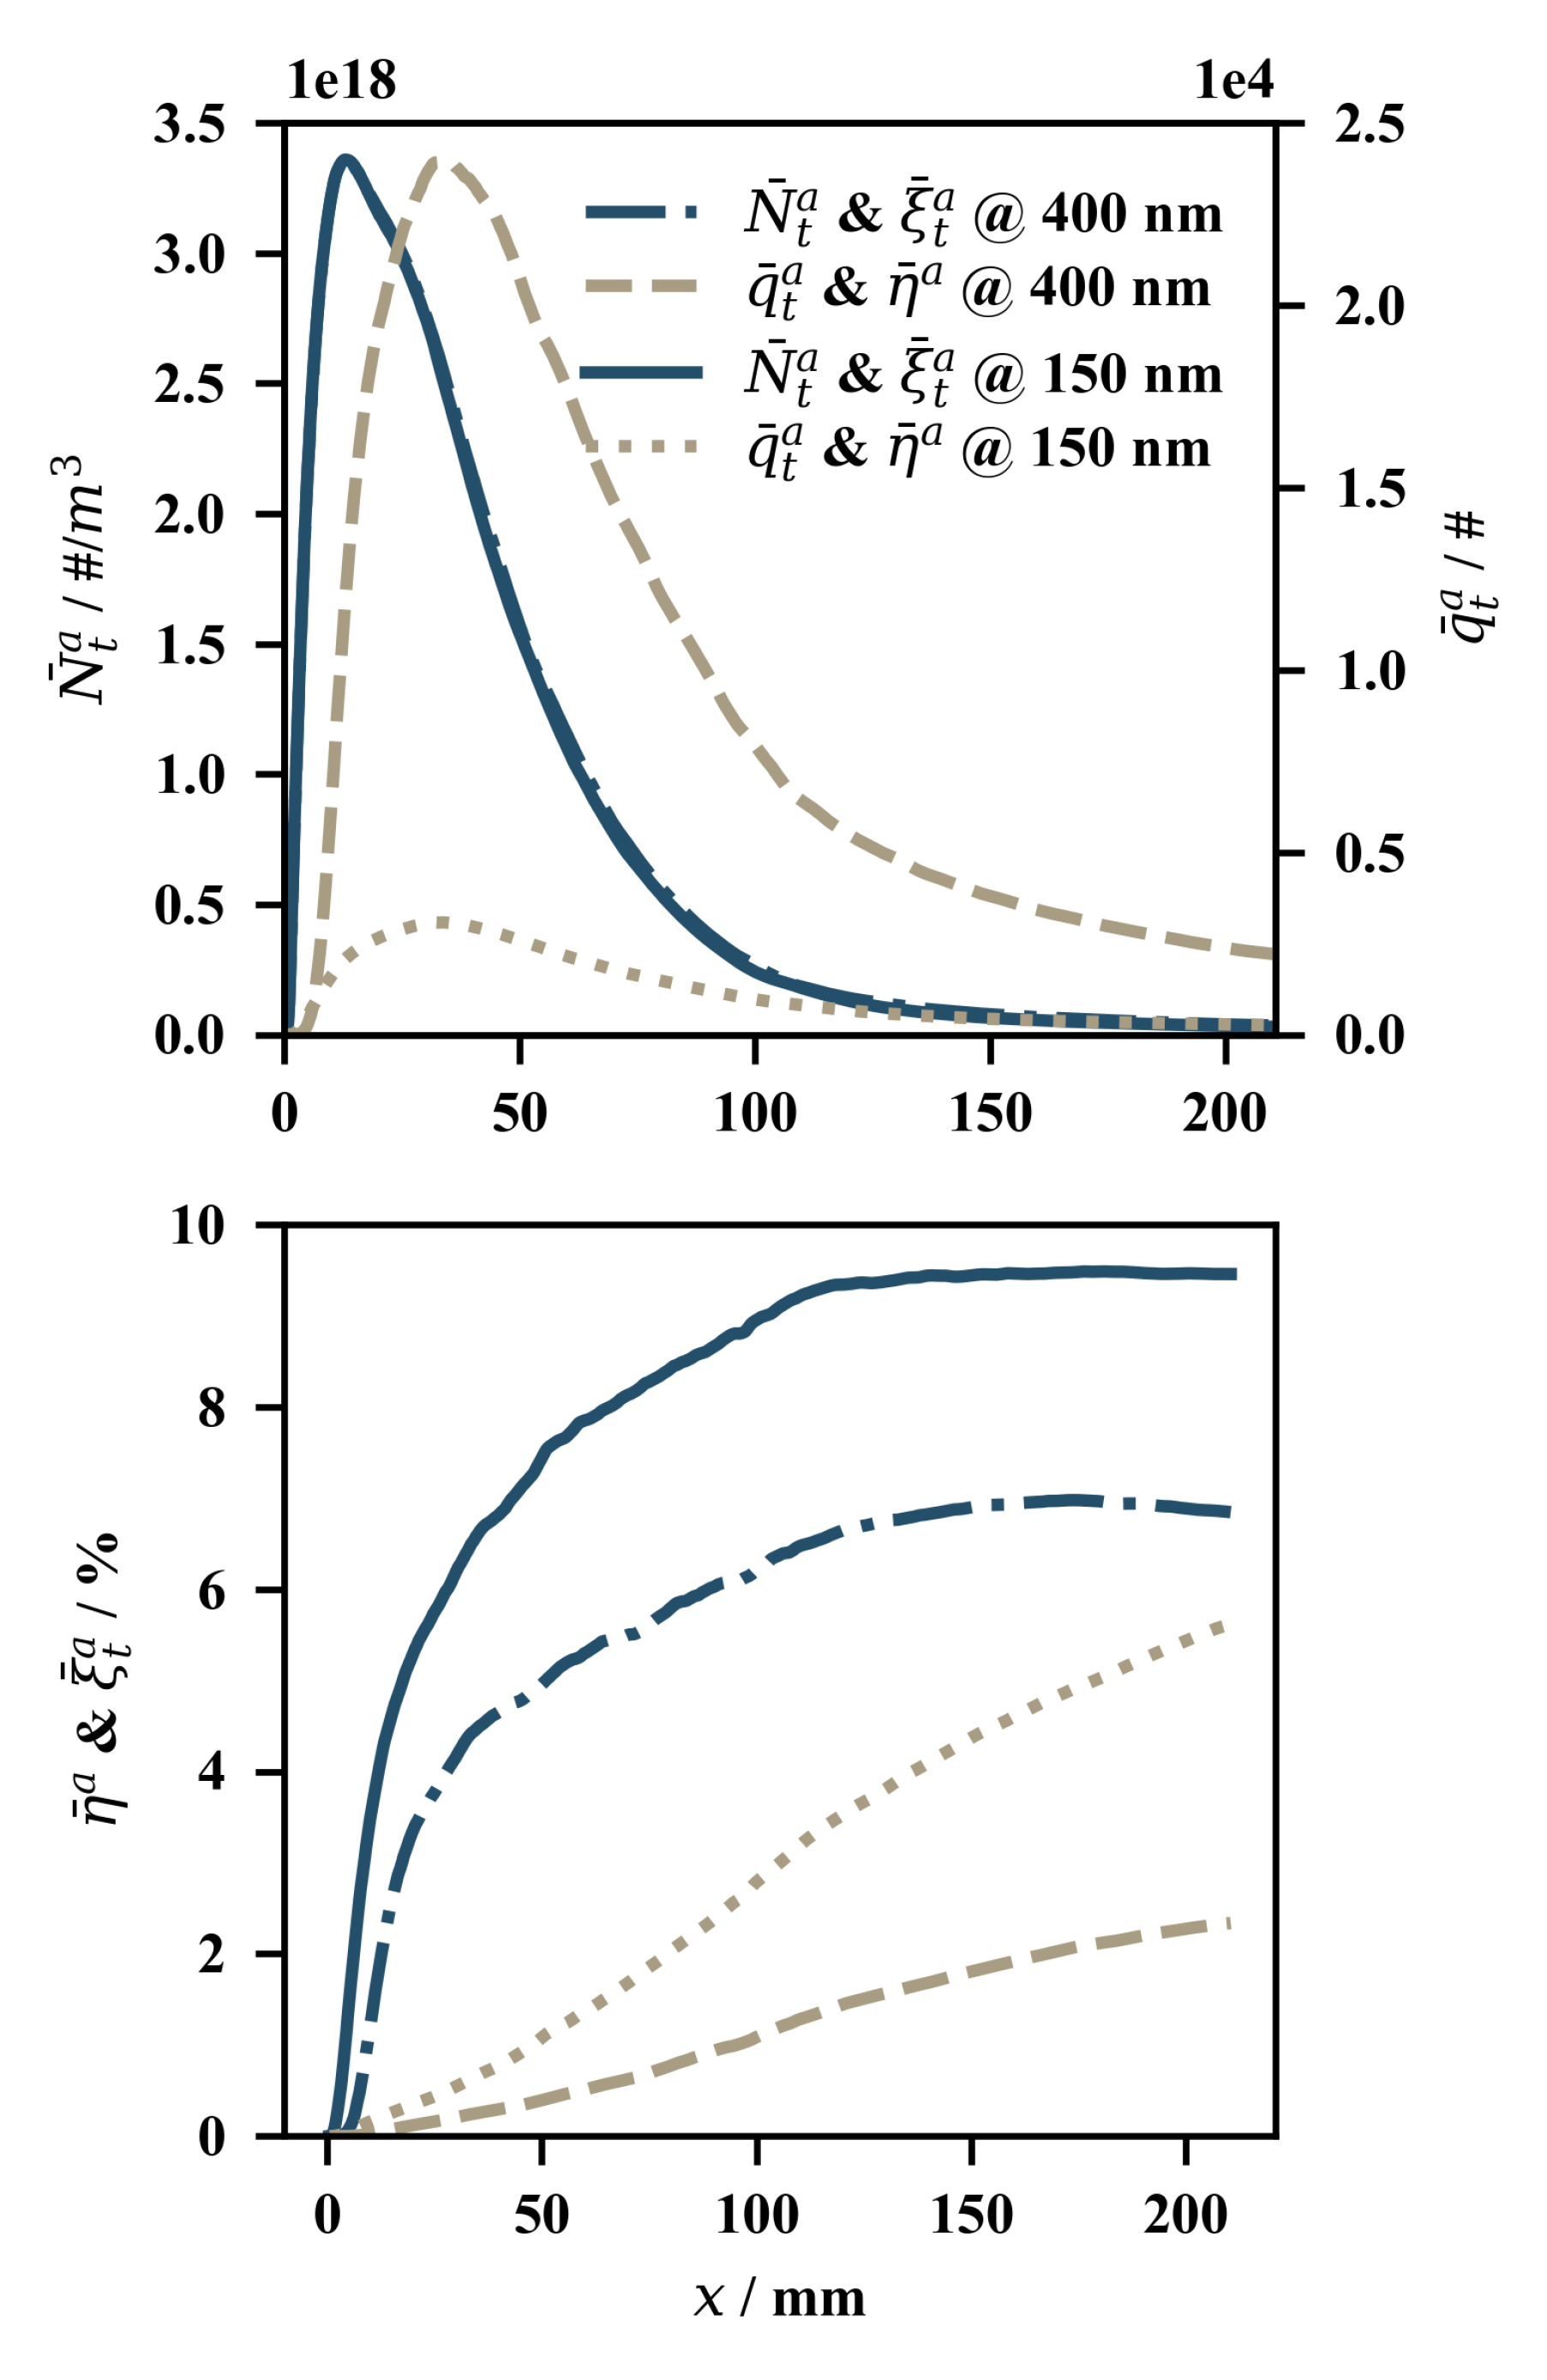
Here, V s = Δ x , y , z d V denotes the volume of the slice used for averaging. It can be seen that free platinum particles are generally smaller sized in comparison to those found on the carrier particle surface. Nevertheless, the mean diameters show a similar behavior between all cases, while the scattering of the instantaneous quantity is comparable for the different carrier sizes (top vs. bottom). Comparison of the normalized total number concentrations of free ( N ¯ t a * ) and deposited particles ( q ¯ t a * ) shows almost identical slopes for the different carrier sizes. Comparing the dispersed particle number concentrations N ¯ t a * and the deposited particle numbers q ¯ t a * , a correlation between both can be found: the dispersed particle number concentrations N ¯ t a * rise, until the rates for deposition dominate. Once this stage is reached, the deposited particle numbers q ¯ t a * increases, while N ¯ t a * falls off drastically. This strong decrease takes place within the zone of particle inception and is therefore an evidence for high deposition rates. The range, in which inception takes place can be estimated by the appearance of monomers (i.e., up to 100 mm above the burner). A further comparison without normalization is given by Figure 8.
It becomes obvious that changing the carrier particle diameter in the investigated range does not affect the free particle deposition rate, as the total free particle concentrations N ¯ t a are identical (overlap). The different number of captured surface particles per carrier particle q ¯ t a * for different carrier particle sizes becomes now apparent, underlining the observation that a larger carrier particle captures more surface particles on average, and although they appear less in number, the deposition rate seems to be comparable. This is not obvious, since the coagulation kernel is defined by a complex interplay of particle number concentrations, inertia and particle sizes. Plots for the time averaged total surface coverage ξ ¯ t a show that the variable stagnates after a maximum is reached. This happens, when the particle load η ¯ a is increasing and therefore, deposition is still ongoing. This behavior can be explained by the accelerated on-surface coagulation process, combining more single particles together to form bigger structures while reducing their surface area and therefore the covered surface of the carrier particle ξ ¯ t a .
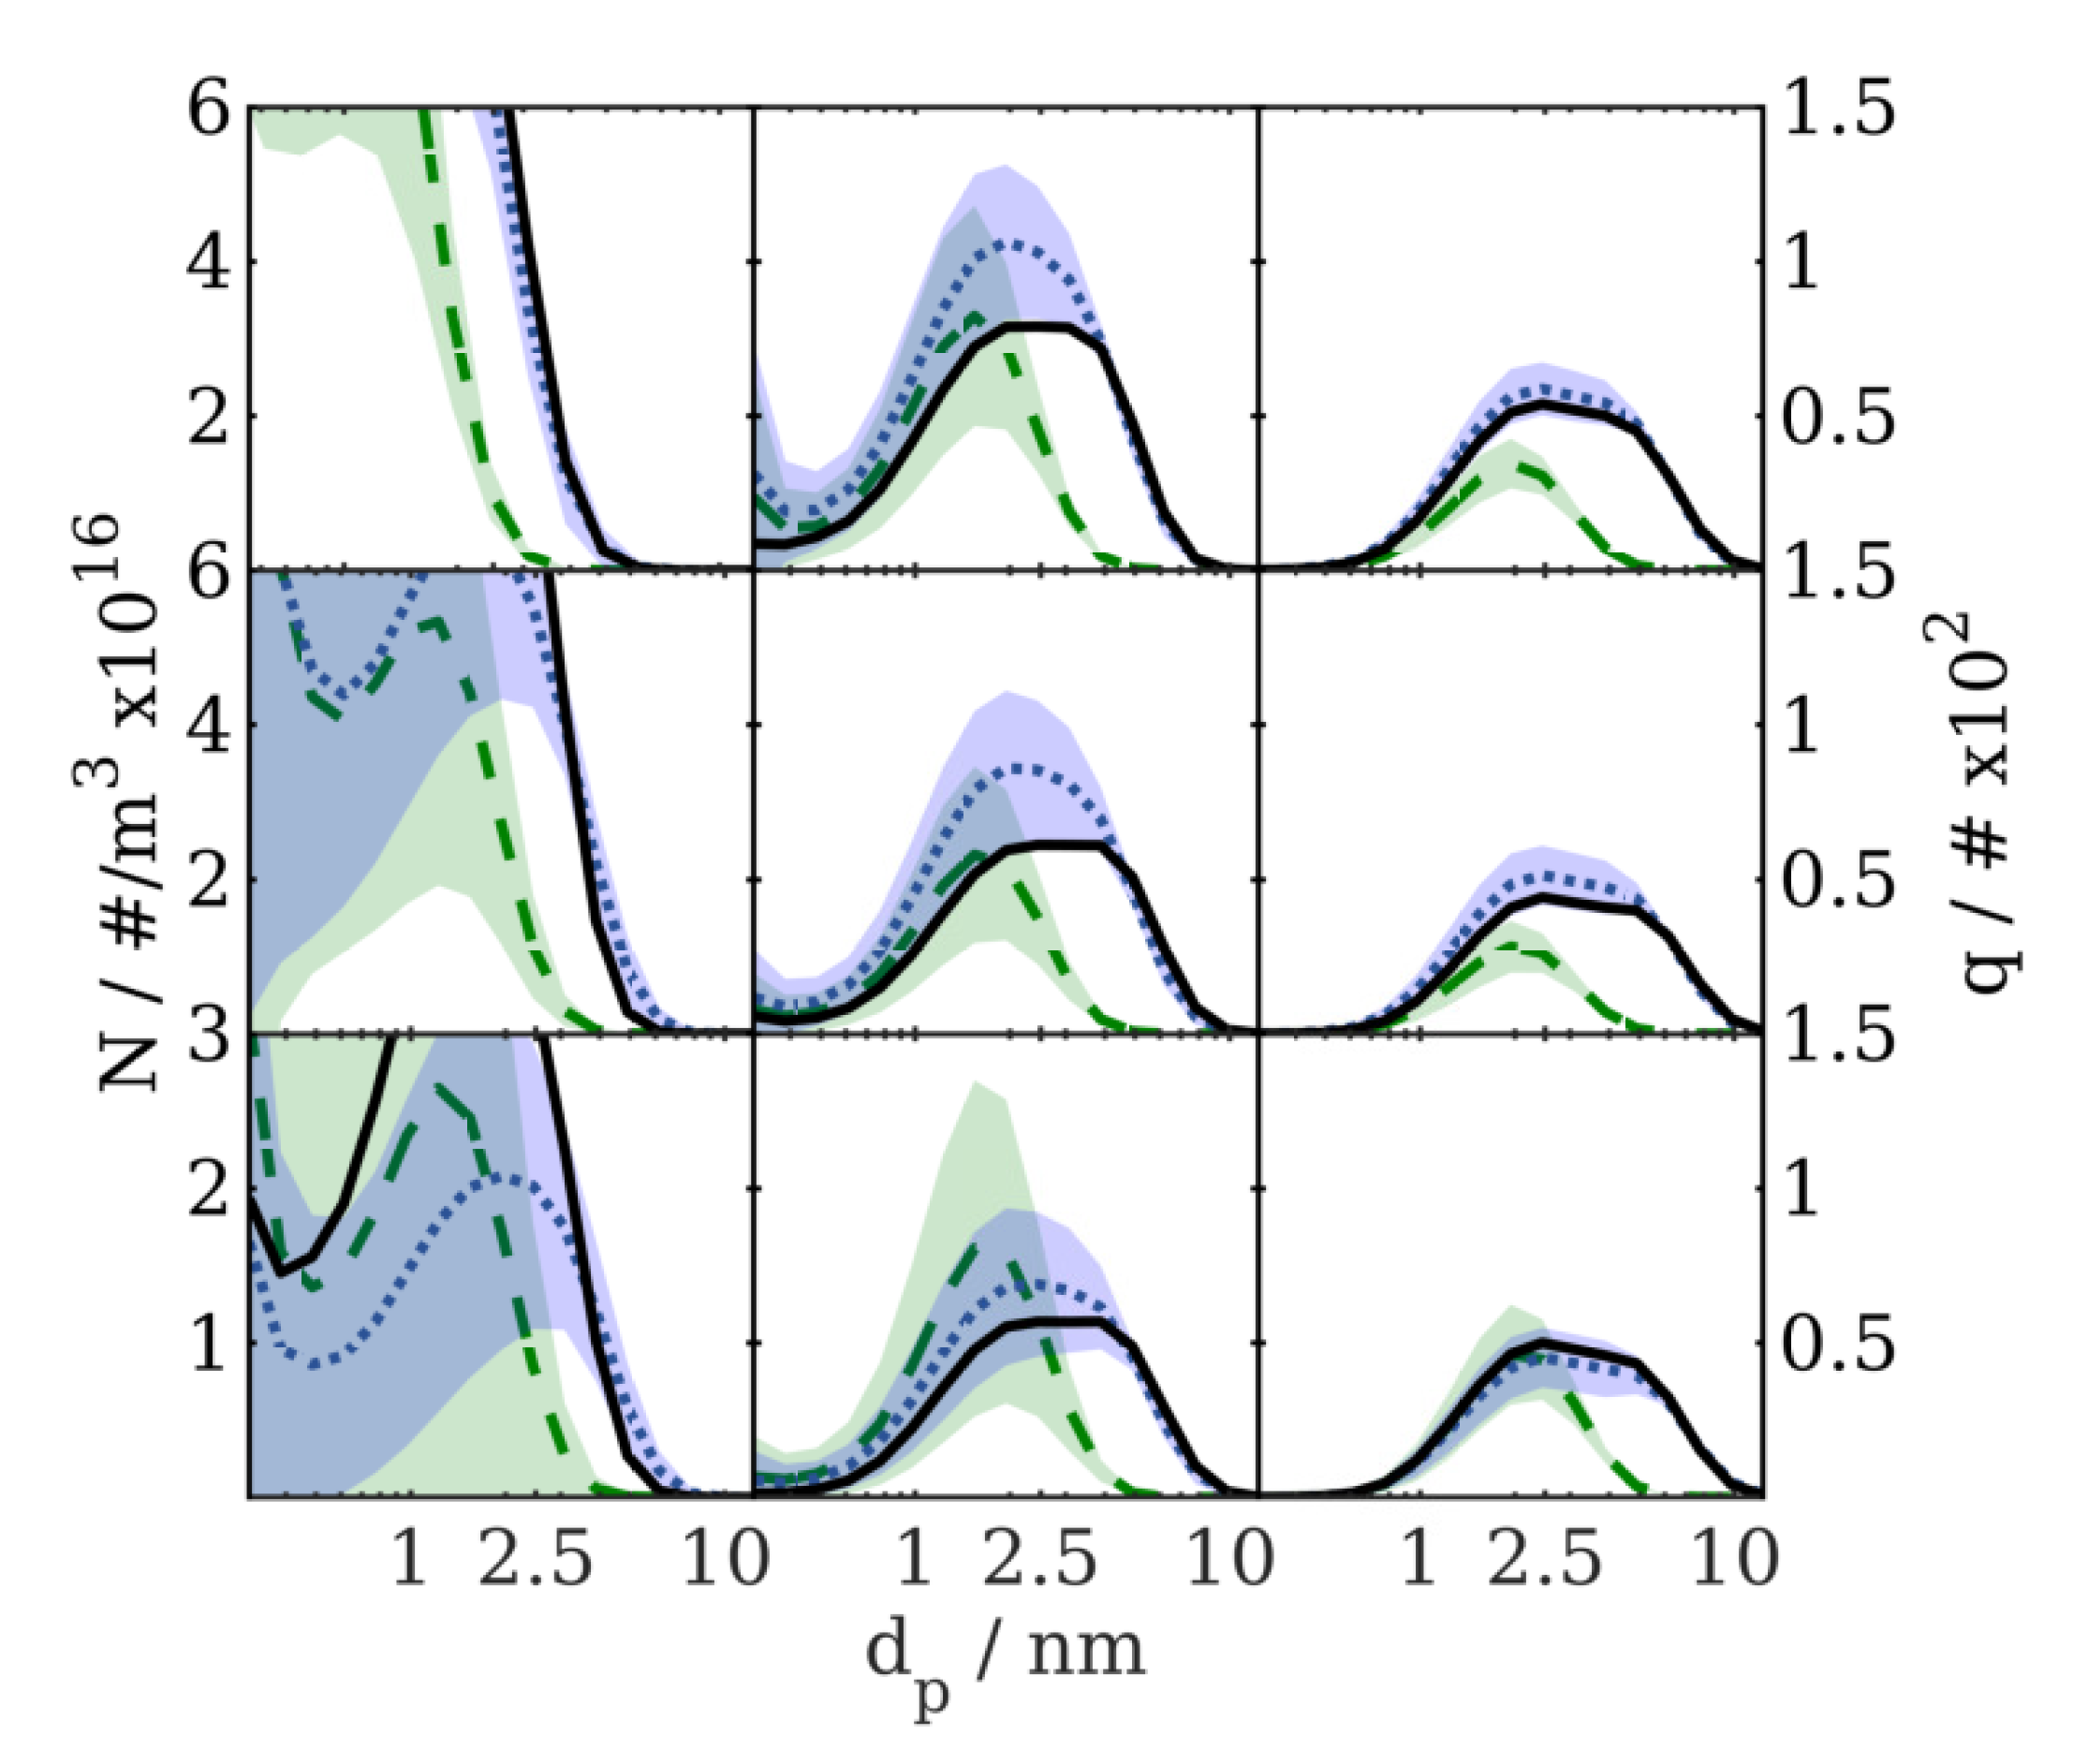
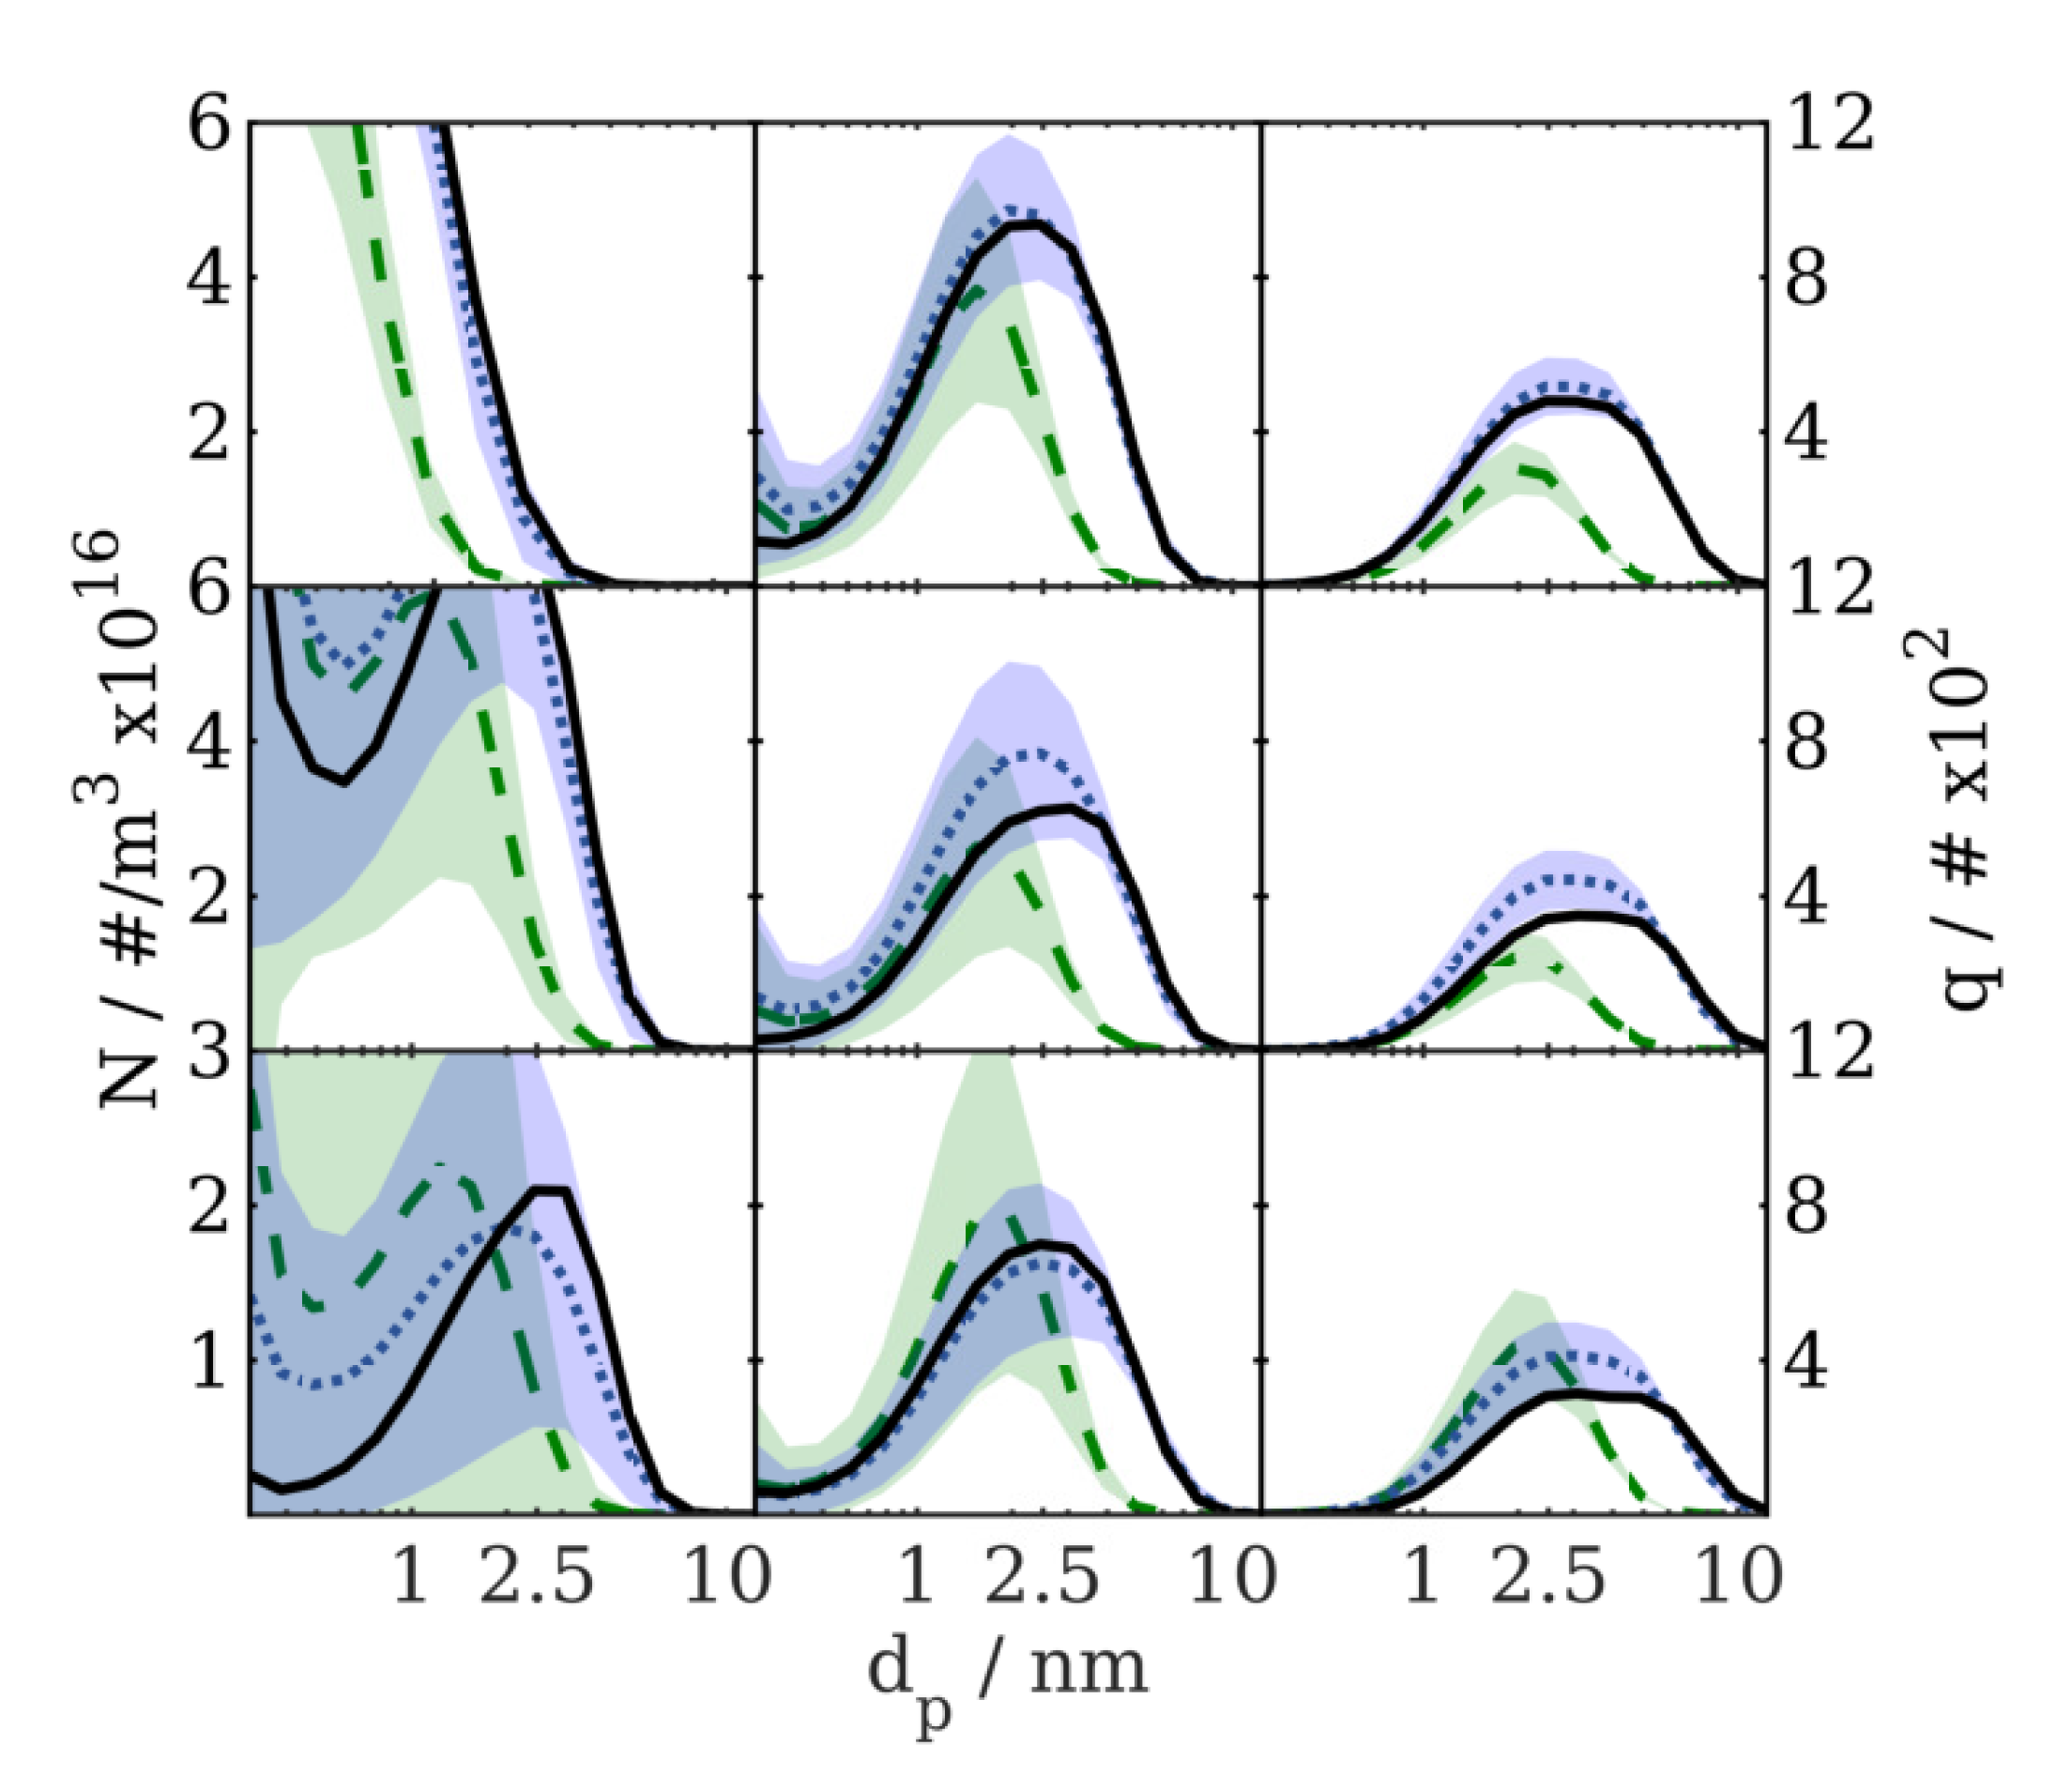
Figure 9 and Figure 10 illustrate gas phase and deposited particle distributions averaged over time for different axial and radial locations. Although bigger carrier particles capture more platinum particles, the shapes of the PSDs appear very similar for dispersed and deposited platinum particles at all locations.
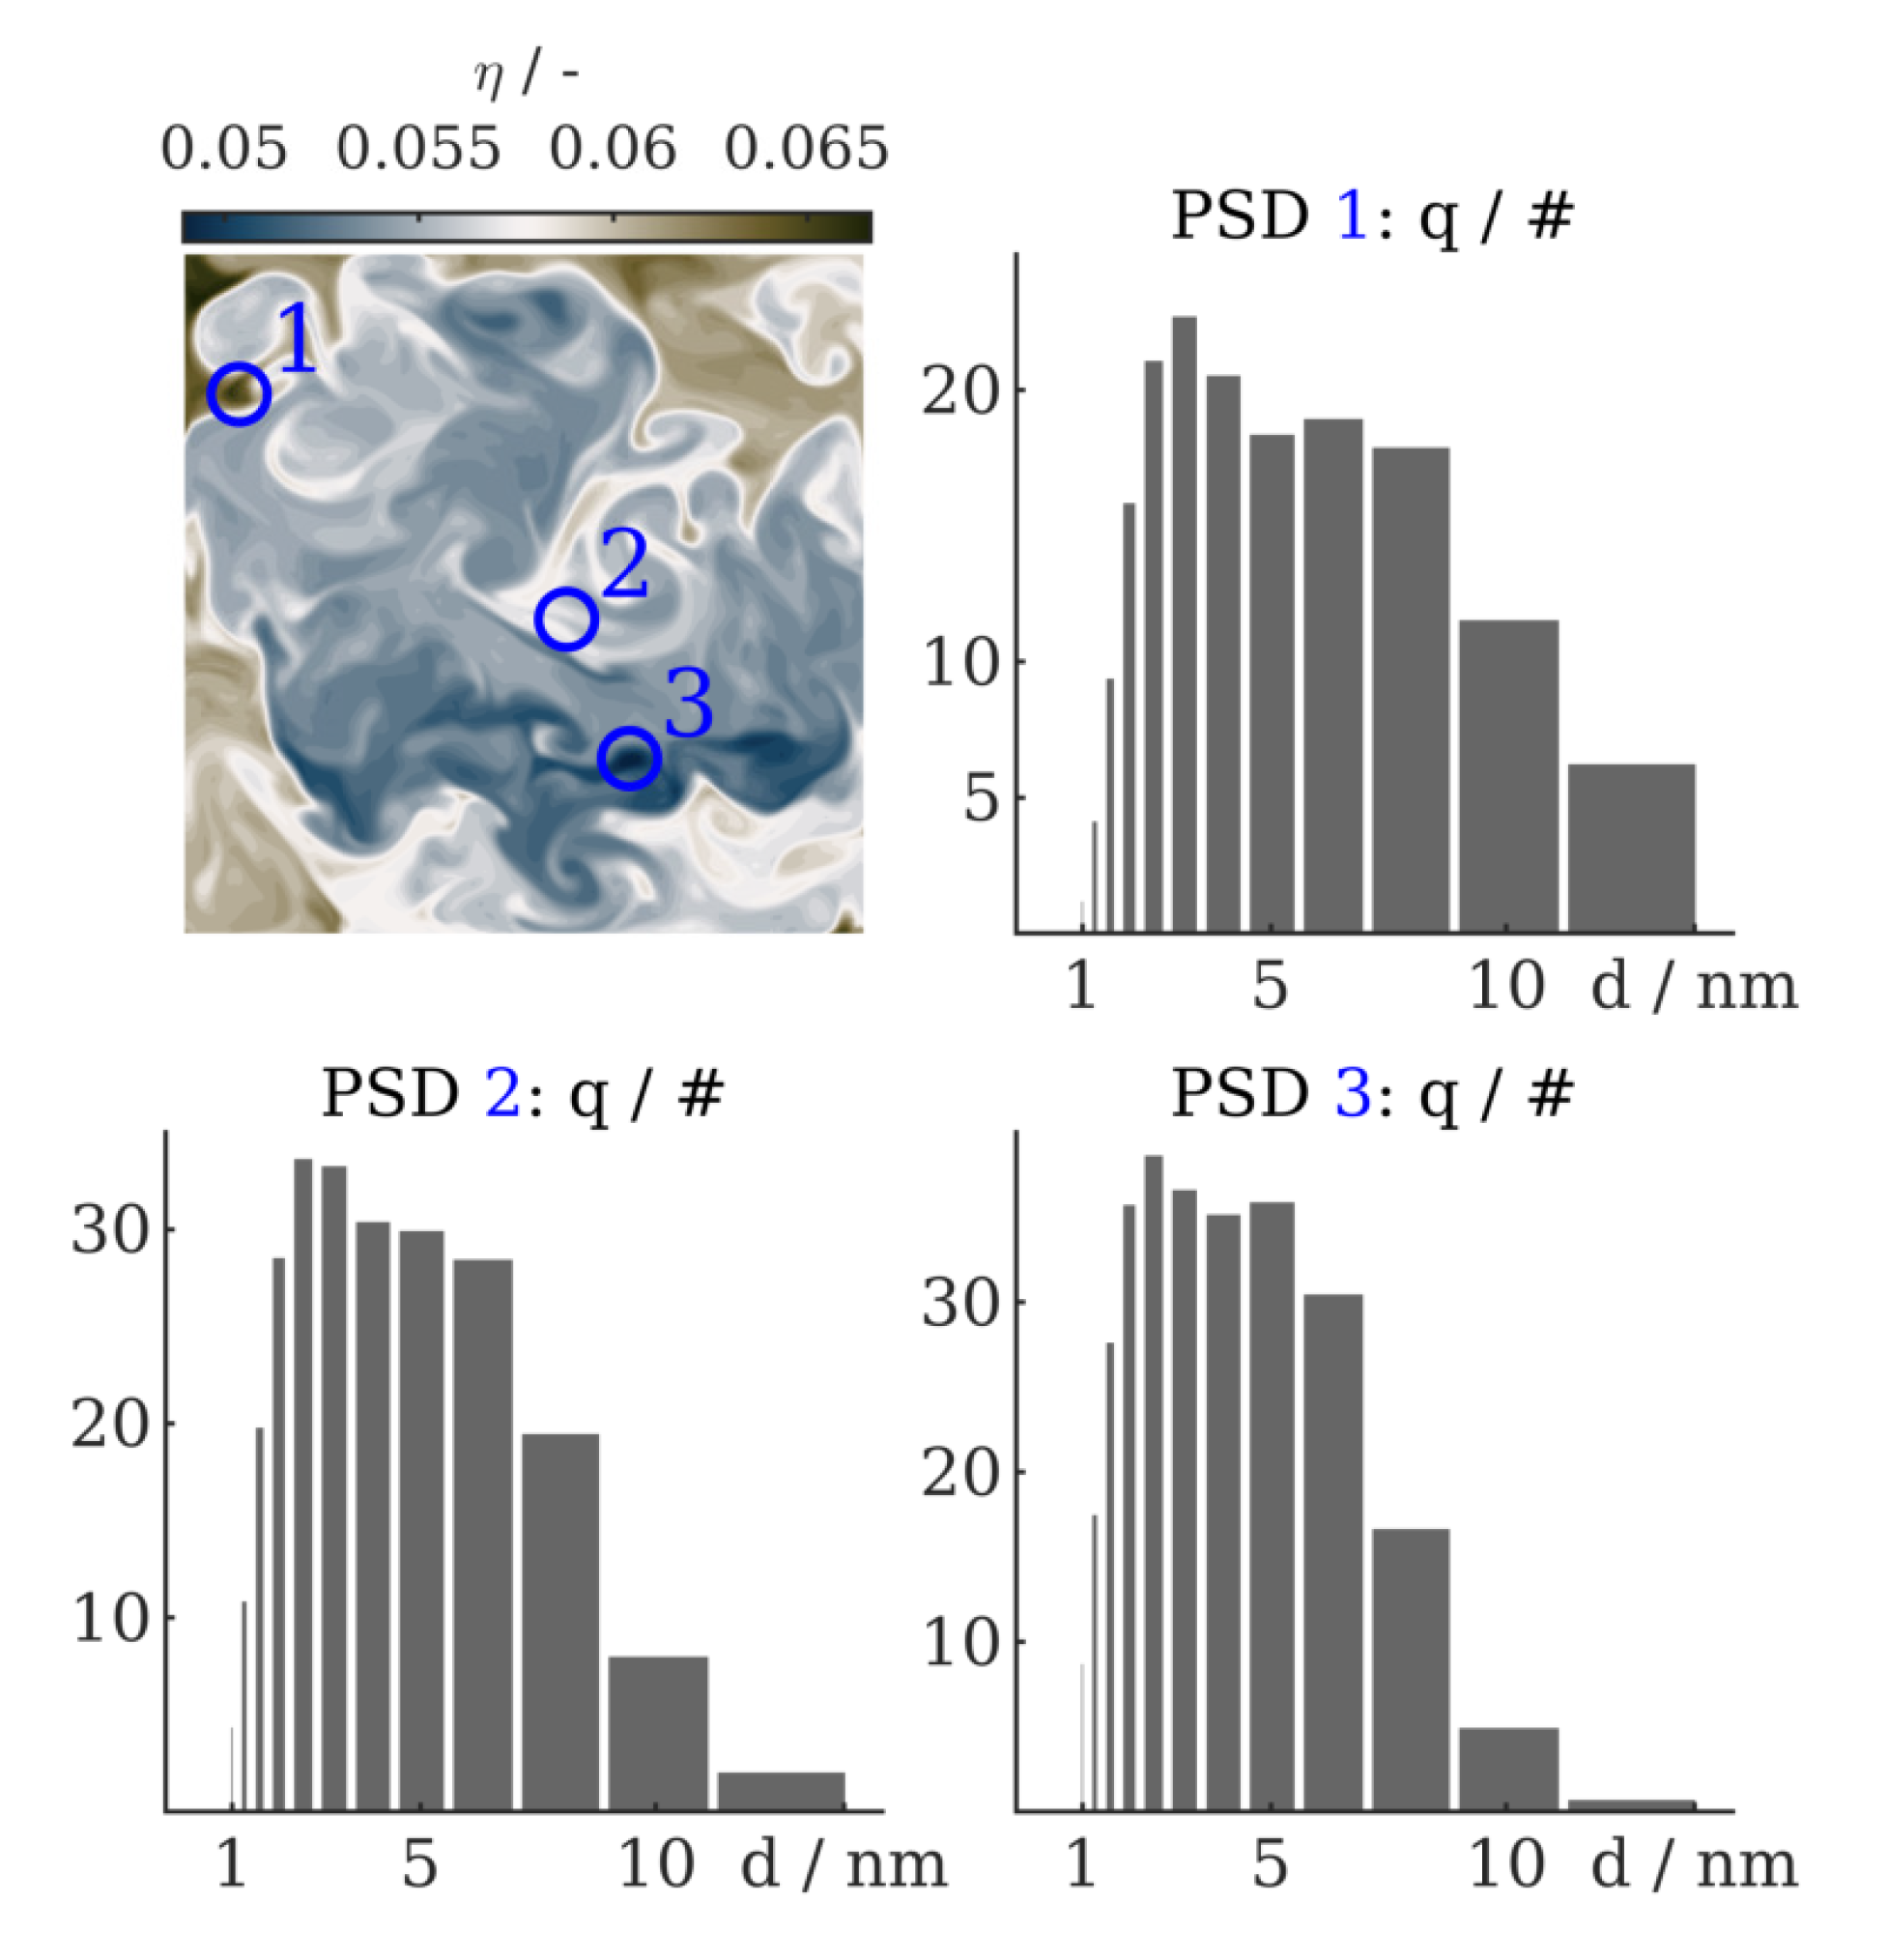
In both cases, particle size slightly increases in axial and radial direction, since the residence time increases, while particle concentration decreases (see Figure 5). Nevertheless, time averaged PSDs do not show the real instantaneous size distribution. It is possible that very different PSDs alternate strongly in time and create a very different picture of the size distribution. High root mean square (RMS) values, as shown in areas closer towards the burner in Figure 11 and Figure 12, indicate this behavior. Accounting for this effect is of special importance for the given case, as a few size distributions of deposited material on single carrier particles are compared and different trajectories have a strong impact. Therefore, when comparing with experimental PSDs obtained by TEM counts of deposited particles, a comparison of instantaneous, time correlated values might give further insights. Thus, instantaneous PSDs for three different locations, as well as a contour of the particle loading η m , at an axial height of x = 200 mm are shown in Figure 11 and Figure 12 for both carrier particle sizes. Due to the high inertia of the carrier particles, a filamentation can be observed. Thus, probe locations are chosen for areas with low-, intermediate- and high mass load η m , respectively. In all cases, a mode of smaller particles (2–4 nm) can be observed for all locations, whereas the PSDs gets broader with higher carrier load η m and smaller carrier particle sizes.
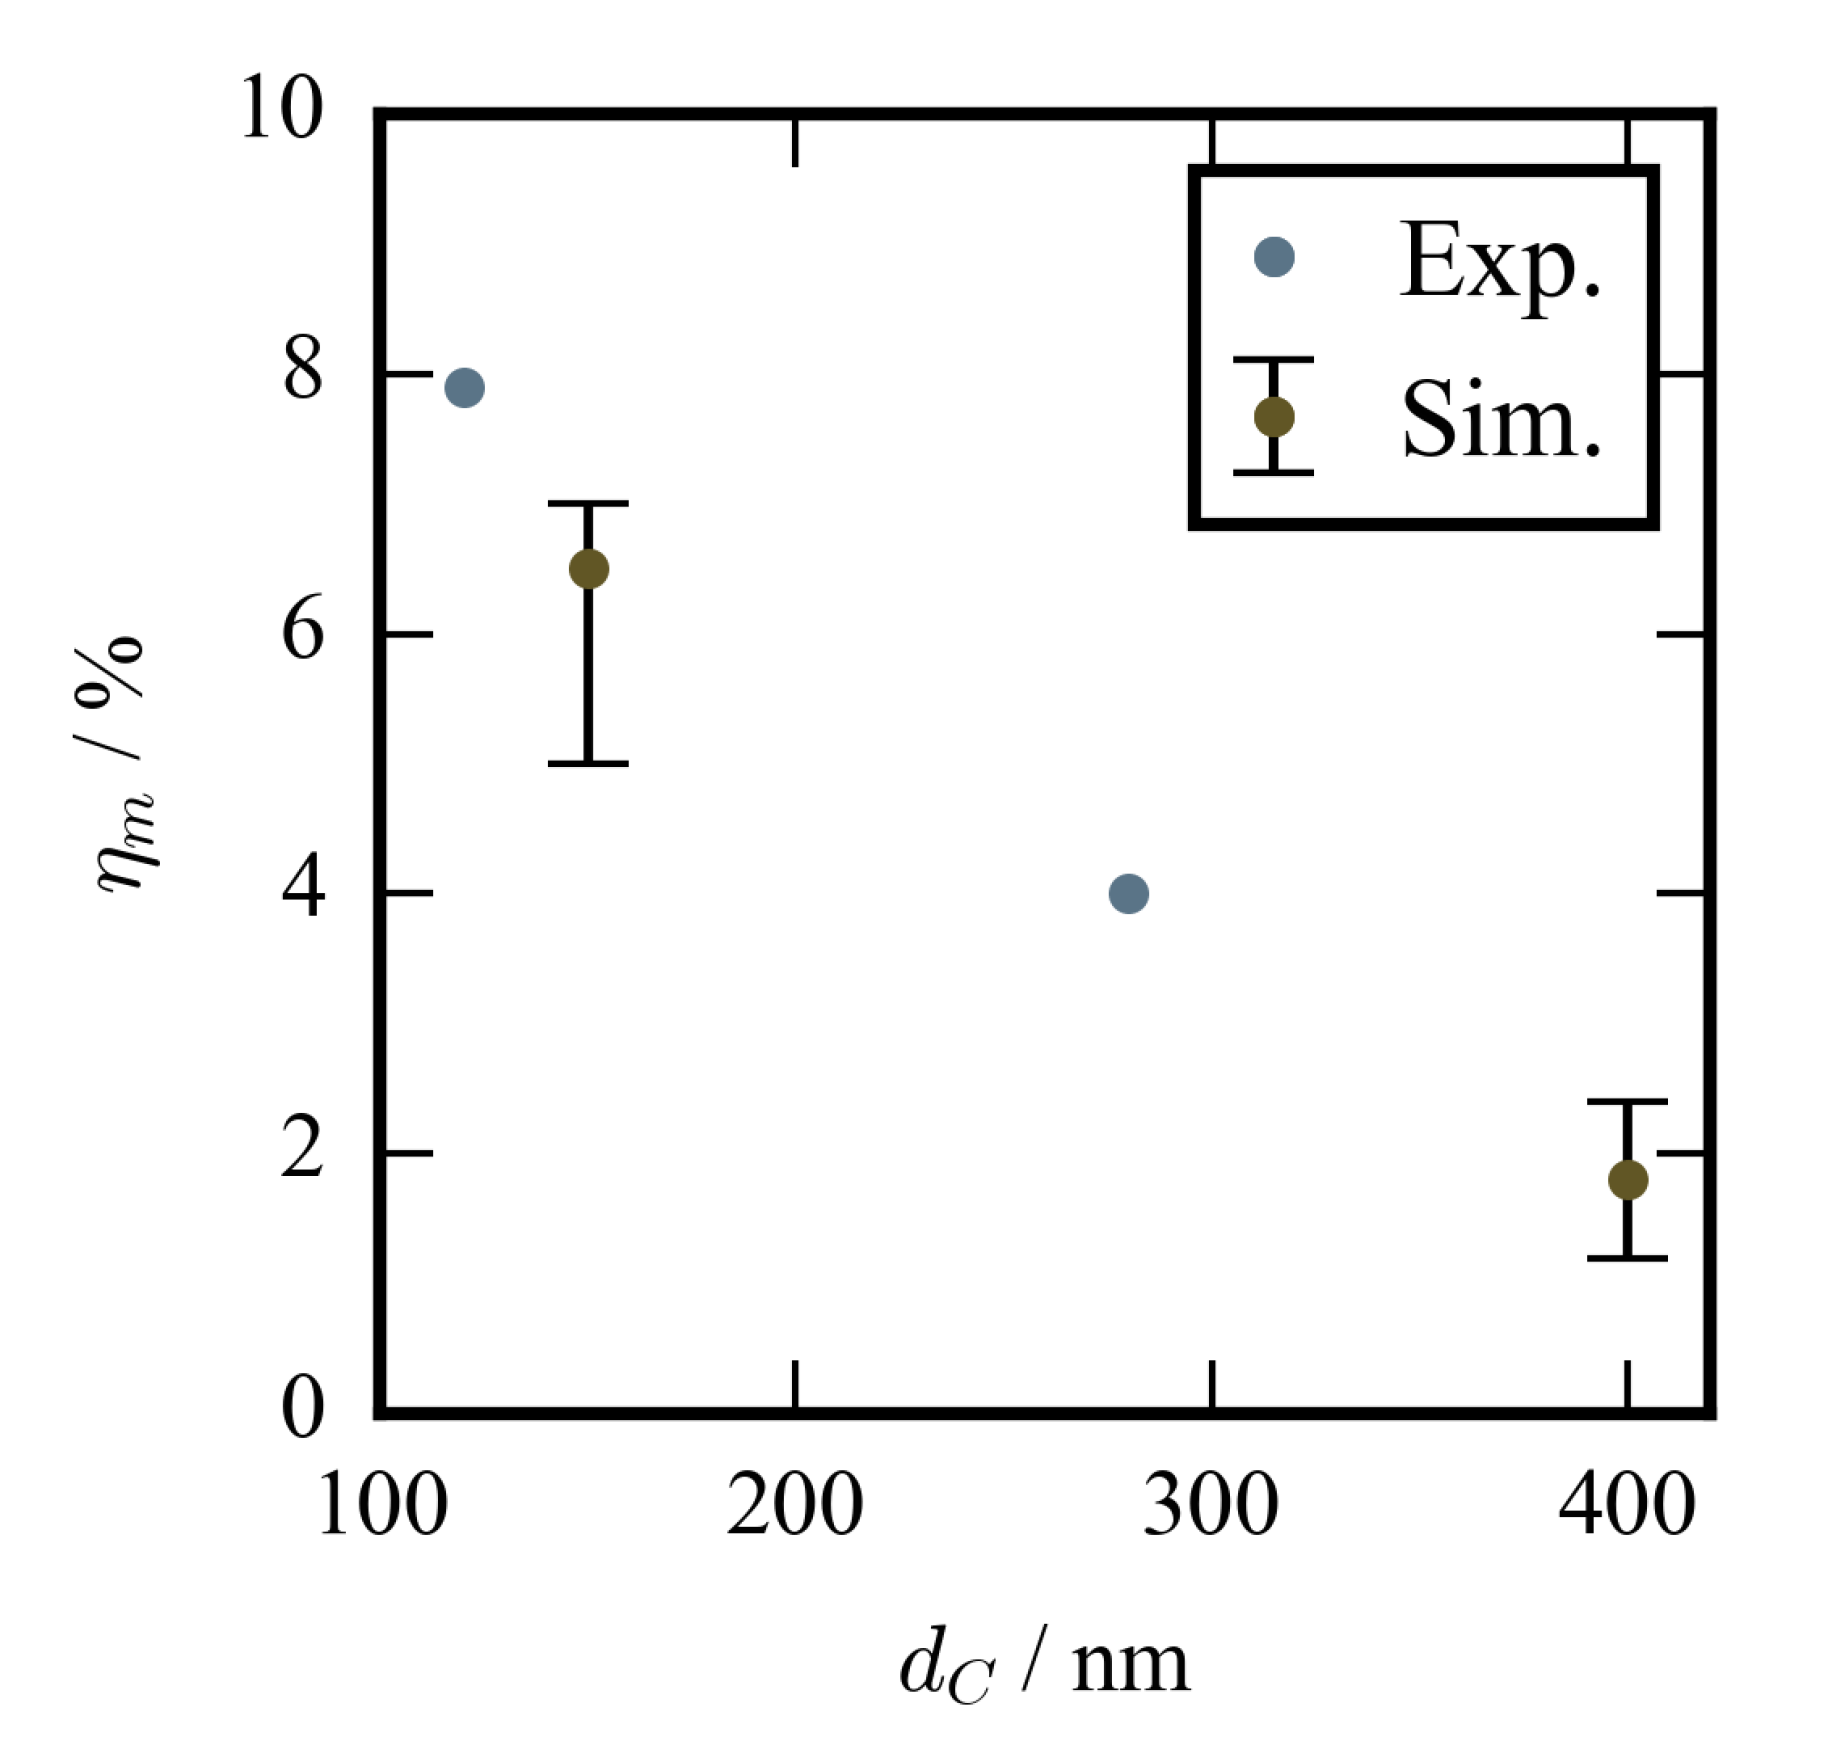
Figure 13 shows that the calculated particle loads η m fit well into those given by the experiment, following a negative trend with increasing carrier particle diameter d C . In comparison with the experimentally measured distributions, shown in Figure 14, the simulated PSDs agree in the area of smaller particles and the location of the highest particle counts. Mean diameters found by the experiments, given with 4.12 and 2.40 nm for the carrier particles of 120 and 280 nm, are within the range of those predicted by the simulations ( 3.75 and 4.18 nm for carriers of 150 and 400 nm). In both cases, distributions predicted by the simple surface coagulation model are a lot broader than given by the experiment though. The good agreement with the experimental observations concerning the particle loading η m gives rise to the assumption that deposition rates are predicted correctly. It is therefore likely that this behavior is in a large part explained by a too high value for the surface coagulation constant. The value was fitted in a one dimensional configuration using a constant mixture and has to be corrected by a more appropriate procedure in future work. Nevertheless, stressing the overall complexity of the global process, the remaining uncertainties of all sub models, the sensitivity of the investigated quantities, as well as the limited options for experimental validation, we consider the results in “surprisingly” good agreement. Studies without surface coagulation model led to a significantly different distribution with a very dominant peak at sizes around the monomer diameter and therefore, were far off the values shown by the experiment.
Finally, Figure 15, illustrates three dimensional representations of the simulation results previously shown in Figure 14. The volumetric models are obtained by ballistic reconstruction, i.e., spherical particle models are constructed according to the calculated PSDs and randomly “shot” on the carrier particle surface, whereby particle–particle collisions are considered as well. Here, a d C = 150 nm and a d C = 400 nm composite nanoparticle are shown, giving a TEM-like visual impression of the simulated data that can be compared to the TEM picture in the middle.

5. Conclusions

Spray flame synthesis of composite nanoparticles ( Pt / Al 2 O 3 ) has been investigated by experimental and numerical modeling in the scope of LES with a solvent of isopropanol and acetic acid. Simulations were performed using premixed flamelet generated manifolds (PFGM) for tabulated chemistry with the artificially thickened flame approach (ATF) for the three-dimensional model of the synthesis setup. The simulation strategy was verified in generic one-dimensional simulations (Appendix A). Aerosol dynamics have been taken into account by a sectional model, extended for surface deposition of platinum onto the alumina carrier surface, as well as for on-surface coagulation. The three dimensional simulations performed for different constant carrier particle sizes (150 and 400 nm) show good agreement with experimental observations regarding deposition rates and mean particle diameter. High deposition rates are found directly downstream of the flame, but the deployment of platinum particles continues further downstream. Particle size distributions (PSDs) of deposited platinum matter are predicted with a large deviation in width towards bigger particle sizes. Due to the good agreement of the deposited particle mass, it is likely that the surface coagulation constant has to be refitted in order to avoid too high surface coagulation rates. Investigations should be made in order to elaborate the validity of the definition of the surface collision constant and may replace it by a more general expression, or a function which decreases with higher inertia and size of deposited particles. Experiments with a larger database of particle and thermochemical data are mandatory for the development of more accurate numerical models and closures, as needed for the interaction of turbulence and coagulation processes. Simplified experiments with less complex chemistry would allow the use of finite rate chemistry and avoid the inaccuracies from using tabulated chemistry approaches and evaporation of spray mixtures.

Author Contributions

Conceptualization, P.W.; methodology, P.W.; software, P.W. and A.M.K.; validation, P.W.; formal analysis, P.W.; investigation, P.W. and S.A.; writing—original draft preparation, P.W.; writing—review and editing, P.W., I.W. and A.M.K.; visualization, P.W. and S.A.; supervision, I.W., A.M.K. and H.W.; project administration, I.W., H.W. and A.M.K.; funding acquisition, H.W., I.W. and A.M.K. All authors have read and agreed to the published version of the manuscript.

Funding

This research was funded by the European Commission in the Horizon 2020 framework (project Nanodome), grant agreement ID: 646121. The authors acknowledge the computing time granted by the Center for Computational Sciences and Simulation (CCSS) of the University of Duisburg-Essen and provided on the supercomputer magnitUDE (DFG grants INST 20876/209-1 FUGG, INST 20876/243-1 FUGG) at the Zentrum für Informations- und Mediendienste (ZIM).

Conflicts of Interest

The authors declare no conflict of interest. The funders had no role in the design of the study; in the collection, analyses, or interpretation of data; in the writing of the manuscript, or in the decision to publish the results.

Appendix A. Verification of Model Implementation

The verification of the model setup and the implementation of the numerical methods were performed in one-dimensional, generic test cases. Three simulations have been performed applying two different codes: Cantera and the in-house code PsiPhi, the latter described in Section 4. Cantera is widely known and utilized in the chemical kinetics community for simulation of one-dimensional laminar flame configurations with finite rate chemistry and adaptive grid refinement. For the comparison between both codes, a laminar freely propagating flame configuration with stoichiometric air to fuel ratio has been chosen. The fuel (solvent-spray and pilot) and precursor ratio is kept the same as in the experiments and the liquid fuel is assumed to be completely evaporated. The particle model is implemented and conducted in PsiPhi only. Alumina carrier particles are injected at a distance of about 15 mm behind the flame front in order to account for the delayed release from the encapsulating droplet in case of a spray injection. The alumina carrier particle inception considers the mass flow given by the experiments at a fixed diameter of d C = 150 nm. Two of three simulations are performed using PsiPhi, where the first simulation resolves the flame front with a grid size of Δ = 15.625   μ m . The second PsiPhi calculation uses a grid size of Δ = 0.25   m m and resolves the flame front by ATF on a width of 8 cells. This corresponds to the setup used for further 3D calculations of the complete synthesis flame configuration. The Navier–Stokes equations were solved in the low-Mach number formulation applying a fractional step pressure-velocity coupling, while an explicit three step Runge–Kutta scheme was used for time integration. Spatial derivatives for momentum equations were approximated by a second order central differencing scheme, while for the convective fluxes of all remaining scalars a TVD-scheme was used applying the non-linear CHARM limiter [61].

Verification Results

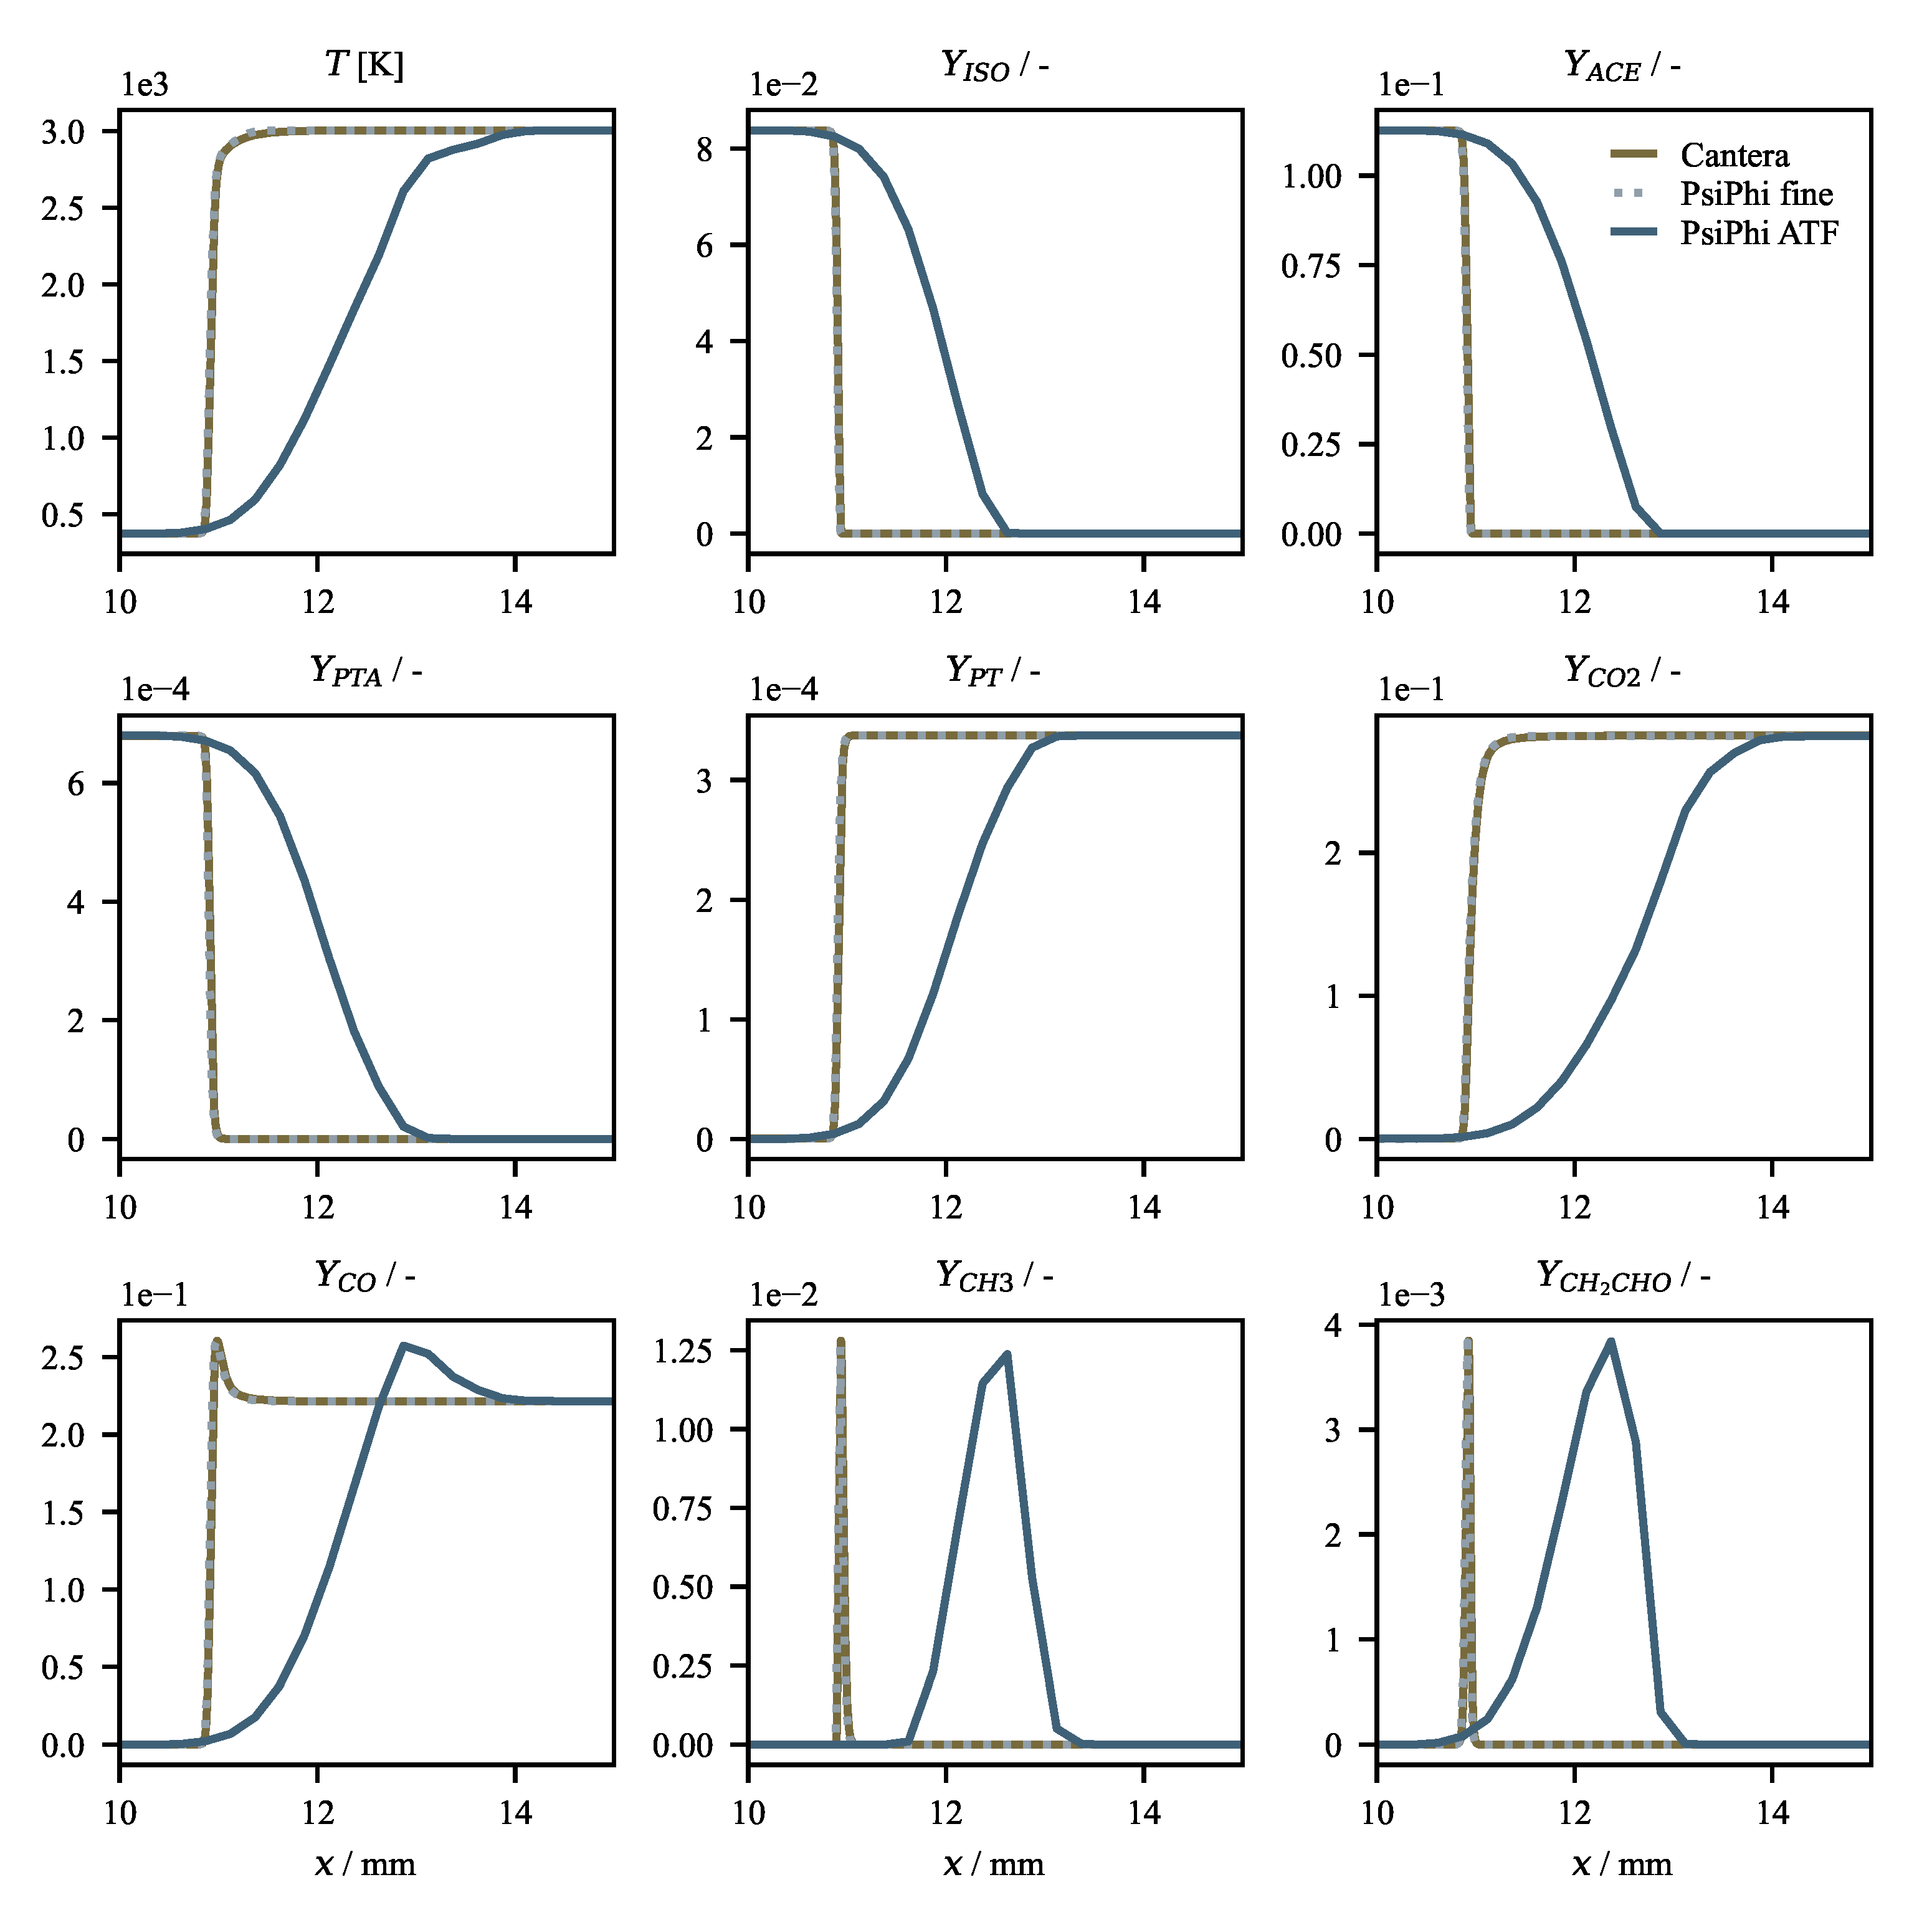
Figure A1 shows the results of all three simulations in terms of spatial temperature and species mass fraction profiles. While the finite rate chemistry solution performed using Cantera is considered as the “reference solution”, it is evaluated how accurate the different settings are in direct comparison. Within the shown window of 1.5 cm around the flame front, no deviation between the Cantera and the resolved PsiPhi solution can be observed, testifying the applied tabulated chemistry method combined with the defined progress variable being able to reconstruct the flames structure in the given configuration. The coarser PsiPhi simulation with the ATF approach exhibits a stretched flame front in comparison to the resolving simulations, while conserving a similar slope. This effect is due to the ATF and allows the flame front being resolved on coarser grids, avoiding artifacts and larger errors for flame speed and progress. Nevertheless, it is obvious that further simulations would benefit from a finer spatial resolution, but keeping in mind the dimensions of the real-world flame, the authors consider this setting as the best trade-off between computational expenses and accuracy.
Further investigations are made for the developed sectional particle deposition model in order to verify the model behavior within the simplified one-dimensional environment. Figure A2 shows the direct comparison of the evolution process of free and deposited particle distributions, as well as the total carrier coverage ξ t and loading η . It can be observed that after a strong growth in number and size close to the reaction zone, the number concentration of free particles N is remarkably reduced after carrier particle being released. As the quadratic dependency of the deposition process indicates, free particle numbers decrease in sections with high number concentrations and vice versa. The consequence for the surface particle distributions is a drastic increase of particle numbers in the corresponding sections within the zones of intermediate and small sized particles right after the carrier particle release. Due to the surface coagulation model, coagulation of platinum particles continues on the carrier particle surface and the PSD of deposited particles q is shifted towards larger particle sizes downstream. Interestingly, after the deposition process is initialized, particles on the carrier surface grow faster that the remaining free particles within the gas phase. The increasing surface particle coagulation rate is additionally a reason for the stagnating total surface coverage ξ t at simultaneously increasing carrier particle loading η m . At a distance of x 150 mm, the surface particle coagulation rate outnumbers the deposition rate in such a way that the particle coverage starts decreasing.
Figure A1. Comparison of thermochemical states obtained by different one-dimensional simulations using finite rate chemistry (Cantera) and tabulated chemistry (PsiPhi) with direct resolved flame front and flame front resolved by applying artificially thickened flame (ATF).
Fluids 05 00201 g0a1
Figure A2. Contours and line plots of different quantities over axial distance x, the location of carrier particle injection ( x = 25 mm) is indicated by a gray dotted line. From left to right: contour of free particle N size distribution over x; contour of deposited particle q size distribution over x; line plots of mean free and deposited particle diameters d m and d s , m , as well as the total surface coverage ξ t and the carrier particle load η along the x-direction.
Fluids 05 00201 g0a2
Figure A3. From left to right: distributions of free particle sizes N, deposited particle sizes q and particle coverage ξ for all sections at different axial distances x = 25, 63 and 163 mm.
Fluids 05 00201 g0a3
Figure A3 visualizes this process by showing distributions of the free gas particles N i , deposited particles q i and the carrier coverage ξ i for section index i at three different positions (x = 25, 63, 163 mm), respectively. It becomes obvious that the main deposition process takes place directly after the carrier particle inception at x = 25 mm, transferring a large number of free gas phase platinum particles N to the carrier surface distributions q between position x = 25 mm and x = 63 mm. Accordingly, the hampered growing of free gas phase particle sizes is attributed to the fact that the number concentration N gets thinned out due to the deposition process. Figure A4 illustrates this behavior by visualizing the trend of the free platinum particle coagulation rate tensor [ d N i j / d t ] c , N for the same positions as used for prior investigations (i.e., x = 25, 63, 163 mm). As expected, drop of the coagulation rate after the particle release (between x = 25 and 63 mm) is considerably larger than the following step, as the linear trend is shown on a logarithmic scale. Due to the growth of the remaining free platinum particles within the gas phase, the coagulation maximum moves along the symmetric tensors’ main diagonal, towards larger particle sizes in flow direction.
Figure A4. Representation of the symmetric free particle coagulation rate matrix at different axial distances (FLTR) x = 25, 63 and 163 mm.
Fluids 05 00201 g0a4
In order to investigate the behavior of the deposition process of free platinum particles to the carrier surface, the total deposition rate d N k / d t c , C (Equation (21)) is split into its contribution for different sections according to the equation given below.
d Q i j d t d e p = ξ j d N i d t c , C + ( 1 ξ t ) E j d N i d t c , C δ i j ,
where E j is j-th component of the first order unit matrix and δ i j is the Kronecker delta. Rates corresponding to the contributions from Equation (A1) are indicated in Figure A5. In contrast to the free particle coagulation rate, the matrix resulting from the deposition rate is not symmetric. It can be observed that the distribution in N direction (x-axis) very much equals the free molecular particle coagulation rate (Figure A4) though. In the Q direction (y-axis), the distribution is generated by the coverage ξ i , which moves to a higher maxima according to the on-surface coagulation. With respect to the similarity to the distributions given by Figure A3 (right), the distribution in Q direction can be well explained. The comb along the main diagonal represents the deposition rate of particles which either directly contact the surface, or collide with a deposited platinum particle of the same size. Further, every value off the diagonal corresponds to a collision of a free gas particle N i with a particle attached to the carrier surface Q j . For better understanding, Figure A6 shows the deposition rates on the main diagonal, given by the equation below
d Q i j d t d e p d = d Q i j d t d e p δ i j ,
for illustration of the contributions of the direct deposition on the carrier surface and collision with particles covering the carrier. The evolution of the overall three-dimensional distribution is an example for the whole deposition process and in line with observations made before (Figure A2, Figure A3, Figure A4). Explained using the example of Figure A5 and Figure A6, the process can be described from left to right (in flow direction): (I) The free particles, which were generated in and after the flame front, strongly deposit on the almost empty surface. Therefore, rates off the main diagonal are very low, with high values for small N and Q. (II) A major amount of particles was already deposited and the surface is covered by platinum particles by more than 4% (see Figure A3). Direct deposition on the carrier surface is still dominant, but collision with deposited platinum material is more relevant. Particles deposited on the carrier have a larger average size in comparison to free gas particles due to on-surface coagulation. (III) Particle deposition rate decreases further, especially in the region of smaller particle sections. The importance of free particle and deposited particle interactions increases for larger particle sections, as particle growth on the carrier surface increases the coverage of particles in that size range.
Figure A5. Representation of the non-symmetric particle deposition rate matrix at different axial distances (FLTR) x = 25, 63 and 163 mm.
Fluids 05 00201 g0a5
Figure A6. Particle deposition rate contributions of the main diagonal of the particle deposition rate matrix given by Equation (A2) at different axial distances (FLTR) x = 25, 63 and 163 mm.
Fluids 05 00201 g0a6
Summarizing, free particle coagulation and on-surface coagulation can be understood as individual processes, connected by the deposition procedure. Deposition is in first place driven by free particle and carrier particle concentrations and therefore dominant in regions, in which carrier particles are incepted to existing platinum particles. More sophisticated tests must be performed to justify further adaption of the on-surface coagulation constant α c .

References

  1. Mädler, L.; Kammler, H.K.; Mueller, R.; Pratsinis, S.E. Controlled synthesis of nanostructured particles by flame spray pyrolysis. J. Aerosol. Sci. 2002, 33, 369–389. [Google Scholar] [CrossRef]
  2. Grossmann, H.K.; Grieb, T.; Meierhofer, F.; Hodapp, M.J.; Noriler, D.; Gröhn, A.; Meier, H.F.; Fritsching, U.; Wegner, K.; Mädler, L. Nanoscale mixing during double-flame spray synthesis of heterostructured nanoparticles. J. Nanopart. Res. 2015, 17, 174. [Google Scholar] [CrossRef]
  3. Kempf, A.M.; Schulz, C. SpraySyn Standardbrenner: Definition, Gesamtsimulation, Charakterisierung. Available online: https://gepris.dfg.de/gepris/projekt/375220870 (accessed on 1 October 2020).
  4. Schneider, F.; Suleiman, S.; Menser, J.; Borukhovich, E.; Wlokas, I.; Kempf, A.; Wiggers, H.; Schulz, C. SpraySyn—A standardized burner configuration for nanoparticle synthesis in spray flames. Rev. Sci. Instrum. 2019, 90, 085108. [Google Scholar] [CrossRef] [PubMed] [Green Version]
  5. Buesser, B.; Groehn, A.J. Multiscale Aspects of Modeling Gas-Phase Nanoparticle Synthesis. Chem. Eng. Technol. 2012, 35, 1133–1143. [Google Scholar] [CrossRef] [PubMed] [Green Version]
  6. Noriler, D.; Hodapp, M.J.; Decker, R.K.; Meier, H.F.; Meierhofer, F.; Fritsching, U. Numerical simulation of flame spray pyrolysis process for nanoparticle productions: Effects of 2d and 3d approaches. In Fluids Engineering Division Summer Meeting; American Society of Mechanical Engineers: New York, NY, USA, 2014; Volume 46216, p. V01AT03A021. [Google Scholar]
  7. Weise, C.; Menser, J.; Kaiser, S.; Kempf, A.; Wlokas, I. Numerical investigation of the process steps in a spray flame reactor for nanoparticle synthesis. Proc. Combust. Inst. 2015, 35, 2259–2266. [Google Scholar] [CrossRef]
  8. Gröhn, A.J.; Pratsinis, S.E.; Sánchez-Ferrer, A.; Mezzenga, R.; Wegner, K. Scale-up of nanoparticle synthesis by flame spray pyrolysis: The high-temperature particle residence time. Ind. Eng. Chem. Res. 2014, 53, 10734–10742. [Google Scholar] [CrossRef]
  9. Kruis, F.E.; Kusters, K.A.; Pratsinis, S.E.; Scarlett, B. A Simple Model for the Evolution of the Characteristics of Aggregate Particles Undergoing Coagulation and Sintering. Aerosol Sci. Technol. 1993, 19, 514–526. [Google Scholar] [CrossRef] [Green Version]
  10. Rittler, A.; Deng, L.; Wlokas, I.; Kempf, A.M. Large eddy simulations of nanoparticle synthesis from flame spray pyrolysis. Proc. Combust. Inst. 2016, 36, 1077–1087. [Google Scholar] [CrossRef]
  11. Abdelsamie, A.; Chi, C.; Nanjaiah, M.; Skenderović, I.; Suleiman, S.; Thévenin, D. Direct Numerical Simulation of Turbulent Spray Combustion in the SpraySyn Burner: Impact of Injector Geometry. Flow Turbul. Combust. 2020, 1–17. [Google Scholar] [CrossRef]
  12. Vemury, S.; Pratsinis, S.E. Self-preserving size distributions of agglomerates. J. Aerosol Sci. 1995, 26, 175–185. [Google Scholar] [CrossRef]
  13. Vemury, S.; Pratsinis, S.E.; Kibbey, L. Electrically Controlled Flame Synthesis of Nanophase TiO2, SiO2, and SnO2 Powders. J. Mater. Res. 1997, 12, 1031–1042. [Google Scholar] [CrossRef]
  14. Gelbard, F.; Seinfeld, J.H. The general dynamic equation for aerosols. Theory and application to aerosol formation and growth. J. Colloid Interface Sci. 1979, 68, 363–382. [Google Scholar] [CrossRef]
  15. Rigopoulos, S. Population balance modelling of polydispersed particles in reactive flows. Prog. Energy Combust. Sci. 2010, 36, 412–443. [Google Scholar] [CrossRef] [Green Version]
  16. Ramkrishna, D.; Singh, M.R. Population balance modeling: Current status and future prospects. Annu. Rev. Chem. Biomol. Eng. 2014, 5, 123–146. [Google Scholar] [CrossRef] [Green Version]
  17. Gelbard, F.; Tambour, Y.; Seinfeld, J.H. Sectional representations for simulating aerosol dynamics. J. Colloid Interface Sci. 1980, 76, 541–556. [Google Scholar] [CrossRef]
  18. Garrick, S.; Zachariah, M.; Lehtinen, K. Modeling and simulation of nanoparticle coagulation in high reynolds number incompressible flows. In Proceedings of the National Conference of the Combustion Institute, Oakland, CA, USA, 25–28 March 2001. [Google Scholar]
  19. Loeffler, J.; Das, S.; Garrick, S.C. Large Eddy Simulation of Titanium Dioxide Nanoparticle Formation and Growth in Turbulent Jets. Aerosol Sci. Technol. 2011, 45, 616–628. [Google Scholar] [CrossRef] [Green Version]
  20. Blacha, T.; Di Domenico, M.; Gerlinger, P.; Aigner, M. Soot predictions in premixed and non-premixed laminar flames using a sectional approach for PAHs and soot. Combust. Flame 2012, 159, 181–193. [Google Scholar] [CrossRef]
  21. Lindstedt, R.; Waldheim, B. Modeling of soot particle size distributions in premixed stagnation flow flames. Proc. Combust. Inst. 2013, 34, 1861–1868. [Google Scholar] [CrossRef]
  22. Rodrigues, P.; Franzelli, B.; Vicquelin, R.; Gicquel, O.; Darabiha, N. Coupling an LES approach and a soot sectional model for the study of sooting turbulent non-premixed flames. Combust. Flame 2018, 190, 477–499. [Google Scholar] [CrossRef] [Green Version]
  23. Schiener, M.; Lindstedt, R. Transported probability density function based modelling of soot particle size distributions in non-premixed turbulent jet flames. Proc. Combust. Inst. 2019, 37, 1049–1056. [Google Scholar] [CrossRef]
  24. Hardt, S.; Wlokas, I.; Schulz, C.; Wiggers, H. Impact of Ambient Pressure on Titania Nanoparticle Formation During Spray-Flame Synthesis. J. Nanosci. Nanotechnol. 2015, 15, 9449–9456. [Google Scholar] [CrossRef] [PubMed]
  25. Hamid, N.A.; Wennig, S.; Hardt, S.; Heinzel, A.; Schulz, C.; Wiggers, H. High-capacity cathodes for lithium-ion batteries from nanostructured LiFePO4 synthesized by highly-flexible and scalable flame spray pyrolysis. J. Power Sources 2012, 216, 76–83. [Google Scholar] [CrossRef]
  26. Van Oijen, J.A.; de Goey, L.P.H. Modelling of Premixed Laminar Flames using Flamelet-Generated Manifolds. Combust. Sci. Technol. 2000, 161, 113–137. [Google Scholar] [CrossRef] [Green Version]
  27. Peters, N. Laminar flamelet concepts in turbulent combustion. Symp. (Int.) Combust. 1988, 21, 1231–1250. [Google Scholar] [CrossRef]
  28. Utriainen, M.; Kröger-Laukkanen, M.; Johansson, L.S.; Niinistö, L. Studies of metallic thin film growth in an atomic layer epitaxy reactor using M(acac)2 (M=Ni, Cu, Pt) precursors. Appl. Surf. Sci. 2000, 157, 151–158. [Google Scholar] [CrossRef]
  29. Chaston, J.C. Reactions of Oxygen with the Platinum Metals. Platinum Met. Rev. 1965, 9, 51–56. [Google Scholar]
  30. Mosquera, A.; Horwat, D.; Vazquez, L.; Gutiérrez, A.; Erko, A.; Anders, A.; Andersson, J.; Endrino, J.L. Thermal decomposition and fractal properties of sputter-deposited platinum oxide thin films. J. Mater. Res. 2012, 27, 829–836. [Google Scholar] [CrossRef]
  31. Simonsen, S.B.; Chorkendorff, I.; Dahl, S.; Skoglundh, M.; Sehested, J.; Helveg, S. Direct Observations of Oxygen-induced Platinum Nanoparticle Ripening Studied by In Situ TEM. J. Am. Chem. Soc. 2010, 132, 7968–7975. [Google Scholar] [CrossRef] [Green Version]
  32. Peev, N.S. Particle Collision Frequency and the Two-dimensional Particles Nucleation. C. R. Acad. Sci. 2013, 66, 29–34. [Google Scholar] [CrossRef]
  33. Pelucchi, M.; Bissoli, M.; Cavallotti, C.; Cuoci, A.; Faravelli, T.; Frassoldati, A.; Ranzi, E.; Stagni, A. Improved kinetic model of the low-temperature oxidation of n-heptane. Energy Fuels 2014, 28, 7178–7193. [Google Scholar] [CrossRef]
  34. Djokic, M.R.; Van Geem, K.M.; Cavallotti, C.; Frassoldati, A.; Ranzi, E.; Marin, G.B. An experimental and kinetic modeling study of cyclopentadiene pyrolysis: First growth of polycyclic aromatic hydrocarbons. Combust. Flame 2014, 161, 2739–2751. [Google Scholar] [CrossRef]
  35. Brönstrup, M.; Schröder, D.; Kretzschmar, I.; Schwarz, H.; Harvey, J.N. Platinum Dioxide Cation: Easy to Generate Experimentally but Difficult to Describe Theoretically. J. Am. Chem. Soc. 2001, 123, 142–147. [Google Scholar] [CrossRef]
  36. Van Oijen, J.A.; Bastiaans, R.J.M.; De Goey, L.P.H. Low-dimensional manifolds in direct numerical simulations of premixed turbulent flames. Proc. Combust. Inst. 2007, 31, 1377–1384. [Google Scholar] [CrossRef]
  37. Peters, N. Laminar diffusion flamelet models in non-premixed turbulent combustion. Prog. Energy Combust. Sci. 1984, 10, 319–339. [Google Scholar] [CrossRef]
  38. Peters, N. Turbulent Combustion; Cambridge University Press: Cambridge, UK, 2000. [Google Scholar]
  39. Pope, S.B. Turbulent Flows; IOP Publishing: Bristol, UK, 2001. [Google Scholar]
  40. Nicoud, F.; Toda, H.B.; Cabrit, O.; Bose, S.; Lee, J. Using singular values to build a subgrid-scale model for large eddy simulations. Phys. Fluids 2011, 23, 085106. [Google Scholar] [CrossRef] [Green Version]
  41. Butler, T.; O’rourke, P. A numerical method for two dimensional unsteady reacting flows. Symp. (Int.) Combust. 1977, 16, 1503–1515. [Google Scholar] [CrossRef] [Green Version]
  42. Legier, J.P.; Poinsot, T.J.; Veynante, D. Dynamically thickened flame LES model for premixed and non-premixed turbulent combustion. Proc. Summer Prog. 2000, 12, 157–168. [Google Scholar]
  43. Proch, F.; Domingo, P.; Vervisch, L.; Kempf, A.M. Flame resolved simulation of a turbulent premixed bluff-body burner experiment. Part II: A-priori and a-posteriori investigation of sub-grid scale wrinkling closures in the context of artificially thickened flame modeling. Combust. Flame 2017, 180, 340–350. [Google Scholar] [CrossRef]
  44. Charlette, F.; Meneveau, C.; Veynante, D. A Power-Law Flame Wrinkling Model for LES of Premixed Turbulent Combustion Part I- Non-Dynamic Formulation and Initial Tests. Combust. Flame 2002, 131, 159–180. [Google Scholar] [CrossRef]
  45. Wang, G.; Boileau, M.; Veynante, D. Implementation of a dynamic thickened flame model for large eddy simulations of turbulent premixed combustion. Combust. Flame 2011, 158, 2199–2213. [Google Scholar] [CrossRef]
  46. Rittler, A.; Proch, F.; Kempf, A.M. LES of the Sydney piloted spray flame series with the PFGM/ATF approach and different sub-filter models. Combust. Flame 2015, 162, 1575–1598. [Google Scholar] [CrossRef]
  47. Berg, H.C. Random Walks in Biology; Princeton University Press: Princeton, NJ, USA, 1993. [Google Scholar]
  48. Friedlander, S. Smoke, Dust and Haze: Fundamentals of Aerosol Behavior; Oxford University Press: Oxford, UK, 1977. [Google Scholar]
  49. Pratsinis, S.E. Simultaneous nucleation, condensation, and coagulation in aerosol reactors. J. Colloid Interface Sci. 1988, 124, 416–427. [Google Scholar] [CrossRef]
  50. Kazakov, A.; Frenklach, M. Dynamic Modeling of Soot Particle Coagulation and Aggregation: Implementation with the Method of Moments and Application to High-Pressure Laminar Premixed Flames. Combust. Flame 1998, 114, 484–501. [Google Scholar] [CrossRef]
  51. Harris, S.J.; Kennedy, I.M. The Coagulation of Soot Particles with van der Waals Forces. Combust. Sci. Technol. 1988, 59, 443–454. [Google Scholar] [CrossRef]
  52. Menz, W.J.; Kraft, M. A new model for silicon nanoparticle synthesis. Combust. Flame 2013, 160, 947–958. [Google Scholar] [CrossRef]
  53. Shekar, S.; Sander, M.; Riehl, R.C.; Smith, A.J.; Braumann, A.; Kraft, M. Modelling the flame synthesis of silica nanoparticles from tetraethoxysilane. Chem. Eng. Sci. 2012, 70, 54–66. [Google Scholar] [CrossRef]
  54. Sander, M.; West, R.H.; Celnik, M.S.; Kraft, M. A Detailed Model for the Sintering of Polydispersed Nanoparticle Agglomerates. Aerosol Sci. Technol. 2009, 43, 978–989. [Google Scholar] [CrossRef]
  55. Wang, C.S.; Friedlander, S.K. The self-preserving particle size distribution for coagulation by Brownian motion: II. Small particle slip correction and simultaneous shear flow. J. Colloid Interface Sci. 1967, 24, 170–179. [Google Scholar] [CrossRef]
  56. Prakash, A.; Bapat, A.P.; Zachariah, M.R. A Simple Numerical Algorithm and Software for Solution of Nucleation, Surface Growth, and Coagulation Problems. Aerosol Sci. Technol. 2003, 37, 892–898. [Google Scholar] [CrossRef]
  57. Spicer, P.T.; Chaoul, O.; Tsantilis, S.; Pratsinis, S.E. Titania formation by TiCl4 gas phase oxidation, surface growth and coagulation. J. Aerosol Sci. 2002, 33, 17–34. [Google Scholar] [CrossRef]
  58. Proch, F.; Kempf, A.M. Numerical analysis of the Cambridge stratified flame series using artificial thickened flame LES with tabulated premixed flame chemistry. Combust. Flame 2014, 161, 2627–2646. [Google Scholar] [CrossRef]
  59. Kempf, A.M.; Geurts, B.J.; Oefelein, J.C. Error analysis of large-eddy simulation of the turbulent non-premixed sydney bluff-body flame. Combust. Flame 2011, 158, 2408–2419. [Google Scholar] [CrossRef] [Green Version]
  60. Proch, F.; Kempf, A.M. Modeling heat loss effects in the large eddy simulation of a model gas turbine combustor with premixed flamelet generated manifolds. Proc. Combust. Inst. 2015, 35, 3337–3345. [Google Scholar] [CrossRef]
  61. Zhou, G. Numerical Simulations of Physical Discontinuities in Single and Multi-Fluid Flows for Arbitrary Mach Numbers. Ph.D. Thesis, Chalmers University of Technology, Gothenburg, Sweden, 1995. [Google Scholar]
Figure 1. TEM picture (left) and EDX elemental mapping (right) of an alumina particle decorated with smaller platinum particles produced by flame spray synthesis (isopropanol and toluene). Platinum atoms detected by the EDX (depicted in blue) form the different Pt-particles shown in the TEM picture. The Pt-particles are distributed over the surface of the Al 2 O 3 particle (Al atoms depicted in red). The EDX analysis indicates a Pt mass-loading η m of 7.9% on the Al 2 O 3 carrier particle (mass ratio Pt to Al 2 O 3 ).
Fluids 05 00201 g001
Figure 2. Photo of the experimental configuration (left) and close-up of the burner (right) during operation. The latter shows a flame without precursor addition.
Fluids 05 00201 g002
Figure 3. Snippet of the thermochemical data stored in the premixed flamelet generated manifold (PFGM) table for the given case at f 2 = 0.15 . From left to right and top to bottom: temperature, mass fractions of CO , CO 2 , O 2 , Pt ( acac ) 2 and the nanoparticle inception source term.
Fluids 05 00201 g003
Figure 4. Processes description in 3 steps: 1—droplet evaporation/shrinking, 2—droplet collapsing and carrier particle release, 3—platinum particle growth in gas phase and on carrier surface, gas phase particle deposition.
Fluids 05 00201 g004
Figure 5. Contour plots along the x-y plane; from left to right: Temperature T, total gas phase particle number concentration N t , total deposited particle number q t , carrier particle concentration C. Images are split in two parts: the left part corresponds to to the simulation with smaller carrier particles ( d C = 150 nm) and the right part to the simulation with larger carrier particles ( d C = 400 nm), respectively.
Fluids 05 00201 g005
Figure 6. Contour plots along the x-y plane; From left to right: Mean gas particle diameter d a , mean deposited particle diameter d s , a , carrier particle load η m . Images are split in two parts: the upper part corresponds to to the simulation with smaller carrier ( d C = 150 nm) and the lower part to the simulation with larger carrier ( d C = 400 nm), respectively.
Fluids 05 00201 g006
Figure 7. Profiles along the centerline of time averaged free particle mean diameter d ¯ m a and normalized time averaged total dispersed particle number concentration N ¯ t a * for the cases (a) d C = 400 nm and (b) d C = 150 nm . Profiles along the centerline of time averaged deposited particle mean diameter d ¯ s , m a and normalized temporal averaged total deposited particle number per carrier q ¯ t a * for the cases (c) d C = 400 nm and (d) d C = 150 nm (see text for quantity definition). Dots represent the instantaneous values of d m and d s , m .
Fluids 05 00201 g007
Figure 8. Time averaged quantities of different carrier particle sizes in comparison. (Top): free particle number concentration N ¯ t a and number per carrier q ¯ t a * . (Bottom): total surface coverage ξ ¯ t a and carrier loading η ¯ a .
Fluids 05 00201 g008
Figure 9. Averaged particle size distributions (PSDs) of platinum particles for d C = 150 nm in gas phase N (green) and on carrier surface q (blue). Dashed lines indicate the RMS of flow field fluctuations. Black lines show the instantaneous PSDs of q. Left-to-Right: different distances from burner x = 80 , 125 , 170 mm; Top-to-Bottom: different radial positions from axis r = 0 , 10 , 15 mm.
Fluids 05 00201 g009
Figure 10. Averaged PSDs of platinum particles d C = 400 nm in gas phase (green) and on carrier surface (blue) with dashed lines indicating the RMS of flow field fluctuations. Black lines show the instantaneous PSDs of q. Left-to-Right: different distances from burner x = 80 , 125 , 170 mm; Top-to-Bottom: different radial positions from axis r = 0 , 10 , 15 mm.
Fluids 05 00201 g010
Figure 11. Instantaneous PSDs of deposited platinum material for the case d C = 150 nm. PSDs obtained at 3 locations at an axial height of x = 200 mm. The contour plot visualizes the 3 locations taken for the PSDs within the particle mass load field η m .
Fluids 05 00201 g011
Figure 12. Instantaneous PSDs of deposited platinum material for the case d C = 400 nm. PSDs obtained at 3 locations at an axial height of x = 200 mm. The contour plot visualizes the 3 locations taken for the PSDs within the particle mass load field η m .
Fluids 05 00201 g012
Figure 13. Particle load η m (mass ratio Pt to Al 2 O 3 ) of platinum particles deployed on alumina carrier particle surface obtained by EDX of single product particles from experiments (blue) and from a specific point in time and space (at x = 200 mm) from simulations (brown). Values of particle load η m calculated from simulations (brown) correspond to location 1 from Figure 11 ( d c = 150 nm) and location 2 of Figure 12 ( d c = 400 nm), respectively. Error bars represent the minimum and maximum values of computed η m at the cross section x = 200 mm above the burner (see contour of Figure 11 and Figure 12) for the different carrier particle sizes.
Fluids 05 00201 g013
Figure 14. Measured and calculated PSDs of platinum particles deployed on alumina carrier particle surface. Calculated distributions correspond to PSD 1 from Figure 11 and PSD 2 of Figure 12, respectively.
Fluids 05 00201 g014
Figure 15. Artificial TEM representation of two calculated particles (left: d C = 150 nm, right: d C = 400 nm). TEM particle (center: d C = 280 nm) is the source for the distribution given in Figure 14.
Fluids 05 00201 g015
Publisher’s Note: MDPI stays neutral with regard to jurisdictional claims in published maps and institutional affiliations.