1. Introduction
The rapid increase in the population within urban areas and limited ground spaces have increased the need for multilevel car parking facilities, either aboveground or underground. An underground carpark is an enclosed space located below ground level due to better utilization of the building space. Indoor air quality (IAQ) is a critical element when designing an underground carpark as it directly affects the health of human beings using it. Car emissions are the main source of air pollution in underground carparks were exposure to high levels of these emissions, such as Carbon Monoxide (CO), could cause respiratory and heart diseases [
1,
2,
3]. Car emissions might increase during start-up and at lower speed and health effects might become worse in poor ventilation, which make underground carparks not favorable for long-term stays [
4,
5]. Carpark users may become feel uncomfortable at temperatures of 32 °C to 35 °C and air velocity between 0.2 and 0.4 m/s for 80% satisfaction [
6]. Therefore, a given underground carpark requires a proper ventilation system to maintain CO levels within acceptable limits in accordance with regulations and legislations of the related country [
7].
Natural ventilation in underground carparks is not common as carparks do not provide sufficient number of openings of an aggregate area equal to at least 5% of the floor area at a given level, of which at least half should be in two opposing walls [
8,
9,
10]. Moreover, a minimum of 3 °C difference between indoor and outdoor temperatures is needed to validate the natural ventilation approach [
11]. Sometimes this is not possible and it is necessary to adopt an alternative approach to natural ventilation [
12]. Therefore, a mechanical ventilation system (ducted (conventional) or ductless ventilation systems) is necessary to ensure good IAQ that meets standards and regulations of CO exposure limits. Ductless mechanical ventilation system using jet fans is becoming popular these days due to its success in controlling fire, resulted in smoke and other contaminants in Tunnels. Within carparks, ductless system could be achieved through supply fans installed within supply air shaft or side walls openings, impulse jet fans installed at ceiling level of the carpark to mix and force the air into motion towards the exhaust shaft or wall openings, exhaust fans installed within exhaust air shaft or side wall openings, a detection system and a control system [
10]. Jet fans could keep smoke at high levels and transfer it to the exhaust fans or louvers which enhances the extracting process [
13]. Using jet fans instead of duct network increases the total moving air volume to around 10 times of the intake air volume. Therefore, the extraction capacity must be large enough to accommodate the required flow rates to dilute the contaminants within the required time, based on the regulated ventilation rates.
The worldwide accepted ventilation requirements of underground carparks are 6 air changes per hour (ACH) or 5 to 7.6 L/s·m
2 in normal CO dilution mode and 10 ACH for smoke clearance in case of a fire [
14,
15]. However, these values did not provide healthy environment within carparks always and the ventilation rate of 7·5 L/s·m
2 would provide more than 6 ACH for carparks with heights less than 3 m. These ventilation rates could work for heavily used carparks if reasonable and even mixing of the air flow and the contaminant source is achieved [
16]. This is confirmed by Chan and Chow [
17] when they investigated the CO levels at occupied zones (0.5–1.5 m) within six carparks in Hong Kong at peak hours. They reported that carparks with supply and exhaust ventilation systems have lower CO concentrations than carparks with exhaust systems only, under ventilation rates of 6 ACH during normal operation and 9 ACH during congested hours. Chan et al. [
18] reported similar results when they examined the IAQ within 52 underground carparks in Hong Kong in which 34.6% of sites exceeded WHO’s 1-h Time weighted average (TWA). Furthermore, the required ventilation rate could be affected by the adopted CO exposure limits, the cold weather and the city location at high altitudes might cause an increase from these traditional values.
The WHO recommendation for CO exposures and periods of TWA are [
3]: 100 mg/m
3 (90 ppm) for 15 min, 60 mg/m
3 (50 ppm) for 30 min, 30 mg/m
3 (25 ppm) for 1 h and 10 mg/m
3 (10 ppm) for 8 h. In Australia, the following values are enforced [
9]: 100 ppm never to be exceeded, 90 ppm for 15 min, 60 ppm for 1 h and 30 ppm for 8 h. According to ASHRAE [
10], CO limits of 25 ppm are accepted for 8 h exposures, 35 ppm for 1 h exposure and a maximum level of 200 ppm to be maintained within the carpark. The Egyptian code of garages recommends that, for an underground carpark, the CO concentration should not exceed 50 ppm in the normal operating conditions and 100 ppm in the extreme peak conditions. Burnett and Chan [
16] reported that carpark users perform light work when carrying objects to and from a vehicle and could be subjected to a very low health risk when exposed to 100 ppm for a duration of 15 min. These levels are unlikely to affect driving performance for the 15 min duration expected for customers to remain in a parking facility. They recommended a maximum CO limit of 200 ppm for a 15-min exposure for carparks within Hong Kong city [
16]. However, concentration of 200 ppm could be permitted for 1 h if it is permitted locally at the ceiling level according to NIOSH/OSHA and the French standard [
7]. An agreement on the exposure limits is not available unanimously among the key regulation authorities. Therefore, setting the acceptable CO exposure limits needs to be achieved according to a given country local environmental conditions, location altitude and car fleet profile.
Researchers have been working on simulating carpark ventilation systems using different approaches to study the CO concentration based on the related local requirements. These approaches were either field measurements or computational fluid dynamics (CFD) taking into consideration different factors, such as car types and carpark geometries [
19]. Fire studies within carparks, on the other hand, have focused on smoke visibility and the time needed to extract smoke from the carpark [
9].
Field measurements of pollutants within carparks have attracted high attention around the world. El Fadel et al. [
20,
21] assessed the IAQ of underground carparks within Beirut. They showed that the highest concentrations of CO were observed around 4:00 p.m., which corresponds to the evening peak hour when employees were leaving at the end of the working day and most vehicles were running from a cold start. The peak concentration of CO during that period reached 0.14 g/m
3 at a ventilation rate of 1.5 ACH. Chaloulakou et al. [
22] surveyed underground carparks in Athens and showed that CO levels could vary depending on location, time and day of measurements. They reported that garage employees at indoor sites were exposed to CO concentrations in excess of those permitted by the long-term occupational standards. Sulaiman et al. [
23] surveyed underground carparks in Kuala Lumpur and focused their findings on how IAQ was affected by the design of the carpark, the type of ventilation system and time customers spend inside the carpark. They concluded that a mechanically ventilated carpark with multi inlets and exits and proper signage could improve the IAQ of the carpark and shorten the time needed by customers to stay inside it.
The use of CFD as simulation tool of IAQ within carparks has enhanced the design process of the related ventilation systems and provided reasonable predictions of emissions distribution within the carpark [
24]. A steady state CFD simulations of a shopping mall carpark with a capacity of 467 cars has resulted in reducing the ventilation rate by 21% while maintaining a healthy IAQ, which was reflected on savings of around 50,000 Australian dollars [
19]. Ho et al. [
25] stated that CFD simulations of multilevel underground carparks are possible and provide reasonable results with the adopted average-diffused model based on their simulation of a small underground carpark with 14 car places. In transient CFD simulations, a simulation period of 15 min was common among researchers. Sittisak et al. [
26] initialized the single floor underground carpark (188 cars capacity) with 120 ppm of CO and reported that a 4 ACH of ducted system could reduce the concentration to 28 ppm after 15 min. Similarly, Kong et al. [
6] simulated an underground carpark with 300 parking bays where CO emissions from car were allowed for 3 min before being stopped and starting ventilation fans at full capacity. They reported that 2 ACH was found to be adequate to ventilate the space when 5% of cars are running and 6 ACH was required when 40% of cars are running.
The work presented so far showed the importance of utilizing CFD software as a tool to validate the ventilation strategy of large and complicated underground carparks. The 6 ACH design ventilation rate has proven to be insufficient for some carparks, which put uncertainties on ventilation systems of underground carparks for validation purposes. Furthermore, the CO exposure limits were based on fully mixed conditions within the carpark and does not accommodate for areas with high concentration that requires jet/mixing fans to be installed. In terms of predicting CO concentration, different CFD software have produced similar results with preferences given to ANSYS Fluent for mechanical ventilation studies and to fire dynamic simulator (FDS) for ventilation with fire scenarios. However, the certain works have reported on simulating a single level of an underground carpark and no work has covered a simulation of a multilevel underground carpark. Furthermore, CO emissions from cars were assumed as an initial boundary condition for the carpark and transient CFD simulation were utilized to estimate the average CO concentration after 15 min. This approach is related to fire scenarios more than the dominant daily ventilation of the carpark when cars keep moving and emitting CO till evacuating the carpark for periods longer than 15 min and up to one hour. Cars as pollutant sources move for much of the time and their distribution depend on the routes they have to take. Other important aspects of car emissions that needs to be accommodated in CFD simulation are cold and hot start conditions and changing amounts of CO emissions as the car travelled within the carpark. For all these reasons, a need for detailed CFD simulations of multilevel underground carpark remains needed.
The current study is concerned with effects of ventilation rates, car fleet distribution and supply and exhaust louvers porosity on the IAQ of a multilevel underground carpark that serves a shopping mall in Amman, Jordan. A three dimensional CFD model has been build using Fluent of ANSYS 18.1 software and simulations of the carpark were conducted under steady state conditions [
27]. The turbulence of the air flow within the carpark was accommodated by using the shear-stress transport (SST) k-ω turbulence model due to its advantage of computing flow separation from smooth surfaces [
28]. The quality of the utilized hybrid mesh was examined, a sensitivity analysis was conducted and a validation of the CFD model was confirmed. Percentages of simulated gasoline, hybrid and electric cars were based on the survey of the Jordanian car fleet which could be extrapolated worldwide. Simulations were based on the assumption of worst case scenario where all parking levels are full and the carpark is to be emptied in one hour. The results from this study could contribute to enhancing the control strategy in place of the carpark at variable occupancy rates.
2. Materials and Methods
The CFD simulation of the multilevel underground carpark required the knowledge of the carpark structure and ventilation system. The CO emissions were based on the car fleet distribution and how cars move within the carpark. Then, the proper set of governing equations that were utilized are presented with the proper boundary conditions. The current section details these major requirements.
2.1. Investigated Carpark
The investigated shopping mall has a total area equal to 150,000 m
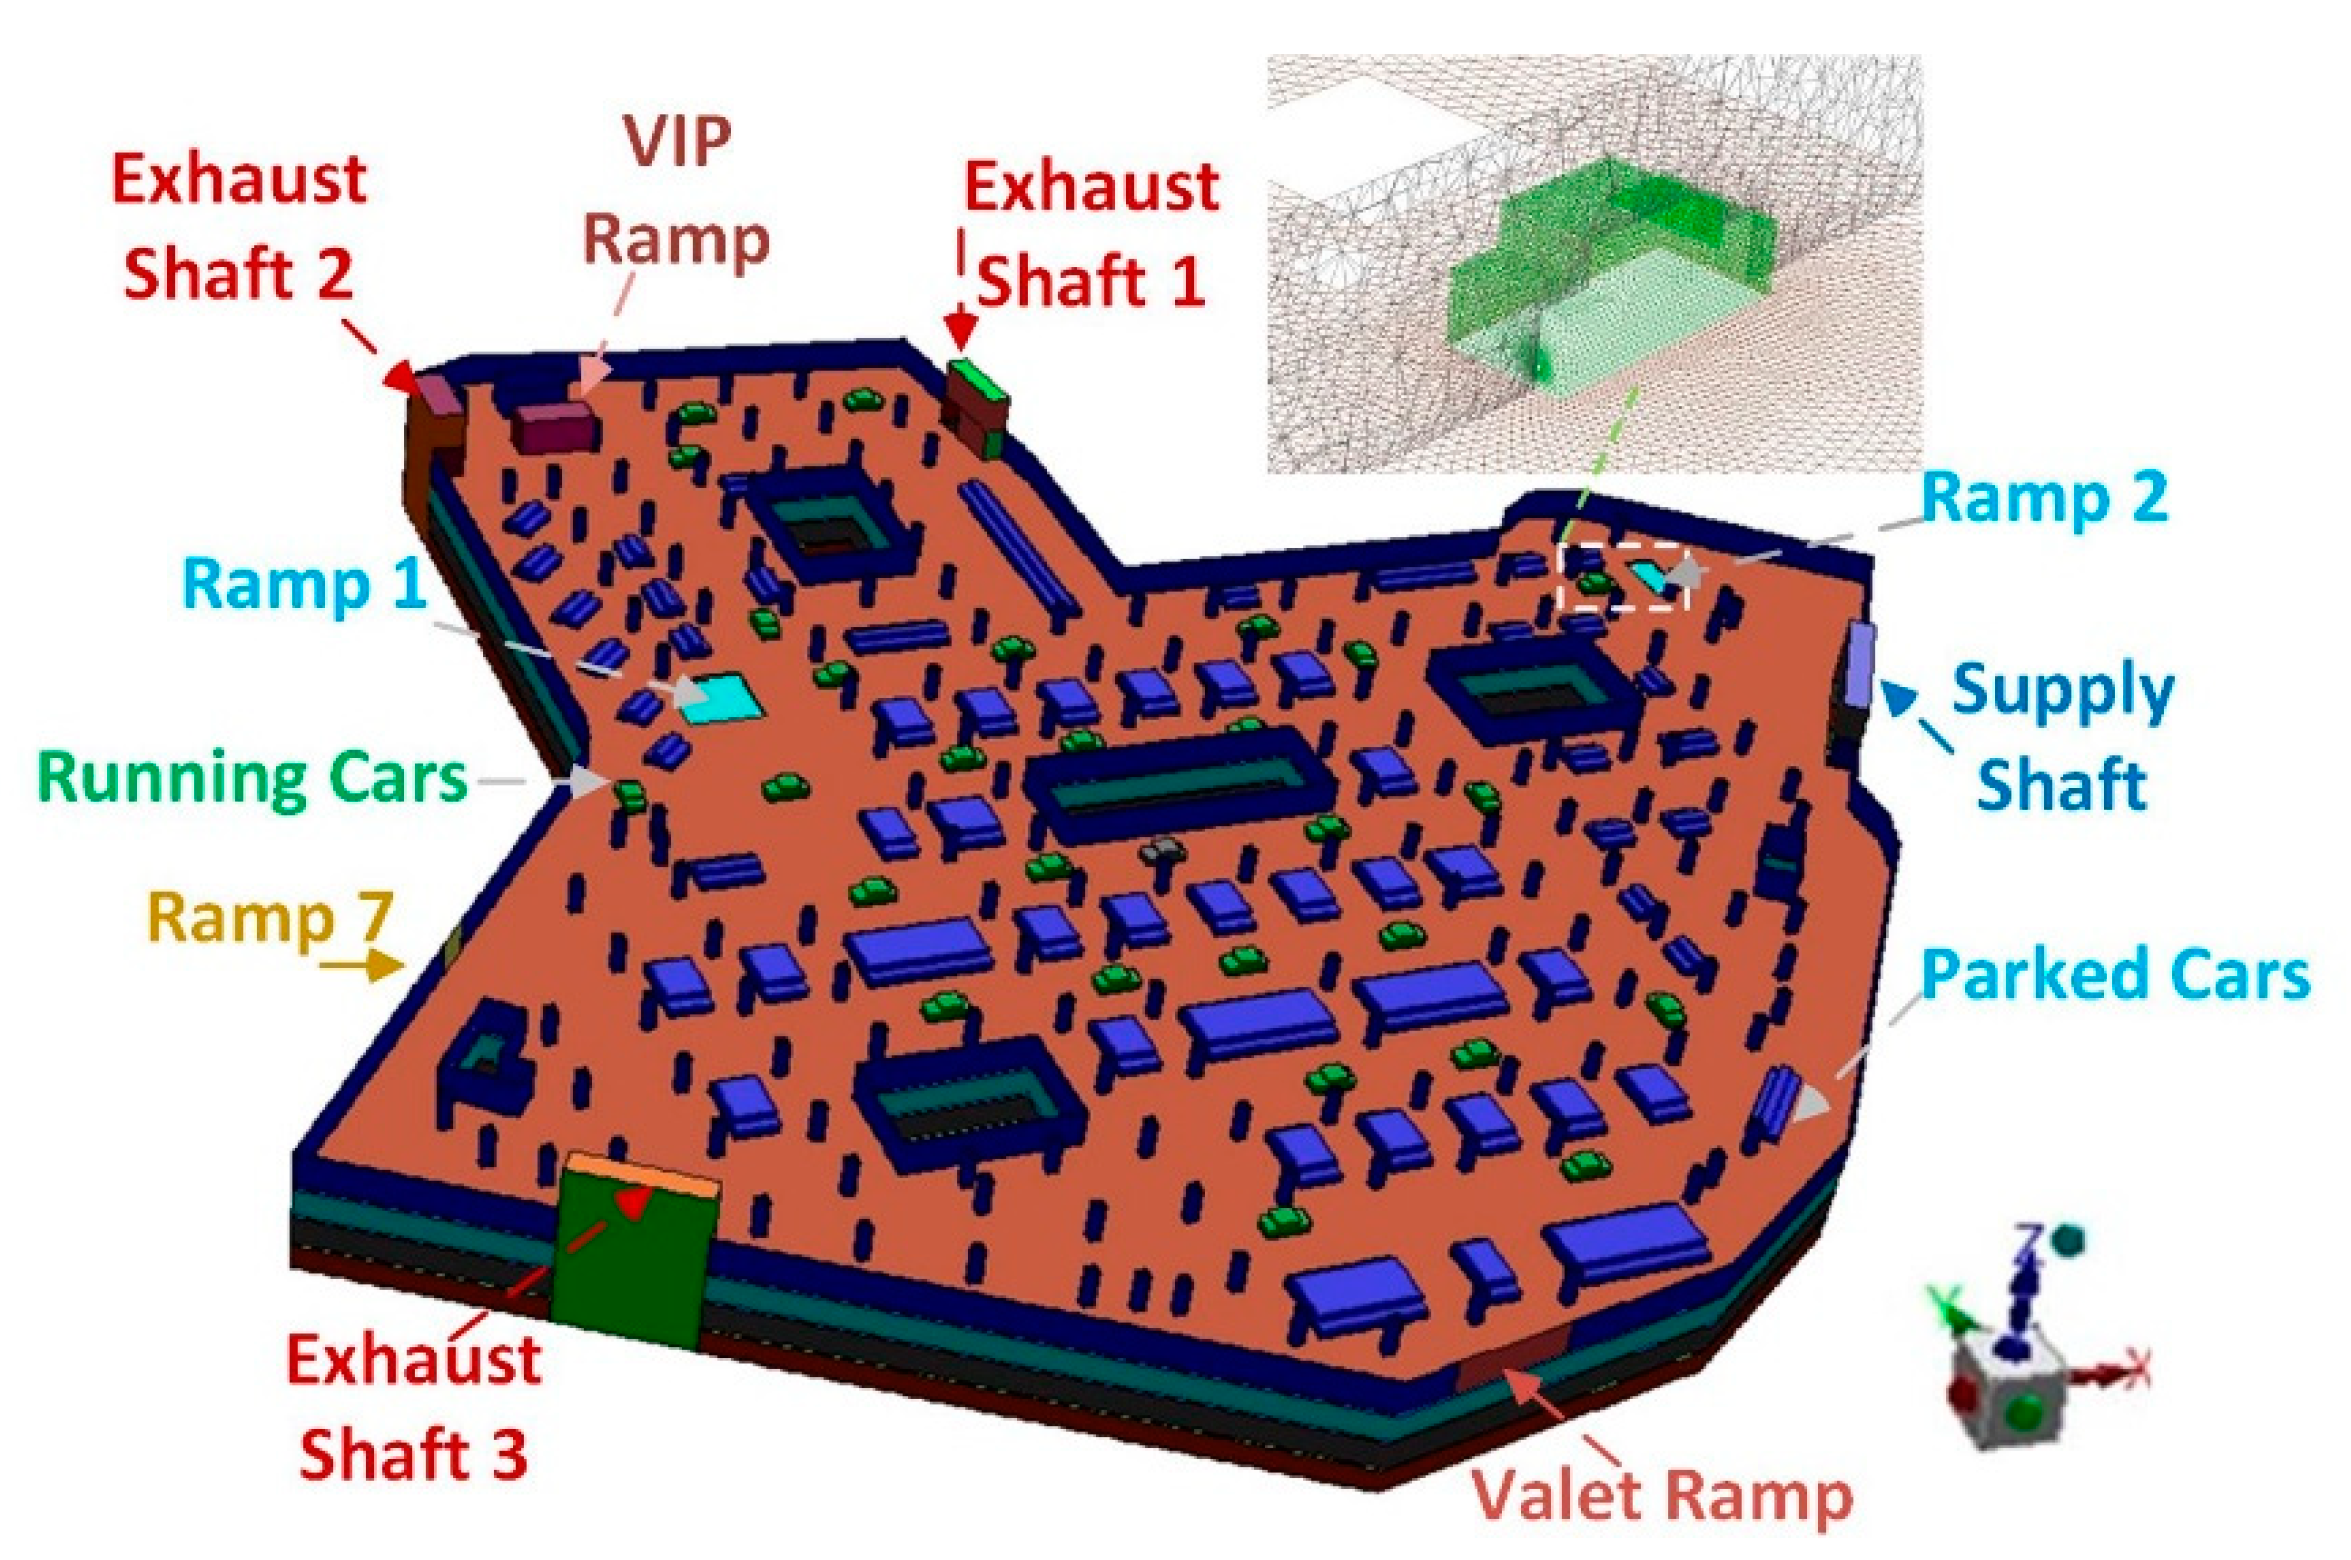
2 and is served by a multilevel underground carpark with a total capacity of 1477 car spaces as shown by
Figure 1. The first level (P1) is located at the top and the nearest to the ground level where all parking cars have to go through it to enter or to exit the carpark. Cars need to use ramps to travel downward to the second level (P2) and the third level (P3) carpark while the fourth level (P4) was converted to a karting track and does not host parking spaces. However, P4 affects the ventilation system since all levels are connected to the same supply and exhaust shafts. All parking levels are similar in design with P1 having the least parking areas due to the existence of carpark entrances and exits within it. P1 with a height of 3.3 m and an air volume of 42,000 m
3 was designed to accommodate up to 346 cars. P2, P3 and P4 with a height of 2.7 m and an air volume of 43,000 m
3 and could accommodate up to 377 cars, each. P2, P3 and P4 have 2 ramps that connect each parking level to the one below it (Ramp 1) or the one above it (Ramp 2). Furthermore, there are three entrances/exits at P1 on South, West and North sides of the shopping mall. VIP entrance facing the North side, Valet entrance facing the South side and Ramp 7 entrance facing the West side.
2.2. Current Ventilation System
All carpark levels are connected to one supply shaft and three exhaust shafts. Each parking level has four louvers: supply louver (18 m × 2.5 m), exhaust louvers 1 and 2 (9 m × 2.5 m) and exhaust louver 3 (12 m × 2.5 m). All louvers are designed as perforated façade that has multi-openings with the dimensions of 12 cm by 112 cm and a thickness of 15 cm. The design air flow for each parking level is 89,775 L/s (6.68 L/s·m2) which is equivalent to 7.6 ACH (3.22 L/s·m2). These design values are within the international standards requirements for normal ventilation scenarios.
The supply and exhaust fans are identical in design (Flaktwood, 160JM/40/6/6/26), each fan has a 1.6 m diameter and operates at 985 rpm and has a flow rate of 39,900 L/s. There are 9 fans connected to the supply shaft and 16 exhaust fans distributed over shafts 1 (5 fans), shaft 2 (5 fans) and shaft 3 (6 fans). Supply and exhaust fans could be operated automatically as a group or individually as needed according to the operation conditions. There are three sensors (Sontay- GS/S/SM1000) in each parking level installed at a height of 1.5 m and distributed over three locations that form three independent zones. Fans operate as a group at maximum or minimum speed according to the set point specified by the ventilation strategy based on the sensors feedback. The current carpark ventilation strategy has three operating conditions:
Naturally ventilated when the CO concentration is less than 45 ppm.
Mechanically ventilated at minimum power when the CO concentration is between 45 ppm and 50 ppm.
Mechanically ventilated at maximum power when the CO concentration is higher than the upper limit, which is 50 ppm, where the impulse fans will operate at maximum speed.
There are 136 impulse fans (Flaktwood, 31JT/3SP/RDD/TB), distributed over the four parking levels, used to circulate and mix the air flow from supply to exhaust shafts as shown by
Figure 2. The 34 jet fans in each parking level push the air into three directions to ensure the mixing and the circulation of air from the supply to the three return louvers and to reduce the concentration of the exhaust gases in the stagnant air zones. When the impulse fans operate at low speeds, it has a flow rate of 600 L/s, and when at high speed it has a flow rate of 1200 L/s.
2.3. Fleet Distribution
The Jordanian car market has plenty of car options, hybrid electrical vehicle (HEV) models are found side by side with conventional gasoline car models [
29]. Electric vehicles (EV) are becoming more common in the transportation sector in recent times and it is likely to replace internal combustion engine (ICE) vehicles in the near future [
30]. Private owned cars are the main mean of transportation in Jordan and there has been a rapid increase in the number of cars in the past few years due to the increase in population. Based on Jordanian drivers and vehicles license department [
31], there are around 1.2 million registered cars that have been categorized into four main groups based on car age and are listed in
Table 1. Furthermore, cars were categorized based on engine size and are listed in
Table 2. It was found that the average engine size of these groups was found to be around 1.8 L.
The car distribution shows that electrical and hybrid cars have entered the market around 20 years ago. This is due to the government regulations and tax incentives that increased the percentage to reach 13% of the total cars in Jordan. The average car age was found to be 16.3 years which is higher than the average car age within the European Union of 10.5 years [
32].
2.4. CO Emissions
Emission standards define the threshold values according to a specific test procedure and apply for new vehicles. However, real world vehicle emissions differ strongly from values given in the vehicle-emission standards. The influence of continual fleet renewal and more stringent emission standards for new conventional vehicles could results in reducing CO emissions by the year 2030 to 0.4 g/km instead of its current 1 g/km [
33]. Worldwide emission standards for Europe, Japan and the USA dominate car emission legislations. The European Commission emission standards have been implemented in Europe, in many countries of Asia and in a few countries in South America, Africa and the Arabic countries. A different regulation exists in North America, which is also in use in Central America, some countries in South America, as well as in South Korea.
Hybrid electric vehicles (HEVs) that combine internal combustion engines with battery power that don’t have plug-in capability reduce vehicle lifetime emissions by 25-35% compared to conventional internal combustion vehicles [
34,
35,
36,
37]. In Canada, the Honda Civic Hybrid, for instance, emits 31%, less CO
2 than the conventional Civic [
38]. In Jordan, the lowest CO
2 emissions (lowest) was for the Toyota Prius (111 g/km), the highest was for the conventional Toyota Highlander (292 g/km) [
29]. Similar conclusions were reported by O’Driscoll et al. [
39] for the European market. They surveyed a sample of 149 cars that represented around 56% of European cars for CO
2 and NO
x emissions. The 149 cars consisted of diesel, gasoline and hybrid passenger cars under both Euro 5 and Euro 6 emission standards. They reported that diesel vehicles outperformed gasoline vehicles by 13–66% in CO
2 emissions with emissions of 170.2 g/km for diesel and 210.5 g/km for gasoline under urban driving conditions. Hybrid cars were found to emit 117.4 g/km of CO
2, which resulted in 45% reduction in CO
2 emissions when compared with gasoline vehicles. Moreover, it is estimated that compact, mid-size, mid-size sport utility, and SUV hybrid cars emits less CO
2 than conventional cars by 10%, 15%, 19%, and 21% and fuel savings of 21%, 25%, 31%, and 32%, respectively [
32]. The use of HEV is meant to reduce emissions and to increase energy efficiency when compared with conventional cars. Huang et al. [
40] reported that HEVs could save up to 49% in fuel when compared to conventional cars. However, they demonstrated that HEVs produced higher CO emissions when compared to conventional cars under driving tests due to their stop and restart mechanism. Therefore, adopting HEV could lead to higher CO emissions under certain driver behavior or actual driving conditions [
41,
42].
Battery electric vehicles (BEVs) are superior to plugged hybrid electric vehicles (PHEVs) in terms of environmental performance. The findings may not be warranted when the vehicle cycle is counted, since a larger battery is necessary to be produced for BEVs than a class-equivalent PHEV to overcome the range limitation [
43]. In China, approximately 70% of the total gasoline replacement and 80% of the total CO
2 emissions reduction were contributed to BEVs [
44]. Reductions of 85% in air pollutants could be achieved were EVs charged with 80% renewable electricity or the electricity generated from the best available technologies of coal-fired power plants, which are futuristic power generation scenarios [
45,
46,
47].
Motor vehicle emissions are affected by various factors: the type of vehicle and its age, the fuel used, how well maintained the vehicle is, how and where it is driven where better roads and less ‘stop–start’ driving reduces emissions. CO emissions from ICE cars are well documented by the Permanent International Association of Road Congresses (PIARC) [
33] and are listed in
Table 3:
As can been from the above survey, there is no clear agreement on the amount of car emissions from hybrid cars. This was due to different engine sizes, fuel types and driving conditions. However, an emission reduction based on engine size would be the most appropriate approach. The reductions in CO emissions values of 10% for engine sizes less than 2L and 15% for engine sizes bigger than 2L were adopted for hybrid cars as listed in
Table 4.
2.5. Car Movement
Running cars are the main factor affecting the ventilation system in underground carparks and their numbers depend on the facility served which could reach 3%-5% of provided parking spaces for shopping malls [
7]. However, there are many other factors that should be taken into consideration when designing the carpark such as: Design of the carpark and geometrical dimensions, turn-over rate, number of entrances and exits, geometrical designs at entrances and exits, payment method (automatic pay stations or payment at exit) and mechanical ventilation facilities [
12].
The regulations in Jordan, as in many other countries, require that the carpark needs to be evacuated from cars within one hour. This is translated into one car leaving the current carpark from each exit every 10 s. Based on a maximum car speed of 6 km/h, the distance travelled by each car should be estimated. Therefore, the time required by each car to exit the carpark need to estimated which lead to knowing the total number of running cars within the carpark. The estimated time required to exit the carpark was divided into four categories. Based on these categories, the total time for a car to leave the carpark was estimated and summarized in
Table 5 and
Table 6.
- Category (A)
Time required to start engine, reversing and ready to move. This value was assumed to be 10 s.
- Category (B)
Time required for the car to travel from its parking location to the nearest exit or Ramp.
- Category (C)
Time spend on each Ramp that connecting two parking levels. This value was assumed to be 5 s for cars moving from P3 towards P2. An extra 5 s delay for all the cars moving from P2 to P1 to account for additional traffic as P3 and P2 cars use the same ramp to reach P1 before exiting the carpark.
- Category (D)
Time required to exit the carpark into the main street. This value was assumed to be 20 s. At P1, there are three exits open for cars and it was assumed that cars from P3 exited from VIP exist, cars from P2 exited from Ramp 7 and cars from P1 exited from Valet exit.
These calculations were iterated for all the cars within all parking levels with a 10 s delay between each car until the car flow reached a steady state of 49 running cars. This is equivalent to 4.55% of the simulated 1100 parking cars within P1, P2, and P3. A car distribution of 20 cars in P3, 20 cars in P2 and 9 cars in P1 as listed in
Table 6. If time is taken into consideration, the position of cars in minutes 2, 3 and 4 will not be in the same parking level. For P3, the second minute cars will be divided in half as there will be 3 cars still moving in P3 and 3 cars have reached P2. The same approach applied to the second minute cars in P2 as half of them will be in P1. For the third and fourth minute cars from P2 and P3, they will have reached P1. Therefore, the updated actual running cars distribution were estimated as; 9 cars within P3, 12 cars within P2 and 28 cars within P1.
2.6. Governing Equations
The current carpark was modelled using ANSYS FLUENT 18.1 software [
27]. A three-dimensional CFD pressure based solver, steady-state model of the carpark was developed. The volumetric species transport model was adopted to describe the CO emissions from cars and dry air with the inclusion of diffusion energy source options. The governing equations of all fluid flow, including scalar quantities and pollutant concentrations, could be expressed in the general conservation form of the transport equation [
27]. Species conservation equation for air and CO within ANSYS are based on evaluating local mass fractions of each species (Yi) for the ith species as defined by Equation (3). The effect of buoyancy were fully included within the current simulations.
where
ρ is the air density,
is the velocity vector,
is a scalar quantity for velocity, energy, species and turbulence parameters,
is the diffusion coefficient and
is a source term. The mechanical energy E and the enthalpy of mixed air h are needed to solve thermal behavior of air in addition to the air temperature T and the effective thermal conductivity k
eff. The other parameters needed for species behavior were: J
i is the diffusion flux of species i and
is the deviatoric stress tensor and Y
i is the local mass fraction of each species.
The air or CO diffusion flux under turbulent flow was defined according to Equation (4) and Equation (5), respectively. The utilized parameters were: turbulent Schmidt number (Sc
t), turbulent viscosity (
µt), turbulent diffusivity (D
t) and the diffusion coefficient for CO into air (D
i,ma) [
13] as an ideal gas behavior:
Simulating turbulence within carparks is traditionally achieved with the standard k-ε turbulence model with the standard wall function [
13] or the re-normalized (RNG) k–ε model [
48]. However, the shear-stress transport (SST) k-ω model was adopted in the current due to its advantage of computing flow separation from smooth surfaces [
28,
49],
where G
k is the turbulence kinetic energy generation due to gradients in mean velocity, G
ω represents
ω generation, the effective diffusivity of k and
ω are represented by Γ
k and Γ
ω, respectively, and D
ω represents the cross-species diffusion term. The default constants values of the model were kept unchanged.
The porosity of the perforated façade of supply and exhaust shafts and the corresponding pressure drop (Δp) was estimated based on Darcy law. The pressure-jump coefficient (C) and the thickness of the façade (Δt = 0.15 m) are provided values whereas the velocity normal to the porous face (v) is calculated by the software:
The concentration of CO within carpark (C
s) could be estimated theoretically under certain conditions: zero concentration of ambient CO, constant density of air and at mass averaged values of fully mixed air [
50]. The rate at which air enters or leaves the space (
) in L/s was based on the supply air flow rate and the rate of contaminant generation within the space (
) in L/s was based on the total CO emissions from running cars within the carpark. Furthermore, the CO ventilation efficiency (
β) was defined as a ratio of mass averaged CO concentration at exhaust shafts (CO
ex) to volume averaged of CO concentration within the carpark (CO
cp) [
17]:
Throughout the current study, the CO concentration in part per million (ppm) was estimated based on Equation (12) based on ambient air temperature (T) in Kelvin, Pressure (p) in mmHg, density (
ρ) in kg/m
3, and mass fraction of CO (Y
co) in kg/kg:
2.7. Boundary Conditions
The actual geometry of the carpark shown by
Figure 1 was simplified to accommodate the limitation of the current simulation and shown by
Figure 3. Moving cars were displayed in green color and as a single car whereas parked cars were displayed in blue color. The parked cars were combined together as one block as the small spaces between them would make it very difficult to generate a proper mesh of the carpark. For simplicity, the geometry of a car was modelled as two rectangular blocks on top of one another. The lower rectangular block dimensions were 4 m by 1.8 m by 1 m represents the lower part of the vehicle. The upper rectangular block dimensions were 2 m by 1.8 m by 0.6 m which represents the upper part of the vehicle. A squared exhaust was attached to the car with edge length of 7 cm.
The utilized boundary and initial conditions were based on internationally reported values and based on the estimations resulted from the Jordanian car fleet listed in
Table 1 to
Table 4. It has been documented that global background concentrations of CO range between 0.06 mg/m
3 and 0.14 mg/m
3 (5–12 ppm) [
3,
51] with typical values of CO concentration are between 1 to 5 ppm [
33]. The ambient conditions in the current study were CO concentration of 0 ppm at 27 °C at 1 atm.
The supply shaft inlet boundary was modelled as a mass flow inlet of a design value of 431 kg/s (359 m3/s) which forces the air velocity and pressure to meet the required flow rates. The exhaust shafts exit boundaries were modelled as mass flow outlet with exits 1 and 2 having same flow rates 135 kg/s (112 m3/s) and exit 3 has a different value of 161 kg/s (135 m3/s). Furthermore, the three exits at P1 of the carpark were modelled as pressure outlet boundary with ambient conditions values as inputs in case of a reverse flow through these boundaries. The turbulence intensity of 5% and hydraulic diameter of 0.8 m was adopted for turbulence calculations.
Cars were simulated as non-moving objects with their bodies modelled as no slip wall boundary. The car exhaust was modelled as velocity inlet boundary at 60 °C and 4.9 m/s with a given CO mass fraction. For the resulted average engine size of 1.8 L running at 1600 rpm, half the engine capacity will be emitted every 2 rpm based on a four stroke engine at a speed of 4.9 m/s from an exhaust diameter of 7 cm. Using the weighted average method for estimating CO emissions produced by the Jordanian cars fleet, results showed that the cars emitted 17.24 g/min of CO at the cold start (first minute) and 5.07 g/min of CO when it‘s moving at 6 km/h (2nd minute and above). These value could be presented as CO mass fraction of 0.0111 kg/kg at the first minute, 0.0033 kg/kg at the 2nd minute, 11,483 ppm at the first minute, 3416 ppm at the second minute and 0.287 L/s at the 1st minute and 0.085 L/s at the second minute. The mass fraction values were changed during the study to accommodate different percentages of investigated car fleets. The turbulence intensity of 5% and hydraulic diameter of 7 cm was adopted for turbulence calculations.
The supply and exhaust louvers were not fully opened which resulted in pressure loss that needs to be considered when running the simulation. The supply and exhaust louvers were modelled as porous jump boundary with pressure jump coefficient value is provided. Four simulated porosity values were 40–100% with pressure-jump coefficient values of 400-0, respectively. Moreover, the ramps that connect P1 with P2, P2 with P3 and P3 with P4 were modelled as interior surfaces that allows air to flow through it and carrying with it all simulated parameters. Finally, carpark walls, floors and ceilings and cars bodies were simulated as a no slip wall boundary with adiabatic properties.
3. Results and Discussion
On a typical shopping day, mall visitors could spend up to 30 min inside the carpark and distributed as: up to 10 min driving in and out of the carpark, up to 15 min for collecting belongings and having one or two trips into the mall and back to the car to load bought items, and around 5 min for unplanned issues. Carpark employees, on the other hand, could spend up to 8 h which requires strict IAQ conditions that is based on proper ventilation. Furthermore, the conversion criteria used for the current study were: 10−3 for continuity, momentum and turbulence equations and 10−6 for energy and species (CO) equations.
3.1. Mesh Sensitivity Study
The hybrid (structured and unstructured) mesh with different element sizes was used in meshing the carpark with results shown by
Figure 4. The car body was meshed using tringles with max edge length of 10 cm and the car exhaust was meshed with tringles with max edge length of 1.5 cm and maintained fixed for all simulations. The supply and exhaust shafts were meshed with cubical mesh with max edge element length of 0.4 m. The occupied zones of the carpark were meshed with element sizes of 1.0 m, 0.6 m and 0.4 m. with total elements number of 3.7, 8.2, and 20.2 million, respectively.
The volume weighted average (VWA) values of the CO concentration for the simulated cases at four different ACH values are shown in
Figure 4. As mesh element sizes became smaller, simulation results became more accurate. The length of 0.4 m was fine enough to predict the VWA of CO when compared with the other two lengths plotted based on Equation (10). At 1.6, 2.1 and 3.3 ACH, 0.4 m case resulted in the lowest value of CO concentration in comparison with 1.0 m case resulting in the highest and least accurate value and 0.6 m case placed in between. At 1.1 ACH, 0.4 m case resulted in the highest and most accurate value with 0.6 m case showing the lowest value and least accurate value. However, a mesh with 0.6 edge length would produce a reasonable result. The critical zones within the carpark were the vicinity of CO emitted cars and the supply/exhaust shafts which were simulated at the same mesh size for the three cases of (0.4, 0.6 and 1.0 m). This has led to, relatively, small differences between the simulated three mesh sizes. A finer mesh of less than 0.4 m would increase the simulation time to a prohibiting limits which limited the current study to the minimum value of mesh edge length of 0.4 m for the air space within the carpark.
3.2. CFD Validation
The validation of the current CFD model was conducted against the perfectly mixed mathematical approach of IAQ (C
s) defined in Equation (10) and shown by
Figure 5. The presented values from the CFD simulations were: Volume weighted average (VWA) across all air volumes of the carpark and mass weighted average (MWA) and area weighted average (AWA) of the air flowing out of the exhausts shafts and carpark exits. The AWA results were higher than the C
s values with errors ranging from 4.1% to 23.5% which presents the AWA as an inaccurate approach to adopt. The second accurate approach was the VWA with errors ranging from 0.6% to 10.3% which highlights the importance of mesh generation of the carpark in relation to the source of CO generation. The most accurate results were found in the MWA with errors ranging from 0.8% to 3.4% which put it as the favorite approach to adopt in presenting the current study results.
The MWA of CO concentrations within the carpark were within the acceptable limits for the 15-min limit of 90 ppm for all the simulated ACHs. For the 30-min limit of 50 ppm, ACH must be higher than 2.7. Moreover, the 8-h limit of 25 ppm has needed a minimum of 5.3 ACH to validate a healthy IAQ which complied with the worldwide adopted 6 ACH as a ventilation requirement. Carpark employees work near carpark exits/inlets or mall entrances/exits, which expose them to fresh air most of time with CO concentrations lower than 25 ppm. Therefore, the 50 ppm limit will be considered the limiting factor for the current study. These limits are based on assumption of fully mixed air within the carpark which is not realistic unless the jet fans were in operation. Therefore, running the 34 jet fans within each level of the carpark is a must to get the full mixed air assumption.
The presented values of ACH could be based on averaged carpark value or on an individual value for each parking level as shown by
Figure 6. The ACH value at each level was different due to the variation in physical volume of each level and the air flowrate supplied to or exhausted from it. Furthermore, the number of running cars at each level is different with P1 having the highest number (28 running cars) while P3 having the lowest number (9 running cars). This would require controlling the amount of fresh air supplied to each level in order to maintain the required average CO exposure limit of 50 ppm. The average ACH required for the carpark was 2.7, which is higher than values required for P3 (1.3 ACH) and P2 (1.7 ACH) and lower than the value required for P1 (3.4 ACH). Therefore, distributing fresh supplied air equally to all levels of the carpark is not recommended and should be based on the running cars within each level rather than the parking capacity of each level.
Based on the presented results, it is clear that MWA at the exhaust shaft exits would give a reasonable and more accurate results. Therefore, the rest of the study will be based on MWA results and the AWA and VWA results will not be discussed or presented any further.
3.3. Influence of Conventional and Hybrid Cars Fleet Percentages
Effects of car fleet distribution on CO concentration within the carpark are presented in this section where the CO generation was varied as a function of the suggested fleet distribution.
Table 7 lists the simulated cases with conventional cars representing the fully gasoline engines. The percentage of the conventional cars could be interpreted in two different ways: Percentage of cars within the simulated car fleet and percentage of occupied car spaces within the carpark based on conventional cars, only. Furthermore,
Table 7 lists the CO mass fraction for the first and the minute minute corresponding to the car fleet distribution.
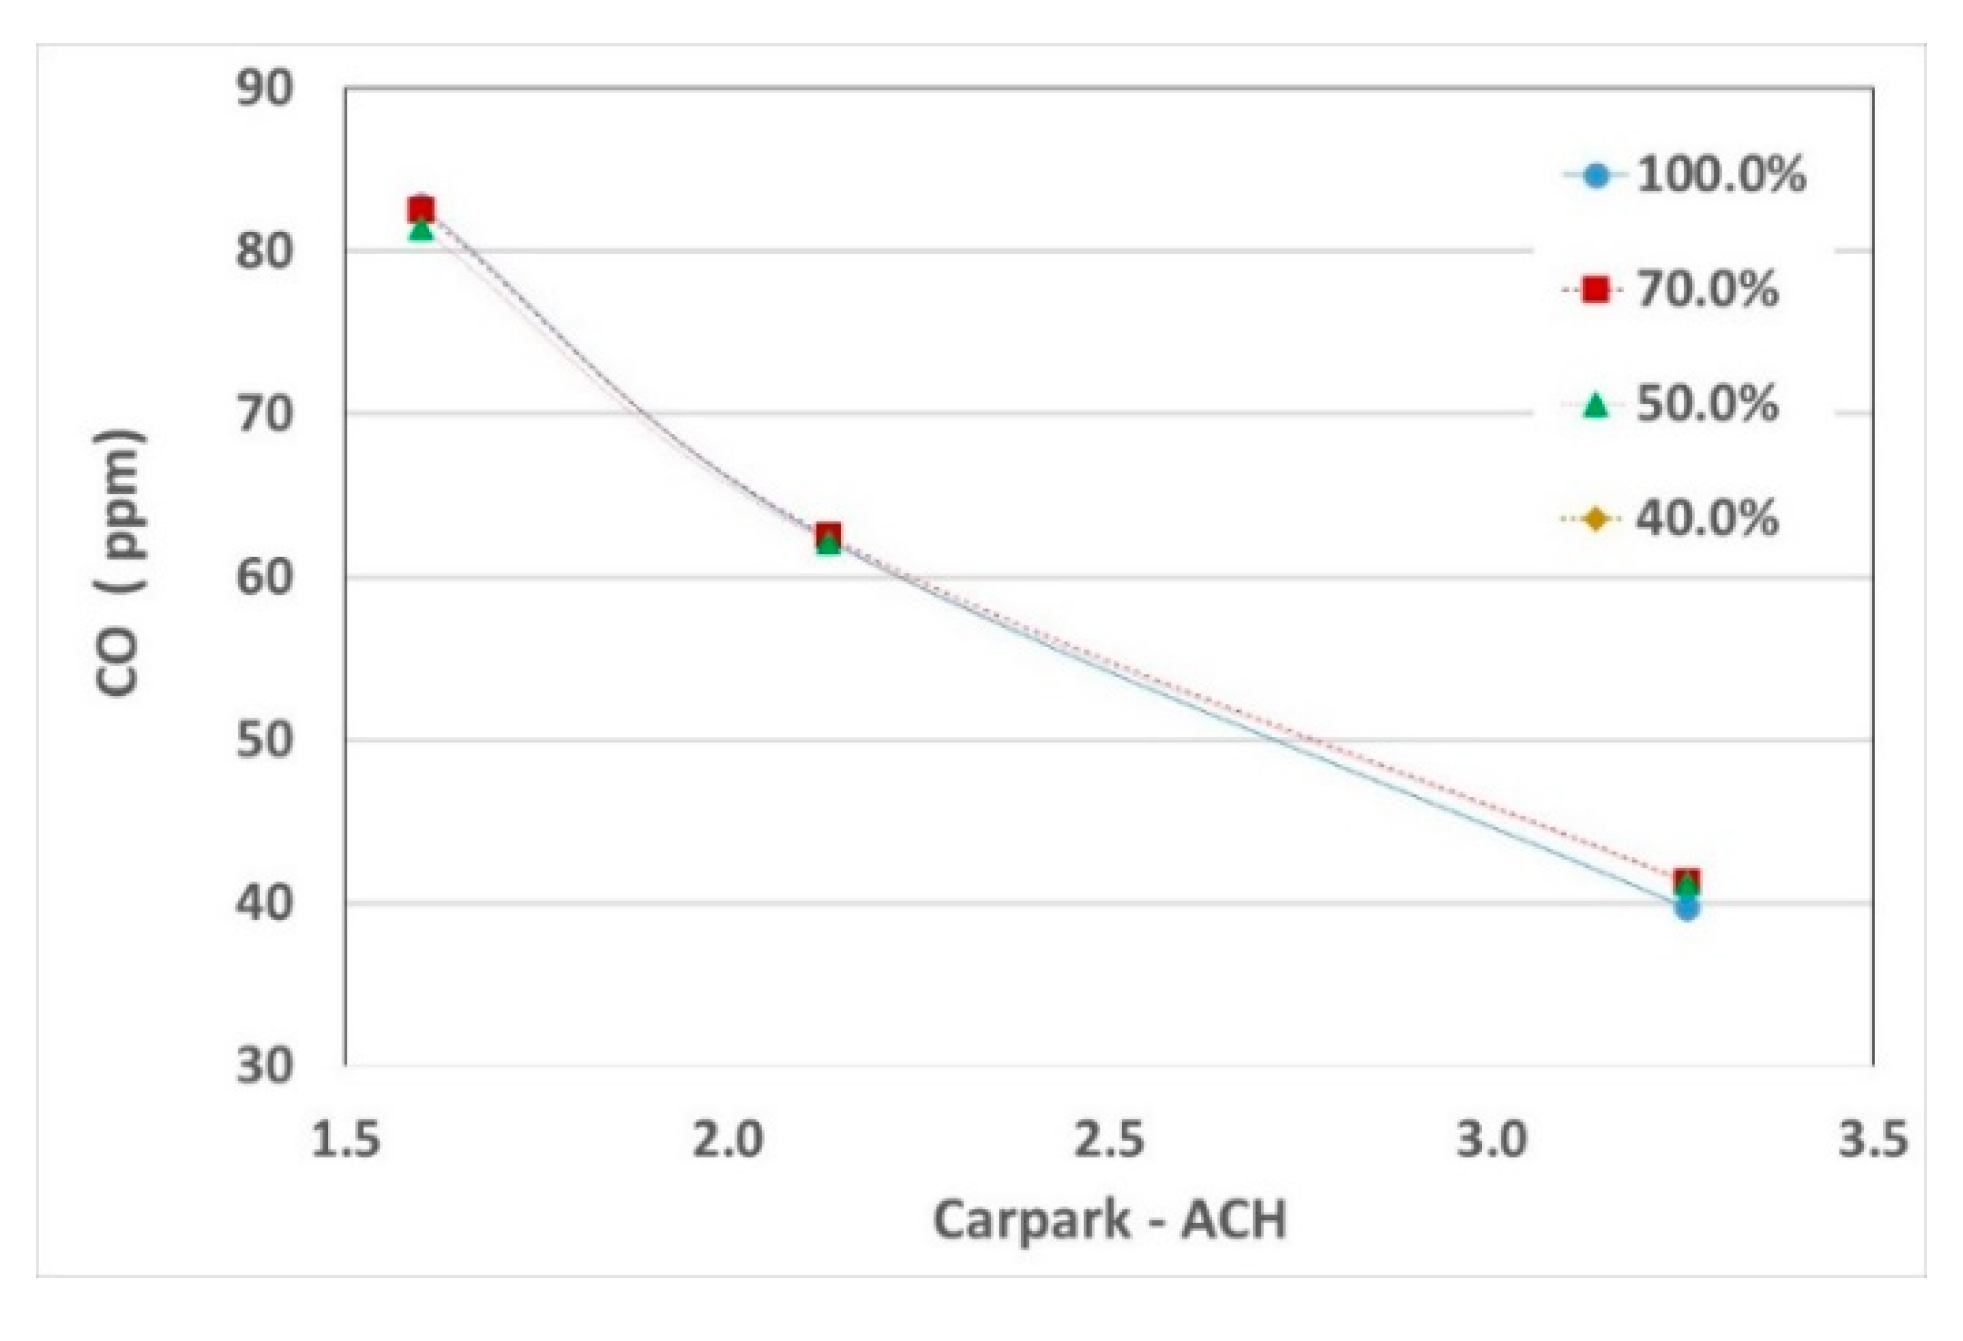
Based on Equation (10), the relation between CO concentration and the CO generation within the carpark at a constant supplied air flowrate is linear as confirmed by
Figure 7. At 3.3 ACH, the ventilation system of the carpark was capable of maintaining the CO concentration below 50 ppm for all simulated cases. At 2.1 ACH, the ventilation system was good enough for a distribution of 81% of conventional cars or conventional cars occupancy percentage. The percentage was les for 1.6 ACH and 1.1 ACH where it reached 61% and 44%, respectively. In this way, a proper ventilation strategy could be build based on the occupancy rate of the carpark as a single unit. However, this is not the case when considering each parking level as an interdependent unit within the carpark as shown by
Figure 8.
The behavior of the CO concentration within P1, P2 and P3 were different at different ACH value.
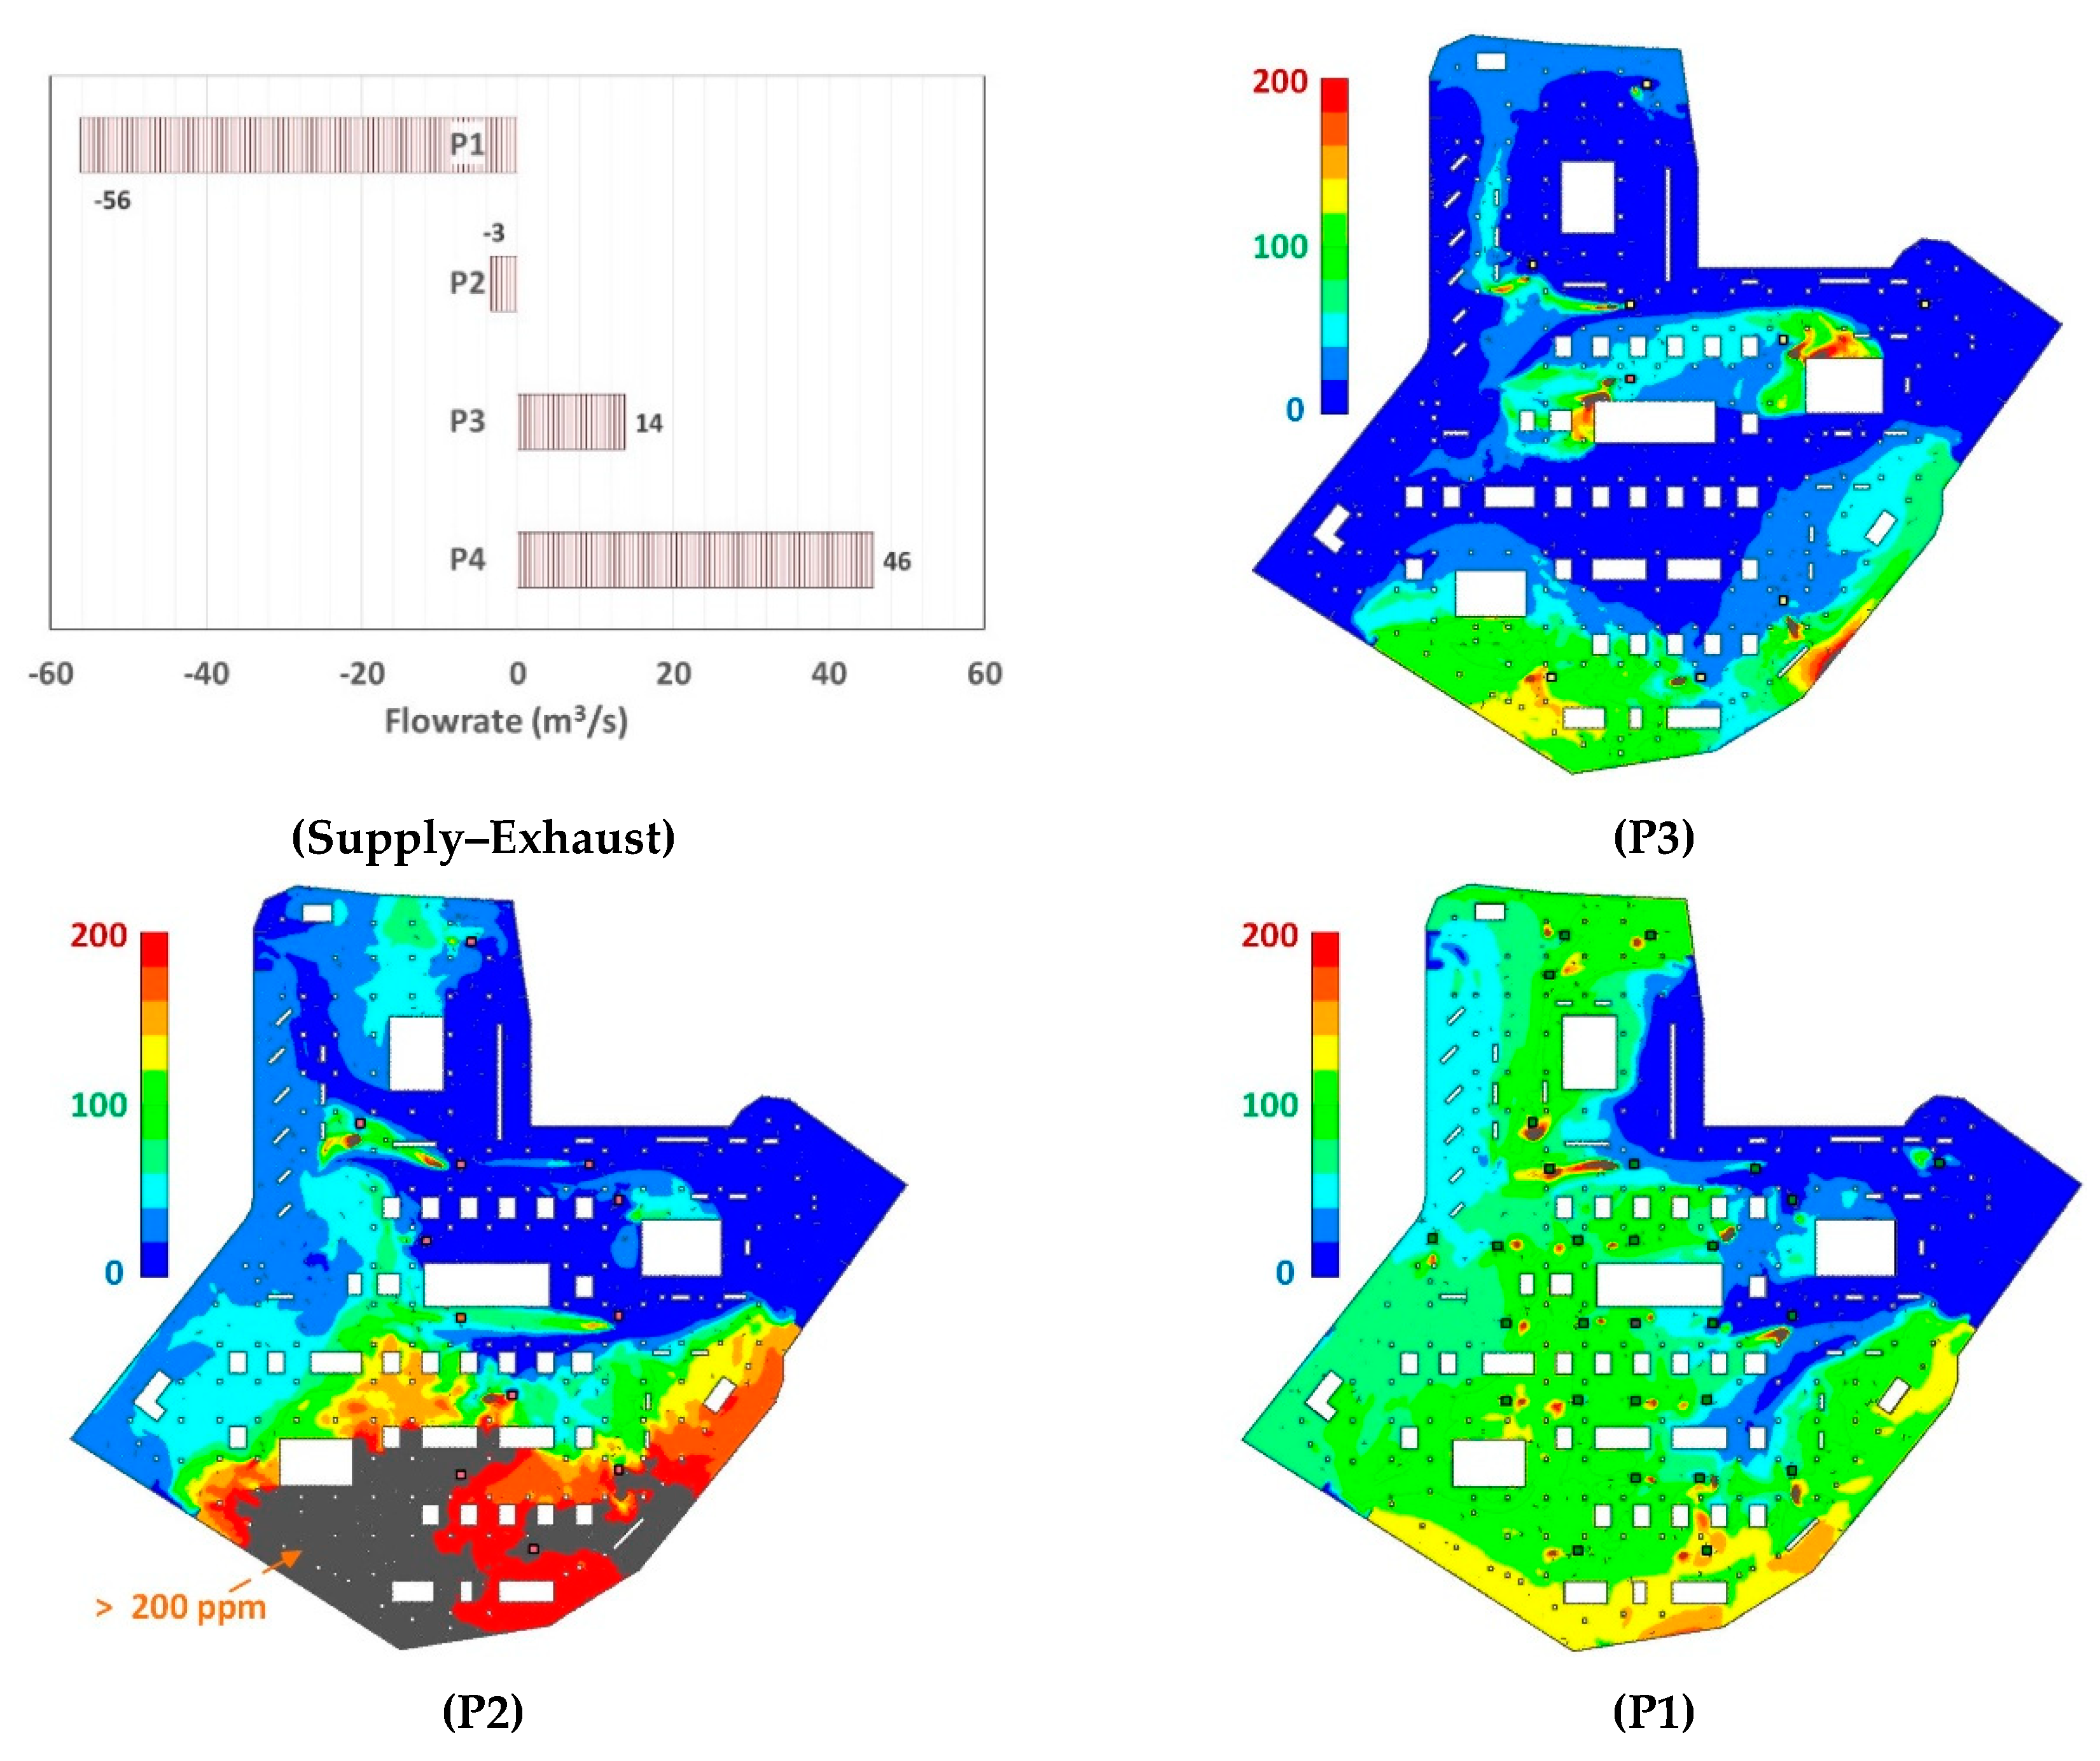
Figure 8 shows that P3 had a healthy IAQ at 3.3 ACH for all the simulated cases whereas P1 and P2 were not. The main reason for that is the number of running cars at P3 were the lowest (9 cars) and the air supplied to it from the supply shaft or P4 through Ramps was fresh. The amount of air flowing from one level to another depended on the difference between the supplied an exhausted air through that level as shown by
Figure 9.
Figure 9 shows that P3 benefited from 46 m
3/s of fresh air flew from P4 through the Ramps which made P3 a level with three supplied air inlets that lowered the CO concentration (
Ccp) throughout the level well below the 200 ppm local limit. The number of cars in P2 was 12 running cars with 14 m
3/s and 46 m
3/s of contaminated air coming through the Ramps from P3, and P4, respectively. The amount of fresh air supplied to P2 was 3 m
3/s less than the amount exhausted from the level which leaves around 56 m
3/s of contaminated air to flow through the Ramps to P1. Although the average CO values for P2 were below 80 ppm at 100% emissions, the CO contaminated air of around 20 ppm came through the Ramps to P2 caused CO to reach unacceptable local levels (200 ppm) at the lower part of the carpark. Furthermore, this result has exposed the low air velocity at the lower side of P2 level which formed a stagnant air zone and highlighted the importance of running jet fans. The upper part of the carpark is closer to the supply louver than the lower part which caused most of the fresh air to flow towards exhaust shaft 1 causing a relatively low CO concentration. Based on
Figure 8, P2 could meet the 50 ppm exposure limit when emissions/occupancy percentages were less than 60%. Similarly, P1 could meet the exposure limit at emissions of less than 75%. However, the IAQ of P1 exceeded the 90 ppm average value at emissions higher than 75% and 50% at 1.6 ACH, and 1.1 ACH, respectively.
These outcomes are not in line with the average values reported earlier for the total carpark, which showed that the current ventilation strategy would meet all simulated cases except for emission rates of higher than 80% at 1.1 ACH.
The importance of jet fans in mixing the air within the carpark and diluting the CO high concentrations into acceptable levels was evident based on obtained results and could be evaluated by the ventilation efficiency defined by Equation (11).
Figure 10a shows that efficiency increased when ACH value decreased. The lower ACH value resulted from lower flowrates and lower air velocities which enhance CO diffusion. However, there were minimal effects of emission percentages on the ventilation efficiency at low ACH values (2.6 and 1.1), which resulted in relatively constant values of 69%, and 74%, respectively. The lowest efficiency was found at 3.3 ACH due to air taking less time to reach exhaust shafts and less time for contaminated air to diffuse. There was an increase in the efficiency value as the emission percentage increased for the 3.3 ACH where it changed from 58% to 65%. The 7% increase could be related to the air flowing through the Ramps between the levels of the carpark and the amount of CO generated within the carpark. The higher CO concentration enhances the driving force for mass diffusion within the carpark and increases the ventilation efficiency. The lower the ventilation efficiency, the higher the need for a jet fan to cause better mixing and higher dilution of CO concentration.
The parking levels showed different trends of the ventilation efficiency with P1 having the highest efficiency (84%), P2 the lowest efficiency (33–42%) and P3 around 52%. P1 has one supply louver, three Ramps openings, three exits and three exhaust louvers which are well distributed across the level. This enhanced the mixing effect within the level and increased the ventilation efficiency. P2 and P3 did not have exit openings and had three additional Ramps openings with short distances in between which enhanced air to flow between levels rather than across the same level. The location of one of the Ramps close to the supply louver caused fresh air to travel through all levels towards P1, which left the other levels with plenty of contaminated air and increased the CO concentration within the level that led to lowering the ventilation efficiency. The trend of the ventilation efficiency was similar to the carpark trend as it presented the average value of the total carpark values.
3.4. Effect of Louvers’ Porosity on CO Concentration
Porosity of a louver affects the airflow rate through it which affects the air distribution within the carpark and flowrates through Ramps between levels. Car emissions were maintained at the original case that represented the Jordanian car fleet as listed in
Table 1. The CO concentration of the carpark remained, relatively, unchanged for all simulated porosities as shown by
Figure 11. The concentration increased as the ventilation air quantity decreased regardless of the porosity of the louvers. Porosity showed no significant effect on the CO concentration when considering the underground carpark as a single unit because CO generation and ventilation flowrates did not change. Furthermore, the required ACH for maintaining the 50 ppm exposure limit remained at around 2.7 ACH.
Effects of porosity could be seen when considering the individual level of the carpark, as shown by
Figure 12. The variation in air flow rates through supply/exhaust louvers at each level is noticeable at the simulated porosities and the current running conditions of the investigated carpark. The exhaust flowrate ratio represents the amount of air flowing through that louver with respect to the total flowrate from the other exhaust louvers at the same level. The supply air flowrate ratio represents the air flowing through the louver at a given level to the total supply flowrate of the carpark.
Figure 12 shows inconsistent trends of flowrate ratio at different ACH values independent of louver porosity. The design ratios for the carpark were constant for all exhaust shaft (ES) louvers at all levels (ES1 and ES2 = 31%; ES3 = 38%). The supply louvers were not constant which highlighted the important issue of air flowing through Ramps and through parking levels as shown by
Figure 13.
The supplied air flowrate ratio increased for P1 and P2 and decreased for P3 and P4 as the porosity decreased. This is due to increased air pressure in the supplied air shaft due to lower porosity of supply lovers at each level, which distributed the air uniformly at all supply louvers. Each level has three exhaust shafts with ES1 being closest to the supply shaft louver (SS) and ES-3 the furthest from the SS. The amount of air flowing through ES1 was lower than the required ratio for all levels apart from P1 where it was higher than the designed value. Air flowing via Ramp 2 from P4 to P1 preferred to exit through ES1 while air flowing via Ramp 1 preferred to exit through ES2 and ES3 as shown by
Figure 13. However, the ratio decreased for P1 and increased for P2, P3 and P4 as the porosity decreased. The balancing flowrate came through ES2 and ES3 at all levels with porosity of 40% to 50% provided the closest air flowrate to the design values. The flowrate through P1-ES3 and P2-ES3 were lower than design value while the other two louvers were higher to maintain the airflow balance for that level. The same trend was noticed at P1-ES2 and P4-ES2. Air flowing via Ramps decreased as the louvers porosity decreased with P4 being the main provider and P1 being the main receiver. Therefore, modelling a multilevel underground carpark requires closer attention to cross level interaction which could affect the CO concentration within a given level.
The mass weighted average of CO concentration of air flowing through the Ramps was affected by the louvers porosity and ACH values as shown by
Figure 14. Air flowing from P4 to P3 (R4-3) showed values close to 0 ppm at all porosities and ACH values due to the absence of running cars at this level. However, these value assisted P3 in diluting the CO concentration. The Ramp between P2 and P1 (R2-1) showed the highest sensitivity to ACH values with variation of CO concentration from 34 ppm at 3.3 ACH to 76 ppm at 1.6 ACH. The high air flowrates through R2-1 with values more than 20 m
3/s and 36 ppm could provide a contaminated air to P1. The CO concentration at the exhaust shafts decreased as the porosity decreased at 3.3 ACH for P1 and P2 while increased for P3. The increase for P3 was caused by the reduction in air flowing from P4 through the Ramps at lower porosities. Furthermore, the reduction in porosity was reflected on the uniformity of fresh air flowing through the supply louvers to each level accompanied with the reduction of contaminated air flowing through the Ramps.
The ventilation efficiency increased as the ventilation flowrate decreased for the carpark at all porosities as shown by
Figure 15. At 6 ACH, the efficiency reached around 90% at a louver porosity of 70% and decreased at higher and lower porosity values. At higher ACH values, the highest efficiency values were shifted toward lower porosity values because of air flowing across the same level and via Ramps from one level to another. The contaminated air caused the high concentration of CO to get into upper levels which increased the efficiency value. At 3.3 ACH, P1 and P2 had the highest value of efficiency at a porosity of 50% whereas P3 had the lowest value. The short circuit of air flowing through Ramp 2 near the supply shaft of P4 to P3 and P2 showed the steep trend of the efficiency curve. As a result, modelling carpark Ramps accurately and significantly affects the CO concentration within each level of the carpark.


