Condensation of an Azeotropic Mixture inside 2.5 mm ID Minitubes


Abstract
1. Introduction
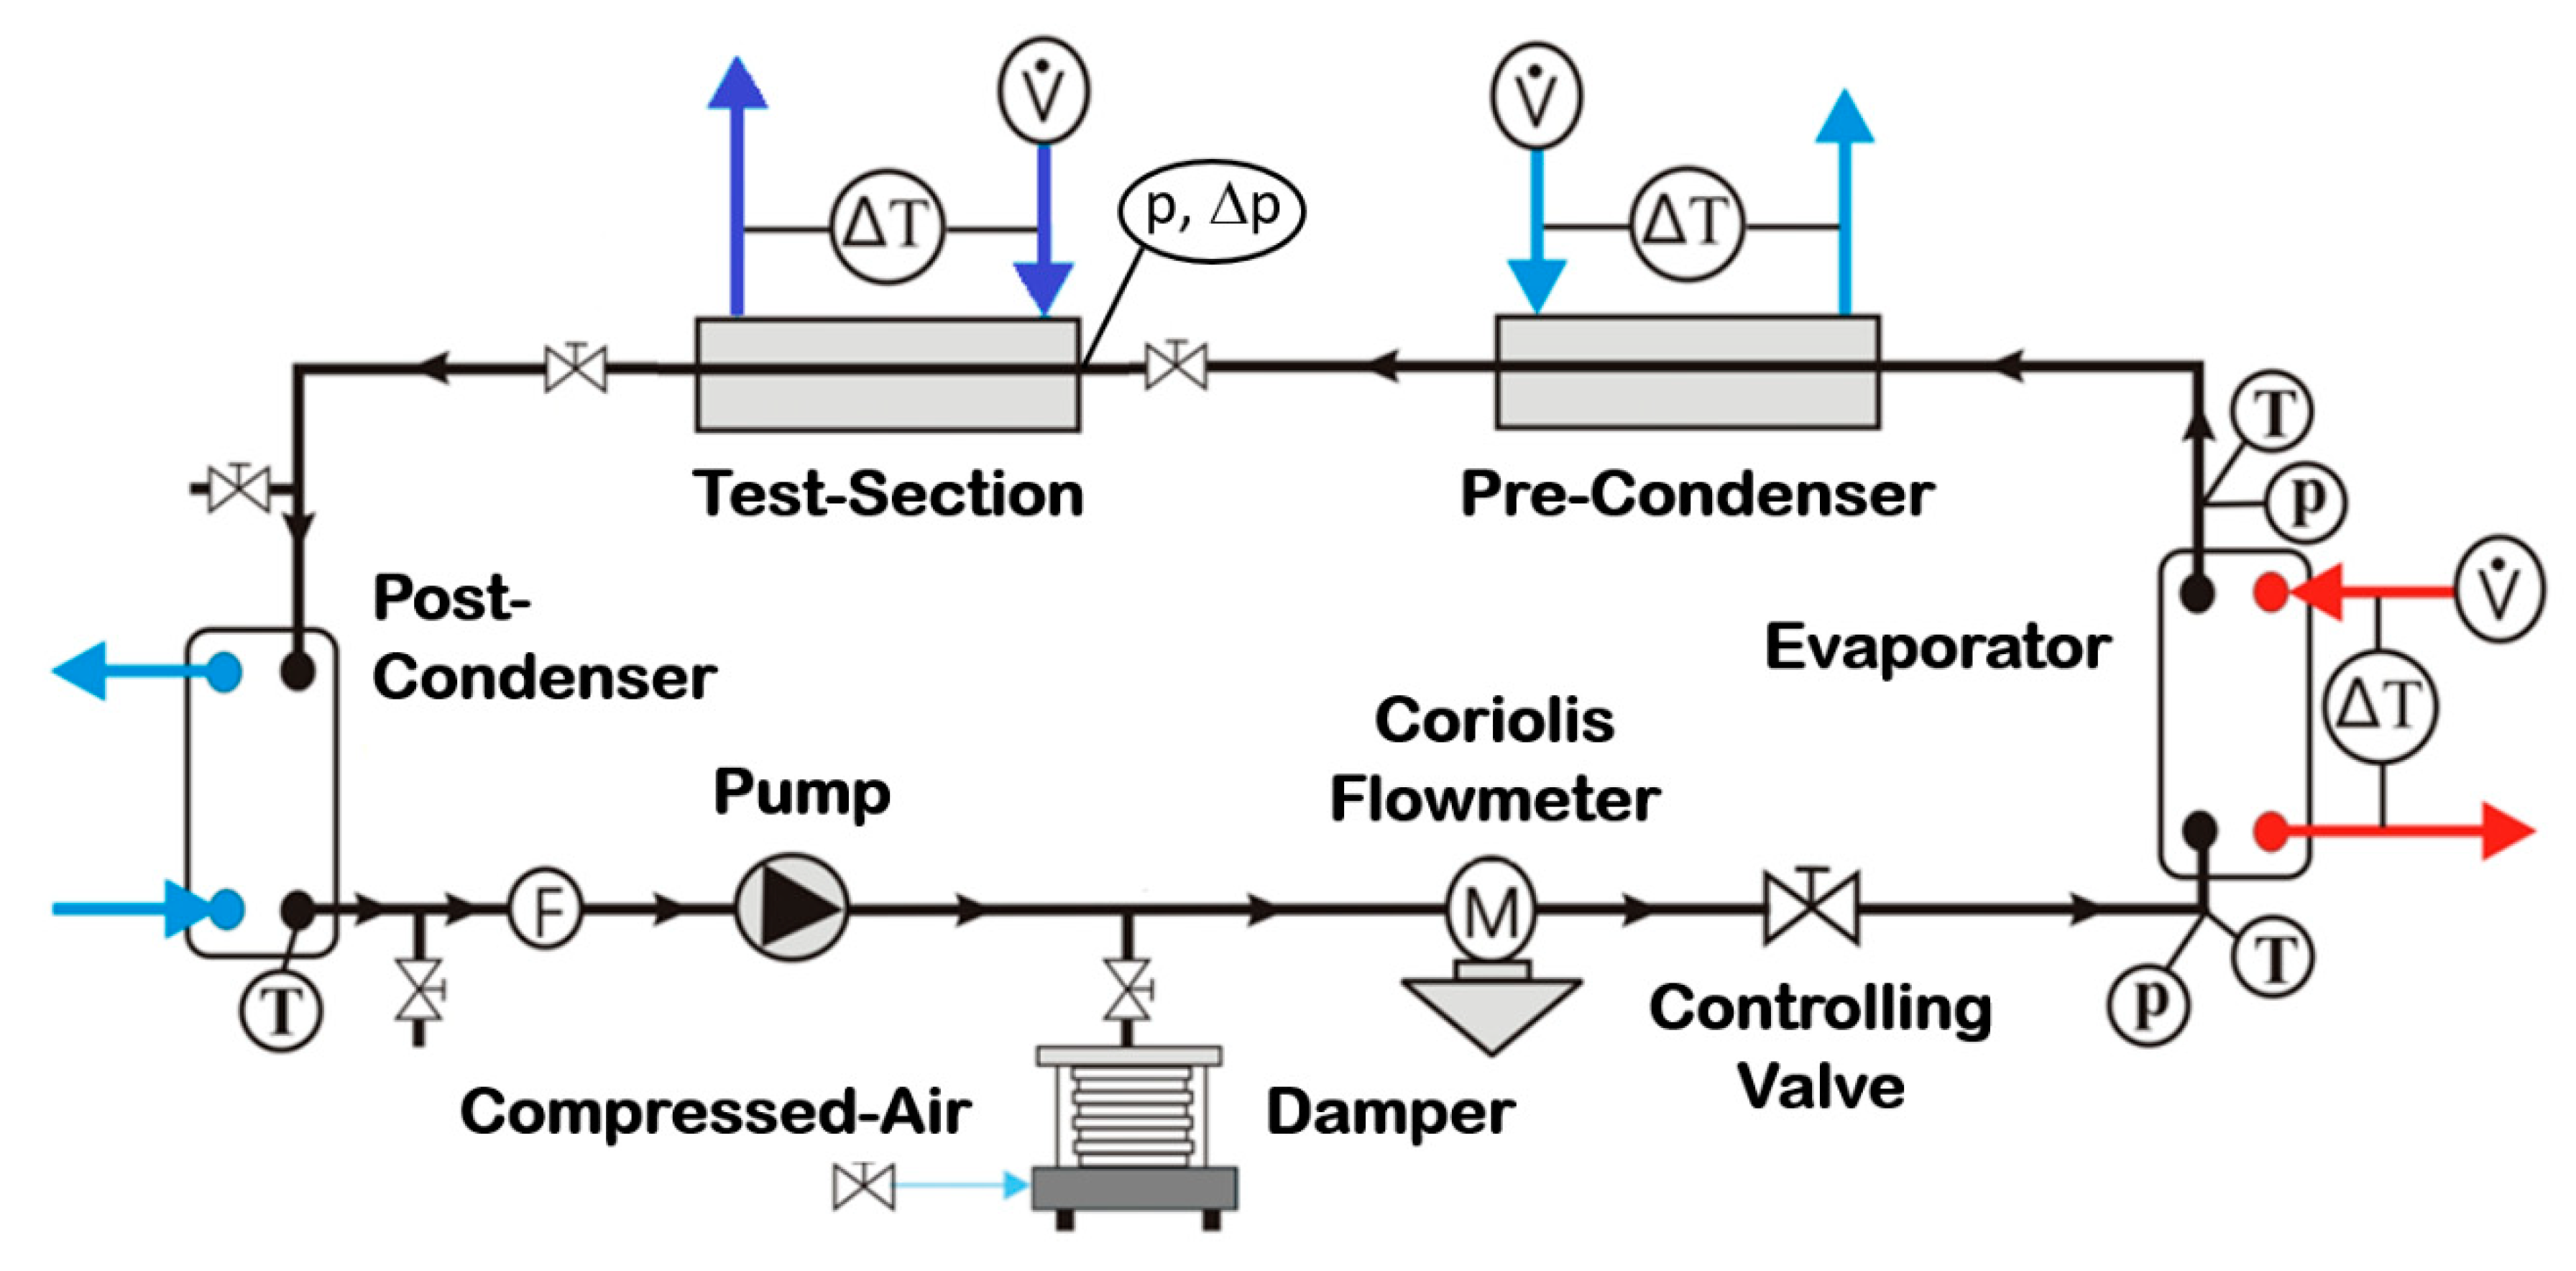
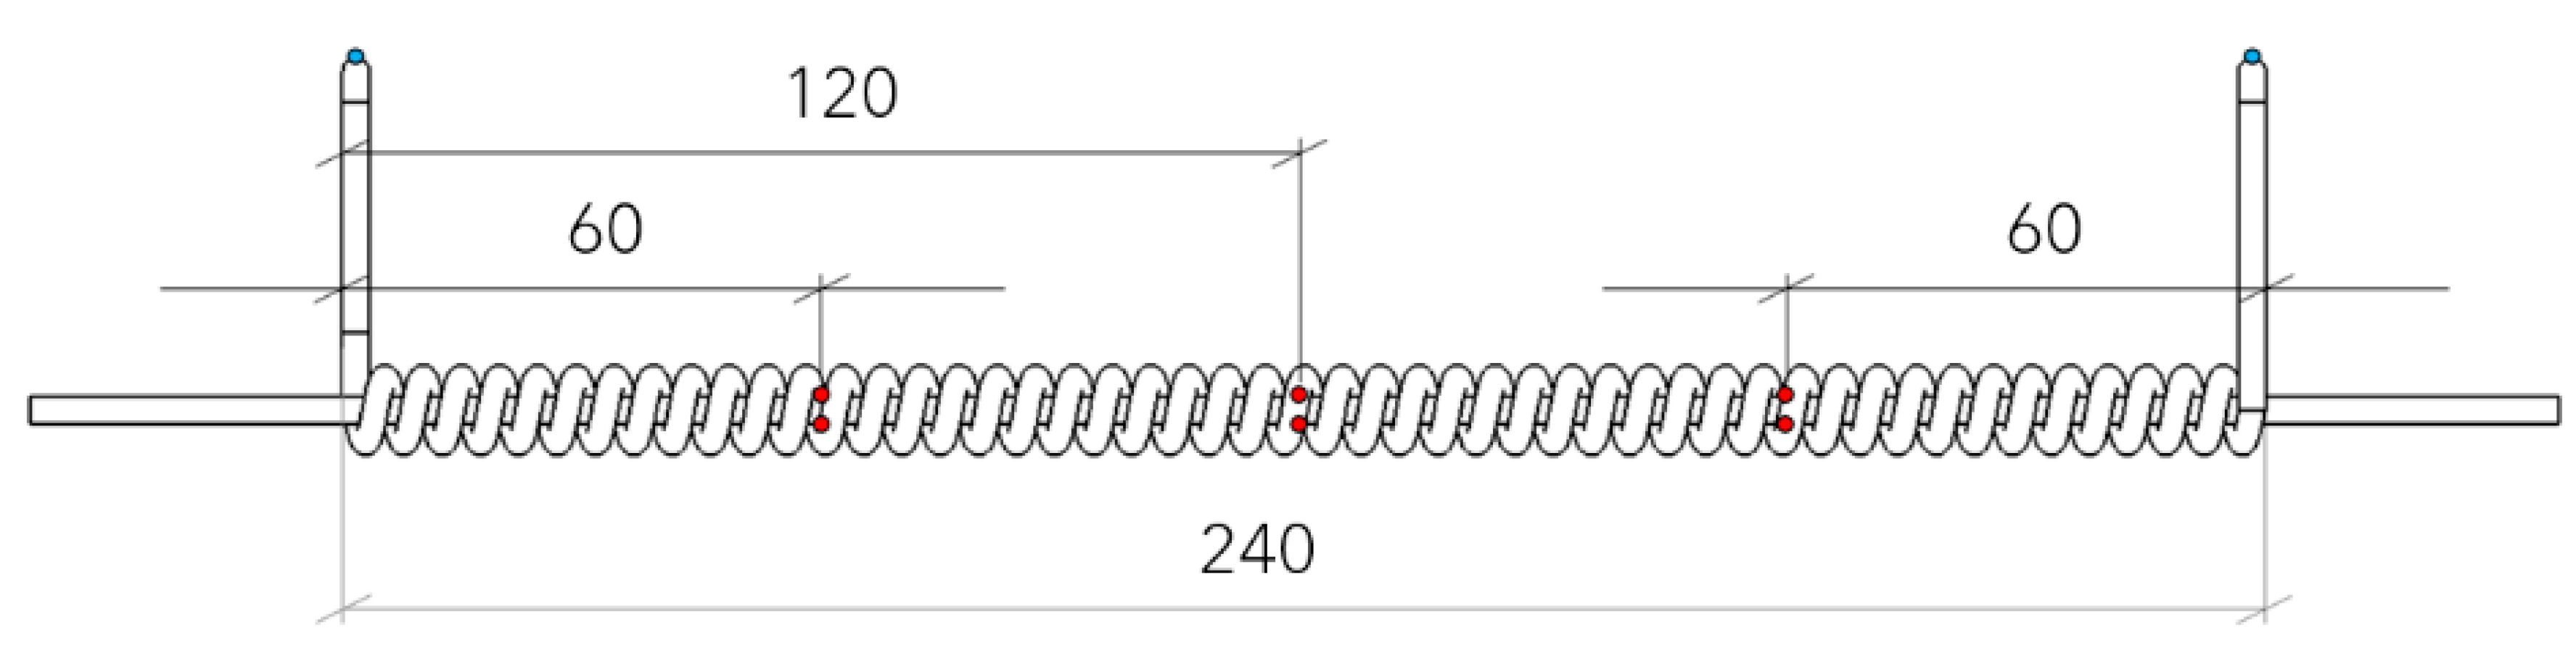
2. Experimental Facility and Test Sections
3. Data Analysis
4. Experimental Results
4.1. Smooth Tube
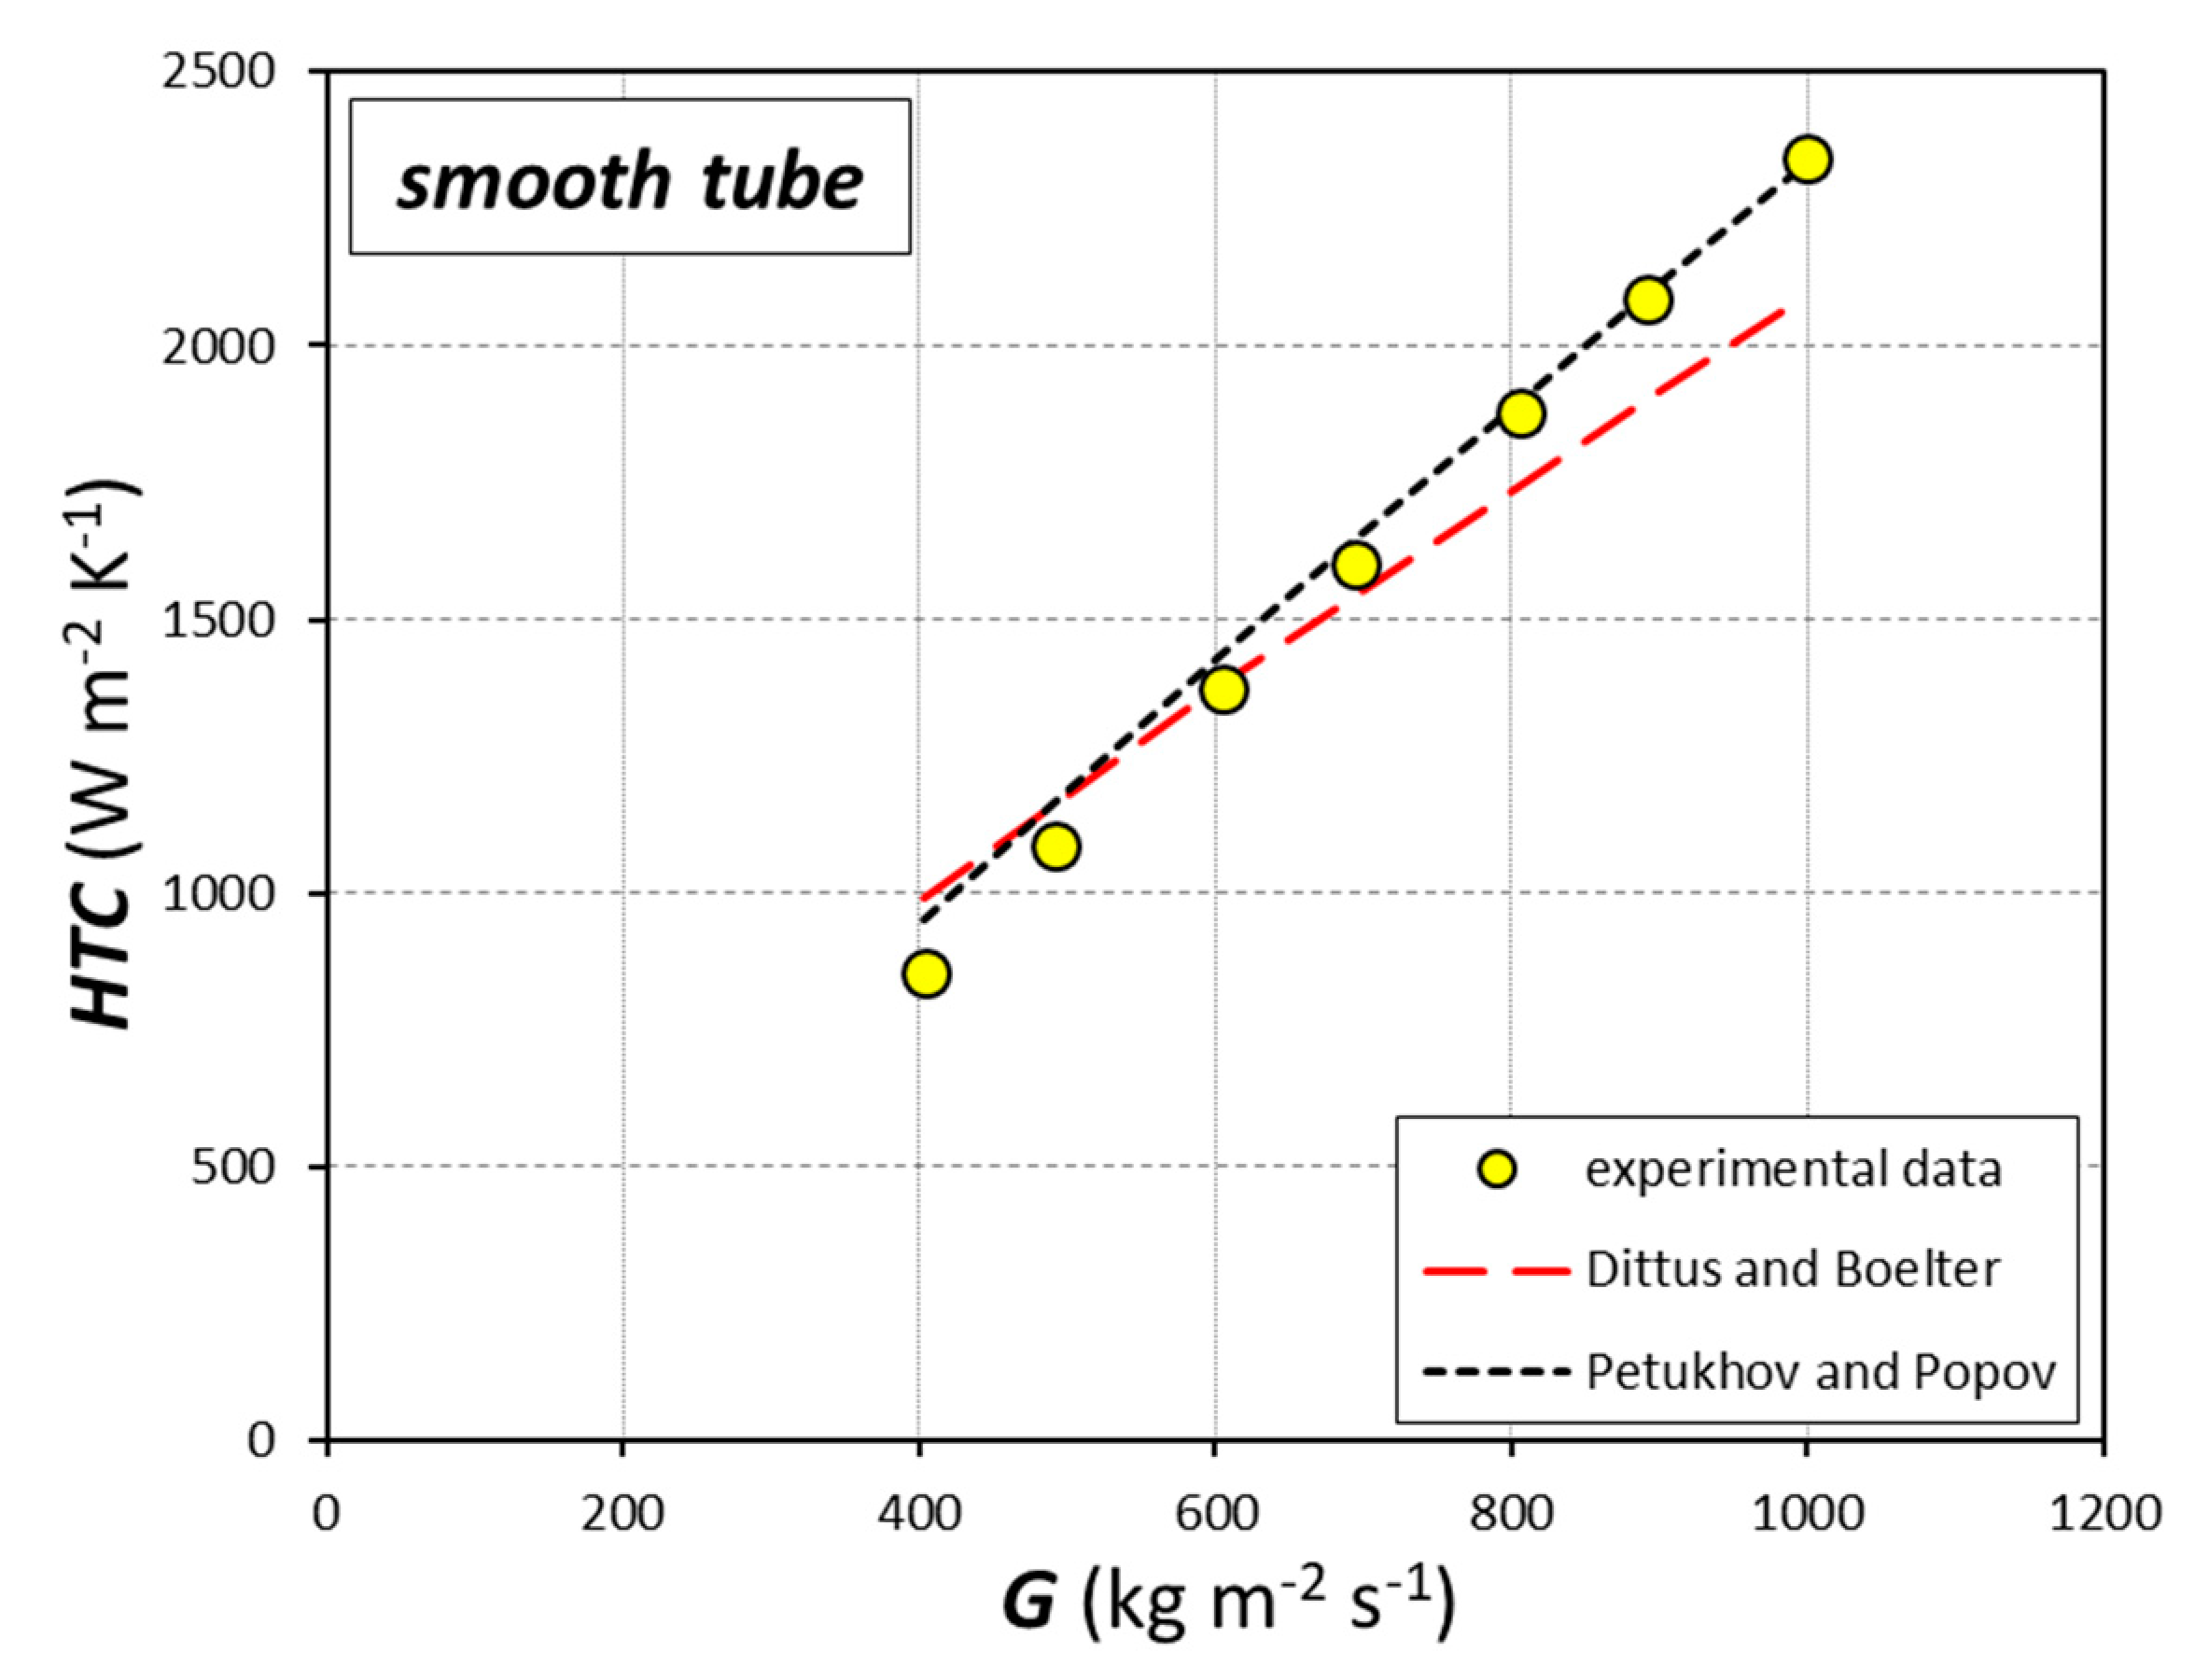
4.1.1. Single-Phase Results
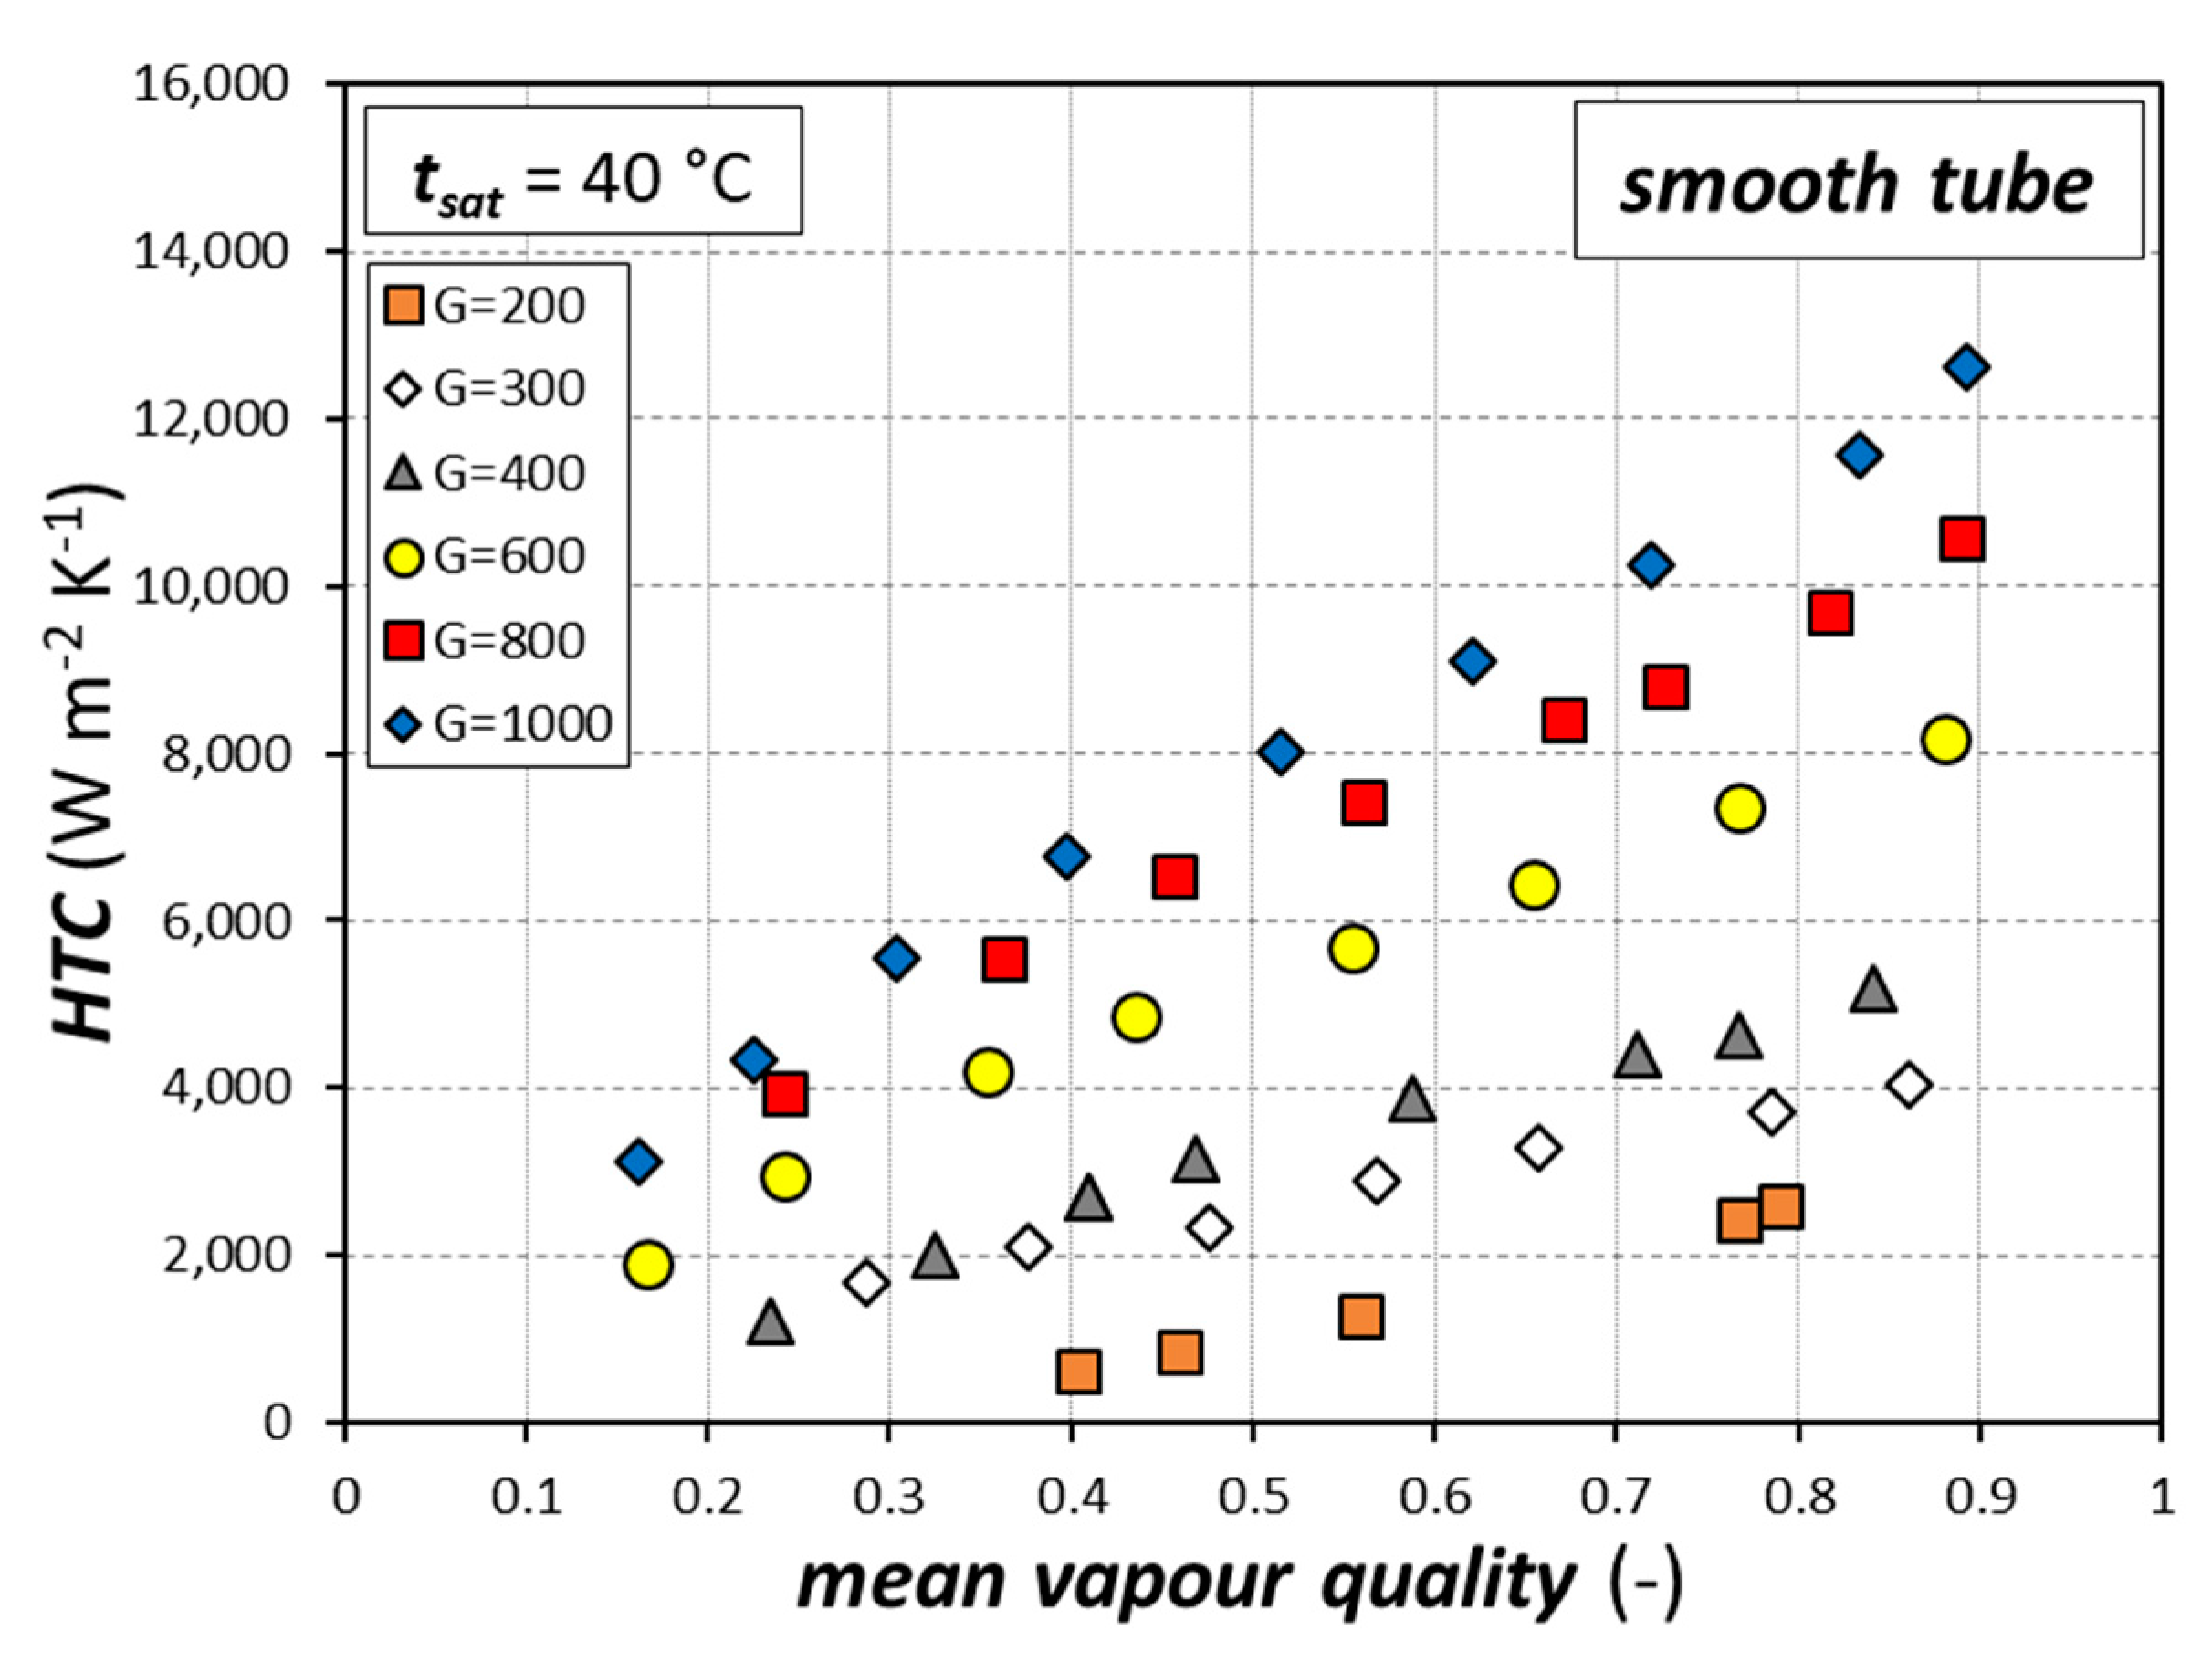
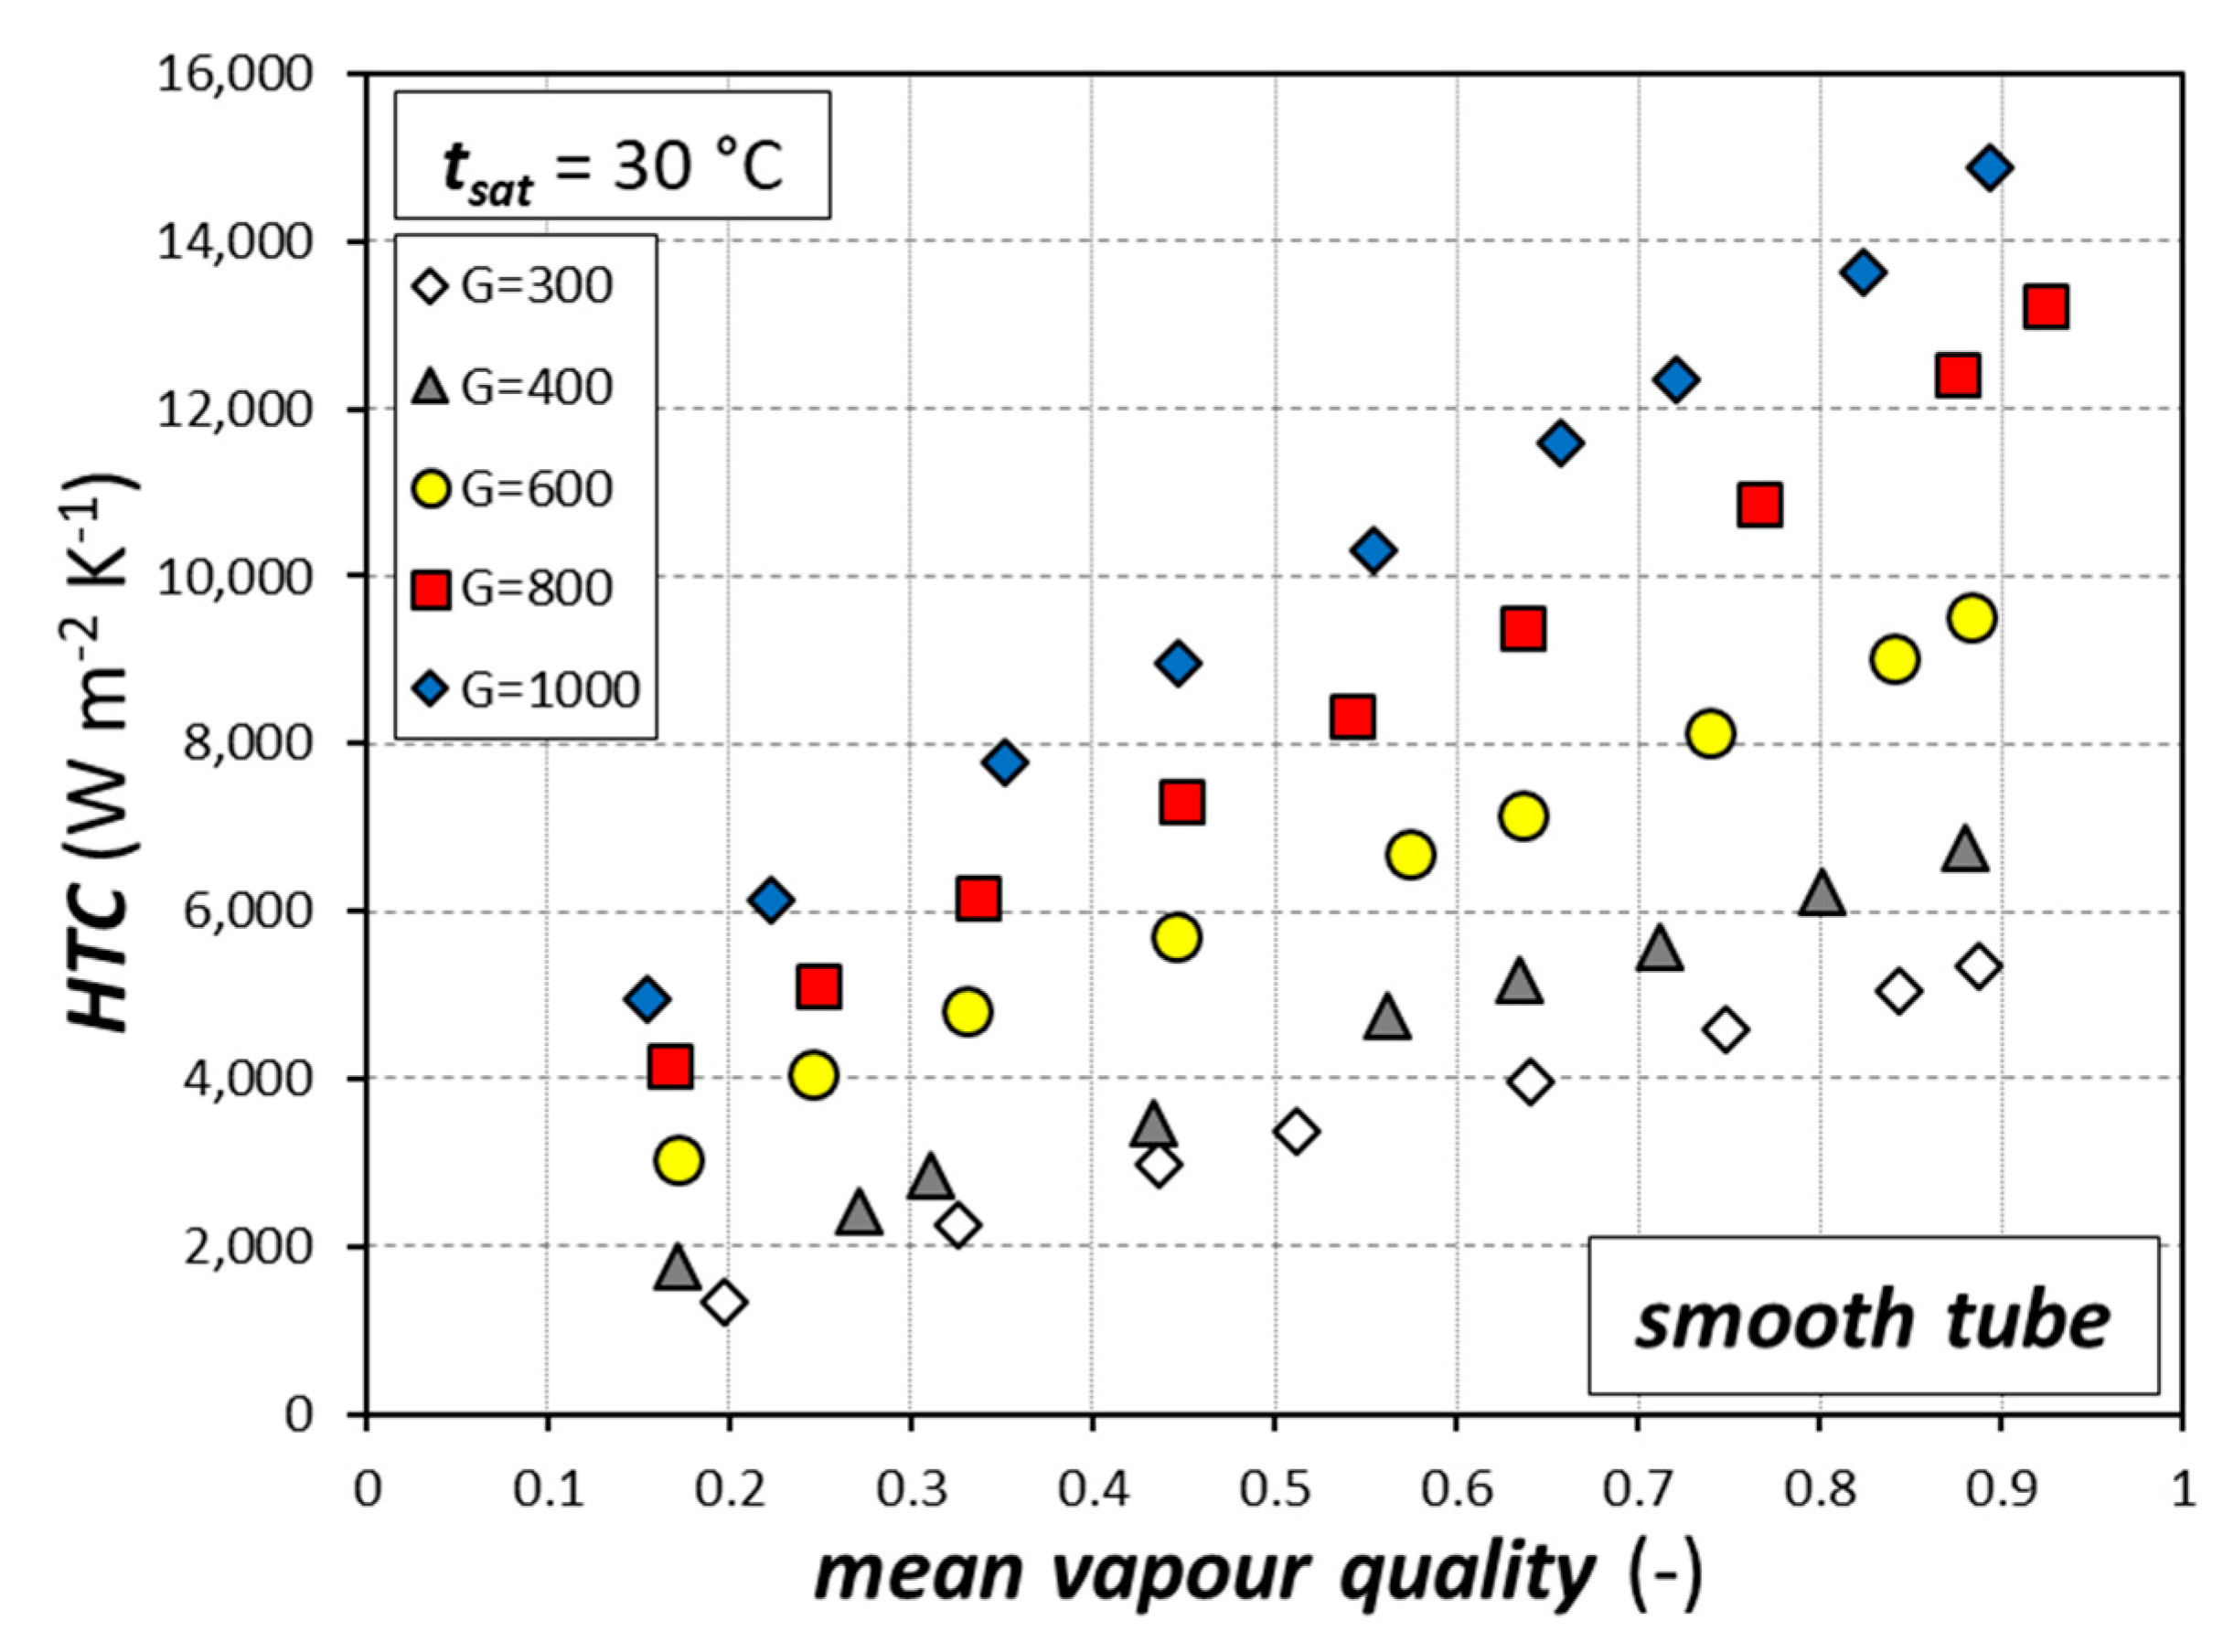
4.1.2. Condensation Results
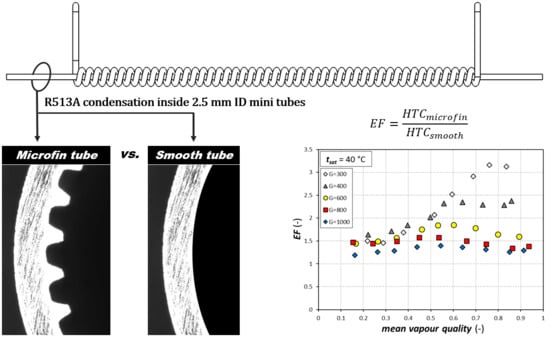
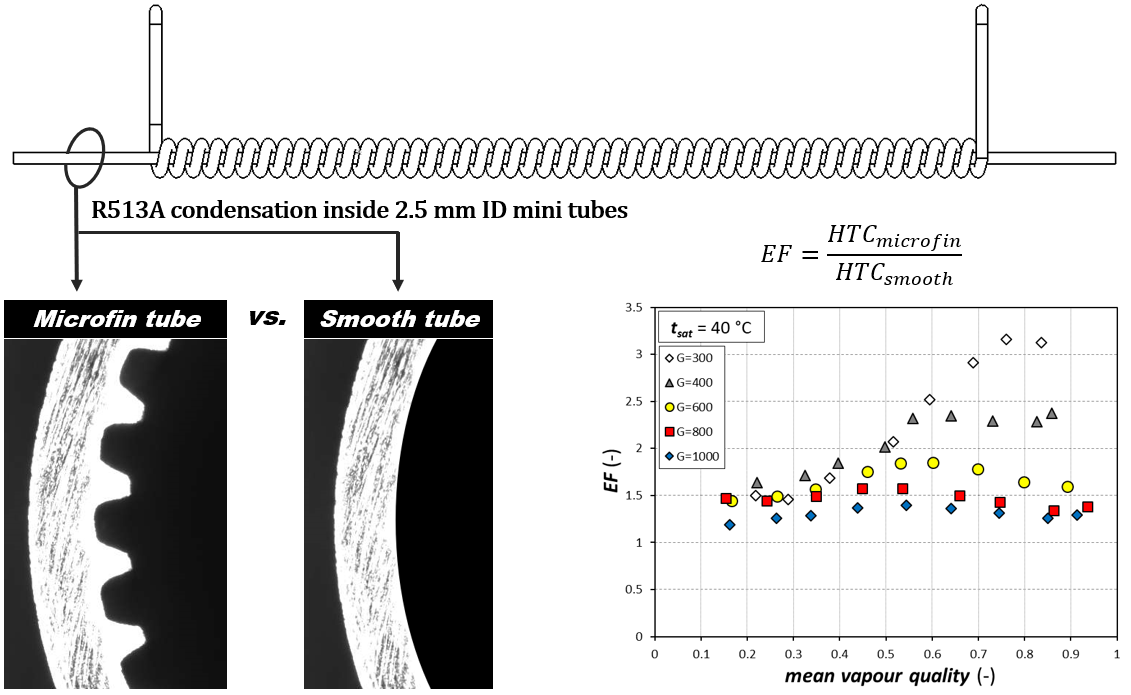
4.2. Microfin Tube
4.2.1. Single-Phase Results
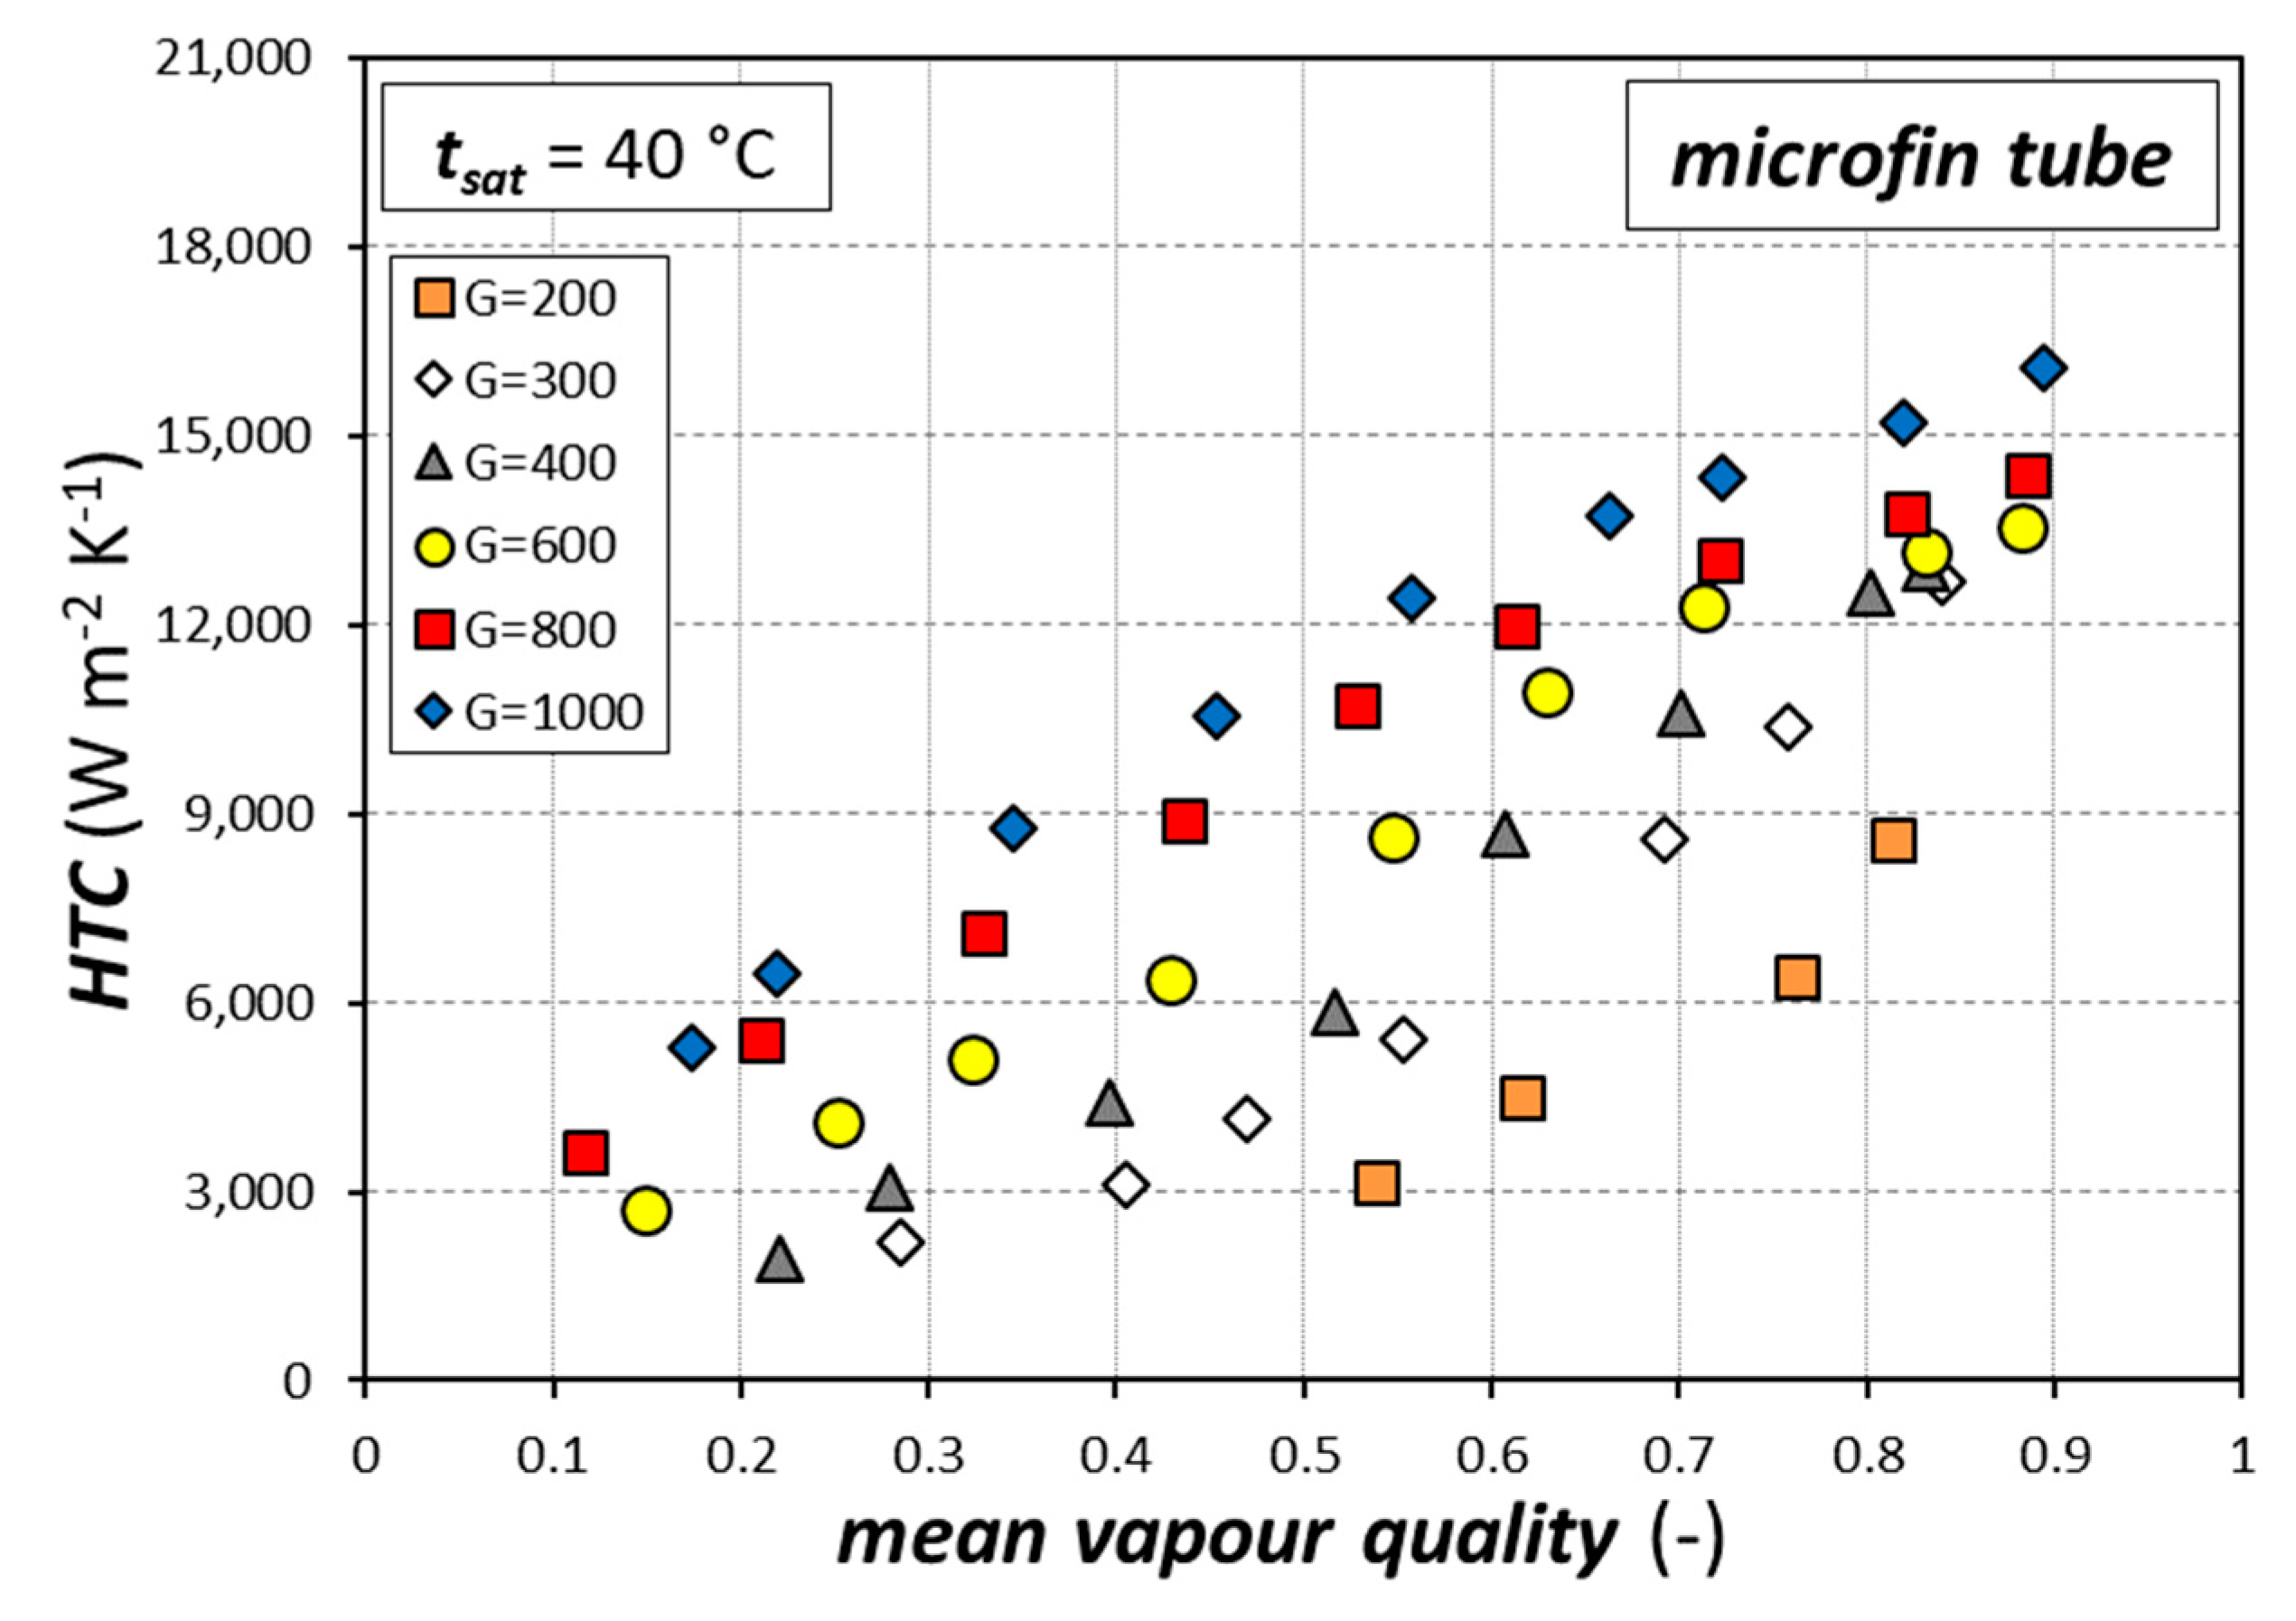
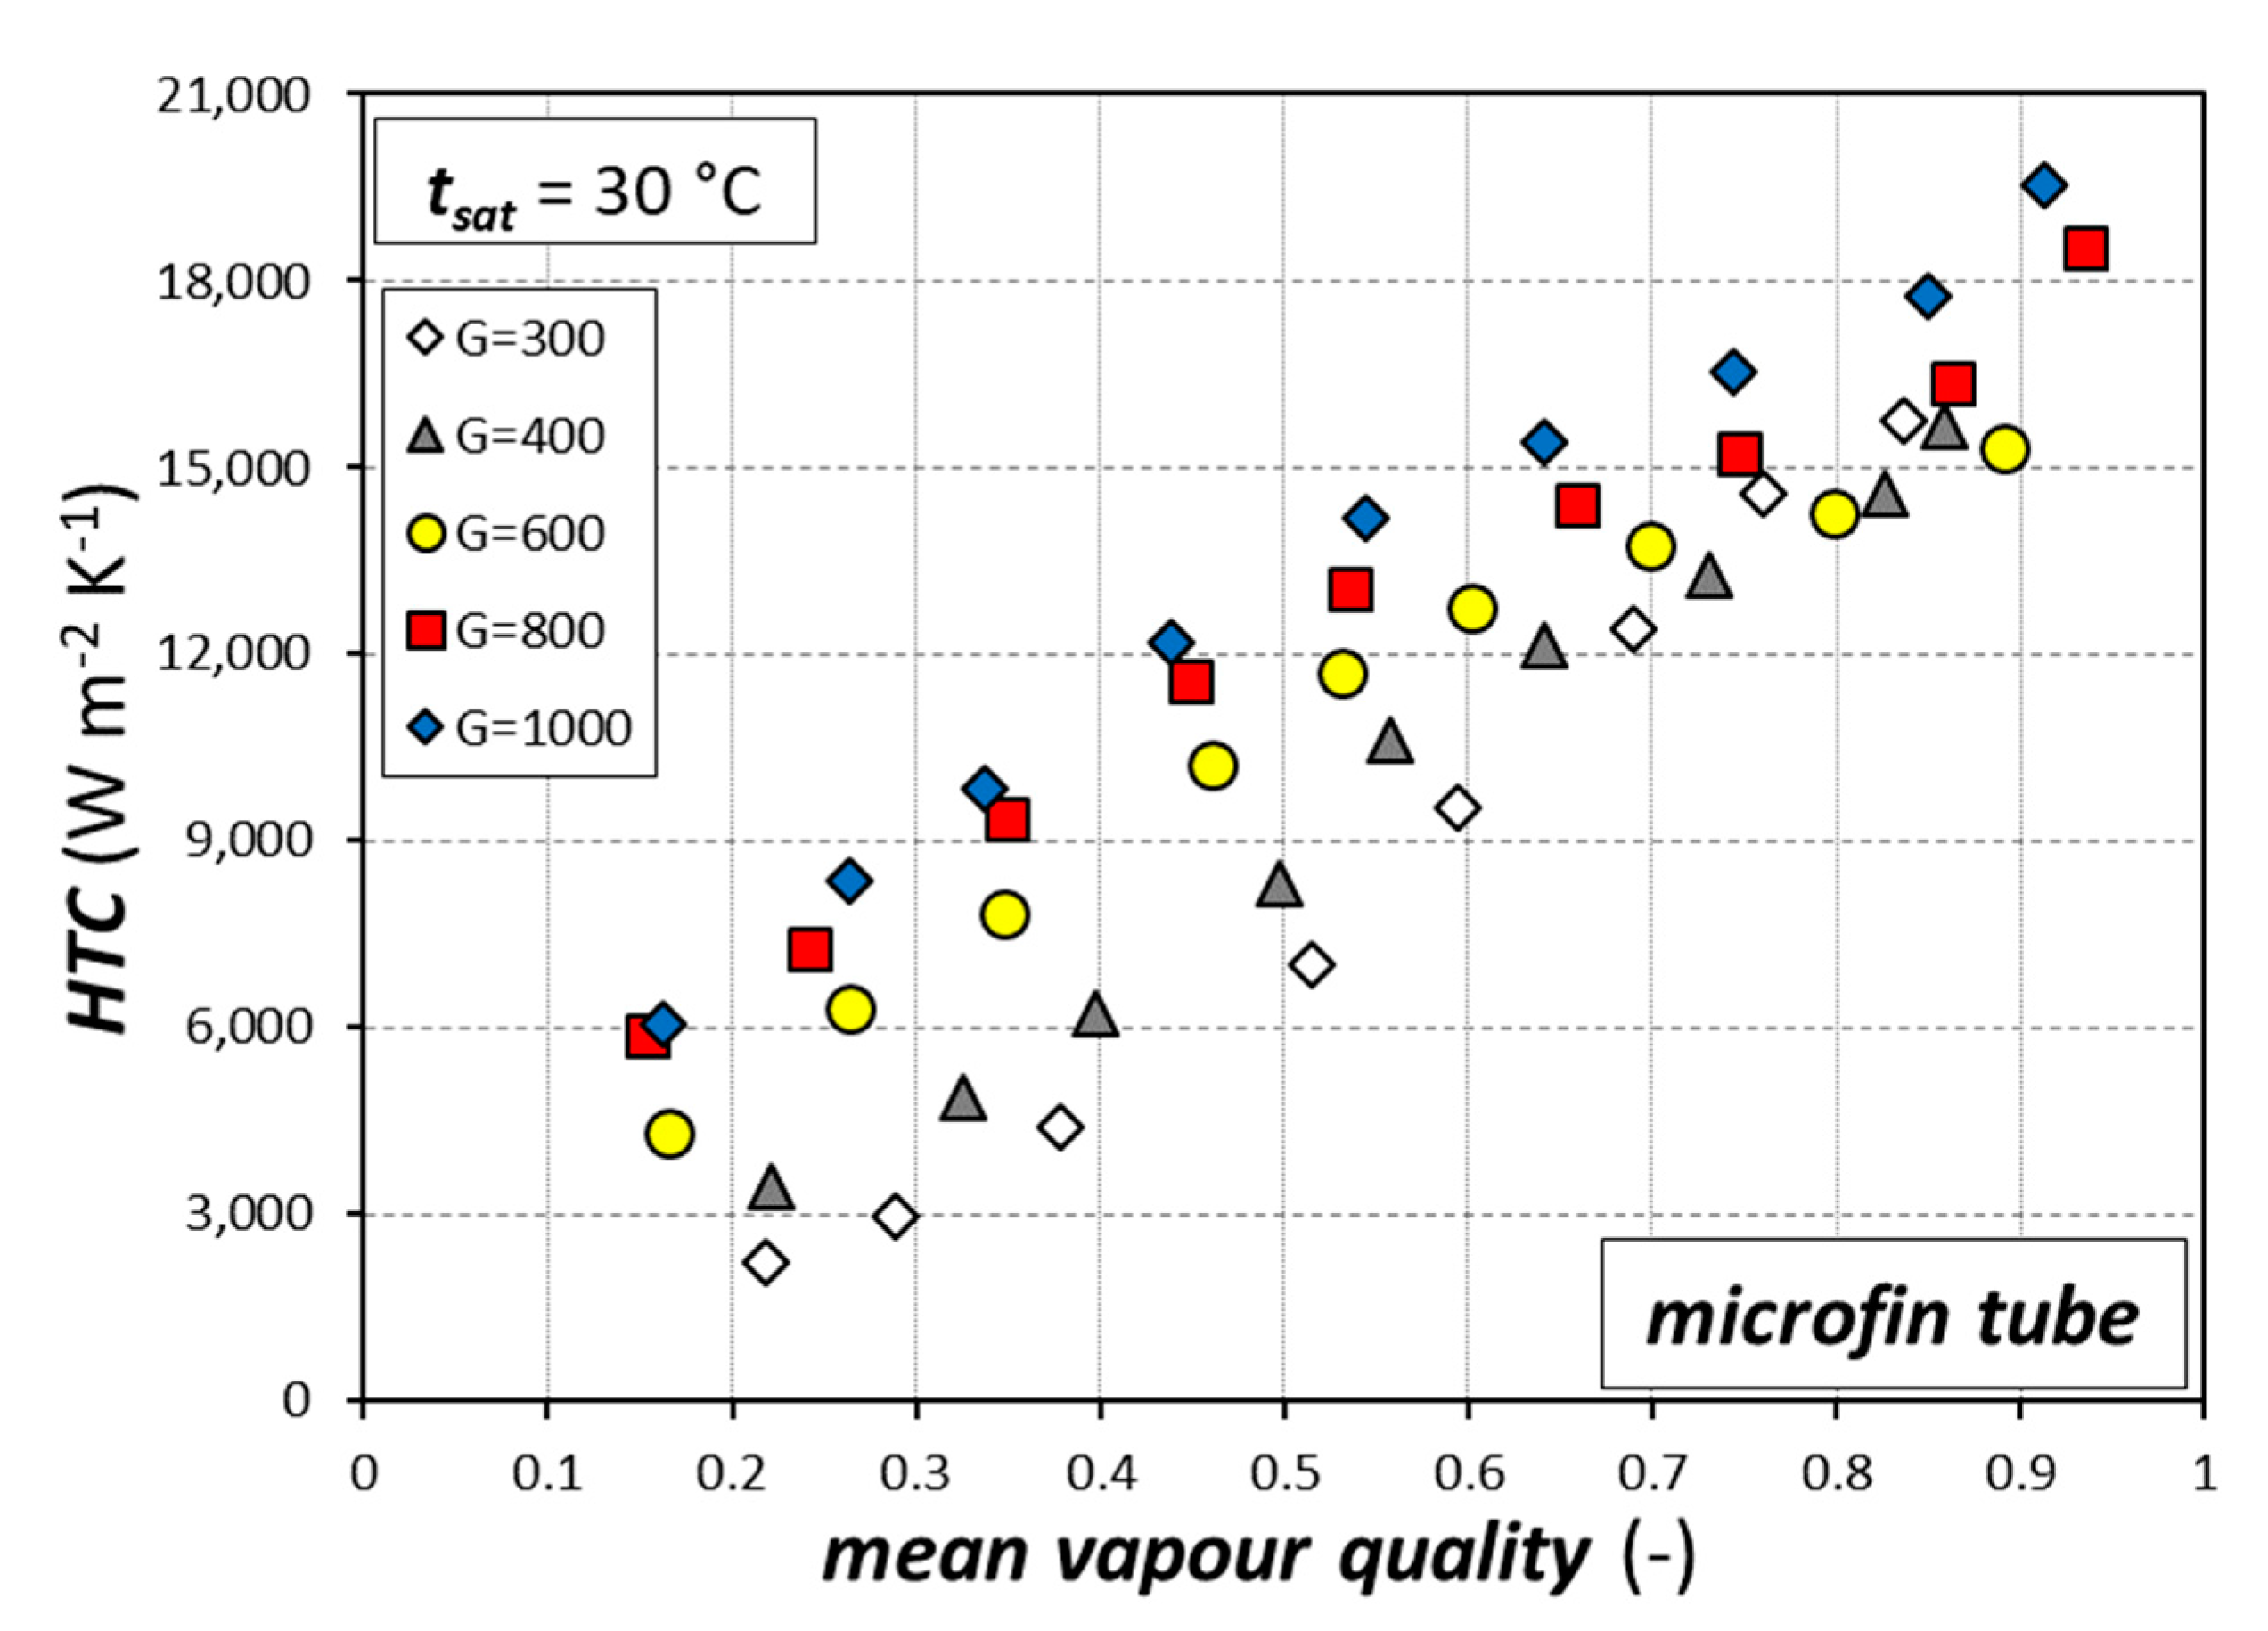
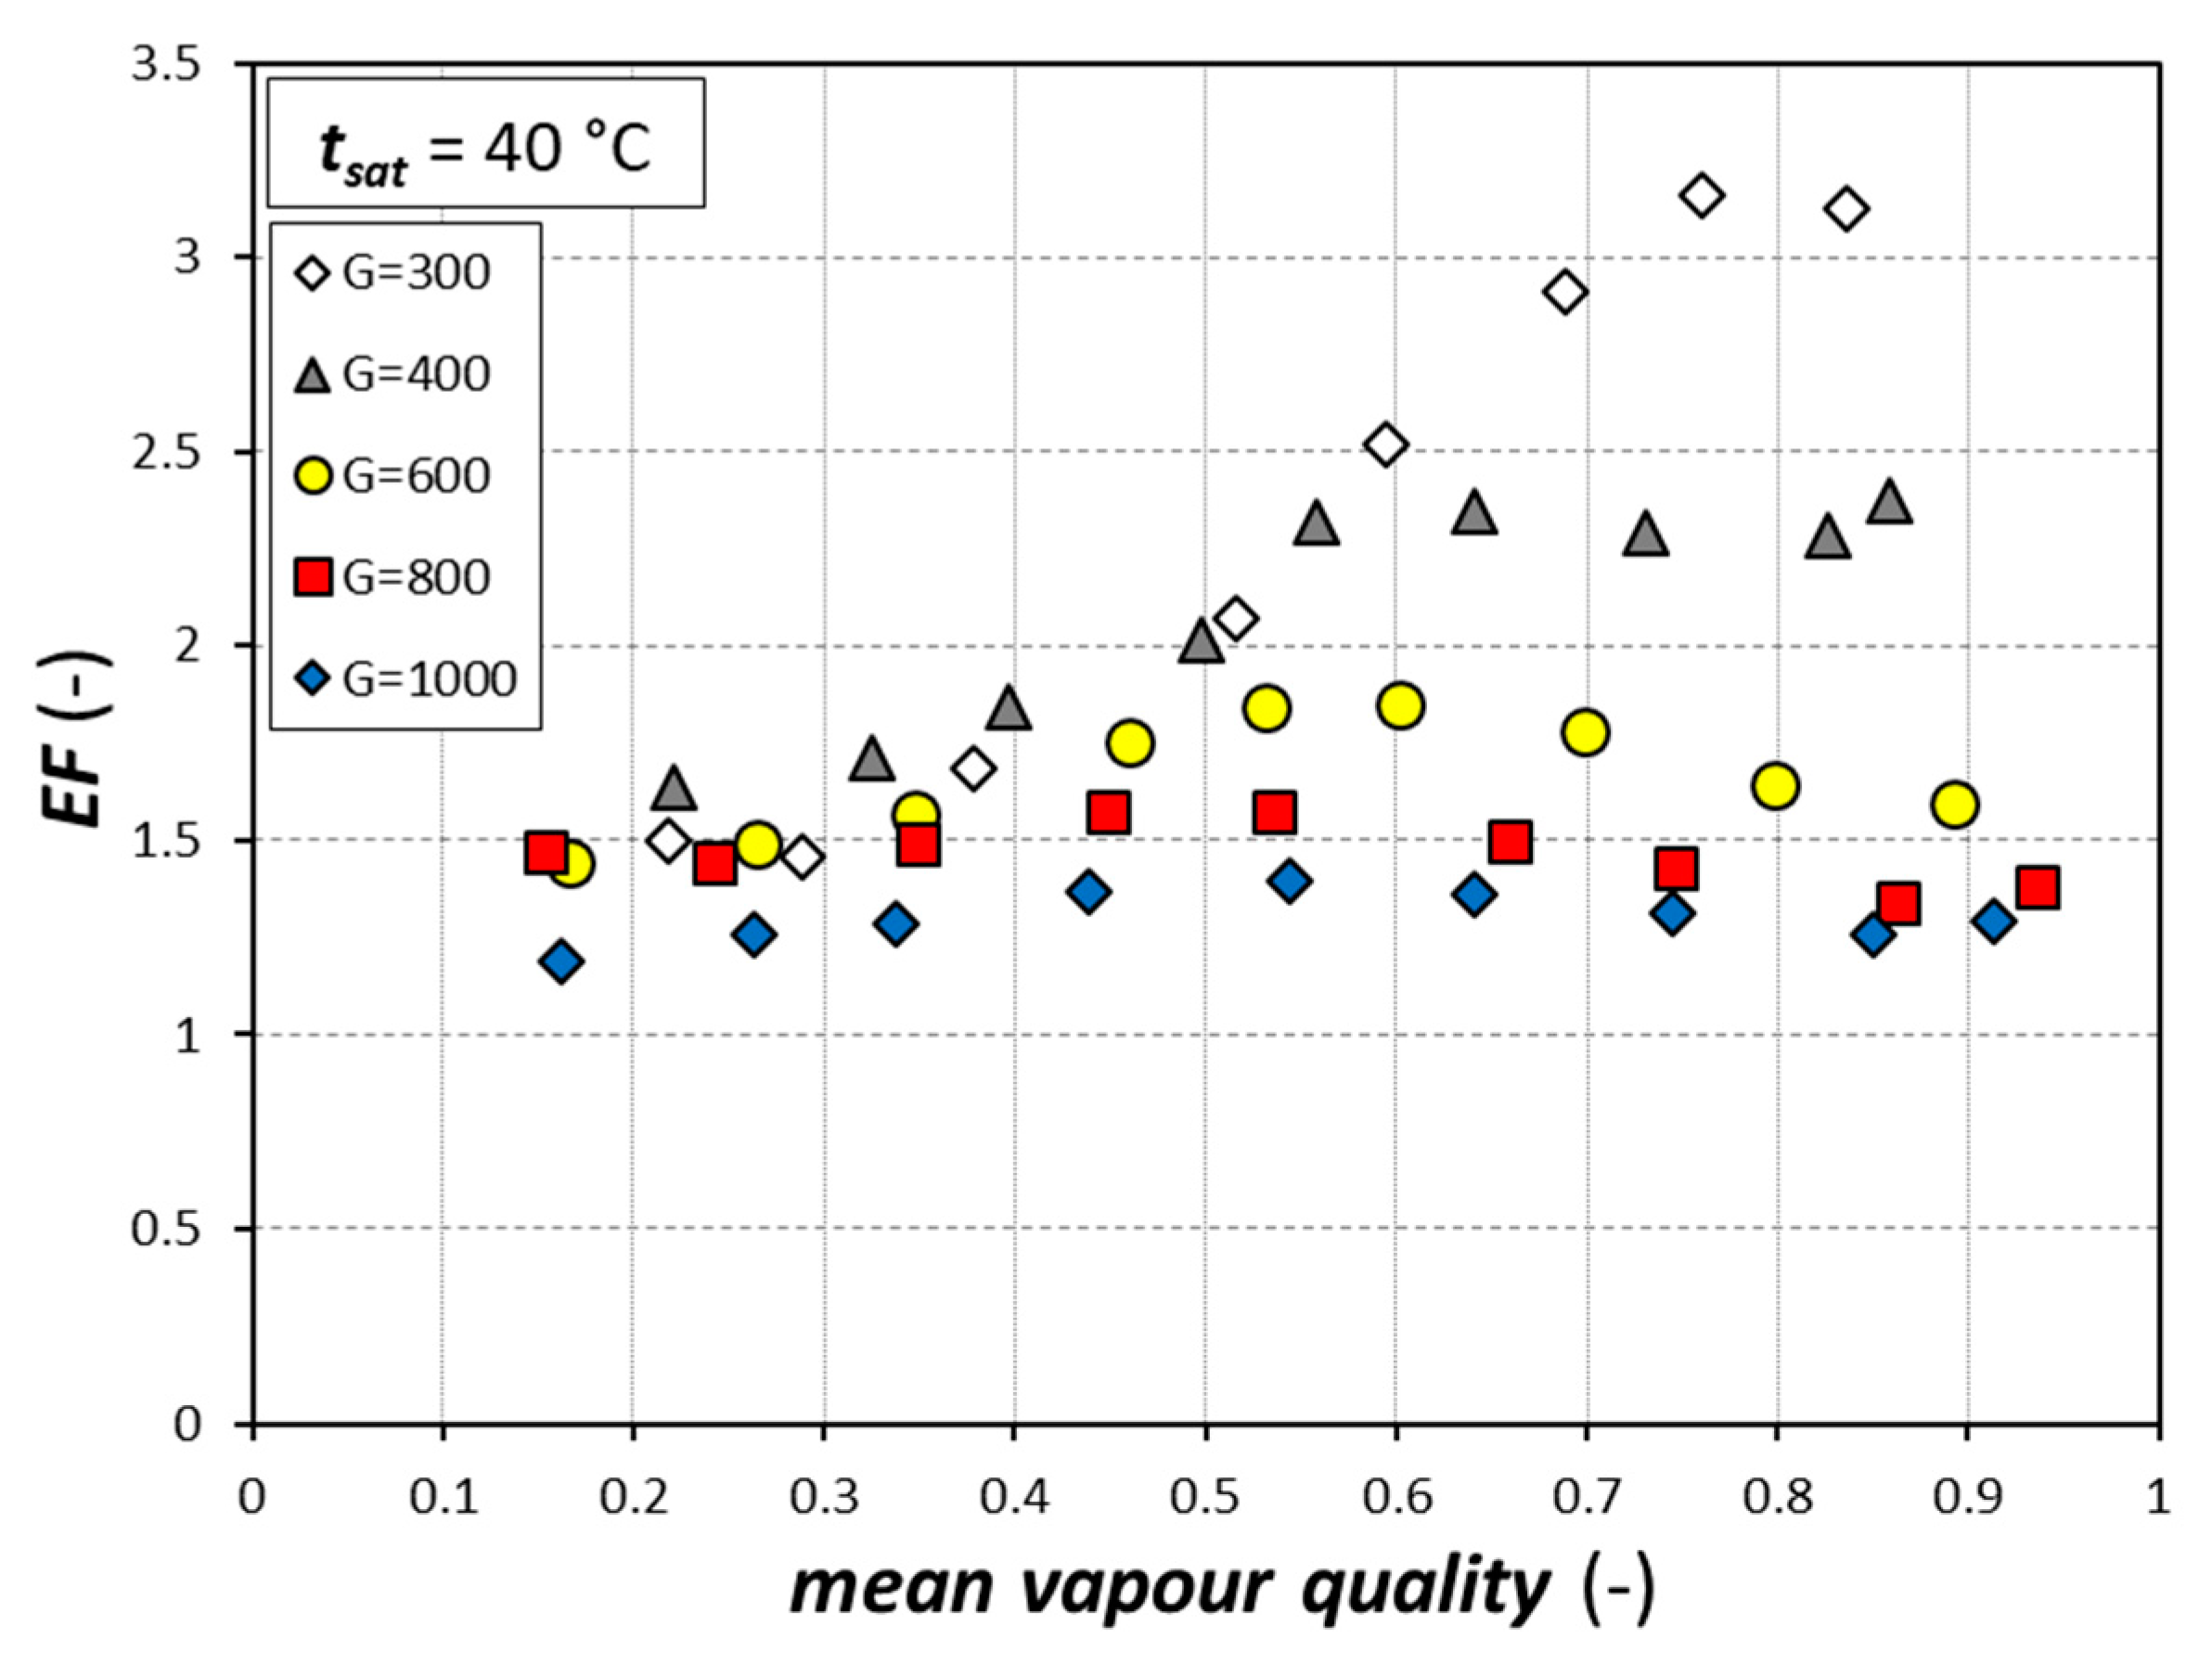
4.2.2. Condensation Results
4.3. Comparison among the Tubes
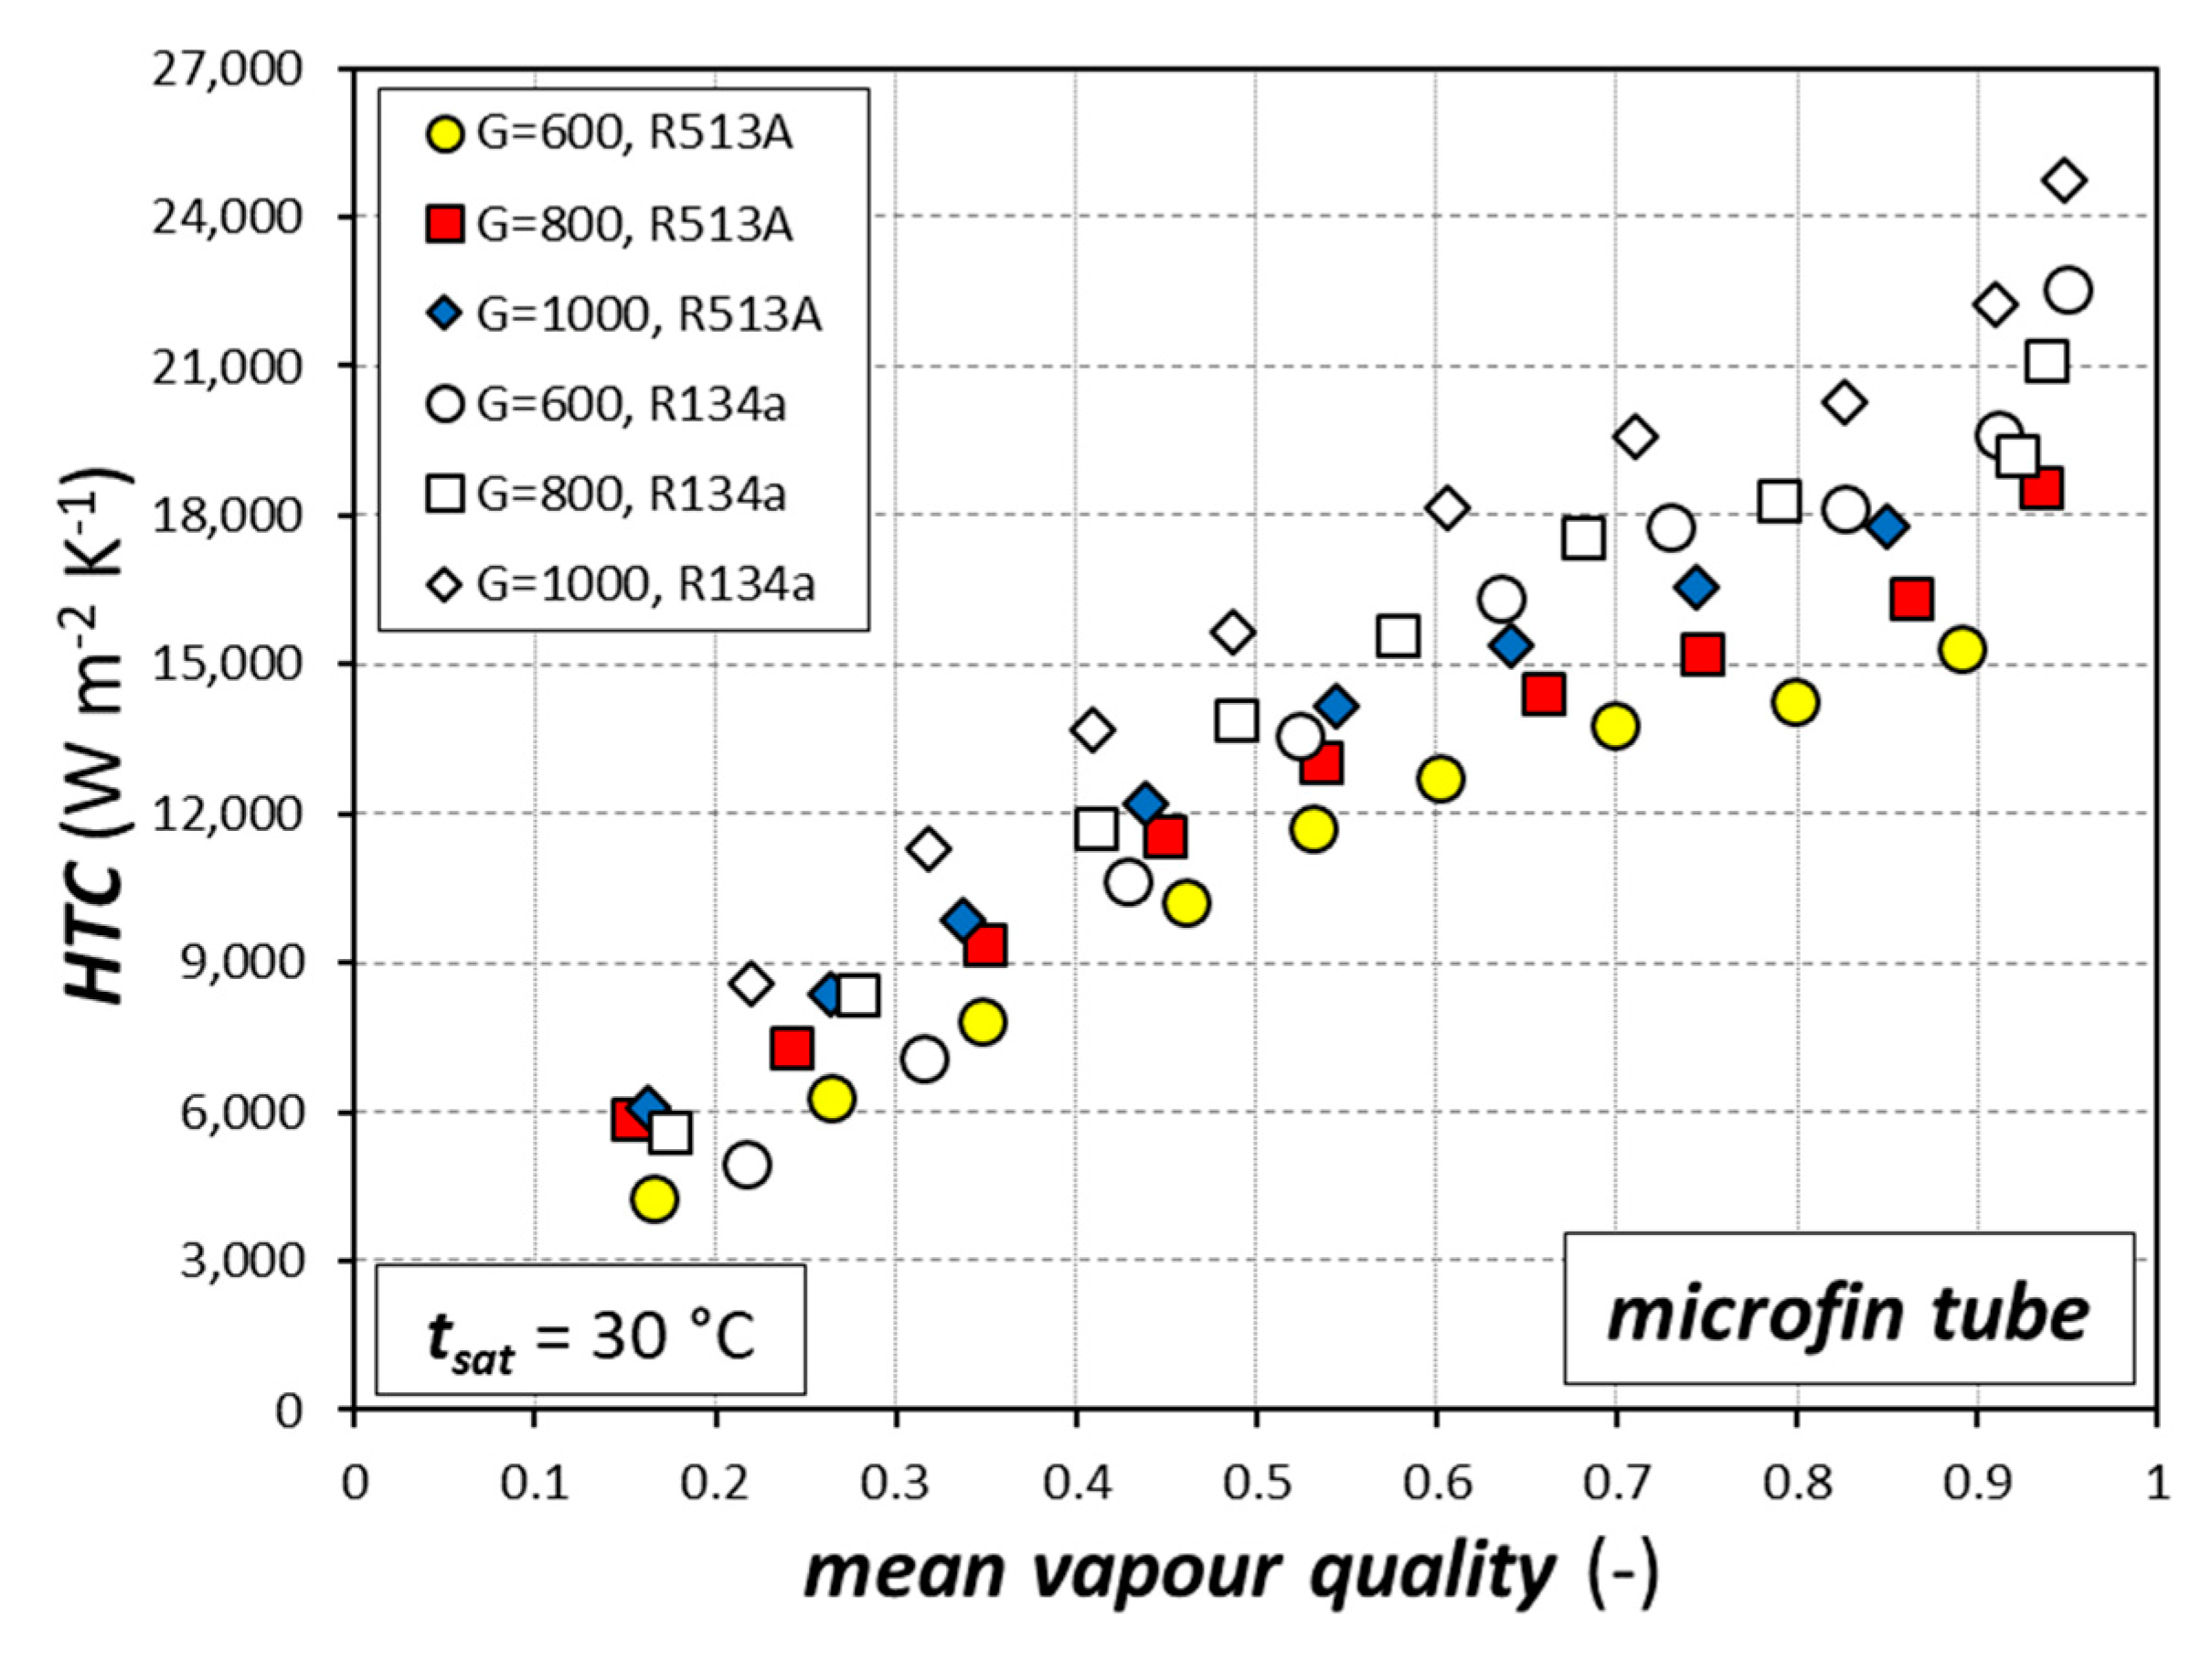
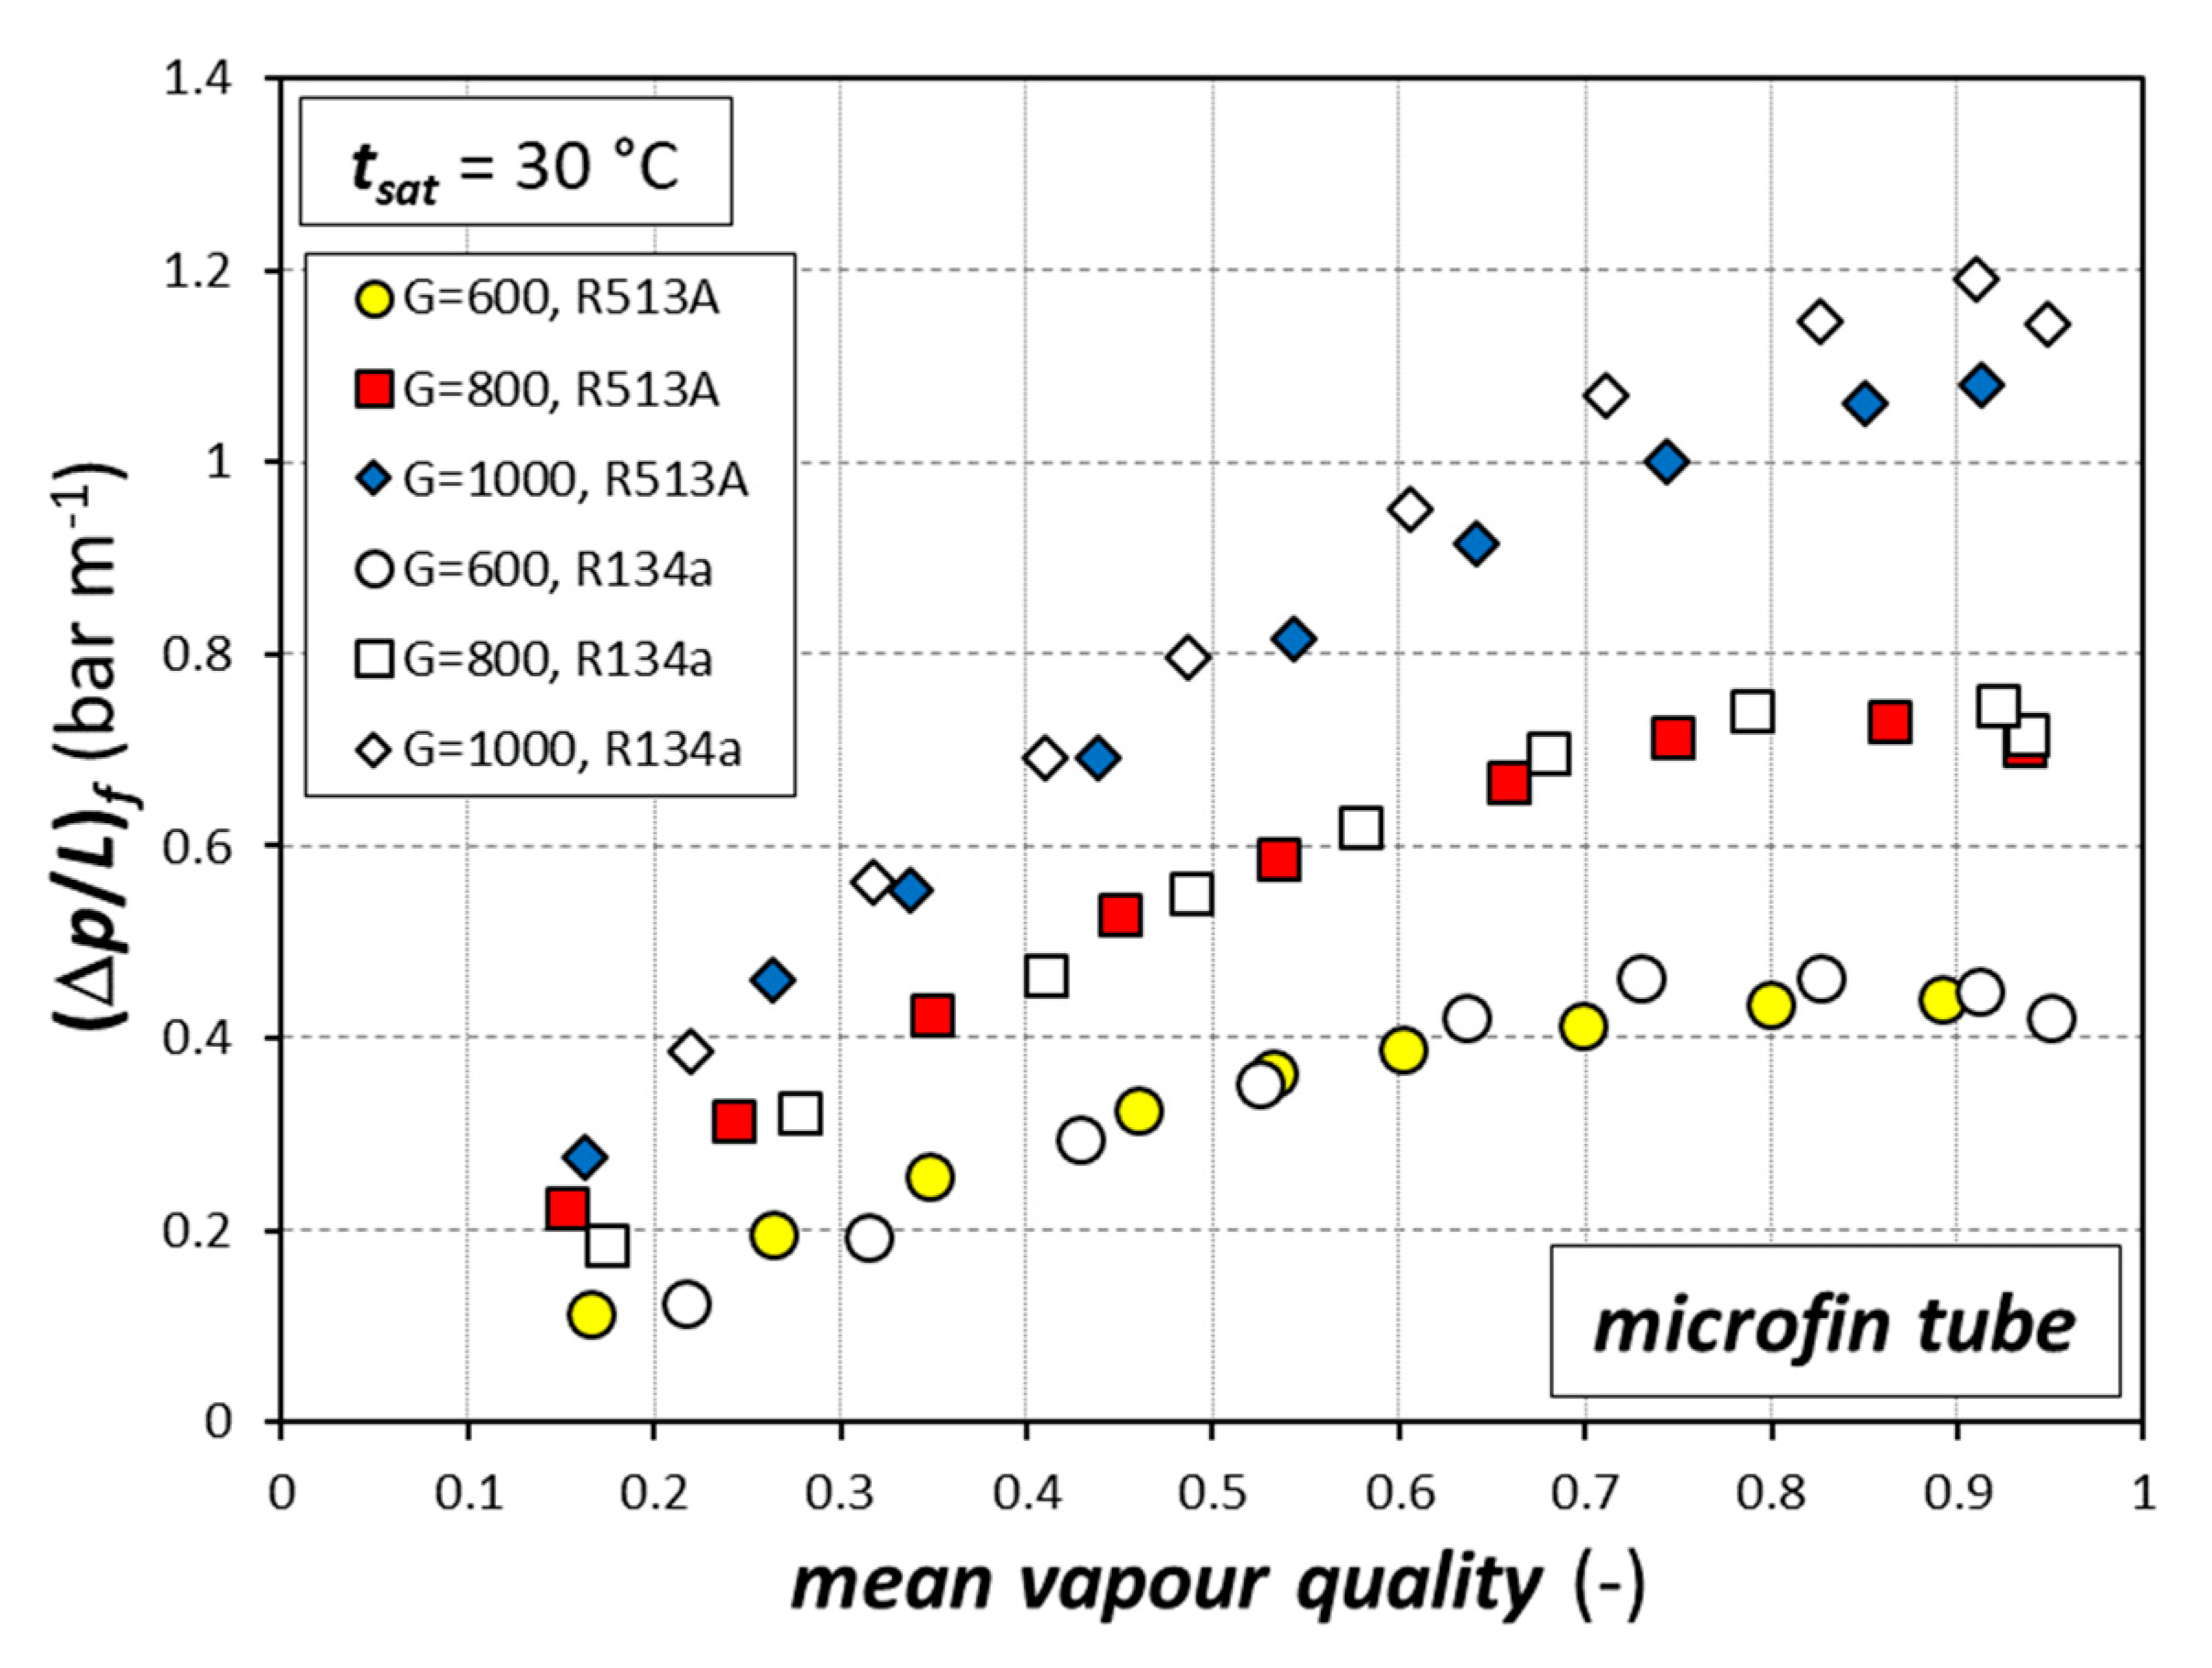
4.4. Comparison among Refrigerants
5. Empirical Modelling
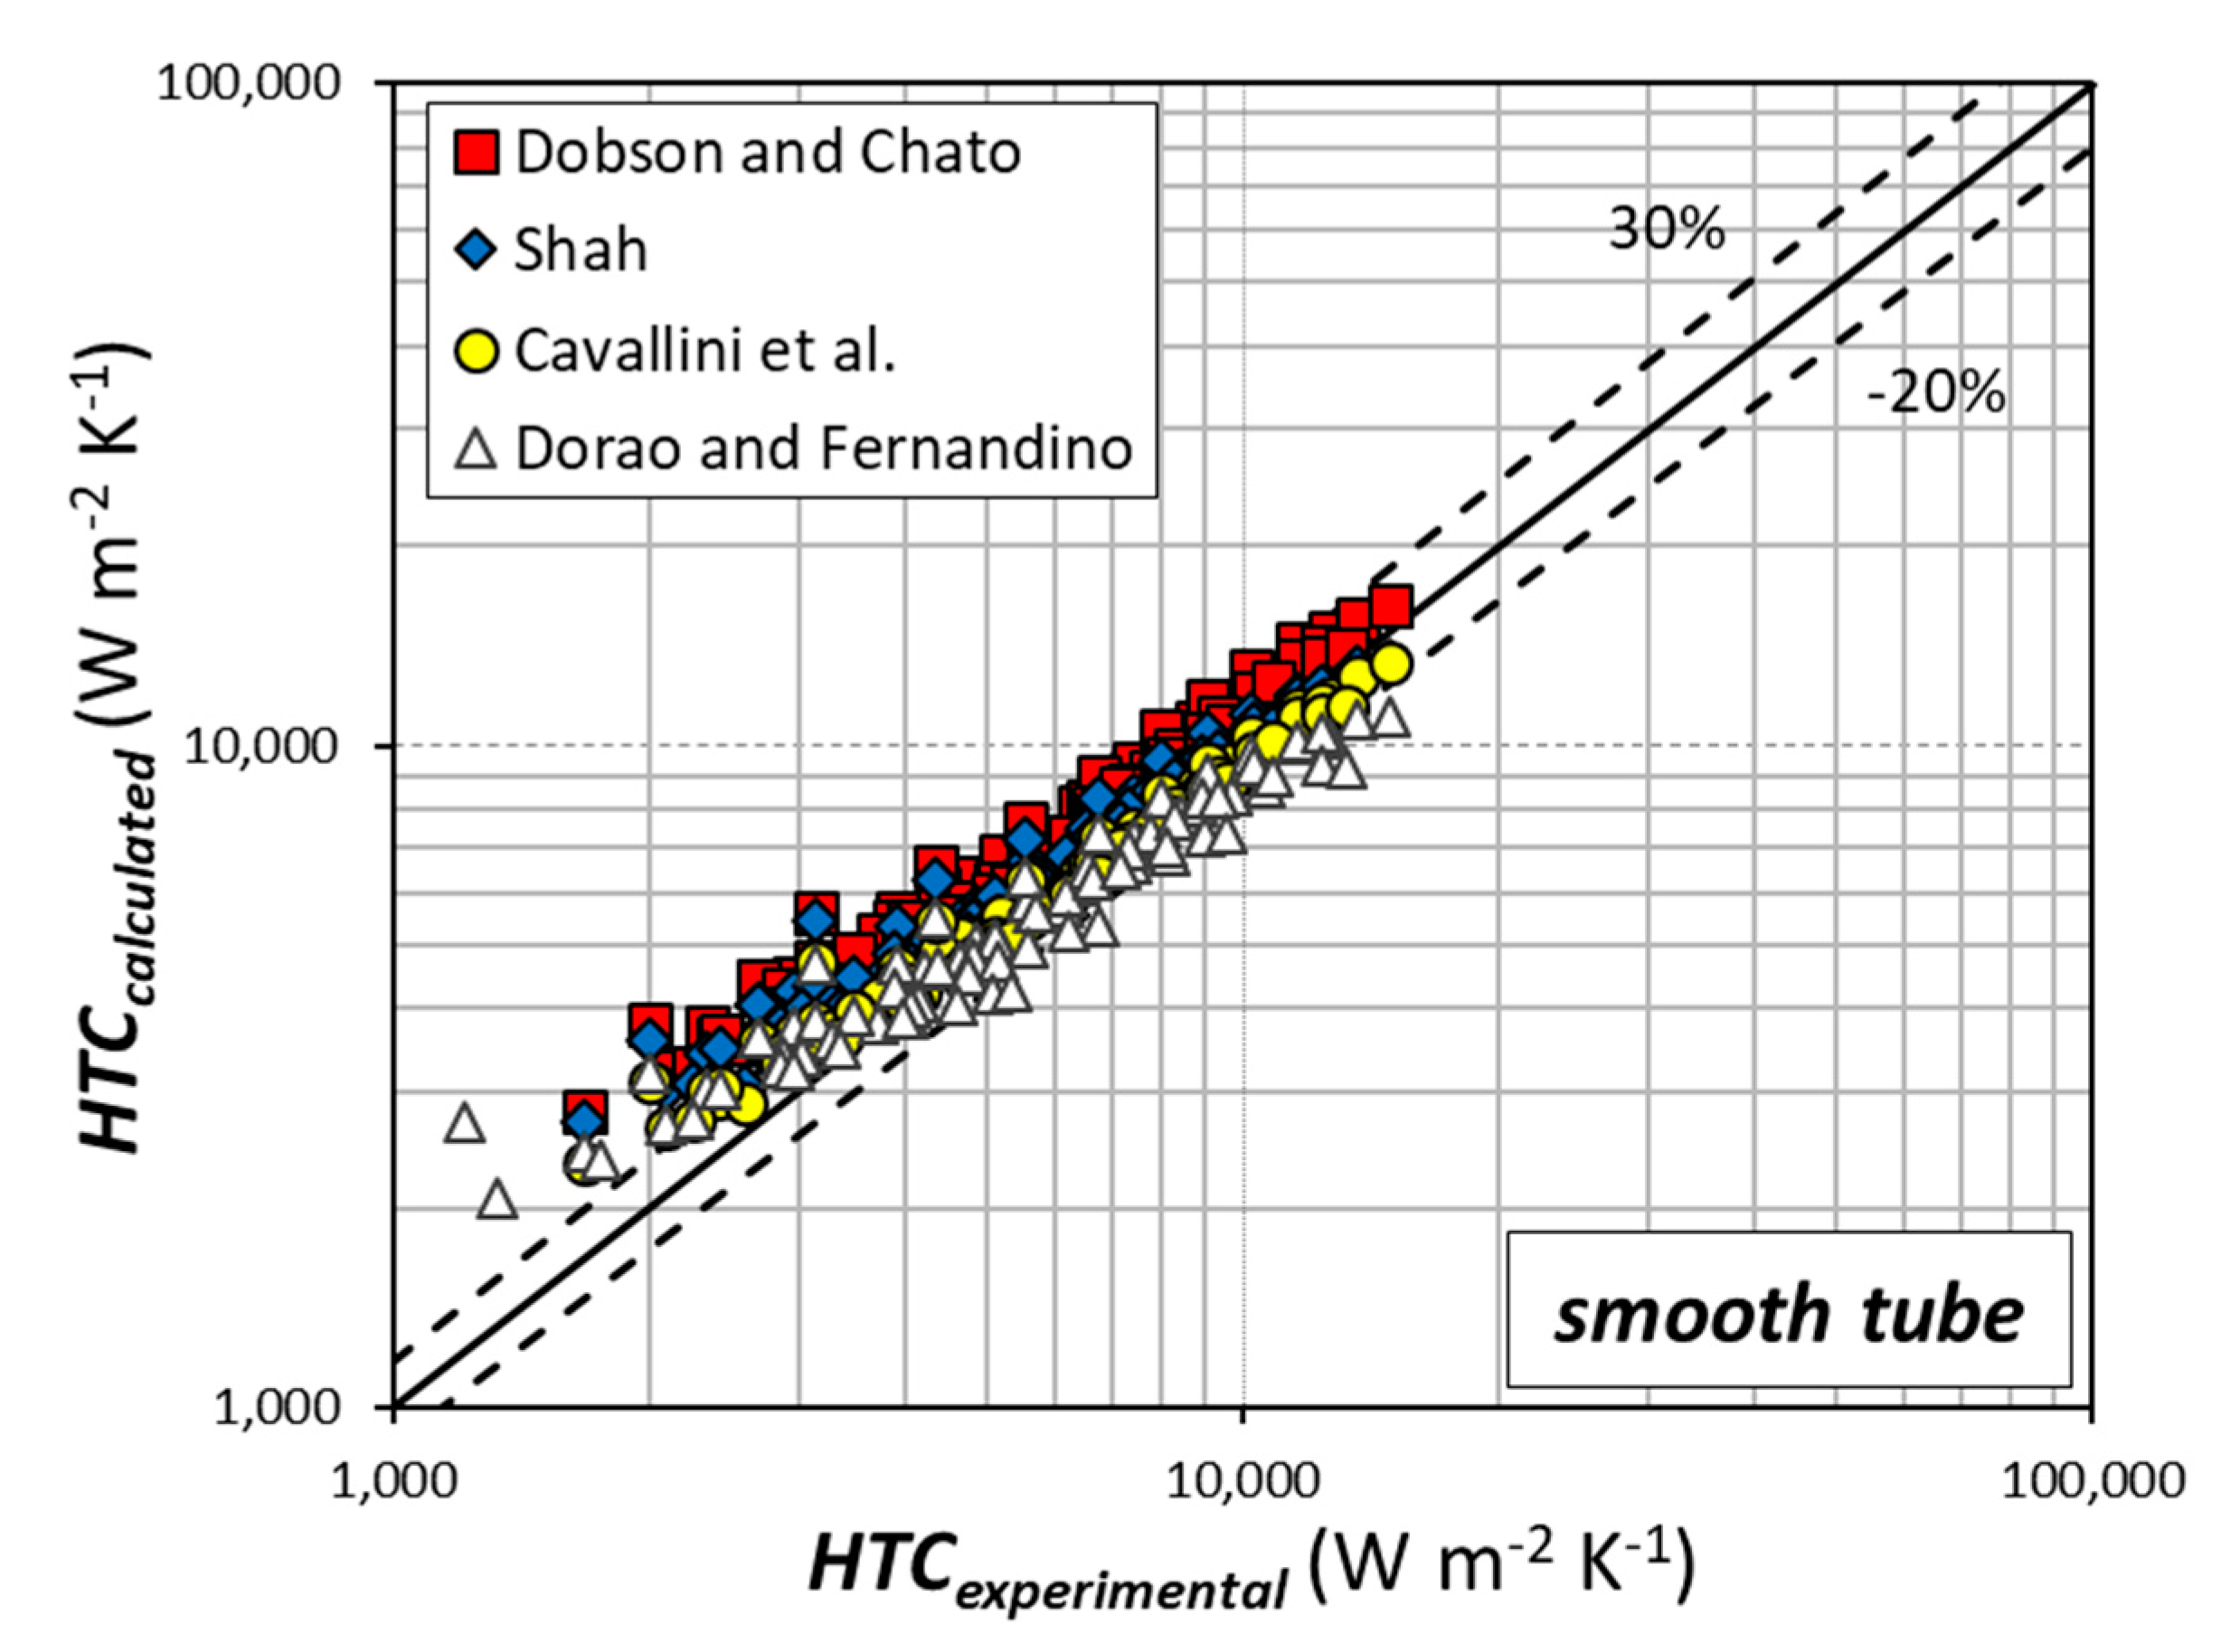
5.1. Smooth Tube
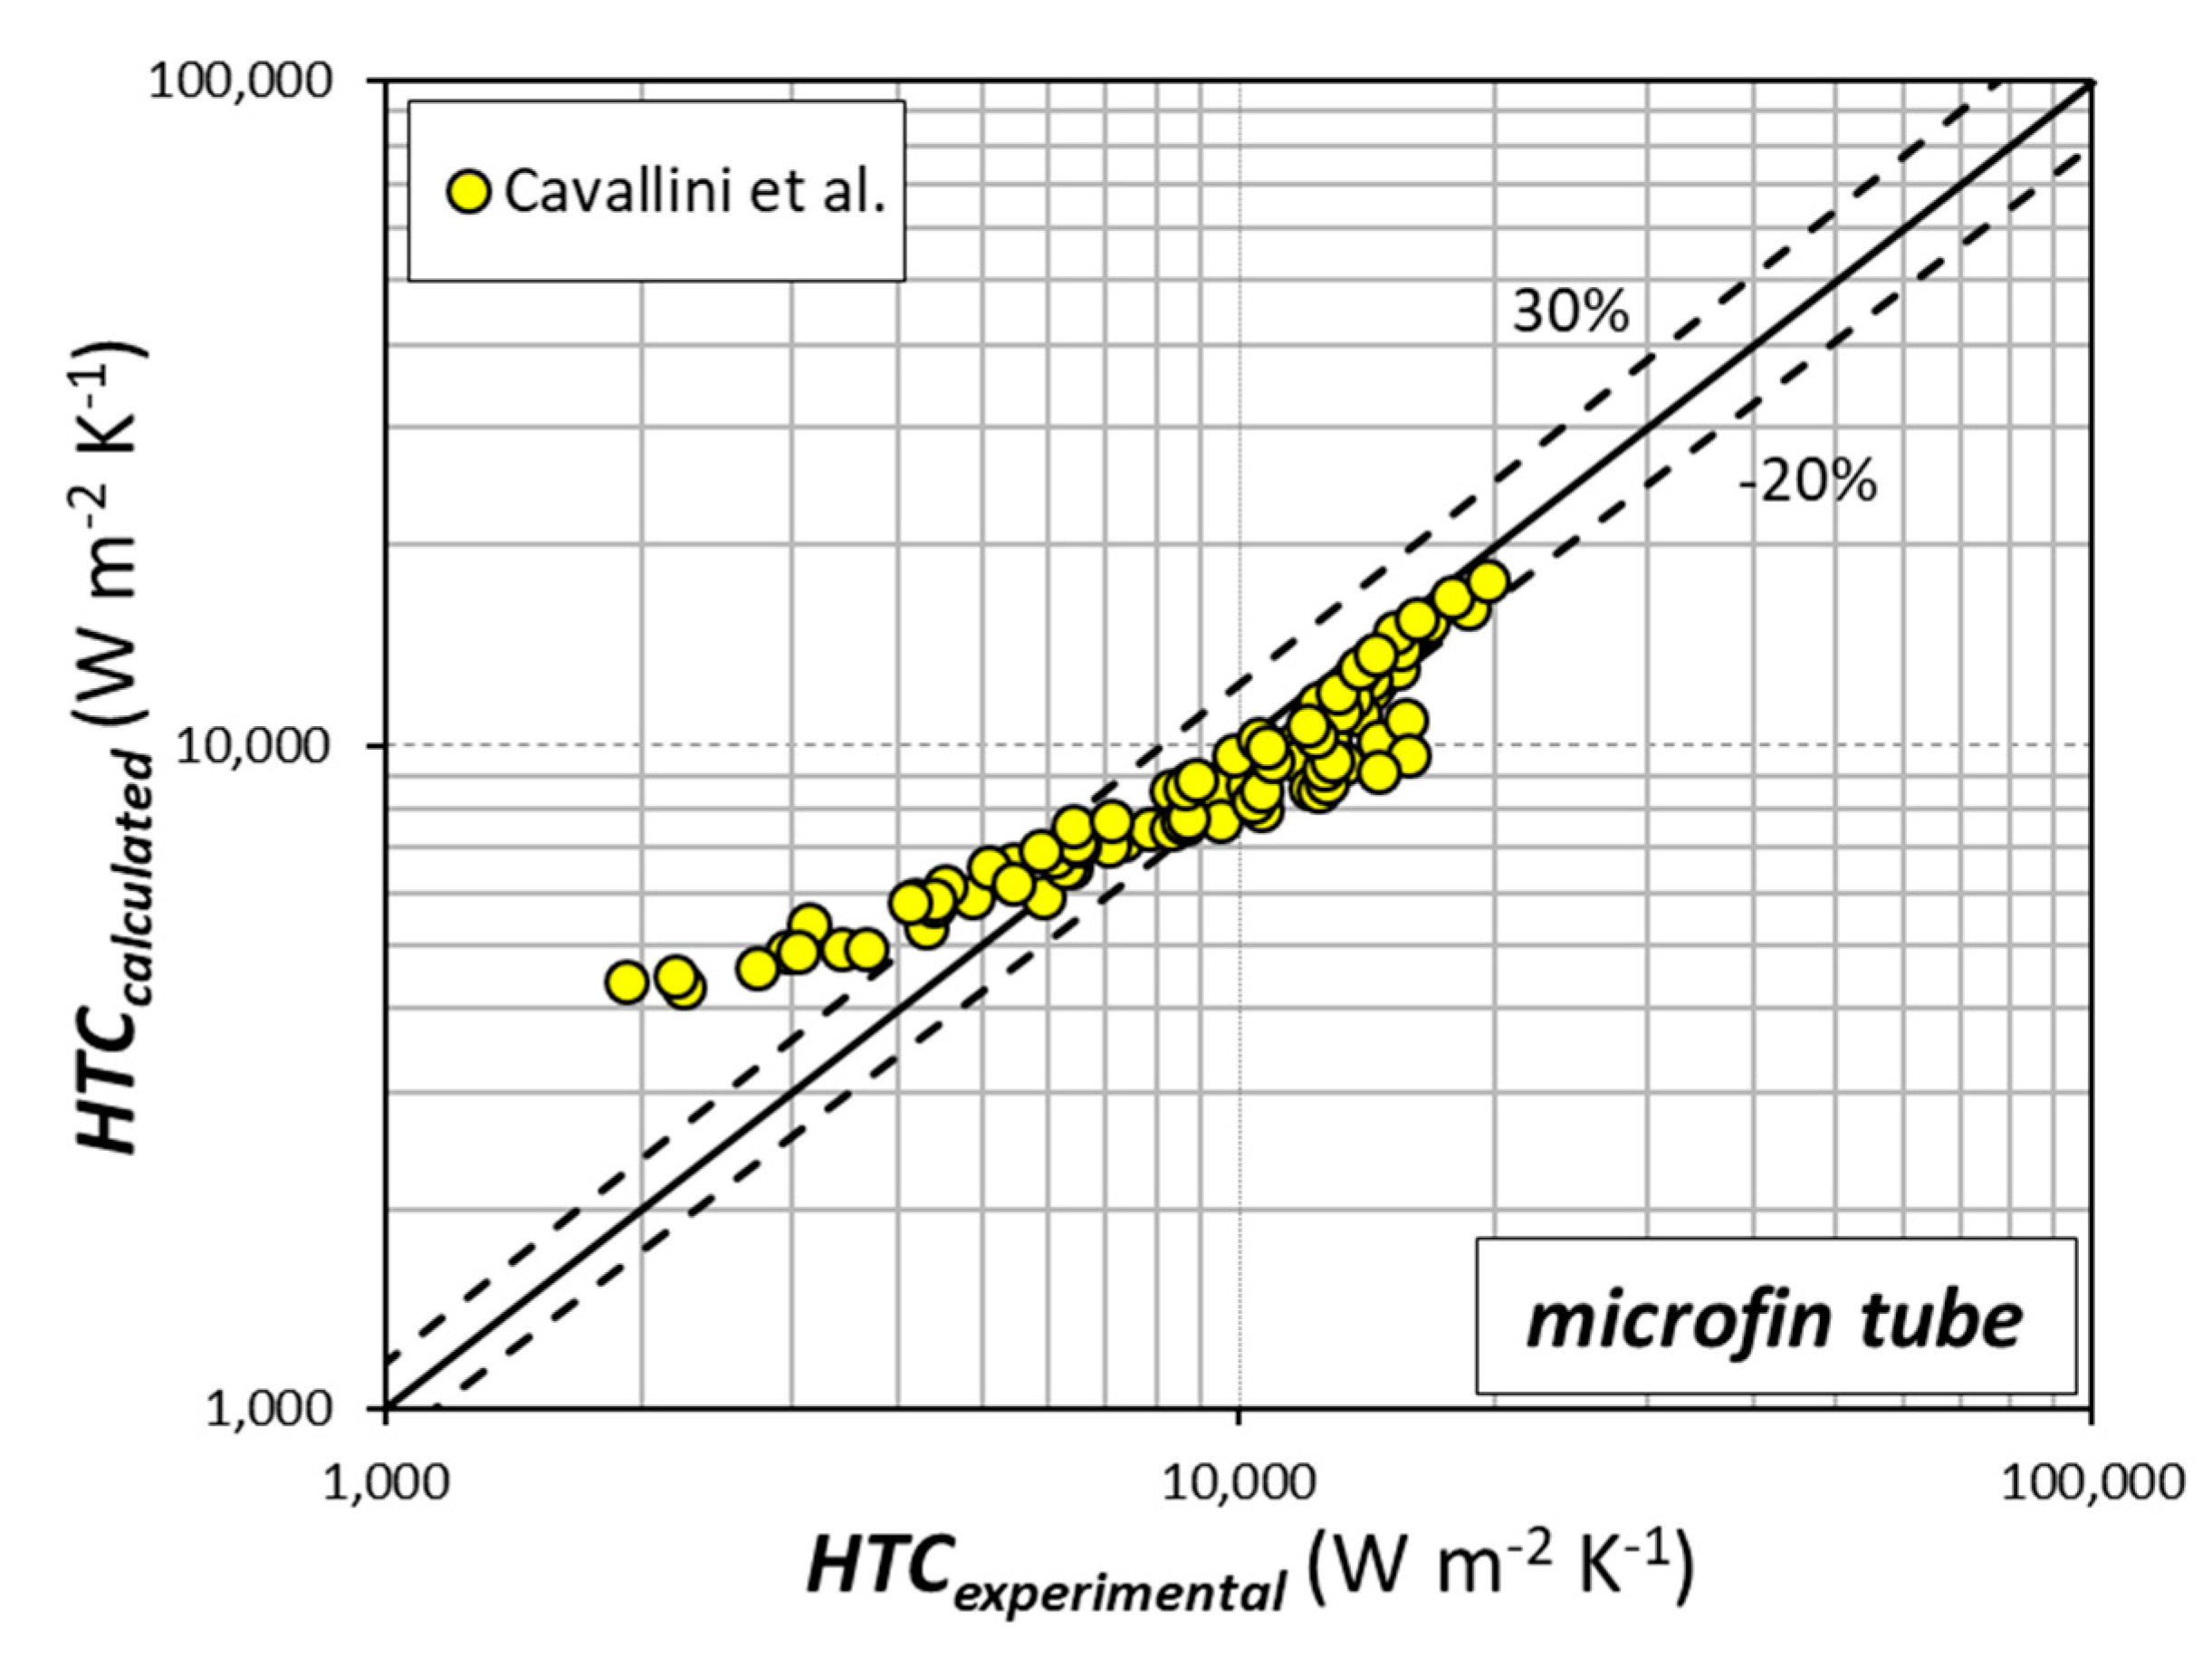
5.2. Microfin Tube
6. Conclusions
Author Contributions
Funding
Acknowledgments
Conflicts of Interest
Nomenclature
| A | area [m2] |
| c | specific heat [J kg−1 K−1] |
| D | diameter [m] |
| G | mass velocity [kg m−2 s−1] |
| h | specific enthalpy [J kg−1] |
| HTC | heat transfer coefficient [W m−2 K−1] |
| L | length [m] |
| mass flow rate [kg s−1] | |
| p | pressure [bar] |
| q | heat flow rate [W] |
| Pr | Prandtl number [-] |
| t | temperature [°C] |
| x | thermodynamic vapor quality [-] |
| Greek symbols | |
| ∆p | pressure drop [Pa] |
| ∆T | temperature difference [K] |
| λ | thermal conductivity [W m−1 K−1] |
| μ | dynamic viscosity [Pa s] |
| ρ | density [kg m−3] |
| σ | surface tension [N m−1] |
| Subscripts | |
| f | frictional |
| i | inner |
| in | at the inlet |
| L | of the saturated liquid |
| out | at the outlet |
| PC | at the pre-condenser |
| r | reduced |
| ref | of the refrigerant |
| sat | saturated |
| TS | in the test section |
| V | of the saturated vapor |
| vs | of the superheated vapor |
| w | of the water |
| wall | at the wall |
References
- Hodnebrog, O.; Etminiam, M.; Fuglestvedt, J.S.; Marston, G.; Myhre, G.; Nielsen, C.J.; Shine, K.P.; Wallington, T.J. Global warming potentials and radiative efficiencies of halocarbons and related compounds: A comprehensive review. Rev. Geophys. 2013, 51, 300–378. [Google Scholar] [CrossRef]
- Matkovic, M.; Cavallini, A.; Del Col, D.; Rossetto, L. Experimental study on condensation heat transfer inside a single circular minichannel. Int. J. Heat Mass Transf. 2009, 52, 2311–2323. [Google Scholar] [CrossRef]
- Zhang, H.Y.; Li, M.J.; Liu, N.; Wang, B.X. Experimental investigation of condensation heat transfer and pressure drop of R22, R410A and R407C in mini.tubes. Int. J. Heat Mass Transf. 2012, 55, 3522–3532. [Google Scholar] [CrossRef]
- Guo, Q.; Li, M.; Gu, H. Condensation heat transfer characteristics of low-GWP refrigerants in a smooth horizontal mini tube. Int. J. Heat Mass Transf. 2018, 126, 26–38. [Google Scholar] [CrossRef]
- Azzolin, M.; Bortolin, S.; Del Col, D. Convective condensation at low mass flux: Effect of turbulence and tube orientation on the heat transfer. Int. J. Heat Mass Transf. 2019, 144, 118646. [Google Scholar] [CrossRef]
- Azzolin, M.; Berto, A.; Bortolin, S.; Moro, L.; Del Col, D. Condensation of ternary low GWP zeotropic mixtures inside channels. Int. J. Refrig. 2019, 103, 77–90. [Google Scholar] [CrossRef]
- Murphy, D.L.; Macdonald, M.P.; Mahvi, A.J.; Garimella, S. Condensation of propane in vertical minichannels. Int. J. Heat Mass Transf. 2019, 137, 1154–1166. [Google Scholar] [CrossRef]
- Gao, L.; Honda, T.; Koyama, S. Experiments on flow boiling heat transfer of almost pure CO2 and CO2-oil mixtures in horizontal smooth and microfin tube. HVAC&R 2007, 13, 415–425. [Google Scholar]
- Kim, Y.J.; Cho, J.M.; Kim, M.S. Experimental study on the evaporative heat transfer and pressure drop of CO2 flowing upward in vertical smooth and micro-fin tubes with the diameter of 5 mm. Int. J. Refrig. 2008, 31, 771–779. [Google Scholar] [CrossRef]
- Dang, C.; Haraguchi, N.; Hihara, E. Flow boiling heat transfer of carbon dioxide inside a small-sized microfin tube. Int. J. Refrig. 2010, 33, 655–663. [Google Scholar] [CrossRef]
- Qu, W.; Mudawar, I. Measurement and correlation of critical heat flux in two-phase micro.channel heat sinks. Int. J. Heat Mass Transf. 2004, 47, 2045–2059. [Google Scholar] [CrossRef]
- Diani, A.; Campanale, M.; Cavallini, A.; Rossetto, L. Low GWP refrigerants condensation inside a 2.4 mm ID microfin tube. Int. J. Refrig. 2018, 86, 312–321. [Google Scholar] [CrossRef]
- Bashar, M.K.; Nakamura, K.; Kariya, K.; Miyara, A. Experimental study of condensation heat transfer and pressure drops inside a small diameter microfin and smooth tube at low mass flux condition. Appl. Sci. 2018, 8, 2146. [Google Scholar] [CrossRef]
- Diani, A.; Cavallini, A.; Rossetto, L. R1234yf flow boiling heat transfer inside a 2.4 mm microfin tube. Heat Transf. Eng. 2017, 38, 303–312. [Google Scholar] [CrossRef]
- Jige, D.; Inoue, N. Flow boiling heat transfer and pressure drop of R32 inside 2.1 mm, 2.6 mm and 3.1 mm microfin tubes. Int. J. Heat Mass Transf. 2019, 123, 566–573. [Google Scholar] [CrossRef]
- Hirose, M.; Jige, D.; Inore, N. Optimum fin geometries on condensation heat transfer and pressure drop of R1234ze(E) in 4 mm outside diameter horizontal microfin tubes. Sci. Technol. Built Environ. 2019, 25, 1271–1280. [Google Scholar] [CrossRef]
- Heredia-Aricapa, Y.; Belman-Flores, J.M.; Mota-Babiloni, A.; Serrano-Arellano, J.; Garcìa-Pablon, J.J. Overview of low GWP mixtures for replacement of HFC refrigerants: R134a, R404A and R410A. Int. J. Refrig. 2020, 111, 113–123. [Google Scholar] [CrossRef]
- Kedzierski, M.A.; Lin, L.; Kang, D. Pool boiling of low-global warming potential replacements for R134a on a reentrant cavity surface. J. Heat Transf. 2018, 140, 121502. [Google Scholar] [CrossRef]
- Diani, A.; Rossetto, L. R513A flow boiling heat transfer inside horizontal smooth tube and microfin tube. Int. J. Refrig. 2019, 107, 301–314. [Google Scholar] [CrossRef]
- Diani, A.; Rossetto, L. Characteristics of R513A evaporation heat transfer inside small-diameter smooth and microfin tubes. Int. J. Heat Mass Transf. 2020, 162, 120402. [Google Scholar] [CrossRef]
- Lemmon, E.W.; Huber, M.L.; McLinden, M.O. NIST Standard Reference Database 23, NIST Reference Fluid Thermodynamic and Transport Properties, REFPROP, Version 10.0, Standard Reference Data Program; National Institute of Standards and Technology: Gaithersburg, MD, USA, 2018.
- Kline, S.J.; McKlintock, F.A. Describing the uncertainties ins single-sample experiments. Mech. Eng. 1953, 75, 3–8. [Google Scholar]
- Dittus, F.W.; Boelter, L.M.K. Heat transfer in automotive radiators of the annular type. Univ. Calif. Publ. Eng. 1930, 2, 443–461. [Google Scholar]
- Petukhov, B.S.; Popov, V.N. Theoretical calculation of heat exchange and frictional resistance in turbulent flow in tubes of an incompressible fluid with variable physical-properties. High Temper. 1963, 1, 69–83. [Google Scholar]
- Doretti, L.; Fantini, F.; Zilio, C. Flow patterns during condensation of three refrigerants: Microfin tube vs. smooth tube. Proceeding of the IIR International Conference on Thermophysical Properties and Transfer Processes pf Refrigerant, Vicenza, Italy, 31 August–2 September 2005. [Google Scholar]
- Cavalini, A.; Del Col, D.; Mancin, S.; Rossetto, L. Condensation of pure and near-azeotropic refrigerants in microfin tubes: A new computational procedure. Int. J. Refrig. 2009, 32, 162–174. [Google Scholar] [CrossRef]
- Rouhani, S.Z.; Axelsson, E. Calculation of void fraction in the subcooled and boiling region. Int. J. Heat Mass Transf. 1970, 13, 383–393. [Google Scholar] [CrossRef]
- Dobson, M.K.; Chato, J.C. Condensation heat transfer inside smooth horizontal tubes. J. Heat Transf. ASME 1998, 120, 193–213. [Google Scholar] [CrossRef]
- Shah, M.M. An improved and extended general correlation for heat transfer during condensation in plain tubes. HVAC&R Res. 2009, 15, 889–913. [Google Scholar]
- Cavallini, A.; Del Col, D.; Doretti, L.; Matkovic, M.; Rossetto, L.; Censi, G. Condensation in horizontal smooth tubes: A new heat transfer model for heat exchanger design. Heat Transf. Eng. 2006, 27, 31–38. [Google Scholar] [CrossRef]
- Dorao, C.A.; Fernandino, M. On the heat transfer deterioration during condensation of binary mixtures. Appl. Phys. Lett. 2019, 114, 171902. [Google Scholar] [CrossRef]


| Properties | R134a | R513A |
|---|---|---|
| tsat [°C] | 30 | 30 |
| psat [bar] | 7.702 | 8.211 |
| ρL [kg m−3] | 1188 | 1115 |
| ρV [kg m−3] | 37.54 | 43.50 |
| λL [W m−1 K−1] | 0.079 | 0.068 |
| λV [W m−1 K−1] | 0.014 | 0.015 |
| μL [μPa s] | 183 | 156 |
| μV [μPa s] | 11.9 | 11.8 |
| cp,L [J kg−1 K−1] | 1447 | 1436 |
| cp,V [J kg−1 K−1] | 1066 | 1092 |
| PrL [-] | 3.35 | 3.29 |
| PrV [-] | 0.885 | 0.888 |
| σ [N m−1] | 0.0074 | 0.0061 |
| pr [-] | 0.190 | 0.225 |
© 2020 by the authors. Licensee MDPI, Basel, Switzerland. This article is an open access article distributed under the terms and conditions of the Creative Commons Attribution (CC BY) license (http://creativecommons.org/licenses/by/4.0/).
Share and Cite
Diani, A.; Rossetto, L. Condensation of an Azeotropic Mixture inside 2.5 mm ID Minitubes. Fluids 2020, 5, 171. https://doi.org/10.3390/fluids5040171
Diani A, Rossetto L. Condensation of an Azeotropic Mixture inside 2.5 mm ID Minitubes. Fluids. 2020; 5(4):171. https://doi.org/10.3390/fluids5040171
Chicago/Turabian StyleDiani, Andrea, and Luisa Rossetto. 2020. "Condensation of an Azeotropic Mixture inside 2.5 mm ID Minitubes" Fluids 5, no. 4: 171. https://doi.org/10.3390/fluids5040171
APA StyleDiani, A., & Rossetto, L. (2020). Condensation of an Azeotropic Mixture inside 2.5 mm ID Minitubes. Fluids, 5(4), 171. https://doi.org/10.3390/fluids5040171