Abstract
Many industrial processes depend on the wetting of liquids on various surfaces. Understanding the wetting effects due to ultrasonic vibration could provide a means for changing the behavior of liquids on any surface. In previous studies, low-frequency surface vibrations have been used to alter wetting states of droplets by exciting droplet volume modes. While high-frequency (>20 kHz) surface vibration can also cause droplets to wet or spread on a surface, this effect is relatively uncharacterized. In this study, droplets of various liquids with volumes ranging from 2 to 70 µL were vibrated on hydrophobic-coated (FluoroSyl) glass substrates fixed to a piezoelectric transducer at varying amplitudes and at a range of frequencies between 21 and 42 kHz. The conditions for contact line motion were evaluated, and the change in droplet diameter under vibration was measured. Droplets of all tested liquids initially begin to spread out at a similar surface acceleration level. The results show that the increase in diameter is proportional to the maximum acceleration of the surface. Finally, liquid properties and surface roughness may also produce some secondary effects, but droplet volume and excitation frequency do not significantly change the droplet spreading behavior within the parameter range studied.
1. Introduction
Manipulating droplet wetting can be useful for numerous tasks such as transporting or separating solid objects [1,2,3,4]. Most coating and bonding processes also depend on wetting conditions. Wetting conditions can be altered by many methods, including surface coatings [5], surfactants [6], and electric fields [7]. Many of these methods have been widely studied, and much scientific literature exists on each one.
Vibration has been shown to affect the wetting state of liquids [8,9,10,11,12,13,14,15,16,17], but the effects are highly coupled to droplet volume, surface structure, and fluid properties. Even contact angle changes the natural frequencies of the droplet oscillation [18]. Thus, applications have been limited. In some cases, vibration-driven wetting may be preferred as it does not alter the surface chemistry or require electrical connections, but the relationship between vibration conditions and wetting changes needs to be better understood.
Prior research examining the wetting effects of low-frequency vibration has focused on high amplitude vibrations that are tuned to droplet volume vibration modes. The studies can be generally split into two categories: vertical [8,9,10] and horizontal surface excitation [11,12,13,14,15,19]. Low-frequency excitations have been shown to excite droplet vibrations at the excitation frequency and multiples of it [19]. Low-frequency vibrations have also been used to alter wetting states (Cassie-Wenzel transitions) on textured surfaces [11,20]. Low-frequency vibration requires large surface amplitudes. The required input voltage to achieve higher amplitudes can be reduced by exciting a modal frequency of the droplet; however, the response would then be highly sensitive to the volume and surface tension of the liquid. Additionally, droplet shape distortion may be significant.
High-frequency vibration of droplets on smooth surfaces could provide the desired wetting effects without some of the aforementioned drawbacks. Prior work done with wetting driven by high-frequency vibration does exist [16,17,19,21,22], but many studies only provides a qualitative analysis that does not quantify the effect or elucidate the cause of the observed effects [16,17]. Many do not investigate a wide range of variables, but instead limit the study of certain variables (e.g., a fixed vibration frequency [16] and liquid properties [16,21]). In the author’s prior work [23] wetting transitions were induced on smooth hydrophobic surfaces when droplets were vibrated with a swept sine wave input over a range of high frequencies (>10 kHz). Droplets spread at local peaks in the vibration amplitude corresponding to modal vibrations of the transducer. These transitions appeared to be unique as droplet spreading occurred without perceptible contact angle (CA) oscillation or excitation of droplet volume modes. However, the conditions for droplet spreading were not quantified. Recent work has shown that ultrasonic vibrations produced oscillations at frequencies significantly below the excitation frequency but did not note any spreading response possibly due to differences in excitation magnitude [19].
This current work examines the conditions under which ultrasonic (>20 kHz) vibration initiates the spreading of droplets on smooth hydrophobic surfaces and quantifies the degree of spreading due to the vibrations. This is accomplished by observing droplet spreading on a super hydrophobic substrate oscillated at a constant frequency and increasing amplitude.
2. Materials and Methods
The experimental setup is illustrated in Figure 1. Glass substrates were coated with FluoroSyl 3750 hydrophobic fluoropolymer (Cytonix, Beltsville, MD, USA) by the methods detailed in [24]. This coating was shown to provide stable wetting characteristics under both prolonged water exposure and intense ultrasonic vibration [24]. The smooth glass slides have very little inherent roughness; however, measurement of the coating’s roughness with atomic force microscopy (DI-3000, Digital Instruments, Santa Barbara, CA, USA) indicates the average (Ra) and root-mean-square (Rq) roughness values are 18 and 26 nm with a standard deviation of 5 and 9 nm respectively. The coating exhibits a range of distinct surface features [24] that can be measured with atomic force microscopy (Figure 2).
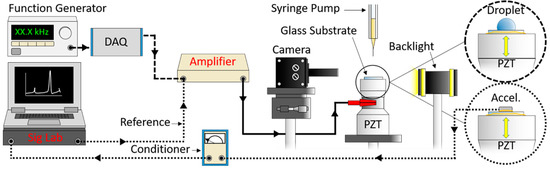
Figure 1.
Droplets were vibrated via an ultrasonic transducer with a stepped sine wave signal of increasing amplitude (5 V/s) from zero to 300 V. Backlit images of vibrating droplets were recorded at 30 frames/s (dashed lines). Surface vibration was measured with an accelerometer by using a dynamic analyzer to compute the ratio of the cross-spectrum and the reference auto spectrum to obtain the frequency response (dotted lines).
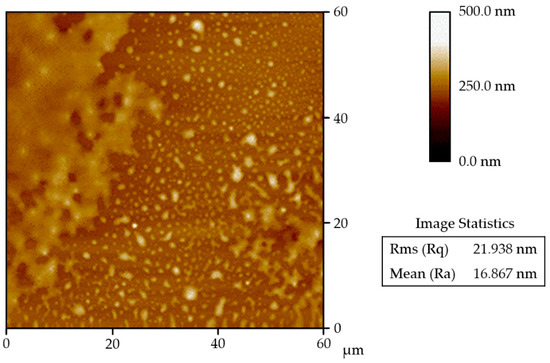
Figure 2.
Typical surface topology of FluoroSyl coated on a smooth glass substrate taken with atomic force microscopy. Roughness values are shown for this specific scan.
Coated glass slides were mounted on a piezoelectric transducer with UV light-cure adhesive (Loctite 4310, Loctite, Rocky Hill, CT, USA). The adhesive was exposed with UV light (365 nm wavelength and 3 mW/cm2) for ~5 min and then allowed to cure for ~24 h. Droplets of liquid (2 to 70 µL) were pumped (Legato 180, KD Scientific, Hilliston, MA, USA) on to the coated glass substrate with an accuracy of ±0.35%. A sine wave signal was produced by a function generator (33250A, Agilent, Wilmington, DE, USA), and input to a signal conditioner/digital-analog converter (DAQ) (USB-6343, LabVIEW, Austin, TX, USA). A trigger switch initiated the increase of the driving signal amplitude (voltage) while simultaneously initiating image acquisition. The signal was output from the DAQ to a high-frequency amplifier (PZD350A, Trek, Lockport, NY, USA) with a gain of 100x. The resulting sine wave signal that powers the transducer has a stepped amplitude that increases from zero to 300 V in 5 V increments over 60 s with a 1 s dwell at each voltage.
Droplets were imaged with an exposure time of 1 µs with a high-speed camera (NX8-S2, IDT Vision, Pasadena, CA, USA) using a backlight to produce a high-contrast droplet surface profile. A frame rate of 30 frames/s was used except where noted. A MATLAB edge detection algorithm [25,26,27,28] was used to measure the CA and the diameter of the droplet at the contact line. This procedure was performed once for each combination of liquid, droplet volume, and vibration frequency across a range of 21–42 kHz using the same vibrating transducer (unless otherwise noted). Above 42 kHz, atomization of droplets was observed under spreading conditions.
Contact angles of the treated surfaces were measured using the sliding angle (tilted plate) method. A droplet initially rests on a surface oriented orthogonally to the gravitational direction. The surface was tilted while the droplet shape was imaged. The advancing () receding angle () were taken as the angle formed at the leading and trailing edge of the droplet just before each edge becomes unpinned and moves down the surface. The CA hysteresis was taken as the angle difference between the advancing and receding angles.
The frequency response of vibrating surfaces were measured by removing the hydrophobic coating from the glass substrate, and subsequently fixing a small adhesive-mount accelerometer (Model: 352A92, PCB Piezotronics, Depew, NY, USA) to the surface following the same procedure previously discussed for bonding substrates. The signal from the accelerometer was conditioned and then processed by a dynamic analyzer (Model 50-21, SigLab, Fremont, CA, USA) that computes the ratio of the cross-spectrum and the reference auto spectrum to obtain the surface frequency response (Figure 1).
Measured surface acceleration () levels at a given frequency () were used to estimate the vibration amplitude ()
and approximate maximum surface velocity ()
at a given frequency. The vibration intensity was characterized at driving voltages of 50, 100, 150, 200, 250, and 300 V in precisely the location on the glass substrate where droplets were vibrated. Acceleration at intermediate voltages was estimated by linear interpolation of the frequency response between the measured values.
Four different liquids were used throughout testing: deionized water, a 3:5 volume ratio water/glycerol mixture, ethylene glycol, and propylene glycol. The density, surface tension, and dynamic viscosity for all four liquids at room temperature (20–25 °C) are presented in Table 1 [29,30,31,32,33,34,35,36]. The different liquids were chosen to investigate the effects of density, surface tension, and viscosity. The vibration frequencies, droplet volumes, liquid, and piezoelectric transducer used during testing to investigate the wetting effects of ultrasonic vibration are recorded in Table A1, Table A2, Table A3, Table A4, Table A5, Table A6, Table A7, Table A8 and Table A9 in Appendix A. This data is available in the supplementary materials. This information may be used to understand the underlying causes of the wetting effects and ultimately enable the prediction or control of wetting of liquids in general circumstances using ultrasonic vibration.

Table 1.
The properties of four liquids at room temperature (20–25 °C) used in testing [29,30,31,32,33,34,35,36].
Acceleration measurement was a significant cause for data inaccuracies. The accelerometer datasheet reports a measurement uncertainty of ±10% for frequencies up to 20 kHz [37]. Uncertainty was assumed >±10% in the testing frequency range above 20 kHz. The interpolation of acceleration response between measured input voltage introduces additional uncertainty in the acceleration estimates, especially near resonance frequencies where the response was non-linear. The amount of uncertainty varied over the frequency range and was difficult to quantify. Because the acceleration uncertainty would be highest at resonant frequencies where frequency response was non-linear, data taken precisely at these frequencies were excluded from the analysis.
The mode shapes of the vibrating substrates at specific frequencies may also cause droplets to move along the surface to nodal positions or locations where the vibration is orthogonal to the surface. This was relatively uncommon, but vibration frequencies, which caused significant droplet movement on the surface were also excluded due to the varying levels of surface acceleration over the vibrating surface.
Twenty-four-hour adhesive cures were demonstrated to produce stable frequency response measurements using an accelerometer (<4.1% average variation between successive measurements) [38]. Under extreme acceleration, the partial failure of adhesive could occur but was typically detectable by anomalous vibration response or audible cues.
3. Results
Experimental data are plotted in Figure 3 as the ratio of droplet diameter to initial droplet diameter (d/di) against surface acceleration (am) for 294 combinations of liquid, droplet volume, and vibration frequency detailed in Table A1, Table A2, Table A3 and Table A4. A linear least squares regression for each droplet volume and vibration frequency for each liquid illustrates the general effect of spreading. Droplet spreading is indicated when d/di exceeds unity, but was only considered if d/di exceeded 1.075. This number was chosen only to reduce the noise of droplet diameter measurements as a result of contact line oscillations. There is variation in the droplet response, but generally in each instance d/di increases proportionally with surface acceleration, and droplet spreading initiates when surface acceleration levels exceed a threshold (~20,000 m/s2). Figure 4 shows examples of raw droplet spreading data for two droplets of deionized water. The initiation of spreading (noted as a black ‘x’) was determined with a post-processing algorithm that referenced the surface frequency response and calculated the acceleration at which the diameter of the droplet began to increase beyond the oscillation of the contact line. This threshold was relatively similar for all combinations of fluids, droplet sizes, and vibration frequencies. This is a significant departure from droplet spreading at low frequencies where spreading is very sensitive to droplet volume, liquid type, and vibration frequency [8,10,12,13,14,15].
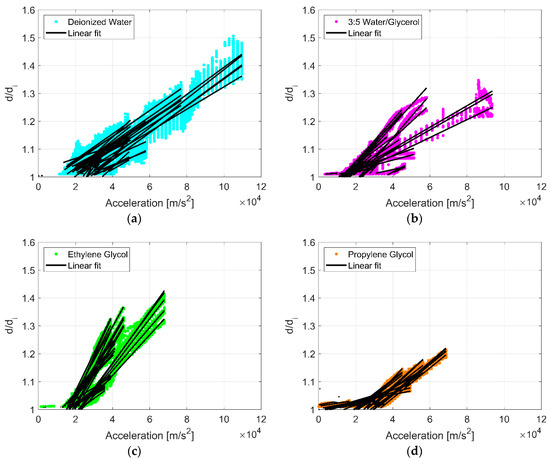
Figure 3.
The ratio of droplet diameter to initial droplet diameter (d/di) plotted against surface acceleration () for all combinations of liquid, droplet volume, and vibration frequency: (a) deionized water, (b) water/glycerol, (c) ethylene glycol, and (d) propylene glycol. A linear least squares regression for each droplet volume and vibration frequency for each liquid are plotted in black. Droplet spreading is indicated when d/di exceeds unity, but was only considered if d/di exceeded 1.075.
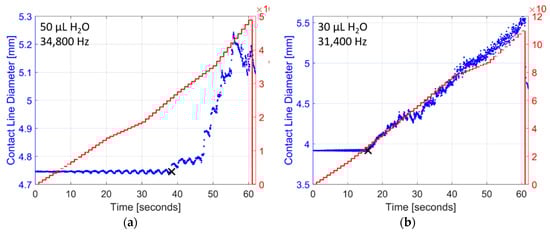
Figure 4.
Examples of raw droplet spreading data collected while vibrating droplets of deionized water with a ramped sine wave signal increasing in amplitude (5 V/s) from zero to 300 V: (a) a 50 µL droplet vibrated at 34.8 kHz, and (b) a 30 µL droplet vibrated at 31.4 kHz. The diameter of each individual droplet begins to increase once acceleration levels are sufficiently high. The initiation of droplet spreading is calculated using a post-processing algorithm and is noted as a black ‘x’ in each example. In most cases the droplet diameter increases linearly with the acceleration response, but stick-slick contact line motion can also occur as observed in (a) after the initiation of droplet spreading.
3.1. Droplet Volume, Vibration Frequency, and Transducer Frequency Response
Figure 5 summarizes the acceleration at which spreading initiated as a function of the input frequency for water droplets on two different transducers. Low-frequency vibration has been shown to be dependent on input frequency, but the spreading initiation for ultrasonically vibrated droplets of deionized water (black markers) is relatively constant across a wide range of excitation frequencies and droplet volumes. For reference, the measured acceleration response of each transducer is overlaid (PZT 1 and PZT 2 in Figure 5). Surface acceleration varies with vibration frequency as a result of the characteristic resonance of each transducer. Droplet spreading initiates independently of vibration frequency and droplet size if surface acceleration is sufficient (~20,000 m/s2). The frequency and shape of droplet vibration modes are dependent on droplet volume, but the initiation of ultrasonic spreading is not dependent on volume. The initiation of droplet spreading appears to vary more at frequencies near a transducer resonance where the acceleration levels are higher, and the response to the driving signal is non-linear; an inherent effect of resonance. This increased variation may be attributed largely to uncertainty in the linear interpolation of surface acceleration values between measured values near a resonance frequency.
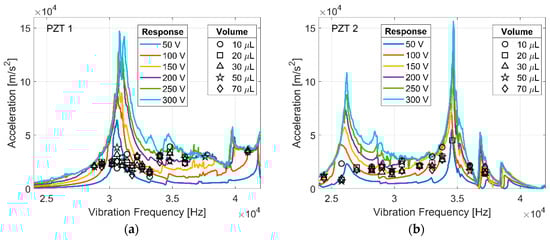
Figure 5.
The frequency response (colored lines) of PZT 1 (a), and PZT 2 (b) at varying driving amplitudes, and the acceleration at which ultrasonic spreading was initiated (black markers) for deionized water droplets.
The effects of ultrasonic vibration on droplets do decrease in smaller droplets when surface tension forces begin to dominate the inertial forces caused by ultrasonic vibration. The spreading acceleration (as), defined as the acceleration normal to the solid surface that is required to initiate droplet spreading, and the slope of the best fit line ((d/di)/am) for 2–70 µL droplets of deionized water is recorded in Table 2. Small droplets of deionized water (4 µL) appear to require increasing surface acceleration to initiate spreading while 2 µL droplets did not spread sufficiently for an estimation of onset or slope. There is not a clear change in the slope of the spreading response until droplet volumes exceed 4 µL. The relative impact of surface tension affects can be seen from the Bond number (, where is defined as the acceleration of gravity, and as droplet diameter). The variable ‘’ in this parameter was defined as the gravitational acceleration because the vibration acceleration does not cause bulk motion of the droplet. For deionized water, the increase in the acceleration threshold required for spreading occurs at Bond numbers less than Bo ~ 1. This suggests that droplet spreading with ultrasonic vibration is dependent on microscopic effects at the contact line and not macroscopic effects that would typically show a strong volume dependency.
Table 2.
The spreading slope ((d/di)/am) and spreading acceleration (as) for 2–70 µL droplets of deionized water.
3.2. Material Properties
The density, surface tension, and dynamic viscosity of all four test liquids are summarized in Table 1. The density of all four liquids is within 20%. There is approximately a factor of 2 difference in the range of surface tensions, and more than 1 order of magnitude difference in dynamic viscosity. To differentiate the response of each liquid, the spreading slope and spreading acceleration for all 4 liquids are recorded in Table 3. This table conveys the significant standard deviation in the experimental measurements.
Table 3.
The spreading slope ((d/di)/am) and spreading acceleration (as) for all 4 liquids.
Droplets of water/glycerol are comparable in surface tension (67 mN/m) and density (1172 kg/m3) to water, but its dynamic viscosity (20 cP) is 17x larger. This sizeable dynamic viscosity difference is also apparent between water and both glycol liquids (18x and 65x for ethylene glycol and propylene glycol respectively). Thus, any differences in the response between water and the other liquids would most likely be attributed to dynamic viscosity. Surface tension controls the interactions between the liquid, solid, and gas interfaces, and could likewise affect droplet spreading. Density variations could dynamically affect droplets by increasing or decreasing inertial forces, but a 20% difference may be too small to discern relative to acceleration uncertainty and other variations.
The average spreading slope for all liquids tested is 6.0 × 10⁻⁶ (m/s2)−1 and does not appear to strongly correlate with any liquid property, so the variation between liquids may be due to acceleration measurement error and/or stick-slip contact line motion (Figure 4a) caused by local surface roughness differences. The spreading acceleration may also be affected by acceleration measurement error and surface roughness, but requires more analysis to determine if it is influenced by variables other than surface acceleration.
3.3. Surface Roughness
While the bulk of the testing was done on glass slides, most practical surfaces have significant texture. A surface variation could cause significant differences and could be partly responsible for inconsistencies caused by varying contact line conditions during droplet spreading. To perform a preliminary assessment of the impact of roughness, artificially rough surfaces (created by abrading the surface with various grit sandpaper before coating with FluoroSyl) were used to investigate the effect of surface roughness. The average Ra and Rq values of the roughened hydrophobic coated surfaces are compared to the spreading slope and spreading acceleration for 10–70 µL droplets of deionized water in Table 4. The mean spreading slope increases with roughness (droplets spread further at a specific level of surface acceleration), while the average value acceleration required for onset of spreading appears to decrease with roughness. The standard deviations are larger relative to the mean values in the roughened surfaces compared to the smooth surfaces. This prevents firm conclusions regarding this effects. This variation is likely due to the stochastic nature of the surface roughness created from the sandpaper. Improved understanding could be obtained by repeating using more repeatable photolithographically defined textures.
Table 4.
Average Ra and Rq values of hydrophobic coated surfaces compared to spreading slope ((d/di)/am) and spreading acceleration (as) for 10–70 µL droplets of deionized water.
The advancing and receding CA for deionized water on each roughened surface is shown in Figure 6. Increasing surface roughness effectively increases the advancing CA, receding CA, and the hysteresis (suggesting that increased surface roughness may promote a mixed wetting state with partial wetting into the surface roughness features). Droplets that spread to an apparent wetting CA below the receding angle of the surface during vibration recede to some degree after vibration is ceased. The resultant equilibrium CA formed by a droplet after vibration is ceased is the droplet retraction CA (plotted as an “x”). The retraction CA on the smooth surface usually remains well within the hysteresis range. However, the retraction angle of droplets vibrated on roughened surfaces retract closer to the receding CA or even remain below the receding CA. Surface features on the roughened surface thereby act to pin the contact line after vibration is ceased and thus maintain a larger spread area. This effect may be useful for effecting permanent wetting changes, wetting droplets to the receding angle of the surface consistently, or even promoting reversible wetting states. Most importantly, it appears that even small features on the surface of the coating may cause significant variation in the behavior of droplets during vibration. This is seen in the increased in variation of the spreading slope with roughness.
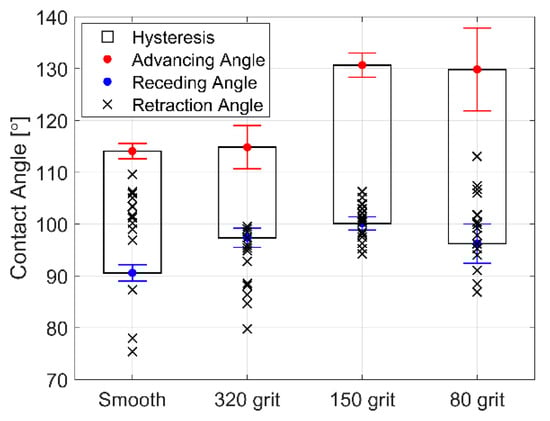
Figure 6.
Ra Contact angle (CA) hysteresis, as well as advancing and receding CAs for deionized water on smooth and roughened surfaces coated with FluoroSyl. The final CAs of spread droplets after vibration (retraction angle) are plotted as an “x”.
3.4. Non-Dimensional Analysis
Non-dimensional analysis using the Buckingham pi theorem [39] was applied to the empirical data collected to investigate droplet spreading initiation. The initiation of droplet spreading appears to be dictated by the level of surface acceleration, but may also depend on variables like liquid density (), viscosity (), surface tension (), CA (θ), droplet diameter (), and vibration frequency () (CA is a dimensionless variable and is added to surface tension to form a single variable (θ)). To determine the functional relationship between droplet diameter () and the rest of the independent variables, , pi terms () are formed:
Plotting illustrates the threshold for droplet spreading (Figure 7). A dot represents variable conditions for droplets at the initiation of spreading. A linear regression of the log-log data is plotted though this data. An “x” represents variable conditions for droplets that did not spread. Data for droplets that did not spread remain mostly above the line formed by the dots in the plot of versus . Using this information could be useful to predict the level of surface acceleration that would initiate droplet spreading if the vibration frequency and physical properties of the liquid were known.
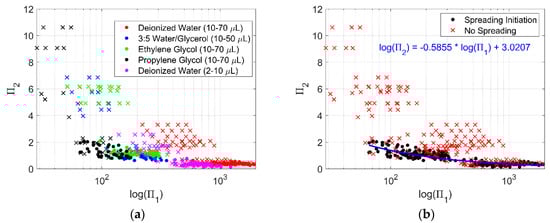
Figure 7.
plotted against . (a) Data plotted as dots represent variable conditions at the initiation of droplet spreading for each corresponding liquid, while the data plotted as an “x” represent variable conditions when droplets for each corresponding liquid did not spread. (b) The same data as (a), but without differentiating between liquid. A black dot represents the point where spreading initiated, a red “x” are conditions without spreading. A linear regression of the log-log data for the condition where droplets begin to spread is shown in blue with the equation noted in (b).
4. Discussion
Prior work with low-frequency vibrations [8,9,10] attributes droplet spreading to CA oscillation in excess of the advancing angle. These oscillations are typically a result of the excitation of the droplet volume mode. Ultrasonic excitation causes limited excitation of droplet volume modes observed in [19], but the amplitude is too small to cause spreading. However it is possible that spreading due to ultrasonic excitation could be caused by droplet capillary or surface waves that create microscopic oscillations of the CA.
Figure 8 shows spreading (before, during, and after) for different liquid droplets (video examples for vibrated droplets of each liquid can be found in the supplementary materials: Videos S1–S4). Small capillary waves are visible on the surface of droplets of all liquids tested when spreading occurs in both the distortion of the backlight diffracting through the droplet, and along the profile of the drople, especially at the contact line. The waves can be resolved with high magnification and high-frequency imaging (video of vibrated droplets of water imaged at high frequencies can be found in the supplementary materials: Videos S5 and S6). However, these waves are only easily discernable in the contact line images for the lowest viscosity fluid, deionized water (Figure 8 inset, top row).
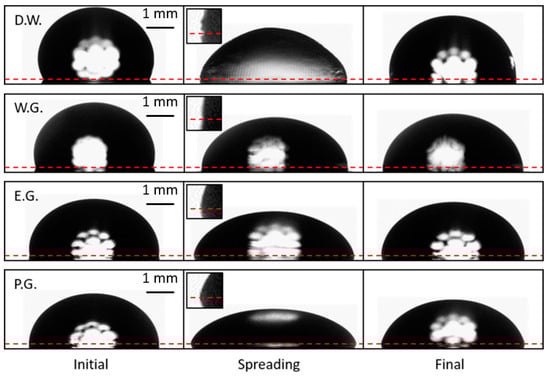
Figure 8.
Ultrasonic spreading of deionized water (D.W.), 3:5 water/glycerol (W.G.), ethylene glycol (E.G.), and propylene glycol (P.G.) droplets. Droplets were not vibrated in the initial or final state. The horizontal dashed line is plotted through the triple point at each side of the droplet. The inset images magnify the triple point to clarify the CA oscillations produced by the surface waves if they are resolvable. Small capillary waves were observed on the surface of all liquids tested, however they are most apparent on the surface of deionized water droplets (inset, top row).
High-speed imaging at frame rates equal to the vibration frequency (e.g., a droplet vibrated at 30 kHz and imaged at 30,000 fps) reveal a standing wave on the surface deionized water droplets at the contact line (Video S7). This is evidence of the liquid and solid coupling at the contact line and may suggest the surface waves originate around the contact line, however they are difficult to track due to the complex dynamics of the surface waves in 2-dimensions. Even further magnification was used in order to better resolve microscopic surface waves, however loss of light becomes an issue with increased magnification. High speed video of water droplets imaged at frequencies over 2.5x vibration frequency enables investigation of the dynamics of the surface waves without introducing aliasing effects. A 10 µL droplet of deionized water that was vibrated at frequencies from 21 to 23 kHz and imaged at 60 kHz (Video S8) was observed to generate a surface wave at the contact line of the droplet at a frequency of 21.4 and 22.7 kHz (average of 10 measurements) corresponding to the vibration frequency. This is a strong correlation and additional investigation over a range of frequencies and droplet volumes would be insightful. However, significantly higher frame rates would be required to image droplets vibrated at higher frequencies. This is in contrast to the work in [19] where much lower contact angle oscillation frequencies were observed. This apparent difference may be due to aliasing as a result of the lower imaging frequency used in the prior work, difference in vibration direction (horizontal [19] versus vertical excitation in this work), or lower vibration amplitudes.
In addition to frequency, the wavelength of surface waves was approximately measured from images for 10–70 µL droplets of deionized water vibrated at frequencies between 20 and 50 kHz. The measurements were found to agree on average within 3.5% of the well-known dispersion relation for 1-D capillary waves on a flat liquid surface (Figure 9) [40]:
The accuracy of the 1D model may decrease at smaller droplet volumes as the relative size of wavelength to droplet arc length increases.
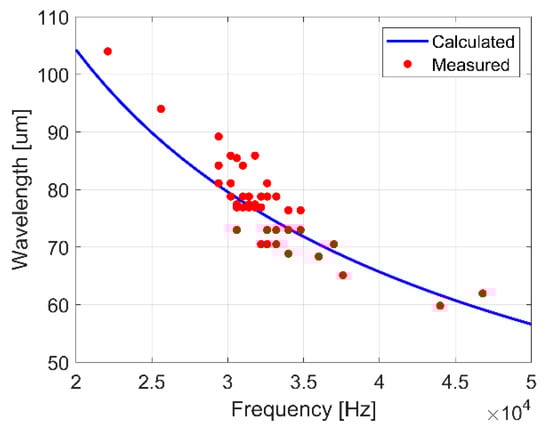
Figure 9.
Comparison of the calculated wavelength for 1-D capillary waves on a flat liquid surface to measured wavelengths for surface waves on 10–70 µL droplets of deionized water vibrated at frequencies between 20 and 50 kHz.
The amplitude of the capillary waves is more challenging to resolve, however the waves adjacent to the solid surface may be approximated using equation (1) due to the no-slip condition at the solid-liquid boundary defined by the contact line of the droplet. Typical surface acceleration at the initiation of spreading (~20,000 m/s2) is a result of vibration amplitudes between ~40 and 10 µm at 21 and 42 kHz respectively. Surface waves of this amplitude could generate sufficient CA oscillation (exceeding the advancing angle) that would cause droplets to spread similarly to droplets excited by low-frequency vibration [8,10]. However, approximating the CA oscillation and wave amplitude with digital image processing is difficult due to insufficient imaging resolution and viscous damping effects that rapidly attenuate the surface waves. Droplets sufficiently smaller than the capillary length appear to be pinned in place during ultrasonic vibration. The cause of this is unknown, but it could be in part due to the larger relative surface features of a non-ideal surface and surface tension forces that dominate the inertial effects of the surface waves generated by vibration.
The low viscosity of deionized water droplets enables crude approximation of amplitude and CA during spreading using digital image processing (Figure 10).
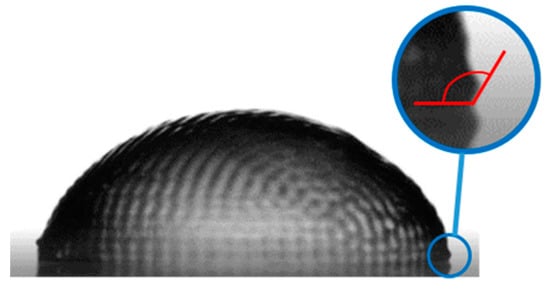
Figure 10.
Surface waves on a 20 µL droplet of deionized water as a result of CA oscillation during spreading (vibration frequency and surface acceleration are 32 kHz and ~50,000 m/s2 respectively). The angle is shown to indicate the location of the solid surface and to demonstrate how the contact angle is accordingly measured.
For deionized water droplets, the approximate wave amplitude measured at the contact line from the images agrees well with equation 1 that approximates the amplitude of the vertical motion of the transducer. However, measurement error may be 10% or higher due to image resolution. Measurement of CA as droplets of deionized water begin to spread indicates that the contact line periodically exceeds the advancing angle. This suggests that ultrasonic spreading of the low viscosity fluids may be caused by microscopic CA oscillations that likely occur below the imaging resolution in most cases. If similar waves drive spreading of the higher viscosity fluids, the magnitude is much smaller and not be observable optically. Smaller amplitude surface waves would logically correlate with smaller angles of contact line oscillation and higher surface accelerations required to spread high viscosity droplets, however the opposite effect is observed. This could be a result of a viscous delay in droplet retraction of higher viscosity liquids that facilitates spreading of higher viscosity droplets. However, viscosity also seems to lower the maximum relative diameter to which a droplet can effectively spread. This is likely due to the attenuation of surface wave amplitude (and thus contact angle oscillation) which is increasingly required in order to exceed the advancing angle as the droplet spreads and lowers its overall, static contact angle. This also raises the possibility of an alternative spreading mechanism that is not dependent on contact angle oscillations exceeding the advancing contact angle. The authors are unaware of previous reports of these effects.
5. Conclusions
This work shows that ultrasonic vibration can be an effective way of controlling the spreading droplets of a wide property range. The method is relatively insensitive to excitation frequency and is practical on both smooth and rough surfaces. Droplets consistently spread with an increased diameter of over 20% (corresponding to an area increase of 50% or more based on a circular approximation) due to ultrasonic surface vibration.
In spite of significant measurement error, an approximation for initiation and subsequent spreading of droplets by ultrasonic vibration has been determined empirically. The spreading initiation for droplets of any liquid tested strongly depends on the level of surface acceleration, and was determined using non-dimensional analysis. Above the spreading threshold, the droplet diameter increases proportionally to surface acceleration at 6.0 × 10⁻⁶ (m/s2)−1.
Droplet volume only effects spreading at length scales less than the capillary length of the liquid (smaller than ~ 6 µL for droplets of deionized water). Under this length scale, surface tension forces begin to dominate the dynamic forces caused by surface vibration. Ultrasonic spreading is also independent of vibration frequency, but depends on the characteristic frequency response of the transducer exciting the droplet. Droplet spreading was found to be more erratic at the higher levels of acceleration tested. Viscosity appears to be responsible for the attenuation of capillary waves that were not apparent on the surface of higher viscosity droplets, but density and surface tension do not seem to significantly affect ultrasonic spreading above the capillary length. Increasing surface roughness increases the CA hysteresis of the surface. Droplets vibrated on roughened surfaces show decreased acceleration thresholds to initiate spreading and more spreading after initiation.
Repeatability of droplet spreading would be improved with better control of surface acceleration. A hydrophobic coating that is consistently more smooth would also help to alleviate some of the variation observed during droplet spreading, however all other hydrophobic coatings tested were found to degrade due to vibration and water exposure over time [24]. This degradation manifests as a change in the coatings contact angle hysteresis under exposure to liquid water, and can be expedited when vibrated ultrasonically. Therefore, an ideal coating would need to be investigated.
Supplementary Materials
The following are available online at https://www.mdpi.com/2311-5521/5/1/18/s1, Experimental data; Video S1: A 30 µL water droplet vibrated with a ramped sine wave signal (amplitude 0 to 300 V) at 31.4 kHz, Video S2: A 30 µL water-glycerol (3:5 volume ratio) droplet vibrated with a ramped sine wave signal (amplitude 0 to 300 V) at 29.8 kHz, Video S3: A 30 µL ethylene glycol droplet vibrated with a ramped sine wave signal (amplitude 0 to 300 V) at 29.8 kHz, Video S4: A 30 µL propylene glycol droplet vibrated with a ramped sine wave signal (amplitude 0 to 300 V) at 31.4 kHz, Video S5: High speed video (10 kHz imaging frequency) of a 10 µL water droplet vibrated with a 350 V sine wave signal while sweeping the vibration frequency from 21 to 23.5 kHz; the high imaging frequency and low exposure time reveal small capillary waves moving on the surface of the droplet, Video S6: High speed video (1 kHz imaging frequency) of a 30 µL water droplet vibrated with a ramped sine wave signal (amplitude 0 to 300 V) at 41.4 kHz; droplet ejection (observed in the latter portion of the video) could occur if vibration frequencies and amplitudes were sufficiently high (although this was avoided during testing). Video S7: High speed video (30 kHz imaging frequency) of a 30 µL water droplet vibrated at 30 kHz; this video shows standing waves on the surface of the droplet at the contact line as a result of synchronizing the imaging frequency with the vibration frequency. This video suggests that surface waves may be originating around the contact line of the droplet at a frequency similar to that of vibration. Video S8: High speed video (60 kHz imaging frequency) of a 10 µL water droplet vibrated with a sine wave signal (amplitude 350 V) at frequencies from 21 to 23 kHz over 4 s; Imaging at frequencies greater than 2.5x vibration frequency is a necessity in order to resolve the dynamics of the surface waves sufficiently without introducing aliasing effects. A new surface wave is generated at the contact line of the droplet roughly every 3 frames. At an imaging frequency of 60 kHz, this corresponds to a wave frequency of 20 kHz, which is also the vibration frequency. This suggest that the vibration of the solid surface is responsible for generating the waves observed on the surface of droplet.
Author Contributions
Author contributions are as follows: conceptualization, N.C., R.G., and A.T.-M.; methodology, M.T.; software, M.T.; validation, N.C., R.G., and A.T.-M.; investigation, M.T.; resources, N.C.; data curation, M.T.; writing—original draft preparation, M.T.; writing—review and editing, N.C., R.G., and A.T.-M.; visualization, M.T.; supervision, N.C., and R.G.; project administration, N.C.; funding acquisition, N.C., R.G., and A.T.-M. All authors have read and agreed to the published version of the manuscript.
Funding
This research was funded by the National Science Foundation, grant Nos. 1361919 and 1912028.
Acknowledgments
The Nanotechnology Research and Education Center (NREC) at the University of South Florida for use of the cleanroom and characterization equipment.
Conflicts of Interest
The funders had no role in the design of the study; in the collection, analyses, or interpretation of data; in the writing of the manuscript, or in the decision to publish the results.
Appendix A
The testing parameters used for the experiments conducted for this research are shown in Table A1, Table A2, Table A3, Table A4, Table A5, Table A6, Table A7, Table A8 and Table A9 below.
Table A1.
Testing parameters used for the experiments conducted with deionized water to investigate material property effects.
Table A1.
Testing parameters used for the experiments conducted with deionized water to investigate material property effects.
| Liquid | Droplet Volume [µL] | Frequency [kHz] | PZT |
|---|---|---|---|
| Deionized Water | 10, 20, 30, 50, 70 | 24.0 | 1 |
| Deionized Water | 10, 20, 30, 50, 70 | 25.2 | 1 |
| Deionized Water | 10, 20, 30, 50, 70 | 26.0 | 1 |
| Deionized Water | 10, 20, 30, 50, 70 | 27.4 | 1 |
| Deionized Water | 10, 20, 30, 50, 70 | 28.2 | 1 |
| Deionized Water | 10, 20, 30, 50, 70 | 28.8 | 1 |
| Deionized Water | 10, 20, 30, 50, 70 | 29.4 | 1 |
| Deionized Water | 10, 20, 30, 50, 70 | 31.4 | 1 |
| Deionized Water | 10, 20, 30, 50, 70 | 31.8 | 1 |
| Deionized Water | 10, 20, 30, 50, 70 | 32.2 | 1 |
| Deionized Water | 10, 20, 30, 50, 70 | 32.6 | 1 |
| Deionized Water | 10, 20, 30, 50, 70 | 33.2 | 1 |
| Deionized Water | 10, 20, 30, 50, 70 | 34.0 | 1 |
| Deionized Water | 10, 20, 30, 50, 70 | 34.8 | 1 |
| Deionized Water | 10, 20, 30, 50, 70 | 36.0 | 1 |
| Deionized Water | 10, 20, 30, 50, 70 | 37.6 | 1 |
| Deionized Water | 10, 20, 30, 50, 70 | 38.8 | 1 |
| Deionized Water | 10, 20, 30, 50, 70 | 41.0 | 1 |
Table A2.
Testing parameters used for the experiments conducted with water/glycerol to investigate material property effects.
Table A2.
Testing parameters used for the experiments conducted with water/glycerol to investigate material property effects.
| Liquid | Droplet Volume [µL] | Frequency [kHz] | PZT |
|---|---|---|---|
| 3:5 Water/Glycerol | 10, 30, 50 | 24.0 | 1 |
| 3:5 Water/Glycerol | 10, 30, 50 | 24.8 | 1 |
| 3:5 Water/Glycerol | 10, 30, 50 | 25.6 | 1 |
| 3:5 Water/Glycerol | 10, 30, 50 | 26.0 | 1 |
| 3:5 Water/Glycerol | 10, 30, 50 | 26.6 | 1 |
| 3:5 Water/Glycerol | 10, 30, 50 | 27.0 | 1 |
| 3:5 Water/Glycerol | 10, 30, 50 | 27.4 | 1 |
| 3:5 Water/Glycerol | 10, 30, 50 | 28.0 | 1 |
| 3:5 Water/Glycerol | 10, 30, 50 | 28.8 | 1 |
| 3:5 Water/Glycerol | 10, 30, 50 | 29.4 | 1 |
| 3:5 Water/Glycerol | 10, 30, 50 | 29.8 | 1 |
| 3:5 Water/Glycerol | 10, 30, 50 | 30.4 | 1 |
| 3:5 Water/Glycerol | 10, 30, 50 | 30.8 | 1 |
| 3:5 Water/Glycerol | 10, 30, 50 | 31.2 | 1 |
| 3:5 Water/Glycerol | 10, 30, 50 | 32.0 | 1 |
| 3:5 Water/Glycerol | 10, 30, 50 | 32.6 | 1 |
| 3:5 Water/Glycerol | 10, 30, 50 | 33.2 | 1 |
| 3:5 Water/Glycerol | 10, 30, 50 | 34.0 | 1 |
Table A3.
Testing parameters used for the experiments conducted with ethylene glycol to investigate material property effects.
Table A3.
Testing parameters used for the experiments conducted with ethylene glycol to investigate material property effects.
| Liquid | Droplet Volume [µL] | Frequency [kHz] | PZT |
|---|---|---|---|
| Ethylene Glycol | 10, 20, 30, 50, 70 | 24.6 | 1 |
| Ethylene Glycol | 10, 20, 30, 50, 70 | 26.8 | 1 |
| Ethylene Glycol | 10, 20, 30, 50, 70 | 29.0 | 1 |
| Ethylene Glycol | 10, 20, 30, 50, 70 | 29.4 | 1 |
| Ethylene Glycol | 10, 20, 30, 50, 70 | 29.6 | 1 |
| Ethylene Glycol | 10, 20, 30, 50, 70 | 29.8 | 1 |
| Ethylene Glycol | 10, 20, 30, 50, 70 | 30.0 | 1 |
| Ethylene Glycol | 10, 20, 30, 50, 70 | 30.4 | 1 |
| Ethylene Glycol | 10, 20, 30, 50, 70 | 31.2 | 1 |
| Ethylene Glycol | 10, 20, 30, 50, 70 | 33.2 | 1 |
| Ethylene Glycol | 10, 20, 30, 50, 70 | 35.6 | 1 |
| Ethylene Glycol | 10, 20, 30, 50, 70 | 38.8 | 1 |
| Ethylene Glycol | 10, 20, 30, 50, 70 | 41.0 | 1 |
Table A4.
Testing parameters used for the experiments conducted with propylene glycol to investigate material property effects.
Table A4.
Testing parameters used for the experiments conducted with propylene glycol to investigate material property effects.
| Liquid | Droplet Volume [µL] | Frequency [kHz] | PZT |
|---|---|---|---|
| Propylene Glycol | 10, 20, 30, 50, 70 | 24.8 | 1 |
| Propylene Glycol | 10, 20, 30, 50, 70 | 27.2 | 1 |
| Propylene Glycol | 10, 20, 30, 50, 70 | 28.6 | 1 |
| Propylene Glycol | 10, 20, 30, 50, 70 | 29.0 | 1 |
| Propylene Glycol | 10, 20, 30, 50, 70 | 29.4 | 1 |
| Propylene Glycol | 10, 20, 30, 50, 70 | 29.8 | 1 |
| Propylene Glycol | 10, 20, 30, 50, 70 | 30.2 | 1 |
| Propylene Glycol | 10, 20, 30, 50, 70 | 30.6 | 1 |
| Propylene Glycol | 10, 20, 30, 50, 70 | 31.2 | 1 |
| Propylene Glycol | 10, 20, 30, 50, 70 | 33.4 | 1 |
| Propylene Glycol | 10, 20, 30, 50, 70 | 36.2 | 1 |
| Propylene Glycol | 10, 20, 30, 50, 70 | 38.8 | 1 |
| Propylene Glycol | 10, 20, 30, 50, 70 | 42.0 | 1 |
Table A5.
Testing parameters used for the experiments conducted with deionized water to investigate the diminishing inertial effects.
Table A5.
Testing parameters used for the experiments conducted with deionized water to investigate the diminishing inertial effects.
| Liquid | Droplet Volume [µL] | Frequency [kHz] | PZT |
|---|---|---|---|
| Deionized Water | 2, 4, 6, 8, 10 | 24.2 | 1 |
| Deionized Water | 2, 4, 6, 8, 10 | 26.8 | 1 |
| Deionized Water | 2, 4, 6, 8, 10 | 27.4 | 1 |
| Deionized Water | 2, 4, 6, 8, 10 | 28.0 | 1 |
| Deionized Water | 2, 4, 6, 8, 10 | 28.6 | 1 |
| Deionized Water | 2, 4, 6, 8, 10 | 29.0 | 1 |
| Deionized Water | 2, 4, 6, 8, 10 | 29.4 | 1 |
| Deionized Water | 2, 4, 6, 8, 10 | 29.8 | 1 |
| Deionized Water | 2, 4, 6, 8, 10 | 30.2 | 1 |
| Deionized Water | 2, 4, 6, 8, 10 | 30.6 | 1 |
| Deionized Water | 2, 4, 6, 8, 10 | 31.0 | 1 |
| Deionized Water | 2, 4, 6, 8, 10 | 31.6 | 1 |
| Deionized Water | 2, 4, 6, 8, 10 | 32.2 | 1 |
| Deionized Water | 2, 4, 6, 8, 10 | 35.4 | 1 |
| Deionized Water | 2, 4, 6, 8, 10 | 38.6 | 1 |
| Deionized Water | 2, 4, 6, 8, 10 | 42.0 | 1 |
Table A6.
Testing parameters used for the experiments conducted with deionized water to investigate the effects of vibration frequency.
Table A6.
Testing parameters used for the experiments conducted with deionized water to investigate the effects of vibration frequency.
| Liquid | Droplet Volume [µL] | Frequency [kHz] | PZT |
|---|---|---|---|
| Deionized Water | 10, 20, 30, 50, 70 | 24.4 | 2 |
| Deionized Water | 10, 20, 50, 70 | 25.8 | 2 |
| Deionized Water | 20, 30, 70 | 27.0 | 2 |
| Deionized Water | 10, 20, 30, 50, 70 | 28.2 | 2 |
| Deionized Water | 20, 30, 50, 70 | 29.0 | 2 |
| Deionized Water | 10, 30, 50, 70 | 29.8 | 2 |
| Deionized Water | 10, 20, 30, 50, 70 | 30.6 | 2 |
| Deionized Water | 10, 20, 30, 50, 70 | 32.0 | 2 |
| Deionized Water | 10, 20, 30, 50, 70 | 33.0 | 2 |
| Deionized Water | 10, 20, 30, 50, 70 | 33.8 | 2 |
| Deionized Water | 20, 30, 50, 70 | 34.6 | 2 |
| Deionized Water | 10, 30, 50, 70 | 36.0 | 2 |
| Deionized Water | 10, 20, 30, 50, 70 | 37.2 | 2 |
| Deionized Water | 10, 20, 30, 50, 70 | 38.4 | 2 |
| Deionized Water | 10, 20, 30, 50, 70 | 39.6 | 2 |
| Deionized Water | 10, 20, 30, 50, 70 | 40.6 | 2 |
Table A7.
Testing parameters used for the experiments conducted with deionized water to investigate the effects of surface roughness using 320 grit sandpaper.
Table A7.
Testing parameters used for the experiments conducted with deionized water to investigate the effects of surface roughness using 320 grit sandpaper.
| Liquid | Droplet Volume [µL] | Frequency [kHz] | PZT |
|---|---|---|---|
| Deionized Water | 10, 20, 30, 50, 70 | 24.8 | 1 (320 grit) |
| Deionized Water | 10, 20, 30, 50, 70 | 26.2 | 1 (320 grit) |
| Deionized Water | 10, 20, 30, 50, 70 | 27.4 | 1 (320 grit) |
| Deionized Water | 10, 20, 30, 50, 70 | 28.2 | 1 (320 grit) |
| Deionized Water | 10, 20, 30, 50, 70 | 28.6 | 1 (320 grit) |
| Deionized Water | 10, 20, 30, 50, 70 | 29.2 | 1 (320 grit) |
| Deionized Water | 10, 20, 30, 50, 70 | 29.8 | 1 (320 grit) |
| Deionized Water | 10, 20, 30, 50, 70 | 30.4 | 1 (320 grit) |
| Deionized Water | 10, 20, 30, 50, 70 | 31.0 | 1 (320 grit) |
| Deionized Water | 10, 20, 30, 50, 70 | 31.6 | 1 (320 grit) |
| Deionized Water | 10, 20, 30, 50, 70 | 32.2 | 1 (320 grit) |
| Deionized Water | 10, 20, 30, 50, 70 | 32.8 | 1 (320 grit) |
| Deionized Water | 10, 20, 30, 50, 70 | 34.4 | 1 (320 grit) |
| Deionized Water | 10, 20, 30, 50, 70 | 36.8 | 1 (320 grit) |
| Deionized Water | 10, 20, 30, 50, 70 | 39.0 | 1 (320 grit) |
| Deionized Water | 10, 20, 30, 50, 70 | 41.6 | 1 (320 grit) |
Table A8.
Testing parameters used for the experiments conducted with deionized water to investigate the effects of surface roughness using 150 grit sandpaper.
Table A8.
Testing parameters used for the experiments conducted with deionized water to investigate the effects of surface roughness using 150 grit sandpaper.
| Liquid | Droplet Volume [µL] | Frequency [kHz] | PZT |
|---|---|---|---|
| Deionized Water | 10, 20, 30, 50, 70 | 25.2 | 1 (150 grit) |
| Deionized Water | 10, 20, 30, 50, 70 | 26.6 | 1 (150 grit) |
| Deionized Water | 10, 20, 30, 50, 70 | 27.2 | 1 (150 grit) |
| Deionized Water | 10, 20, 30, 50, 70 | 27.8 | 1 (150 grit) |
| Deionized Water | 10, 20, 30, 50, 70 | 28.4 | 1 (150 grit) |
| Deionized Water | 10, 20, 30, 50, 70 | 29.0 | 1 (150 grit) |
| Deionized Water | 10, 20, 30, 50, 70 | 29.6 | 1 (150 grit) |
| Deionized Water | 10, 20, 30, 50, 70 | 30.2 | 1 (150 grit) |
| Deionized Water | 10, 20, 30, 50, 70 | 30.8 | 1 (150 grit) |
| Deionized Water | 10, 20, 30, 50, 70 | 31.4 | 1 (150 grit) |
| Deionized Water | 10, 20, 30, 50, 70 | 32.0 | 1 (150 grit) |
| Deionized Water | 10, 20, 30, 50, 70 | 32.8 | 1 (150 grit) |
| Deionized Water | 10, 20, 30, 50, 70 | 35.2 | 1 (150 grit) |
| Deionized Water | 10, 20, 30, 50, 70 | 37.6 | 1 (150 grit) |
| Deionized Water | 10, 20, 30, 50, 70 | 40.4 | 1 (150 grit) |
Table A9.
Testing parameters used for the experiments conducted with deionized water to investigate the effects of surface roughness using 80 grit sandpaper.
Table A9.
Testing parameters used for the experiments conducted with deionized water to investigate the effects of surface roughness using 80 grit sandpaper.
| Liquid | Droplet Volume [µL] | Frequency [kHz] | PZT |
|---|---|---|---|
| Deionized Water | 10, 20, 30, 50, 70 | 25.2 | 1 (80 grit) |
| Deionized Water | 10, 20, 30, 50, 70 | 25.8 | 1 (80 grit) |
| Deionized Water | 10, 20, 30, 50, 70 | 26.4 | 1 (80 grit) |
| Deionized Water | 10, 20, 30, 50, 70 | 27.0 | 1 (80 grit) |
| Deionized Water | 10, 20, 30, 50, 70 | 27.6 | 1 (80 grit) |
| Deionized Water | 10, 20, 30, 50, 70 | 28.2 | 1 (80 grit) |
| Deionized Water | 10, 20, 30, 50, 70 | 28.6 | 1 (80 grit) |
| Deionized Water | 10, 20, 30, 50, 70 | 29.2 | 1 (80 grit) |
| Deionized Water | 10, 20, 30, 50, 70 | 29.8 | 1 (80 grit) |
| Deionized Water | 10, 20, 30, 50, 70 | 30.4 | 1 (80 grit) |
| Deionized Water | 10, 20, 30, 50, 70 | 32.0 | 1 (80 grit) |
| Deionized Water | 10, 20, 30, 50, 70 | 33.8 | 1 (80 grit) |
| Deionized Water | 10, 20, 30, 50, 70 | 36.0 | 1 (80 grit) |
| Deionized Water | 10, 20, 30, 50, 70 | 38.6 | 1 (80 grit) |
| Deionized Water | 10, 20, 30, 50, 70 | 41.0 | 1 (80 grit) |
References
- Destgeer, G.; Jung, J.H.; Park, J.; Ahmed, H.; Sung, H.J. Particle Separation inside a Sessile Droplet with Variable Contact Angle Using Surface Acoustic Waves. Anal. Chem. 2017, 89, 736–744. [Google Scholar] [CrossRef] [PubMed]
- Daniel, S.; Chaudhury, M.K.; De Gennes, P.-G. Vibration-Actuated Drop Motion on Surfaces for Batch Microfluidic Processes. Langmuir 2005, 21, 4240–4248. [Google Scholar] [CrossRef] [PubMed]
- Chong, J.; Whitehill, J.D.; Neild, A. Low-volume filling of microplate wells using vibration. Anal. Biochem. 2012, 425, 10–12. [Google Scholar] [CrossRef] [PubMed]
- Ni, Q.; Capecci, D.E.; Schlafly, M.; Crane, N.B. Robust bidirectional continuous electrowetting based on metal–semiconductor (M–S) diodes. Microfluid. Nanofluidics 2016, 20, 122. [Google Scholar] [CrossRef]
- Nakajima, A.; Hashimoto, K.; Watanabe, T. Recent Studies on Super-Hydrophobic Films. Mon. Chem. Chem. Mon. 2001, 132, 31–41. [Google Scholar] [CrossRef]
- Rosen, M.J. Wetting and Its Modification by Surfactants. In Surfactants and Interfacial Phenomena; John Wiley & Sons, Inc.: Hoboken, NJ, USA, 2004; pp. 243–276. [Google Scholar]
- Frieder, M.; Jean-Christophe, B. Electrowetting: From basics to applications. J. Phys. Condens. Matter 2005, 17, R705. [Google Scholar]
- Whitehill, J.; Neild, A.; Ng, T.W.; Martyn, S.; Chong, J. Droplet spreading using low frequency vibration. Appl. Phys. Lett. 2011, 98, 133503. [Google Scholar] [CrossRef]
- Andrieu, C.; Sykes, C.; Brochard, F. Average Spreading Parameter on Heterogeneous Surfaces. Langmuir 1994, 10, 2077–2080. [Google Scholar] [CrossRef]
- Whitehill, J.D.; Neild, A.; Stokes, M.H. Forced spreading behavior of droplets undergoing low frequency vibration. Colloids Surf. A Physicochem. Eng. Asp. 2012, 393, 144–152. [Google Scholar] [CrossRef]
- Bormashenko, E.; Pogreb, R.; Whyman, G.; Erlich, M. Resonance Cassie−Wenzel Wetting Transition for Horizontally Vibrated Drops Deposited on a Rough Surface. Langmuir 2007, 23, 12217–12221. [Google Scholar] [CrossRef]
- Manor, O.; Pismen, L.M. Effect of high-frequency in-plane substrate vibration on a three-phase contact angle. Phys. Fluids 2015, 27, 062101. [Google Scholar] [CrossRef]
- Mettu, S.; Chaudhury, M.K. Motion of Liquid Drops on Surfaces Induced by Asymmetric Vibration: Role of Contact Angle Hysteresis. Langmuir 2011, 27, 10327–10333. [Google Scholar] [CrossRef] [PubMed]
- Dong, L.; Chaudhury, A.; Chaudhury, M.K. Lateral vibration of a water drop and its motion on a vibrating surface. Eur. Phys. J. E 2006, 21, 231–242. [Google Scholar] [CrossRef] [PubMed]
- Celestini, F.; Kofman, R. Vibration of submillimeter-size supported droplets. Phys. Rev. E 2006, 73, 041602. [Google Scholar] [CrossRef]
- Vukasinovic, B.; Smith, M.K.; Glezer, A. Dynamics of a sessile drop in forced vibration. J. Fluid Mech. 2007, 587, 395–423. [Google Scholar] [CrossRef]
- Eslamian, M.; Zabihi, F. Ultrasonic Substrate Vibration-Assisted Drop Casting (SVADC) for the Fabrication of Photovoltaic Solar Cell Arrays and Thin-Film Devices. Nanoscale Res. Lett. 2015, 10, 462. [Google Scholar] [CrossRef]
- Sharp, J.S.; Farmer, D.J.; Kelly, J. Contact Angle Dependence of the Resonant Frequency of Sessile Water Droplets. Langmuir 2011, 27, 9367–9371. [Google Scholar] [CrossRef]
- Rahimzadeh, A.; Khan, T.; Eslamian, M. Experiments and modeling of nonlinear frequency response of oscillations of a sessile droplet subjected to horizontal vibrations. Eur. Phys. J. E 2019, 42, 125. [Google Scholar] [CrossRef]
- Bormashenko, E.; Pogreb, R.; Whyman, G.; Erlich, M. Cassie−Wenzel Wetting Transition in Vibrating Drops Deposited on Rough Surfaces: Is the Dynamic Cassie−Wenzel Wetting Transition a 2D or 1D Affair? Langmuir 2007, 23, 6501–6503. [Google Scholar] [CrossRef]
- Galleguillos-Silva, R.; Vargas-Hernández, Y.; Gaete-Garretón, L. Wettability of a surface subjected to high frequency mechanical vibrations. Ultrason. Sonochem. 2017, 35, 134–141. [Google Scholar] [CrossRef]
- Rahimzadeh, A.; Ahmadian-Yazdi, M.-R.; Eslamian, M. Experimental study on the characteristics of capillary surface waves on a liquid film on an ultrasonically vibrated substrate. Fluid Dyn. Res. 2018, 50, 065510. [Google Scholar] [CrossRef]
- Trapuzzano, M.A.; Crane, N.B.; Guldiken, R.; Tejada-Martínez, A. Forced Wetting of Liquids Using Ultrasonic Surface Vibration. In Proceedings of the ASME International Mechanical Engineering Congress and Exposition, Pittsburgh, PA, USA, 9–15 November 2018; Volume 1. [Google Scholar]
- Trapuzzano, M.; Crane, N.B.; Guldiken, R.; Tejada-Martínez, A. Wetting metamorphosis of hydrophobic fluoropolymer coatings submerged in water and ultrasonically vibrated. J. Coat. Technol. Res. 2019. [Google Scholar] [CrossRef]
- Trujillo-Pino, A.; Krissian, K.; Alemán-Flores, M.; Santana-Cedrés, D. Accurate subpixel edge location based on partial area effect. Image Vis. Comput. 2013, 31, 72–90. [Google Scholar] [CrossRef]
- Trujillo-Pino, A. Accurate Subpixel Edge Location. Detection of Subpixel Edges with Very High Precision in Grey Level Images. Available online: https://ww2.mathworks.cn/matlabcentral/fileexchange/48908-accurate-subpixel-edge-location?s_tid=FX_rc1_behav (accessed on 28 January 2020).
- Gal, O. Fit_Ellipse. Find the Best Fit for an Ellipse Using a Given Set of Points (a Closed Contour). Available online: https://ww2.mathworks.cn/matlabcentral/fileexchange/3215-fit_ellipse (accessed on 28 January 2020).
- Andersen, N.K. Drop Shape Analysis. Fit Contact Angle by Double Ellipses or Polynomials. Available online: https://ww2.mathworks.cn/matlabcentral/fileexchange/57919-drop-shape-analysis-fit-contact-angle-by-double-ellipses-or-polynomials?requestedDomain=en (accessed on 28 January 2020).
- PubChem Database. Propylene Glycol, CID = 1030. Available online: https://pubchem.ncbi.nlm.nih.gov/compound/1030 (accessed on 28 January 2020).
- PubChem Database. Water, CID = 962. Available online: https://pubchem.ncbi.nlm.nih.gov/compound/962 (accessed on 28 January 2020).
- PubChem Database. 1,2-Ethanediol, CID = 174. Available online: https://pubchem.ncbi.nlm.nih.gov/compound/1_2-Ethanediol (accessed on 28 January 2020).
- Cheng, N.-S. Formula for the Viscosity of a Glycerol−Water Mixture. Ind. Eng. Chem. Res. 2008, 47, 3285–3288. [Google Scholar] [CrossRef]
- Volk, A.; Kähler, C.J. Density model for aqueous glycerol solutions. Exp. Fluids 2018, 59, 75. [Google Scholar] [CrossRef]
- Calculate Density and Viscosity of Glycerol/Water Mixtures. Available online: http://www.met.reading.ac.uk/~sws04cdw/viscosity_calc.html (accessed on 28 January 2020).
- Pagliaro, M.; Rossi, M. Glycerol: Properties and Production; Springer: Berlin/Heidelberg, Germany, 2008. [Google Scholar]
- Yue, H.; Zhao, Y.; Ma, X.; Gong, J. Ethylene glycol: Properties, synthesis, and applications. Chem. Soc. Rev. 2012, 41, 4218. [Google Scholar] [CrossRef]
- Lopez-Walle, B.; Gauthier, M.; Chaillet, N. Principle of a Submerged Freeze Gripper for Microassembly. IEEE Trans. Robot. 2008, 24, 897–902. [Google Scholar] [CrossRef]
- Trapuzzano, M.A. Controlled Wetting Using Ultrasonic Vibration. Ph.D. Thesis, University of South Florida, Tampa, FL, USA, 2019. [Google Scholar]
- Munson, B.R.; Rothmayer, A.P.; Okiishi, T.H. Fundamentals of Fluid Mechanics, 7th ed.; Wiley: Hoboken, NJ, USA, 2012. [Google Scholar]
- De Gennes, P.G.F. Brochard-Wyart, and D. Quere, Capillarity and Wetting Phenomena: Drops, Bubbles, Pearls, Waves; Springer: New York, NY, USA, 2004. [Google Scholar]


© 2020 by the authors. Licensee MDPI, Basel, Switzerland. This article is an open access article distributed under the terms and conditions of the Creative Commons Attribution (CC BY) license (http://creativecommons.org/licenses/by/4.0/).