Article

Slug Translational Velocity for Highly Viscous Oil and Gas Flows in Horizontal Pipes

1
Department of Chemical and Biological Engineering, University of Sheffield, Sheffield S1 3JD, UK
2
Department of Mechanical Engineering, University of Birmingham, Dubai International Academic City, P.O. Box 341799 Dubai, UAE
3
Faculty of Engineering, University of Nottingham, Nottingham NG7 2RD, UK
4
Mewbourne School of Petroleum and Geological Engineering, University of Oklahoma, OK 73019, USA
5
Department of Mechanical Engineering, Kumasi Technical University, P.O. Box 854, Kumasi, Ghana
6
Oil and Gas Engineering Centre, Cranfield University, Bedfordshire MK43 0AL, UK
*
Author to whom correspondence should be addressed.
Fluids 2019, 4(3), 170; https://doi.org/10.3390/fluids4030170
Submission received: 27 June 2019 / Revised: 20 August 2019 / Accepted: 27 August 2019 / Published: 12 September 2019
(This article belongs to the Special Issue Recent Advances in Mechanics of Non-Newtonian Fluids)

Abstract

:
Slug translational velocity, described as the velocity of slug units, is the summation of the maximum mixture velocity in the slug body and the drift velocity. Existing prediction models in literature were developed based on observation from low viscosity liquids, neglecting the effects of fluid properties (i.e., viscosity). However, slug translational velocity is expected to be affected by the fluid viscosity. Here, we investigate the influence of high liquid viscosity on slug translational velocity in a horizontal pipeline of 76.2-mm internal diameter. Air and mineral oil with viscosities within the range of 1.0–5.5 Pa·s were used in this investigation. Measurement was by means of a pair of gamma densitometer with fast sampling frequencies (up to 250 Hz). The results obtained show that slug translational velocity increases with increase in liquid viscosity. Existing slug translational velocity prediction models in literature were assessed based on the present high viscosity data for which statistical analysis revealed discrepancies. In view of this, a new empirical correlation for the calculation of slug translational velocity in highly viscous two-phase flow is proposed. A comparison study and validation of the new correlation showed an improved prediction performance.

Graphical Abstract

1. Introduction

Recently, high viscosity oils (i.e., unconventional oil resources) have been acknowledged as one of the most important future energy sources. This is credited to the increasing world energy demand amidst depletion of lighter of hydrocarbon resources (i.e., conventional oil resources). Recent investigations, as illustrated in Figure 1, have shown that unconventional oil resources constitute the largest available world oil reserves. A good understanding and accurate prediction of high-viscous multiphase flow has become imperative since the behaviour of high viscous liquids in two-phase flowing conditions differs significantly from those of low-viscous liquids. This is needed to ensure efficient production and transportation of high-viscosity oils in pipelines.
The simultaneous flow of gases and liquids in pipelines is characterised by patterns in which the phases are spatially distributed depending on individual flow rates, pipe size and inclination. This occurs in many industrial applications such as chemical, petroleum and nuclear industries. Slug flow pattern has been the dominant flow regime for highly viscous oils occurs over a wide range of superficial velocities, thus making the knowledge of slug flow a major significance for the oil and gas industries.
The most relevant characteristic of slug flow is its intermittency. This is characterised by the intermittent flow of two distinct flow regions (i.e., slug body region and slug film region) making up the slug unit. Intermittent flows have been thoroughly studied theoretically and experimentally owing to their relevance in the oil and gas industry with much more effort dedicated to low viscous liquids. However, in recent times, there has been increasing interest in its understanding for highly viscous multiphase flows.
The equation that describes the velocity of a slug unit is a crucial closure relationship in slug flow modelling. It is required as an input parameter for the estimation of mean liquid holdup and pressure gradient [2,3]. It is also required as closure equation for slug flow models e.g., Wang et al. [4], Zhang et al. [5] and others needed for the prediction of slug flow features and pressure drop in pipes.
Recent high viscosity work by Archibong-Eso et al. [6,7] have shown significant effects on slug flow parameters (such as slug frequency, mean liquid holdup, slug body holdup) with changes in pipe internal diameter. It would therefore not be far-fetched to consider that similar changes in pipe diameter may also affect slug translational velocities.
Air-medium viscous oil ( μ = 0.1 0.584   Pa·s) experiments were performed using horizontal pipe with internal diameter of 0.0508-m [8,9] The viscosity oil was varied by changing the temperature of oil used. His investigation noted significant increase in two phase flow parameters such pressure gradient and liquid holdup as oil viscosity increases. New correlations were proposed for drift velocity and the slug frequency for high viscosity liquid.
Furthermore, the current authors [10,11,12,13] conducted experiments using high viscosity oils ranging from 0.6 to 7.0 Pa·s and gas in both horizontal and inclined experimental test facility with internal diameter of 0.025-m and 0.0762-m located within the Oil and Gas Engineering Centre at Cranfield University. Their investigations noted very significant effects of high liquid viscosity on two phase flows on slug frequency, holdup, length and translational velocities.

2. Literature Review

Nicklin et al. [14] were the first researchers to investigate elongated bubble motion in flowing liquids. They noted that translational velocity can be estimated by the superimposition of the velocity in stagnant liquid and the influence and the influence of the moving liquid. The expression below was then proposed for the estimation of bubble translational velocity in vertical flow.
V T = C 0 V m + C 1 g D
Since the second term in Equation (1) is meaningless in horizontal flow, the translational velocity in horizontal flow is denoted as;
V T = C 0 V m
where V T = Translational velocity, V D = Drift velocity, C 0 = a constant that quantifies the influence of the mixture on bubble velocity (called the distribution parameter) given as 1.2, V m = Mixture velocity, C 1 = Constant (Froude number) to evaluate drift velocity, and g = gravitational acceleration. Several other investigators have proposed different values and Equations for C 0 summarised in Table 1. We note that such an expression (Equation (2)) can be used to calculate the velocity of the liquid slug if C 0 is appropriately defined.
Quite a number of correlations have been developed in the literature from diverse experimental data sources for the determination of slug translational velocity in literature. Slug translational velocity estimation by these models (shown in Table 1) only accounts for a limited number of variables such as the distribution parameter and mixture velocity. As can be seen, the studies of Gregory and Scott [15], Mattar and Gregory [16], Dukler and Hubbard [17], Nicholson et al. [18], Dukler et al. [19], and Kouba and Jepson [20], all proposed correlations of the Nicklin [14] type, mainly based on superficial velocities, and do not have a liquid viscosity term embedded. However, only few existing [9,12,21,22,23] have indicated that the fluid properties such as the liquid viscosity have significant effects on slug translational velocity. It was noted by these studies that slug translational velocity increases as liquid viscosity increases. Furthermore, most of these investigations were carried out using liquid viscosity limited to less than 1.0 Pa·s in addition to using relatively smaller pipe internal diameter test facilities.
Other researchers have investigated the effects of fluid properties on drift velocity which forms an integral part of translational velocity as indicated in Equation (2). Most recent and notable amongst these investigators are the works of Gokcal et al. [8] and Jeyachandra et al. [24] which were conducted using an inclinable facility of internal diameter 0.0508-m for liquid viscosities that are within the range 0.0154–0.574 Pa·s. Brito et al. [22] using same test facility noted that slug translational velocity increases as liquid viscosity increases. Additionally, it is worth noting that most of these investigations were carried out using liquid viscosity oil limited to less than 1.0 Pa·s and also using relatively smaller pipe internal diameter test facilities.
Other researchers have investigated the effects of fluid properties on drift velocity which forms an integral part of translational velocity as indicated in Equation (2). Most recent and notable amongst these investigators are the works of Gokcal et al. [9] and Jeyachandra et al. [24] which were conducted using an inclinable facility of internal diameter 0.0508-m for liquid viscosities that are within the range 0.0154–0.574 Pa·s.
In recent studies, Al-Kaiyem et al. [25] and Bendiksen et al. [26] experimentally investigated slug flow in a horizontal pipeline using medium viscosities. While Al-kayiem et al. [25] carried out statistical assessment of slug body length and translational velocity using water as the liquid phase, they noted that for a fixed water velocity, the slug length and translational velocity increases with an increase in the superficial air velocity while the slug frequency decreased. Bendiksen et al. [26] utilised oil of viscosity ranging from 0.240–0.730 Pa·s in a 0.057-m ID horizontal pipe to study slug bubble velocity. The authors noted liquid viscosity has a strong effect on bubble shape and velocity.
In the present investigation, oils of varying oil viscosity in the range of 0.07–5.5 Pa·s were used to conduct an experiment which differed from the majority of experiments presented in the literature where low to medium viscosity is generally used. In this work, we also propose a new correlation that integrates the effects of liquid viscosity for the prediction of slug translational velocity has been proposed.

3. Experimental Setup

3.1. Description of Test Facility

The test facility we used for this study is situated at Cranfield University’s Oil and Gas Engineering Centre. The facility has previously been used for other slug flow studies [7,11,13,34]. It is made up of a 0.0762-m internal diameter (ID) horizontal pipe constructed from a transparent pipe with an L/D = 223. A schematic representation of the flow facility is presented in Figure 2a. It comprises of three main sections: the fluid handling section and that for the instrumentation and data acquisition. The measurement and observation section is 14 m from the pipe inlet. A separator is at the end of the pipe for phase separation.
The mineral oil used for the experiments is CYL680, manufactured by Total Limited UK, is stored in a steel metal tank of 2-m3 capacity and introduced to the test section via a T-junction by means of a progressive cavity pump manufactured by Fluid Pumps Limited, United Kingdom. The oil flow rate is metered using a Coriolis flow meter (Endress + Hauser, Promass 83F80 DN80) with an accuracy of ±0.035%. Oil recirculation to the tank is done using a bypass line before the commencement of experimental runs in order to achieve a uniform oil viscosity. The temperature of the oil is controlled using a bath circulator (Thermal Fisher) with a temperature range of 0–50 ± 0.01 °C. The oil stored in the tank is heated or cooled to a desired temperature resulting to change in oil viscosity in the tank. In the laboratory, Brookfield DV-I™ prime viscometer was used to measure oil viscosity and the obtained result compared well with the manufacturer-supplied values given in Figure 2b.
Air is pumped by a screw compressor (Anglian Compressors, Peterborough, UK) is monitored using two vortex flow meters (Prowirl 72F15 DN15, Endress + Hauser, Reinach, Switzerland) and a vortex flow meter (1.5-inch Prowirl 72F40 DN40, Endress + Hauser, Reinach, Switzerland) with different measuring ranges (0–20 and 10–130 m3/h). To avoid fluctuating air supply to the test section, the air is first charged into a 2.5-m3 and delivered at a pressure of 7 barg. Afterwards, filtered air from the compressor is afterwards injected into the test line with the aid of 2-inch steel pipe which is at L/D = 150 upstream of the observation and measurement section. The collected two-phase mixture is allowed to stay 48 h or more in the separator to reach full separation and all air bubbles were removed by agitation and buoyancy. This left the oil in the tank which was pumped for reuse.

3.2. Flow Facility Instrumentation, Data Acquisition and Processing

3.2.1. Thermocouples and Pressure Transducers

For the temperature of the experimental test fluids, J-type thermocouples manufactured by Reotemps Instruments Limited (Reotemps, San Diego, CA, USA) are used for its measurement. The thermocouples which have an accuracy of ±0.1 °C are installed at regular intervals along the test line. Pressure measurement is achieved by means of differential pressure transducers manufactured by GE Druck (Leicester, UK) and installed at 4 m and 13 m downstream of the main test line and connected. Pressure readings were obtained from differential pressure transducers, flowmeters and temperature sensors. These are saved to a PC using LabVIEW 8.6.1 (National Instruments, Austin, TX, USA). This system is comprised of a National Instruments (NI) USB-6210 (National Instruments, Austin, TX, USA) connector board interface that outputs signals from the instrumentation via BNC coaxial cables.

3.2.2. Gamma Densitometers

Gamma densitometers are devices used for measuring the density of fluids flowing in a conduit which uses a radioactive source of gamma rays and a detector. Standard gamma densitometers use 137Cs (cesium) or 241Am (americium) to induce Compton scattering. The count rate at the detector depends mainly on the density of the flowing fluids. Advantages of gamma densitometers include non-intrusiveness, and they work for non-transparent pipe sections. Moreover, they are not affected by friction or kinetic effects.
The single-beam gamma densitometers we used were manufactured by Neftemer Limited, Russia. Its major components are highlighted in Figure 3. These gamma densitometers consist of a single energy source that emits gamma rays at 662 keV known as the high-energy level (hard spectrum or hard count) and a soft spectrum that emits lower-energy gamma rays, specifically 100–300 keV. They contain Caesium-137 acquired via a sodium iodide scintillator. In this work, a proprietary data acquisition (DAQ) system was used for voltage signal acquisition. In addition, an ICP i-7188 (ICP DAS, Fresno, CA, USA) programmable logic controller was used for the conversion of the raw voltage to gamma counts (counts refer to the remaining attenuated signals after absorption through the fluid).
The Beer-Lambert Equation given in Equation (3) is used for the calculation of the liquid holdup from the linear attenuation coefficients, and is as follows:
H L = [ l n ( I M I A ) l n ( I L I A ) ]
where I M = mean gamma count from gas-liquid mixture in the pipe; I A   = mean calibrated gamma count for an empty pipe (i.e., 100% Air); I L   = mean calibrated gamma count for the pipe containing pure liquid; and H l   = Liquid holdup. A characteristic plot of the time series of the liquid holdup obtained by the gamma densitometers are presented in Figure 4a, which exhibits an intermittent slug flow behaviour. This is characterised by troughs and crests, while the crests suggest the movement of liquid slugs, the troughs regions indicate the slug film. Two gamma densitometers that we positioned at L/D = 103 and 124 were used to measure holdup. A comprehensive statistical uncertainty analysis for the densitometer measurements have earlier been presented in Baba et al. [34]. The time series data were analysed and used to calculate the slug translational velocity using Equation (4). This was achieved through cross-correlation by utilising the “xcorr” function of MATLAB’s signal processing toolbox.
V T = Δ l G a m m a   T 1 T 2 = Δ l G a m m a   τ
where τ is the time lag between the two signals determined by cross-correlation, the procedure of which is explained in the next paragraph. For the purpose of this investigation, noisy inputs associated with the acquired signals were minimised by using signal filters in MATLAB (i.e. the “smooth” function). Sample raw as well as filtered signal outputs from the gamma densitometers are presented respectively in Figure 4.
Cross-correlation which is a standard method that is used to measure the degree of similarity between two signals and for the determination of the time difference that exists between them was implemented on the two gamma densitometer signal time series as presented in Equations (5) and (6). Assuming two time series are X ( t n ) and   Y ( t n ) , where n = 0, 1, 2, 3…. N−1, then the cross-correlation coefficient is given as:
R x y ( τ ) = C x y ( τ ) C y ( 0 ) C y ( 0 )
C x y ( τ ) = 1 N τ   n 1 N τ X ( t n )   Y ( τ + t n )
where τ is the temporal lag.

3.3. Fluid Properties

Table 2 summarises the properties of the fluids used in the experiments and the test matrix. The measurement uncertainties of the listed parameters were obtained from manufacturers’ specification of flow meters, viscometer, and gamma sensor. These agreed with values obtained from repeated tests to ascertain accuracy.

4. Results

4.1. Flow Regime Map

Flow pattern maps are a means of representing local flow patterns as a function of gas and liquid velocities. Generally, these are plots of two-dimensional graphs showing separate areas corresponding to different flow patterns defined transition criteria. Undoubtedly, no universally accepted flow pattern map has been developed however, a number of flow patterns maps have been proposed by early researchers and widely used in the oil and gas industry [35,36].
In this study, flow pattern maps were constructed based on experimental observations in this study using superficial velocities of oil and gas as ordinate and abscissa respectively. Figure 5 shows the flow regime maps which highlight the effects of liquid viscosity on oil-gas two phase flow.
As can be seen in Figure 5, the flow pattern changes from intermittent region (i.e., plug and slug) to transition region (i.e., pseudo-slug) and then to separated flow region (i.e., annular flow pattern). Plug flow is observed from experimental observations within the range of superficial velocity of oil and superficial gas velocities of 0.3–1.0 m/s. Slug flow pattern is then observed as the gas phase gains more kinetic energy owing to increase in superficial gas velocity. Entrainment of droplets from the elongated liquid body occurs with increasing turbulence and this eventually leads to breaking up the liquid body into shorter ones. It is worth noting here that, the liquid viscosity range investigated showed that the intermittent region (i.e., plug flow and slug flow) dominates the flow map and even become enlarged as the viscosity of liquid increases conforming previous findings [9,10,11,37,38] and this can be attributed to the increase in shear in the pipe walls owing to viscosity effects. The intermittent flow region is also amplified as the superficial velocity of liquid increases credited to increased liquid height which enhances the formation of slug. With further increase in the gas phase resulting in reduction of the liquid fraction translates into insufficient liquid height to aid slug formation thereby initiating the transition from slug flow to annular flow (i.e., pseudo-slug) and occurs generally at 3–5 m/s superficial velocity of gas with the appearance of rolling waves at the interphase. In Figure 5c, a comparison of observed flow against the prediction of flow regime map proposed by Beggs and Brill [35] is presented. The Beggs and Brill [35] flow regime map shows some differences in the prediction of the flow regimes for the current experiments. As can be seen, the prediction of regime transition from intermittent to annular flow is over predicted by the map. This could be due to diameter difference as Beggs and Brill [35] used 1-inch and 1.5-inch diameter pipes and viscosity effects. In Figure 5d, a comparison of the flow pattern map for this study with that of Taitel and Dukler [36] shows an agreement in terms of non-existence of the stratified pattern region, the map however under predicted the annular flow region.

4.2. Mechanism of Slug Flow Formation and Liquid Viscosity on Translational Velocity

The continuous growth of disturbance waves in stratified gas-liquid flows in a test channel result in the formation of slug flow. If the velocity of the gas phase is continually increased resulting to increased momentum of the gas phase and at a suitable liquid height in the test flow line. Due to increase in momentum of the gas phase, there is a resulting decrease in interfacial pressure. The decrease in pressure results in suction forces (commonly referred to as Bernoulli Effect) that acts on the liquid phase. A combination of these forces thereby overcome the forces of gravitational as well as surface tension forces. This mechanism is known as the Kelvin-Helmholtz (K-H) instability which governs transition from stratified to slug flow. Wave peaks continue to grow eventually bridging the pipe cross-section.
Figure 6 shows a typical slug flow pattern observed in our experiments. The flow pattern is characterised by two distinct regions; the film region the slug body. As depicted, the slug front had high momentum and is highly energetic, traveling at a velocity higher than that of that the test fluid mixture velocity. As a consequence of this high velocity, the slug body accelerates the film region causing an entrainment of gas in the slug body. Furthermore, entrained gas bubbles in the liquid film around the pipe wall causes aeration in the slug body. Researchers [39,40] have noted that entrained gas bubbles cause losses from the slug front to the leading film tail, on account of recirculation.
Figure 7a shows the measured translational velocity plotted as a function of mixture velocity. The result, as can be seen, illustrates a linear relationship between the experimental translational velocity and mixture velocity for the different viscosities investigated. The error bars shown represent measurement error of ±8% being the maximum deviation from the mean slug translational velocity values determined using the gamma densitometers. Expectedly, the measured translational velocity grows with increase in mixture velocity with the slope of the graph found to be 2.1–2.3. The obtained slope represents the flow coefficient Co as expressed in the translational velocity in Equation (1). The result also shows that increased oil viscosity slightly affects the flow distribution coefficient Co. It can be concluded that the experiments conducted are in the laminar flow region as widely reported the literature.
Correspondingly, translational velocity—as can be seen in Figure 7b—increased with an increase in viscosity as can be seen from the plot. We attribute this to the fact that the length of the slug was reduced with an increase in liquid viscosity (as confirmed by many researchers [34,37,38,39,40,41] thereby reducing the mass of liquid body travelling per unit time which translated to higher momentum. In other words, slug translational velocity is proportional with liquid viscosity as a result of reduced slug length and increased frequency. Though the laminar sublayer increases with increasing liquid viscosity, this increase is dominated by the effects associated with the reduction in the slug body (as a result of the decrease in the slug length. This trend conforms to those reported for medium liquid viscosities previously reported [9,22,34].

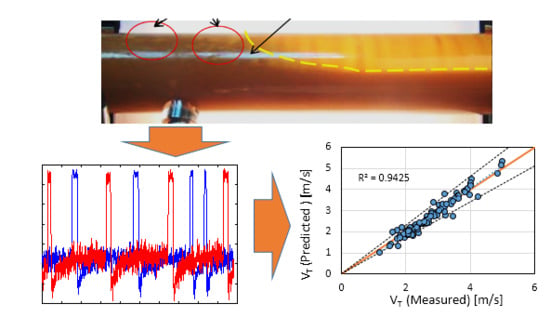
5. Correlation of Slug Translational Velocity Data

As stated earlier, translational velocity is a key parameter for slug flow modelling. Existing correlations found in the literatures show significant performance deficiencies for application in high viscosity usage within specified limits. A correlation based on experiments was first proffered by Nicklin et al. [14] to determine the velocity of a Taylor bubble in slug flow in vertical pipes but have largely been applied to different pipe inclinations by many researchers in recent times as given in Equation (2). The value of the distribution parameter C o was found to be nearer 1.2 for fully-developed turbulent flow and nearing 2 for laminar flow. Previous studies have shown that for low viscosity liquids, the distribution parameter C o   ranges between 1.0 < C o < 1.2. However, Wallis [42] noted that the value of C o can even be higher than 2 for fully developed laminar flow though it was stated in his work that the exact behaviour was to be determined. This has been confirmed by the works of Gokcal [9] who suggested a larger distribution parameter. Choi et al. [32] proposed C o = 2.27 for relatively medium viscosity oils from Equation (7). Lacy [43] also suggested 2.3 for C o and most recently 2.26 by Archibong-Eso [11].
C o   =   2 1 + ( R e 1000 ) 2 + 1.2 0.2 ρ G ρ L ( 1 e x p ( 18 α G ) ) 1 + ( 1000 R e ) 2
Thus the proposed translational velocity V T was correlated from the experimental dataset for this study ranging from 1.5 to 5.5 Pa·s and Gokcal’s [9] dataset ranging from 0.108 to 0.587 Pa·s. By utilising the least squares regression method, the error margin in prediction between the proposed correlation and that of the experimental data is obtained, afterwards minimised by way of fine-tuning C 1 to obtain an optimum local solution. The new optimum solution obtained for C 1 based on the present data set for high viscosity oil in the range 1.5–5.5 Pa·s was calculated as 0.79.
Seven correlations were used for a comparative study [14,24,32,44,45,46,47]. Figure 8 shows a comparison of the current high viscosity translational velocity and predictions of four selected correlations on the basis of performance from the aforementioned [14,24,44,46]. It may be seen that there are large deviations from the error bands of ± 15% and are mostly under predictions.
A statistical quantification of the deviations between the experimental data and the seven correlations is given in Table 3. The statistical parameters used ε 1 ε 6 defined in the Appendix A and vary from standard deviation of relative error to absolute mean actual error, have previously been used by other authors [6,13,33]. It therefore becomes imperative to extend the validity of existing correlations as their accurate prediction is crucial in the design of pipelines and downstream unit operation equipment such as separators and slug catchers. To do this, we introduce the so-called viscosity number by adding it to the distribution parameter C o so as to account for the effect of liquid viscosity and its effect on the velocity of the liquid slug in highly viscous oil flows. The viscosity number has been successfully demonstrated in the past to adequately characterize highly viscous flows in multiphase pipelines [34,40,41]. Its addition yields an expression for the slug translational velocity as follows:
V T   = ( C o + N μ ) V m + + C 1 g D
where N μ is the viscosity number given by:
N μ   = V m μ L g D 2 ( ρ l ρ g )
The results of our comparison are presented in Figure 8 and Figure 9. Figure 9 shows a comparison between the predictions of Equation (8) and the current experimental data on slug translational velocity. Compared with Figure 8, it represents a significant increase in predictive performance of slug translational velocity. Only 9 of over 80 data points were outside the ±15% error bands. Statistical comparison using the parameters ε 1 ε 6 also shows improved predictions when compared to the previous correlations with their performance is presented in Table 3.
A further demonstration of the predictive capabilities of the proposed correlation is carried out. We show this by comparing its predictions with the data of Gokcal [9]. Gokcal’s dataset is for liquid viscosity of 0.181–0.587 Pa·s, a range lower than that investigated in this study (0.9–5.5 Pa·s). Notwithstanding this, Figure 9b shows that the correlation compares favourably, illustrating its consistency against independent data. While there are over-predictions for most data points, these are well within +20% of Gokcal’s data. We note that the developed slug translational velocity correlation needs to be further tested against a lower viscosity dataset as well as those with a wider range of fluid properties for robustness.

6. Conclusions

Experimental measurement of slug translational velocity in high viscosity oil-gas flow conducted in this study by using cross correlated data from two gamma densitometers with the same sampling frequency of 250 Hz. The results show that slug translational velocity increased with rise in oil viscosity. It also increased with increase in mixture velocity of flow. This is similar to observations made by previous authors [9,22]. Comparison of seven existing models/correlations on for slug translational velocity against data obtained in this study showed that the measured slug translational velocity was under predicted by several degrees of magnitude. The proposed slug translational velocity developed from data with oil viscosity from 0.108–5.5 Pa·s. A statistical performance evaluation of the proposed correlation against independent data obtained from Ref. [9] showed that the proposed correlation had better predictive capabilities for the high liquid viscosity range. We note that the slug translational velocity correlation developed in this study needs to be further tested against a more a wider range dataset to make it more robust. The reason for this is that, for any correlation, the more the data used to derive it, the more its predictive power across a wide range of conditions, fluid properties, and pipe sizes. It is impossible to cover all those in an experimental campaign as experiments are expensive to conduct. As a result, our measurements had to be limited, and were obtained with one pipe diameter (0.0762m), and one oil which we varied the viscosity between 1 and 6 Pa·s. To increase the range of applicability of the derived correlation at high oil viscosities, we further added the data of Gokcal obtained at viscosities between 0.2 and 0.6 Pa·s. Consequently, the correlation can only be used with confidence at these conditions.

Author Contributions

Conceptualization, Y.D.B. and A.M.A.; methodology, O.T.F. and A.A.E.; data analysis: J.X.F.R., Y.D.B. and A.M.A.; writing—original draft preparation, Y.D.B.; writing—review and editing, Y.D.B., A.M.A., A.A.E., J.X.F.R.; proofreading, A.M.A., O.T.F.; supervision, L.L. and H.Y.

Funding

This research received no external funding.

Acknowledgments

The authors (Y.D.B. and A.M.A.) are grateful to the Petroleum Technology Development Fund (PTDF), which forms part of the Nigerian Government for funding their PhD studies in Cranfield University. We also acknowledge the support and kind assistance of laboratory manager Stan Collins, Laboratory technicians, David Withington, Kelvin White and Sheridan Cross. The authors are also grateful to research colleagues at Cranfield University’s Oil and Gas Engineering Centre.

Conflicts of Interest

All authors declare no conflict of interest.

Nomenclature

SymbolsDenotesUnits
AAream2
CConstant[-]
DPipe diameterm
FrFroude number[-]
fsSlug Frequencys−1
gAcceleration due to gravitym. s2
Llengthm
N μ Viscosity number[-]
HLHoldup[-]
HFAverage film holdup[-]
HSAverage slug holdup[-]
N f Inverse viscosity number[-]
ReReynolds number[-]
StStrouhal number[-]
VmMixture Velocitym/s
LsLiquid slug lengthm
VTTranslational velocitym/s
Greek letters
μ ViscositycP
ρ Densitykg/m3
τ Shear stressPa
ε Relative error[-]
Subscripts
fFilm zone
gGas phase
lLiquid phase
mMixture phase
sSuperficial
tTranslational

Appendix A

Statistical parameters for evaluating the performance of predictive correlations relative to the experimental data acquired. These parameters, six of them, have also been used by numerous researchers [6,13,34,48,49,50] and are evaluated based on two types of errors; actual and relative error respectively. Results are given in Table 3 and the best performing correlations are those with the least magnitude of the statistical parameter concerned. They are:
ε i = y p r e d i c t e d y m e a s u r e d y m e a s u r e d 100
ε j = y p r e d i c t e d y m e a s u r e d
The error margins from estimated actual error and relative error above, six other statistical parameters are defined from Equations (A3) to (A8)
The average relative error is given as:
ε 1 = 1 N i = 1 N y i
The absolute of average relative error is given as:
ε 2 = 1 N i = 1 N | y i |
The standard deviation of the relative error is defined as follows:
ε 3 = i = 1 N ( y i Y 1 ) 2 N 1
The average actual error
ε 4 = 1 N i = 1 N y j
The absolute of the mean actual error is calculated using:
ε 5 = 1 N i = 1 N | y j |
The standard deviation of actual errors is calculated as follows:
ε 6 = j = 1 N ( y j Y 4 ) 2 N 1
The mean relative error   ε 1 and the mean actual error   ε 4 measure the disparity between the predicted and measured parameters. If they are positive, this indicates over-estimation of the parameter and vice versa. Individual errors can be either positive or negative, and can cancel each other out, masking the true performance. The mean absolute percentage relative error   ε 2 and the mean absolute actual error ε 5 do not mask the true performance. Nevertheless, they signify the magnitude of the error on average. The standard deviations,   ε 3   and   ε 6 , indicate the degree of scattering compared to their corresponding mean errors,   ε 1 and   ε 4 .

References

  1. Baba, Y.D.; Aliyu, A.M.; Archibong, A.E.; Almabrok, A.A.; Igbafe, A.I. Study of high viscous multiphase phase flow in a horizontal pipe. Heat Mass Transf. 2018, 54, 651–699. [Google Scholar] [CrossRef]
  2. Cook, M.; Behnia, M. Pressure drop calculation and modelling of inclined intermittent gas–liquid flow. Chem. Eng. Sci. 2000, 55, 4699–4708. [Google Scholar] [CrossRef]
  3. Xiao, J.J.; Shonham, O.; Brill, J.P. A Comprehensive Mechanistic Model for Two-Phase Flow in Pipelines. In Proceedings of the SPE Annual Technical Conference and Exhibition, New Orleans, LA, USA, 23–26 September 1990. [Google Scholar]
  4. Wang, S.; Zhang, H.; Sarica, C.; Pereyra, E. A Mechanistic Slug Liquid Holdup Model for Wide Ranges of Liquid Viscosity and Pipe Inclination Angle. In Proceedings of the Offshore Technology Conference, Houston, TX, USA, 6–9 May 2013; pp. 1–11. [Google Scholar]
  5. Zhang, H.-Q.; Wang, Q.; Sarica, C.; Brill, J.P. Unified Model for Gas-Liquid Pipe Flow via Slug Dynamics−Part 1: Model Development. J. Energy Resour. Technol. 2003, 125, 266–273. [Google Scholar] [CrossRef]
  6. Archibong-Eso, A.; Okeke, N.; Baba, Y.; Aliyu, A.; Lao, L.; Yeung, H. Estimating slug liquid holdup in high viscosity oil-gas two-phase flow. Flow Meas. Instrum. 2019, 65, 22–32. [Google Scholar] [CrossRef]
  7. Archibong-Eso, A.; Baba, Y.; Aliyu, A.; Zhao, Y.; Yan, W.; Yeung, H. On slug frequency in concurrent high viscosity liquid and gas flow. J. Pet. Sci. Eng. 2018, 163, 600–610. [Google Scholar] [CrossRef]
  8. Gokcal, B. Effects of High Oil Viscosity on Oil/Gas Flow Behavior in Horizontal Pipes. Master’s Thesis, University of Tulsa, Tulsa, OK, USA, 2006. [Google Scholar]
  9. Gokcal, B. An Experimental and Theoretical Investigation of Slug Flow for High Oil Viscosity in Horizontal Pipes. Ph.D. Thesis, The University Tulsa, Tulsa, OK, USA, 2008. [Google Scholar]
  10. Zhao, Y. High Viscosity Liquid Two-Phase Flow. Ph.D Thesis, Cranfield University, Cranfield, UK, 2014. [Google Scholar]
  11. Archibong, A. Viscous Multiphase Flow Characteristics in Pipelines. Ph.D. Thesis, Cranfield University, Cranfield, UK, 2015. [Google Scholar]
  12. Baba, Y.D. Experimental Investigation of High Viscous Multiphase Flow in Horizontal Pipelines. Ph.D. Thesis, Cranfield University, Cranfield, UK, 2016. [Google Scholar]
  13. Baba, Y.D.; Archibong, A.E.; Aliyu, A.M.; Ameen, A.I. Slug frequency in high viscosity oil-gas two-phase flow: Experiment and prediction. Flow Meas. Instrum. 2017, 54, 109–123. [Google Scholar] [CrossRef]
  14. Nicklin, D.; Wilkes, J.; Davidson, J. Two Phase Flow in Vertical tubes. Trans. Inst. Chem. Eng. 1962, 40, 61–68. [Google Scholar]
  15. Gregory, G. a.; Scott, D.S. Correlation of liquid slug velocity and frequency in horizontal cocurrent gas-liquid slug flow. AIChE J. 1969, 15, 933–935. [Google Scholar] [CrossRef]
  16. Mattar, L.; Gregory, G.A. Air-Oil slug flow in an upward-inclined pipe-I: Slug velocity, holdup and pressure gradient. J. Can. Pet. Technol. 1974, 13, 69–76. [Google Scholar] [CrossRef]
  17. Dukler, A.E.; Hubbard, M.G. A Model for Gas-Liquid Slug Flow in Horizontal and Near Horizontal Tubes. Ind. Eng. Chem. Fundam. 1975, 14, 337–347. [Google Scholar] [CrossRef]
  18. Nicholson, M.K.; Aziz, K.; Gregory, G.A. Intermittent Two Phase Flow in Horizontal Pipes: Predictive Models. Can. J. Chem. Eng. 1978, 56, 653–663. [Google Scholar] [CrossRef]
  19. Dukler, A.E.; Maron, D.M.; Brauner, N. A Physical Model For Predicting The Minimum Stable Slug Length. Chem. Eng. Sci. 1985, 40, 1379–1385. [Google Scholar] [CrossRef]
  20. Kouba, G.E.; Jepson, W.P. The Flow of Slugs in Horizontal, Two-Phase Pipelines. J. Energy Resour. Technol. 1990, 112, 20–24. [Google Scholar] [CrossRef]
  21. Pan, J. Gas Entrainment in Two-Phase Gas-Liquid Slug Flow. Ph.D. Thesis, Imperial College London, London, UK, 2010. [Google Scholar]
  22. Brito, R.; Pereyra, E.; Sarica, C. Experimental study to characterize slug flow for medium oil viscosities in horizontal pipes. In Proceedings of the 9th North American Conference on Multiphase Technology, Banff, AB, Canada, 11–13 June 2014; pp. 403–417. [Google Scholar]
  23. Al Awadi, H. Multiphase Characteristics of High Viscosity Oil. Ph.D. Thesis, Cranfield University, Cranfield, UK, 2011. [Google Scholar]
  24. Jeyachandra, B.C.; Gokcal, B.; Al-Sarkhi, A.; Serica, C.; Sharma, A.K. Drift-Velocity Closure Relationships for Slug Two-Phase High-Viscosity Oil Flow in Pipes. Soc. Pet. Eng. 2012, 17, 593–601. [Google Scholar] [CrossRef]
  25. Al-kayiem, H.H.; Mohmmed, A.O.; Al-hashimy, Z.I.; Time, R.W. Statistical assessment of experimental observation on the slug body length and slug translational velocity in a horizontal pipe. Int. J. Heat Mass Transf. 2017, 105, 252–260. [Google Scholar] [CrossRef]
  26. Bendiksen, K.H.; Langsholt, M.; Liu, L. An experimental investigation of the motion of long bubbles in high viscosity slug flow in horizontal pipes. Int. J. Multiph. Flow 2018, 104, 60–73. [Google Scholar] [CrossRef]
  27. Moissis, R.; Griffith, P. Entrance Effects in Slug Flow. In Proceedings of the Transaction of American Society of Mechanical Engineers (A.S.M.E.), New York, NY, USA, 1 February 1962; pp. 29–39. [Google Scholar]
  28. Fabre, J.; Line, A. Modeling of Two-Phase Slug Flow. Annu. Rev. Fluid Mech. 1992, 24, 21–46. [Google Scholar] [CrossRef]
  29. Manolis, I.G. High Pressure Gas-Liquid Slug Flow. Ph.D. Thesis, Imperial College London, London, UK, 1995. [Google Scholar]
  30. Woods, B.D.; Hanratty, T.J. Relation of slug stability to shedding rate. Int. J. Multiph. Flow 1996, 22, 809–828. [Google Scholar] [CrossRef]
  31. Petalas, N.; Aziz, K. A Mechanistic Model for Multiphase Flow in Pipes. J. Can. Pet. Technol. 2000, 39, 43–55. [Google Scholar] [CrossRef]
  32. Choi, J.; Pereyra, E.; Sarica, C.; Park, C.; Kang, J. An Efficient Drift-Flux Closure Relationship to Estimate Liquid Holdups of Gas-Liquid Two-Phase Flow in Pipes. Energies 2012, 5, 5294–5306. [Google Scholar] [CrossRef] [Green Version]
  33. Kim, T.W.; Aydin, T.B.; Pereyra, E.; Sarica, C. Detailed flow field measurements and analysis in highly viscous slug flow in horizontal pipes. Int. J. Multiph. Flow 2018, 106, 75–94. [Google Scholar] [CrossRef]
  34. Baba, Y.D.; Aliyu, A.M.; Archibong, A.E.; Abdulkadir, M.; Lao, L.; Yeung, H. Slug length for high viscosity oil-gas flow in horizontal pipes: Experiments and prediction. J. Pet. Sci. Eng. 2018, 165, 397–411. [Google Scholar] [CrossRef]
  35. Beggs, D.H.; Brill, J.P. A Study of Two-Phase Flow in Inclined Pipes. J. Pet. Technol. 1973, 25, 607–617. [Google Scholar] [CrossRef]
  36. Taitel, Y.; Dukler, A.E. A model for predicting flow regime transitions in horizontal and near horizontal gas-liquid flow. AIChE J. 1976, 22, 47–55. [Google Scholar] [CrossRef]
  37. Brito, R.; Pereyra, E.; Sarica, C. Effect of Medium Oil Viscosity on Two-Phase Oil-Gas Flow Behavior in Horizontal Pipes. In Proceedings of the Offshore Technology Conference, Offshore Technology Conference, Houston, TX, USA, 6–9 May 2013; p. 285. [Google Scholar]
  38. Zhao, Y.; Lao, L.; Yeung, H. Investigation and prediction of slug flow characteristics in highly viscous liquid and gas flows in horizontal pipes. Chem. Eng. Res. Des. 2015, 102, 124–137. [Google Scholar] [CrossRef] [Green Version]
  39. Al-safran, E.; Gokcal, B.; Sarica, C. High Viscosity Liquid Effect on Two-Phase Slug Length in Horizontal Pipes. In Proceedings of the 15th International Conference on Multiphase Production Technology, Cannes, France, 15–17 June 2011; pp. 257–276. [Google Scholar]
  40. Al-safran, E.M.; Gokcal, B.; Sarica, C. Investigation and Prediction of High-Viscosity Liquid Effect on Two-Phase Slug Length in Horizontal Pipelines. SPE Prod. Oper. 2013, 28, 12–14. [Google Scholar] [CrossRef]
  41. Gokcal, B.; Sarica, C. Analysis and Prediction of Heavy Oil Two-Phase Slug Length in Horizontal Pipelines. In Proceedings of the SPE Heavy Oil Conference and Exhibition, Kuwait City, Kuwait, 12–14 December 2011. [Google Scholar]
  42. Wallis, G.B. One-Dimensional Two-Phase Flow; American Institute of Chemical Engineers: New York, NY, USA, 1969. [Google Scholar]
  43. Lacy, C.E. Applicability of Slug Flow Models to Heavy Oils. In Proceedings of the SPE Heavy Oil Conference Canada, Calgary, AB, Canada, 12–14 June 2012; pp. 266–275. [Google Scholar]
  44. Hubbard, M.G. An Analysis of Horizontal Gas-liquid Slug Flow. Ph.D. Thesis, University of Houston, Houston, TX, USA, 1965. [Google Scholar]
  45. Jepson, W.P. Modelling the transition to slug flow in horizontal conduit. Can. J. Chem. Eng. 1989, 67, 731–740. [Google Scholar] [CrossRef]
  46. Kouba, G.E. Horizontal Slug Flow Modeling and Metering; University of Tulsa: Tulsa, OK, USA, 1986. [Google Scholar]
  47. Benjamin, B. Gravity currents and related phenomena. J. Fluid Mech 1968, 31, 209–248. [Google Scholar] [CrossRef]
  48. Gokcal, B.; Al-Sarkhi, A.; Sarica, C.; Alsafran, E.M. Prediction of Slug Frequency for High Viscosity Oils in Horizontal Pipes. In Proceedings of the SPE Annual Technical Conference and Exhibition, New Orleans, LA, USA, 4–7 October 2009. [Google Scholar]
  49. Al-Safran, E. Investigation and prediction of slug frequency in gas/liquid horizontal pipe flow. J. Pet. Sci. Eng. 2009, 69, 143–155. [Google Scholar] [CrossRef]
  50. Kora, C.; Sarica, C.; Zhang, H.; Al-Sarkhi, A.; Al-Safran, E. Effects of High Oil Viscosity on Slug Liquid Holdup in Horizontal Pipes. In Proceedings of the Canadian Unconventional Resources Conference, Calgary, AB, Canada, 15–17 November 2011. [Google Scholar]
Figure 1. Percentage of world oil reserves showing conventional and unconventional resources [1].
Fluids 04 00170 g001
Figure 2. Experimental test facility (a) Schematic (b) A comparison of measured with manufacturer-supplied temperature response of viscosity.
Fluids 04 00170 g002
Figure 3. Representation of the installed gamma radiation source on the test section.
Fluids 04 00170 g003
Figure 4. (a) Depiction of the determination of time delay for slug translational velocity from gamma densitometer time series (a) Typical liquid holdup plot showing the concept of signal time delay (b) an example of a raw signal output from gamma photon counts (c) an example of a filtered gamma signal output (d) Cross-correlation coefficient and time delay plot.
Fluids 04 00170 g004
Figure 5. Experimental data points for (a) 3–3.5 Pa·s and (b) 5.5–5.5 Pa·s (c) plotted against the Beggs and Brill [35] flow pattern pap for gas-Liquid horizontal flow, shown in (c). A comparison of the observed flow patterns with the flow pattern map of Taitel and Dukler [36] is given in (d).
Fluids 04 00170 g005
Figure 6. A typical Slug flow for gas and high viscosity oil flow observed for this study (figure from Archibong-Eso et al. [7]).
Fluids 04 00170 g006
Figure 7. (a) Data from this work and (b) slug translational velocity vs mixture velocity for data from this work compared with previously reported at different flow conditions (Vsg = 0.3–7.0 m/s and Vsl = 0.2–0.4 m/s).
Fluids 04 00170 g007
Figure 8. Comparison of the experimental data from the present study with several model predictions and experimental data for the present study. Model predictions are by (a) Jeyachandra et al. [24], (b) Nicklin [14], (c) Hubbard [44], and (d) Kouba [46]. The error bands represent a ± 15% deviation of the model from the present experimental slug translational velocities.
Fluids 04 00170 g008
Figure 9. (a) Cross plot of the new correlation’s prediction against the experimentally measured slug body translational velocity (Equation (8)). The error bands are ± 15% limits of deviation between experiments and predicted points. (b) Cross-plot of the model prediction (Equation 8) vs. the experimental measurements of Gokcal [9]. Error bands represent ± 15% deviation of the model from the experimental slug translational velocities.
Fluids 04 00170 g009
Table 1. A summary of current models in the open literature for slug translational velocity.
Authors/YearExperimental Conditions C 0 Model/Correlations Developed for Slug Translational Velocity
Nicklin et al. [14]Theoretical model1.2 at high Reynolds numbers and 2.0 at low Reynolds numbers V T = C 0 V m + C 1 g D
Moissis and Griffith [27]Theoretical model V T = V T , [ 1 + 8 e x p ( 1.06 L s D ) ]
Gregory and Scott [15]Theoretical model1.35 V T = C 0 V m
Mattar and Gregory [16]Air-oil(9 cP) horizontal to 10o incline1.32
Dukler and Hubbard [17]Air-water; 3.75 m horizontal pipe 1.022 + 0.021 l n ( R e s ) . V T = ( 1 + C 0 ) V m  
Nicholson et al. [18]Theoretical model validated with air-oil horizontal flow data { 1.19 ;   D = 0.0258   m   1.128 ;   D = 0.0512   m V T = { 1.19 V m   + 0 : 27 ;   D = 0.0258 m 1.128 V m   + 0 : 28 ;   D = 0.0512 m  
Dukler et al. [19] 1.225 V T = 1.225 V m ; H o r i z o n t a l
Kouba and Jepson [20]Air-water, Diameter= 0.15 m, V T = 1.21 ( 0.1134 + 0.94 V s l + V s g ) .
Fabre and Line [28] C o = 2.27 1 + ( R e / 1000 ) 2 + 1.2 1 + ( 1000 / R e ) 2
Manolis [29] { 1.033 ;   F r m   < 2.86     1.216 ;   F r m   2.86
Woods and Hanratty [30]Horizontal air-water in a 0.0953-m pipe at atmospheric pressure 1.1 ;   F r m   < 3.1
1.2 ;   F r m   3.1
V T = ( C o V m 1 + ( s 1 ) ϵ ) ( 1 ϵ )
Petalas and Aziz [31] 1.64 R e m L 0.031
Choi et al. [32]Air-water/light oil inclinations of -10o to 10o C o = 2.27 1 + ( R e / 1000 ) 2 + 1.2 0.2 ( ρ G ρ L ) ( 1 e x p ( 18 α G ) ) 1 + ( 1000 / R e ) 2
Archibong [11]Air-oil in two horizontal pipes of 0.0508, 0.0762 m internal diameter C 0 = Ψ 1 Ψ 2 + ( R e 1000 ) 2 + Ψ 3 + Ψ 4 ρ g ρ l ( 1 e x p ( 1 e x p   e x p   ( 18 α G )   ) ( R e 1000 ) 2  
Ψ 1 , Ψ 2 Ψ 3 and Ψ 4 were respectively obtained as 0.272, 0.236, 0.471 and 17.143
Kim et al. [33]Air-oil in a horizontal pipe of internal diameters: 0.0508 and 0.0762 m C o = 1.13 V L m a x i V S L i
Where are V L m a x i and V S L i are the in-situ maximum liquid and superficial liquid velocities at each PIV x-grid.
R e m L = ρ L V m D μ L ; F r m = V m g D ; Γ = 1 + ( F r m F r c r i t . C o s ( θ ) ) ;   F r c r i t . = 3.5 ; β T B   a n d   Ψ T B   a r e   e m p e r i c a l   c o n s t a n t   w h o s e   v a l u e   5.5   &   0.6 ; n = 7   c o r r e s p o n d i n g   t o   t h e   1 / 7 t h   p o w e r   l a w   R e s α G S ρ G + ( 1 + α G S ) ρ L α G S μ G + ( 1 + α G S ) μ L ;   V T , i s   t h e   t r a n s l a t i o n a l   v e l .   o f   a   l o n g ,   s t a b l e   s l u g   a t   t h e   s a m e   m i x t u r e   v e l o c i t y ; L s , s t a b l e   w a s   s t a t e d   t o   b e   b e t w e e n   10   a n d   15   p i p e   d i a m e t e r s
Table 2. Test matrix for experimental run and measurement uncertainties.
Density (kg/m3)Test FluidsViscosity (cP)Interfacial Tension (25 °C, N/m)Test Matrix (m/s)API Gravity
1.293Air0.0170.0330.3–9.0-
≈918CYL6801000~60000.0330.06–0.322.67
MeasurementUncertainty (%)
Superficial liquid velocity±0.5
Superficial gas velocity±2.1
Liquid viscosity±1
Pressure drop±2
Liquid holdup±10
Table 3. A comparison between our proposed and existing correlations.
Nicklin [14]Hubbard [44]Benjamin, [47]Kouba [46]Jepson [45]Jeyachandra et al. [24]Choi et al. [32]Eqn. 8
ε 1 −19.85−58.20−19.85−57.63−54.32−33.22−7.67−0.31
ε 2 20.9658.2020.9657.6354.3233.3517.798.05
ε 3 10.618.6410.616.9514.9612.1631.316.55
ε 4 −0.54−1.59−1.59−1.59−1.44−0.88−0.110.00
ε 5 0.561.591.591.591.440.890.540.21
ε 6 0.290.380.380.420.350.291.430.26

