Article

Modeling Flow and Pressure Fields in Porous Media with High Conductivity Flow Channels and Smart Placement of Branch Cuts for Variant and Invariant Complex Potentials

Harold Vance Department of Petroleum Engineering, Texas A & M University, 3116 TAMU, College Station, TX 77843-3116, USA
*
Author to whom correspondence should be addressed.
Fluids 2019, 4(3), 154; https://doi.org/10.3390/fluids4030154
Submission received: 12 July 2019 / Revised: 3 August 2019 / Accepted: 4 August 2019 / Published: 9 August 2019

Abstract

:
A long overdue distinction between so-called variant and invariant complex potentials is proposed here for the first time. Invariant complex potentials describe physical flows where a switch of the real and imaginary parts of the function will still describe the same type of physical flow (but only rotated by π/2). Such invariants can be formulated with Euler’s formula to depict the same flow for any arbitrary orientation with respect to the coordinate system used. In contrast, variant complex potentials, when swapping their real and imaginary parts, will result in two fundamentally different physical flows. Next, we show that the contour integrals of the real and imaginary part of simple variant and invariant complex potentials generally do not generate any discernable branch cut problems. However, complex potentials due to the multiple superpositions of simple flows, even when invariant, may involve many options for selecting the branch cut locations. Examples of such branch cut choices are given for so-called areal doublets and areal dipoles, which are powerful tools to describe the streamlines and pressure fields for flow in porous media with enhanced permeability flow channels. After a discussion of the branch cut solutions, applications to a series of synthetic and field examples with enhanced permeability flow channels are given with examples of the streamline and pressure field solutions.

1. Introduction

Complex potentials have been used extensively to describe physical flows [1,2]. The complex potential comprises the potential function as the real term and stream function as the imaginary term, which can be used to describe the pressure field and the velocity field, respectively. The potential function and the stream function satisfy the Laplace equation; thus, the contours of the solutions of the velocity potential and stream function are perpendicular everywhere in the flow space. Switching of the imaginary and real parts of certain complex potentials provides solutions for physically different flows, while the same switch operation in other complex potentials does not change the flow physics. The complex potentials of distinctive flows are coined here variant, as opposed to invariant complex potentials where the switch of imaginary and real axes results in complex potentials that describe the same flow pattern, but only rotated by π/2.
The distinction between variant and invariant complex potentials introduced in the first part of our study is particularly useful when analyzing flow descriptions created by the superposition of various complex potentials. For example, a doublet flow results from the superposition of a source and a sink flow—The latter each described by variant complex potentials-whereas the doublet’s complex potential is invariant (see later). Multiple doublets were superposed in a recent study [3] to construct a new analytic element, suitable to model flow in fractured porous media based on complex analysis methods. The algorithm for the analytical element of flow in fractures enabled fundamental models [4,5] and applied models [6,7,8,9] that aim to advance our understanding of flow in fractured porous media.
The earlier treatise by Van Harmelen and Weijermars [3] left undiscussed (and unresolved) the branch cut choices of the potential function, which are relevant for pressure field solutions. The present study offers an extension of the earlier study [3] and allows calculation of the pressure field after considering various branch cut solutions. The solution path presented here is practical for use in applications that require quantification of both the pressure field and the particle paths in a fractured porous medium. In this study, we also present several other basic examples of complex potentials that are either variant or invariant, depending on whether the switching of the imaginary and real parts of the complex potential results in physically distinct flows (variant complex potentials) or the same flows (invariant complex potentials).
This work proceeds as follows. Section 2 first explains the fundamental difference between invariant and variant complex potentials, starting with simple flows (Section 2.1 and Section 2.2) and then expanding to complex potentials of superposed flows (Section 2.3 and Section 2.4). Section 3 explains how the earlier solution using multiple doublets to model flow in fractured porous media [3] is an invariant complex potential. Various options are given to place the branch cuts in the most convenient locations when generating pressure field solutions. Section 4 provides an application to fractured porous media by calculating the stream function and potential function solutions for synthetic and natural examples of fracture sets. Section 5 is a discussion, and Section 6 gives conclusions.

2. Methodology: Swapping Complex Potentials

The complex potential, which has the potential function as the real part [ Ω ( z , t ) ] and the stream function as the imaginary term [ Ω ( z , t ) ] , can be used to model two-dimensional flows of an incompressible fluid through a porous medium. The com−plex potential is related to the potential function, ϕ ( z , t ) , and the stream function, ψ ( z , t ) as follows:
Ω ( z , t ) = [ Ω ( z , t ) ] + [ Ω ( z , t ) ] = ϕ ( z , t ) + i ψ ( z , t )   ( m 2 · s 1 )
The real and imaginary parts of certain single-valued complex potentials provide physical descriptions for respectively the potential field contours or isobars (see later Equation (10a)) and the flux across specific regions in the flow between specific streamlines. Although complex potentials for 3D flows are possible [10,11,12], the most convenient formulations are for 2D flows.
A distinction is proposed here for the first time, between so-called variant and invariant complex potentials. Invariant complex potentials describe physical flows where a switch of the real and imaginary parts of the function will still describe the same flow (but only rotated by π/2). Such invariants can be formulated with Euler’s formula to depict the same flow for any arbitrary orientation with respect to the coordinate system used (see Section 5.1). In contrast, variant complex potentials, when swapping their real and imaginary parts, will result in two fundamentally different physical flows. Table 1 lists examples of invariant and variant complex potentials, which are illustrated in the present study. Although the areal dipole is categorized as an invariant complex potential in Table 1, a more nuanced study later (Section 3.3) shows that branch cuts may make them variant. All flows studied occur in a 2D flow domain with unconfined boundaries.

2.1. Simple Invariant Complex Potential: The Far-Field Flow

The complex potential for a uniform flow or a far-field flow of velocity parallel to the x-axis, u x (m2·s−1), is:
Ω ( z ) = u x z      ( m 2 · s 1 )
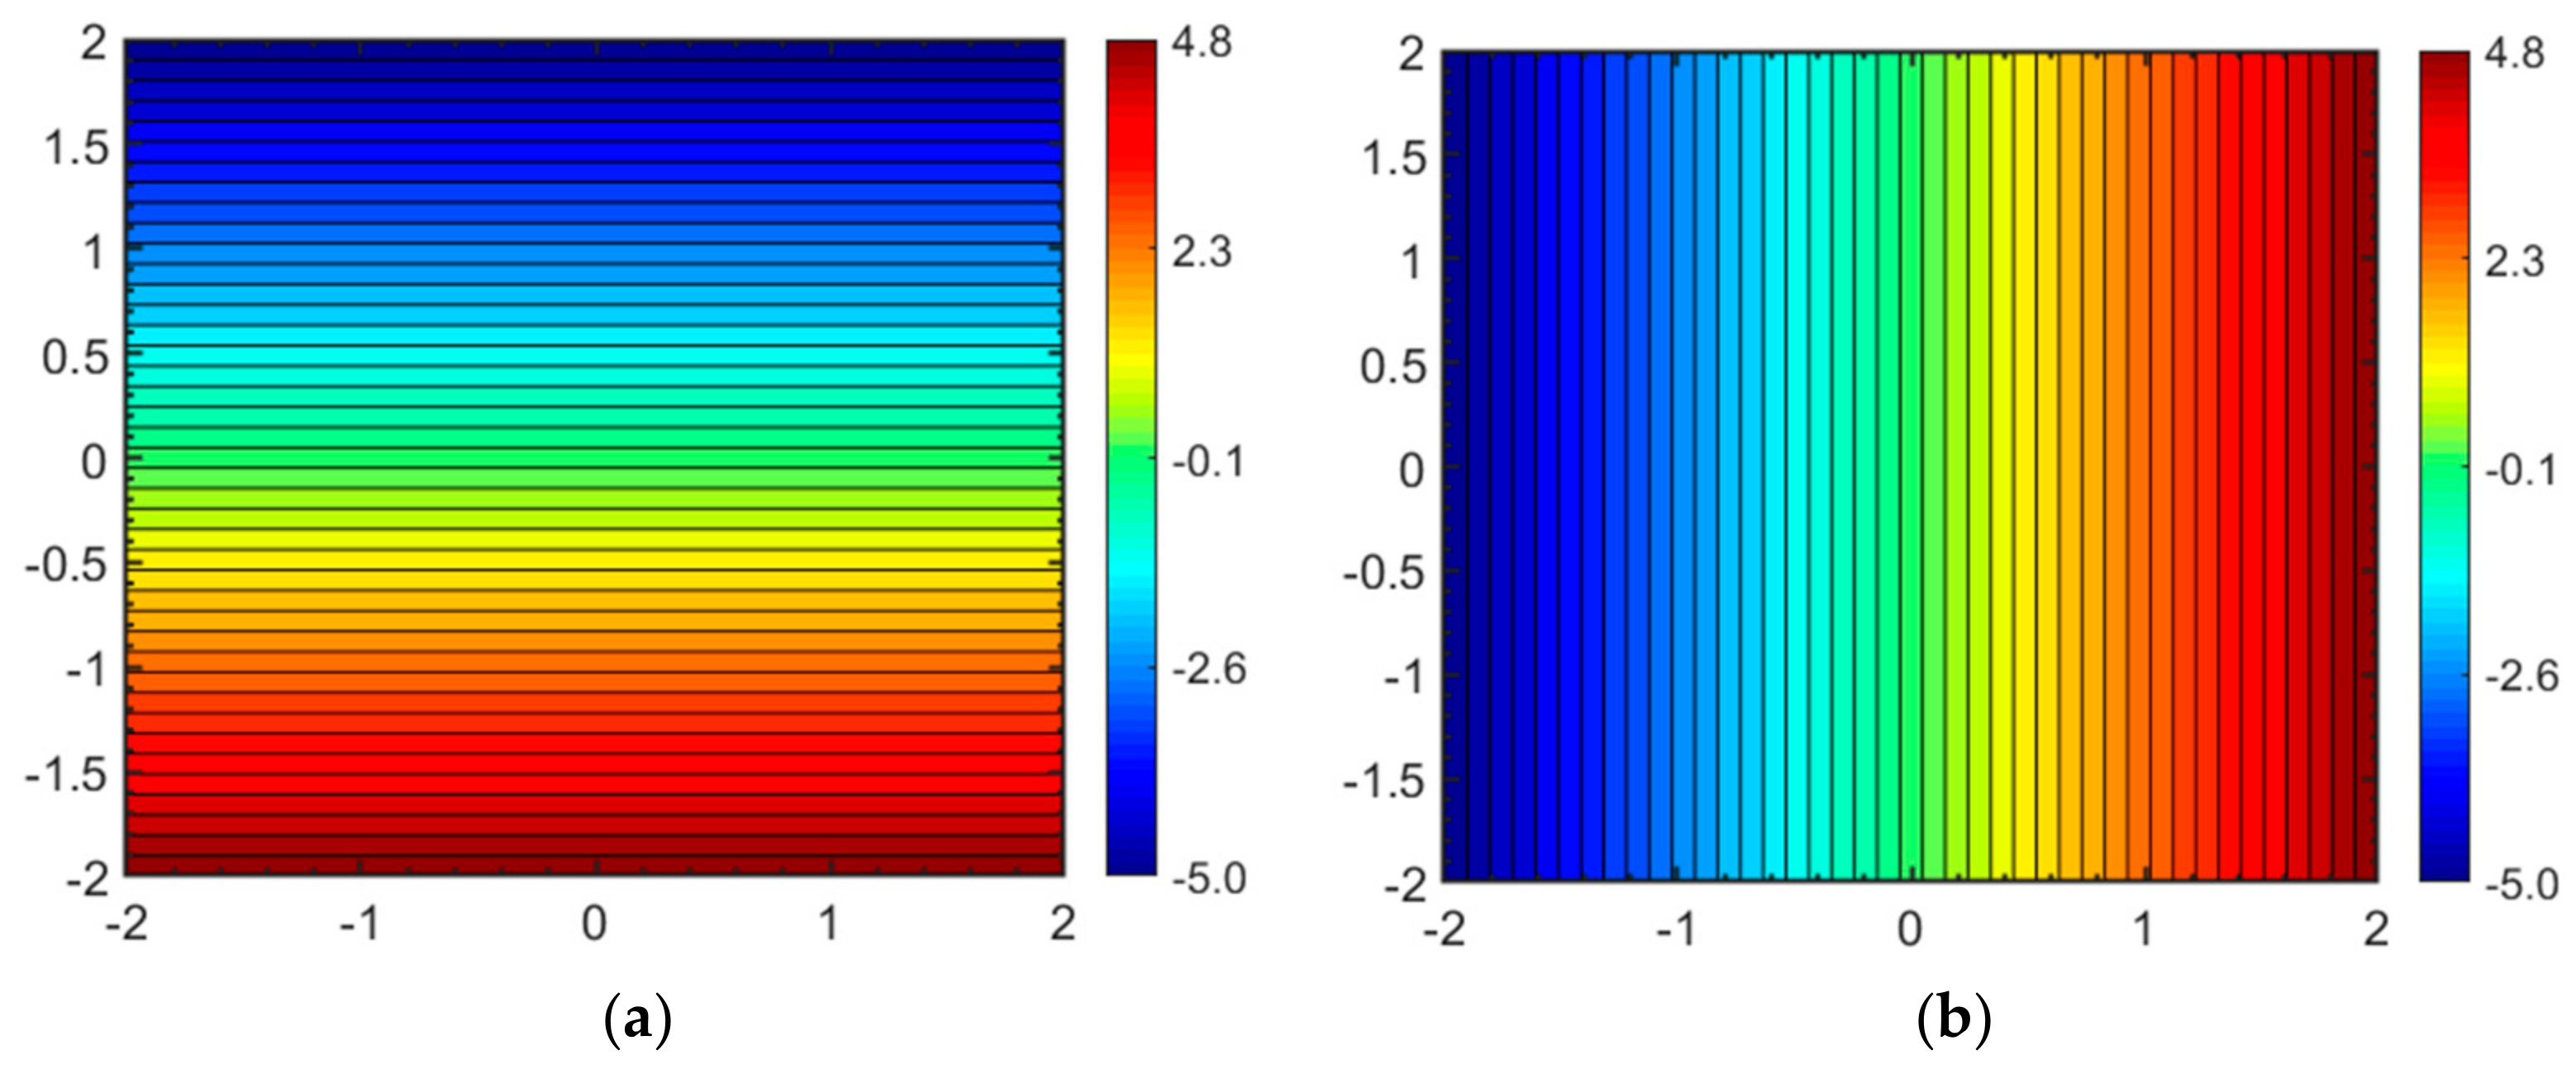
where z = x + i·y. The potential function ( ϕ ) and the stream function ( ψ ) at every point of the flow space can be mapped by the real and the imaginary parts of the complex potential Ω ( z ) = ϕ + i ψ , as shown in Figure 1a,b. When the real and the imaginary parts of the complex potential of Equation (2a) for the far-field flow are switched, the new complex potential becomes:
Ω ( z ) = i . u x z      ( m 2 · s 1 )
For oblique flows, one may use e i θ instead of I for the orientation factor in Equation (2b).
The potential function ( ϕ ) and the stream function ( ψ ) in every point are mapped by solutions for the real and the imaginary parts (Figure 2a,b) show that Equation (2b) still describes the same flow as in Equation (2a), except for a rotation of the coordinate system, but rotated by π/2. Consequently, the complex potential for a far-field flow is termed here invariant (Table 1).

2.2. Simple Variant Complex Potential: The Source/Sink and Vortex Flows

This section shows how source/sink flows (Section 2.2.1) and a vortex (Section 2.2.2) are described by similar complex potentials, but nonetheless are physically different flows; their complex potentials are variant. A final subsection (Section 2.2.3) introduces the final choices of branch cuts to be made, even in the case of a simple variant complex potential (the vortex).

2.2.1. Source/Sink Flows

The complex potential for a source/sink flow of strength, m (m2·s−1), centered about an arbitrary location, zd is:
Ω ( z ) = ( m / 2 π ) ln ( z z d )      ( m 2 · s 1 )
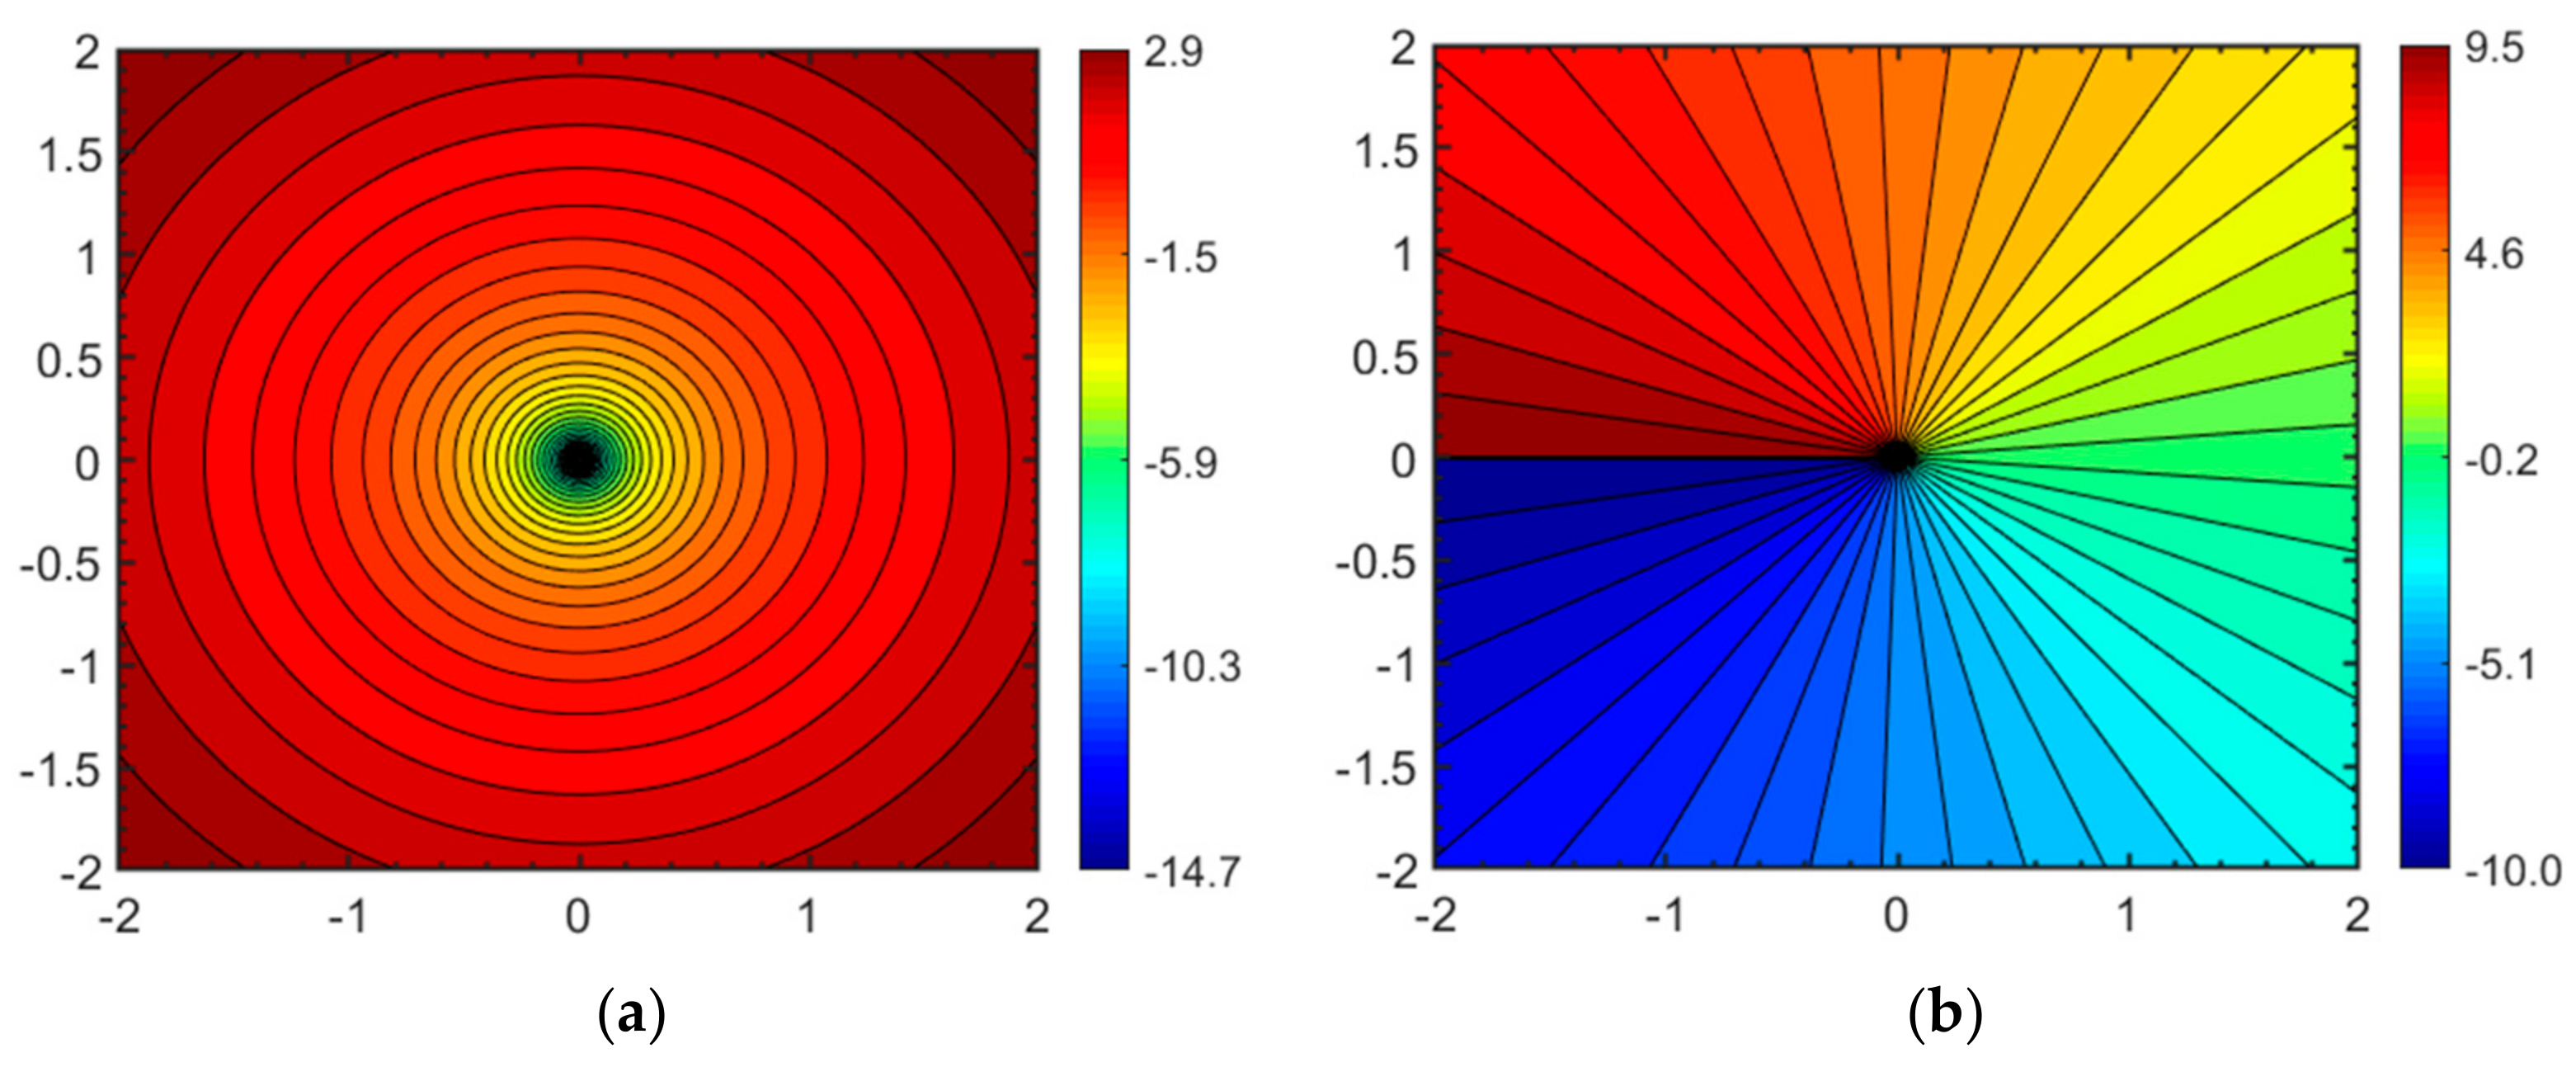
The potential function, ϕ , in every point is solved by the real part of the complex potential Ω ( z ) = ϕ + i ψ . Switching to polar coordinates (r, θ ), and using identity ln z = ln r + i θ , gives the potential function (Figure 3a):
ϕ ( r , θ ) = ( m / 2 π ) ln r      ( m 2 · s 1 )
The stream function, ψ , is given by the imaginary part of the complex potential (Figure 3b):
ψ ( r , θ ) = ( m / 2 π ) θ      ( m 2 · s 1 )

2.2.2. Vortex

It is well known that the potential function and stream function for a vortex are described by inverting the real and imaginary parts of the complex potential for a source/sink flow [1]. The latter can be obtained from the complex potential for a source/sink flow through the division of the right-hand term of Equation (3a) by an imaginary number i, and replacing the source strength, m (m2·s−1), with Γ (m2·s−1), denoting the fluid circulation around the vortex singularity [1]:
Ω ( z ) = Γ 2 π i ln ( z z d ) ,      ( m 2 · s 1 )
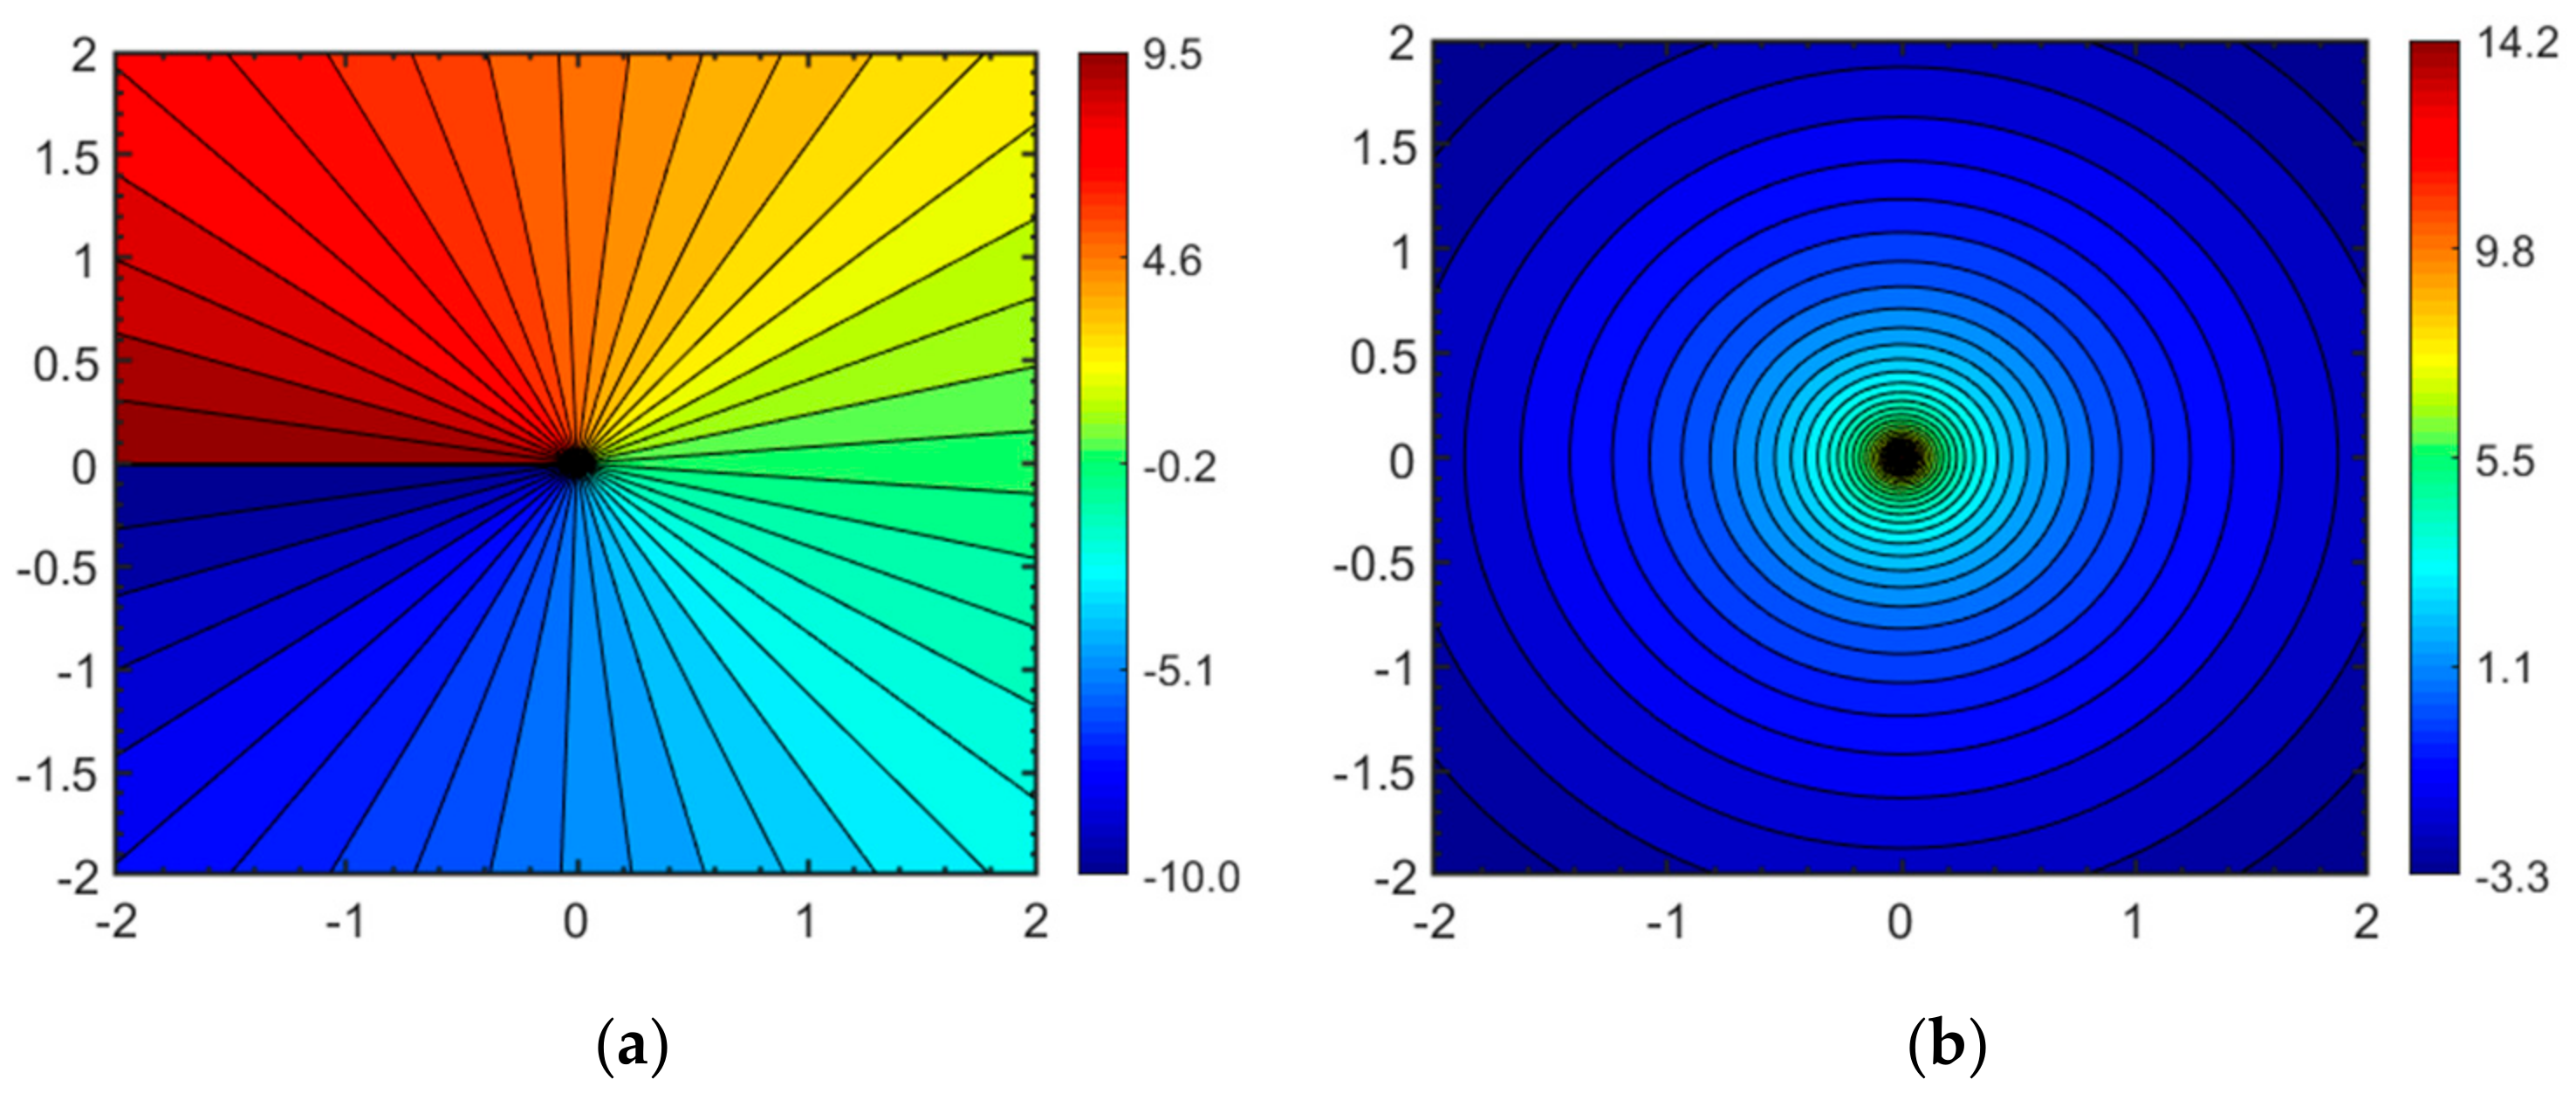
The vortex circulation is defined by Γ = v d r , such that a positive Γ gives counterclockwise flow and negative Γ results in clockwise flow. The pressure field potential, ϕ , in every point is solved by the real part of the complex potential, again using polar coordinates (r, θ ) for simplicity (Figure 4a):
ϕ ( r , θ ) = Γ 2 π θ      ( m 2 · s 1 )
The stream function, ψ , given by the imaginary part of the complex potential (Figure 4b):
ψ ( r , θ ) = Γ 2 π ln r      ( m 2 · s 1 )
Comparison of Figure 3a,b and Figure 4a,b reveals that what are streamlines for the source/sink flow (Figure 3a) are identical to pressure contours for the vortex flow (Figure 4b). Similarly, the pressure contours for the source/sink flow (Figure 1b) become streamlines for the vortex flow (Figure 2a). However, the complex potentials of Equations (3a) and (4a) clearly describe two flows that are physically different. Such complex potentials are termed here variant (Table 1).

2.2.3. Branch Cuts

In addition to the distinction of variant and invariant complex potentials, our study also pays particular attention to branch cut choices. Branch cut discontinuities occur when either the potential function (real part of a complex analytic function) or stream function (imaginary part of a complex analytic function) is multi-valued. Usually, multi-valued solutions do not occur simultaneously for both the potential and stream functions of a given flow. The discontinuity appears as a branch cut when the function is visualized in the complex plane, which accommodates the value jump. The branch cut makes the valid solution domain simply connected and the function is then single-valued. A modified contouring, which involves concatenation of different branches is also presented in Section 5.2. An alternative way for representing multi-valued functions uses Riemann surfaces instead of branch cuts.
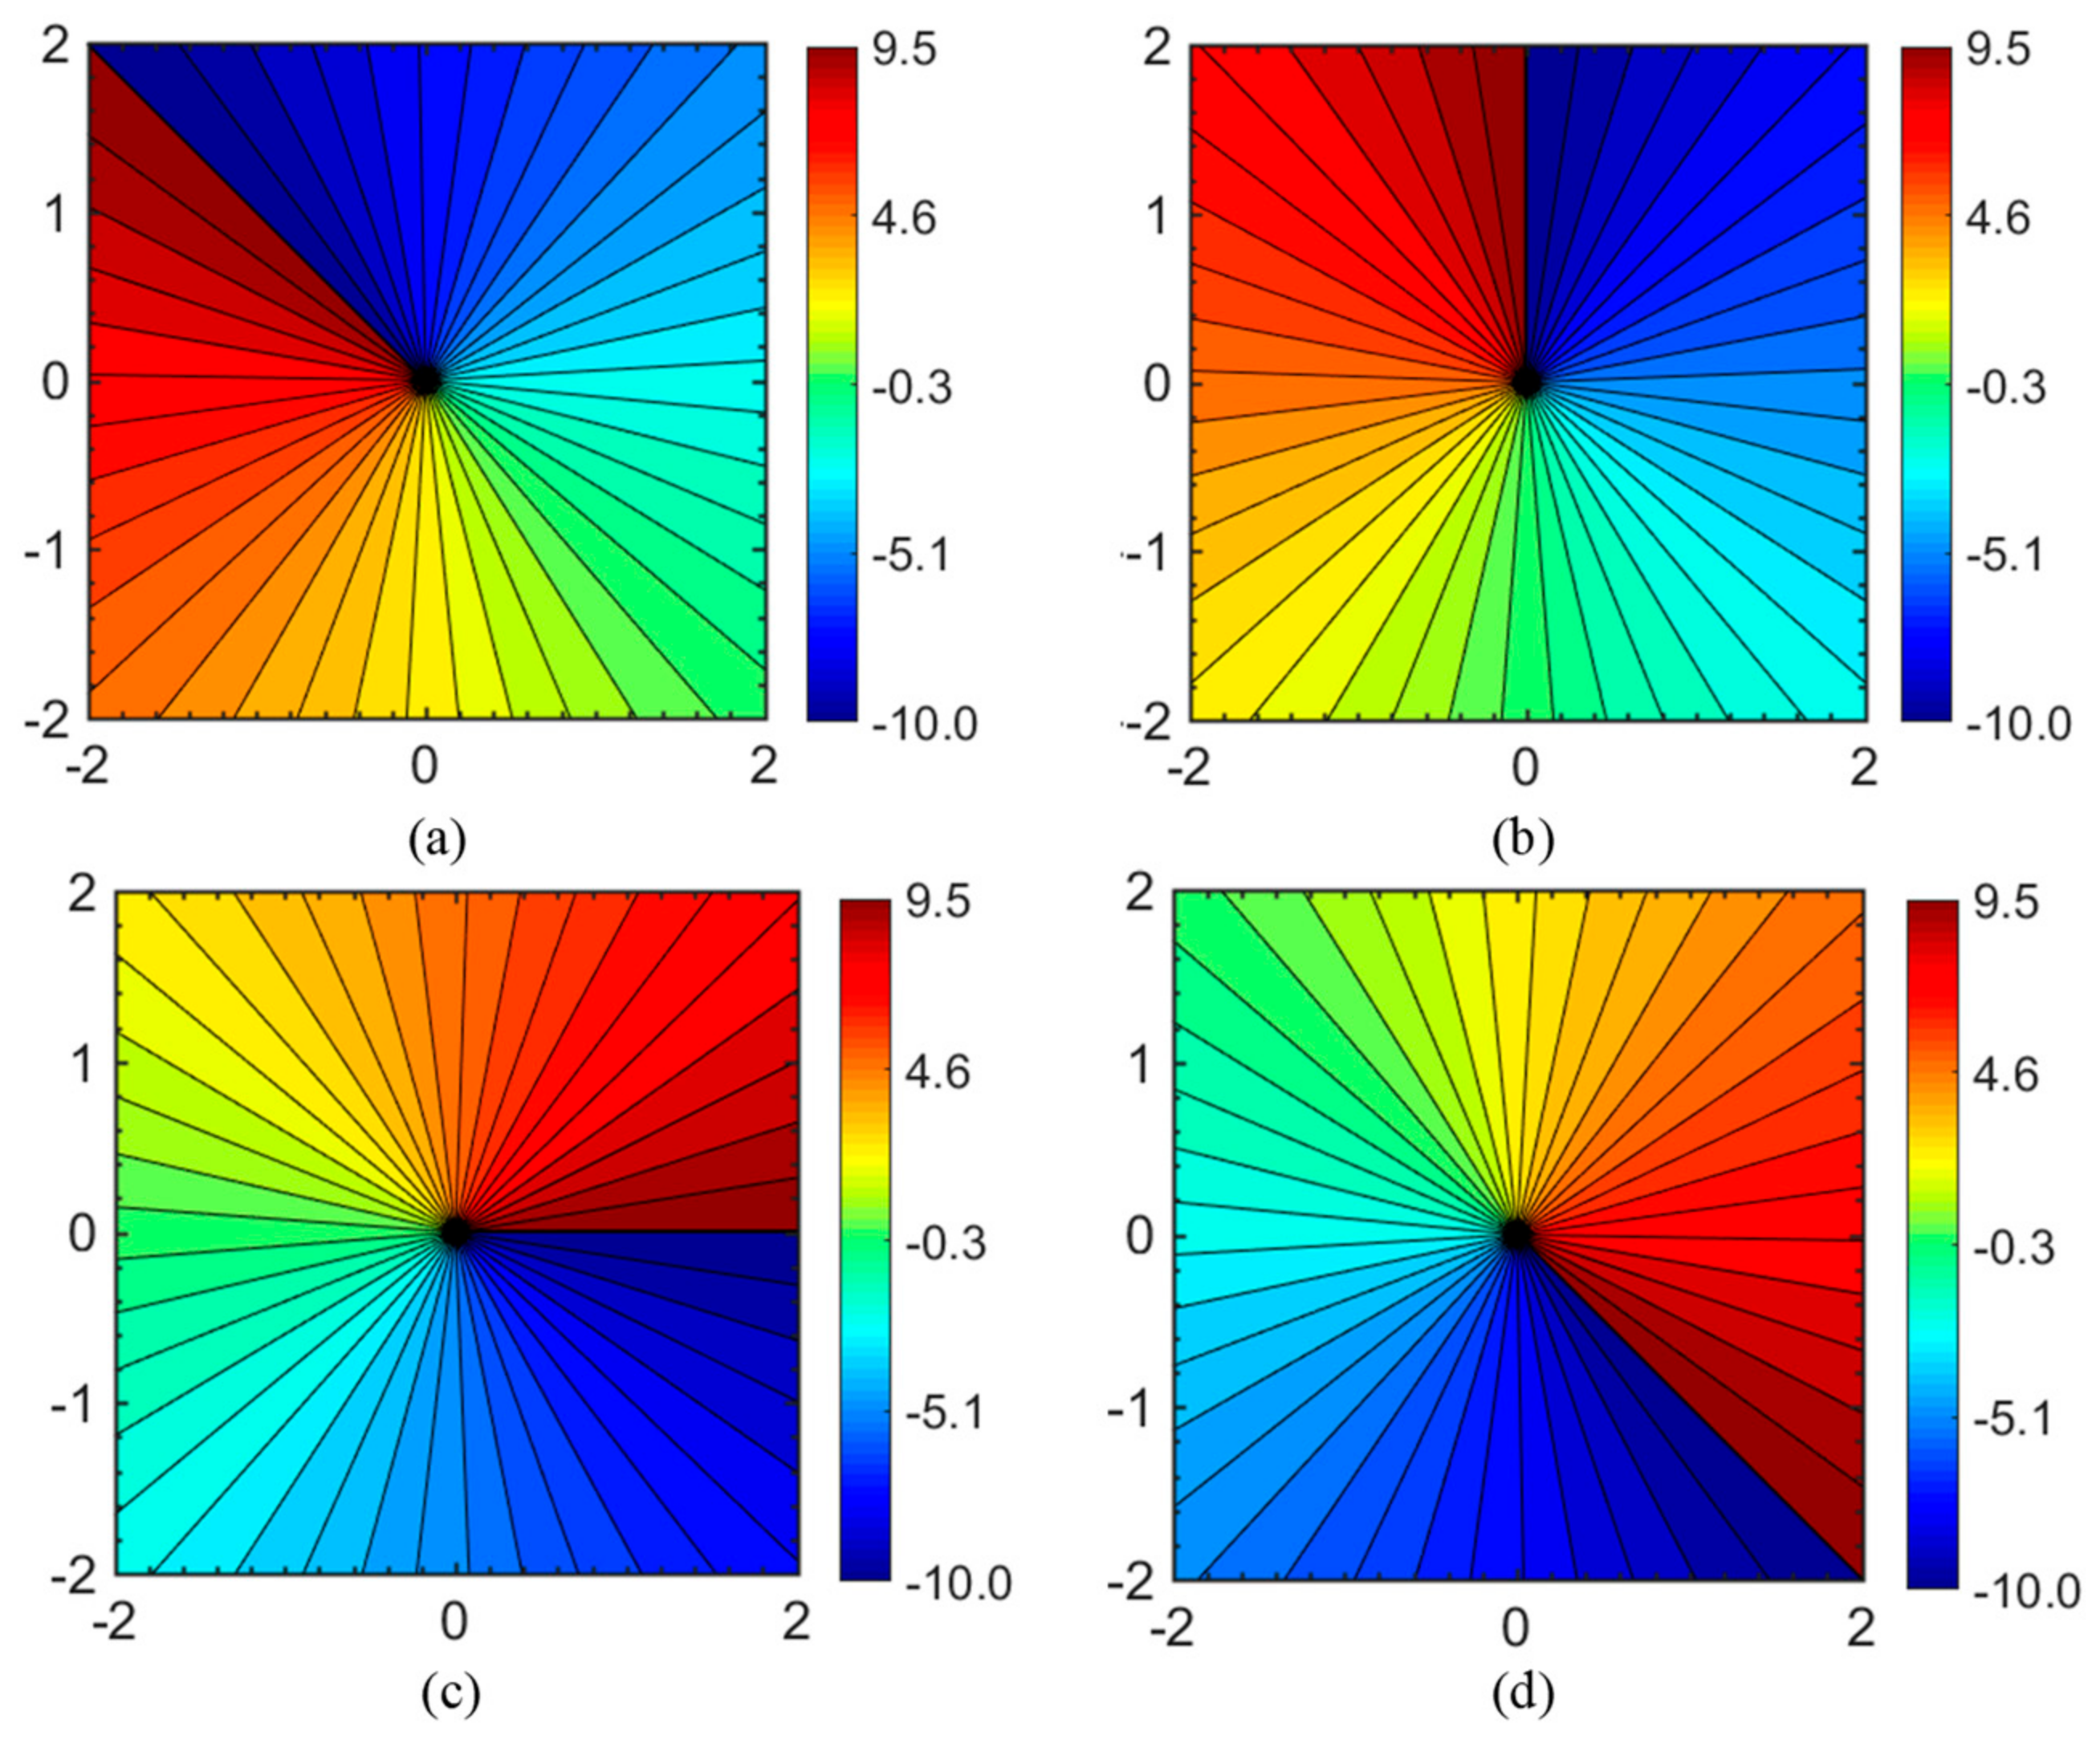
The stream function solution of Figure 3b is not a branch cut that would pose any challenge in physical interpretation, because the segmented region where the minimum and maximum of the stream function meet does not pose any physical barrier for the flow, only an arbitrary reference line for the flux computation. However, the potential function solution of Figure 4a we label as a critical branch cut choice, which would pose an apparent obstacle for 2D flow across the branch cut. Fluid in the clockwise rotating vortex flow would need to jump over the implied pressure gradient barrier at the location of the branch cut, from low to high pressure. This is purely a mathematical artefact or choice that assigns a single value to a multi-valued complex elementary function [13], which nonetheless could create confusing plots if not properly interpreted. For the vortex field, any radial may be chosen as the desired branch cut location (Figure 5a–d), which highlights that the vortex has a quasi-continuous potential function (pressure gradient). However, when we analyze flows due to complex potentials of superposed flow elements, the location of the branch cuts may leave open many choices, some less practical than others, as we will discuss in detail in Section 3.3.

2.3. Superposed Invariant Complex Potentials: Doublet Flow

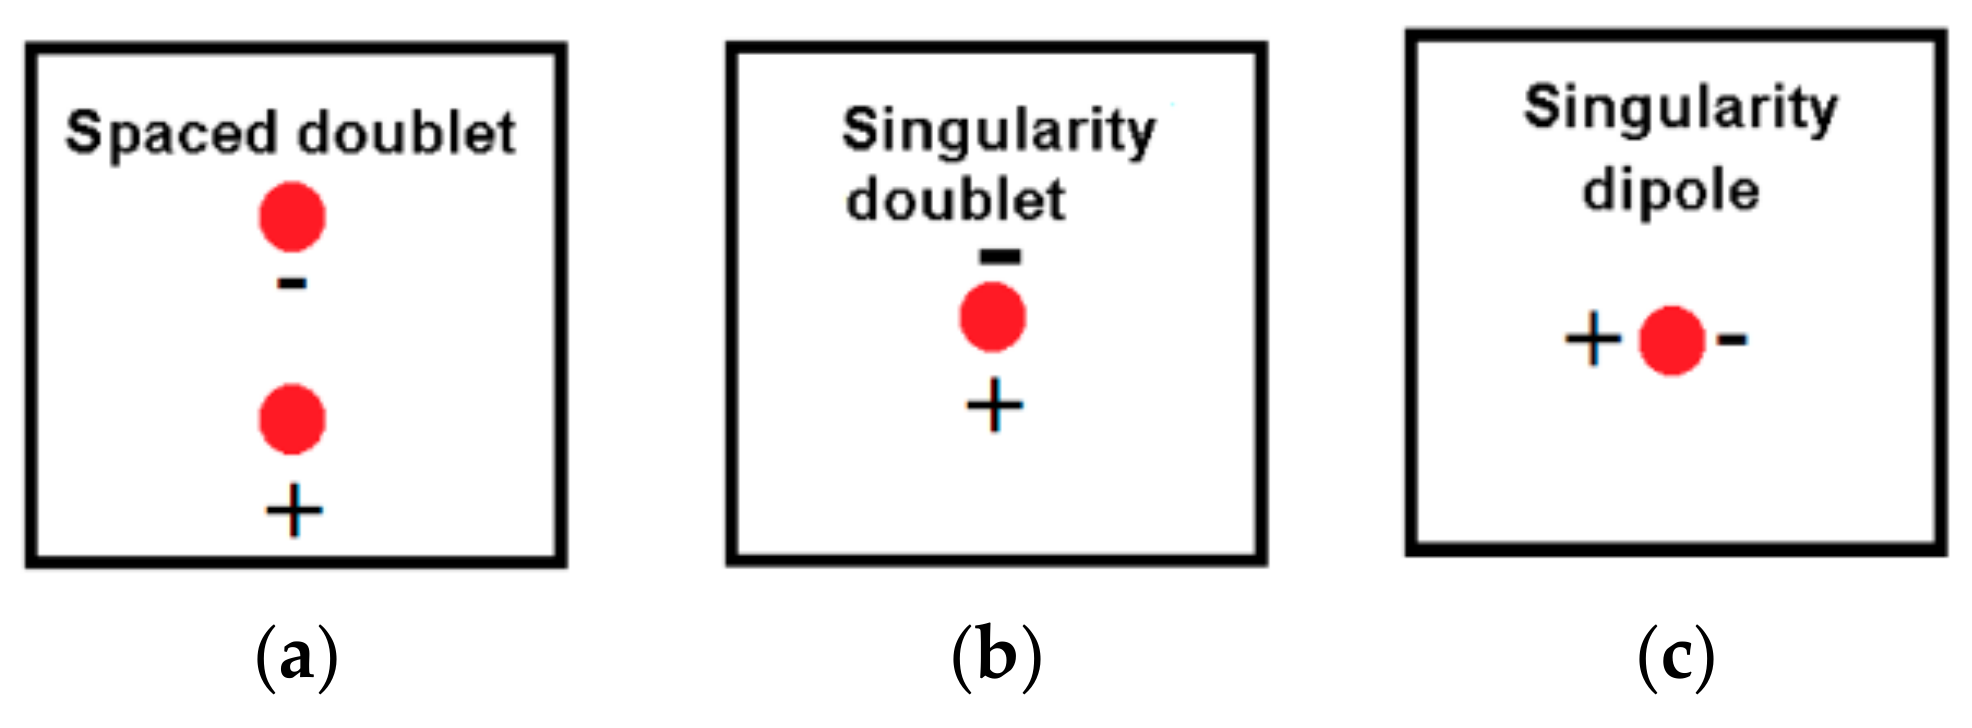
The complex potential for a so-called spaced doublet is derived by combining the vector fields for a point source and a point sink of equal strength located at z1 and z2 respectively (Figure 6a). For a singularity doublet, a limiting process that decreases the distance between the point source and sink (z1–z2) to zero (Figure 6b), gives the required complex potential [14]. The singularity doublet and singularity dipole can both be described by an invariant complex potential (Section 2.3.1 and Section 2.3.2). The distinction between doublets and dipoles was originally proposed by Strack [15], which was required for constructing line arrays called, respectively, line doublets and line dipoles. The distinction is made based on the polarity orientation of these elements (for later use in a superposition procedure. see Section 2.4). The line doublet has the unique straight streamline of each singularity doublet oriented perpendicular to the line array. In contrast, the line dipole aligns the symmetry streamline with the line array of all singularities. The distinction between doublets and dipoles by Strack [15] was adopted in a later study by Weijermars and van Harmelen [14], and is further analyzed in the present study.

2.3.1. Singularity Doublet

The complex potential for a singularity doublet with a strength of µ (m3·s−1) located at zd in a complex plane, obtained by integrating the vector field is [14]:
Ω ( z ) = i . μ 2 π ( z z d )      ( m 2 · s 1 )
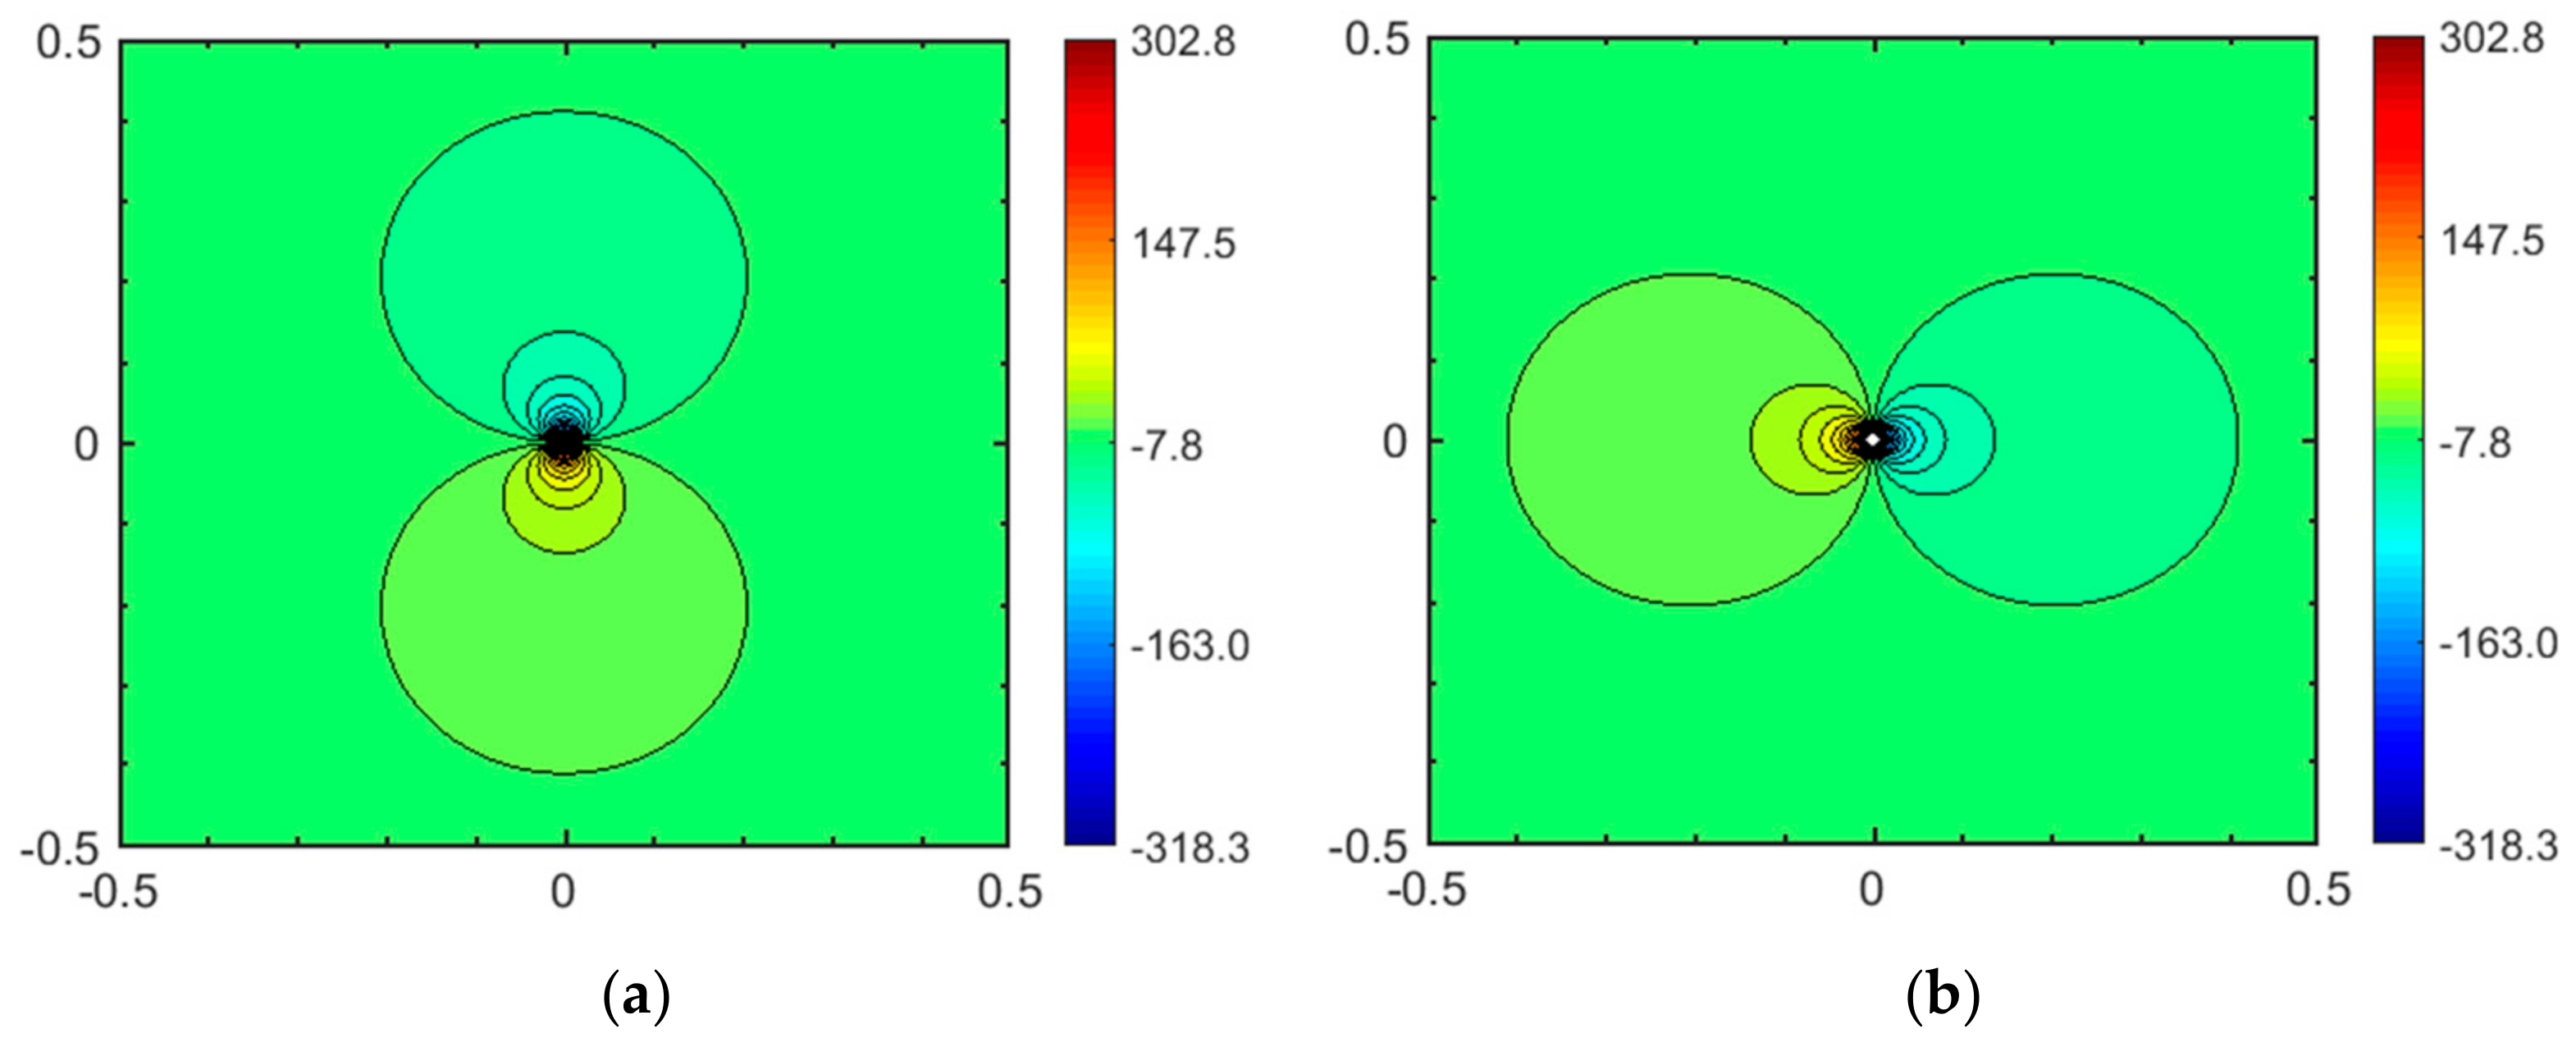
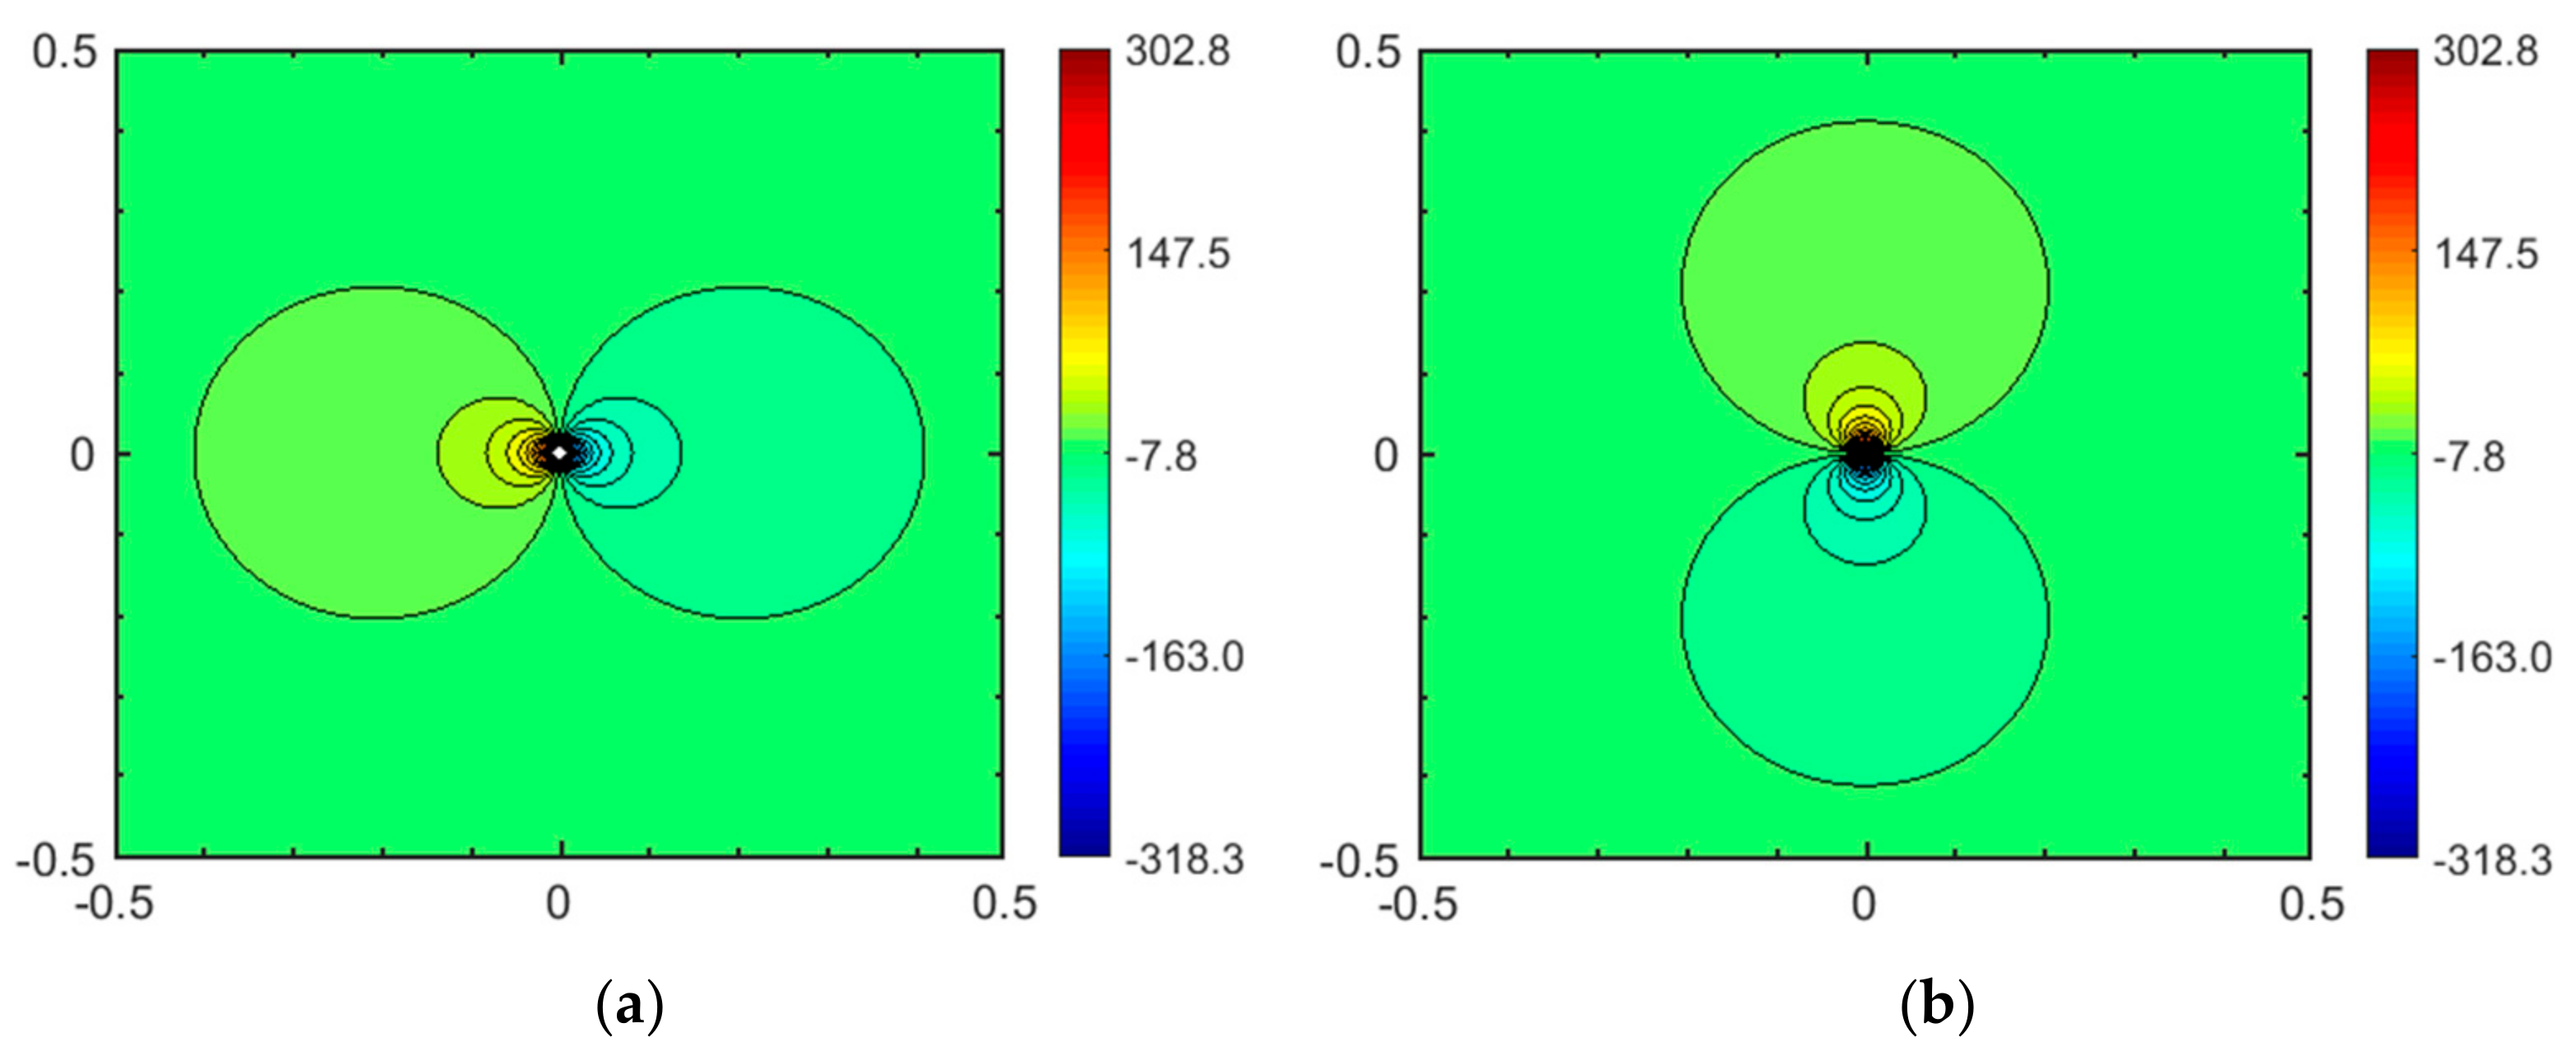
The pressure field potential, ϕ , is the real part of the complex potential Ω ( z ) = ϕ + i ψ , which for a singularity doublet, using polar coordinates (r, θ ) for simplicity (Figure 7a), is:
ϕ ( r , θ ) = μ 2 π · cos θ r      ( m 2 · s 1 )
The stream function, ψ , due to the imaginary part of the complex potential (Figure 7b), is:
ψ ( r , θ ) = μ 2 π · sin θ r      ( m 2 · s 1 )

2.3.2. Singularity Dipole

When the real and the imaginary parts of the complex potential of Equation (5a) for the singularity doublet are switched, through division of the right-hand terms in Equation (5a) by an imaginary number i, and replacing the doublet strength, µ (m2·s−1), with µ* (m2·s−1), the new complex potential becomes:
Ω ( z ) = μ * 2 π ( z z d )      ( m 2 · s 1 )
The potential function, ϕ , and the stream function, ψ , for the rotated point doublet (Figure 8a,b), using polar coordinates (r, θ ), are:
ϕ ( r , θ ) = μ * 2 π · sin θ r      ( m 2 · s 1 )
ψ ( r , θ ) = μ * 2 π · cos θ r      ( m 2 · s 1 )
The complex potentials of Equations (5a) and (6a), if scaled by the same strength µ = µ*, clearly describe two flows that are physically identical (save a rotation over π/2). Such complex potentials are termed here invariant (Table 1). Although the rotated singularity doublet flow of Figure 6b is physically identical to that of Figure 6c (except for a reference frame rotation), the flow of Figure 6c is termed a point dipole, to aid the distinct of the superposition series in Section 2.4.

2.4. Superposed Variant Complex Potential: Line Doublets and Line Dipoles

A point doublet, or singularity doublet, is an analytical element where one side of the singularity is the source (+) and the other side is the sink (−) (Figure 6b). The point (or singularity) dipole is an analytical element like the singularity doublet, but the source and sink sides are rotated 90° clockwise (Figure 6c). The distinction between a singularity doublet and singularity dipole becomes important when considering a linear array of superposed singularity doublets (Figure 9a) or a linear array of superposed dipoles (Figure 9b). The flow regimes of each of these superposed arrays are physically different and have distinct implications in hydrocarbon well placement, geothermal reservoirs, and flow through a heterogeneous reservoir [3,14,15].

2.4.1. Line Doublets

The complex potential for modeling the flow near discrete fractures makes use of the superposition of line doublets (see Section 4), and can be obtained from the complex potential for a singularity doublet with a strength of m (m3·s−1)located between za and zb in a limiting superposition process (Figure 9a):
Ω ( z ) = i . m [ L o g ( z z a ) L o g ( z z b ) ] 2 π ( z a z b )      ( m 2 · s 1 )
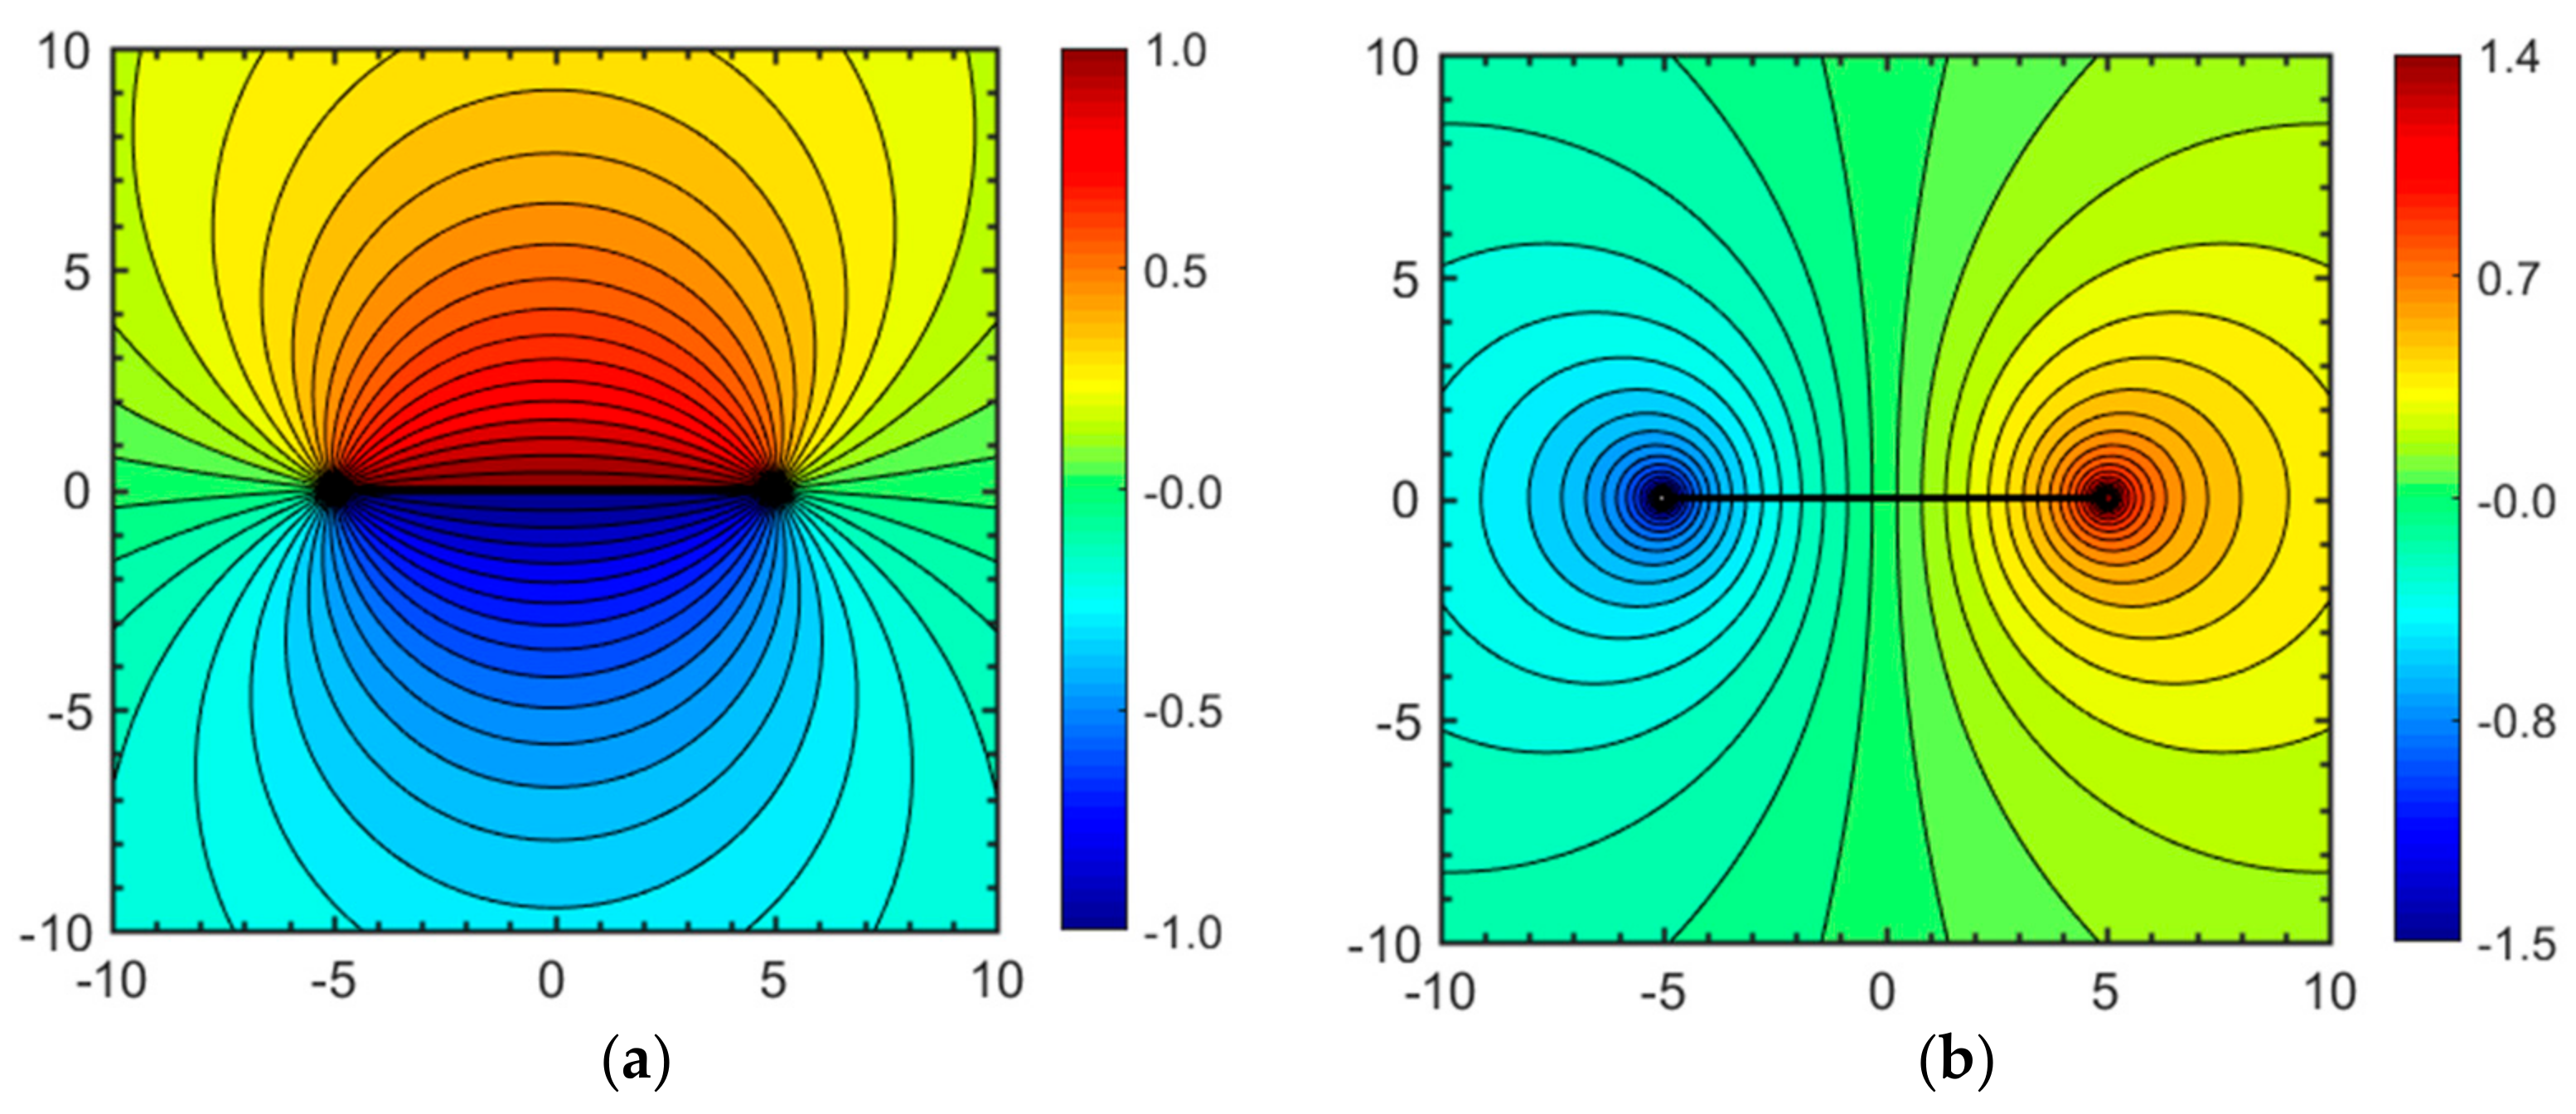
The potential function (Figure 10a), ϕ , is mapped by the real part and the stream function (Figure 10b), ψ , is given by the imaginary part the complex potential Ω ( z ) = ϕ + i ψ respectively.

2.4.2. Line Dipoles

The complex potential for a line dipole with a strength of m (m3·s−1) located between za and zb in a complex plane, can be obtained by superposing dipole singularities in a limiting process (Figure 9b):
Ω ( z ) = m [ L o g ( z z a ) L o g ( z z b ) ] 2 π ( z a z b )      ( m 2 · s 1 )
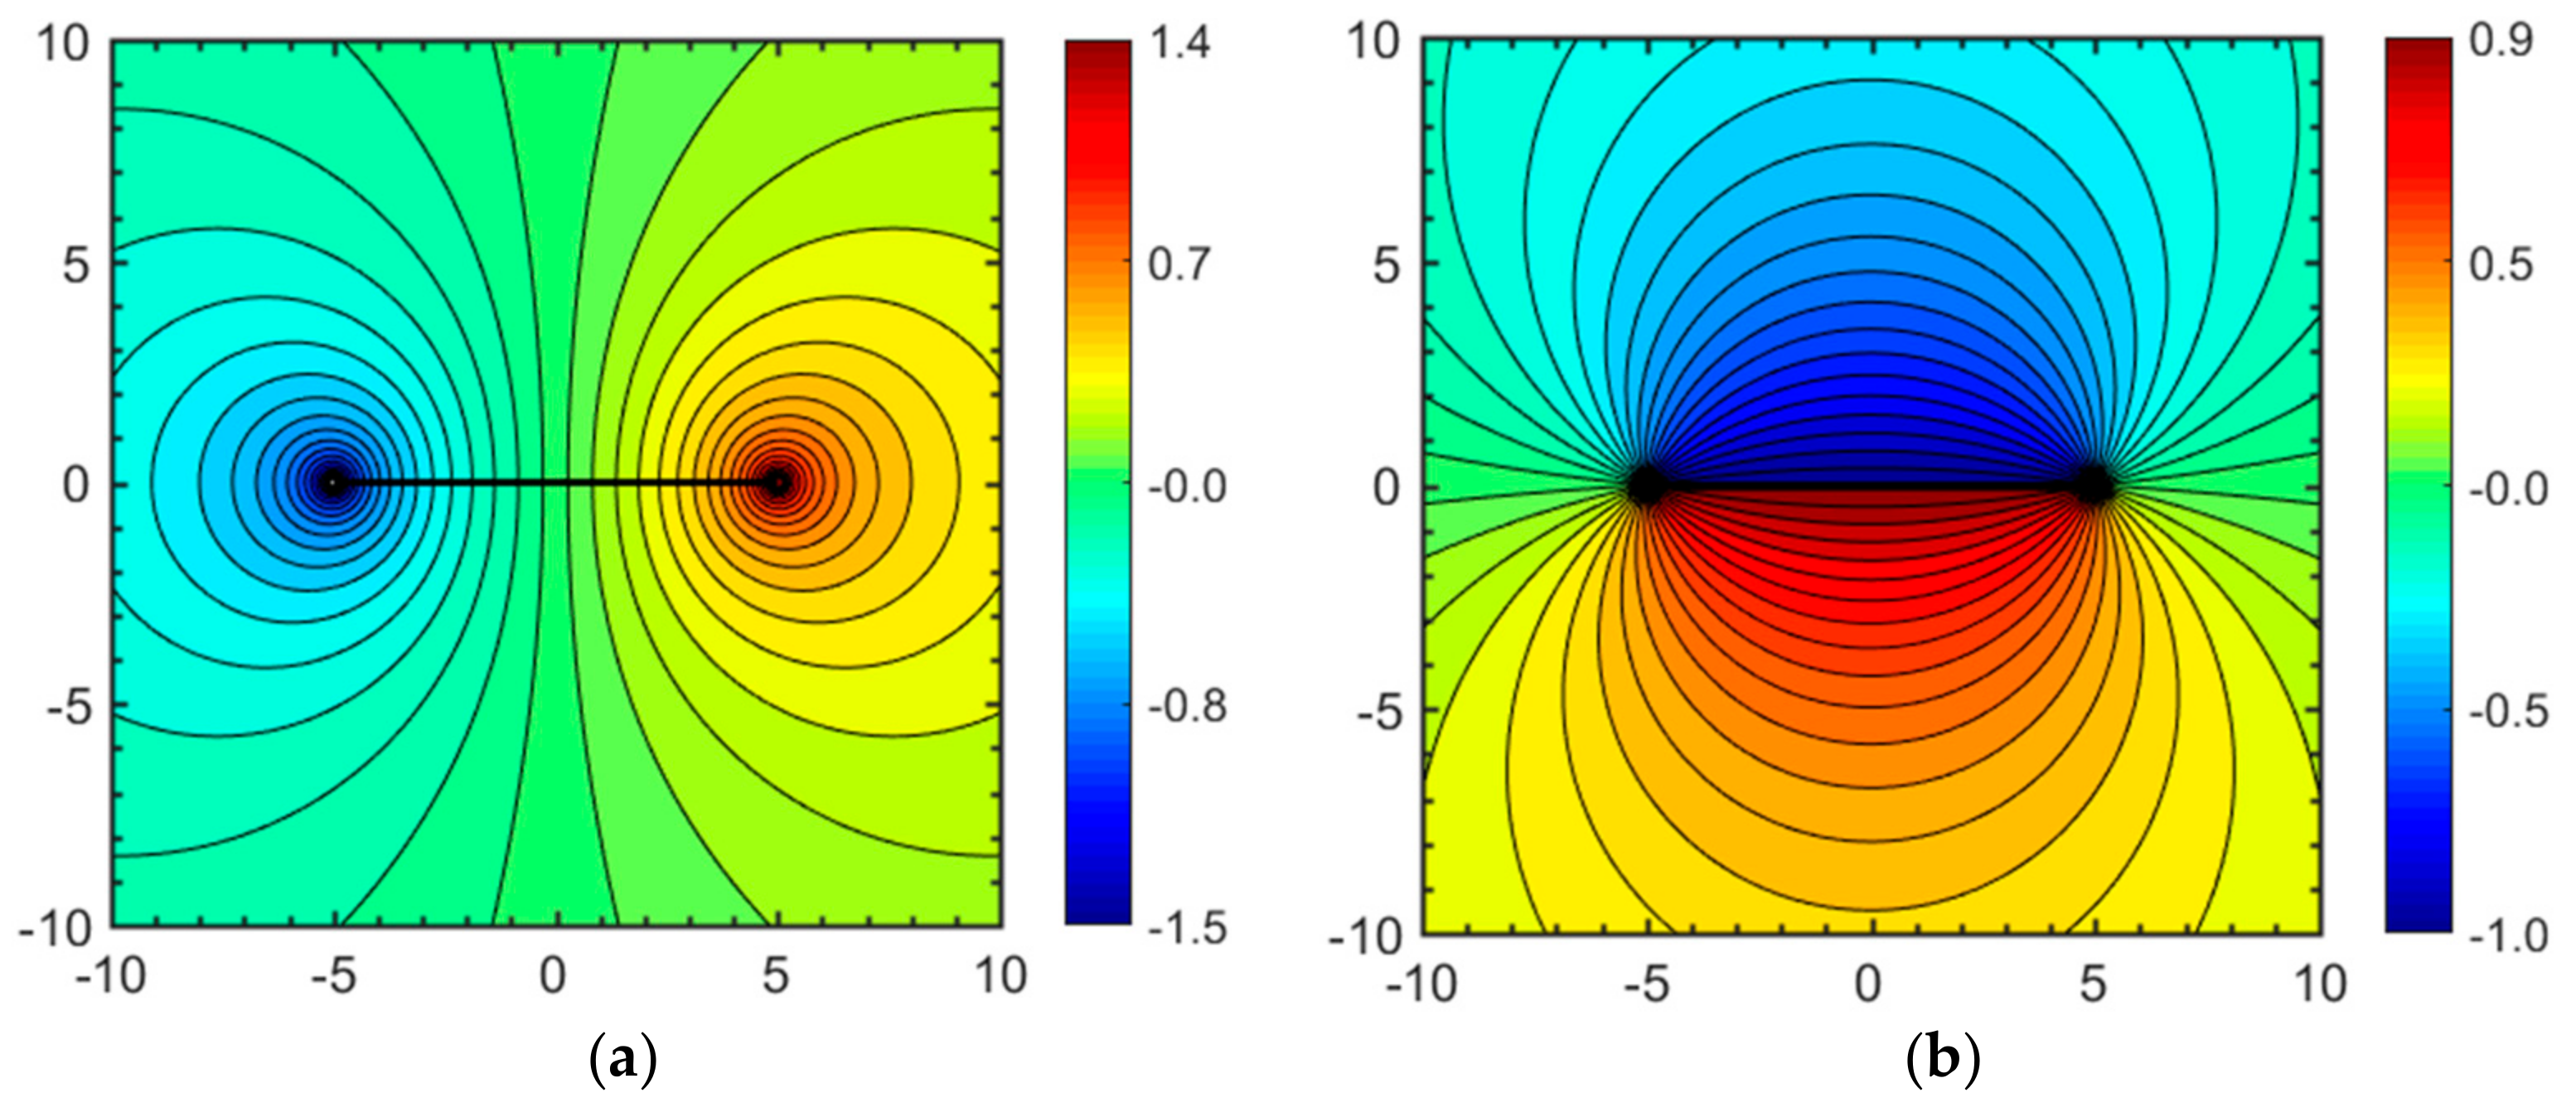
The potential function (Figure 11a), ϕ , and the stream function (Figure 11b), ψ , are mapped by the real part and the imaginary part of the complex potential respectively (see Equation (1)). The complex potentials of Equations (7) and (8) clearly describe two flows that are physically different. Such complex potentials are termed here variant (Table 1).

3. Complex Potentials to Describe Flow in Enhanced Permeability Flow Channels—Invariant Complex Potentials

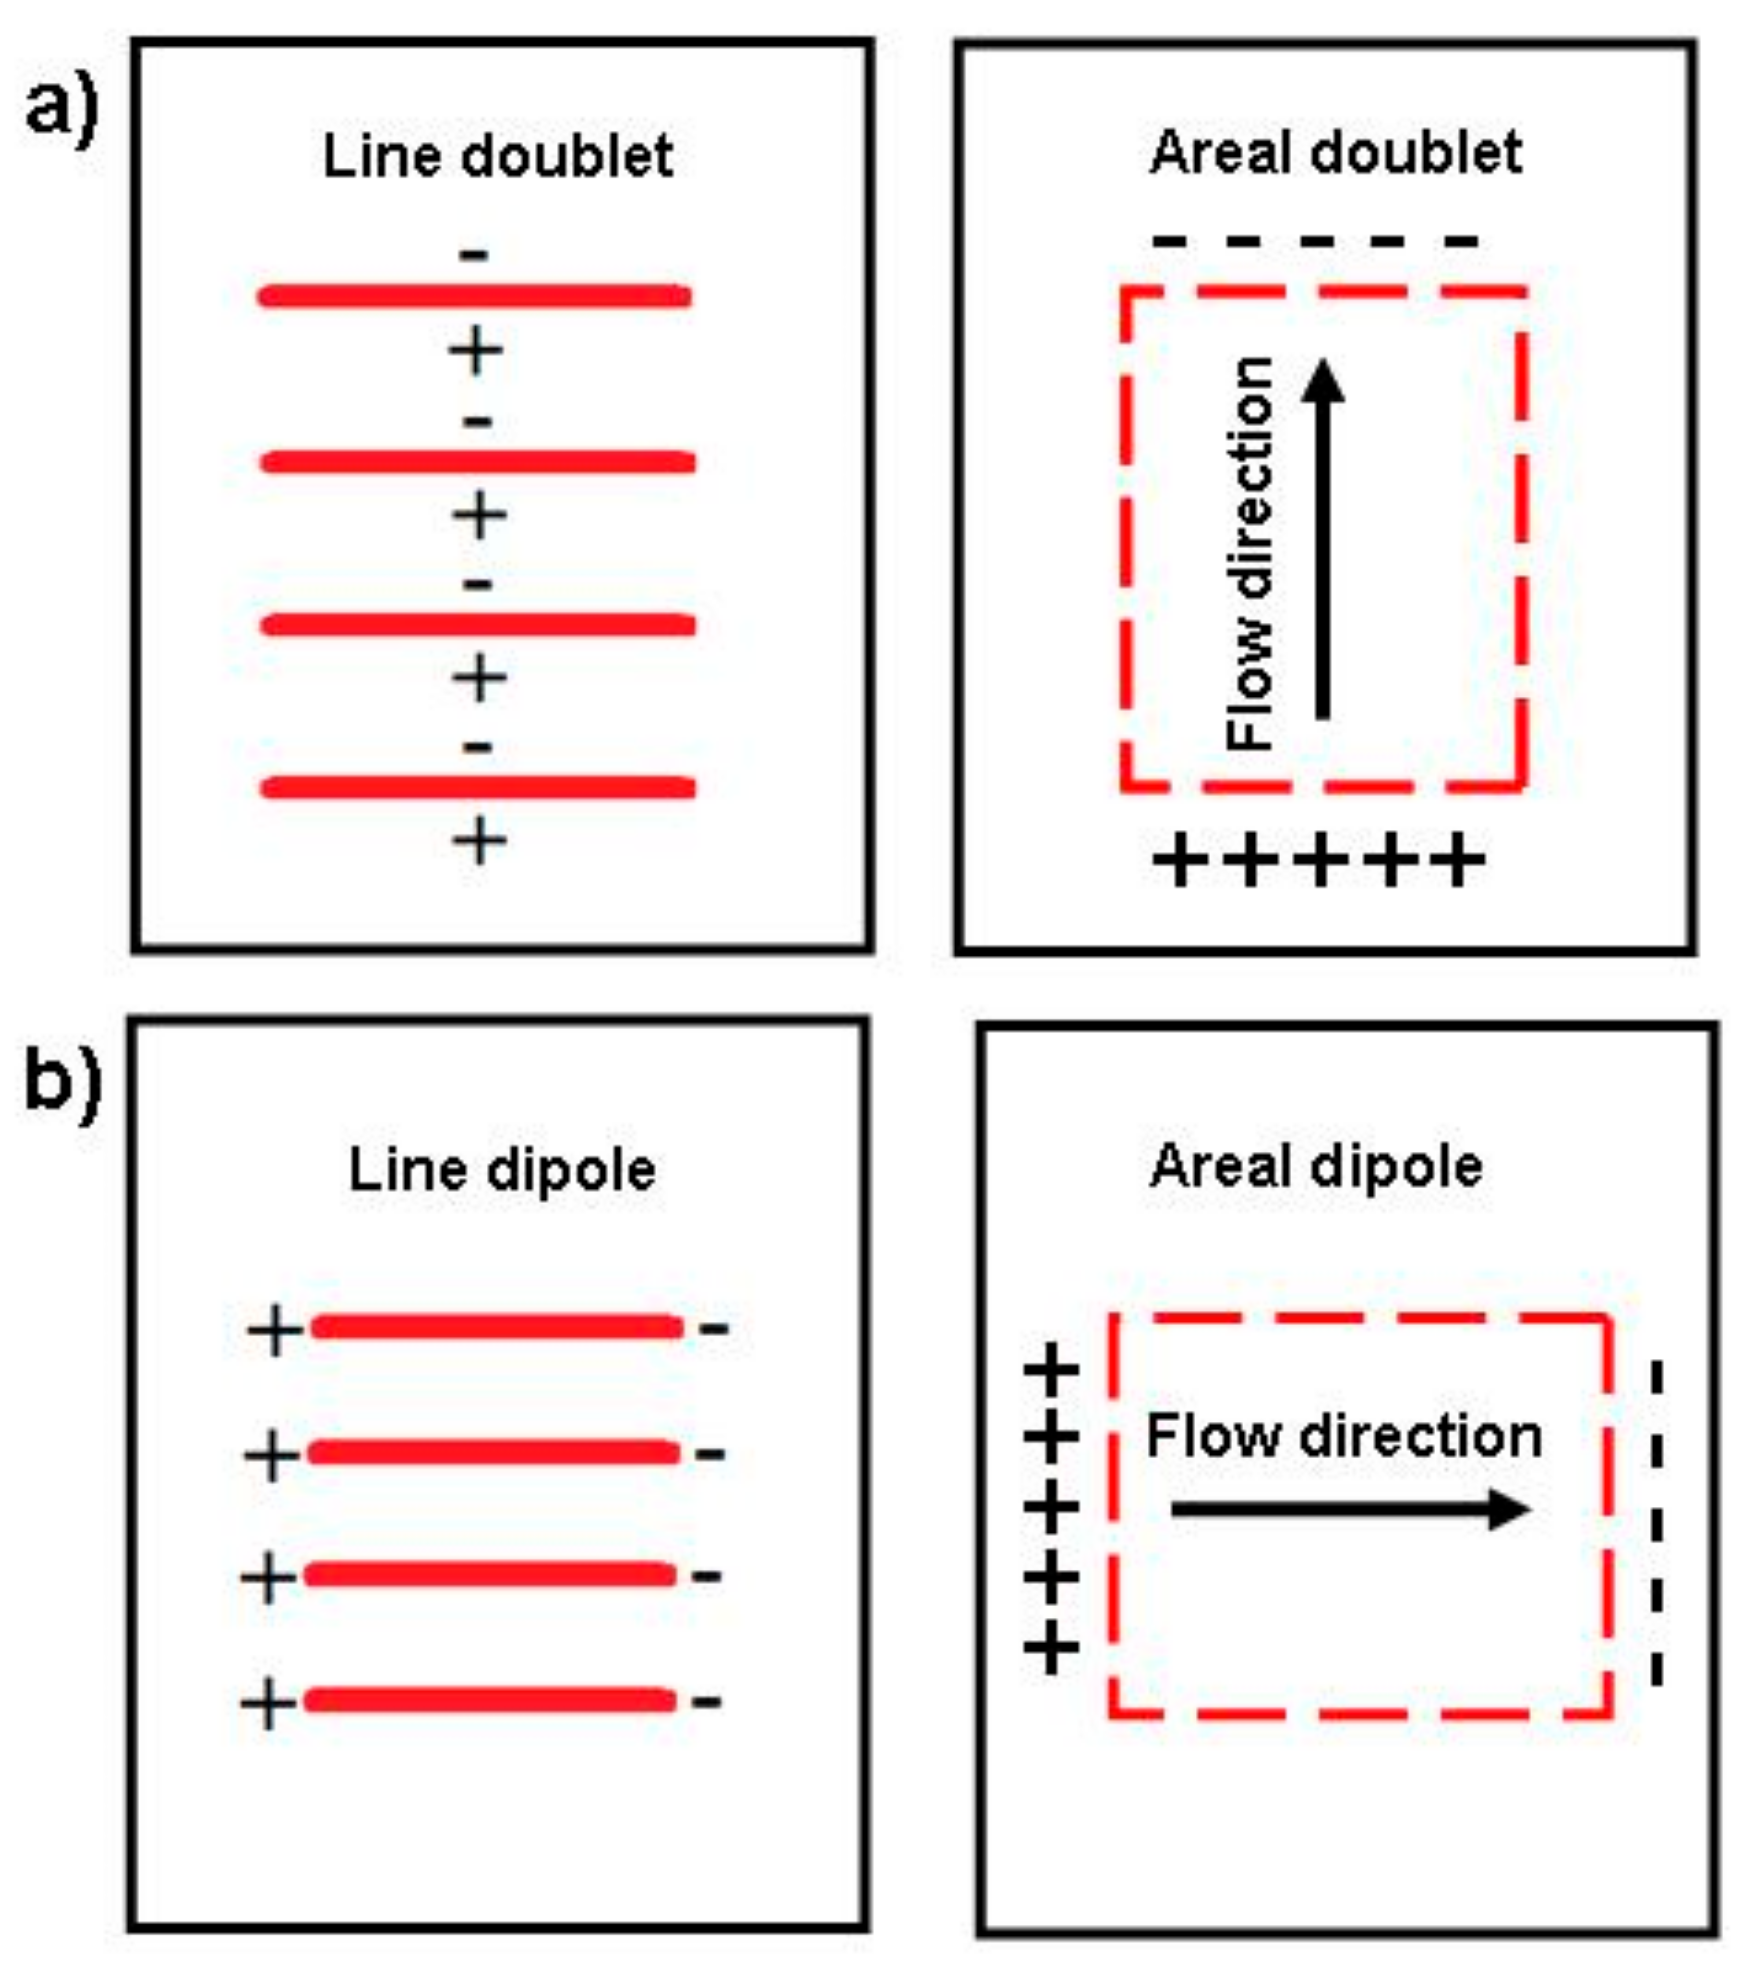
Van Harmelen and Weijermars [3] introduced an analytical element to describe flow through permeable fractures, which enhance fluid velocity locally, by superposing an infinite number of line doublets. Figure 12a shows the spatial arrangement of line doublets to be integrated to obtain what is coined here as an areal doublet element. The same element was originally referred to as a natural fracture element [3], because the element may model flow in discrete fractures. However, using the term “areal doublet element” in hindsight seems more objective than “natural fracture element” as the element can model flow accelerators in porous media. Below we show that an element similar to the areal doublet can be obtained via an alternative superposition of line dipoles, following the spatial integration method sketched in Figure 12b.

3.1. Branch Cut Issues

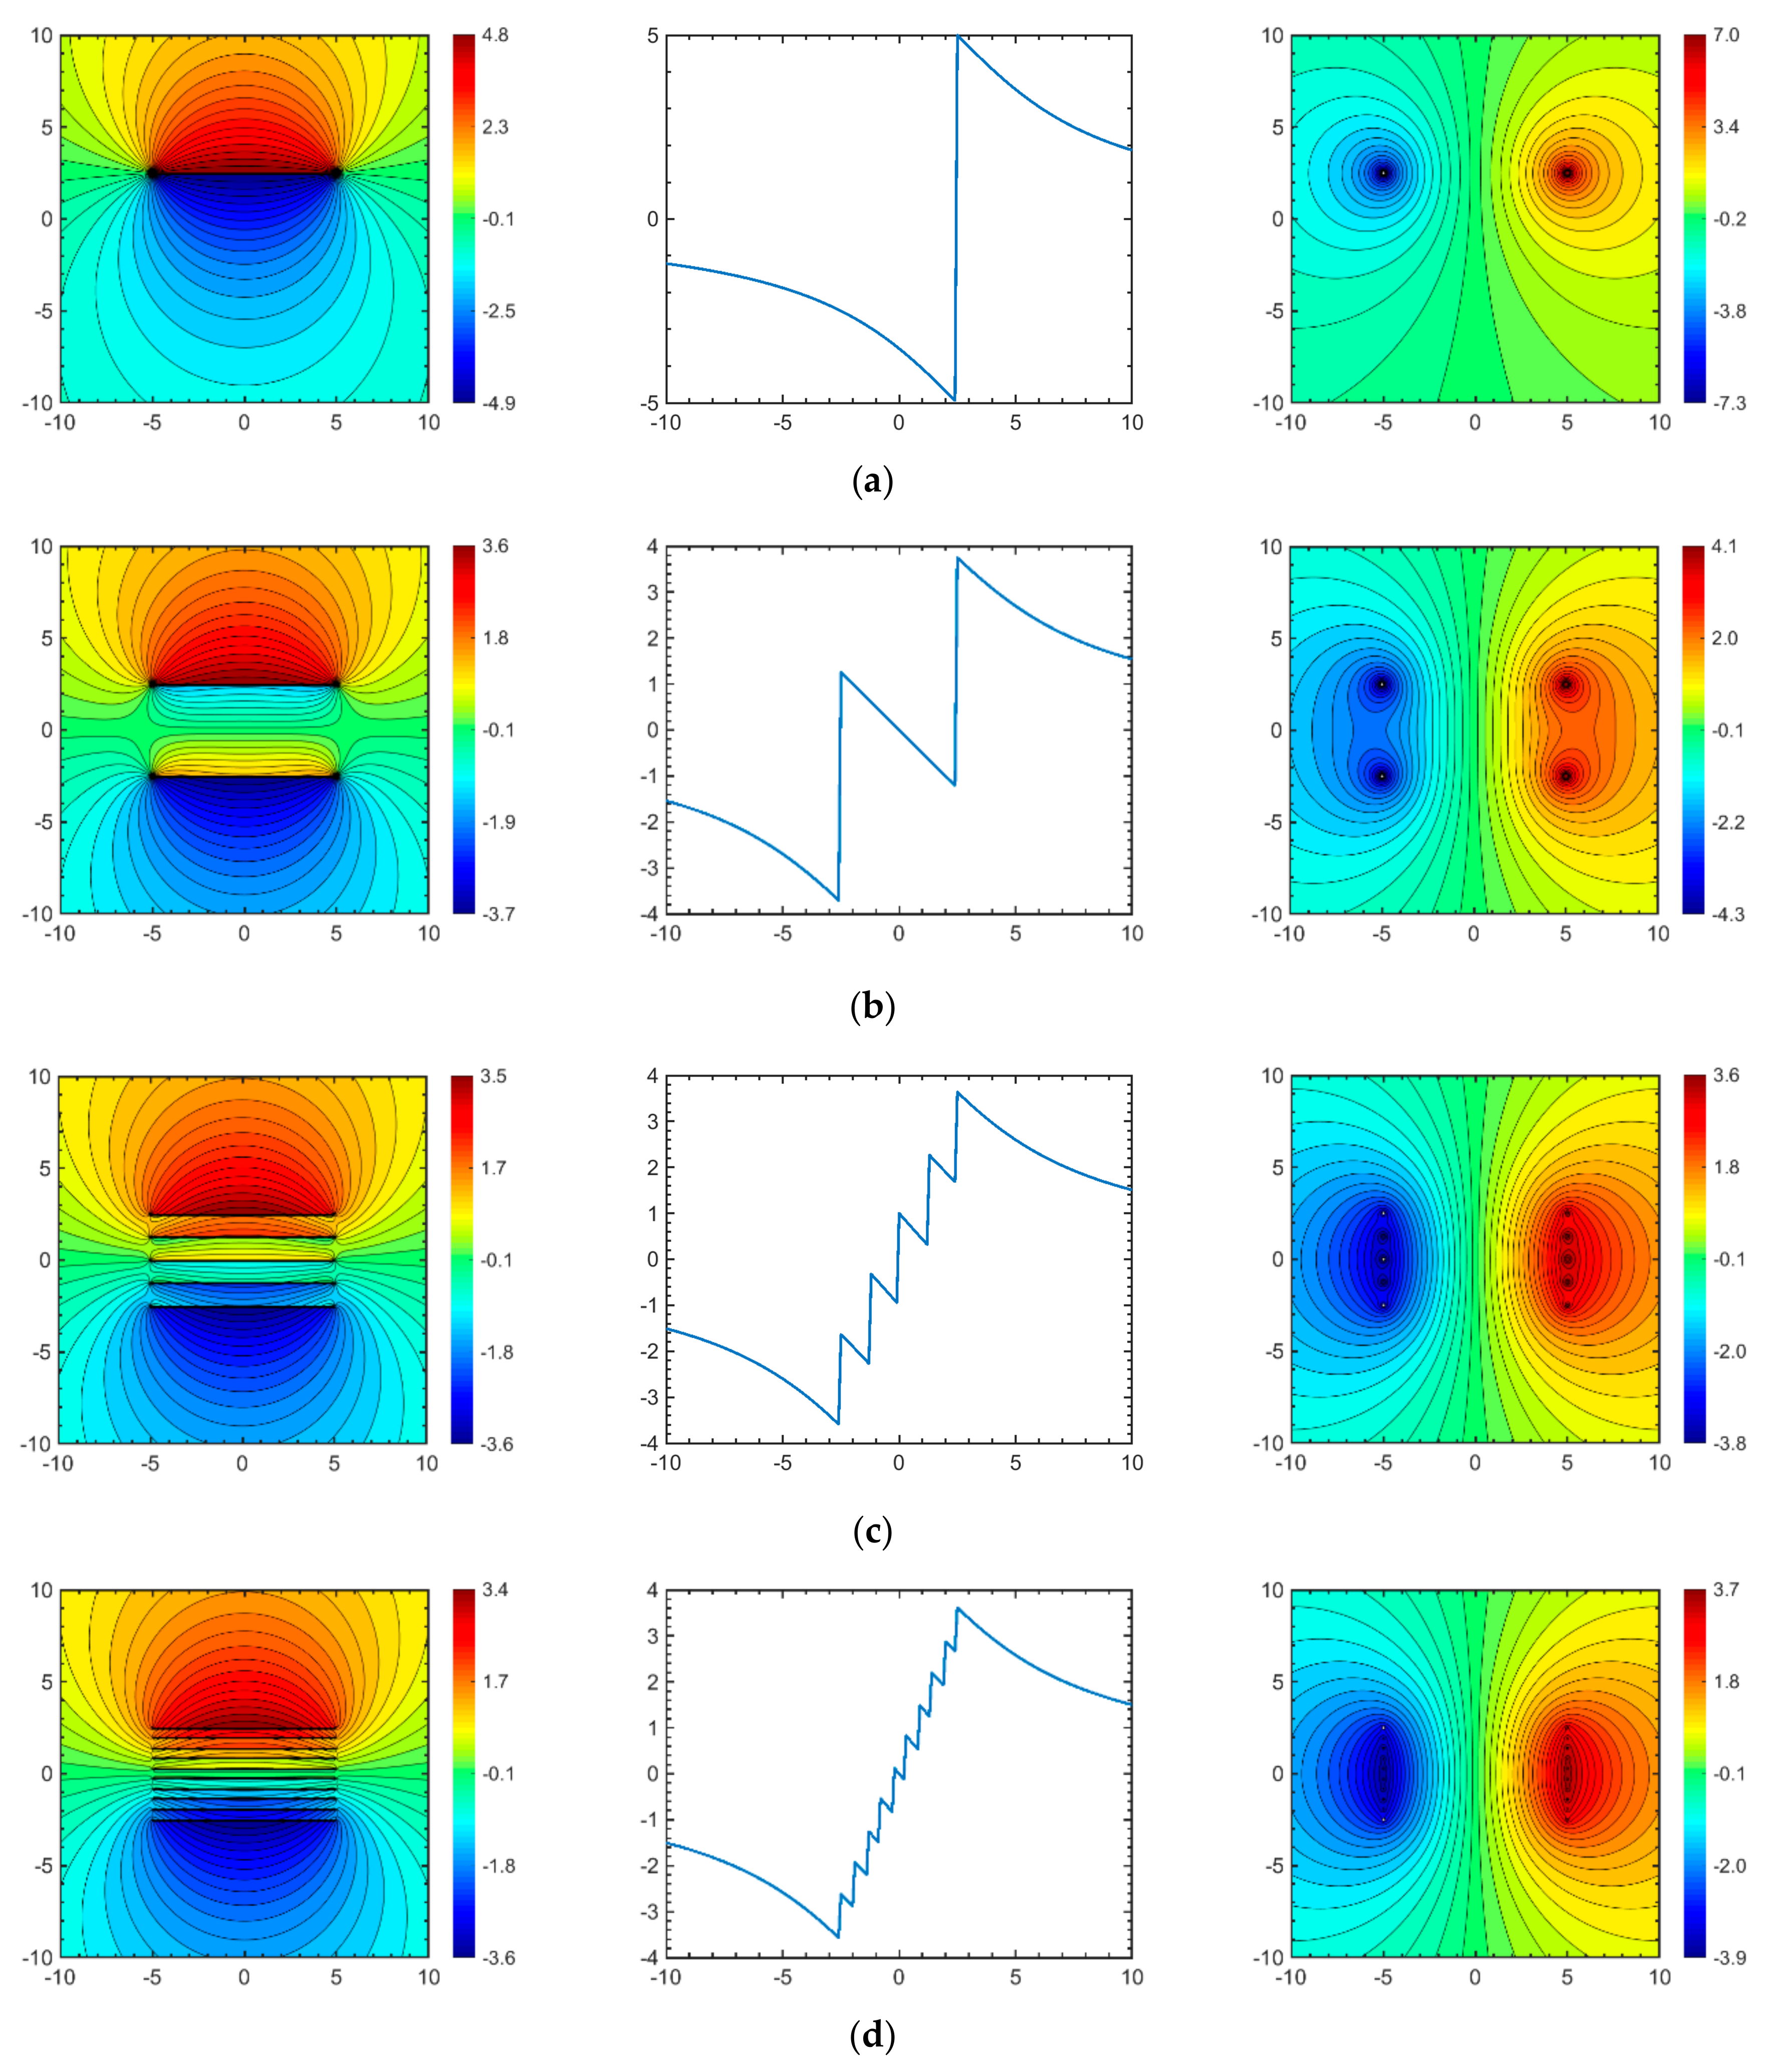
Before discussing the areal doublet, Figure 13a–d show the potential function (left) and stream function (right) solutions obtained by discrete superposition of different number of line doublets. The potential function solution (left) exhibits an increasing number of branch cuts (Figure 13a–d), corresponding to the number of superposed line doublets. Discrete jumps in the value of the potential function (a proxy for pressure gradients), due to the branch cuts, are graphed in the central images. What is potentially confusing is the occurrence of an “apparent” adverse pressure gradient when the number of superposed line doublets increases, and the branch cut spacing is reduced accordingly. The pressure gradient in the central region between the outer line doublets remains favorable to flow from high to low (as opposed to adverse pressure gradients), but involves many pressure jumps. When the number of branch cuts increases, a superficial inspection may suggest and adverse pressure gradient develops in the central region between the outer branch cuts. This flow adversity of the potential function gradient is purely a resolution effect, the pressure gradient remains favorable to flow, but the difference between branch cut jumps and pressure gradients is no longer visually discernable when the number of superposed line doublets increases.
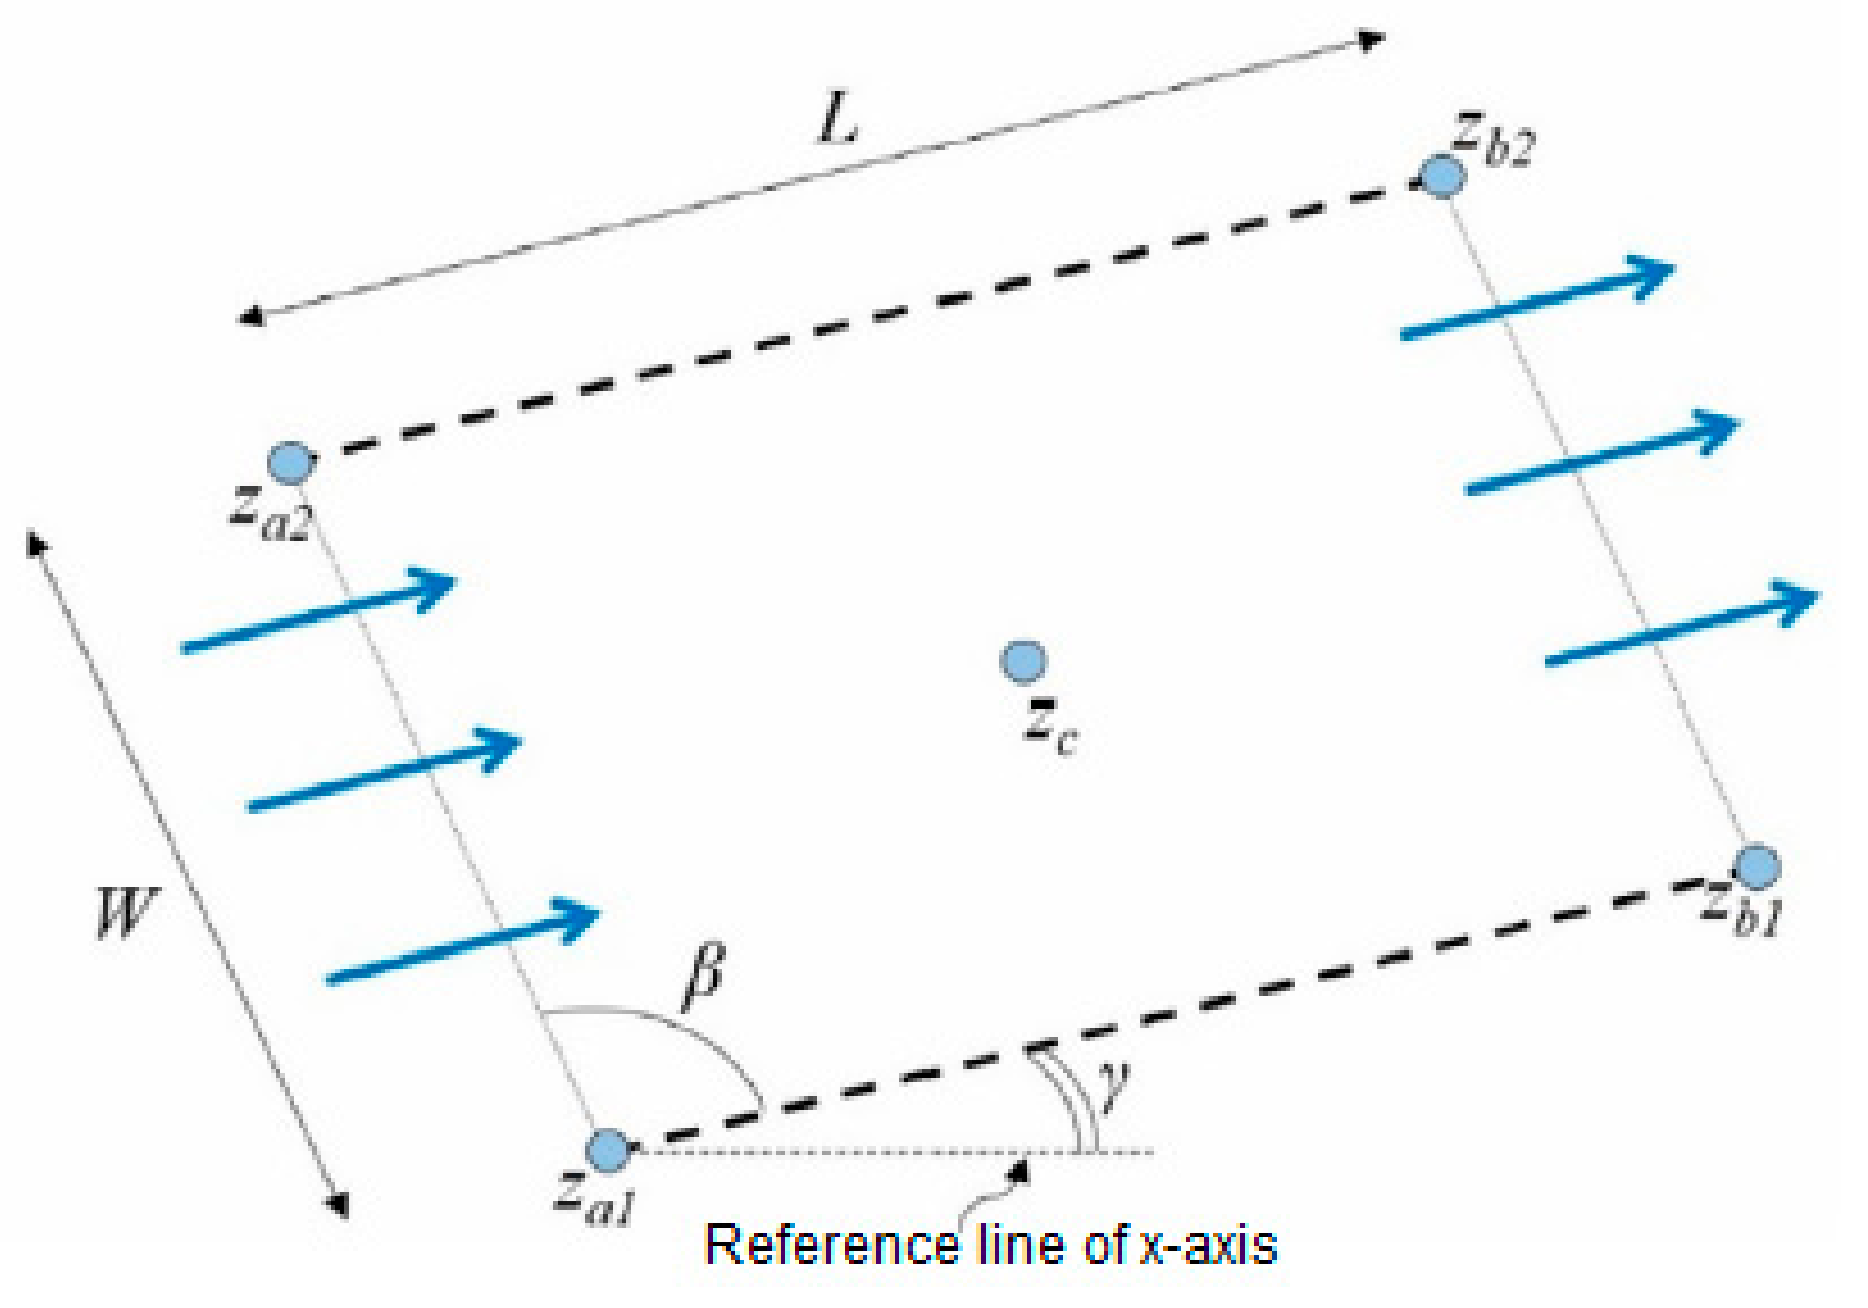
The branch cuts are “folded” into the fracture zone confined between the vertices za1–za2 and zb2–zb1, using the vertices as defined in Figure 14. In fact, there is an infinite number of branches due to the analytical element being formed by integrating numerous discrete doublet elements. The inner branch cuts get cancelled as seen in Figure 13a–d, and only two outer branches remain (at the entry and exit of the flow channel). This is similar to what is observed in Figure 13a–d where only the other two branch cuts remain in the potential field when the number of line doublets are increased.

3.2. Areal Doublet

The complex potential for the areal doublet, used in a prior study of flow in fractures [3], is obtained by superposing an infinite number of line doublets (see Equation (B12) in [3]):
Ω ( z ) = i υ ( t ) 2 π h n L W . e i γ [ ( z + z a 2 ) ( log ( e i γ ( z z a 2 ) ) ( z + z a 1 ) ( log ( e i γ ( z z a 1 ) ) + ( z + z b 1 ) ( log ( e i γ ( z z b 1 ) ) ( z + z b 2 ) ( log ( e i γ ( z z b 2 ) ) ]      ( m 2 · s 1 )
where υ (m4·s−1) is the strength, which is assumed to be steady here, but may be time-dependent for certain cases, γ (radians) is the tilt angle with x-axis, β (radians) is the angle between the corner points (Figure 14), h (m) is the height, L (m) is the length, W (m) is the width, za1, za2, zb1, and zb2 (Figure 14) are co-ordinates for the vertices calculated from center co-ordinate, zc, as follows:
z a 1 = z c e i γ ( 0.5 L + 0.5 W e i β ) z a 2 = z c e i γ ( 0.5 L 0.5 W e i β ) z b 1 = z c e i γ ( 0.5 L + 0.5 W e i β ) z b 2 = z c e i γ ( 0.5 L 0.5 W e i β )      ( m )
The tilt angle with x-axis, β (radians), in this study is exclusively used as π/2 in order to create the flow channels which are rectangular in shape. The pressure function (Figure 15a,b), ϕ , and the stream function (Figure 15c), ψ , are mapped by the real part and the imaginary part of the complex potential respectively (see Equation (1)).

3.3. Branch Cut Choices for Areal Doublet

The solutions of the potential function (Equation (9c)) and stream function (Equation (9d)) by standard software platform solvers introduce branch cut choices. For simpler expressions (such as solutions of Figure 5a–d), the solver functions embedded in the mathematical software work well to separate the real and the imaginary parts of the complex potential to plot the potential and the stream functions, respectively. However, for an expression as complex as the one in Equation (9a), the expression must be manually solved to avoid the appearance of branch-cuts in impractical locations (see Appendix A, Appendix A3). Several logarithmic functions, with non-zero argument, are present in Equation (9a) which results in branch cuts in the potential function solution (Figure 15a) of Equation (9c), manifested as discontinuities in the pressure field when solved with MATLAB. The branch cuts do not appear in the stream function solution (Figure 15c) based on Equation (9d).
The pressure fields of Figure 15a,b are meant to illustrate the problem that arises with the scaling of the outer pressure field (Figure 15a, when not folding the branch cuts into the fracture) due to the pressures magnitude monotonically increasing to an infinitely large value in the zone between the branch cuts which extends to infinite (outside the top of the picture). By folding the branch cuts inside the fracture (Figure 15b), the pressures values immediately outside the fracture will not be suppressed by infinitely high pressures arising in Figure 15a as a result of the unfavorable branch cut placements.
Contour integration of several mathematical functions involving square roots, power, natural logs, and inverse trigonometric functions, are multi-valued and thus may result in branch cuts appearing in inconvenient locations when plotting integral solutions. The branch cuts may occur in pressure field solutions as well as in stream function solutions for various closed-form solutions, as seen in Figure 3b, Figure 4a, Figure 10a and Figure 11b. These branch cuts may mask the intended values of the physical quantity (such as pressure) described by the complex potential. The location of the branch cuts can be better controlled when the potential function is manually separated into the real and imaginary parts, using Equation (9a) and following the schedule explained in Appendix A (Appendix A3). Figure 15b shows a solution where the branch cuts are not extending toward infinity, but are pointing inward, confined to the central area (Figure 15b), similar to the solution obtained in Figure 13d (after adding an infinite number of line doublets in the superposition). The solution of Figure 15b suggests the existence of an adverse pressure gradient in the central flow region, which is entirely due to the method of solution, similar to what is seen in Figure 13a–d. However, the flow in Figure 15b is from bottom to top along the streamlines converging in the central flow domain, unimpeded by any adverse pressure gradients.

3.4. Areal Dipole

The complex potential for superposed line dipoles can be obtained from the complex potential for a superposed line doublet (Equation (9a)) through the multiplication of the right-hand term of Equation (9a) by an imaginary number i. The pressure field potential and stream function is mapped by the real and imaginary part of the complex potential Ω ( z ) = ϕ + i ψ respectively as shown in Figure 16a,b. The branch cut appearing in the stream function solution of Figure 16b is moved using the same approach as for the branch cut relocation of the potential function in Figure 15a. The conclusion is that the complex potentials for both the areal doublet and areal dipole are invariant (Table 1), because switching of its imaginary and real parts (or equivalent swapping of the real and imaginary coordinate axes) gives their mutual solutions. The complex potentials for the areal doublet and areal dipole describe two flows that are physically identical. What is remarkable is that the line doublets and line dipoles that are used to obtain the invariant complex potentials of the areal doublet and areal dipole, are themselves variant (Table 1). However, the selection of branch cuts, based on the nature of the problem, may result in areal doublet to be variant.

4. Application

This section is sub-divided into several subsections. The basic tools for pressure scaling, streamline tracking and time of flight contours are outlined in Section 4.1 and Section 4.2, respectively. Section 4.3 and Section 4.4 apply the developed tools to model several synthetic flow elements, including high conductivity flow channels with randomized orientations, lengths, and strengths, which may mimic natural fractures. Finally, Section 4.5 analyzes the flow of fluid through a non-isotropic system with several high conductivity flow channels abstracted from a field example.

4.1. Scaling of Pressure Field Solutions

The transient pressure gradient, P(z,t), governing the time-dependent fluid flow in a reservoir with permeability k can be calculated from the real part of a suitable complex potential, [ Ω ( z , t ) ] . The complex potential is split in its real and imaginary parts, which correspond to respectively the potential function, ϕ ( z , t ) , and the stream function, ψ ( z , t ) as shown in Equation (1). Subsequently, the potential function, ϕ ( z , t ) , can be used to compute and scale the pressure gradient due to a flow (relative to an initial reservoir pressure) in any location, z, at a given time, t, using the following generic formula [16,17]:
Δ P ( z , t ) = ϕ ( z , t ) η k      ( Pa )
where ϕ ( z , t ) is the potential function, η the viscosity of the fluid (expressed in Pa.s), and k the permeability of the reservoir (expressed in m2 nor Darcy). The generic form of Equation (10a) will yield a specific pressure profile when a specific potential function is defined (and η and k are known). The actual pressure field at any given time, t, can be thus be obtained when the initial pressure state, P0, of the reservoir is known:
P ( z , t ) = P 0 + Δ P ( z , t ) = P 0 ϕ ( z , t ) η k      ( Pa )
The porosity may appear as a scaling factor accounted for in input values for ϕ ( z , t ) such as a certain flow strength [18].

4.2. Particle Tracking and Time-of-Flight Contours

The algorithm used to trace streamline and time-of-flight contours apply a Eulerian particle tracking method ( z n + 1 z n + v ( z n ) ), with the required velocity field inputs obtained from the velocity potential V(z) that can be derived from the complex potential Ω ( z , t ) as follows:
V ( z , t ) = d Ω ( z , t ) ¯ d z = v x + i v y      ( m 2 · s 1 )
Equation (11) is used to calculate the velocity field solutions from specific velocity field expressions defined for any analytical flow elements. Tracing each streamline is accomplished by first choosing an initial position z0 at time t0 = 0 and calculating the initial velocity. By choosing an appropriate time-step, Δt, the position z 1 ( t 1 ) of the tracer at time t1 = t0 + Δt is:
z 1 ( t 1 ) z 0 ( t 0 ) + v ( z 0 ( t 0 ) ) Δ t      ( m )
The position z j ( t j ) of the tracer at any other time tj is:
z j ( t j ) z j 1 ( t j 1 ) + v ( z j 1 ( t j 1 ) ) Δ t      ( m )
The time-of-flight contours (TOFCs) are determined by plotting the location of all the tracers for particular time steps. The selection of an appropriate time-step duration is a crucial decision in the Eulerian particle tracking method. An overly coarse time step in combination with sharply curving streamlines results in overshooting of the particles, which then jump from one streamline to the other, which is inaccurate. For such cases, a very small time-step is required such as to avoid inaccuracies in the displacement of the particles due to the high instantaneous velocity. However, for cases where the velocity gradient is spatially less convolute, a coarser time-step can be used to reduce the computational time. Further details on complex potentials and stream functions in reservoir flow applications are given elsewhere [2,3,4,5,6,7,8,9,16,17].

4.3. Synthetic Cases of Wide Flow Channels (Cases A–B)

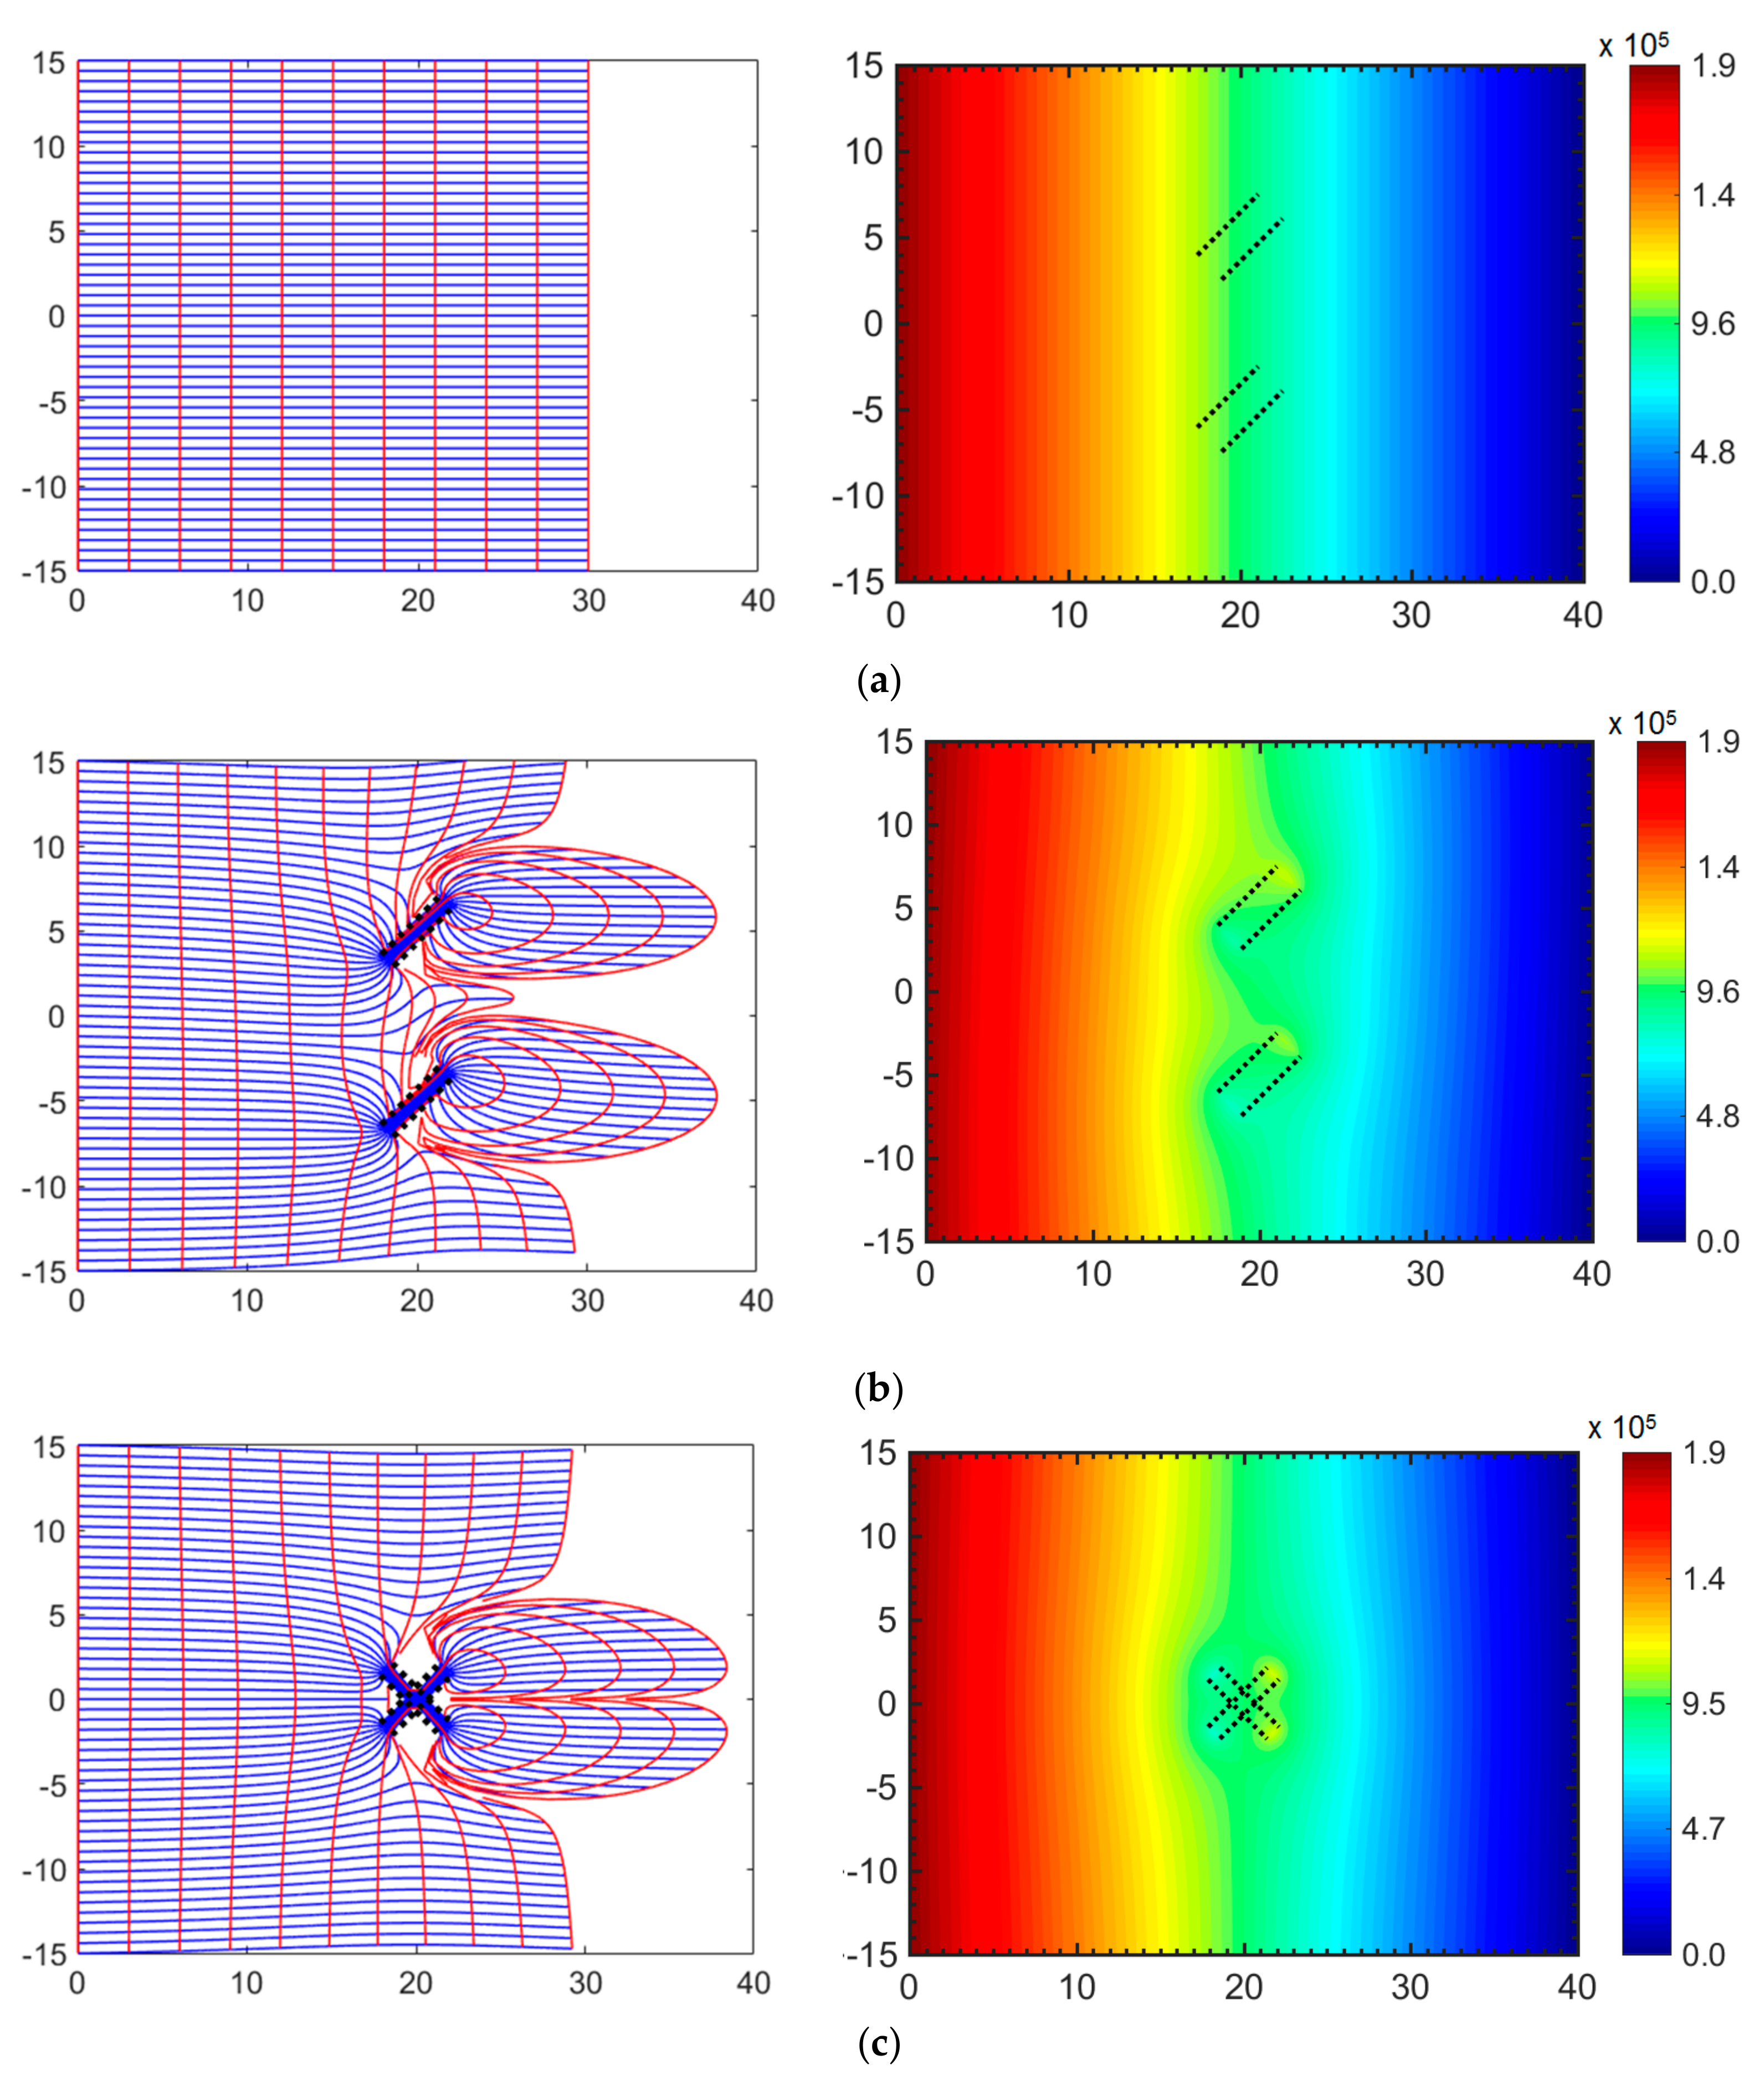
A first series of flow channels is modelled with large apertures or widths to highlight the streamline convergence in the flow element as well as the fact that the steepest pressure gradients occur in and near the flow elements. For each of the simulations in this section, a uniform far-field flow rate of 0.15 m·year−1 (4.75 × 10⁻⁸ m·s−1) is assumed, from left to right parallel to the real axis. For later comparison, Figure 17a first shows the streamlines (blue) and TOFC (red), due to the far-field flow in an isotropic reservoir without any other flow elements (such as hydraulic/natural fractures) simulated for the period of 20 years. The fluid viscosity is assumed to be 1 cP (0.001 Pa.s) and the reservoir permeability is 10 mD (9.87 × 10⁻¹⁵ m2). The particle tracking simulation is run for a period of 20 years with a time step (Δt) of 0.1 days. For the far-field flow travelling at a rate of 0.15 m·year−1, the streamlines and the TOFC travel 30 m downstream (in the homogeneous and non-fractured reservoir). The porosity is assumed to be 10%; for cases with different porosity the TOFC will be proportionally slower or faster (see [18] for additional details). Figure 17b,c (left column) show the effect of flow accelerators, modeled by areal doublet, on both the streamlines and the TOFCs. The flow accelerators (which may mimic natural fractures) (Figure 17b,c) locally enhance the flow rate and some TOFCs reach further downstream, up to 37.6 m and 38.4 m in Figure 17b,c, respectively. The corresponding pressure plots are shown in Figure 17a–c (right column). Comparison of the pressure plots for each case shows that the presence of enhanced permeability flow channels increases the pressure gradient close to the flow elements. The inputs used to generate the Figure 17a–c are presented in Appendix B (Table A2 through Table A4).

4.4. Effect of Spatial Complexity in the Location of the Flow Channels (Cases C–D)

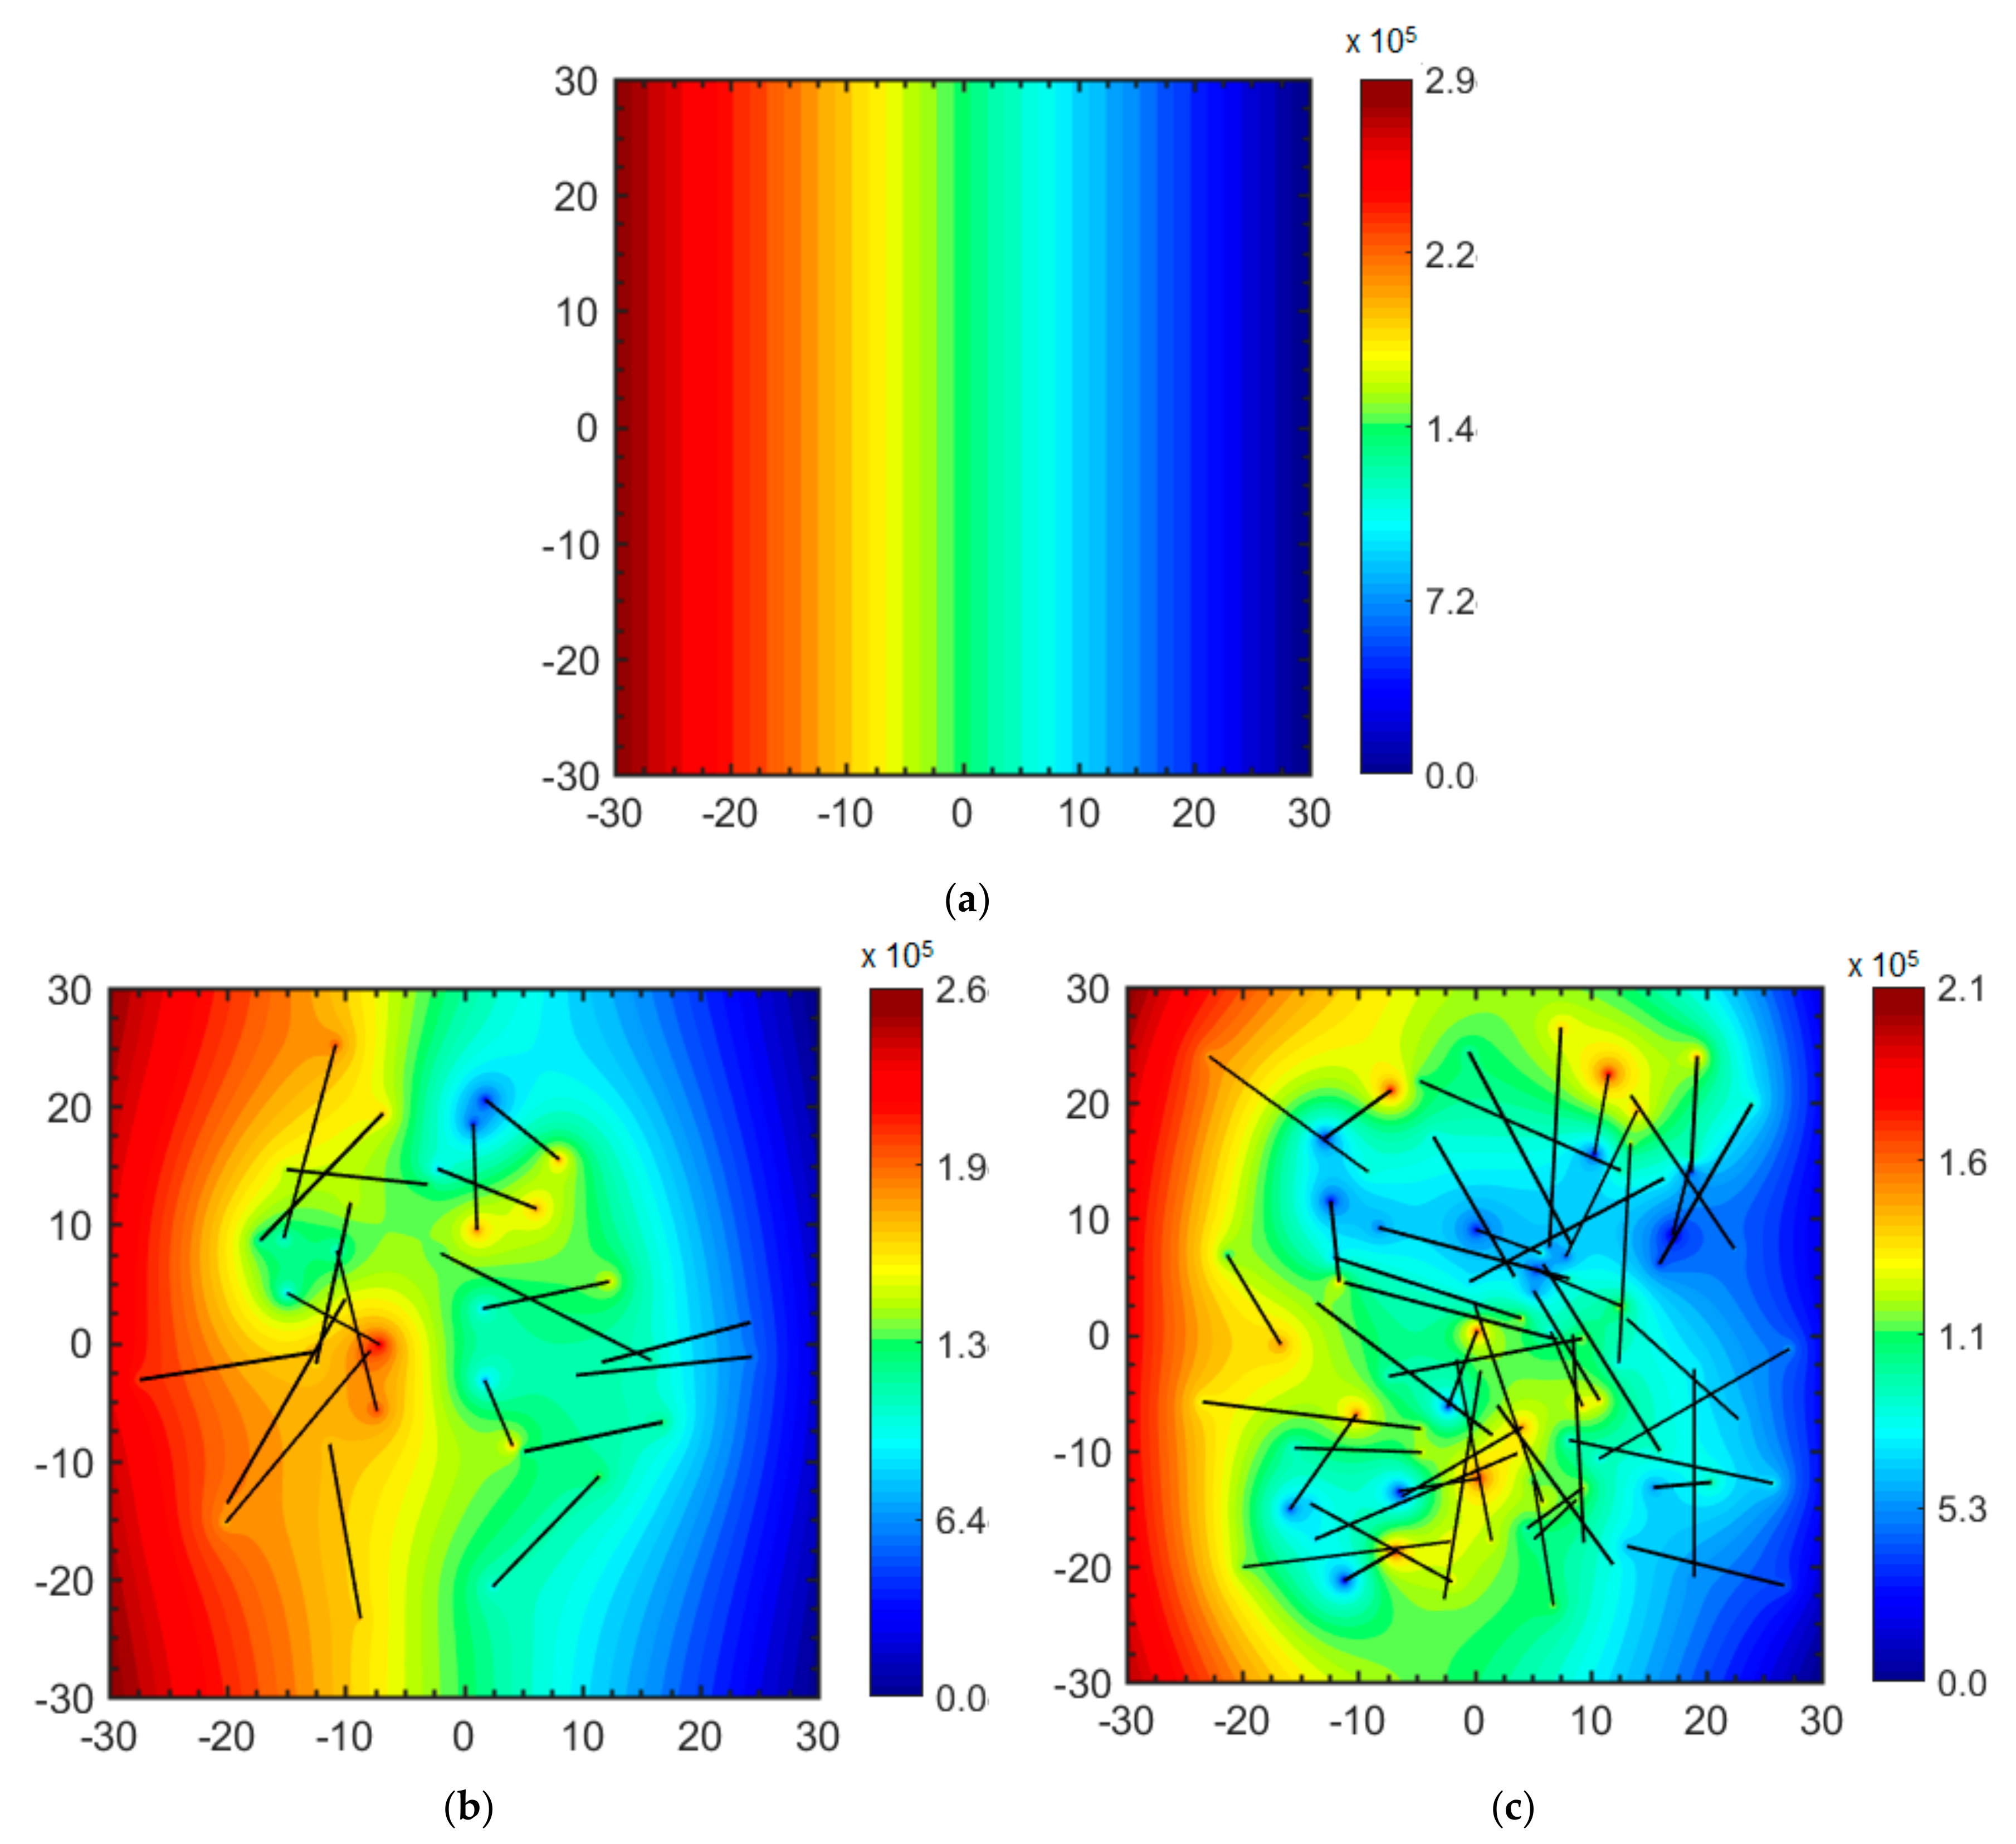
The next series of simulations use a narrower and increasing number of enhanced permeability flow channels, which highlights that when the number of flow channels increases (1) the pressure gradients become steeper, and (2) the pressure contour pattern becomes more complex. For the base case, consider a 60 m × 60 m unconfined isotropic flow space (Figure 18a). A uniform far-field flow moves from left to right with a velocity of 0.15 m·year−1 (or 4.7 × 10⁻⁸ m·s−1), which maintains a maximum pressure of 2.9 × 10² kPa for a reservoir with a porosity of 10%. Figure 18b,c show the pressure fields due to the presence of increasing numbers of flow channels. The flow channels are randomly generated as follows. The width of each flow channels is randomly varied between 0.1–0.01 m, a length between 5 and 20 m, and orientation between −90° to 90° with respect to the horizontal axis. The strength of the is varied between 4.7 × 10⁻⁸ and 9.4 × 10⁻⁶ (m4·s−1). Figure 18b,c show that the pressure contour patterns become complex with addition of flow channels with varying strengths and orientations.

4.5. Field Example from Aravalli Supergroup—Rajasthan (India) (Case E)

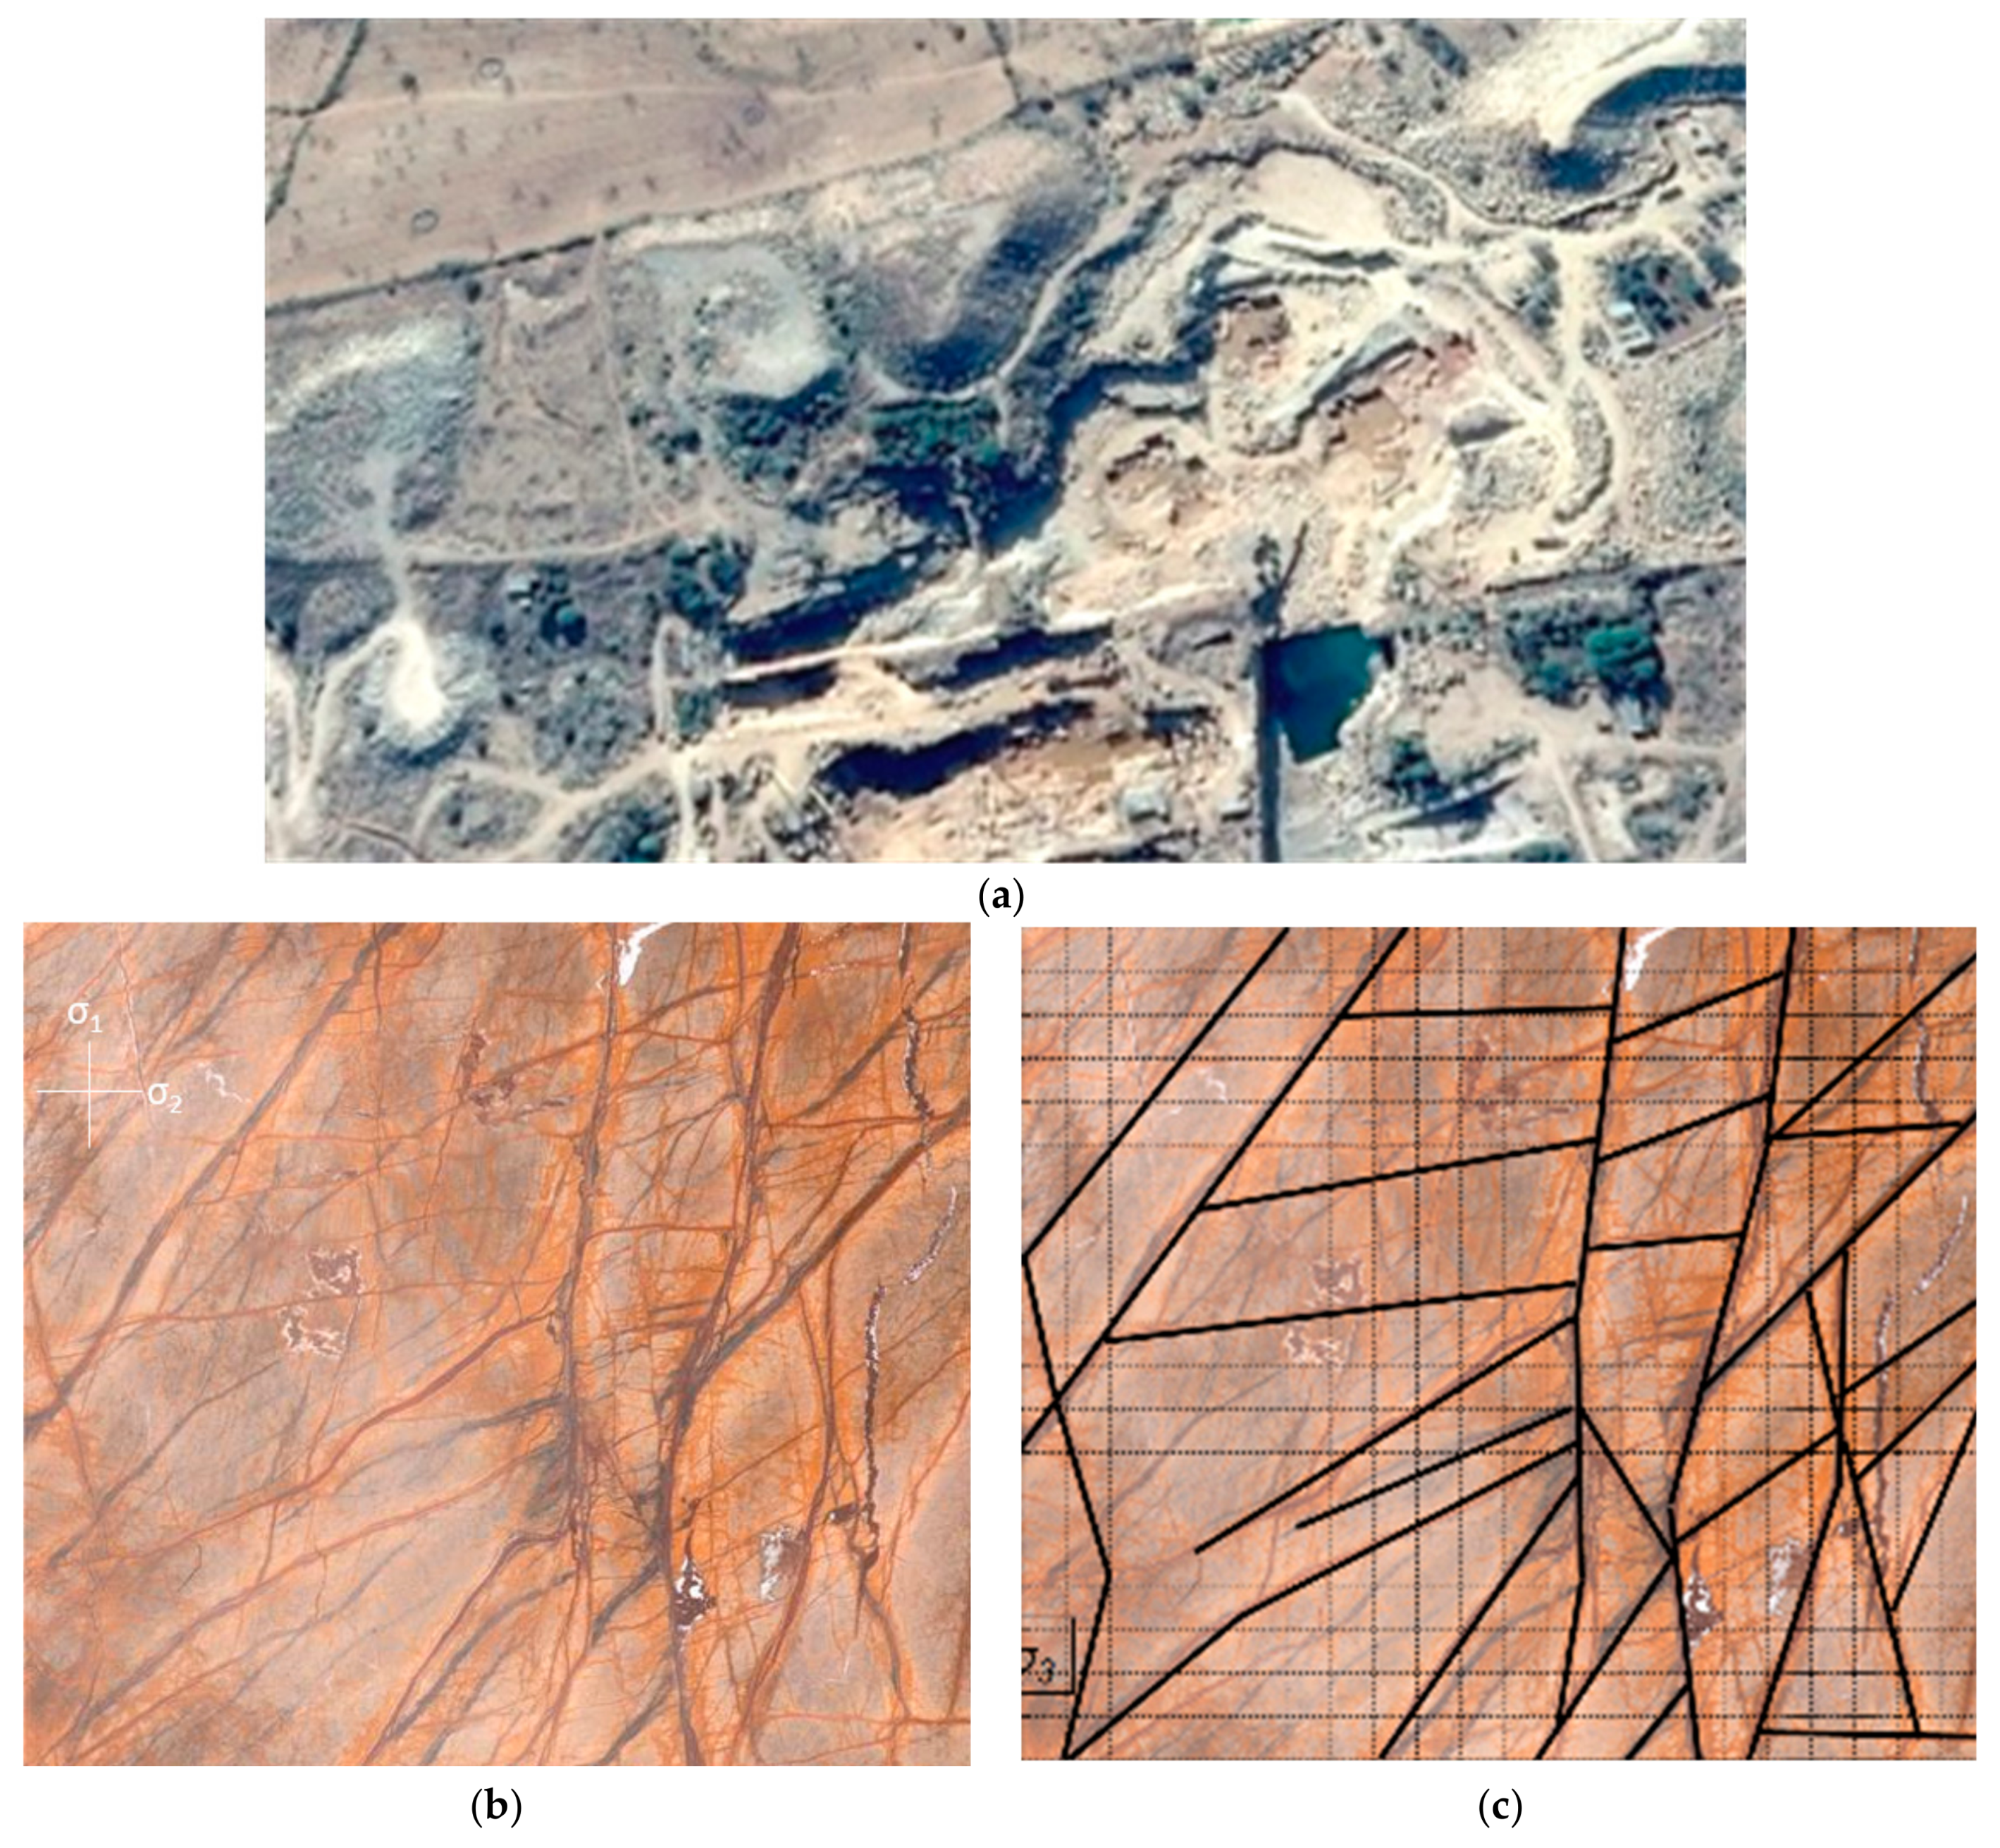
A final set of simulations revisits flow along the hydrothermal veins [3] using the fracture pattern observed in a polished slab of facing stone quarried from fractured Proterozoic rocks from the Aravalli Supergroup in the state of Rajasthan, India [19,20,21]. The fractures are formed under high fluid pressure deeper in the Earth’s crust before the rock was exhumed by tectonic uplift and erosion. These rocks are currently exploited as facing stones and quarried near the villages of Bidasar-Charwas, Churu district (Figure 19a). The quarries are confined to a 0.5 km wide and 2.5–3.5 km long belt of open pits dug below the desert plain. The rocks in these pits have been described as part of the Bidasar ophiolite suite [22]. A polished slab containing the naturally created fracture network are imaged in Figure 19b.
Similar to our companion study [3], the simulations in this study do not account for the creation of the fractures, which are already developed when invaded by the hydrothermal fluids. The precise natural pressure responsible for the injection of the hydraulic veins is unknown, but the pressure has exceeded the strength of the rock and was large enough to inject fluid into propagating fractures at several km burial depth, thus being in the order of 100 MPa. Figure 19c highlights the main flow conduits used in our flow analysis. The far-field flow velocity is assumed to be 4.75 × 10⁻⁹ m s−1 and porosity is 10% for all rock. The direction of the far-field flow in Figure 20a–d is assumed to be from top to bottom (−90°), based on the provenance of the major flow channels.
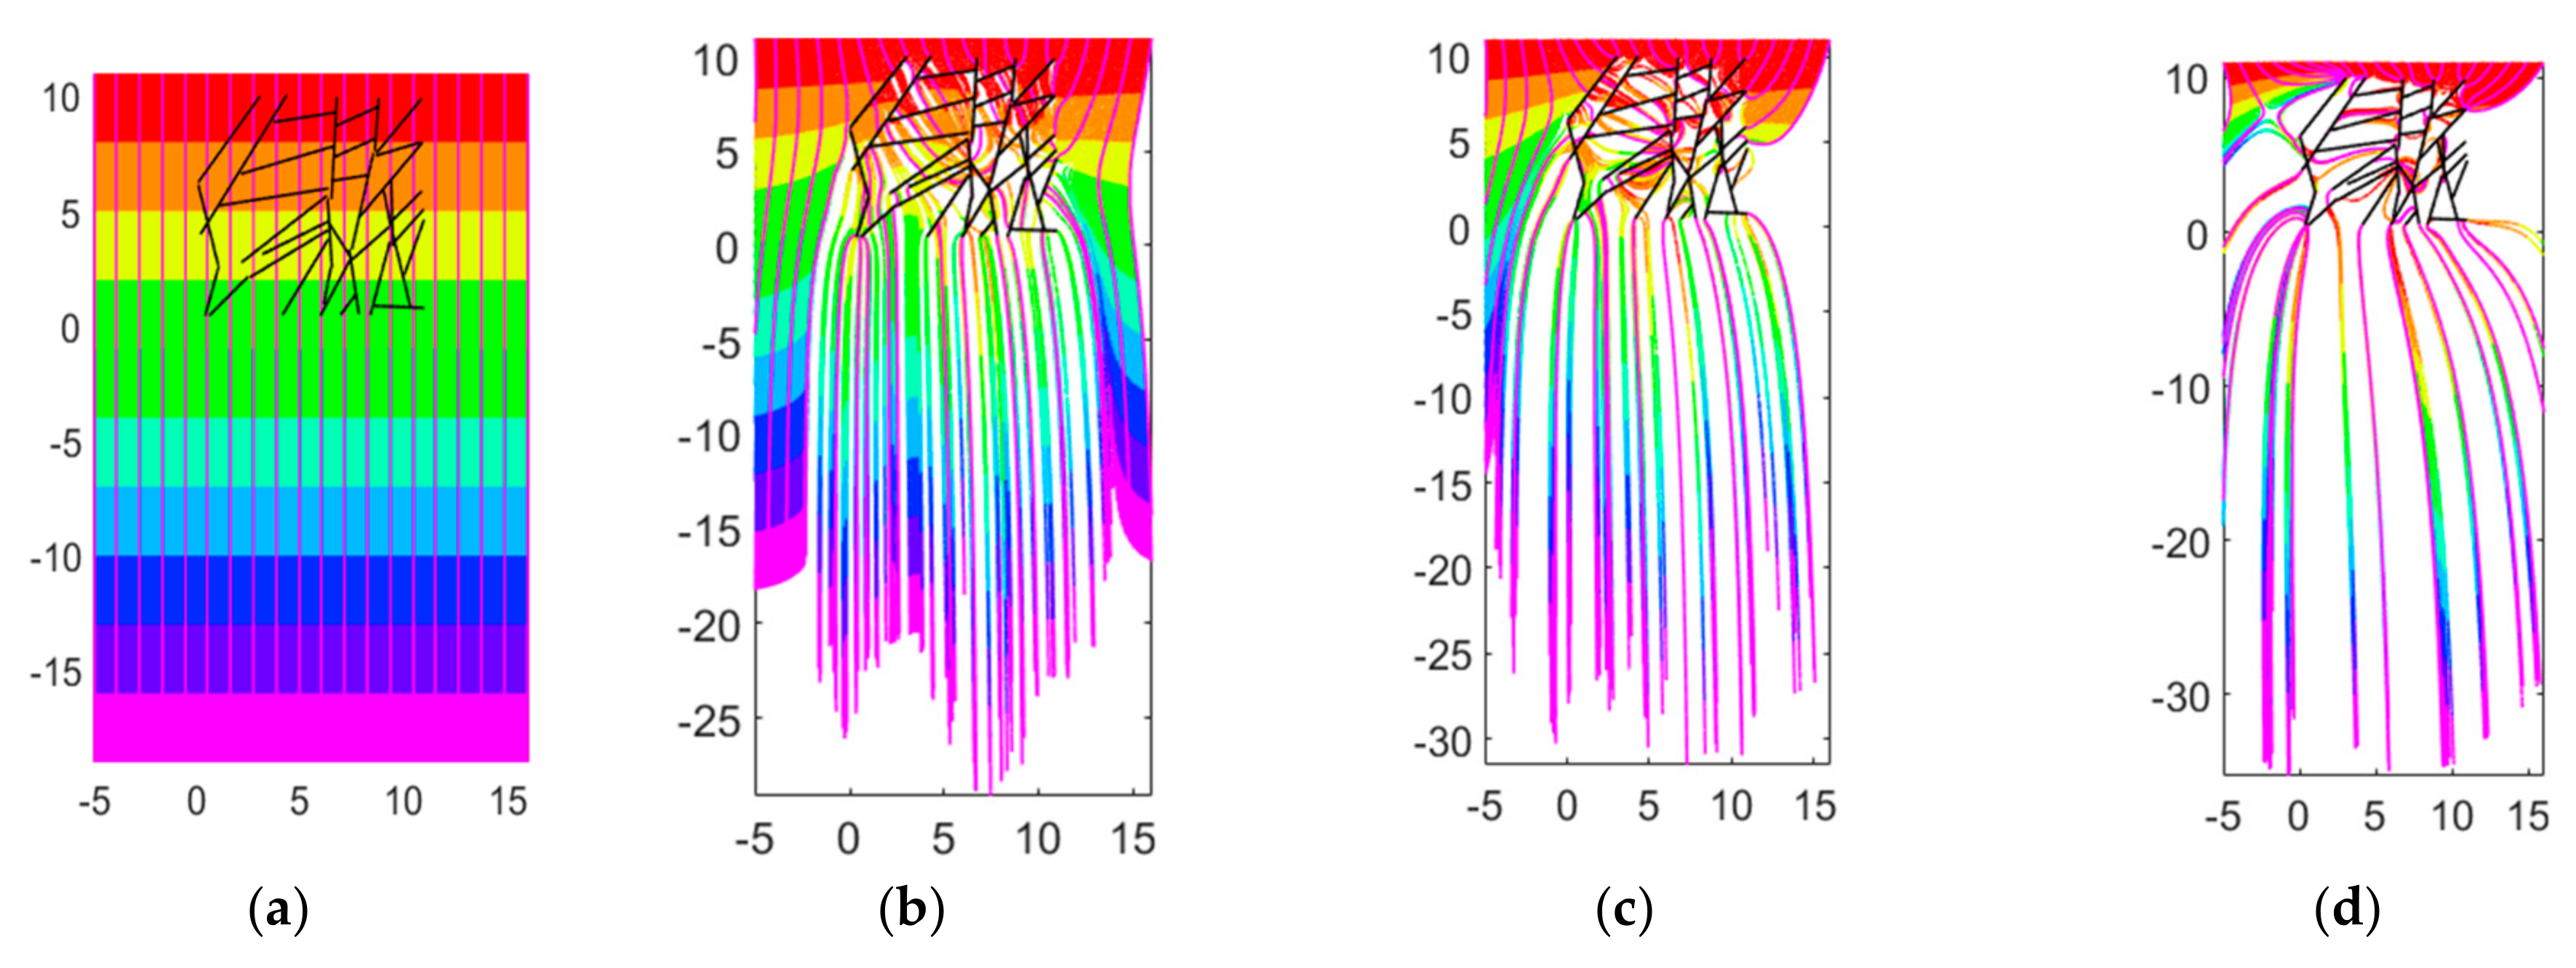
Figure 20a shows a base case for comparison with the time-of-flight contours and streamlines in the absence of the enhanced permeability flow channels. Figure 20b–d assume strengths of the flow channels with unit length scaled by one, two and five times 4.75 × 10⁻⁸ m4s−1. Each flow channel is assumed to have a width of 0.01 m and unit height. The time-of-flight contours (Figure 20b) show that the fluid velocity increases near the regions with a high density of flow channels. The fluid which are not close to the flow channels travels through the matrix unchanged. For the cases with higher fracture strength such as in Figure 20c,d, the majority of the fluid will travel through the conduits and travels further downstream in the same run time.
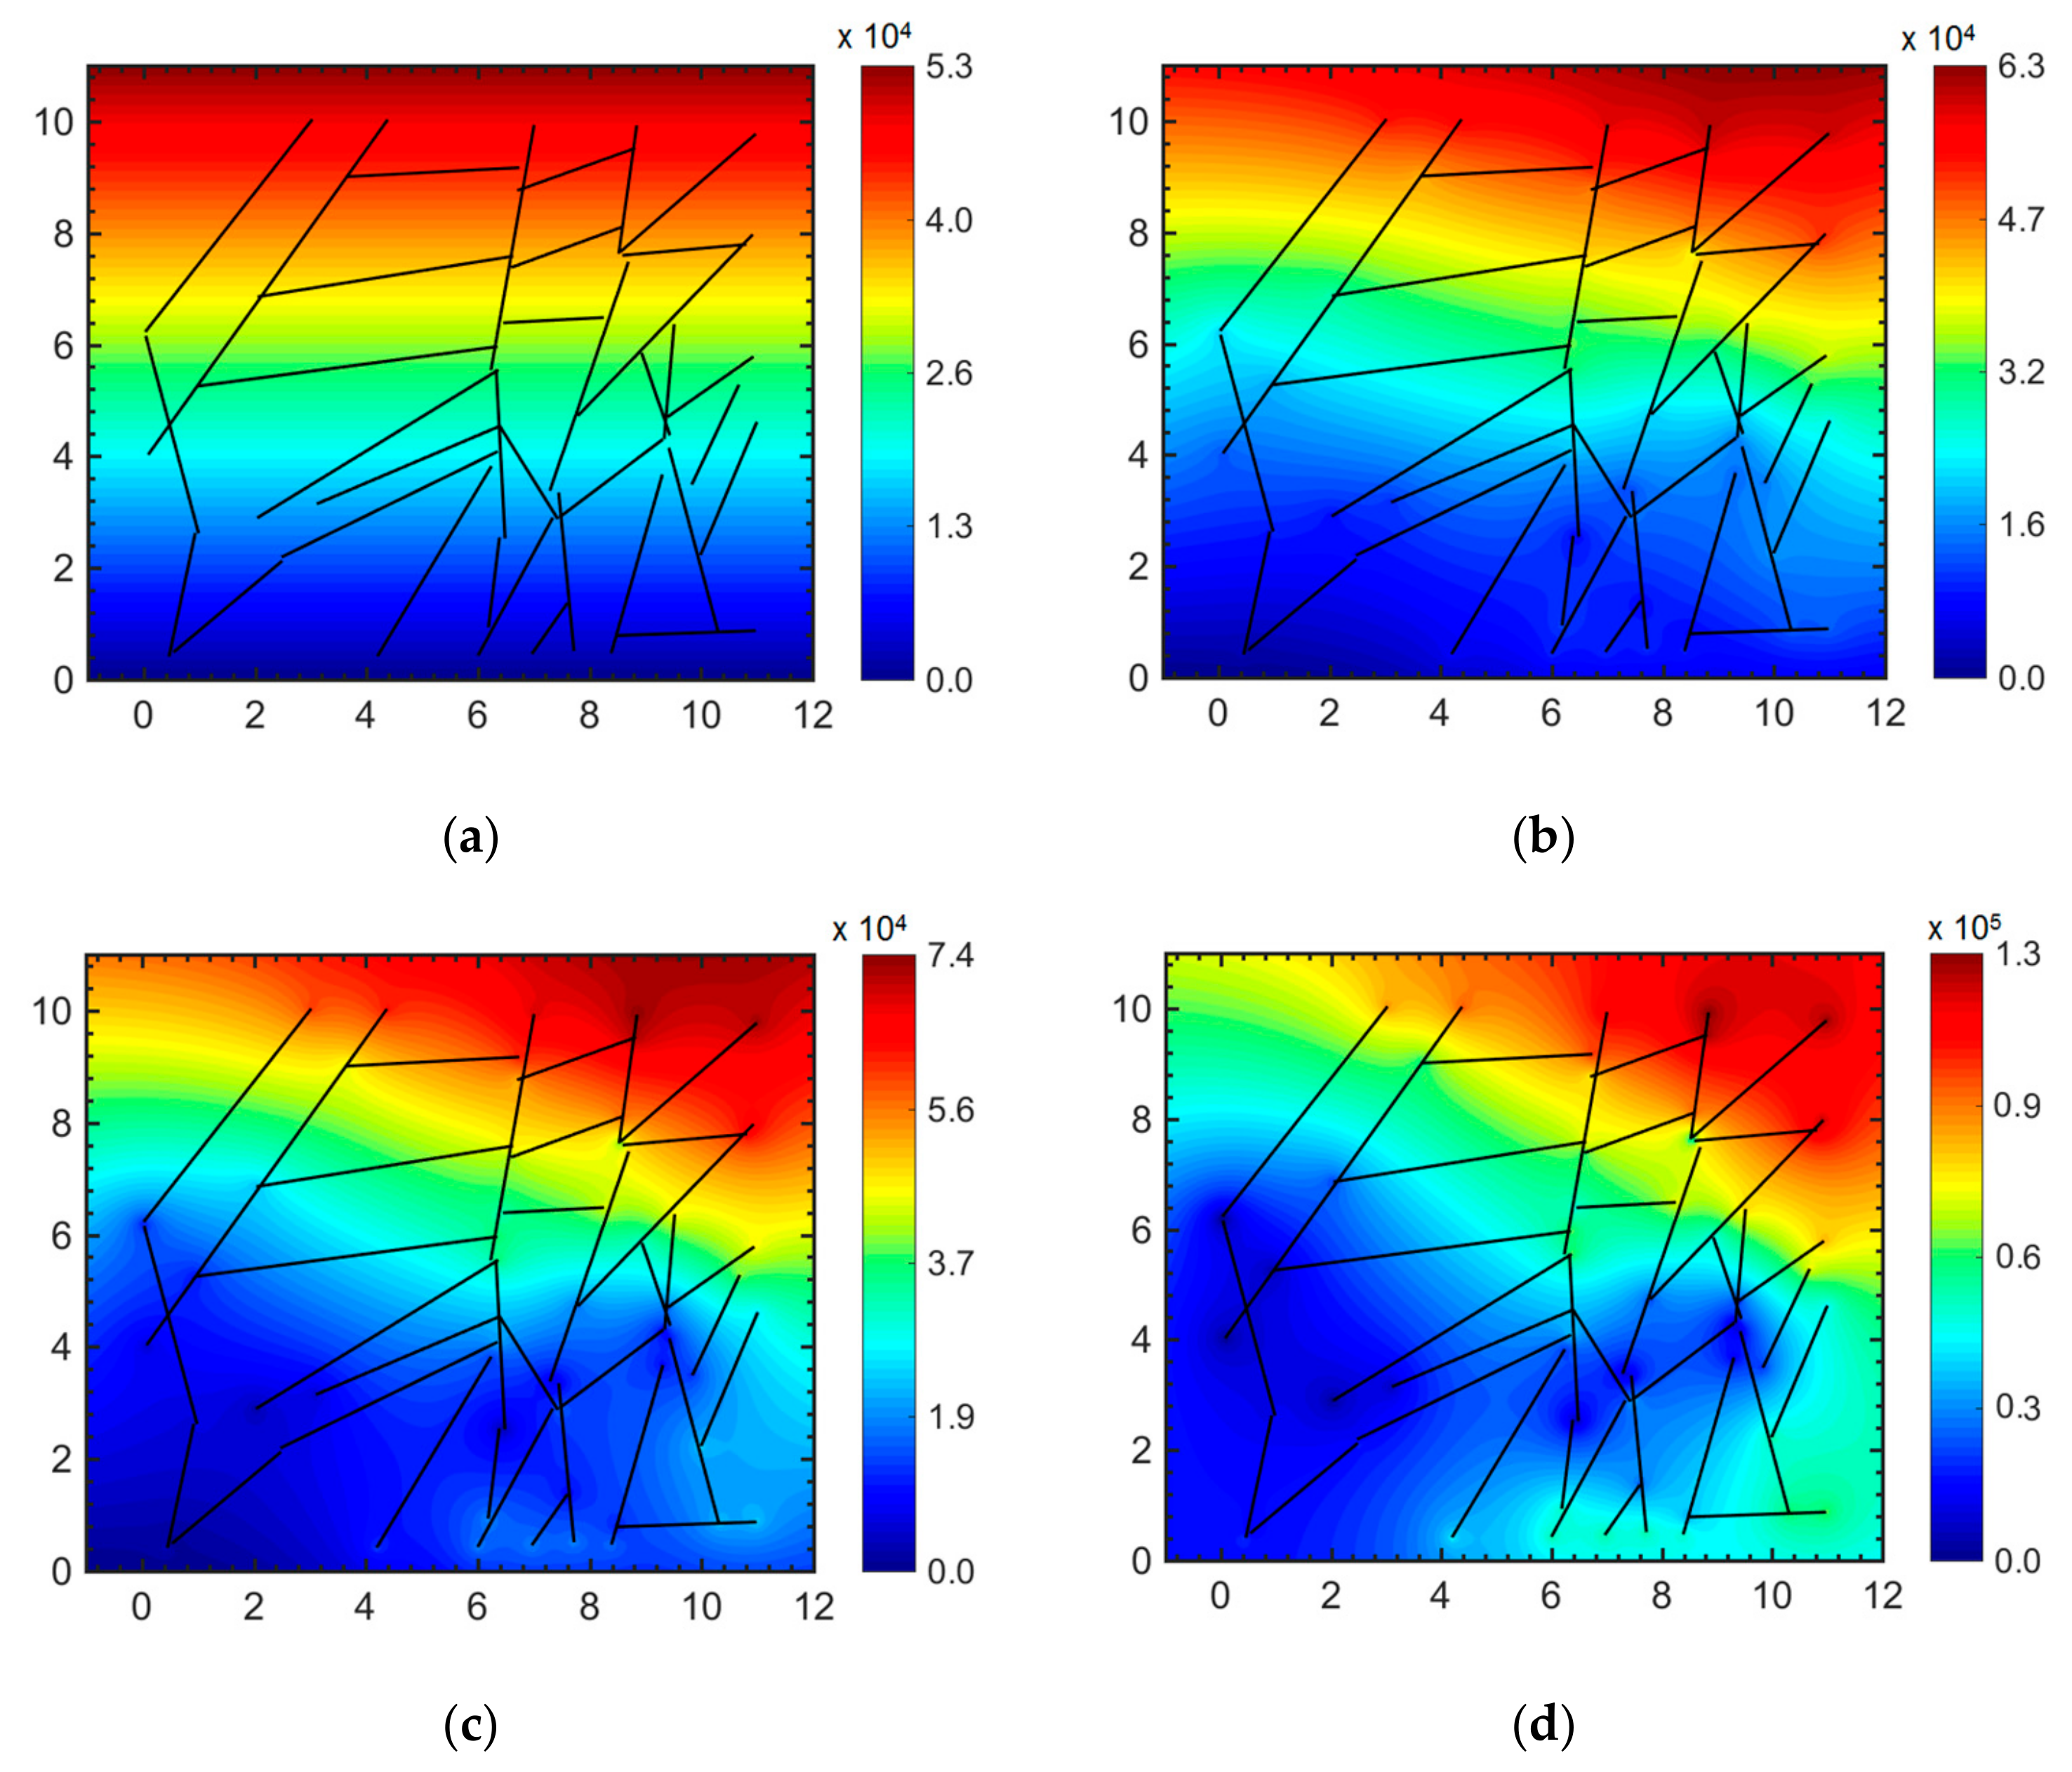
The pressure field plots for each case (Figure 21a–d) shows that, for cases with higher permeability contrasts (Figure 21c,d), the maximum pressures increase and so do the local pressure gradients, while the pressure contour pattern becomes more involved. Figure 21c,d also show a high-pressure zone develops in the left part of the flow field where numerous significantly long horizontal and vertical flow channels are aggregated.
The pressure field generated in Figure 21c,d show anomalously high and low pressure zones in some areas of the reservoir (which can be termed as hot/cool spots). These hot-spots and cool-spots are the artefacts of the arbitrarily specified strengths of the flow channels and occur for the cases where the natural fracture strengths are unusually high (Figure 21c,d). The effect does not appear for cases where the natural fracture strength is reasonable (Figure 18b,c and Figure 21b). The pressure near the flow channels are also distorted as the potential function is scaled by a uniform permeability (Equation (10a)), while in the model the flow is artificially enhanced by the analytical element. The pressure field needs to be downscaled in the vicinity of the flow channel elements by a locally decreasing the permeability. The realistic scaling of the pressures in each flow channel and selective downscaling of the permeability inthe vicinity of the fractures requires further study (future work).

5. Discussion

5.1. Variant and Invariant Complex Potentials

The work presented here differentiates between two types of complex potentials, the variant and the invariant complex potential. For several complex potentials, swapping of the real and the imaginary axes (or the equivalent operation of multiplying the potential by an imaginary number i), results in a flow which is physically different from the flow represented by the original complex potential. Examples of such variant complex potentials include the point source (Figure 3) and vortex (Figure 4), line doublet (Figure 10) and line dipole (Figure 11), which are fundamentally different flows. For other flows, the complex potential remains invariant, because even when axes are swapped, the same flow occurs, only rotated by π/2. Examples of invariant complex potentials include the far-field flow (Figure 1 and Figure 2) and the singularity doublet (Figure 7 and Figure 8). For the far-field flow the invariance of flows in any direction is apparent from:
Ω ( z ) = u e i γ z      ( m 2 · s 1 )
The invariant nature of complex potentials can for simple flows be exploited to obtain the stream function solution from the potential function, and vice versa. However, for complex flows with invariant complex potentials, further operations may be required to compute the stream function or potential function. Table 1 categorizes the areal dipole and areal doublet as invariant complex potentials. However, based on further discussion presented in Section 2.2.3, Section 3.1 and Section 3.3 (regarding branch cuts), only certain branch cut choices for the areal dipole/doublet show the invariant flow outcome. For example, solutions with branch cuts obtained by separating the real and the imaginary parts manually, as shown in Figure 15b and Figure 16c, are invariant. Other placement of branch cuts (see later in Section 5.2) would render the result variant.

5.2. Trade-Offs in Branch Cut Choices

The superposition of an increasing, discrete number of line doublets in Section 3.1 to create the areal doublet (Figure 13a–d) showed that the number of branch cuts increases commensurate with the number of superposed line doublets. The simplest branch cut positioning is a straight-line coinciding with each line doublet. When the process is continued to infinity, the entire central area confined between the two outer line doublets will be occupied by branch cuts, meaning that the potential function is not single-valued in the region portraying the fracture. This of course is a mathematical artefact, and the solution of the stream function shows that flow does occur in that region. We undertook various efforts to either repair the branch cut, or move the branch cut due to the potential function to another region. Below we discuss the various options with their limitations and trade-offs.
The potential function solution of Figure 15b suggests a continuous pressure gradient occurs in the central region. This is an arbitrary solution for the region where the potential function is multi-valued, suggesting continuity of both the potential lines and gradients across the central areal doublet. However, we emphasize this smoothed graphical solution is physically contradictory with the flow direction through the central area, which is counter to the pressure gradient. The stream function solution for the areal doublet does not involve any branch cut and is everywhere single-valued and therefore physically correct. Although adverse pressure gradients may arise near boundary layers in flows involving inertia effects [23], no such effects can occur in the Darcy flows through the porous media considered in our study. Our sub-conclusion regarding the potential function solution of Figure 15b is that the central region is completely occupied by branch cuts, and the continuity of the contour gradients is an arbitrary solution, counter-intuitive because of the creation of an apparent adverse pressure gradient, which is non-physical with regard to the stream function solution (Figure 16c).
Figure 15a shows an alternative solution, where the branch cuts for the potential function occur exterior to the central areal doublet region. This solution shows a realistic potential gradient inside the fracture element but generates branch cuts in the exterior region that extend to infinity. This solution with exterior branch cuts becomes unworkable and impractical when superposing numerous areal doublets in the far-field flow to simulate multiple fractures (Section 4). Exterior branch would obliterate part of the pressure field around the fractures. Placing branch cuts inside the fractures is more practical (Figure 15b), especially when these are narrow in width, because these occupy a limited area relative to the matrix. Below we explain other examples of moving the exterior branch cuts to the interior of the areal doublet.
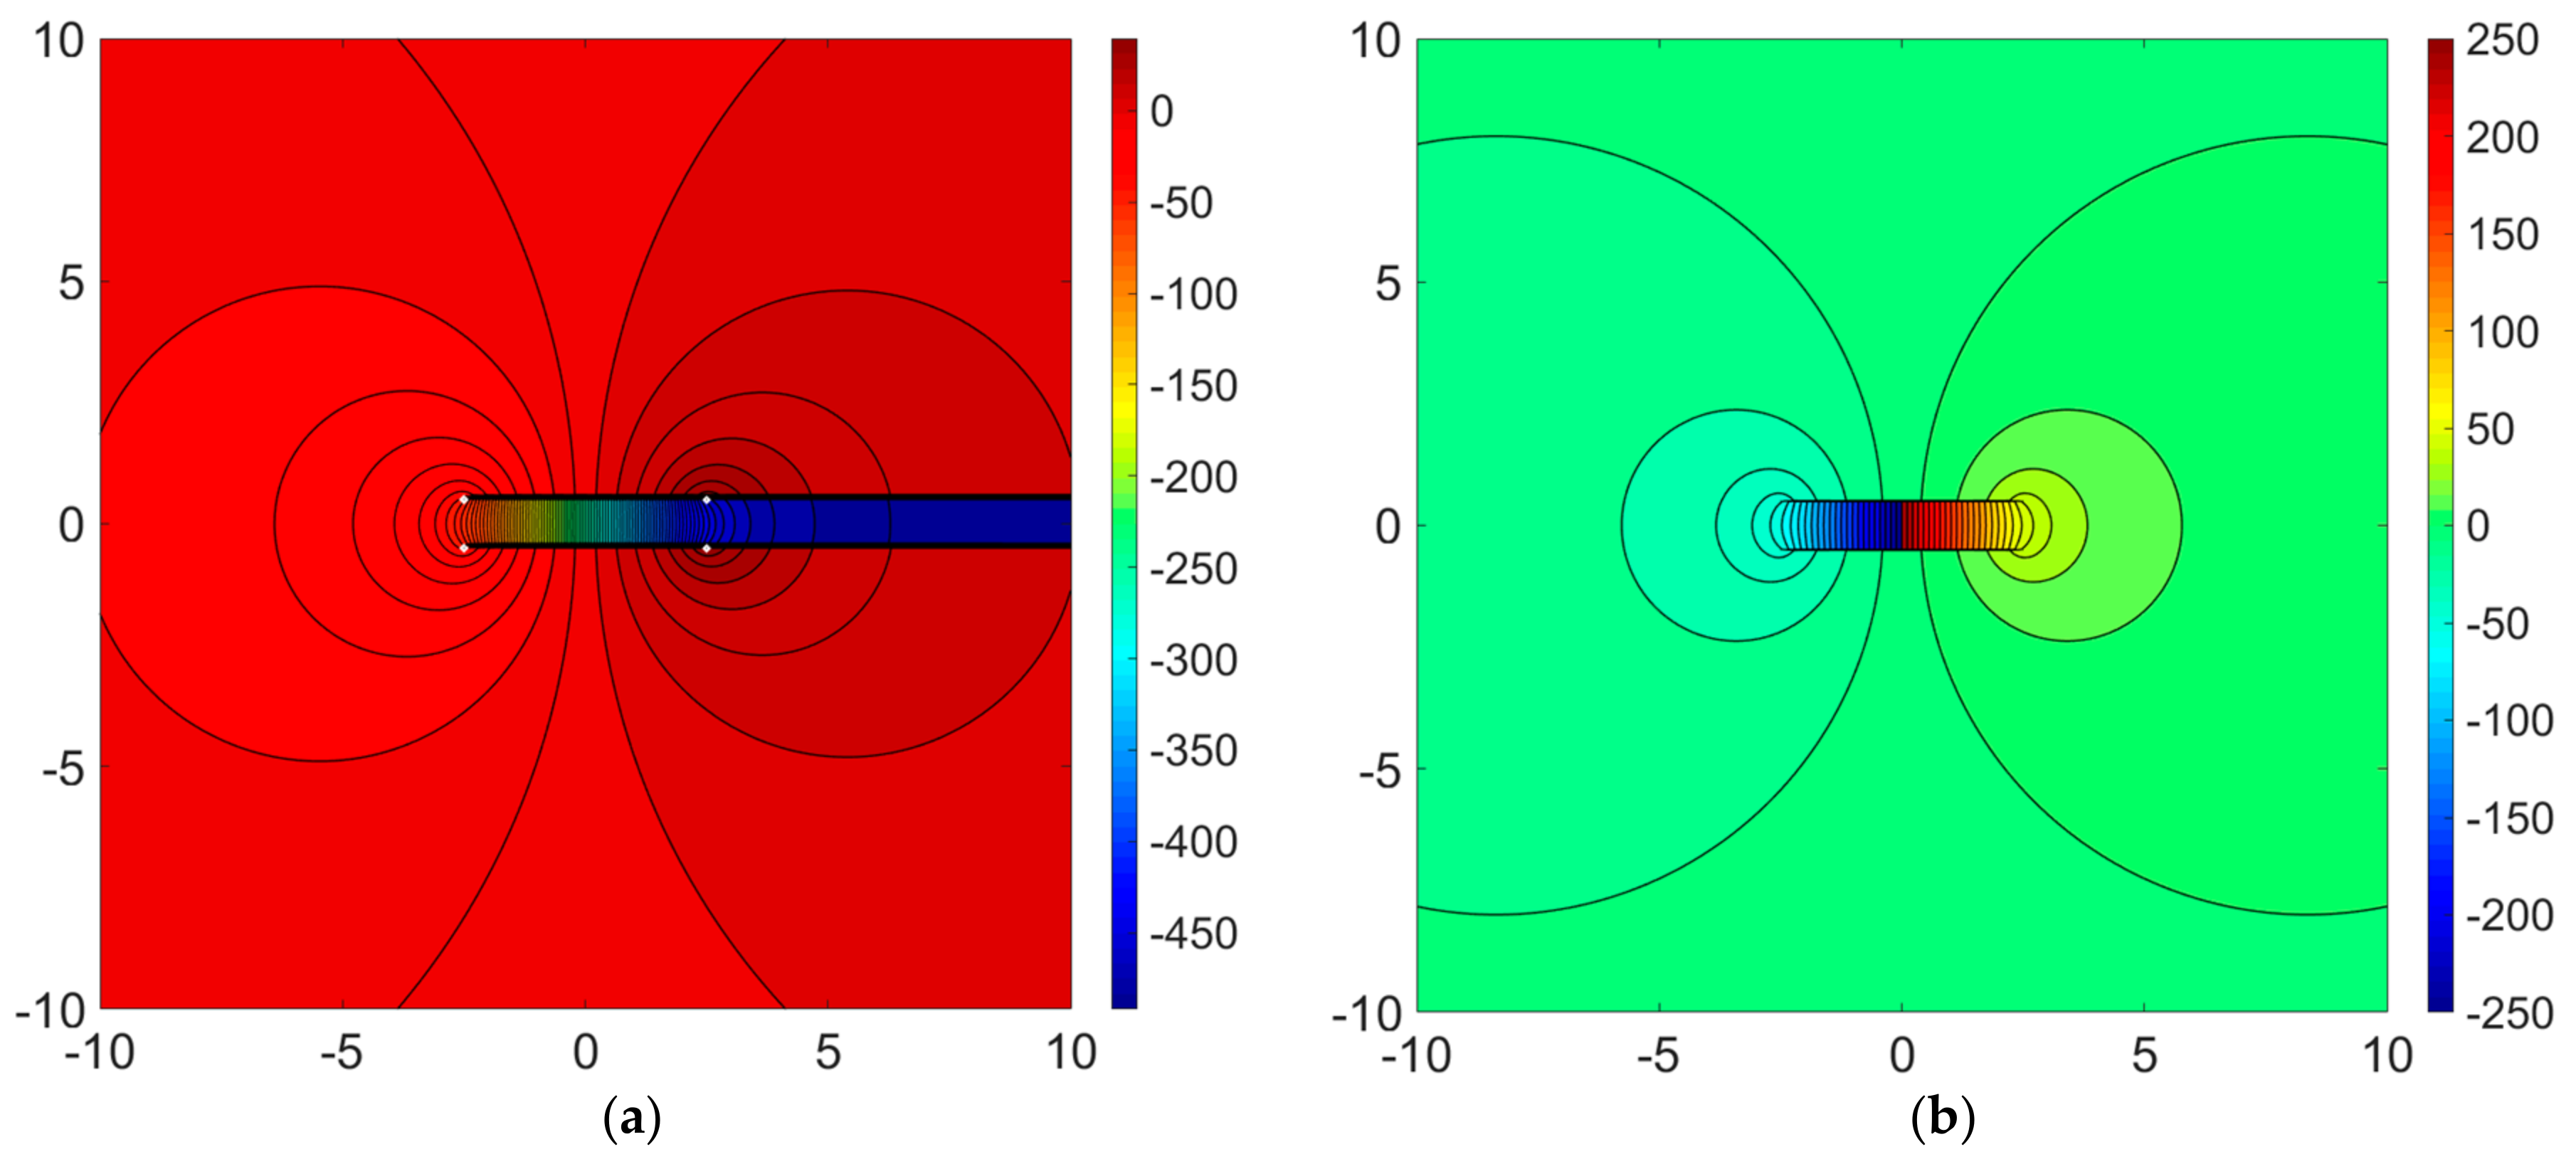
Figure 22a shows another alternative solution, where the branch cut is placed at one end of the areal doublet region. This give a physically plausible and so-called favorable pressure gradient for the flow region in the left half of the image where no branch cut occurs, but still is impractical for the right half of the image. The final solution we offer is a composite solution, where the left and right half of the flow region is free from branch cuts and with just one branch cut occurring centrally in the doublet flow region (Figure 22b) as explained in Appendix A (Appendix A3, last paragraph) which is similar to sequential contouring presented by Holzbecher [24]. This solution also suppresses the extreme highs and lows in the pressure scale that occur when the branch cuts are pointing outward to infinity (Figure 15a and Figure 22a). Although the potential function solution of Figure 22b is physically the best choice, it is not practical in execution. For pressure plots with multiple fractures we use the solution of Figure 15b, which is computed after separation of the real and imaginary parts of the complex potential as explained in Appendix A (Appendix A3).

5.3. Applicability and Accuracy of Current Approach

This study uses an alternative method to the widely used technique of numerical simulation with discrete volumes to model the flow of fluid in porous media with highly conductive flow channels. Unlike such discrete volume models, the present method based on complex analysis methods is grid-less, mesh-less and much faster than the discretized models. Additionally, the closed-form solution provides infinite resolution. The Eulerian particle tracking method implemented in this study gives unique insights by visualizing the flow in fractured reservoirs at high resolution (Figure 17 and Figure 20).
The pressure field plots for the areal doublet used to model the flow and pressure field near and in the enhanced permeability flow channels, involve choices about the placement of branch cuts to curtail multi-valued solutions, which will locally affect the minimum and maximum pressures. However, the pressure field outside the enhanced permeability flow channels show consistent single-valued results (Figure 17, Figure 18, and Figure 20). The width of these flow channels is generally in the range of micro- to millimeters [25,26], so for practical purposes, the pressure estimations presented in this study will introduce only minor inaccuracy due to the branch cut choices made. Although we don’t assert that the areal doublet is a mathematical proxy for natural fractures, they can certainly model flow elements which locally enhance fluid velocity during a flow in porous media.

6. Conclusions

In this work, we present several analytical flow elements which can be used to represent the physical flows. For some of these flows, switching of the real and imaginary parts of the complex potential, which can be achieved by multiplying or dividing the complex potential by an imaginary number i, results in a different flow, termed in this study as variant complex potentials. However, for certain other flows, multiplication or division of the complex potential by the imaginary number, i, does not change the flow physics, which are termed in this study as invariant complex potentials. We also present new solutions to calculate the pressure field based on the complex potential for an areal doublet. From the results in this study, we can conclude that areal doublets, which can be used to model high conductivity flow channels, locally increase both the fluid velocity and the pressure gradients (Figure 17 and Figure 20). Streamline and TOFC plots and pressure field solutions (Figure 17, Figure 18, and Figure 20) show that the presence of such flow channels have a significant impact on the flow in porous media. The algorithms and examples given in our study provide an efficient method to model the flow and pressure fields in fractured reservoirs.

Author Contributions

Conceptualization, R.W.; Methodology, A.K. and R.W.; Investigation, A.K. and R.W.; writing—original draft preparation, A.K. and R.W.; writing—review and editing, R.W.; supervision, R.W.

Funding

This project was sponsored by startup funds of the senior author (R.W.) from the Texas A & M Engineering Experiment Station (TEES).

Conflicts of Interest

The authors declare no conflict of interest.

Appendix A. Branch Cuts in Pressure Plots

For areal doublets (superposed line doublets), simply taking the real part of the complex potential may lead to inconveniently placed branch cuts, which cause discontinuity in the pressure plots. Thus, the real and complex potential need to be manually separated in order to facilitate choices about branch cut placement. Examples for branch cut solutions are presented below.

Appendix A1. Background

The real part of the complex potential yields the potential function, which can be used to calculate the pressure field in a reservoir (as detailed in Section 4.1). Several of our prior studies [12,13] include pressure field solutions for several analytical elements (such as point sources and sinks representing vertical injectors and producers, as well as line sinks, representing hydraulic fractures) and obtained excellent matches with independent pressure field solutions generated using a numerical reservoir simulator.
The superposed complex potential (ΩSUP(z)) for a far-field flow, ΩFF(z) (Equation (2a)), and an areal doublet, ΩAD(z) (Equation (9a)), is:
Ω sup ( z ) = Ω A D ( z ) + Ω F F ( z )      ( m 2 · s 1 )
The pressure gradient at any point z in the complex plane is calculated by selecting the real part of the superposed complex potential, Ω sup ( z ) , and subsequently applying Equations (10a,b).

Appendix A2. Demonstration of Branch Cut for a Simple Case

A brief discussion of branch points and branch cuts is warranted at this point. Assume a function ω = f ( z ) , which maps points from the z plane to another domain in the ω plane. If the function f ( z ) is single-valued, for each value of z we can obtain single value of ω . However, if the function f ( z ) is multi-valued, a value of z results in several values of ω . For example, consider a circular path, represented by the equation z = z 0 + r e i θ , around a point z 0 where r is a constant greater than zero and θ varies in a counterclockwise direction around z 0 . The function f ( z ) results in different values for ω as we move around the circle. Here z 0 is defined as the branch point of the function f ( z ) and multiple ω are different branches of the function. There are two branch points for a function, one at infinity and the other at z such that f ( z ) = 0. Finally, a branch cut is a line connecting two branch points at f ( z ) = 0 and infinity, which separates the discontinuity present in a complex plane [23].
Next, we calculate the pressure field for a synthetic reservoir with properties as summarized in Table A1 to show the branch cuts for an areal doublet. We assume P 0 defined in Equation (10b) to be zero, which is an acceptable assumption for a simple synthetic case. The corresponding pressure gradient (delta P) can be solved using Equations (A2) and (A3):
ϕ sup ( z ) = Ω sup ( z )      ( m 2   s 1 )
Δ P ( z ) = ϕ ( z ) μ k      ( Pa )
Table A1. Properties for pressure field generation.
QuantitySymbolValueUnits
Depthh1m
Porosityn20%
Permeabilityk9.87 × 10−16m2
Viscosityµ0.01Pa.s
Far-field velocityux9.5 × 10−9m·s−1
Angle of far-field flowα0°
Fracture centerzc0m
Fracture lengthL5m
Fracture widthW1m
Angleγ0°
Angle between the corner pointsβ90°
Strength of fractureν9.5 × 10⁻⁹m4·s−1
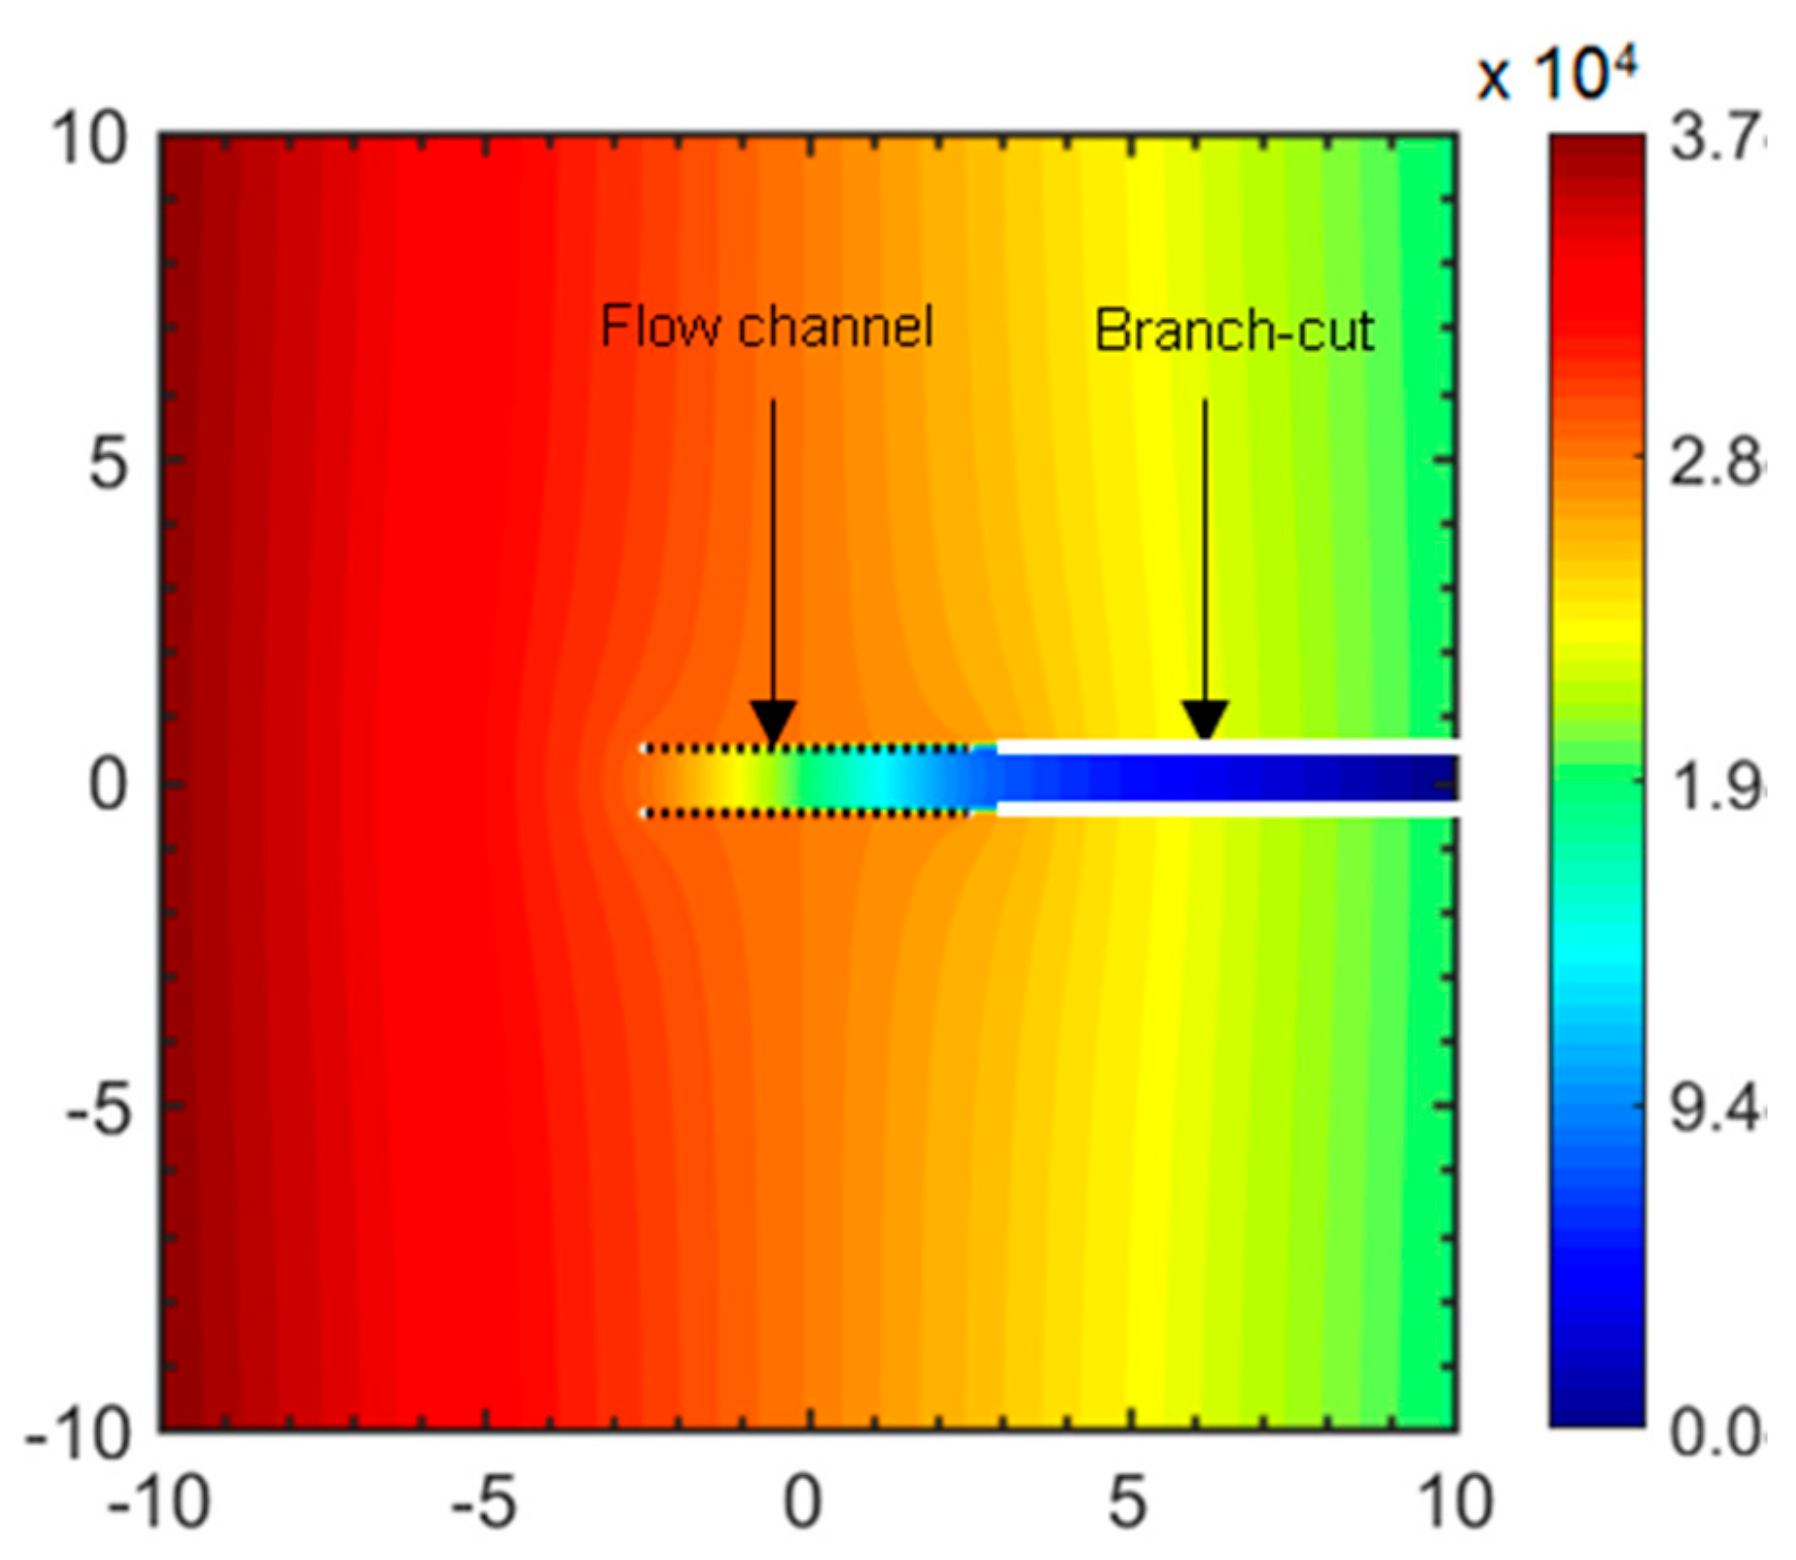
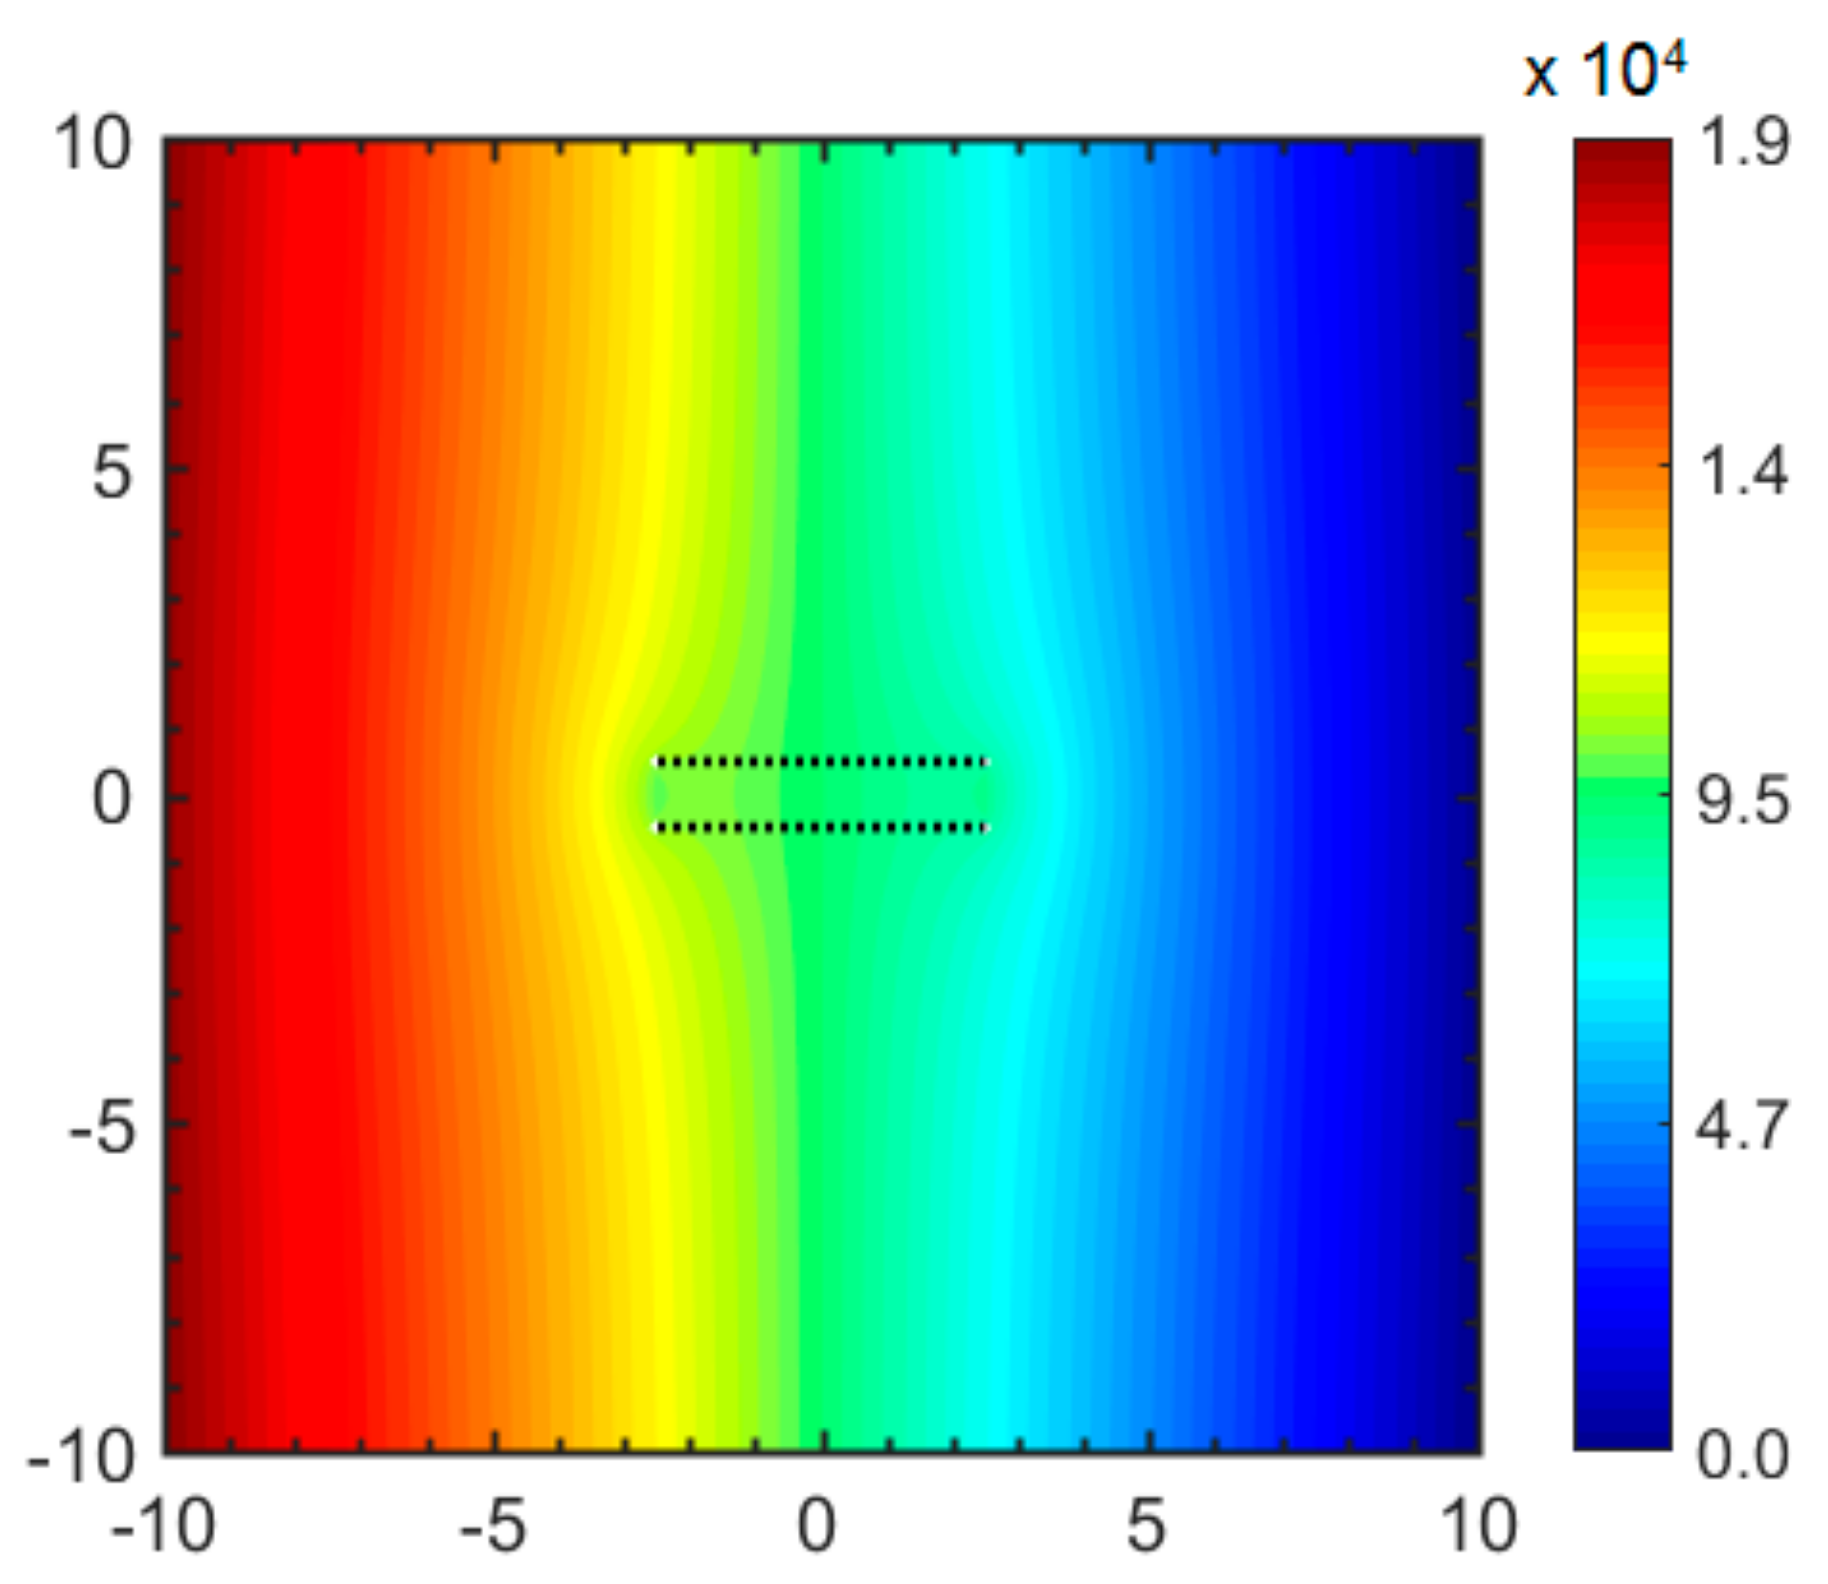
Figure A1 shows the pressure profile for a steady-state case, where a horizontal areal doublet with finite width (represented by black dashed lines) is superposed by a far-field flow (from left to right). The fracture affects the pressure field in its vicinity, as can be inferred from the deflected isobars close to the fracture. However, an undesirable computational effect occurs beyond the right end termination of the fracture (represented by solid white lines), where the pressure jump continues for an infinite distance in the horizontal direction toward the right. This effect is due to the occurrence of so-called branch cuts in the solution of the potential function (Equation (A2)), which becomes undefined at the vertices of the fracture. The simple model in Figure A1 has four branch points at the vertices of the fracture, which renders the function in Equation (9a) undefined at z a 1 , z a 2 , z b 1 , and z b 2 . This results in the pressure profile becoming discontinuous at the branch cuts and the pressure gradient inside and outside of the fracture shows a big jump.
Figure A1. Pressure field for a far-field flow near a fracture. Length scale in m and pressure (rainbow colors) in psi.
Fluids 04 00154 g0a1
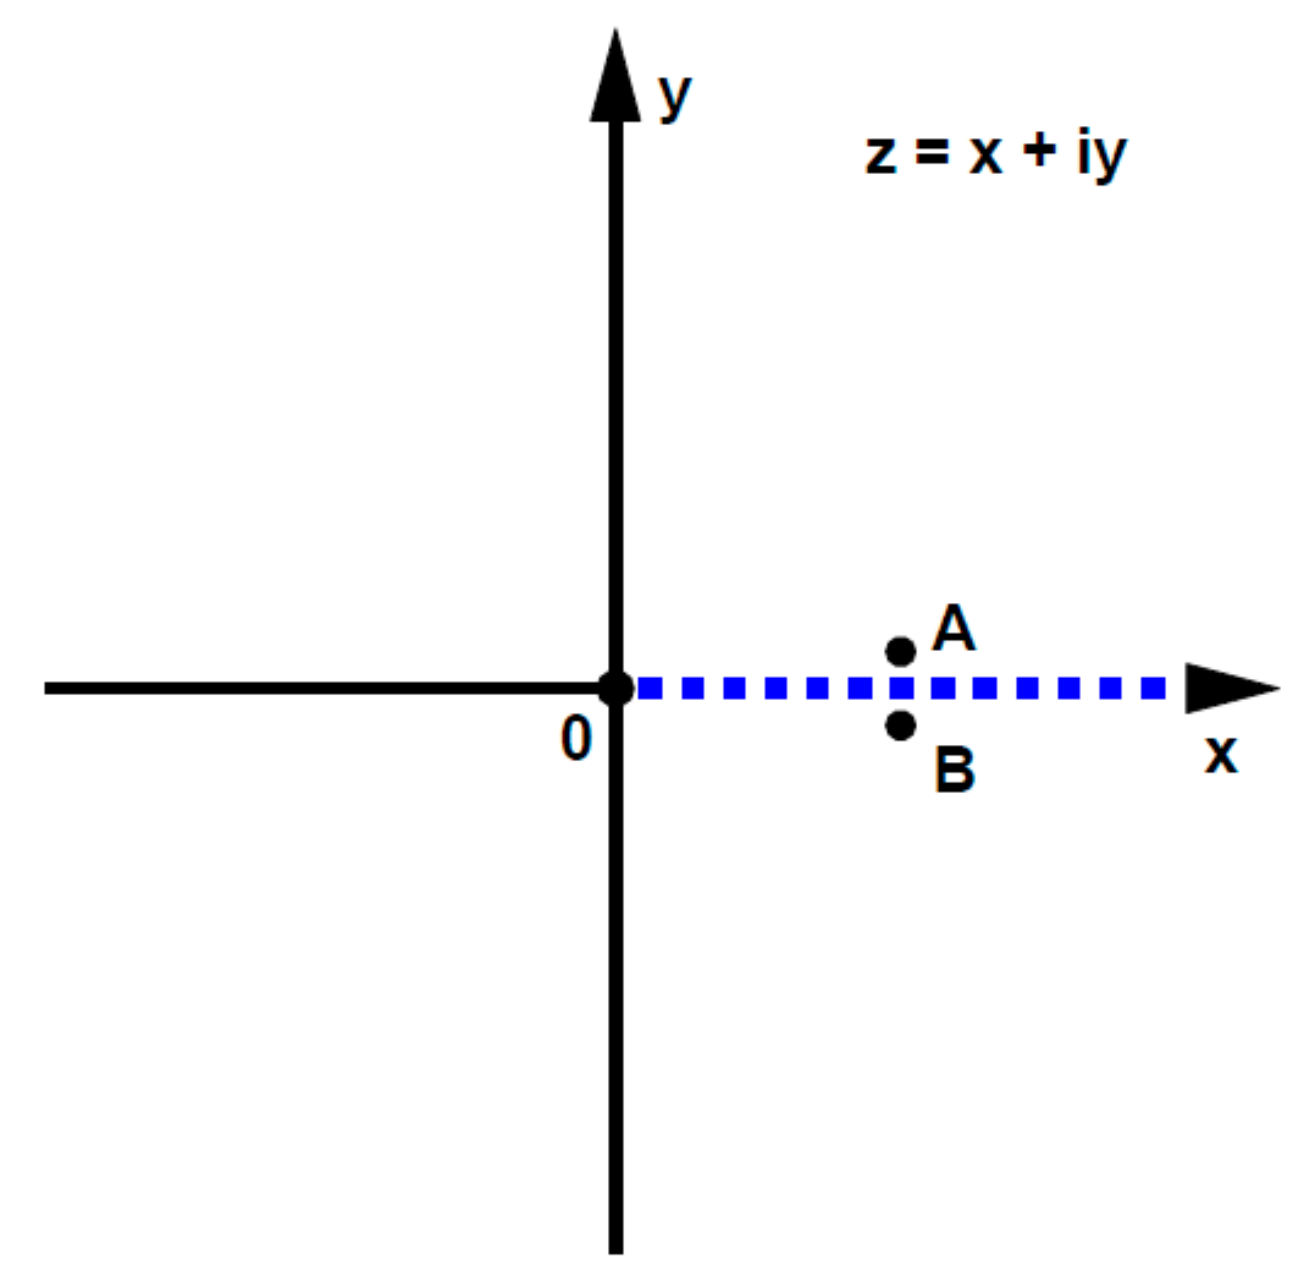
The branch in Figure A1 can be better understood if we consider a function l o g ( z ) , mapped in a complex plane as shown in Figure A2. The value of l o g ( z ) at A, which is infinitesimally close to and above the positive x-axis, differs from that at B, which is infinitesimally close to A but is below the positive x-axis. The function l o g ( z ) is discontinuous across the branch cut represented by line connecting zero to infinity. A Riemann surface can be used to represent the multiple values of ω by splitting the z plane into n parallel planes.
Figure A2. Representation of branch cut at positive x-axis showing discontinuity across two points A and B [27].
Fluids 04 00154 g0a2
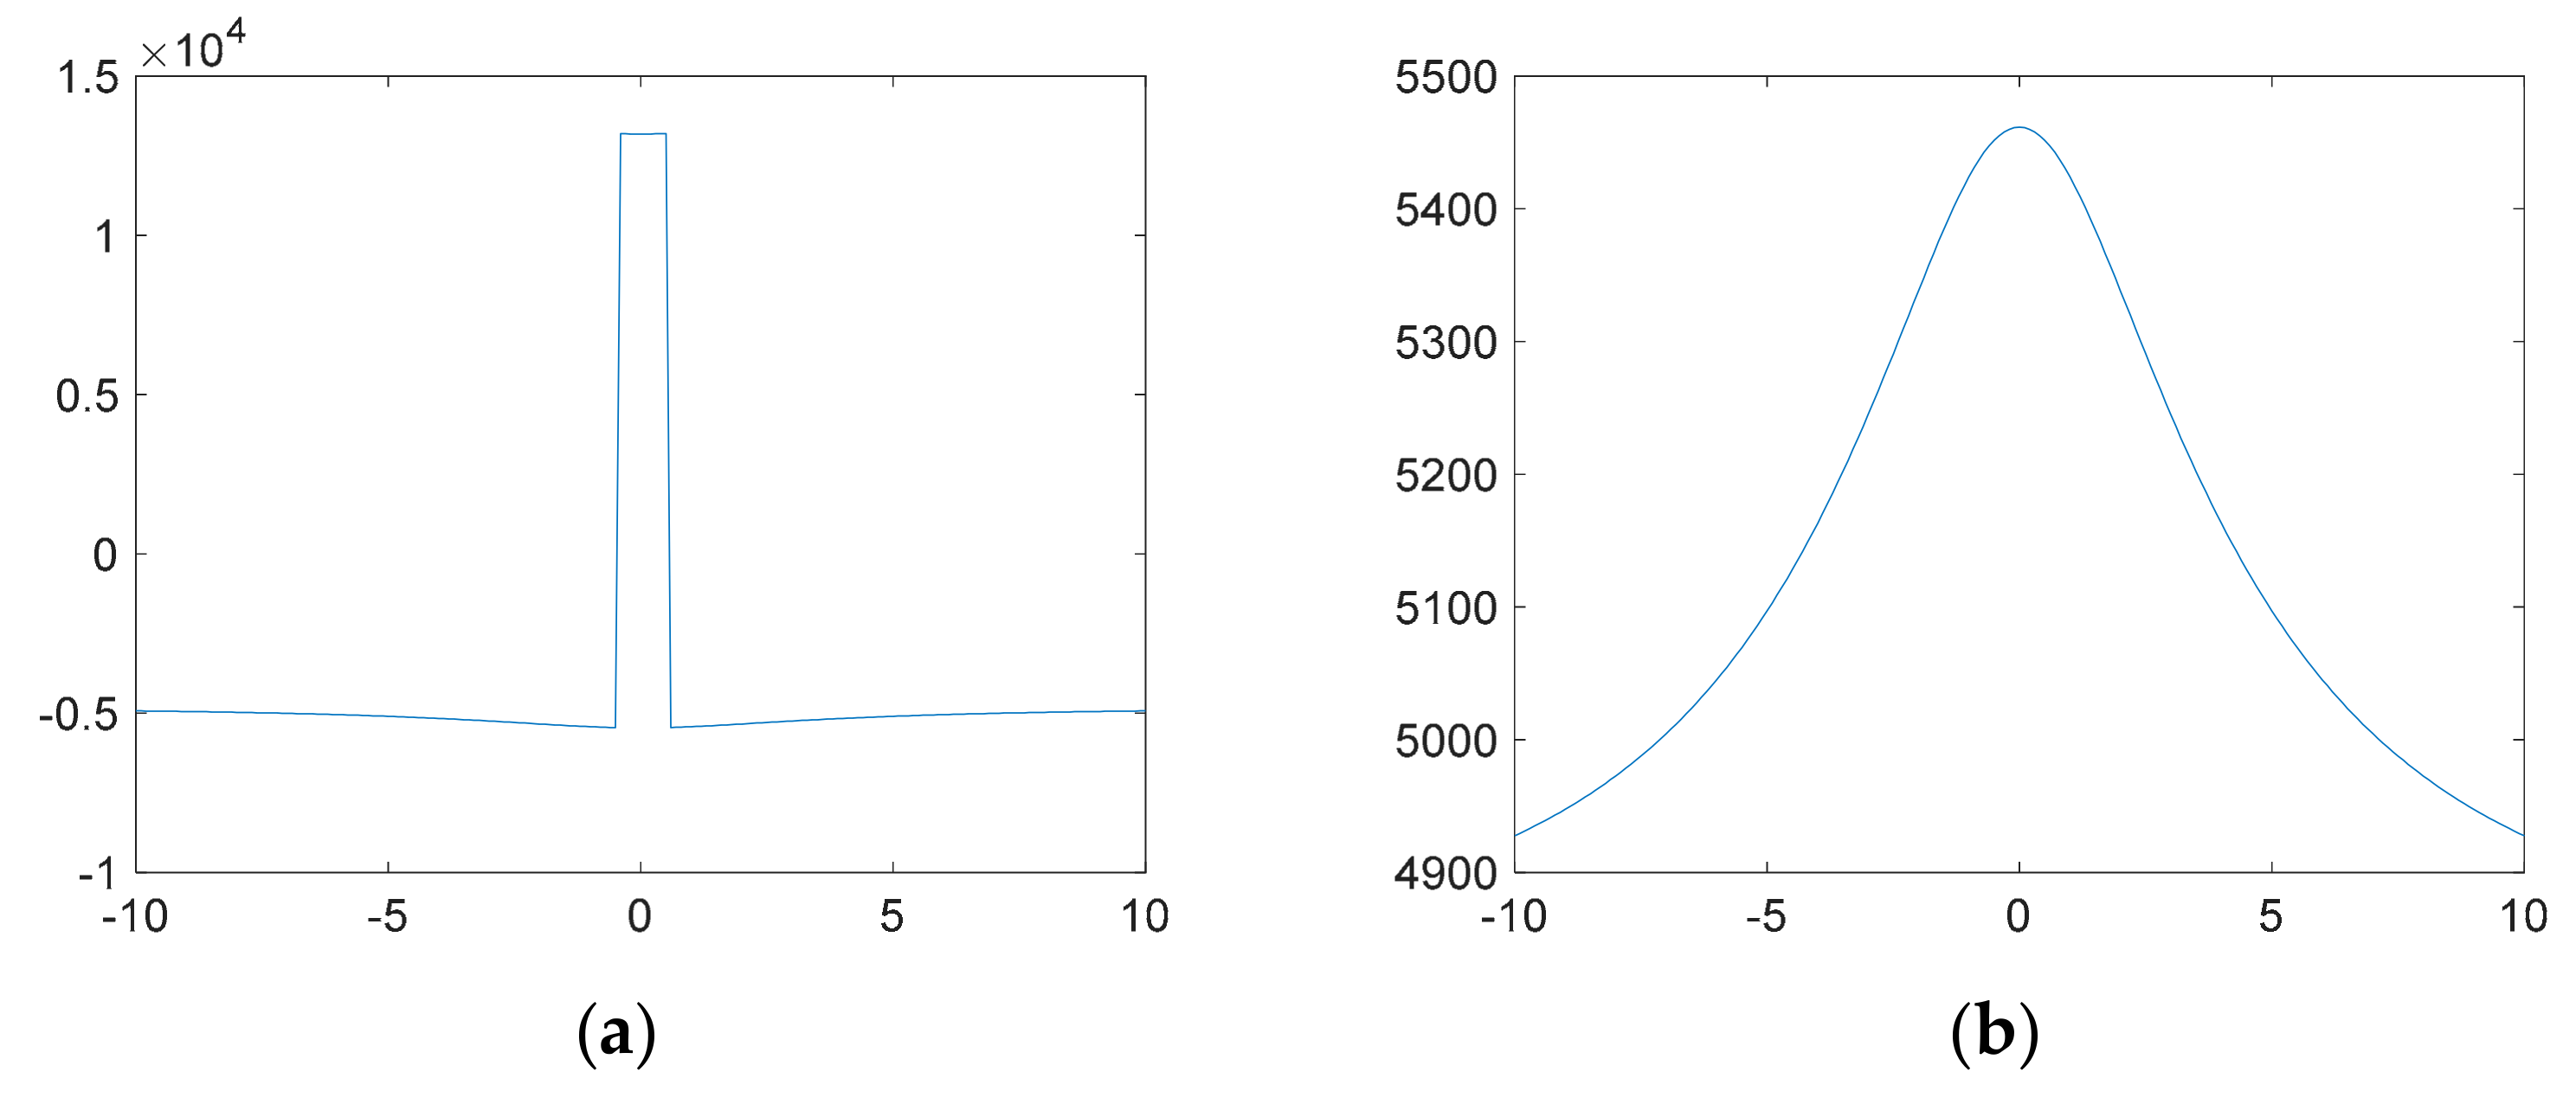
The discontinuity in Figure A1 can be analyzed by taking two arbitrary points 5 + 10i and 5 − 10i and plotting the pressure profile across the vertical cross-section between those points. This is the region with the branch cuts which extends to infinity, from each vertex. The cross-section of Figure A3a demonstrates the acute jump of pressure across the branch cut, and as we move infinitesimally close to the branch cut, either from above or below it (−0.5i or 0.5i) as shown in Figure A2. The pressure gradient ( Δ P ) jumps from −0.5 × 10⁴ Pa to 1.25 × 10⁴ Pa. In effect, each pressure plane lies in two different planes of a Riemann surface as mentioned before. However, Figure A3b shows a pressure profile along −5 + 10i and −5 − 10i (Figure A1), the pressure gradient is smooth and no discontinuity occur as the branch cuts do not extend to negative infinity.
Figure A3. (a) Pressure profile along 5 + 5i and 5 − 5i in Figure A1. Horizontal scale shows distance in meter and vertical scale is pressure in Pa. (b) Pressure profile along −5 + 5i and −5 − 5i in Figure A1. Horizontal scale shows distance in meter and vertical scale is pressure in Pa.
Fluids 04 00154 g0a3

Appendix A3. Proposed Solution to the Branch Cut Placement
The method adopted here to overcome branch cut effects is to separate the real and imaginary parts manually and calculate the phase angles by using tangent function as shown in Equation (A6) below for all the logarithmic terms in Equation (9a). This results in a smooth pressure profile without any unrealistic pressure jumps as shown in Figure A3a.
The following template is used to manually separate the real and imaginary terms and generate the potential plot solution of Figure 15b:
Ω ( z , t ) = υ ( t ) 2 π h n L W [ [ A B + C D ] + i . [ A B + C D ] ]      ( m 2 · s 1 )
Due to the symmetrical nature of the Equation (9a), only one of the four vertices (among, za1, za2, zb1, and zb2) comprised in the terms A, B, C and D, needs to be simplified, for which we use:
A = i e i γ [ ( z + z a 2 ) ( log ( e i γ ( z z a 2 ) ) ]
Term A defined in Equation (A5) can be expanded as follows:
A = i . log R 1 . cos γ . ( x x a 2 ) cos γ . ( x x a 2 ) . arctan b 1 a 1 log R 1 . cos γ . ( y y a 2 ) i . cos γ . ( y y a 2 ) . arctan b 1 a 1 + log R 1 . sin γ . ( x x a 2 ) + i . sin γ . ( x x a 2 ) . arctan b 1 a 1 + i . log R 1 . sin γ . ( y y a 2 ) sin γ . ( y y a 2 ) . arctan b 1 a 1
The real and imaginary parts of Equation (A6) can be separated as follows:
[ A ] = log R 1 . [ sin γ . ( x x a 2 ) cos γ . ( y y a 2 ) ] arctan b 1 a 1 [ sin γ . ( y y a 2 ) + cos γ . ( x x a 2 ) ]
[ A ] = log R 1 . [ cos γ . ( x x a 2 ) sin γ . ( y y a 2 ) ] arctan b 1 a 1 [ cos γ . ( y y a 2 ) sin γ . ( x x a 2 ) ]
where,
z = x + i . y z a 2 = x a 2 + i . y a 2 a 1 = sin γ . ( y y a 2 ) cos γ . ( x x a 2 ) b 1 = + sin γ . ( x x a 2 ) cos γ . ( y y a 2 ) R 1 = a 1 2 + b 1 2
Other expressions in Equation (9a) related to vertices za1 (B), zb1 (C), zb2 (D) can be formulated similar to Equations (A7) and (A8) to separate the real and imaginary term as follows:
[ B ] = log R 2 . [ sin γ . ( x x a 1 ) cos γ . ( y y a 1 ) ] arctan b 2 a 2 [ sin γ . ( y y a 1 ) + cos γ . ( x x a 1 ) ]
[ B ] = log R 2 . [ cos γ . ( x x a 1 ) sin γ . ( y y a 1 ) ] arctan b 2 a 2 [ cos γ . ( y y a 1 ) sin γ . ( x x a 1 ) ]
[ C ] = log R 3 . [ sin γ . ( x x b 1 ) cos γ . ( y y b 1 ) ] arctan b 3 a 3 [ sin γ . ( y y b 1 ) + cos γ . ( x x b 1 ) ]
[ C ] = log R 3 . [ cos γ . ( x x b 1 ) sin γ . ( y y b 1 ) ] arctan b 3 a 3 [ cos γ . ( y y b 1 ) sin γ . ( x x b 1 ) ]
[ D ] = log R 4 . [ sin γ . ( x x b 2 ) cos γ . ( y y b 2 ) ] arctan b 4 a 4 [ sin γ . ( y y b 2 ) + cos γ . ( x x b 2 ) ]
[ D ] = log R 4 . [ cos γ . ( x x b 2 ) sin γ . ( y y b 2 ) ] arctan b 4 a 4 [ cos γ . ( y y b 2 ) sin γ . ( x x b 2 ) ]
If the pressure is calculated by using the original formulation (Equation (9a)), the branch cuts will cause apparent jumps (discontinuities0 in the pressure filed that appear to extend in unfavorable zones (za1zb1, za2zb2, see Figure 14, Figure 22a and Figure A1). By placing the branches between za1za2 and zb1zb2 (Figure 22b), we still have discontinuous solutions known as integral branches, but these branches become confined to the inner region of the flow channels and the pressure field around the fractures at least appear continuous. We recall that this is a pure mathematical manipulation, with the rationale for the chosen solution in Equations (A7)–(A15) being this formulation folds the branch cuts inside the fracture element and achieves the desired continuity of the outer pressure field. Other solutions are possible (Figure 22b).
Equation (A4) with terms A, B, C and D as defined in Equations (A10)–(A15) results in a continuous potential function plot (isobars, Figure A4) for the reservoir defined in Table A1. In Section 2.2.3 (Figure 5), we demonstrated different branch cut solutions for a simple function involving natural logarithm (vortex). A similar procedure can be applied to combine the branch cuts at a single location between the two ends of an areal doublet element as shown in Figure 22b. The potential function is calculated for each vertex of the areal doublet element shown in Figure 14 by dividing the complex plane into two halves at a particular location. Each opposing vortex pair (za1 vs. zb1 and za2 vs. zb2) is assigned opposite branch location, which results in a single branch cut in the previously selected location. Finally, the solutions are spliced together to obtain the solution in Figure 22b.
Figure A4. Pressure profile for flow channel superposed with far field flow by separating the real and imaginary terms individually. The branch cut seen in Figure A1 has been removed by the applied procedure. Length scale in feet and pressure (rainbow colors) in psi.
Fluids 04 00154 g0a4

Appendix B. Inputs for Synthetic and Field Cases

Table A2. Inputs for streamline simulation and pressure gradient calculation.
Inputs for Cases A through E
Flow channel permeability (k)9.87 × 10⁻¹⁵ m2(10 mD)
Matrix Porosity0.1
Viscosity (µ)0.001 Pa.s (1 cP)
Simulation time for Euler’s particle tracking6.31 × 108 s (20 years)
Time steps for particle tracking (Δt)8640 s (0.1 days)
Table A3. Attributes of idealized synthetic flow channels (Case A).
LocationWidth (m)Length (m)Angle (°)Strength (m4·s−1)Far-Field Velocity (m·s−1)
20 + 5i15452.38×10−64.75 × 10⁻⁹
20 − 5i15452.38×10−6
Table A4. Attributes of idealized synthetic flow channels (Case B).
LocationWidth (m)Length (m)Angle (°)Strength (m4·s−1)Far-Field Velocity (m·s−1)
2015452.38×10−64.75 × 10⁻⁹
20153152.38×10−6
Table A5. Attributes of narrow synthetic flow channels (Case C).
LocationWidth (m)Length (m)Angle (°)Strength(m4·s−1)
7 + 3i0.04320−273.95×10⁻⁷
−15 − 5i0.07220601.81×10−7
18 + 0i0.09313150.29×10−7
−20 − 2i0.0991593.90×10−7
−1317i0.04317758.22×10−7
5 + 18i0.0578−398.32×10⁻⁷
−12 + 14i0.09615467.65×10−7
7 − 16i0.05013465.23×10−7
2 + 13i0.0699−226.56×10⁻⁷
11 + −8i0.09812126.46×10−7
−9 + 1i0.04214−767.75×10⁻⁷
−10 − 16i0.05115−801.28×10⁻⁷
17 − 2i0.0631561.66×10−7
−14 − 8i0.02819506.70×10−7
−11 + 5i0.08614783.37×10−7
3 − 6i0.0326−675.99×10⁻⁷
7 + 4i0.05611127.89×10−7
−9 + 14i0.06212−62.47×10⁻⁷
1 + 14i0.0399−888.22×10⁻⁷
−11 + 2i0.0119−299.03×10⁻⁷
Table A6. Attributes of narrow synthetic flow channels (Case D).
LocationWidth (m)Length (m)Angle (°)Strength(m4·s−1)
−19 + 3i0.0429−594.47×10⁻⁷
3 + 8i0.0256−204.42×10⁻⁷
20 + 13i0.09616605.80×10−7
−13 − 11i0.04710559.13×10−7
0 − 10i0.01116−792.71×10⁻⁷
−4 + 4i0.07717−188.89×10⁻⁷
18 − 13i0.090552.47×10−7
07i0.07817−157.46×10⁻⁷
8 + 9i0.07119282.95×10−7
−5 − 14i0.05019232.61×10−7
−6 − 3i0.07319−371.43×10⁻⁷
17 − 11i0.03618−129.36×10⁻⁷
9 − 9i0.06118−870.62×10⁻⁷
137i0.02419877.13×10−7
0 + 11i0.07814−602.90×10⁻⁷
3 − 6i0.02618−716.56×10⁻⁷
9 + 4i0.0268−236.13×10⁻⁷
7 − 13i0.07717−541.19×10⁻⁷
−10 − 10i0.03411−24.18×10⁻⁷
−8 − 18i0.04014−292.71×10⁻⁷
−1 − 13i0.02920811.28×10−7
18 + 12i0.0327765.18×10−7
6 − 18i0.01011−813.18×10⁻⁷
7 − 16i0.0315430.67×10−7
18 − 3i0.02113−420.86×10⁻⁷
20 − 20i0.06814−143.90×10⁻⁷
−3 − 13i0.027796.99×10−7
11 + 19i0.0137808.03×10−7
−2 + 2i0.07919−153.90×10⁻⁷
7 + 17i0.06219876.65×10−7
−16 + 19i0.01017−364.14×10⁻⁷
7 − 15i0.0456362.09×10−7
−9 − 20i0.0985306.84×10−7
−11 − 19i0.0141873.95×10−7
−10 + 19i0.0957368.75×10−7
19 − 6i0.01319306.13×10−7
11 − 2i0.06319−583.66×10⁻⁷
8 − 3i0.0237−673.42×10⁻⁷
19 − 12i0.02018901.62×10−7
8 − 1i0.05711−595.51×10⁻⁷
−12 + 8i0.0927−846.61×10⁻⁷
1 − 2i0.05617115.80×10−7
−1 − 3i0.0447698.98×10−7
−1 − 11i0.04612307.22×10−7
18 + 14i0.04816−562.00×10⁻⁷
4 + 18i0.03919−245.85×10⁻⁷
−14 − 7i0.06519−76.70×10⁻⁷
19 + 19i0.09610878.13×10−7
4 + 16i0.09219−624.71×10⁻⁷
11 + 13i0.01114648.22×10−7
Table A7. Attributes of field case (Case E).
LocationWidth (m)Length (m)Angle (°)Strength(m4·s−1)
1.53 + 8.13i0.014.842312.3×10−7
2.23 + 7.03i0.017.382353.51×10−7
0.51 + 4.39i0.013.662851.74×10−7
0.69 + 1.52i0.012.262531.07×10−7
5.2 + 9.09i0.013.091881.47×10−7
4.34 + 7.22i0.014.651952.21×10−7
3.65 + 5.61i0.015.451882.59×10−7
4.2 + 4.22i0.015.082152.41×10−7
4.74 + 3.84i0.013.552041.69×10−7
4.42 + 3.14i0.014.322092.05×10−7
7.76 + 9.14i0.012.262021.07×10−7
7.58 + 7.74i0.012.112021×10−7
7.35 + 6.44i0.011.811880.86×10−7
6.91 + 3.71i0.011.973050.94×10−7
6.67 + 1.66i0.012.812391.34×10−7
5.22 + 2.12i0.013.972361.89×10−7
6.29 + 1.74i0.011.632580.77×10−7
8.39 + 3.6i0.012.322181.1×10−7
7.28 + 0.92i0.011.112300.53×10−7
8.85 + 2.07i0.013.332541.58×10−7
9.73 + 0.83i0.012.513581.19×10−7
9.86 + 2.51i0.013.42851.62×10−7
10.5 + 3.42i0.012.592481.23×10−7
10.26 + 4.38i0.011.982250.94×10−7
10.17 + 5.24i0.011.882220.89×10−7
9.36 + 6.35i0.014.522272.15×10−7
9.77 + 8.72i0.013.222271.53×10−7
8.69 + 8.77i0.012.322651.1×10−7
9.7 + 7.7i0.012.241951.06×10−7
7.58 + 1.93i0.012.852791.35×10−7
7.99 + 5.43i0.014.342562.06×10−7
6.62 + 7.74i0.014.462672.12×10−7
6.41 + 4.04i0.013.032741.44×10−7
1.51 + 1.31i0.012.542221.21×10−7
9.19 + 5.11i0.011.562820.74×10−7
9.43 + 5.34i0.012.062720.98×10−7

Symbols

ΩComplex potential
u x Far-field velocity in the x-direction
u y Far-field velocity in the y-direction
m Strength of point sources/sinks
Γ Strength of vortex
µStrength of singularity doublet
µ*Strength of singularity dipole
mStrength of line doublet/dipole
υStrength of the areal doublet
ηViscosity of fluid
kReservoir permeability
ϕ Potential Function
ψ Stream Function
v x Velocity on x-direction
v y Velocity on y-direction
Δ t Time step

References

  1. Needham, T. Visual Complex Analysis; Clarendon Press: Oxford, UK, 1997. [Google Scholar]
  2. Sato, K. Complex Analysis for Practical Engineering; Springer International Publishing: Cham, Switzerland, 2015. [Google Scholar] [CrossRef]
  3. Van Harmelen, A.; Weijermars, R. Complex analytical solutions for flow in hydraulically fractured hydrocarbon reservoirs with and without natural fractures. Appl. Math. Model. 2018, 56, 137–157. [Google Scholar] [CrossRef]
  4. Weijermars, R.; Khanal, A. High-Resolution Streamline Models of Flow in Fractured Porous Media using Discrete Fractures: Implications for Upscaling of Permeability Anisotropy. Earth-Sci. Rev. 2019, 194, 399–448. [Google Scholar] [CrossRef]
  5. Weijermars, R.; Khanal, A. Elementary pore network models based on complex analysis methods (CAM): fundamental insights for shale field development. Energies 2019. [Google Scholar] [CrossRef]
  6. Khanal, A.; Weijermars, R. Visualization of drained rock volume (DRV) in hydraulically fractured reservoirs with and without natural fractures using complex analysis methods (CAMs). Pet. Sci. 2019, 16, 550. [Google Scholar] [CrossRef]
  7. Khanal, A.; Weijermars, R. Pressure depletion and drained rock volume near hydraulically fractured parent and child wells. J. Pet. Sci. Eng. 2019, 172, 607–626. [Google Scholar] [CrossRef]
  8. Khanal, A.; Weijermars, R. Production Interference of Hydraulically Fractured Hydrocarbon Wells: New Tools for Optimization of Productivity and Economic Performance of Parent and Child Wells. In Proceedings of the 2019 SPE Europec featured at 81st EAGE Conference and Exhibition, London, UK, 3–6 June 2019. [Google Scholar]
  9. Khanal, A.; Weijermars, R. Impact of Natural Fractures on the Shape and Location of Drained Rock Volumes in Unconventional Reservoirs: Case Studies from the Permian Basin. In Proceedings of the 2019 SPE/AAPG/SEG Unconventional Resources Technology Conference, Denver, CO, USA, 22–24 July 2019. [Google Scholar]
  10. Batycky, R.P.; Blunt, M.J.; Thiele, M.R.; Stanford, U. A 3D Field Scale Streamline Based Reservoir Simulator. Spe Reserv. Eng. 1997. [Google Scholar] [CrossRef]
  11. Thiele, M.R.; Batycky, R.P.; Blunt, M.J.; Orr, F.M., Jr. Simulating Flow in Heterogeneous Systems Using Streamtubes and Streamlines. Spe Reserv. Eng. 1996. [Google Scholar] [CrossRef]
  12. Tanaka, S.; Kam, D.; Datta-Gupta, A.; King, M.J. Streamline-Based History Matching of Arrival Times and Bottomhole Pressure Data for Multicomponent Compositional Systems. In Proceedings of the SPE Annual Technical Conference and Exhibition, Houston, TX, USA, 28–30 September 2015; Society of Petroleum Engineers: London, UK, 2015. [Google Scholar] [CrossRef]
  13. Kahan, W. Branch Cuts for Complex Elementary Functions, or Much Ado about Nothing’s Sign Bit. In The State of the Art in Numerical Analysis, Proceedings of the Joint IMA/SIAM Conference on the State of the Art in Numerical Analysis Held at the UN, Oxford, UK, 1 September 1987; Iserles, A., Powell, M.J.D., Eds.; Clarendon Press: New York, NY, USA, 1987; pp. 165–211. [Google Scholar]
  14. Weijermars, R.; Van Harmelen, A. Breakdown of doublet recirculation and direct line drives by far-field flow in reservoirs: Implications for geothermal and hydrocarbon well placement. Geophys. J. Int. 2016, 206, 19–47. [Google Scholar] [CrossRef]
  15. Strack, O.D.L. Groundwater Mechanics; Prentice-Hall: Englewood Cliffs, NJ, USA, 1989. [Google Scholar]
  16. Weijermars, R.; Van Harmelen, A.; Zuo, L. Flow Interference Between Frac Clusters (Part 2): Field Example from the Midland Basin (Wolfcamp Formation, Spraberry Trend Field) With Implications for Hydraulic Fracture Design. In Proceedings of the SPE/AAPG/SEG Unconventional Resources Technology Conference, Austin, TX, USA, 24–26 July 2017. [Google Scholar] [CrossRef]
  17. Weijermars, R.; van Harmelen, A.; Zuo, L.; Nascentes, I.A.; Yu, W. High- Resolution Visualization of Flow Interference Between Frac Clusters (Part 1): Model Verification and Basic Cases. In Proceedings of the SPE/AAPG/SEG Unconventional Resources Technology Conference, Austin, TX, USA, 24–26 July 2017. [Google Scholar]
  18. Zuo, L.; Weijermars, R. Rules for Flight Paths and Time of Flight for Flows in Porous Media with Heterogeneous Permeability and Porosity. Geofluids 2017. [Google Scholar] [CrossRef]
  19. Pradhan, V.R.; Meert, J.G.; Pandit, M.K.; Kamenov, G.; Mondal, M.d.E.A. Paleomagnetic and geochronological studies of the mafic dyke swarms of Bundelkhand craton, central India: Implications for the tectonic evolution and paleogeographic reconstructions. Precambrian Res. 2012, 198–199, 51–76. [Google Scholar] [CrossRef]
  20. Kilaru, S.; Goud, B.K.; Rao, V.K. Crustal structure of the western Indian shield: Model based on regional gravity and magnetic data. Geosci. Front. 2013, 4, 717–728. [Google Scholar] [CrossRef] [Green Version]
  21. McKenzie, N.R.; Hughes, N.C.; Myrow, P.M.; Banerjee, D.M.; Deb, M.; Planavsky, N.J. New age constraints for the Proterozoic Aravalli-Delhi successions of India and their implications. Precambrian Res. 2013, 238, 120–128. [Google Scholar] [CrossRef]
  22. Mukhopadhyay, S.; Bhattacharya, A.K. Bidasar ophiolite suite in the trans-Aravalli region of Rajasthan: A new discovery of geotectonic significance. Indian J. Geosci. 2009, 63, 345–350. [Google Scholar]
  23. Sanmiguel Vila, C.; Örlü, R.; Vinuesa, R.; Schlatter, P.; Ianiro, A.; Discetti, S. Adverse-Pressure-Gradient Effects on Turbulent Boundary Layers: Statistics and Flow-field Organization. Flow Turbul. Combust 2017, 99, 589. [Google Scholar] [CrossRef] [PubMed]
  24. Holzbecher, E. Streamline Visualization of Potential Flow with Branch Cuts, With Applications to Groundwater. J. Flow Vis. Image Process. 2018, 25, 119–144. [Google Scholar] [CrossRef]
  25. Gale, J.; Laubach, S.; Olson, J.; Eichhubl, P.; Fall, A. Natural Fractures in Shale: A Review and New Observations. Aapg Bull. 2014, 98, 2165–2216. [Google Scholar] [CrossRef]
  26. Dunn, T.L.; Bernabe, A.; Humphreys, J.; Surdam, R.C. Cements and In-situ Widths of Natural Fractures, Almond Formation, Green River Basin, Wyoming; WGA Field Conference Guide Book. 1995, pp. 255–269. Available online: http://www.searchanddiscovery.com/abstracts/html/1995/rms/abstracts/0917a.htm (accessed on 5 August 2019).
  27. Rosales, R.R. Branch Points and Branch Cuts; MIT: Cambridge, MA, USA, 1999. [Google Scholar]
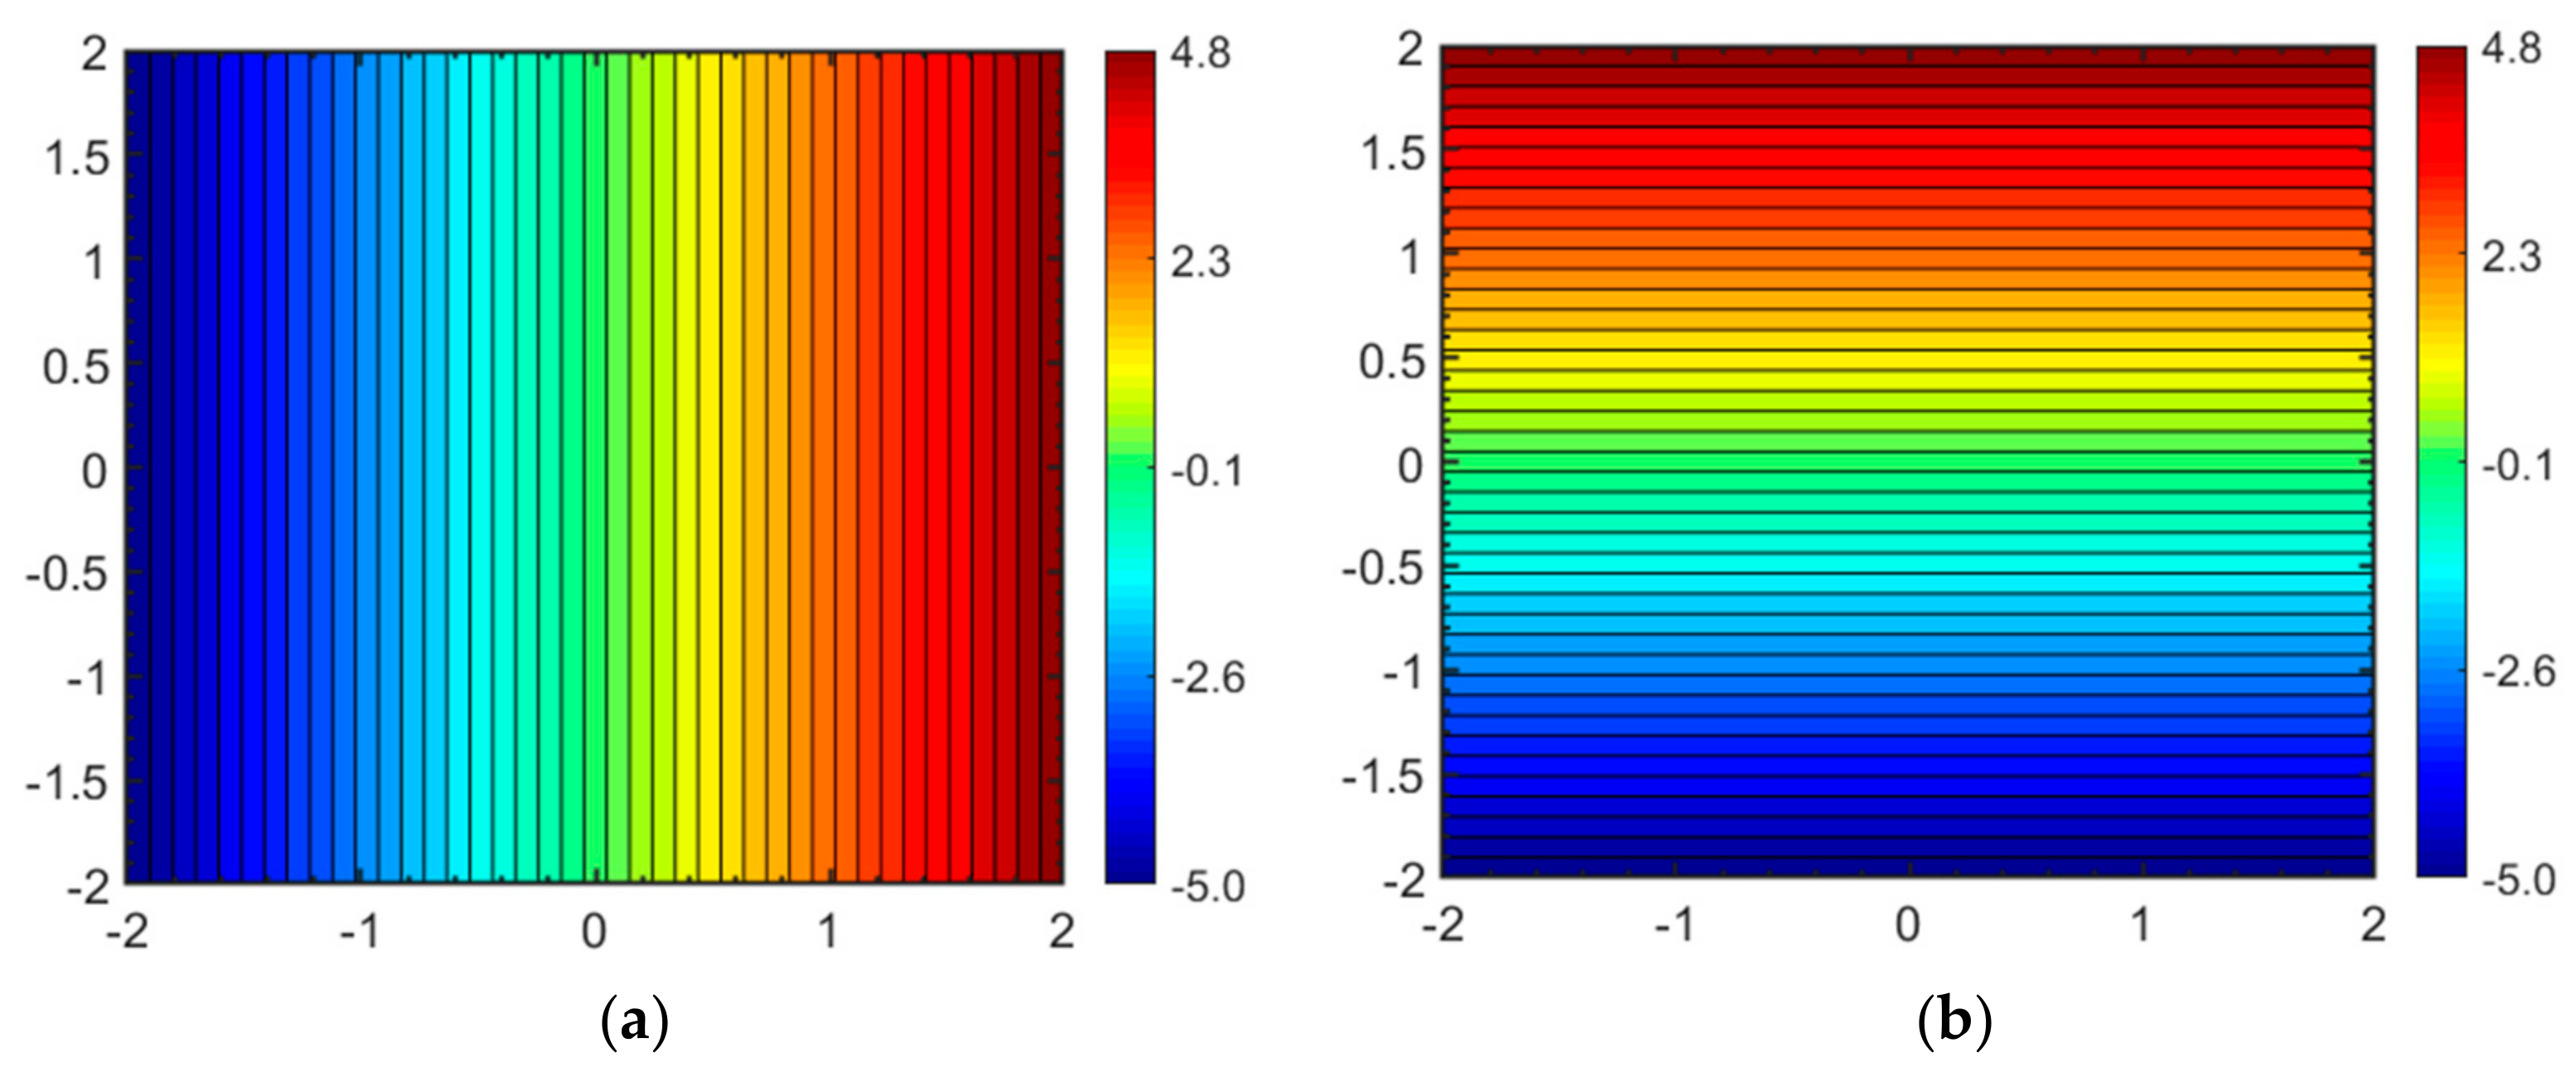
Figure 1. Uniform far-field flow with (a) Potential function values (Φ) given by rainbow colors (m2·s−1) relative to line x = 0. (b) Stream function values (Ψ) given by rainbow colors (m2·s−1) relative to line x = 0. Far-field flow velocity ( u x = 2.5 m2·s−1) originating from the left edge.
Fluids 04 00154 g001
Figure 2. Potential function (a) and stream function (b). Far-field flow velocity ( u y ) = 2.5 m·s−1 originating from the top edge.
Fluids 04 00154 g002
Figure 3. Source flow with (a) Potential function values (Φ) given by concentric circles in rainbow colors. (b) Stream function values (Ψ) given by straight radials in rainbow colors. Strength of source (m) = 20 m2·s−1 and zd = 0. The potential function highs and lows slope opposite to the pressure gradient.
Fluids 04 00154 g003
Figure 4. Vortex flow with (a) Potential lines (Φ) (b) Stream functions (Ψ). Strength of vortex (Γ) = 20 m2·s−1 and zd = 0. Flow is anti-clockwise from low to high potentials; pressure gradient will be opposite to the potential gradient.
Fluids 04 00154 g004
Figure 5. The branch cuts of the potential function of the vortex in Figure 4 rotated by various angles in clockwise direction: (a) Angle of 45°, (b) Angle of 90°, (c) Angle of 180°, and (d) Angle of 225°.
Fluids 04 00154 g005
Figure 6. Schematic of (a) Spaced doublet, (b) Singularity doublet, and (c) Rotated singularity doublet gives a singularity dipole to string into a line dipole as used in Section 2.4. Reproduced with permission from [14].
Fluids 04 00154 g006
Figure 7. Point (singularity) doublet (Figure 5b). (a) Potential function values (Φ) given by concentric circles (m2·s−1) relative to line y = 0 and (b) Stream function values (Ψ) given by concentric circles (m2·s−1). The highest and the lowest values lie close to the singularity and quickly subsides. Strength of point doublet (µ) = 20 m3·s−1 and zd = 0.
Fluids 04 00154 g007
Figure 8. Potential function (a) and stream function (b) for singularity dipole. Strength of point dipole (µ*) = 20 m3·s−1 and zd = 0.
Fluids 04 00154 g008
Figure 9. Visualization of (a) line doublet, and (b) line dipole. (a,b) are obtained by superposing an infinite number of singularity doublets and singularity dipoles, respectively. Reproduced with permission from [14].
Fluids 04 00154 g009
Figure 10. Line doublet with (a) Potential function values (Φ) given by rainbow colors (m2·s−1) relative to line y = 0. (b) Stream function values (Ψ) given by rainbow colors (m2·s−1) relative to line y = 0. Strength of line doublet (m) = 20 m3·s−1 and za = −5 and zb = 5.
Fluids 04 00154 g010
Figure 11. Potential function (a) and stream function (b) as in Figure 10. Strength of line dipole (m) = 20 m3·s−1 and za = −5 and zb = 5.
Fluids 04 00154 g011
Figure 12. Visualization of (a) areal doublet, and (b) areal dipole. (a,b) are obtained by superposing an infinite number of line doublets and line dipoles, respectively.
Fluids 04 00154 g012
Figure 13. (ad) Superposition of discrete line doublets, with respectively 1, 2, 5 and 10 line doublets. Plots show map of potential function solution (left images), vertical profile along central part of potential field at x = 0 and y = ±10, with value jumps across the branch cuts (central images), and stream function solutions (right images). Cumulative strength of line doublets in each case is 100 m3·s−1, length is 10 m each, oriented at 0°.
Fluids 04 00154 g013
Figure 14. Schematic of an areal doublet with a tilt angle, γ (radians), corner point angle, β (radians) located at center zc, width, W (m), and length, L (m).
Fluids 04 00154 g014
Figure 15. Areal doublet (enhanced permeability flow channel). (a) Potential function solution and isobars (Φ) with MATLAB branch cuts, (b) Potential function solution applying manual separation of real part of complex potential applying method of Appendix A. (c) Streamlines and stream function solution (Ψ) (rainbow colors). Strength of the areal doublet is (υ) = 100 m4·s−1 and zc = 0.
Fluids 04 00154 g015
Figure 16. Areal dipole. (a) Potential lines (Φ). (b) Streamlines and stream function (Ψ) solved by MATLAB, and (c) Streamlines and stream function (Ψ) solved using the procedure explained in Appendix A (rainbow colors). Strength of the superposed line dipole is (υ) = 100 m4·s−1 and zc = 0.
Fluids 04 00154 g016
Figure 17. Left column: Streamlines (blue) and TOFC (red) due to a far-field flow with a uniform velocity of 0.15 m·year−1. Three cases are shown: (a) Base Case: Homogeneous reservoir with no enhanced permeability flow channels. (b) Case A: Two parallel enhanced permeability flow channels at an angle with the far-field flow (attributes given in Appendix B, Table A4). (c) Case B: Two enhanced permeability flow channels perpendicular to each other (attributes given in Appendix B, Table A5). Right column: Resulting pressure fields in Pascal.
Fluids 04 00154 g017
Figure 18. Pressure field (in Pascal) for: (a) Base case: Far-field flow for an isotropic reservoir. (b) Case C: 20 randomly generated enhanced permeability flow channels. (c) Case D: 50 randomly generated enhanced permeability flow channels. The attributes of each flow channels are presented in Appendix B (Table A5 through Table A6).
Fluids 04 00154 g018
Figure 19. The images are sorted from the largest to the smallest from top row to bottom row. (a) Satellite image of the quarry near Bidasar, Rajasthan, India (roads for scale). North is downward in image (Google Earth composite of 16 December 2015). (b) Orthogonal photograph of polished rock slab with filled fracture veins. Image dimensions about 1 × 1 m. (c) Interpreted principal fracture network (black lines).
Fluids 04 00154 g019
Figure 20. (a–d): Case E. Streamlines (magenta) and TOFC (rainbow colors) for the slab with enhance permeability flow channels of Figure 19c simulated for 20 years. The flow channels are deactivated in case a and cases b-d have increasing strengths of the flow channels (scaled by their respective lengths and with attributes for each flow channel presented in Appendix B Table A7).
Fluids 04 00154 g020
Figure 21. (ad) Pressure fields (Case E) in Pascal corresponding to the stream function solutions given in Figure 20a–d.
Fluids 04 00154 g021
Figure 22. (a) Branch cuts extend horizontally exhibiting unrealistic contour for potential function. (b) Branch cut restricted to the center of the analytical element.
Fluids 04 00154 g022
Table 1. Invariant and variant complex potentials.
InvariantVariant
Far-field flowSource/sink flow
Singularity dipole/doubletVortex
Areal doubletLine doublet
Areal dipoleLine dipole