Article

Application of a Projection Method for Simulating Flow of a Shear-Thinning Fluid

1
School of Mechanical, Aerospace and Civil Engineering, University of Manchester, Manchester M13 9PL, UK
2
Departments of Mechanical Engineering and Mathematics, University of Kentucky, Lexington, KY 40506, USA
3
School of Mining Engineering and Metallurgy, National Technical University of Athens, 15780 Zografou, Greece
4
Departments of Mechanical Engineering, Technical University of Denmark, Nils Koppels Allé, 2800 Kgs. Lyngby, Denmark
*
Author to whom correspondence should be addressed.
Fluids 2019, 4(3), 124; https://doi.org/10.3390/fluids4030124
Submission received: 29 May 2019 / Revised: 1 July 2019 / Accepted: 3 July 2019 / Published: 8 July 2019
(This article belongs to the Special Issue Recent Advances in Mechanics of Non-Newtonian Fluids)

Abstract

:
In this paper, a first-order projection method is used to solve the Navier–Stokes equations numerically for a time-dependent incompressible fluid inside a three-dimensional (3-D) lid-driven cavity. The flow structure in a cavity of aspect ratio δ = 1 and Reynolds numbers ( 100 , 400 , 1000 ) is compared with existing results to validate the code. We then apply the developed code to flow of a generalised Newtonian fluid with the well-known Ostwald–de Waele power-law model. Results show that, by decreasing n (further deviation from Newtonian behaviour) from 1 to 0.9, the peak values of the velocity decrease while the centre of the main vortex moves towards the upper right corner of the cavity. However, for n = 0.5 , the behaviour is reversed and the main vortex shifts back towards the centre of the cavity. We moreover demonstrate that, for the deeper cavities, δ = 2 , 4 , as the shear-thinning parameter n decreased the top-main vortex expands towards the bottom surface, and correspondingly the secondary flow becomes less pronounced in the plane perpendicular to the cavity lid.

1. Introduction

Flow inside a cubic cavity with a top lid moving at a constant velocity has been the centre of many fundamental fluid flow studies [1,2,3] as well as practical applications [4,5,6]. Flow inside a lid-driven cavity (LDC)—see Figure 1—has been reportedly studied both experimentally and numerically [7,8,9,10,11,12,13,14,15], and used as a reliable benchmark for validating Navier–Stokes (NS) solvers. Recently, Shankar and Deshpande [1] have comprehensively reviewed the LDC flow and identified crucial aspects open for further investigations.
Steady two-dimensional (2-D) LDC flow has been studied in literature at different Reynolds number [12,16]— R e = U l i d L / ν , where U l i d is the lid velocity, L the cavity length and ν the kinematic viscosity of the fluid. The 2-D LDC, however, deviates from actual experiments in 3-D mainly due to the no-slip conditions imposed by end walls in the cross-flow direction span [9,10,11,17]. Albensoeder et al. [17] reported that the fluid bifurcates from steady to periodic, and eventually to turbulent flow when it goes above the critical Reynolds number, R e c r O 10 3 . This is, however, dependent on cavity aspect ratios, i.e., length-to-width, λ = L / W , and depth-to-width, δ = H / L [18,19].
Most fluids in nature exhibit Newtonian behaviour, in which the dynamic viscosity, μ , at constant temperature and pressure is equal to τ / γ ˙ τ is the shear stress, and γ ˙ is the shear rate [20,21]. For an incompressible fluid, the equation governing the tensorial shear stress (in Cartesian coordinates) is [22,23]
τ ̲ ̲ = μ γ ˙ ̲ ̲ ,
where μ is the dynamic viscosity, τ ̲ ̲ is the shear stress tensor, and γ ˙ ̲ ̲ the shear rate tensor. Here, γ ˙ ̲ ̲ is the rate of strain tensor, γ ˙ ̲ ̲ = u + u , which is given by [24,25,26]
γ ˙ = 1 2 I I γ ˙ = 1 2 γ ˙ ̲ ̲ : γ ˙ ̲ ̲ 1 / 2 ,
where I I γ ˙ is the second invariant of γ ˙ ̲ ̲ , u is the velocity gradient tensor and u is its transpose. Similarly, for the stress tensor, τ ̲ ̲ , we have [27,28,29]
τ = 1 2 I I τ = 1 2 τ ̲ ̲ : τ ̲ ̲ 1 / 2 ,
where I I τ is the second invariant of τ ̲ ̲ . The correlation between shear stress and shear rate defines the flow behaviour of a liquid. For a Newtonian fluid, there is a linear correlation between the shear stress and shear rate, and the slope of this line is the dynamic viscosity, μ . Recognition that stress in a fluid can have a nonlinear or temporal (or both) dependence on the rate of deformation developed in the late nineteenth and early twentieth centuries; we now refer to such materials as non-Newtonian fluids. For a non-Newtonian fluid, a.k.a nonlinear or complex fluid, the slope of shear stress versus shear rate curve is not constant, and hence is a function of τ or γ ˙ . The most common category of the complex fluids is the pure viscous fluid in which γ ˙ ̲ ̲ is determined only by the current value of τ ̲ ̲ at any particular point in the flow domain.
Shear-thinning is perhaps the most widely encountered type of time-dependent non-Newtonian fluid behaviour in engineering practice for ceramics [30,31,32,33]. It is characterised by an apparent viscosity μ a which gradually decreases with increasing shear rate:
τ ̲ ̲ = μ a γ ˙ ̲ ̲ ,
or, in terms of the apparent viscosity,
μ a = k γ ˙ ̲ ̲ n 1 τ ̲ ̲ = k γ ˙ ̲ ̲ n 1 γ ˙ ̲ ̲ .
Equation (5) is known as the Ostwald–de Waele power-law model. Varying n between 0 < n < 1 will yield d μ / d γ ˙ < 0 ; i.e., shear-thinning fluids are characterised by a value of n (power-law index) smaller than unity. Many polymer melts and solutions exhibit a value of n in the range 0.3–0.7 depending upon the concentration and molecular weight, etc., of the polymer. Even smaller values of power-law index (n∼0.1–0.15) are encountered with fine particle suspensions such as, e.g., kaolin-in-water and bentonite-in-water. Naturally, the smaller the value of n, the more shear-thinning the material is. The other constant, k, in Equation (5) (consistency index) is a measure of consistency of the substance, which is well described by Jabbari and Hattel [31].
A computational fluid dynamics (CFD) approach to problems showing non-Newtonian behaviour is generally more complicated than that for a corresponding Newtonian case due to the complexity introduced by the constitutive equation of the employed model in the diffusion terms of the Navier–Stokes equations. In particular, it is clear from Equation (5) that the proposed model for viscosity introduces nonlinearities in the diffusion terms—the highest-order differential operators. Different numerical methods have been employed in the past in order to simulate viscous and viscoplastic fluid flows; the most widely known simulations have employed power-law and Bingham models. However, for the LDC problem, most available studies have focused on modelling elastic and viscoelastic fluid flows: see, for example, [34,35,36]. There are also some studies related to the LDC problem for viscoplastic fluids (power-law and Bingham models) in which rather different approaches were used for solving the NS equations, viz., the smoothed particle hydrodynamics (SPH) method [37], and the PIM (point interpolation method) meshfree method [38]. Despite remarks by these authors, there seems to be no clear-cut overall advantage to non-standard methods in the present context.
In this work, we present results from simulation of flow inside a 3-D LDC. We begin with the mathematical formulation and brief discussion of the numerical analytic procedures employed, all of which are fairly well known. We validate a particular Fortran code in a range of R e numbers corresponding to steady flow by using existent, highly-accurate, direct numerical simulations for comparisons with our results. We then proceed to a problem involving a generalised Newtonian fluid with the shear-thinning power-law behaviour. The influence on the flow pattern in the 3-D cavity with several depth-to-width aspect ratios, δ , as well as Reynolds number, are investigated. These values of Reynolds number and aspect ratios are relevant to processing and manufacturing of ceramics and polymers.

2. Mathematical Model

Projection methods such as proposed by Chorin [39], Bell et al. [40] and Gresho [41], e.g., are used in problems involving time-dependent incompressible fluids; the diffusion–convection equations are first solved to predict intermediate velocities which are then projected onto the space of divergence-free vector fields [41]. The incompressible NS equations (the differential form of momentum equation combined with the continuity equation) may be written as
u t + u · u = 1 ρ p + ν Δ u ,
· u = 0 ,
where ρ is density, and ν is kinematic viscosity. These equations are solved in the interior of a domain Ω consisting of the unit cube, ( 0 , 1 ) × ( 0 , 1 ) × ( 0 , 1 ) , shown in Figure 1, with initial conditions u 0 and no-slip boundary conditions.
In the projection 1 method analyzed in [41], and employed here, an intermediate velocity, u * , is computed using the momentum equations with pressure gradient terms absent—given here in semi-discrete form:
u * u n Δ t = u n · u n + ν Δ u n ,
where u n is the velocity at the n t h time level ( u = ( u , v , w ) T ). Equation (7) comprises an easily-solved multi-dimensional system of Burgers’ equations. In the present work, the system is coded using a Fortran 77/90 research code based on Douglas and Gunn time splitting [42] with quasilinearisation (a function-space Newton’s method) of nonlinear advective terms.
In the next (projection) step, the velocity at the ( n + 1 ) th time level is computed as follows:
u n + 1 u * Δ t = 1 ρ p n + 1 ,
u n + 1 = u * Δ t ρ p n + 1 .
The right-hand side of the above equation requires knowledge of the pressure, p, at ( n + 1 ) level. This is obtained by taking the divergence and requiring that · u n + 1 = 0 , which is the divergence-free (continuity) condition, thereby leading to the following Poisson equation for p n + 1 :
Δ p n + 1 = ρ Δ t · u * .
It is important to emphasize, however, that this is not the true, physical pressure although it differs from physical pressure by O ( Δ t / R e ) .
Since the boundary condition for u * in Equation (7) is no slip, this leads to a boundary condition for the approximate pressure in the form (see, e.g., Foias et al. [43])
p n + 1 n = 0 on Ω .
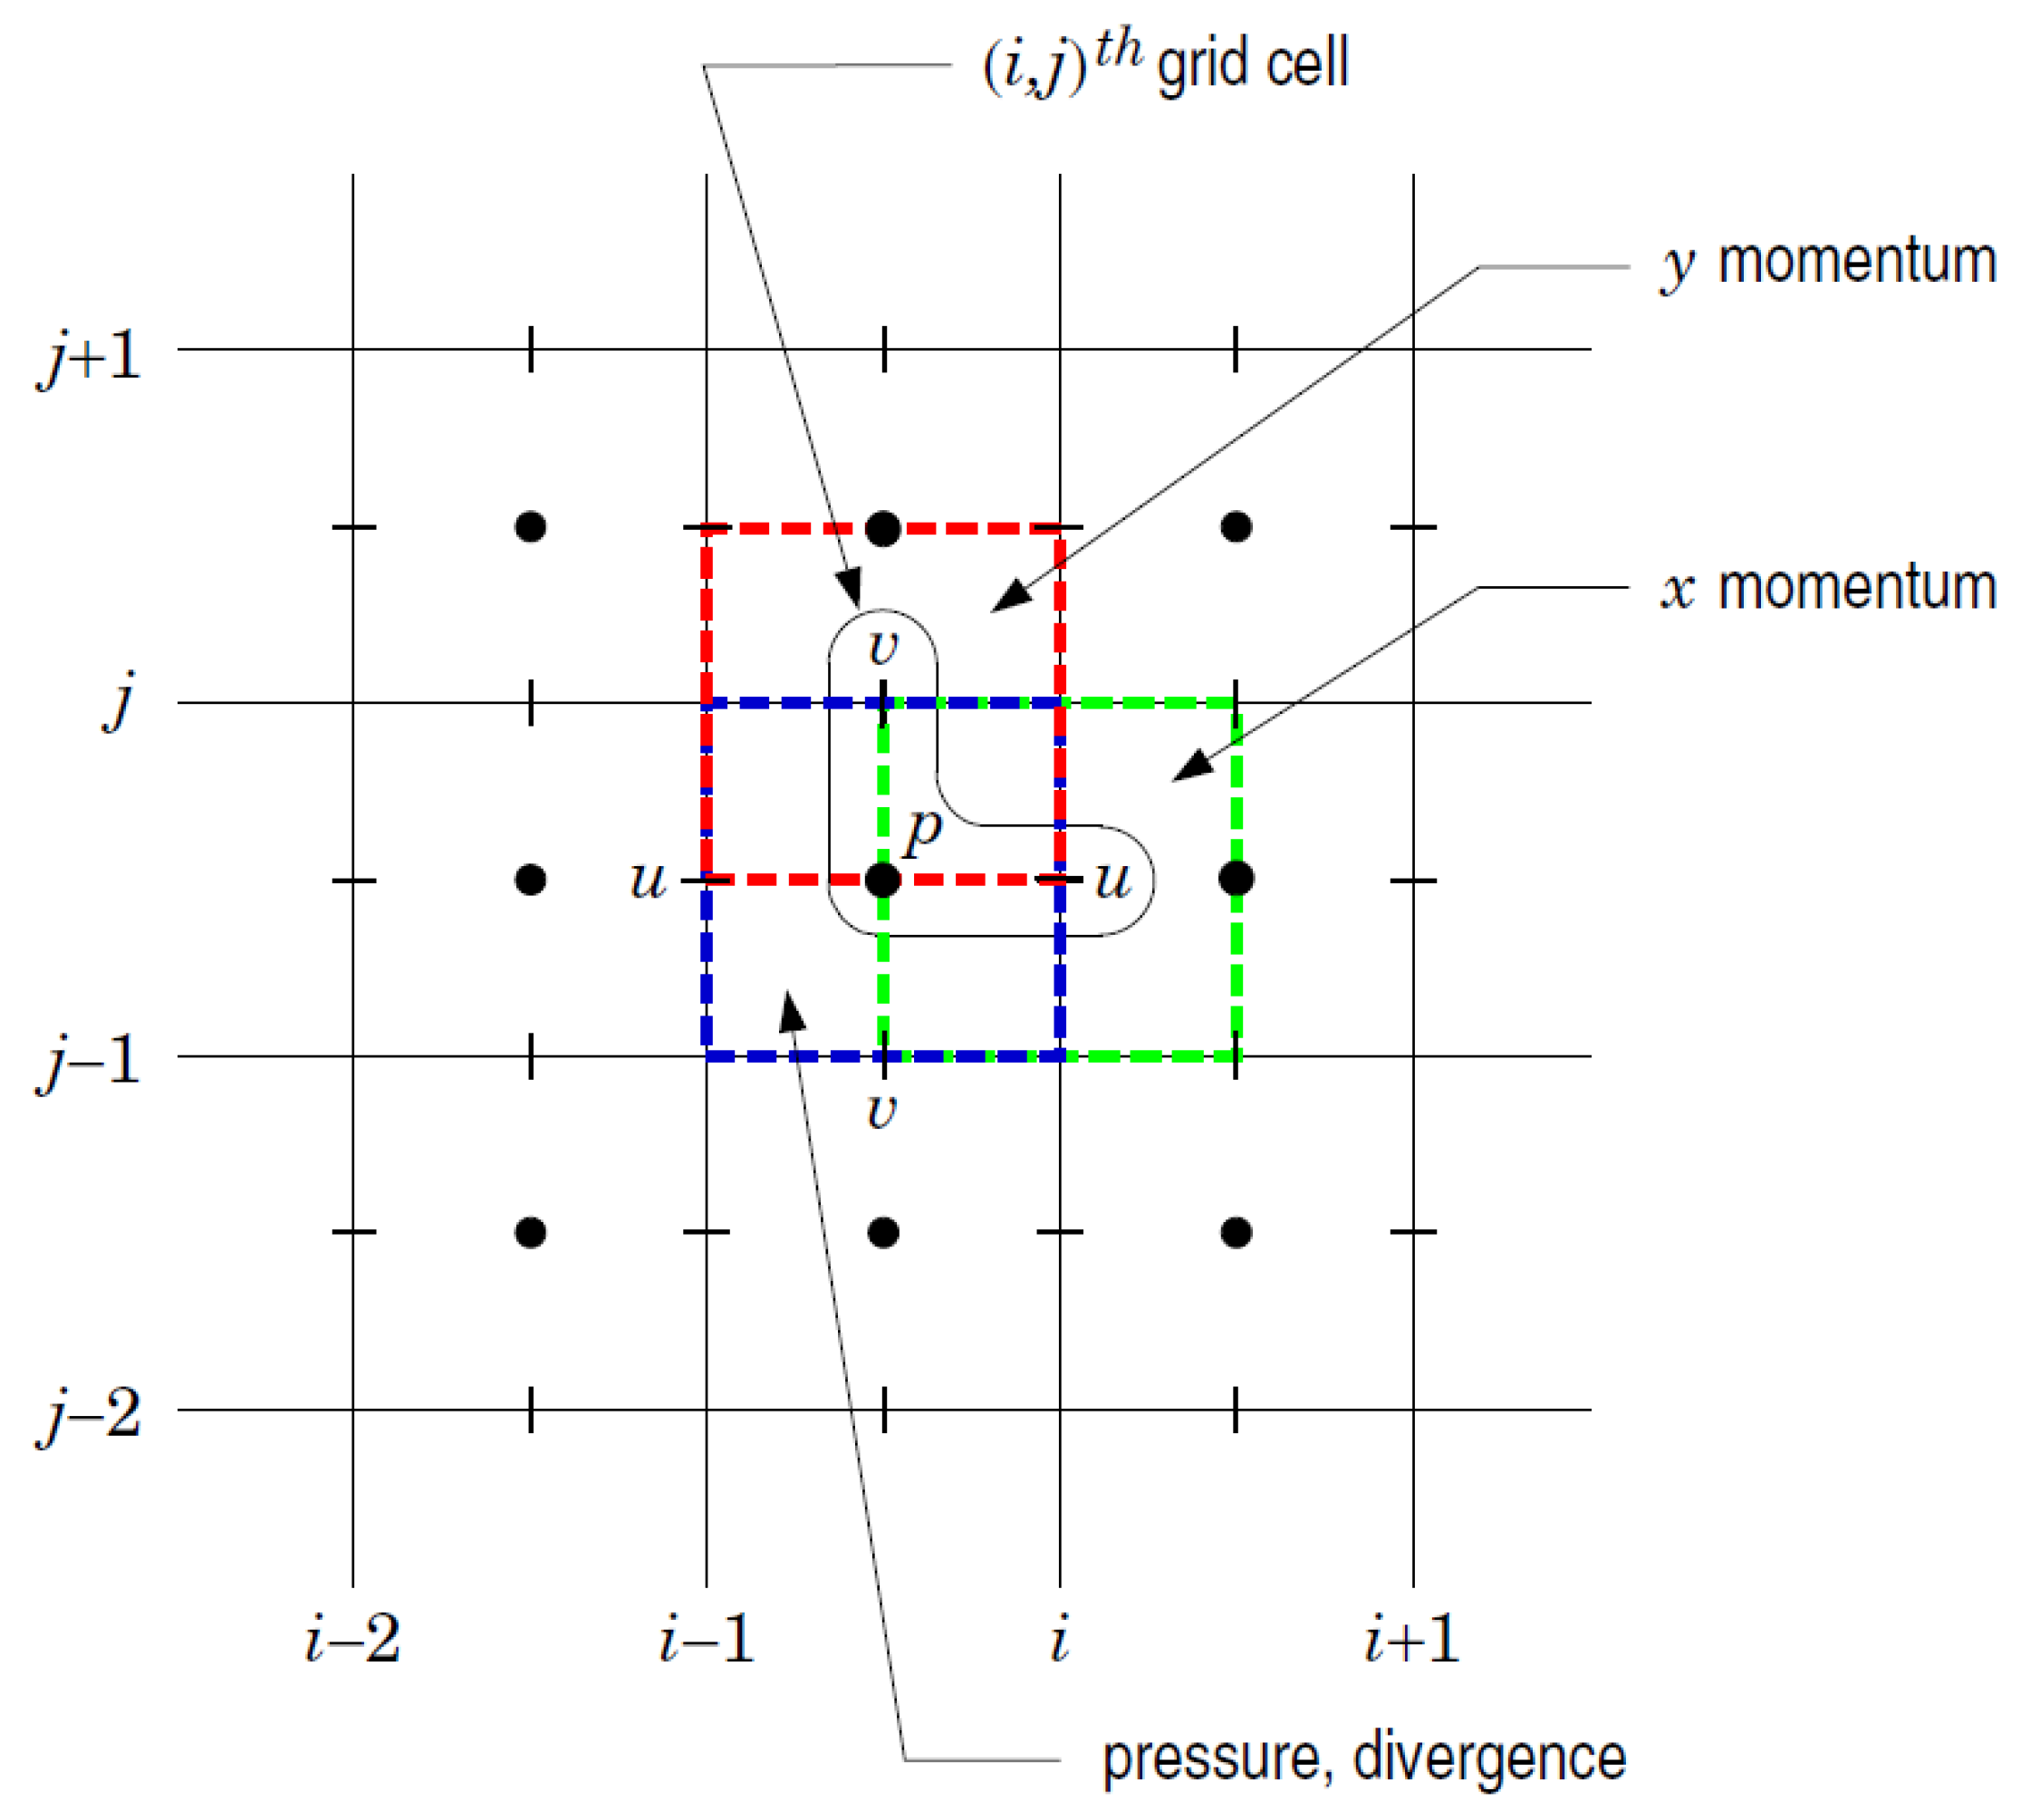
It is important to note that boundary conditions must be imposed on physical boundaries, and, in the context of a staggered grid (see Figure 2), this implies that Dirichlet conditions on velocity components can be directly applied (on the boundary) only for the normal-direction component on each boundary. The tangential components must be averaged across the boundary by employing an “image” cell outside the solution domain. Neumann conditions used here for pressure are also implemented by means of image cells, as must also be done in the context of unstaggered gridding. This is done in all cases to maintain second-order accuracy of interior-point discretizations.
While using transient simulation, it is important to make sure that the Courant–Friedrichs–Lewy (CFL) condition is preserved. For a given resolution size, the CFL condition enforces an upper limit on the local time step [45]. In general, the CFL condition for a three-dimensional, transient problem is as follows:
u x Δ t Δ x + u y Δ t Δ y + u z Δ t Δ z C max ,
where C max is normally 1 for explicit solvers. For implicit or semi-implicit, this value can increase up to a bigger value (e.g., 30), and, hence, choosing larger time step size will not harm the accuracy of the solution. However, in the presence of nonlinear phenomena, i.e., very strong shockwaves and non-Newtonian viscosity, an implicit scheme linearising the governing equations will exhibit a restraint on C max . This is due to a variation in time of the linearisation Jacobian from one iteration to the next. In the light of above a relatively small time step size, Δ t = 0.003 s is used in this study.
Both Equations (6a) and (7) are valid in the case of constant viscosity. However, inserting a non-Newtonian viscosity will increase the nonlinearity of the system of equations. In order to account for the non-Newtonian behaviour of the fluid and reduce the nonlinearity of the system, one possibility is to replace the generalised apparent kinematic viscosity, Equation (6a), by the constant kinematic viscosity derived from Equation (5) [46]. The kinematic viscosity, however, is a function of Δ u , which makes the viscous term nonlinear. According to Taylor’s series of expansion, the viscous terms become:
ν D Δ u D Δ u = ν D Δ u old D Δ u old + d ν D Δ u D Δ u d Δ u Δ u old Δ u Δ u old + O Δ u Δ u old 2
in which D Δ u = 1 2 Δ u + Δ u , and
d ν D Δ u D Δ u d Δ u Δ u old = ν D Δ u old 1 2 I + I + d ν D Δ u d Δ u Δ u old D Δ u old .
Inserting Equation (13) into Equation (12) and neglecting the higher order term O Δ u Δ u old 2 will result in the Newton type iteration. Neglecting the second term on the right-hand side of Equation (13), the viscous term becomes linearised and fixed-point iterations will be achieved as follows:
ν D Δ u D Δ u ν D Δ u old D Δ u .
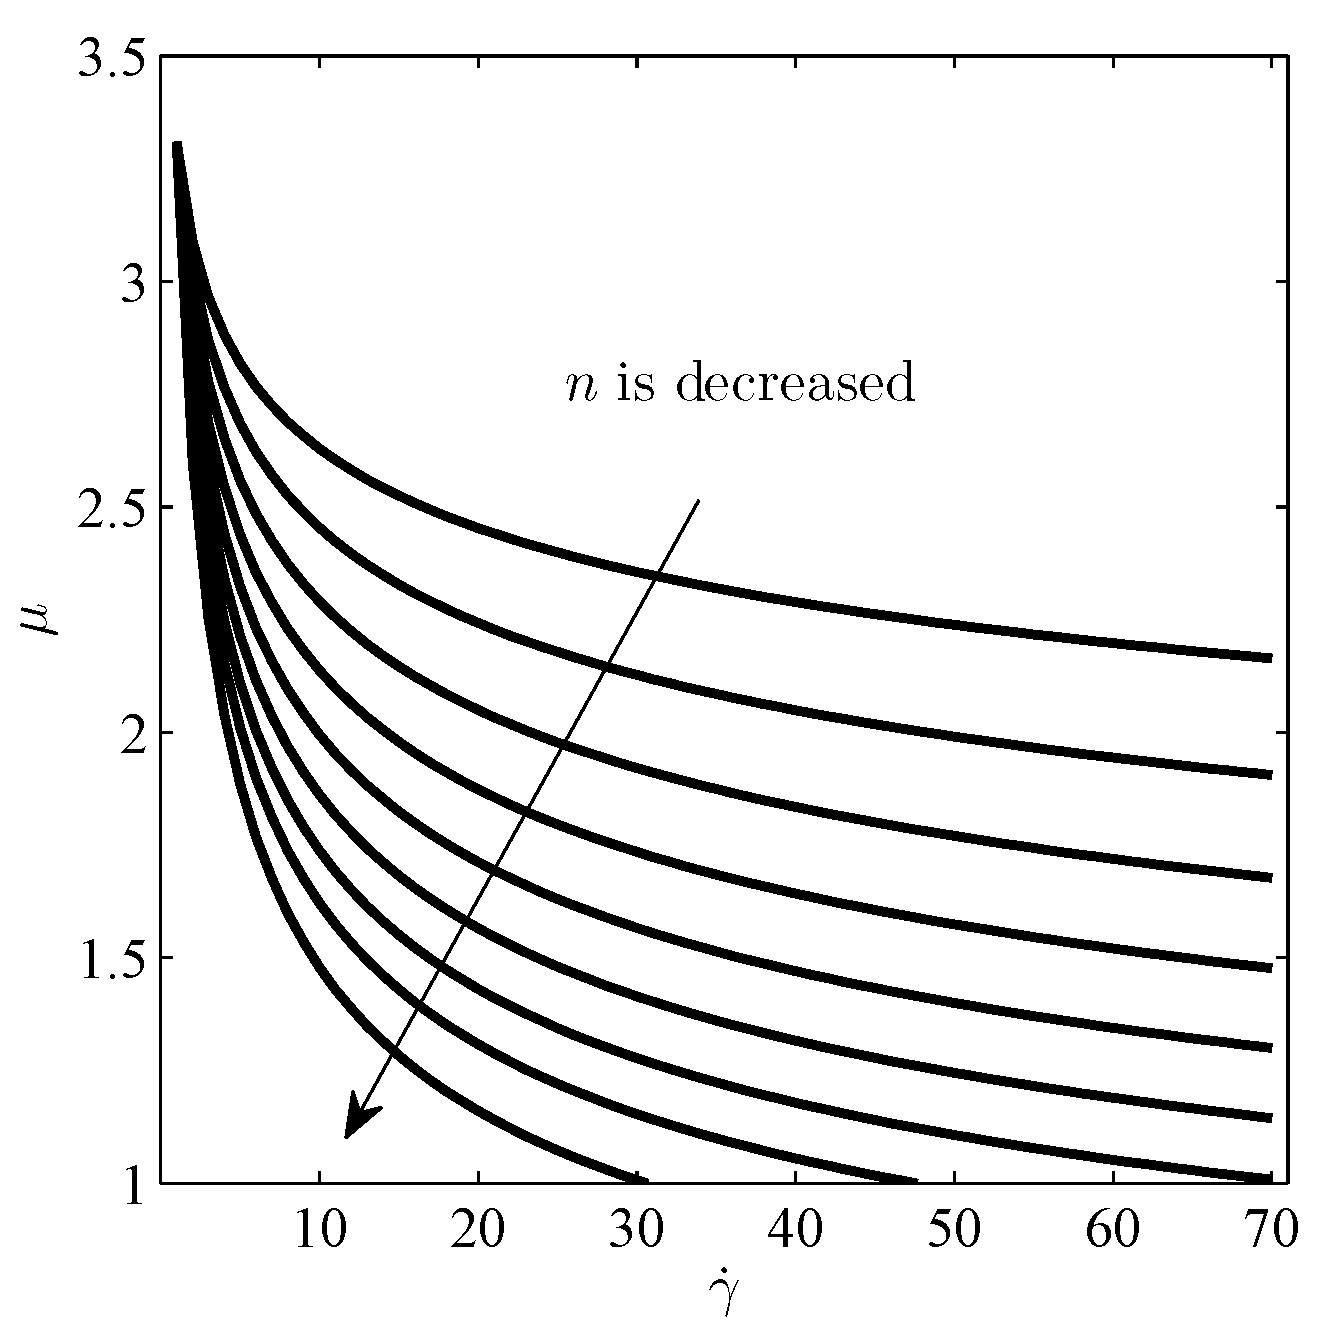
The rheological parameters (k and n) of the fluid are those previously studied by Jabbari and Hattel [31], as a common shear-thinning non-Newtonian fluid used in producing thin substrates for fuel cells and magnetic refrigeration applications. Results from the rheology experiment conducted by Jabbari et al. [30] showed that the La 0.85 Sr 0.15 MnO 3 (LSM) ceramic slurry follows the Ostwald–de Waele power-law behaviour with k = 3.31 and n = 0.9 . In the present study, while keeping k constant, the n parameter is chosen to have different values of 0.9 and 0.5 to investigate the influence of greater deviations from Newtonian fluids (shown in Figure 3).

3. Results and Discussion

We first present a fairly extensive set of results for a Newtonian fluid (applying n = 1 in Equation (5)) in a cubical cavity, for which much is available in the existing literature [7,11,17,47,48]. This provides thorough validation of the new code. Then, we conduct similar studies for a generalised shear-thinning case with different aspect ratios as well as the R e numbers.

3.1. Code Validation for Newtonian Fluid

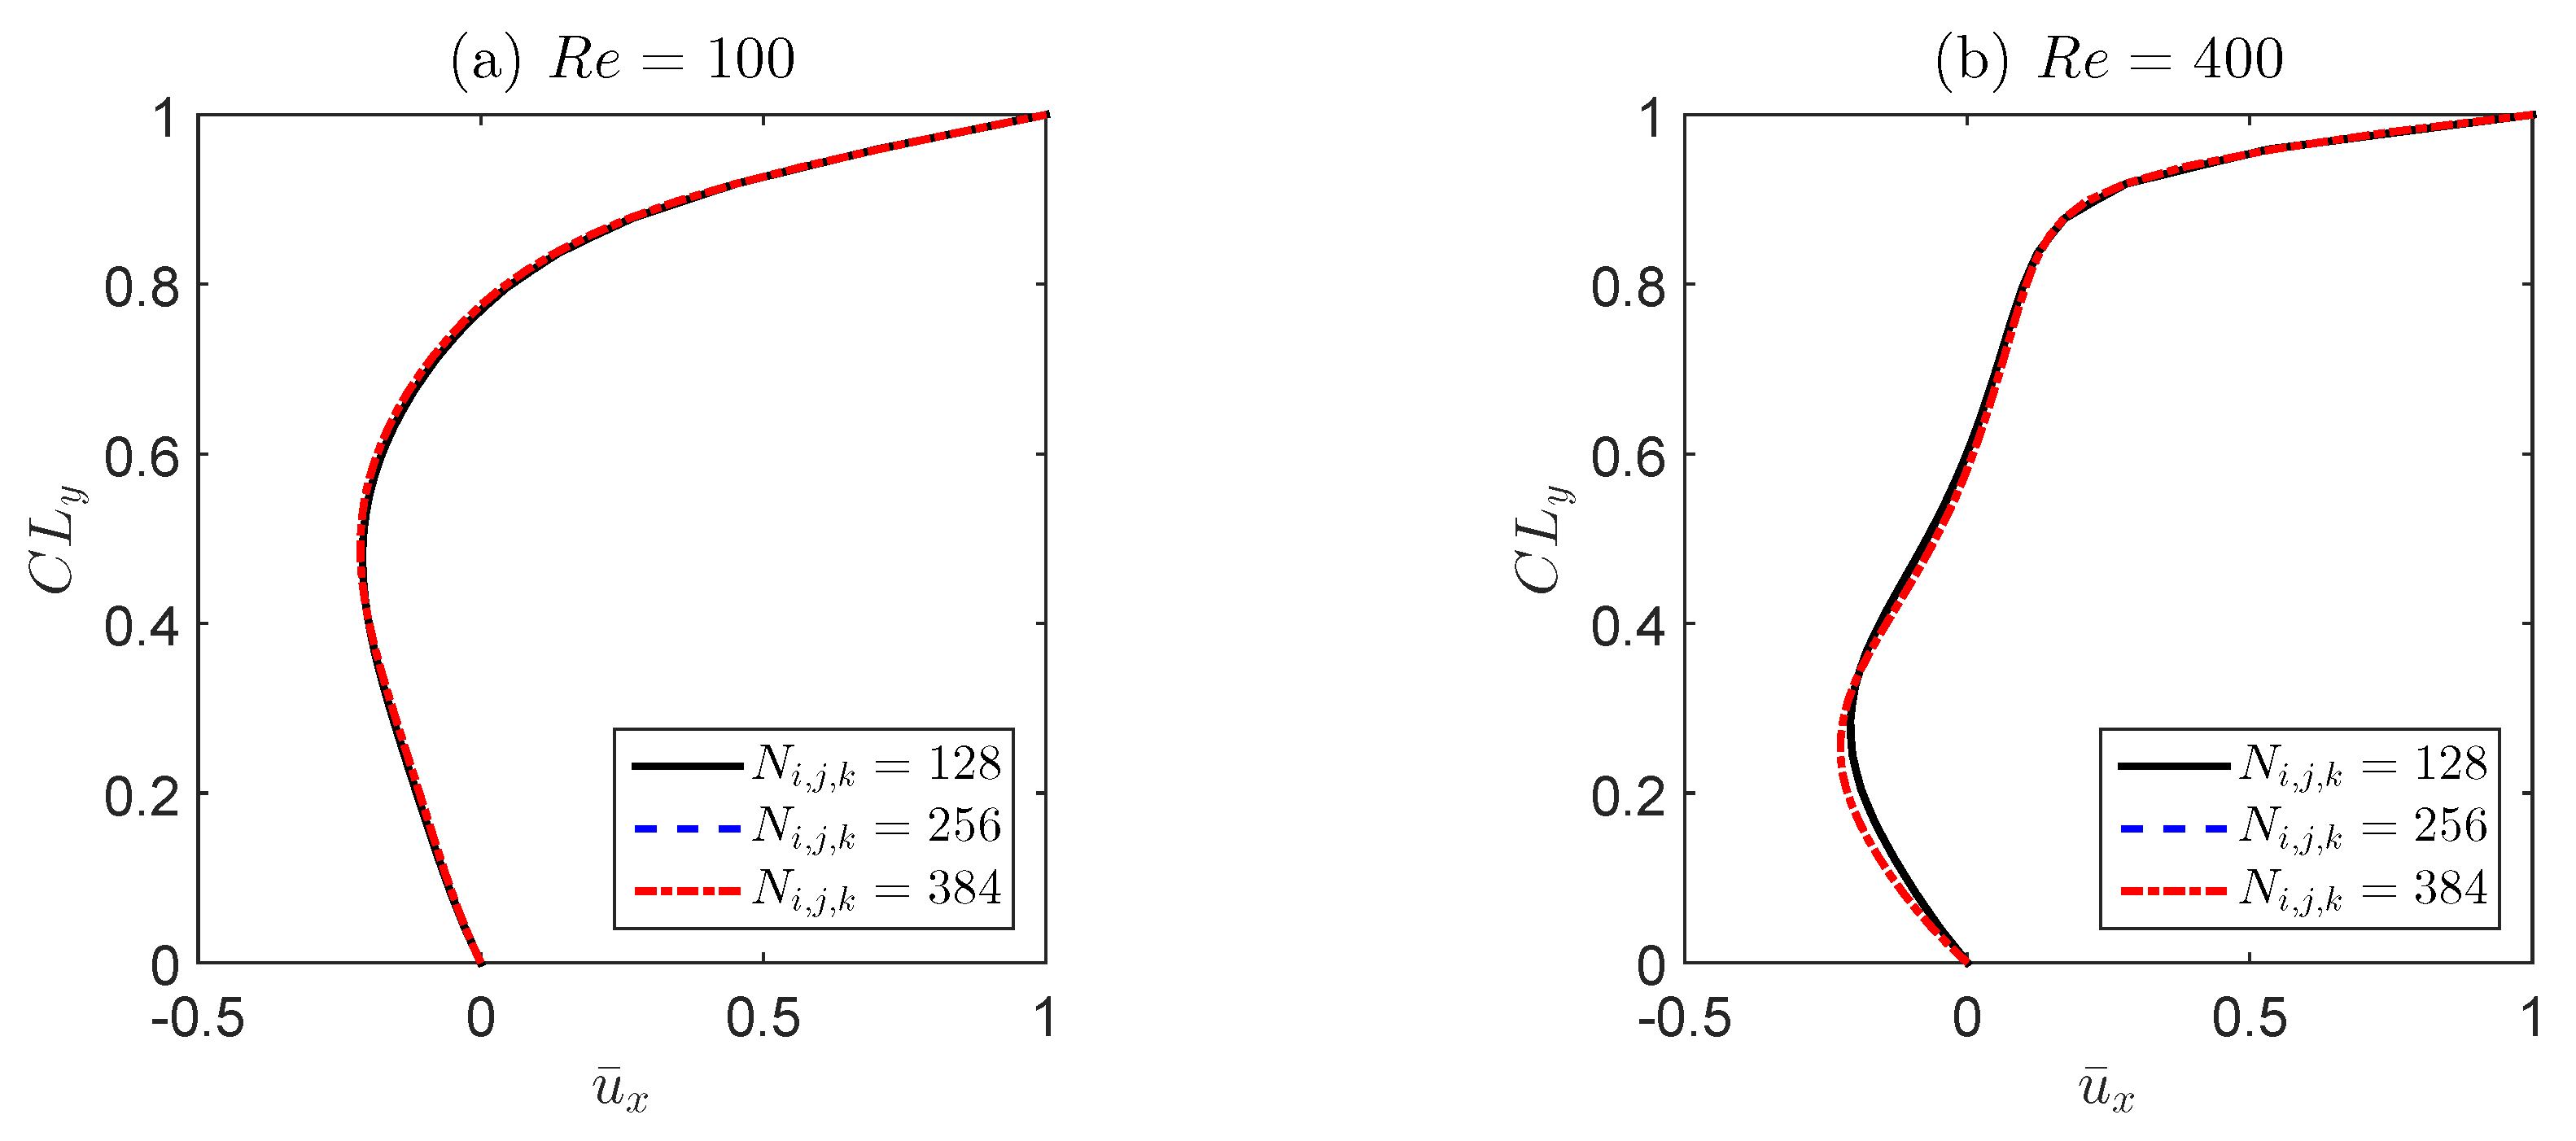
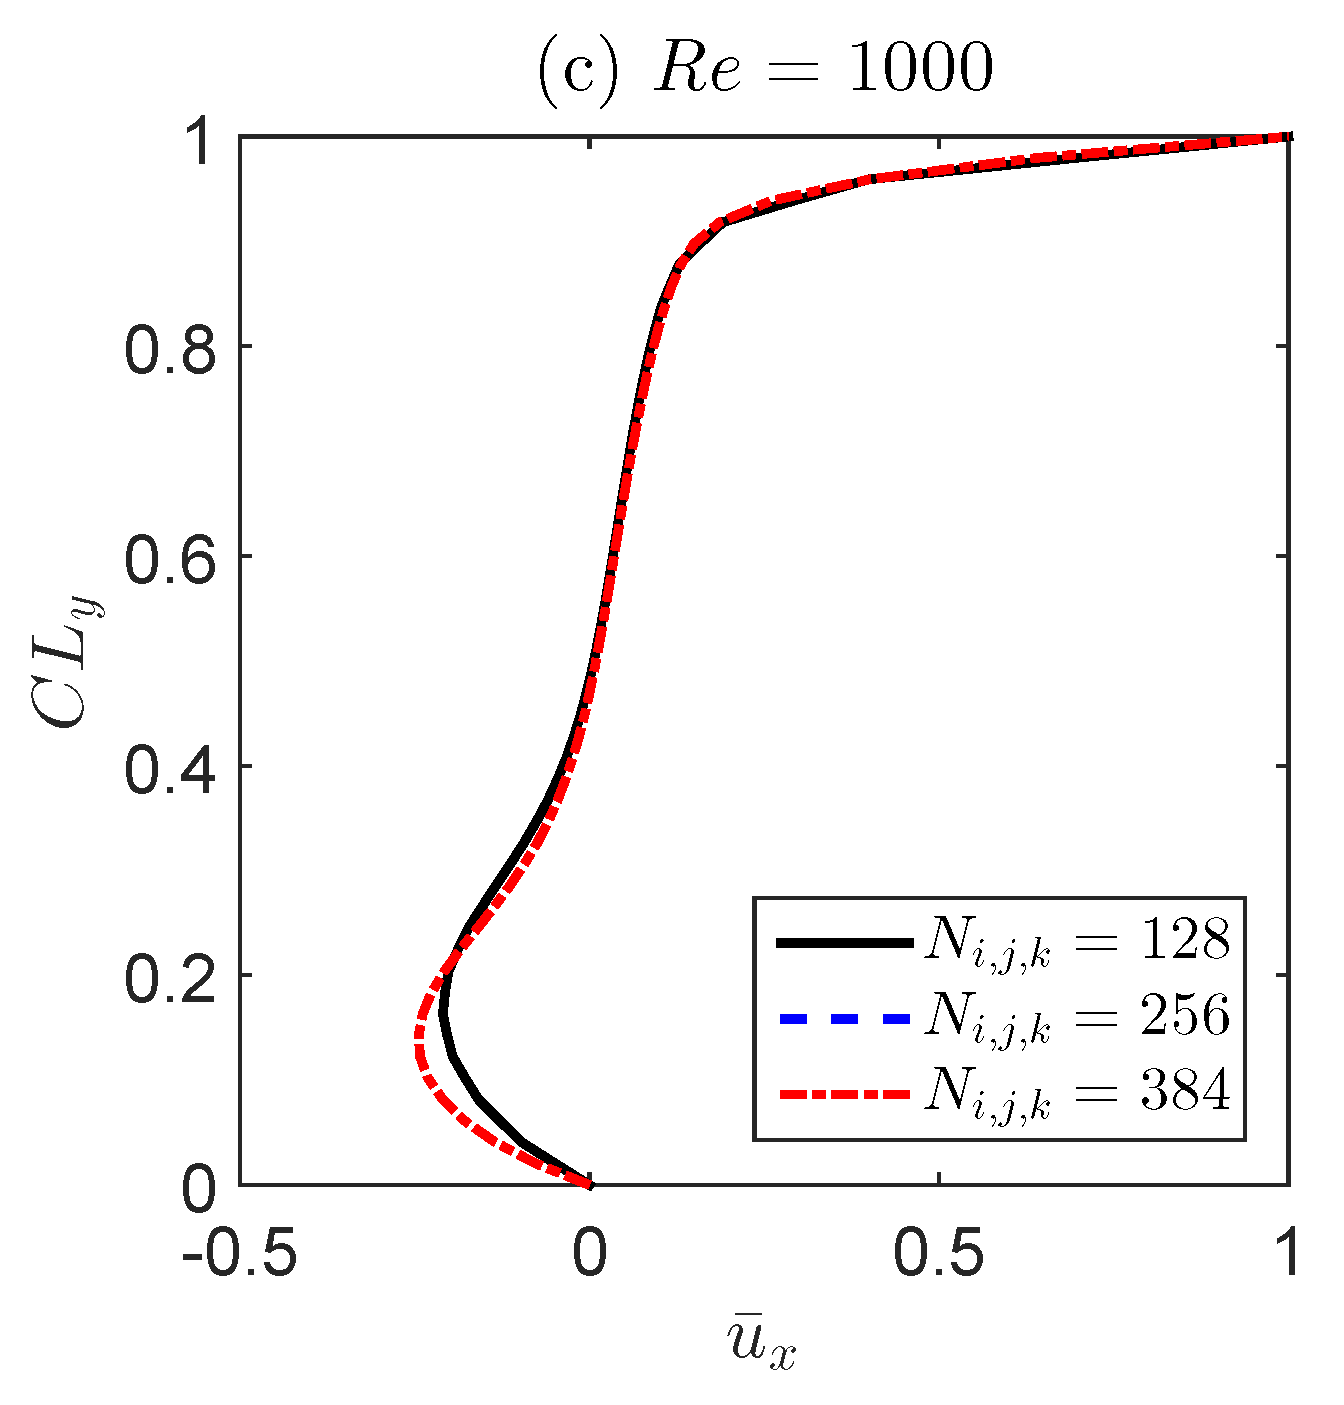
Prior to proceeding with validation in the context of shear-thinning fluids, it is essential to ensure grid independence of the computations for a simpler Newtonian fluid. The aim is to achieve a maximum change of no more than 1% for a certain variable from one grid level to a more refined one. For this purpose, three different uniform grids with the same number of divisions N x = N y = N z in each coordinate direction were used: namely, 128 3 , 256 3 , and 384 3 grids.
Results are shown in Figure 4 for the normalised x-velocity component u ¯ = u / U l i d along the vertical centreline for a Newtonian fluid. Selecting as a criterion the value of u ¯ m i n , it can be seen that grid independence is achieved with the 256 3 grid (refining further to 384 3 showed a change of less than 1%), and, therefore, based on this grid refinement study, this grid is used for all later computations.
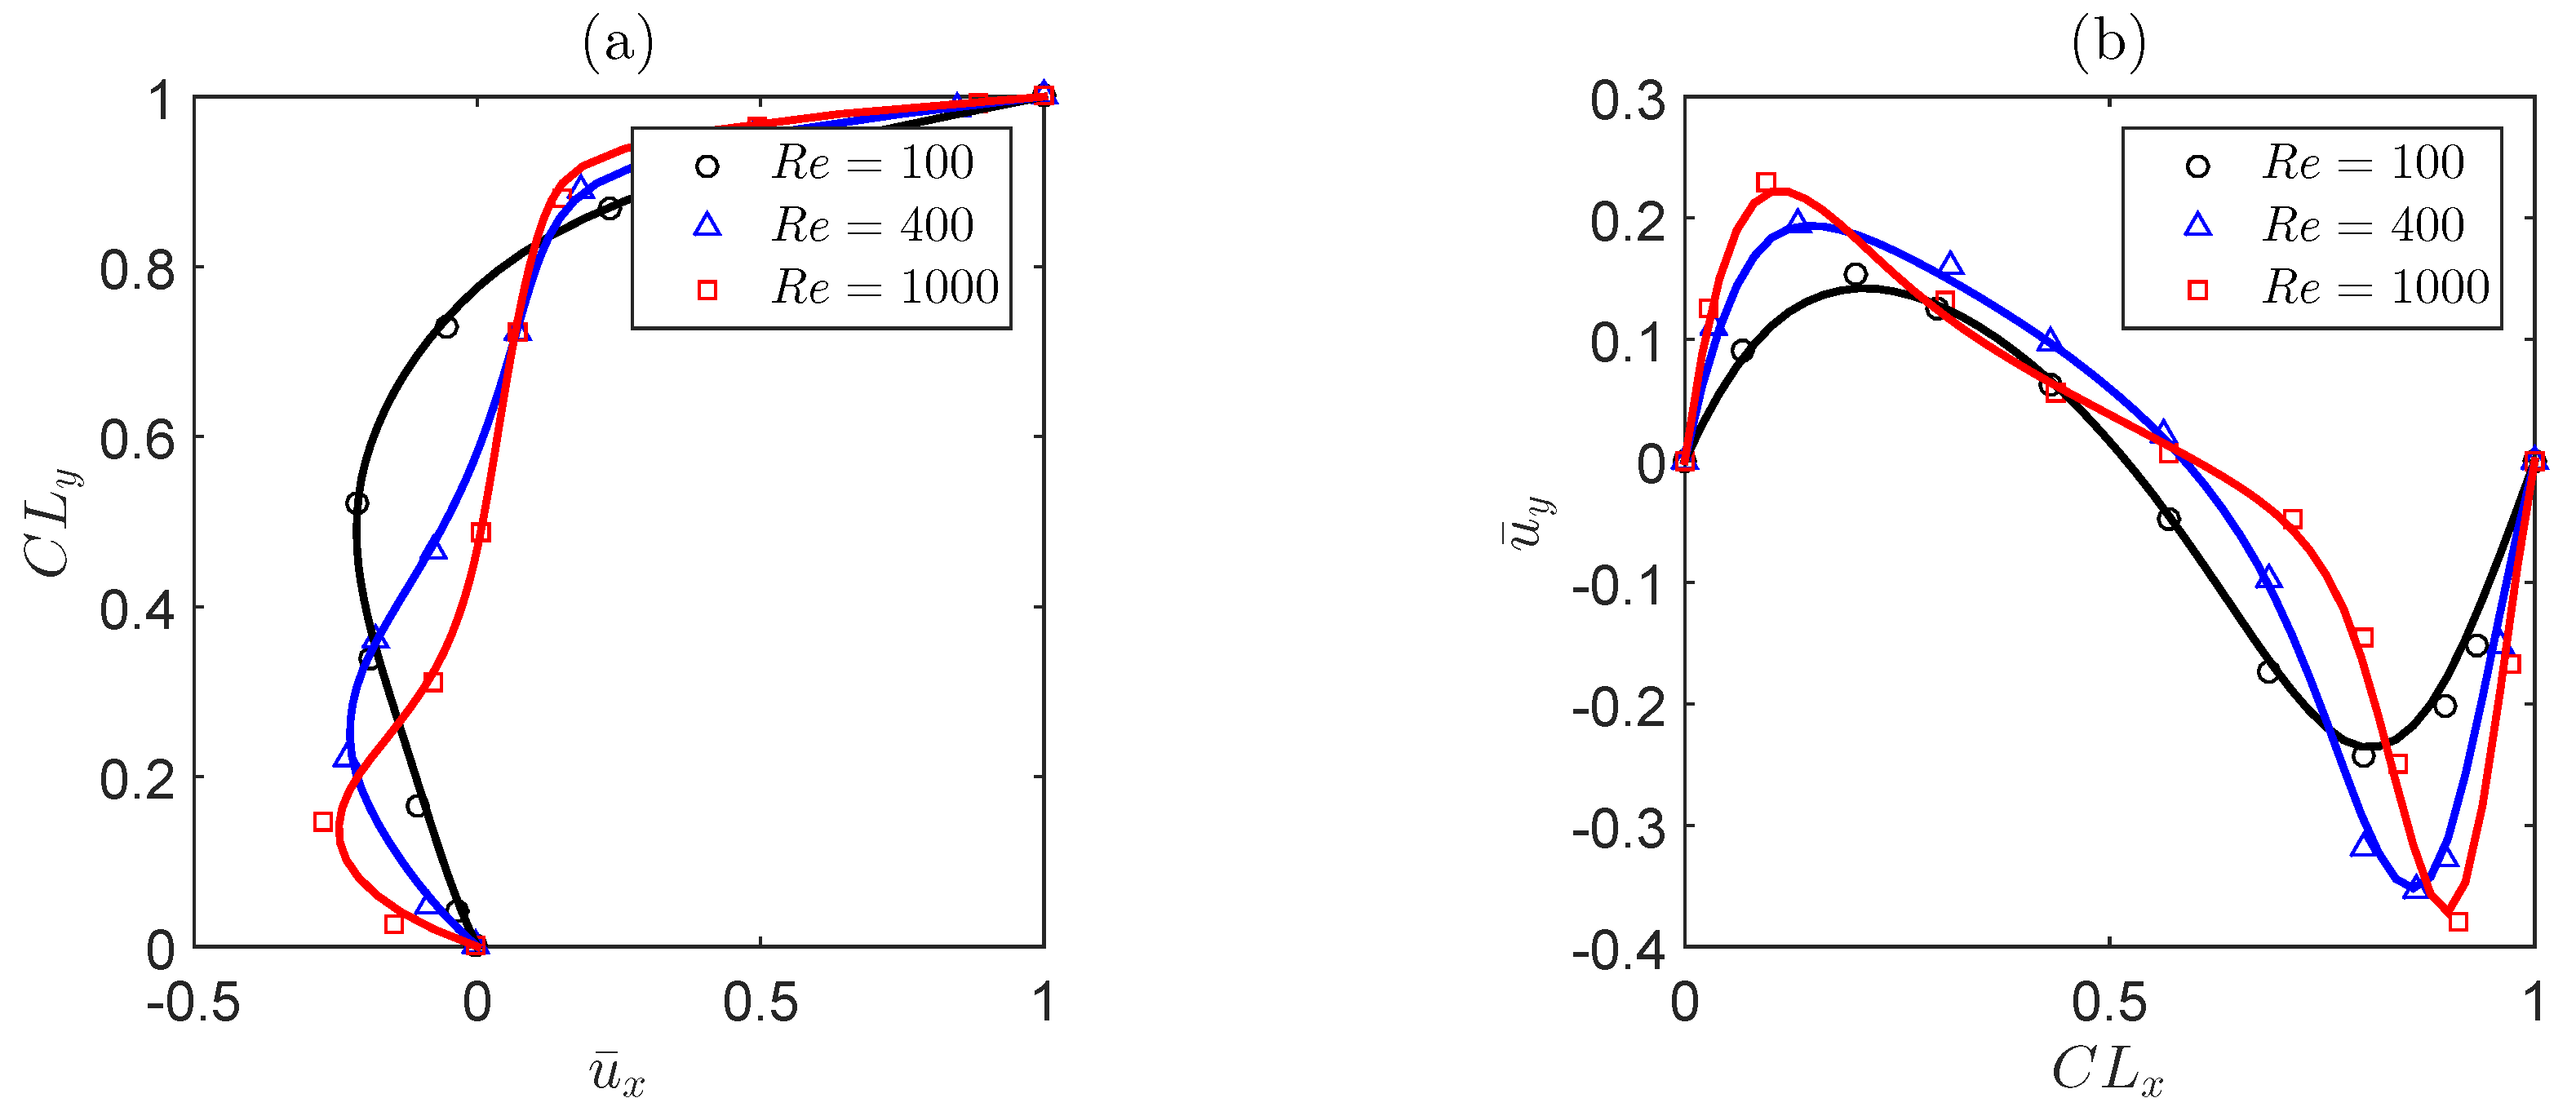
To further validate the developed code, we present a comparison of velocity profiles obtained from the present simulations with the Navier–Stokes solutions published in the literature by Albensoeder and Kuhlmann [47]. These cases correspond to flow in a lid-driven cubical cavity ( δ = 1 ) at different Reynolds numbers. Shown in Figure 5 are the normalised x- and y-components of velocity profiles along the vertical ( C L y ) and horizontal ( C L x ) centreline planes, respectively, in Ω (see Figure 1). Solid lines represent results obtained from the present simulations, whereas the discrete points denote the 3-D pseudo-spectral solution of Navier–Stokes equations in [47]. It is seen that the comparison is excellent at all Reynolds numbers considered here.

3.2. Shear-Thinning Fluid

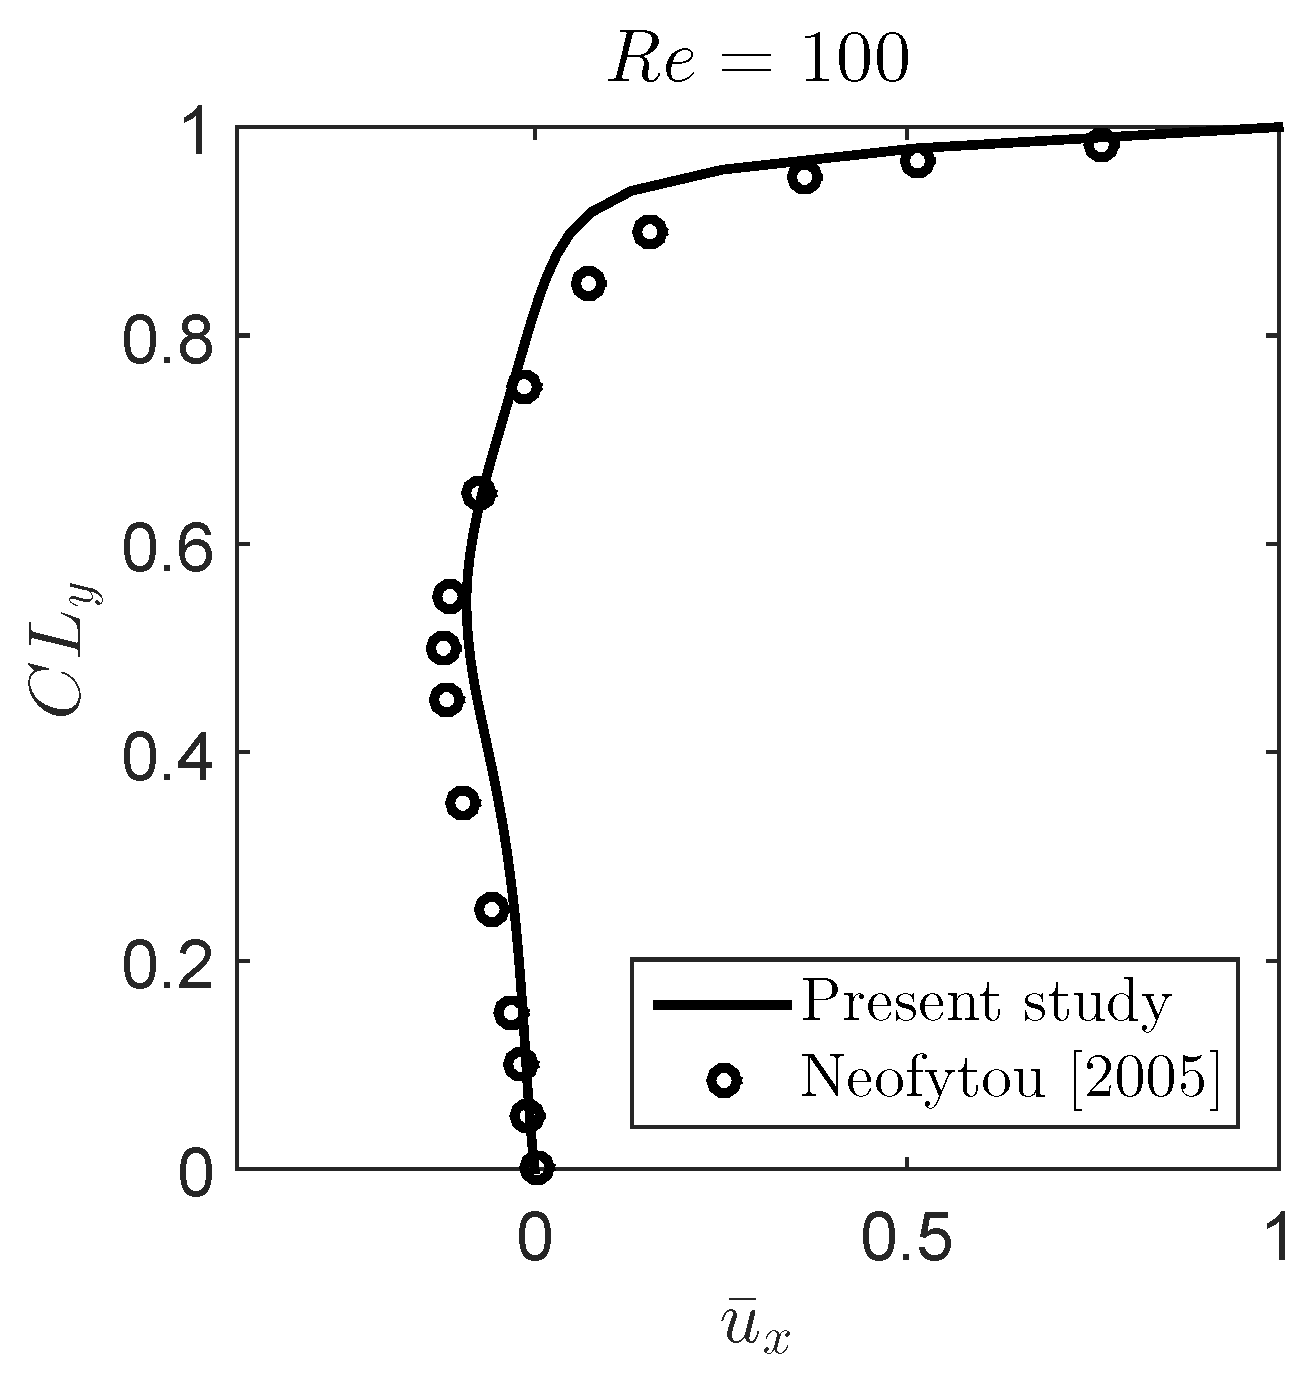
Results of simulation for generalised Newtonian power-law behaviour in the LDC are presented here for three different Reynolds numbers ( R e = 100 , 400 , 1000 ). For the power-law fluid, the R e is calculated by R e = ρ L n / k · U l i d n 2 . The shear rate of the flow is updated in every time step through the generalised kinematic viscosity. In order to validate the present code for generalised Newtonian power-law behaviour, we have compared the results for δ = 1 and n = 0.5 at R e = 100 with those published by Neofytou [48]. Figure 6 depicts the normalised x-components of velocity profiles in the vertical ( C L y ) centreline plane, showing a fairly good agreement. Apparent discrepancies are due to the fact that the referenced work was a 2-D calculation. The critical values for Reynolds number, R e c r , for the transition from steady to periodic flow (a Hopf bifurcation), and for different values of k and n (shear-thinning parameters) are shown in Figure 7. It is seen that, for the current study, k = 3.31 , for all n-values, the critical Reynolds number is above 1000.
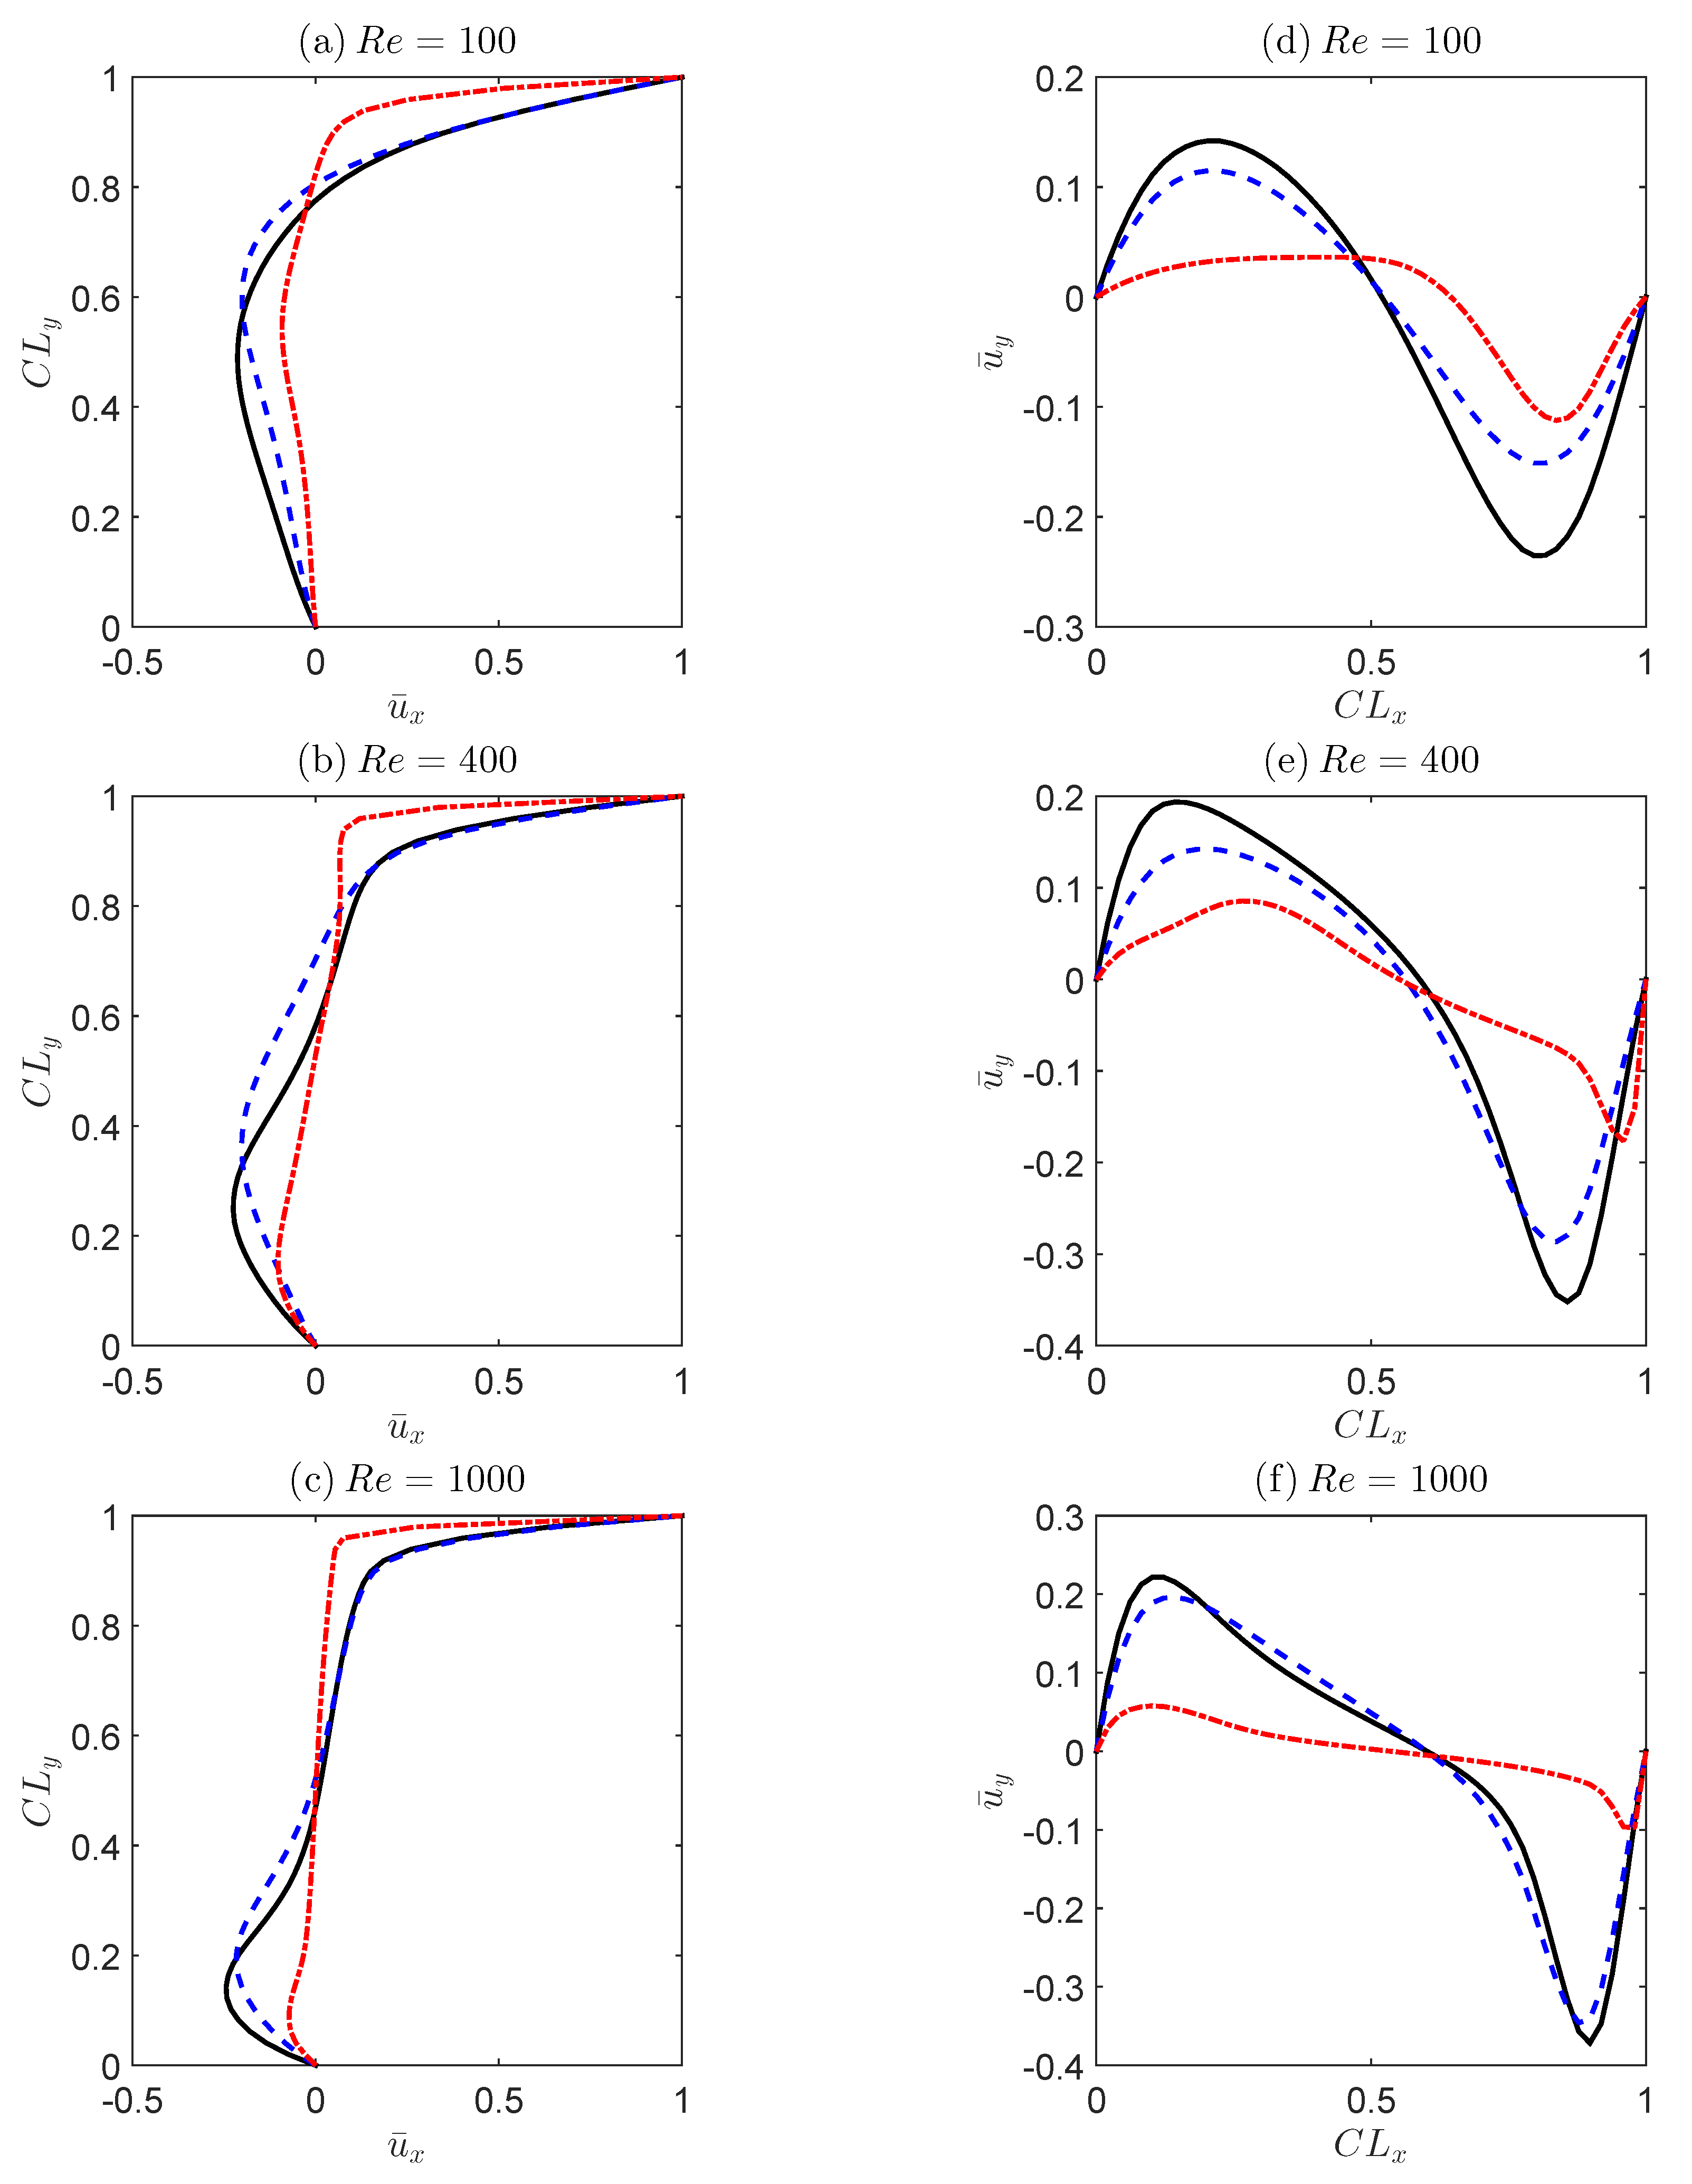
Results for δ = 1 together with three different n values (see Equation (5)) for the shear-thinning parameter are illustrated in Figure 8. It should be noted that the more n is decreased the greater the deviation from Newtonian behaviour. The results show that for all cases increasing R e causes higher gradients in addition to increasing peak values for u and v; this can be attributed to the gradual reduction of viscous effects that occurs with increasing R e .
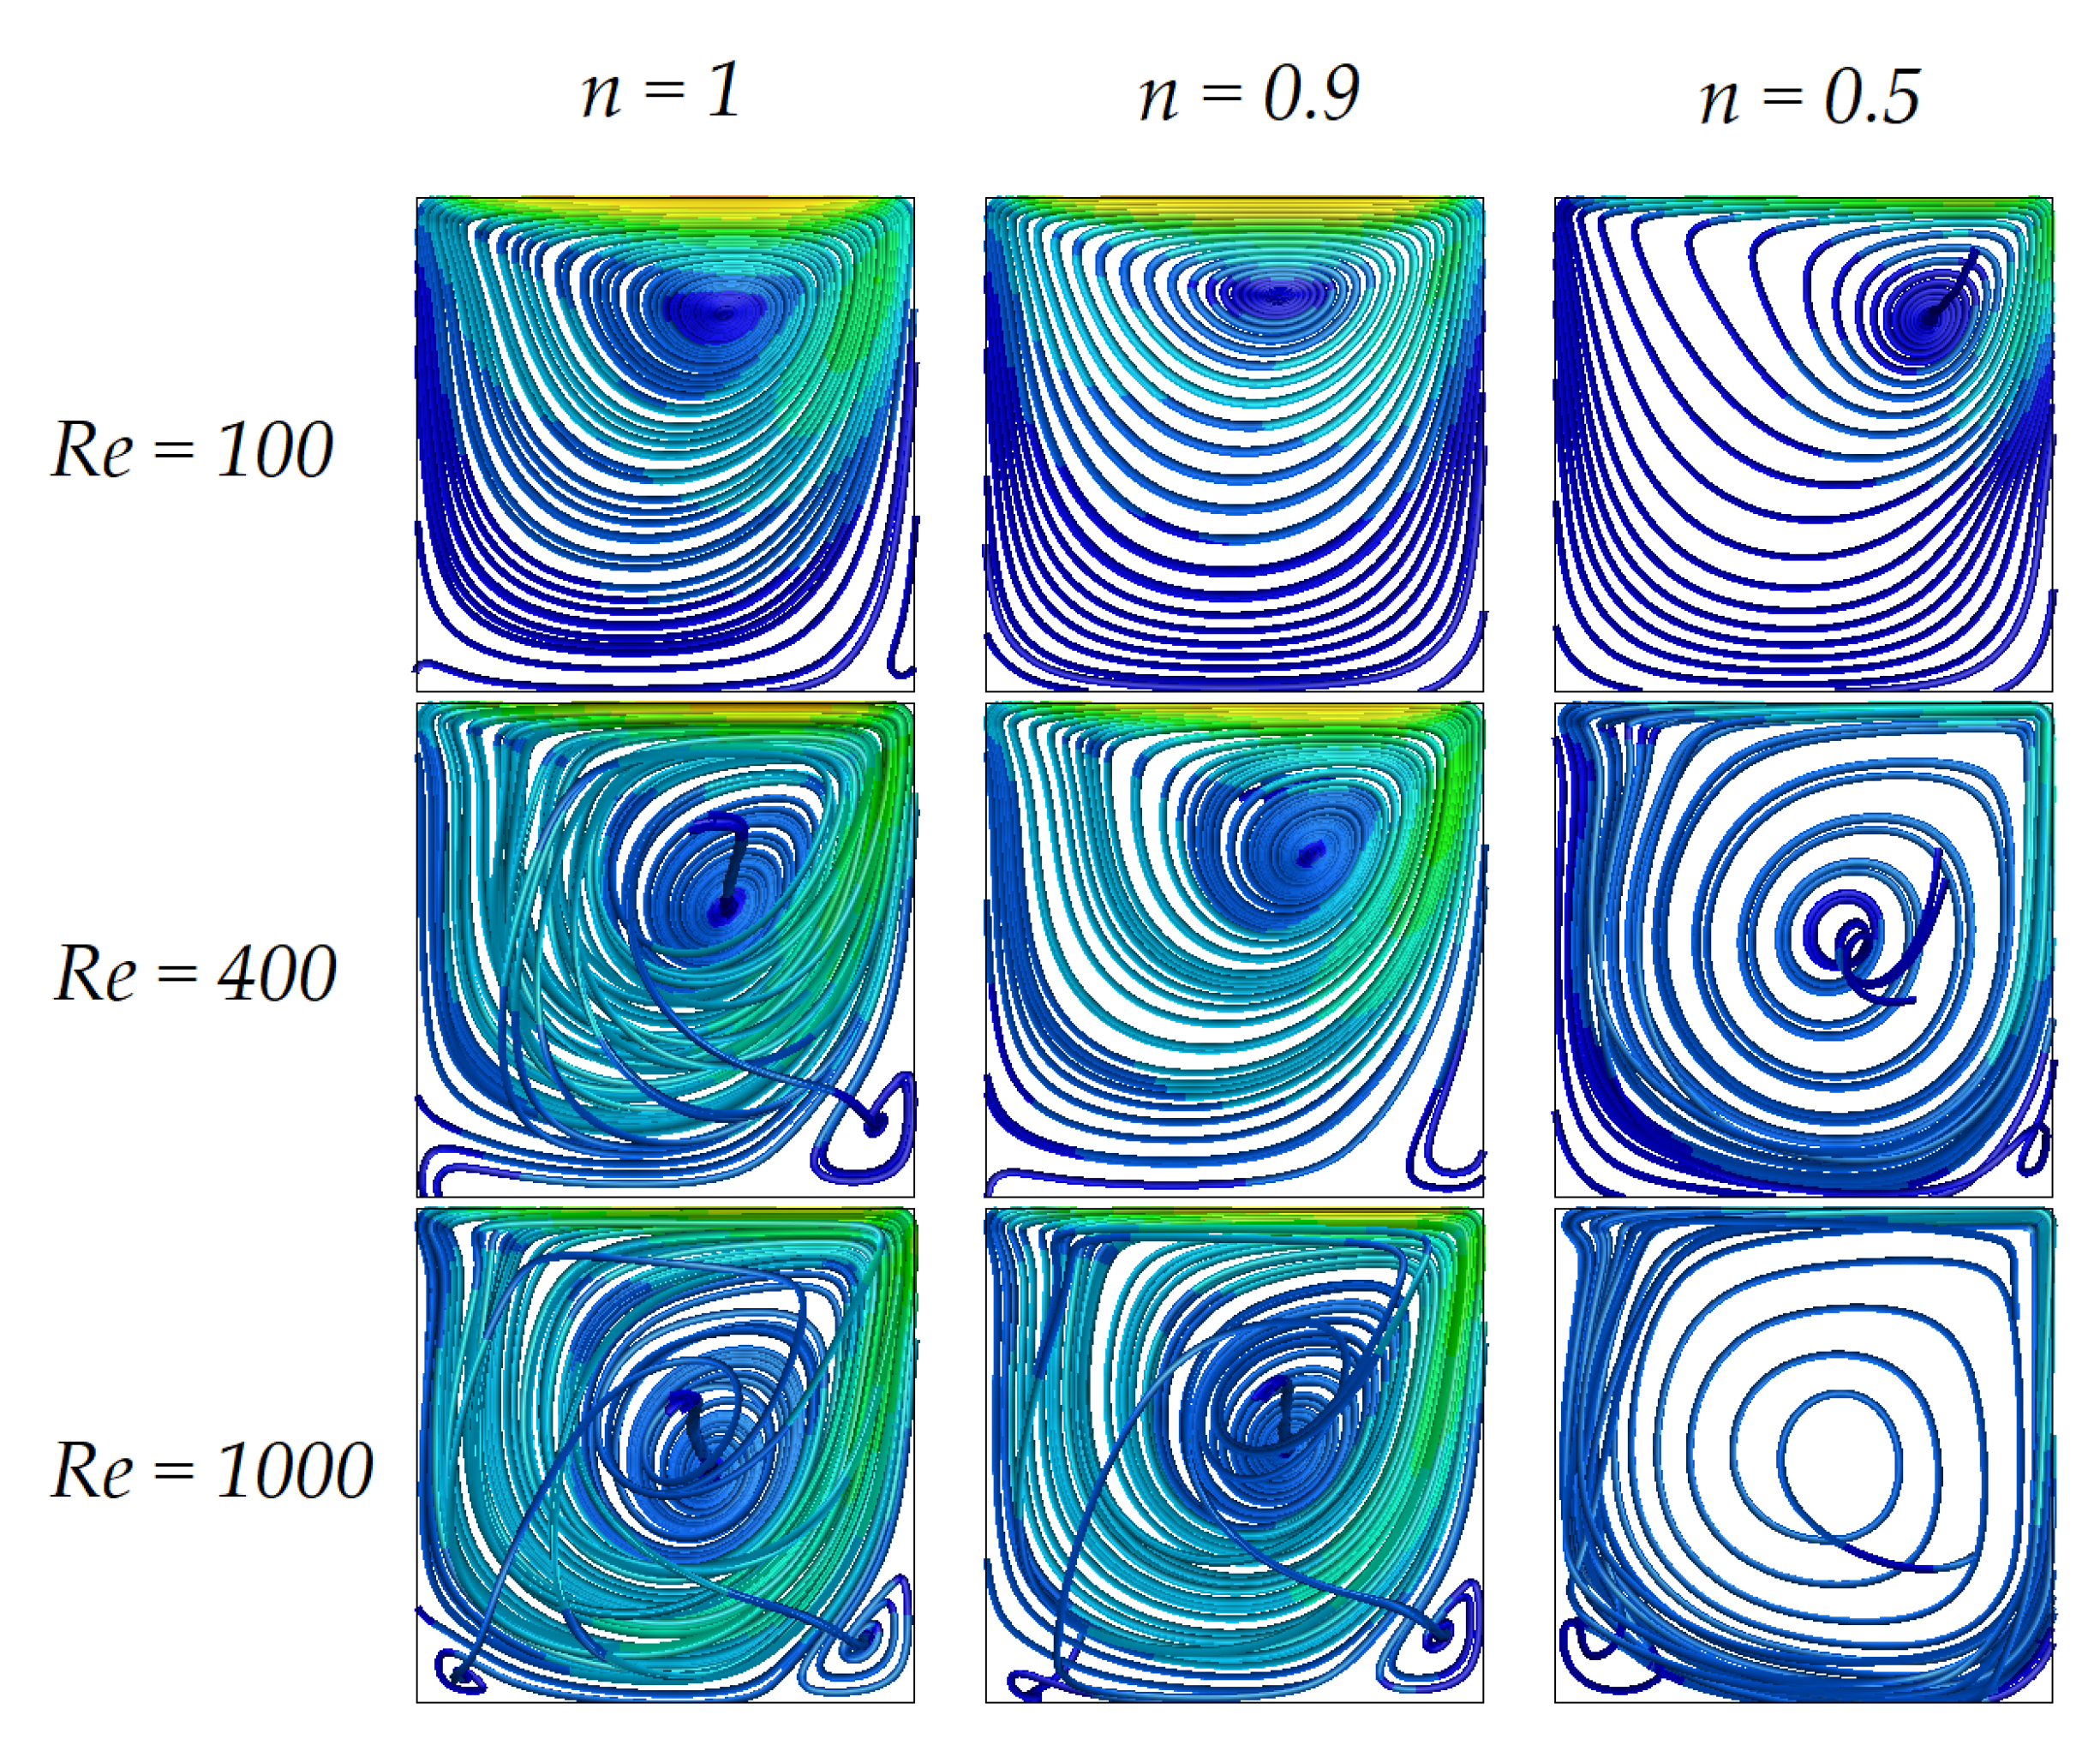
The corresponding streamlines coloured by the velocity magnitude inside the cavity for the three different Reynolds numbers as well as three different n values are illustrated in Figure 9. At low Reynolds number, the top row, the region occupied by the primary vortex is relatively small due to the highly diffusive transport of vorticity, and considerable thickness of the boundary layers near the walls. On the other hand, at high Reynolds numbers, the middle and bottom rows, the primary vortex grows in size and occupies most of the central region of the cavity cross-section; the boundary layer is seen to be limited to very thin regions near the walls, as should be expected. In these cases, the vorticity transport is dominated by advection created due to motion of the top lid. The plot of streamlines revealed that a pair of small secondary vortices appear near the bottom corners of the cavity.
As R e is increased, the centre of the primary vortex ( x v o r , y v o r ) shifts towards the downstream wall, and simultaneously it moves down towards the bottom wall of the cavity (as seen in [47]). In 2-D simulations, the centre of the primary vortex has been observed to shift towards the downstream side of the cavity until the Reynolds number increases to about 100, but there onwards it asymptotically moves towards the geometric centre of the cavity [16] with further increase in the Reynolds number. It has been reported [14,16] that the results of 2-D and 3-D simulations agree very well for R e = 0.01 and R e = 100 . However, for R e = 400 and R e = 1000 , the predicted locations ( x v o r , y v o r ) from 2-D and 3-D flow models are significantly different [14,16]. We believe this difference is due to enhanced motion in the transverse direction. In particular, the entire flow field becomes unsteady at much lower R e in 3-D, and the vortex centre location, itself, does not remain in a fixed location. In particular, although results are still steady for R e = 1000 , they transition to periodic behaviour at slightly higher R e , suggesting very long transients at R e = 1000 . It is also noted that by increasing the shear-thinning effect, decreasing n, the regions with high velocity magnitudes become narrower (while shifting to the top surface), and hence showing boundary layer effect. Moreover, the secondary vortex tends to diminish with decreasing n at all three Reynolds numbers.
The effect on the corresponding displacement of the primary vortex core (physical point in a 3-D domain) is summarized in Table 1 which presents centre-plane xy coordinates. It can be seen that the centre of the main vortex shifts slightly towards the lid with decreasing R e in all cases, whereas, for shear-thinning fluids, the displacement is more marked. It is interesting to note that, by reducing the shear-thinning parameter, n, from 1 to 0.9, the main vortex moves towards the lid; however, by further decreasing n to 0.5, the main vortex shifts back to the centre of the cavity. This can be easily interpreted from the velocity profiles shown in Figure 8, where the velocity gradients show less variation along the C L y and C L x for n = 0.5 , especially for higher R e .
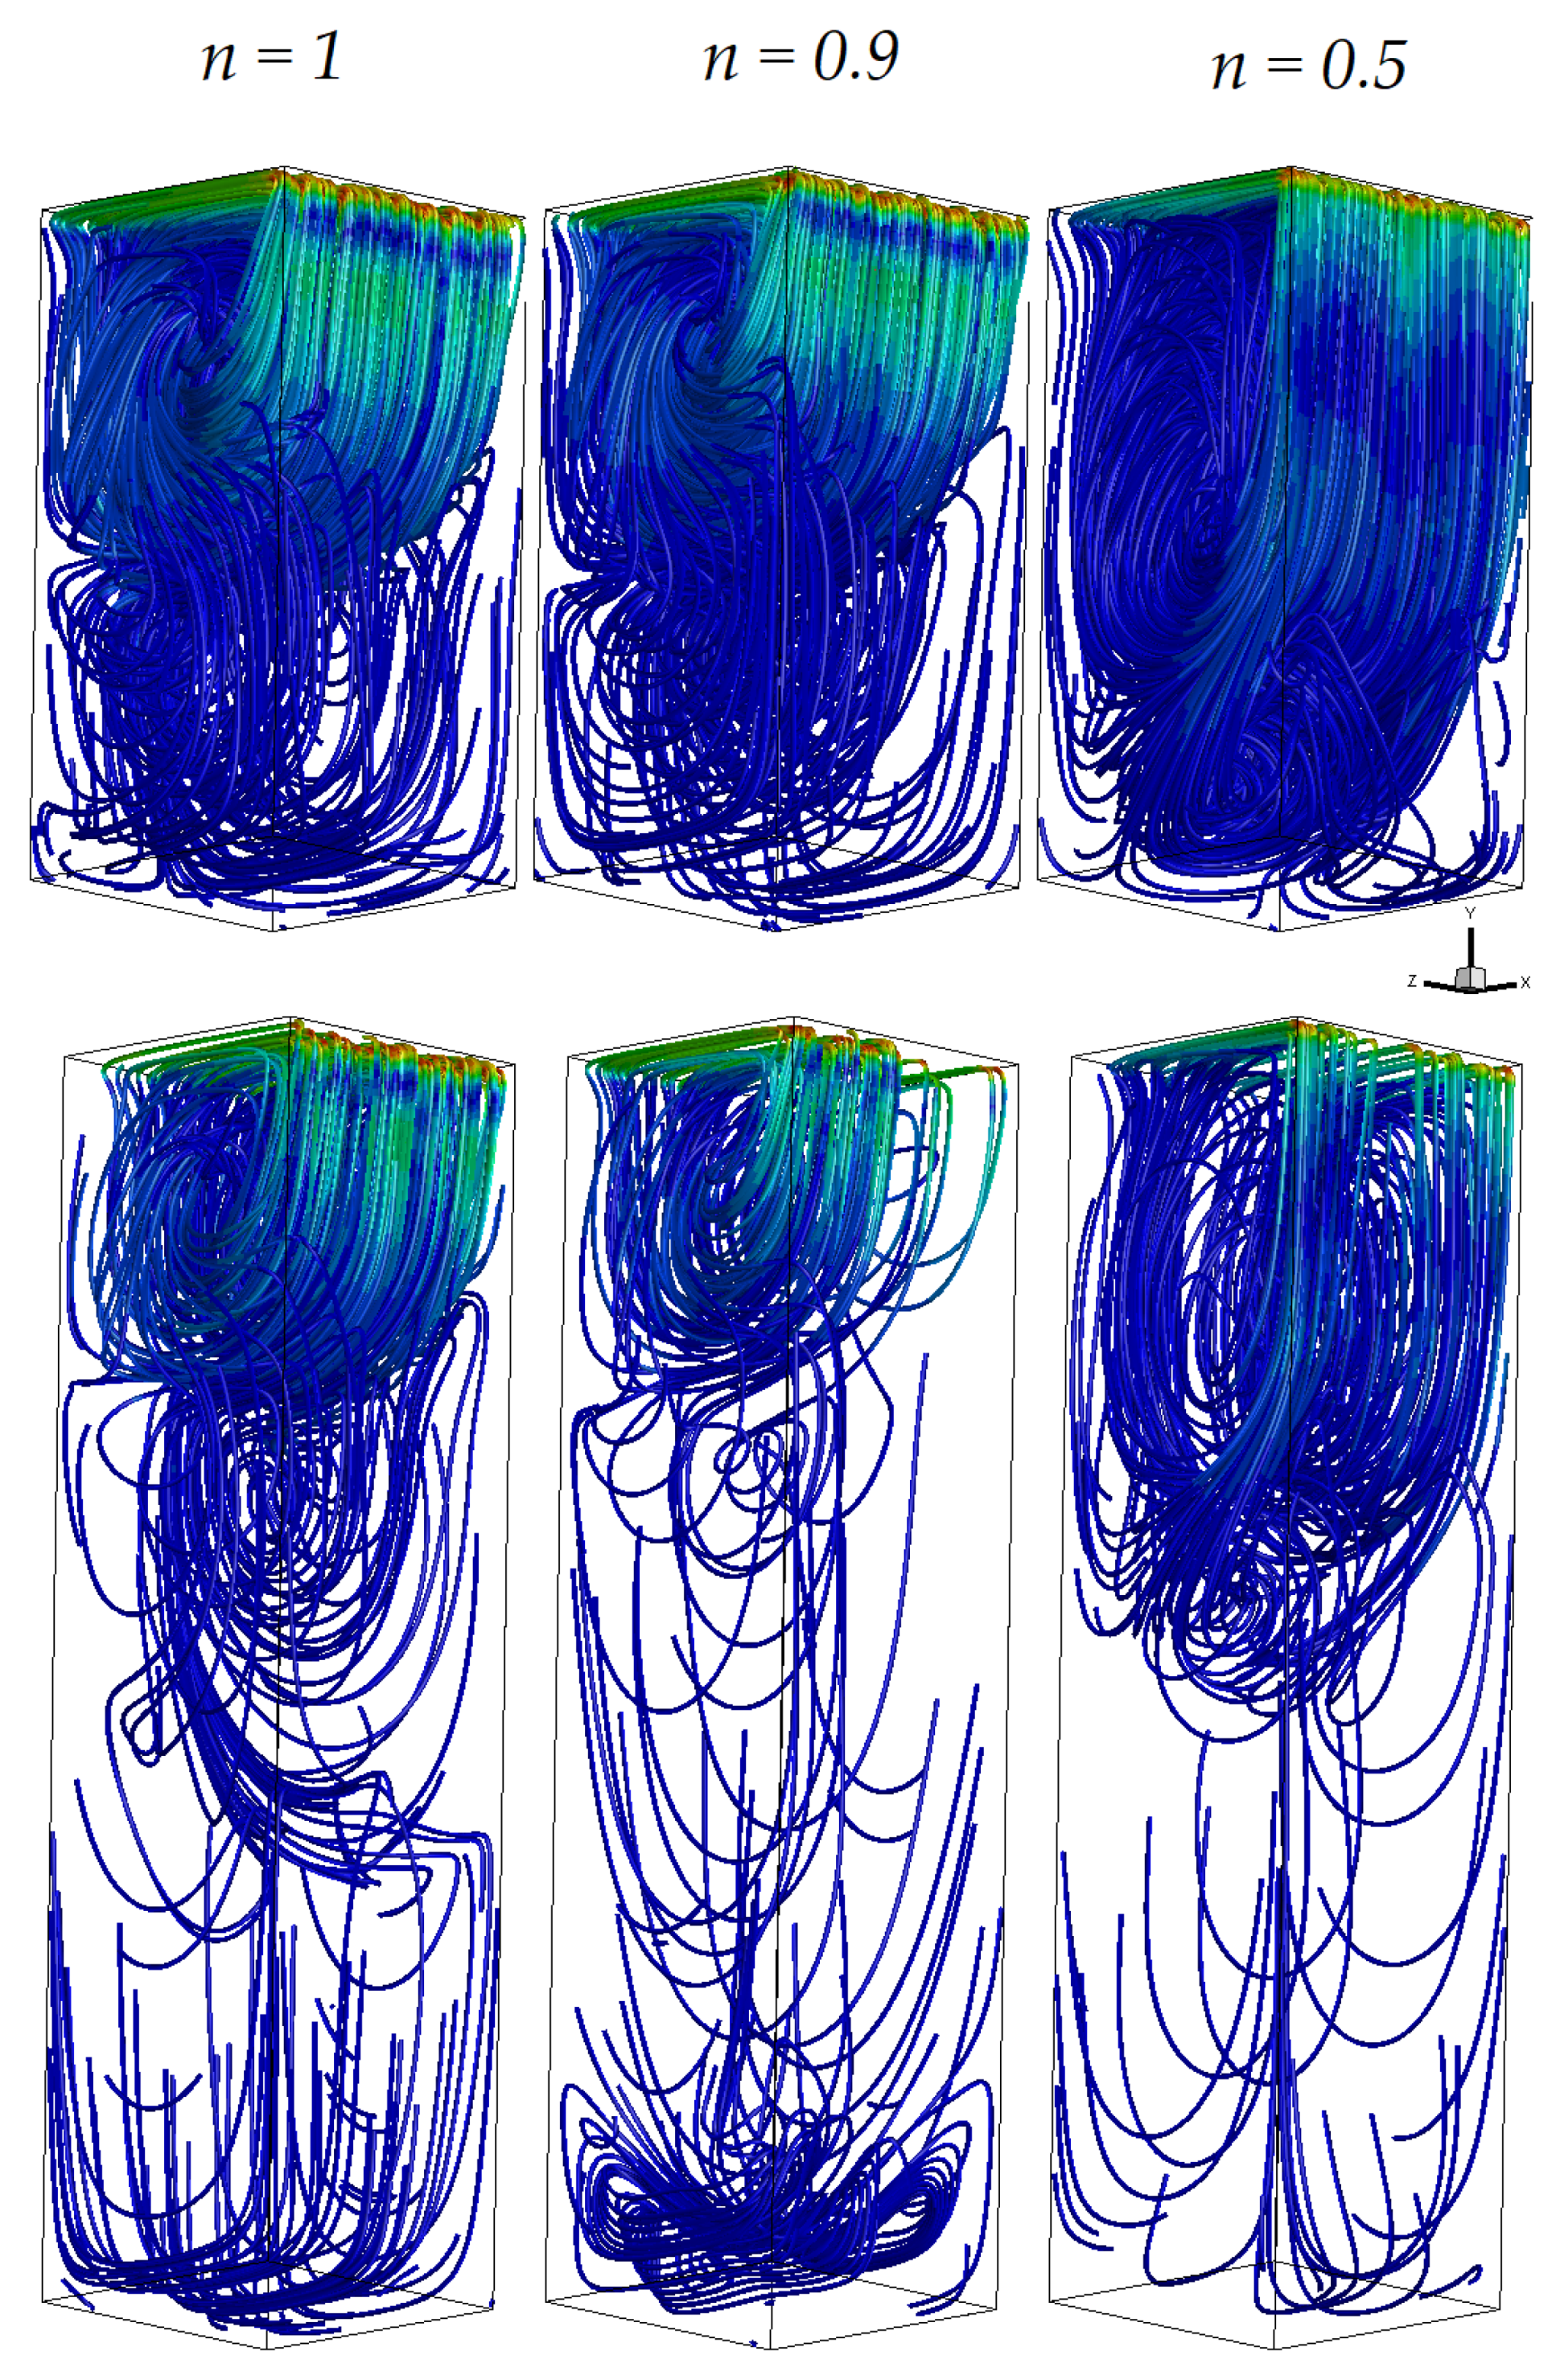
Results of simulations for deeper ( δ > 1 ) cavities are presented with a spanwise aspect ratio of λ = 1 . Figure 10 presents the velocity streamlines coloured by the vorticity magnitude for R e = 1000 with δ = 2 (top row) and δ = 4 (bottom row), as well as for different n values ( n = 1 , 0.9 , 0.5 ). It can be seen that for a Newtonian fluid (top-left) a deep cavity with δ = 2 possesses another main vortex in the bottom region, which has an opposite span-direction compared to the main-top-vortex. The phenomenon occurs for a Newtonian fluid with δ = 4 (bottom-left) leading to a third main vortex in the bottom region which has a different span-direction compared to the vortex above it, but the same as that of the main-top vortex.
For a shear-thinning fluid with a slight deviation from Newtonian (top-mid), n = 0.9 , the secondary main vortex (in the bottom region) has expanded somewhat resulting in smaller area being occupied by the main-top vortex. This is much more pronounced for the same fluid with a deeper cavity (bottom-mid), δ = 4 , where the secondary main vortex has grown and diffused to the third main-vortex region. It is interesting to see that, for a fluid with even lower n (top-left), the main-top- vortex occupies most of the cavity volume. This phenomenon is due to more shear-thinning effects of the fluid with lower n close to the top surface.
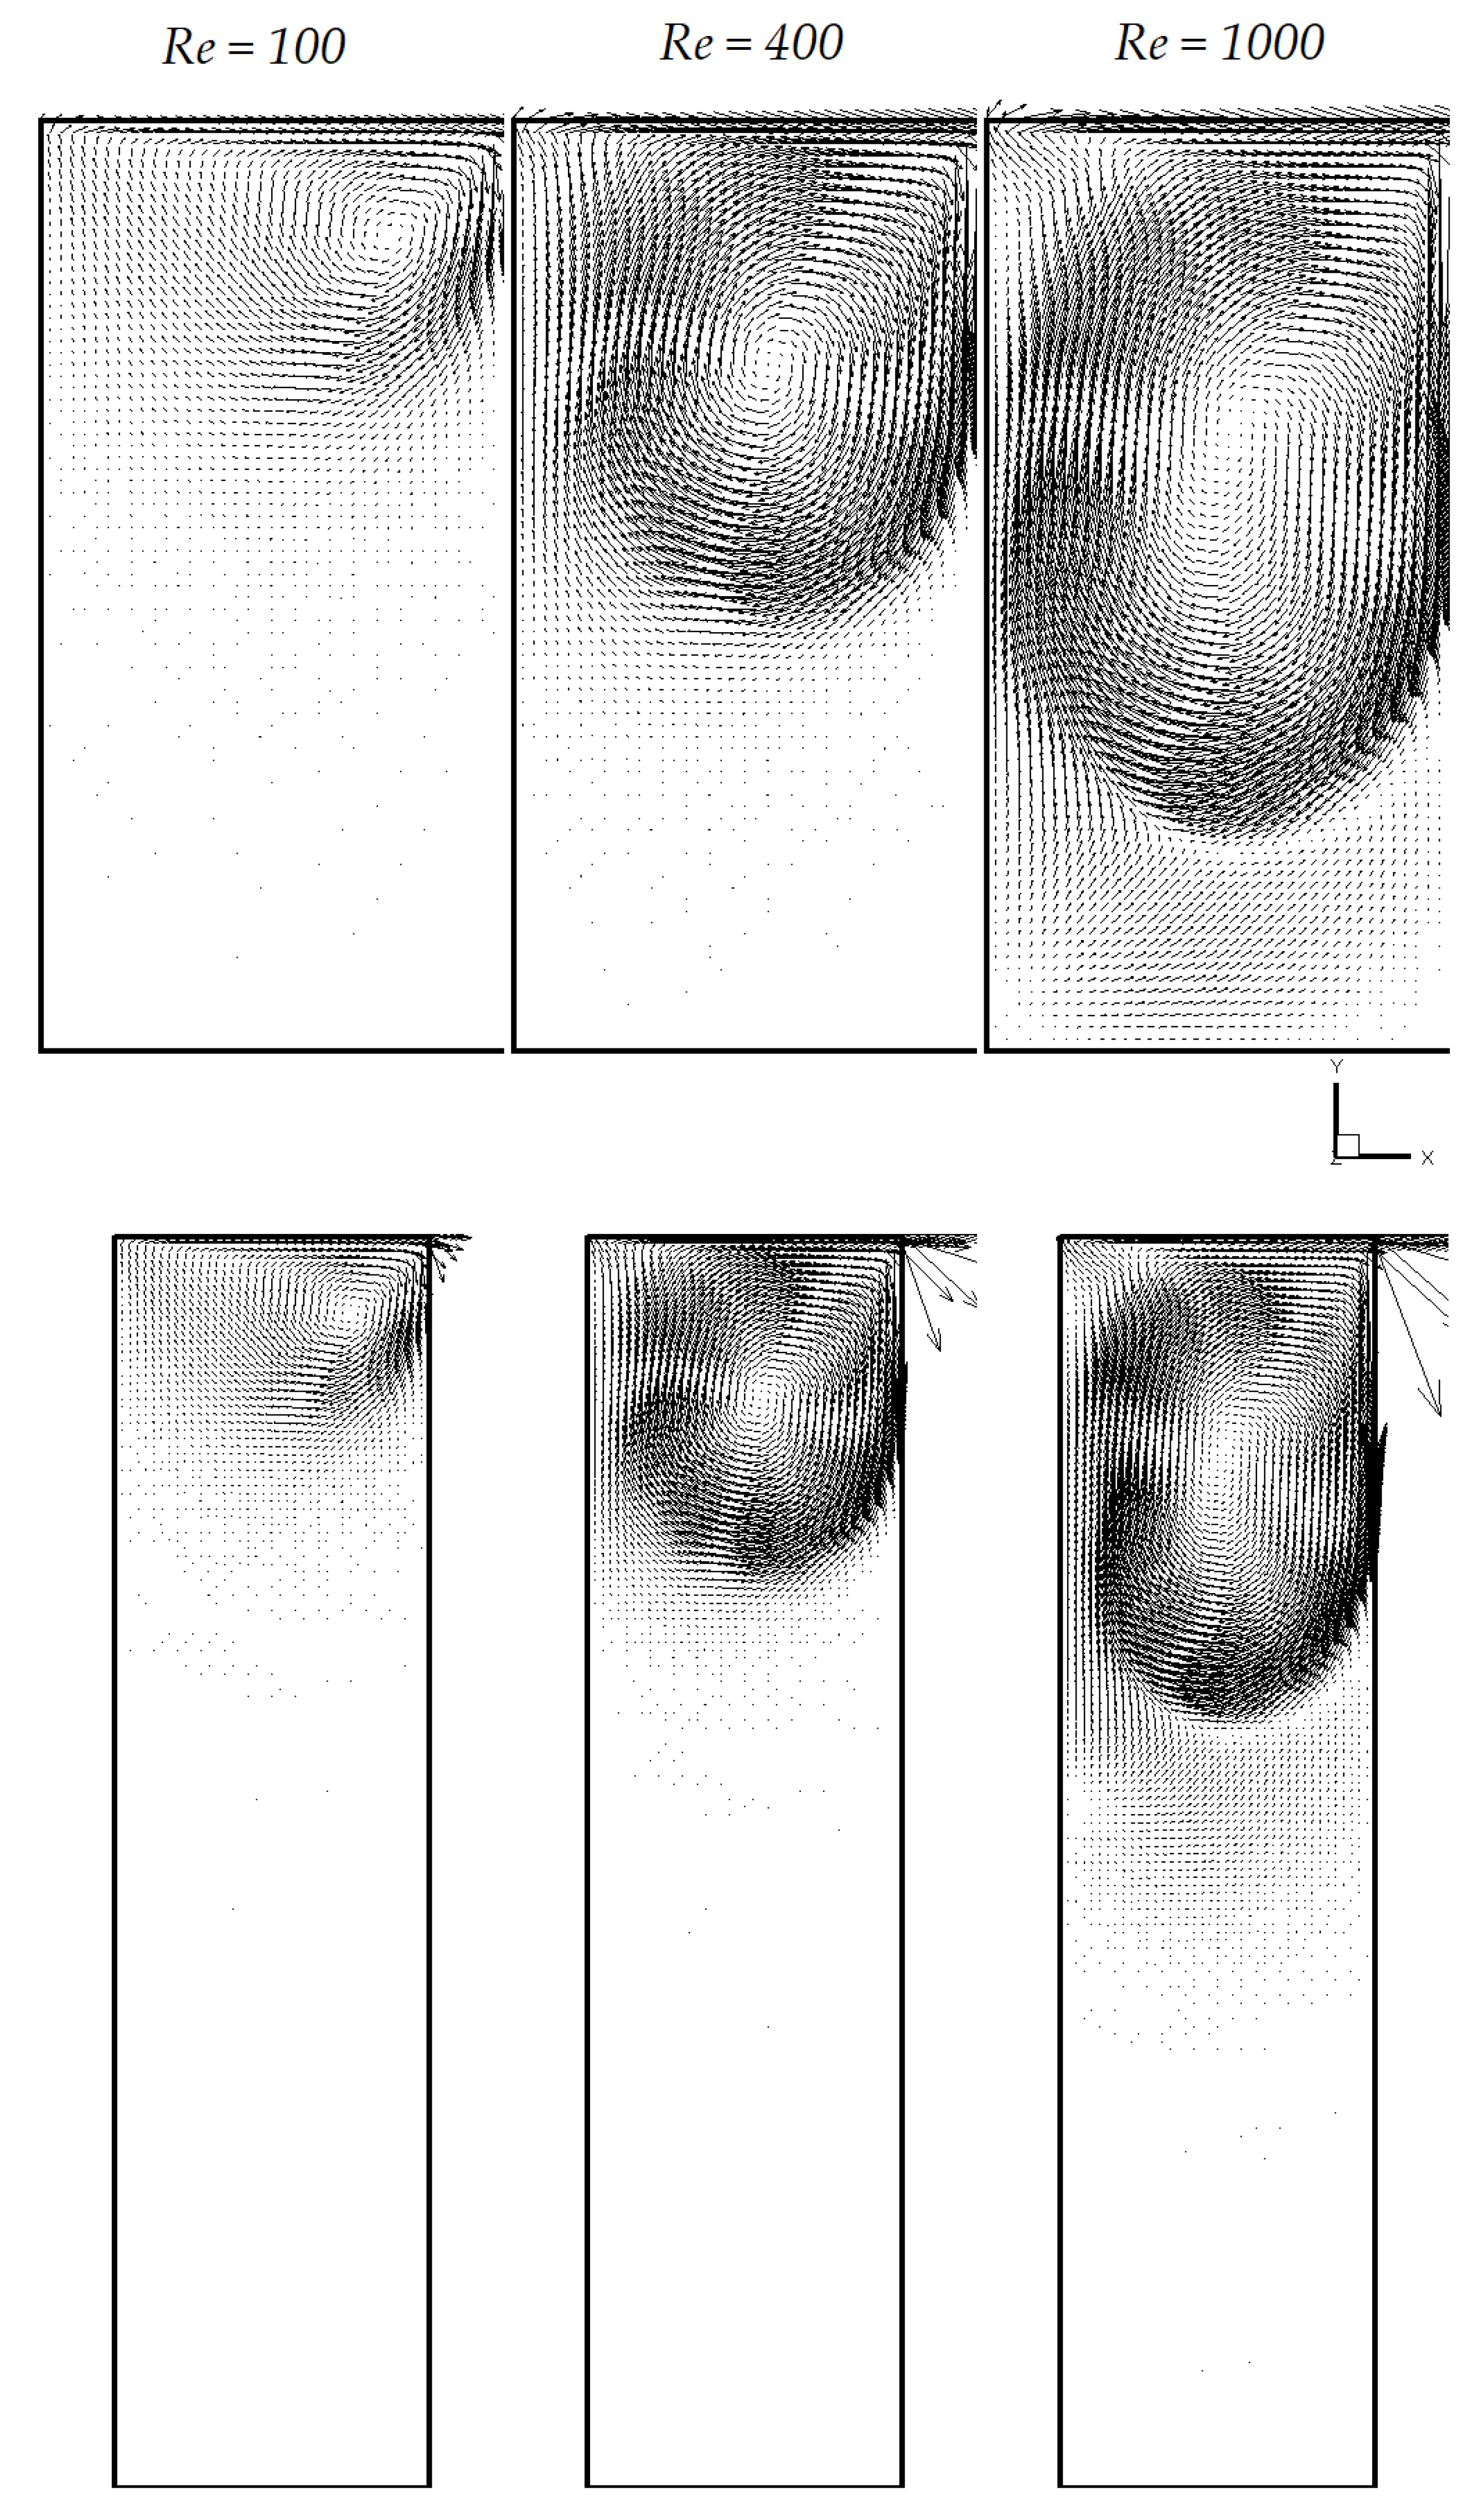
Impact of R e on the main-top vortex for deeper ( δ = 2 , 4 ) cavities with n = 0.5 are illustrated in Figure 11. As it can be seen, by increasing the R e (from left to right column), the main-top vortex expands towards the bottom surface of the cavity.
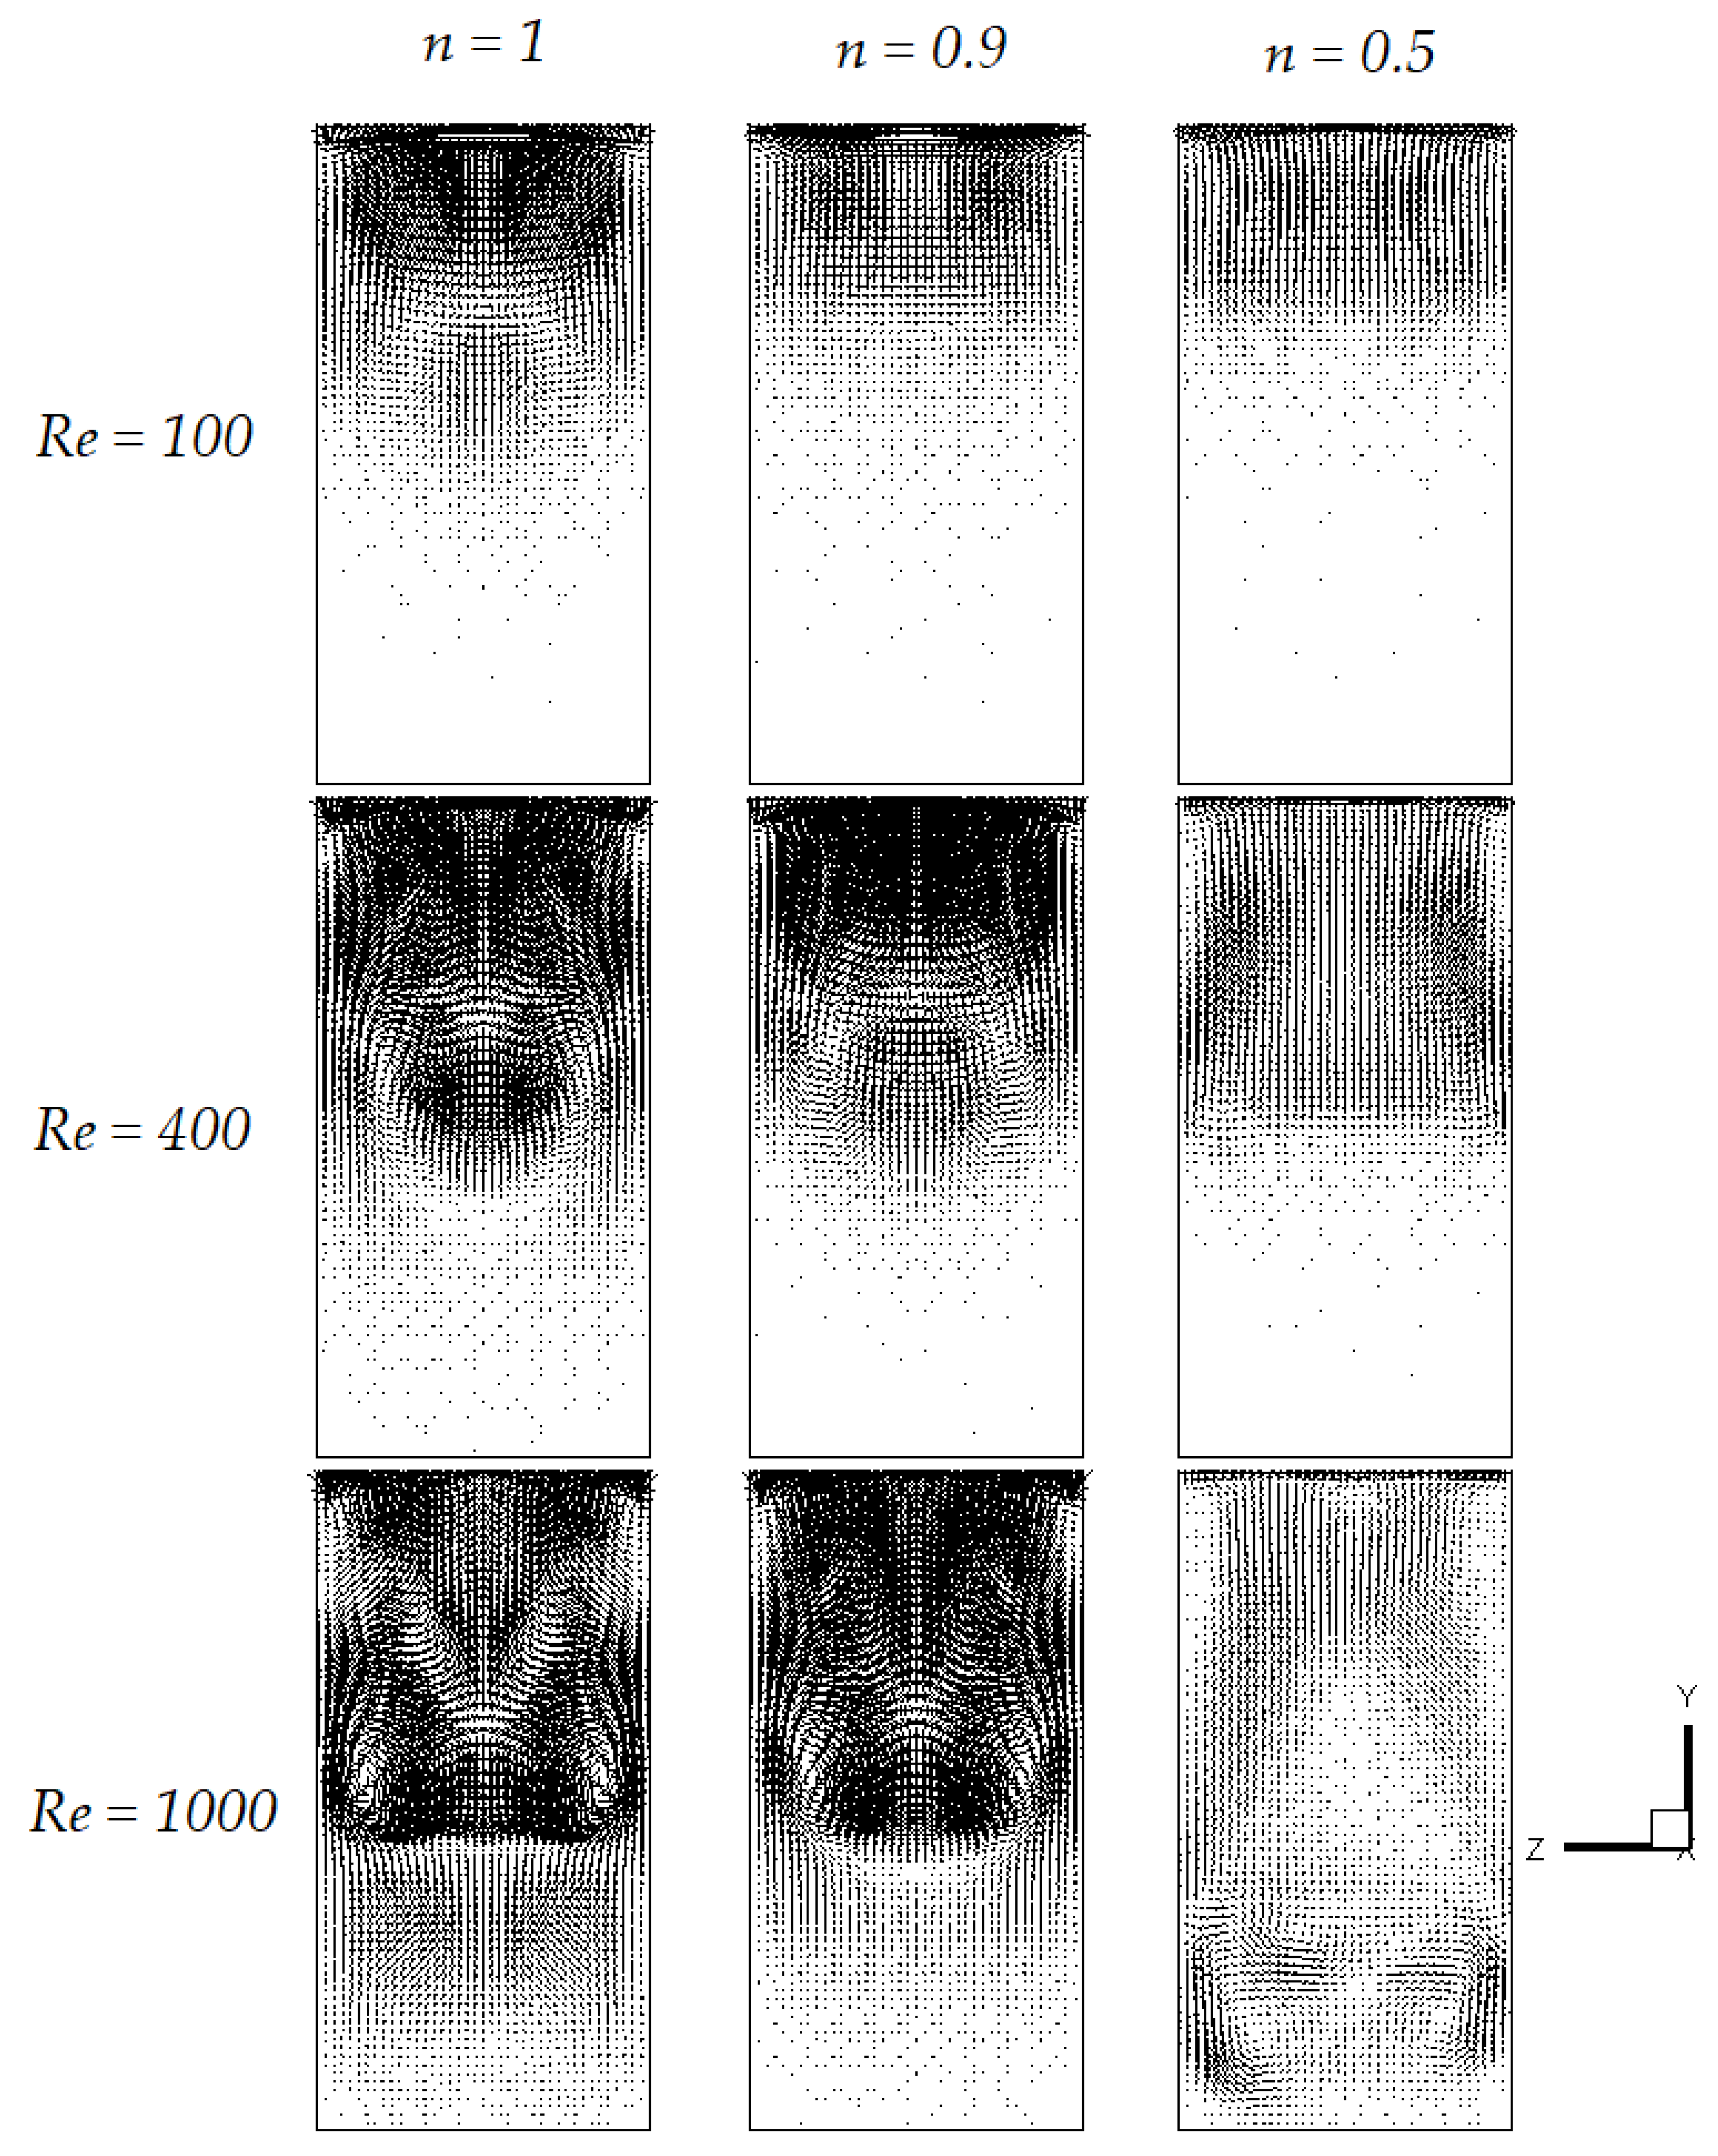
It should be highlighted that, for δ > 1 , there exists a critical Reynolds number above that the flow near the bottom wall will lose symmetry about the line C L y . The flow symmetry will be regained below the critical Reynolds number or by increasing the aspect ratio [19]. Velocity vector in the x = 0.5 plane ( Φ in Figure 1) inside the cavity for δ = 2 , together with different Reynolds numbers ( R e = 100 , 400 , 1000 ) and different values of n = 1 , 0.9 , 0.5 , are given in Figure 12. It is noticed that, by increasing the shear-thinning effect, going from left column to the right, the secondary flow becomes weaker. This is due to the shear-thinning effect, for which the fluid tends to flow more in the in-plane direction (x) rather than in the yz plane. It can be also seen that, in the plane Φ , a pair of secondary-flow vortices is found at small Reynolds number ( R e = 100 ), and these gradually shift towards the lower corner of the cavity side-walls with increasing Reynolds numbers (going from the top row to the bottom row of the figure). In addition, two pairs of longitudinal vortices begin to appear at the upper corner of the side-walls (in fact, a closer examination revealed the presence of a few additional weak vortices, thus making the flow field quite complex). These secondary vortices gain in strength with increasing Reynolds number. The above mentioned phenomena are somewhat less pronounced for fluid with a high shear-thinning effect. Our examination also showed that the same trend exists for the deeper cavity ( δ = 4 ).

4. Conclusions

In this paper, the 3-D LDC flow has been studied in rectangular cavities using a first-order projection method. The developed model has been validated against already published literature, and is further extended to simulate flows with generalised Newtonian power-law behaviour as a shear-thinning fluid.
The results show that the vortex structure in the cubed cavity ( δ = 1 ) changes considerably with R e , where increasing R e results in a second primary vortex appearing beside the first primary vortex. For deep cavities ( δ > 1 ), the results show the existence of a series of counter-rotating primary vortices that are placed vertically along the cavity-height. The size and number of these vortices depend on the cavity aspect ratio ( δ ) and the Reynolds number.
The present study, moreover, shows that the centre of the main vortex shifts towards the lid with decreasing R e in all cases, whereas, for a shear-thinning fluid, the displacement is more marked. It is, moreover, noted that by reducing the shear-thinning parameter, n, from 1 to 0.9, the main vortex shifts towards the lid, however, by further decreasing n to 0.5, the main vortex shifts back to the centre of the box.
Complex flow problems, such as transition to turbulence, and turbulent flow of non-Newtonian power-law fluids in the cavities with different aspect ratios may be of interest for future studies. Migration of a secondary phase, i.e., particles, in the cavity flow of non-Newtonian fluids could be another interesting phenomenon to investigate. This will be beneficial to applications in processing and manufacturing of ceramics and polymers where particles are suspended in non-Newtonian fluid.

Author Contributions

Conceptualization, M.J.; Investigation, M.J.; Software, M.J. and J.M.; Writing—original draft, M.J. and J.M.; Writing—review and editing, J.M., E.M. and J.H.H.

Funding

This research received no external funding.

Conflicts of Interest

The authors declare no conflict of interest.

References

  1. Shankar, P.; Deshpande, M. Fluid Mechanics in the Driven Cavity. Annu. Rev. Fluid Mech. 2000, 32, 93–136. [Google Scholar] [CrossRef] [Green Version]
  2. Shuja, S.; Yilbas, B.; Iqbal, M. Mixed Convection in a Square Cavity due to Heat Generating Rectangular Body: Effect of Cavity Exit Port Locations. Int. J. Numer. Methods Heat Fluid Flow 2000, 10, 824–841. [Google Scholar] [CrossRef]
  3. Wong, J.C.F. Numerical Simulation of Two-dimensional Laminar Mixed-convection in a Lid-driven Cavity Using the Mixed Finite Element Consistent Splitting Scheme. Int. J. Numer. Methods Heat Fluid Flow 2007, 17, 46–93. [Google Scholar] [CrossRef]
  4. Aidun, C.K.; Triantafillopoulos, N.; Benson, J. Global Stability of a Lid-driven Cavity with Throughflow: Flow Visualization Studies. Phys. Fluids A 1991, 3, 2081–2091. [Google Scholar] [CrossRef]
  5. Jana, S.C.; Metcalfe, G.; Ottino, J. Experimental and Computational Studies of Mixing in Complex Stokes Flows: The Vortex Mixing Flow and Multicellular Cavity Flows. J. Fluid Mech. 1994, 269, 199–246. [Google Scholar] [CrossRef]
  6. Alleborn, N.; Raszillier, H.; Durst, F. Lid-driven Cavity with Heat and Mass Transport. Int. J. Heat Mass Trans. 1999, 42, 833–853. [Google Scholar] [CrossRef]
  7. Mills, R.D. On the Closed Motion of a Fluid in a Square Cavity. J. R. Aeronaut. Soc. 1965, 69, 116–120. [Google Scholar] [CrossRef]
  8. Pan, F.; Acrivos, A. Steady flows in rectangular cavities. J. Fluid Mech. 1967, 28, 643–655. [Google Scholar] [CrossRef]
  9. Koseff, J.; Street, R. Visualization Studies of a Shear Driven Three-dimensional Recirculating Flow. J. Fluid Eng. 1984, 106, 21–27. [Google Scholar] [CrossRef]
  10. Koseff, J.; Street, R. The lid-driven cavity flow: A synthesis of qualitative and quantitative observations. J. Fluid Eng. 1984, 106, 390–398. [Google Scholar] [CrossRef]
  11. de Vahl Davis, G.; Mallinson, G. An Evaluation of Upwind and Central Difference Approximations by a Study of Recirculating Flow. Comput. Fluids 1976, 4, 29–43. [Google Scholar] [CrossRef]
  12. Schreiber, R.; Keller, H.B. Driven Cavity Flows by Efficient Numerical Techniques. J. Comput. Phys. 1983, 49, 310–333. [Google Scholar] [CrossRef]
  13. Ku, H.C.; Hirsh, R.S.; Taylor, T.D. A Pseudospectral Method for Solution of the Three-dimensional Incompressible Navier–Stokes Equations. J. Comput. Phys. 1987, 70, 439–462. [Google Scholar] [CrossRef]
  14. Iwatsu, R.; Ishii, K.; Kawamura, T.; Kuwahara, K.; Hyun, J.M. Numerical Simulation of Three-dimensional Flow structure in a Driven Cavity. Fluid Dyn. Res. 1989, 5, 173. [Google Scholar] [CrossRef]
  15. Chiang, T.; Sheu, W.; Hwang, R.R. Effect of Reynolds Number on the Eddy Structure in a Lid-driven Cavity. Int. J. Numer Methods Fluids 1998, 26, 557–579. [Google Scholar] [CrossRef]
  16. Ghia, U.; Ghia, K.N.; Shin, C. High-Re Solutions for Incompressible Flow Using the Navier–Stokes Equations and a Multigrid Method. J. Comput. Phys. 1982, 48, 387–411. [Google Scholar] [CrossRef]
  17. Albensoeder, S.; Kuhlmann, H.; Rath, H. Three-dimensional Centrifugal-flow Instabilities in the Lid-driven-cavity Problem. Phys. Fluids 2001, 13, 121–135. [Google Scholar] [CrossRef]
  18. Leriche, E.; Gavrilakis, S. Direct Numerical Simulation of the Flow in a Lid-driven Cubical Cavity. Phys. Fluids 2000, 12, 1363–1376. [Google Scholar] [CrossRef]
  19. De, S.; Nagendra, K.; Lakshmisha, K. Simulation of Laminar Flow in a Three-dimensional Lid-driven Cavity by Lattice Boltzmann Method. Int. J. Numer. Method Heat Fluid Flow 2009, 19, 790–815. [Google Scholar] [CrossRef]
  20. Tanner, R.I.; Walters, K. Rheology: An Historical Perspective; Elsevier: Amsterdam, The Netherlands, 1998; Volume 7. [Google Scholar]
  21. Reid, R.C.; Prausnitz, J.M.; Poling, B.E. The Properties of Gases and Liquids; McGraw Hill Book Co.: New York, NY, USA, 1987. [Google Scholar]
  22. Blackery, J.; Mitsoulis, E. Creeping Motion of a Sphere in Tubes Filled with a Bingham Plastic Material. J. Non-Newton. Fluid Mech. 1997, 70, 59–77. [Google Scholar] [CrossRef]
  23. Beaulne, M.; Mitsoulis, E. Creeping Motion of a Sphere in Tubes Filled with Herschel-Bulkley Fluids. J. Non-Newton. Fluid Mech. 1997, 72, 55–71. [Google Scholar] [CrossRef]
  24. Mitsoulis, E. Numerical Simulation of Confined Flow of Polyethylene Melts Around a Cylinder in a Planar Channel. J. Non-Newton. Fluid Mech. 1998, 76, 327–350. [Google Scholar] [CrossRef]
  25. Missirlis, K.; Assimacopoulos, D.; Mitsoulis, E.; Chhabra, R. Wall Effects for Motion of Spheres in Power-law Fluids. J. Non-Newton. Fluid Mech. 2001, 96, 459–471. [Google Scholar] [CrossRef]
  26. Mitsoulis, E.; Zisis, T. Flow of Bingham Plastics in a Lid-driven Square Cavity. J. Non-Newton. Fluid Mech. 2001, 101, 173–180. [Google Scholar] [CrossRef]
  27. Chatzimina, M.; Xenophontos, C.; Georgiou, G.; Argyropaidas, I.; Mitsoulis, E. Cessation of Annular Poiseuille Flows of Bingham Plastics. J. Non-Newton. Fluid Mech. 2007, 142, 135–142. [Google Scholar] [CrossRef]
  28. Mitsoulis, E.; Hatzikiriakos, S. Steady Flow Simulations of Compressible PTFE Paste Extrusion Under Severe Wall Slip. J. Non-Newton. Fluid Mech. 2009, 157, 26–33. [Google Scholar] [CrossRef]
  29. Muravleva, L.; Muravleva, E.; Georgiou, G.; Mitsoulis, E. Numerical Simulations of Cessation Flows of a Bingham Plastic with the Augmented Lagrangian Method. J. Non-Newton. Fluid Mech. 2010, 165, 544–550. [Google Scholar] [CrossRef]
  30. Jabbari, M.; Bulatova, R.; Hattel, J.; Bahl, C. Quasi–steady State Power Law Model for the Flow of (La0.85Sr0.15)0.9MnO3 Ceramic Slurry in Tape Casting. Mater. Sci. Technol. 2013, 29, 1080–1087. [Google Scholar] [CrossRef]
  31. Jabbari, M.; Hattel, J. Numerical Modeling of the Side Flow in Tape Casting of a Non-Newtonian Fluid. J. Am. Ceram. Soc. 2013, 96, 1414–1420. [Google Scholar] [CrossRef]
  32. Jabbari, M.; Bulatova, R.; Hattel, J.; Bahl, C. An Evaluation of Interface Capturing Methods in a VOF Based Model for Multiphase Flow of a Non-Newtonian Ceramic in Tape Casting. App. Math. Model. 2014, 38, 3222–3232. [Google Scholar] [CrossRef]
  33. Jabbari, M.; Spangenberg, J.; Hattel, J. Particle Migration Using Local Variation of the Viscosity (LVOV) Model in Flow of a Non-Newtonian Fluid for Ceramic Tape Casting. Chem. Eng. Res. Des. 2016, 109, 226–233. [Google Scholar] [CrossRef]
  34. Pakdel, P.; Spiegelberg, S.; McKinley, G. Cavity Flows of Elastic Liquids: Two-dimensional Flows. Phys. Fluids 1997, 9, 3123–3140. [Google Scholar] [CrossRef]
  35. Pakdel, P.; McKinley, G. Cavity Flows of Elastic Liquids: Purely Elastic Instabilities. Phys. Fluids 1998, 10, 1058–1070. [Google Scholar] [CrossRef]
  36. Yapici, K.; Karasozen, B.; Uludag, Y. Finite Volume Simulation of Viscoelastic Laminar Flow in a Lid-driven Cavity. J. Non-Newton. Fluid Mech. 2009, 164, 51–65. [Google Scholar] [CrossRef]
  37. Rafiee, A. Modelling of Generalized Newtonian Lid-Driven Cavity Flow Using An SPH Method. ANZIAM J. 2008, 49, 411–422. [Google Scholar] [CrossRef]
  38. Shamekhi, A.; Sadeghy, K. Cavity Flow Simulation of Carreau-Yasuda Non-Newtonian Fluids Using PIM Meshfree Method. Appl. Math. Model. 2009, 33, 4131–4145. [Google Scholar] [CrossRef]
  39. Shamekhi, A.; Sadeghy, K. A Numerical Method for Solving Incompressible Viscous Flow Problems. Appl. Math. Model. 1967, 2, 12–26. [Google Scholar]
  40. Bell, J.; Colella, P.; Glaz, H. A Second-Order Projection Method for the Incompressible Navier–Stokes Equations. J. Comput. Phys. 1989, 85, 257–283. [Google Scholar] [CrossRef]
  41. Gresho, P. On the Theory of Semi-implicit Projection Methods for Viscous Incompressible Flow and its Implementation via a Finite Element Method that also Introduces a Nearly Consistent Mass Matrix. Part 1: Theory. Int. J. Numer. Methods Fluids 1990, 11, 587–620. [Google Scholar] [CrossRef]
  42. Douglas, J.; Gunn, J. A General Formulation of Alternating Direction Method Part I. Parabolic and Hyperbolic Problems. Numer. Math. 1964, 6, 428–453. [Google Scholar] [CrossRef]
  43. Foias, C.; Manley, O.; Rosa, R.; Temam, R. Navier–Stokes Equations and Turbulence; Cambridge University Press: Cambridge, UK, 2001; Volume 83. [Google Scholar]
  44. McDonough, J.M. Lectures in Computational Fluid Dynamics of Incompressible Flow: Mathematics, Algorithms and Implementations; Lecture Notes for ME 691; Department of Mechanical Engineering, University of Kentucky: Lexington, KY, USA, 2013. [Google Scholar]
  45. Gnedin, N.; Semenov, V.; Kravtsov, A. Enforcing the Courant–Friedrichs–Lewy Condition in Explicitly Conservative Local Time Stepping Schemes. J. Comput. Phys. 2018, 359, 93–105. [Google Scholar] [CrossRef]
  46. Mitsoulis, E. Flows of Viscoplastic Materials: Models and Computations. Rheol. Rev. 2007, 2007, 135–178. [Google Scholar]
  47. Albensoeder, S.; Kuhlmann, H. Accurate Three-dimensional Lid-driven Cavity Flow. J. Comput. Phys. 2005, 206, 536–558. [Google Scholar] [CrossRef]
  48. Neofytou, P. A 3rd Order Upwind Finite Volume Method for Generalised Newtonian Fluid Flows. Adv. Eng. Softw. 2005, 36, 664–680. [Google Scholar] [CrossRef]
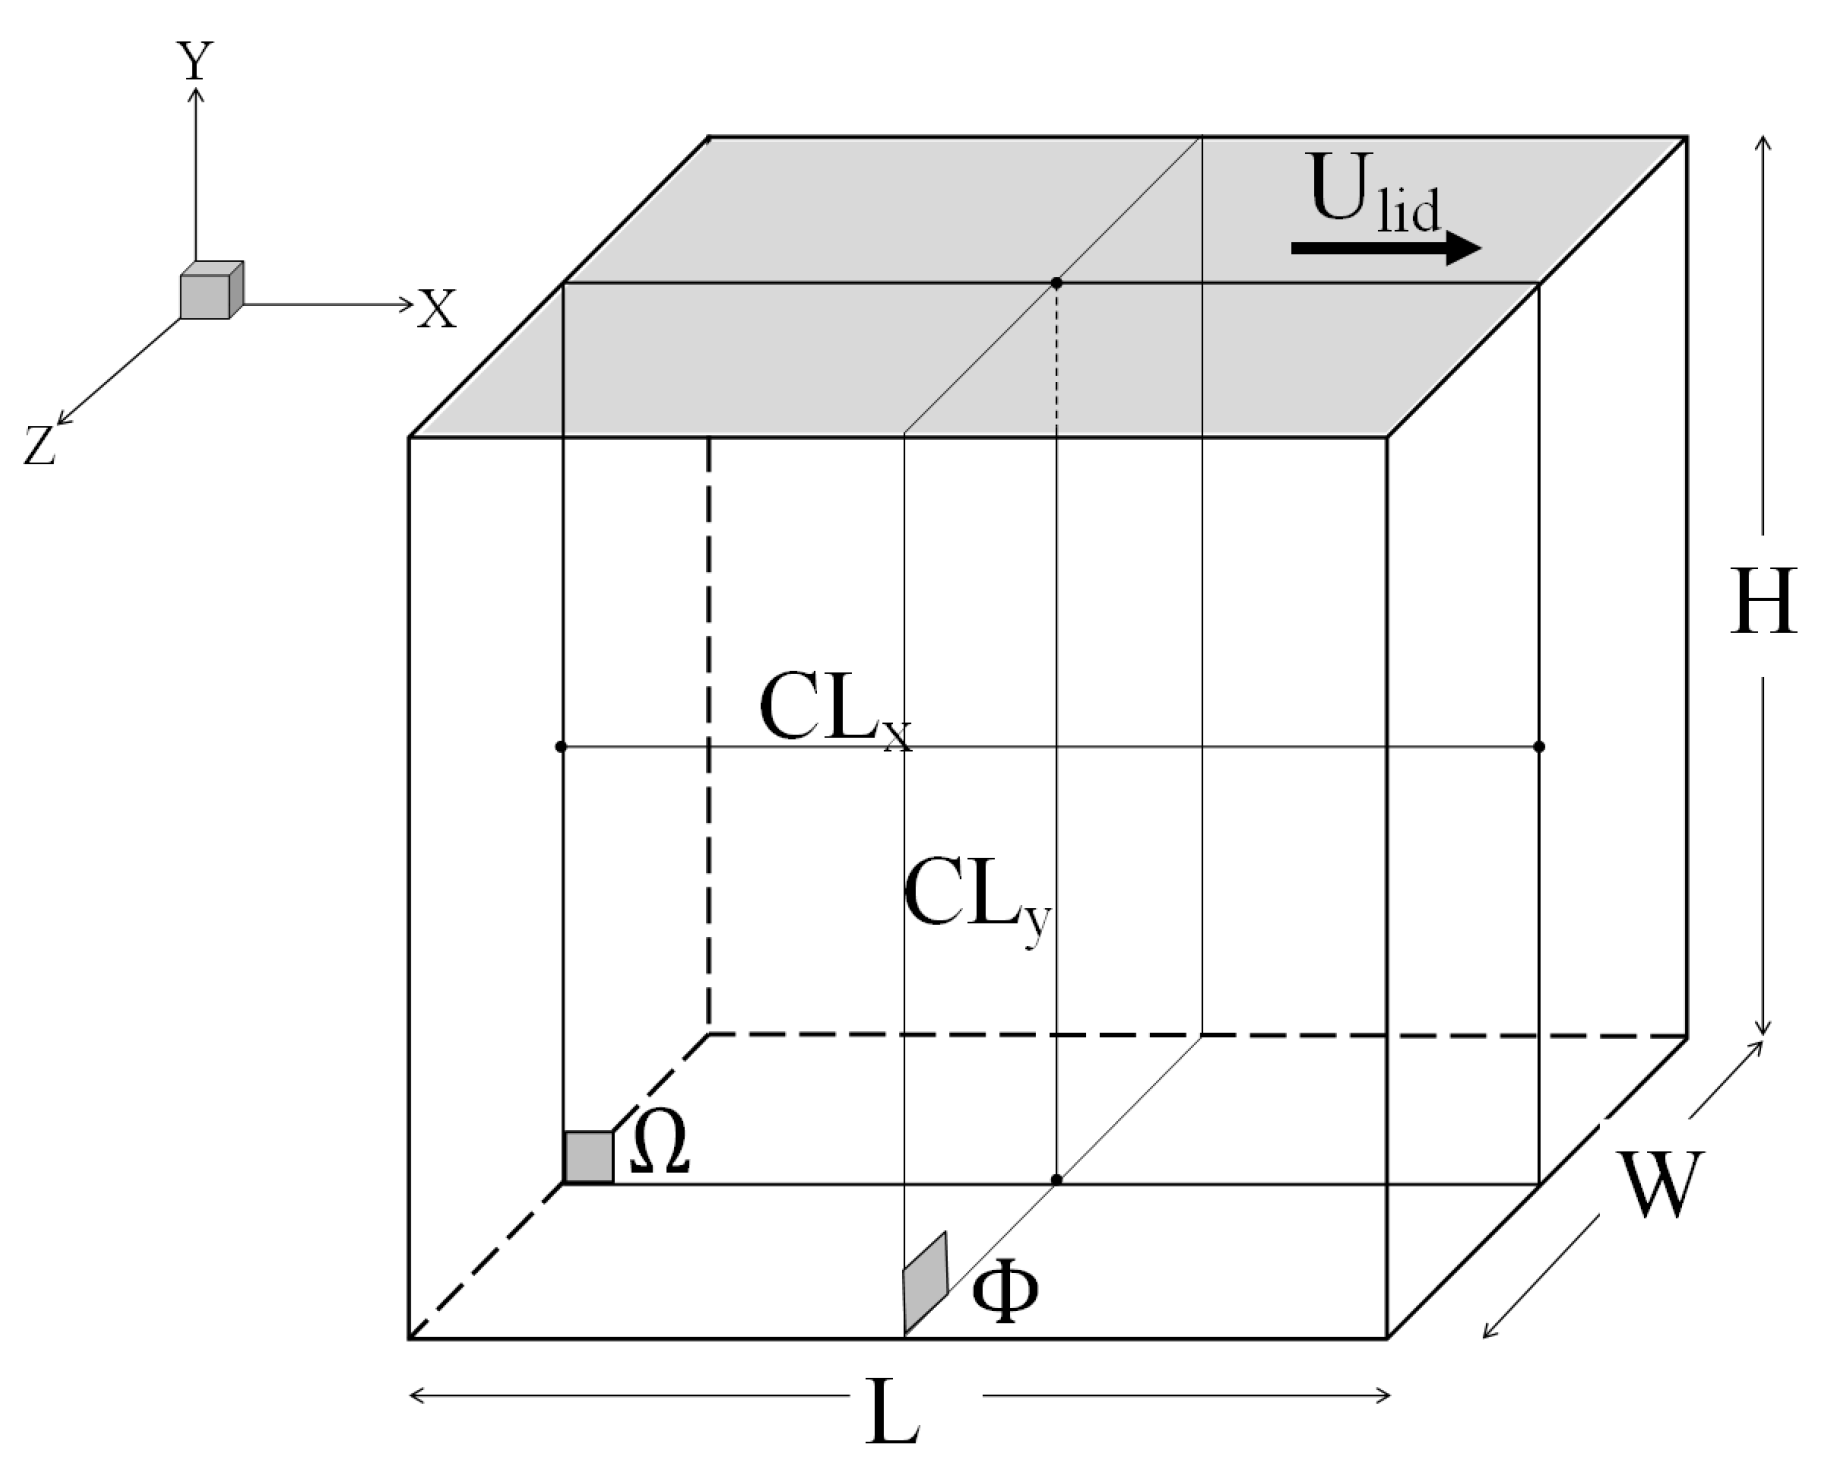
Figure 1. Schematic of a lid-driven cavity in three dimensions.
Fluids 04 00124 g001
Figure 2. Illustration of a staggered grid in 2-D [44].
Fluids 04 00124 g002
Figure 3. Representation of influence of power-law index, n, on non-Newtonian behaviour of a fluid.
Fluids 04 00124 g003
Figure 4. u ¯ component along the vertical centreline ( C L y ) of the cavity for three different grid-resolutions at different Reynolds numbers of (a) R e = 100 ; (b) R e = 400 ; and (c) R e = 1000 .
Fluids 04 00124 g004aFluids 04 00124 g004b
Figure 5. Normalised velocity profiles (a) u ¯ at C L y , and (b) v ¯ at C L x , discrete points from [47].
Fluids 04 00124 g005
Figure 6. Normalised velocity profiles u ¯ at C L y from the present study and its comparison to the work done by Neofytou [48].
Fluids 04 00124 g006
Figure 7. The critical Reynolds number for different k values with different n values.
Fluids 04 00124 g007
Figure 8. Normalised x-components of velocity profiles for aspect ratio δ = 1 and Reynolds numbers (a) R e = 100 ; (b) R e = 400 ; (c) R e = 1000 , and normalised y-components of velocity profiles for aspect ratio δ = 1 and Reynolds numbers; (d) R e = 100 ; (e) R e = 400 ; and (f) R e = 1000 ;— n = 1 (in black),— n = 0.9 (in blue), and — n = 0.5 (in red).
Fluids 04 00124 g008
Figure 9. Flow streamlines coloured by velocity magnitude in central xy plane of Ω for the three different R e numbers as well as three different n values.
Fluids 04 00124 g009
Figure 10. Flow streamlines coloured by vorticity magnitude in deeper cavities ( δ = 2 , 4 ) for R e = 1000 as well as three different n values.
Fluids 04 00124 g010
Figure 11. Velocity vector in central xy plane of Ω for deeper cavities ( δ = 2 , 4 ) as well as different Reynolds number. The non-Newtonian parameter n is equal to 0.5 .
Fluids 04 00124 g011
Figure 12. Velocity vector in plane of Φ for a cavity of δ = 2 together with different Reynolds numbers as well as different values of n.
Fluids 04 00124 g012
Table 1. Location, x , y , of the primary vortex core.
n = 1 n = 0.9 n = 0.5
R e = 100 0.6161 , 0.7634 0.5890 , 0.7967 0.7508 , 0.7540
R e = 400 0.6193 , 0.5836 0.6564 , 0.7004 0.5760 , 0.5446
R e = 1000 0.5935 , 0.4723 0.6084 , 0.5130 0.5334 , 0.4657