1. Introduction
A wide variety of commercial fluid products (e.g., for food or pharmaceutical applications) basically consist of colloidal disperse systems, such as emulsions and foams, whose primary characteristic is the formation and stabilization of a large interfacial area. Proteins are highly efficient for the stabilization of fluid–fluid interfaces as they tend to form two-dimensional (2D) microstructures at the interface, which are referred to as complex interfaces. Such complex interfacial microstructure leads to rheological complexity. In fact, the properties of the fluid-fluid interfaces (e.g., surface tension, surface dilatational, or surface shear moduli) may show a dominant effect on the overall dynamics of these systems. Hence, an understanding of the interfacial properties of adsorbed protein layers is considered to be essential for controlling the physio-chemical stability properties of such colloids [
1,
2]. However, the dynamic behavior of protein-adsorbed fluid-fluid interfaces can be analyzed by using different rheological approaches. Dilatational rheology has been related to the dynamics of emulsion formation [
3,
4] but involves changes in the surface area and surface concentration [
5,
6]. On the other hand, interfacial shear rheology is attracting increasing attention since it has been postulated to be more sensitive to the application of small deformations over which the surface area remains unaltered. In addition, the interpretation of these measurements is analogous to that of widely used techniques in bulk rheology [
7,
8]. However, a correct interpretation of interfacial films requires of both techniques (dilatational and interfacial shear rheology). Although several tools have been used to overcome the challenges of interfacial shear rheology, double wall ring (DWR) geometry has demonstrated many advantages, where the effect of adjoining subphases may be conveniently neglected in most of practical conditions [
9,
10].
The dynamics of model proteins (mainly coming from milk fractions), adsorbed at oil/water (O/W) interface, has been widely studied [
9,
10,
11]. However, these proteins systems are not cost-competitive enough for the manufacturing of commercial emulsions. An attractive alternative for the formation and stabilization of emulsions has been the use of plant proteins, not only because they are more cost-competitive but also because they exhibit high nutritional quality and allow avoiding the use of animal sources. Among them: legume proteins, which constitute the world’s fourth most important crop and are particularly interesting due to their excellent nutritional properties and composition as they are rich in carbohydrates, proteins, fibers, vitamins, and minerals [
12,
13]. In fact, the protein content in legumes is higher than in cereals (reaching up to 20 wt.%) and similar to that found in meat products [
14].
In addition to the characterization of the emulsion at a nanoscale (interfacial properties), it is essential to relate the emulsion stability to its properties at a microscale (i.e., droplet size distribution, DSD), as well as to the macroscopic properties, such as the rheology of the continuous phase, both of which depend on the interactions among droplets [
15] and can be used to predict some destabilization phenomena (e.g., creaming and flocculation) [
16].
The aim of this work was to evaluate the links between the interfacial properties of legume protein-adsorbed O/W layers and the microscopic and macroscopic properties of emulsions stabilized by using these proteins, either from chickpea (CP) or faba bean (FB). Additionally, the influence of pH value was analyzed (pH 2.5 and 7.5). To achieve this objective, the interfacial characterization was carried out by means of dilatational and interfacial shear rheology measurements (using a DWR geometry). Moreover, the microstructure and stability of final emulsions were evaluated by means of droplet size distribution (DSD) and multiple light scattering (MLS) analysis whereas their bulk rheological properties were determined by using small amplitude oscillatory shear (SAOS) measurements.
2. Materials and Methods
2.1. Materials
Two protein systems were used in this study. The HerbaPro F65 (from faba bean) and the CD 300 (from chickpea). Both protein concentrates were supplied by Herba Ingredients (San José de la Rinconada, Seville, Spain). The former protein system was obtained by direct milling, followed by a dry densification process. The light effluent rich in proteins (56.4 ± 0.1 wt.%) was used in this work [
17]. The later protein system was obtained by direct milling of chickpea, however it was concentrated by protein solubilization, followed by isoelectric precipitation (pH 4.0) [
18]. The final protein content of this protein system (CP) was previously reported by the authors (65.2 ± 0.1 wt.%) [
18]. On the other hand, the sunflower oil was purchased from a local producer (COREYSA, Seville, Spain) and all other chemical reagents were purchased from Sigma-Aldrich (St. Louis, MO, USA). The isoelectric point of each protein system was previously determined, being 3.5 for the FB protein system [
17] and 4.0 for the CP protein system [
18].
2.2. Interfacial Characterization
2.2.1. Pendant Droplet Measurements
Kinetics of protein adsorption was determined by pendant droplet measurements. Transient and steady-state interfacial dilatational measurements were carried out using the TRACKER pendant-droplet tensiometer (IT Concept, Nice, France). The shape of an axisymmetric droplet was analyzed through a charge-coupled device (CCD) camera coupled to a computer. Droplet profiles were processed according to the Laplace equation as was described by Castellani et al. [
19]. Transient measurements were carried out at 0.62 rad/s and 10% strain amplitude. On the other hand, after reaching the pseudo-equilibrium state (i.e., after 10,800 s), the mechanical spectra were obtained by means of a frequency sweep test (from 0.048 to 0.62 rad/s). All the experiments were carried out, at least in triplicate, at the saturation protein concentration of the O/W interface, using an optical glass cuvette (8 mL), which contained the oil phase, at 20.0 ± 0.1 °C.
2.2.2. Interfacial Shear Rheological Properties
Protein adsorption kinetics was also determined by interfacial measurements. Transient and steady-state interfacial shear measurements were carried out using the Double wall-ring geometry, coupled to the high-sensitive DHR-3 rheometer (TA Instruments, New Castle, DE, USA). Interfacial shear characterization was carried out by means of interfacial small amplitude oscillatory shear measurements (i-SAOS) measurements [
8]. Time sweep experiments were carried out during the protein adsorption (i.e., over 10,800 s) at 0.62 rad/s, obtaining the interfacial shear mechanical spectra. Subsequently, frequency sweep tests were performed after protein adsorption from 0.062 to 6.2 rad/s. Prior to frequency sweep tests, stress swept tests were performed to determinate the linear viscoelastic region (LVR). All these experiments were carried out at the saturation protein concentration of the O/W interface, at least in duplicate, where the experimental set-up was thermostated at 20.0 ± 0.1 °C by placing the double wall cup directly onto the Peltier bottom plate.
Moreover, the contribution of the subphase to i-SAOS results was assessed by calculating the Boussinesq number (Bo) (Equation (1)):
where
ηs and
ηb represent the viscosities of the interface and the bulk, respectively and
a is the characteristic length for the for geometry used (0.07 mm).
Bo was higher than 100 in all cases (Bo > 100), indicating that the response obtained is solely related to the interfacial contribution [
8,
20].
2.3. Emulsion Preparation
Emulsions were prepared following a two-stages method. In the first stage, protein dispersion (50/50) was adjusted at the selected pH value: either below the isoelectric point (IEP) (pH 2.5) or above the IEP (pH 7.5) [
17,
18]. Subsequently, high-oleic sunflower oil (Coreysa S.A. de C.V., Sevilla, Spain) was gradually blended with the aqueous protein dispersion. The protein concentration was selected according to the concentration of protein required for the saturation of the O/W interface: 2.5 wt.% for pH 2.5 and 4 wt.% for pH 7.5. Blends were subjected to high-shear mixing using the Ultraturrax T-50 (IKA, Staufen, Germany) over 2 min at 5000 rpm, obtaining pre-emulsions. The second stage consisted on passing once the pre-emulsions through the high-pressure valve homogenizer EmulsiFlex-C5 (Avestin, Mannheim, Germany) at 200 KPa. After that, the emulsions were ready for further characterization.
2.4. Emulsion Characterization
2.4.1. Droplet Size Distribution Measurements
DSD measurements were carried out by laser diffraction with the Mastersizer X (Malvern Instruments, Malvern, UK). To disrupt floccules, 1 wt.% of sodium dodecyl sulphate (SDS) was added to the water/emulsion dispersion, followed by a soft stirring [
21]. The Sauter mean droplet diameter was calculated as follows:
where
ni is the number of droplets which have
di as diameter. DSD measurements were carried out the day after emulsion preparation and 28 days later.
2.4.2. Bulk Rheological Properties
Linear viscoelastic properties of legume protein-stabilized emulsions were determined by SAOS measurements, carried out using the AR-2000 rheometer (TA Instruments, New Castle, DE, USA). Prior to frequency sweep tests, stress sweep tests were performed at three different frequencies (0.62, 6.20, and 12.52 rad/s) to define the linear viscoelastic region (LVR). Subsequently, frequency sweep tests were carried out from 0.062 to 125 rad/s, at constant stress within the LVR. Serrated plates of 35 mm were used in these measurements to avoid slipping phenomena. SAOS measurements were carried out the day after emulsion preparation and 28 days later.
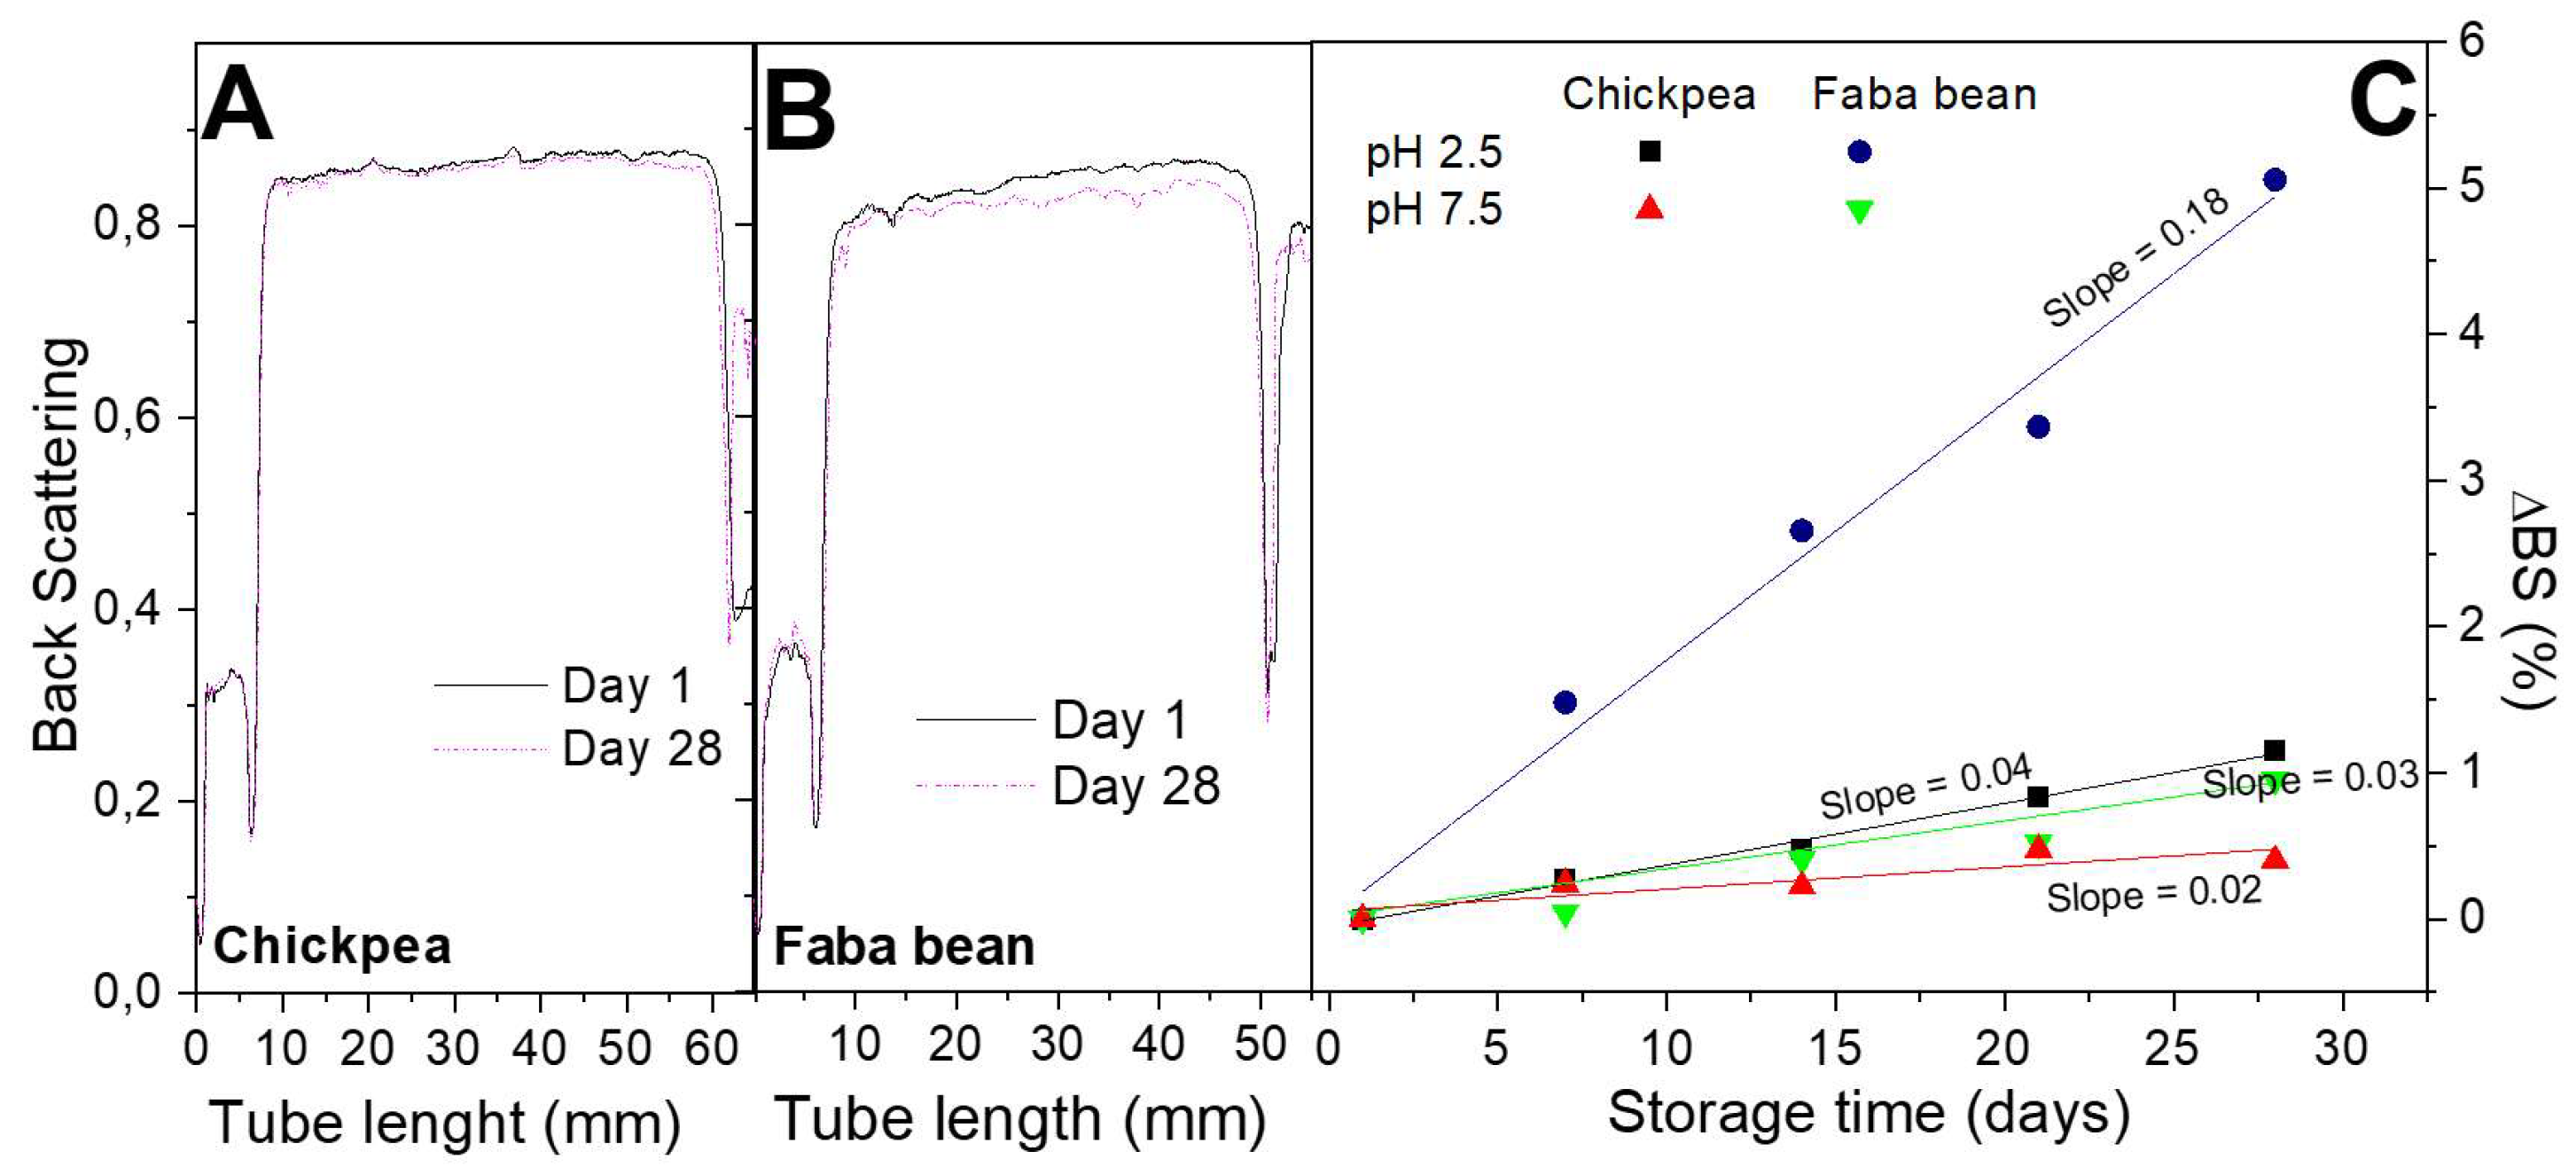
2.4.3. Backscattering Measurements
MLS measurements were carried out with a Turbiscan Lab Expert (L’Union, Toulouse, France). A light source on a glass tube, which contains the sample, was applied. The backscattering profile was obtained as a function of the tube length. The stability of these emulsions was analyzed during 28 days. Relative backscattering (Δ
BS) as a function of time was defined as follows:
where
BS0 and
BSt are the
BS values obtained for the full profile at 50 mm tube length the day 0 and after time,
t (1, 7, 14, 21, and 28 days), respectively.
2.5. Statistical Analysis
At least three replicates of each measurement were carried out. Measurement uncertainty was determined by means of standard deviation. Moreover, significant differences (p < 0.05) were analyzed by means of analysis of variance (ANOVA) tests (Excel statistical package). Different letters in tables indicate significant differences.
3. Results
3.1. Interfacial Characterization
3.1.1. Dilatational Measurements
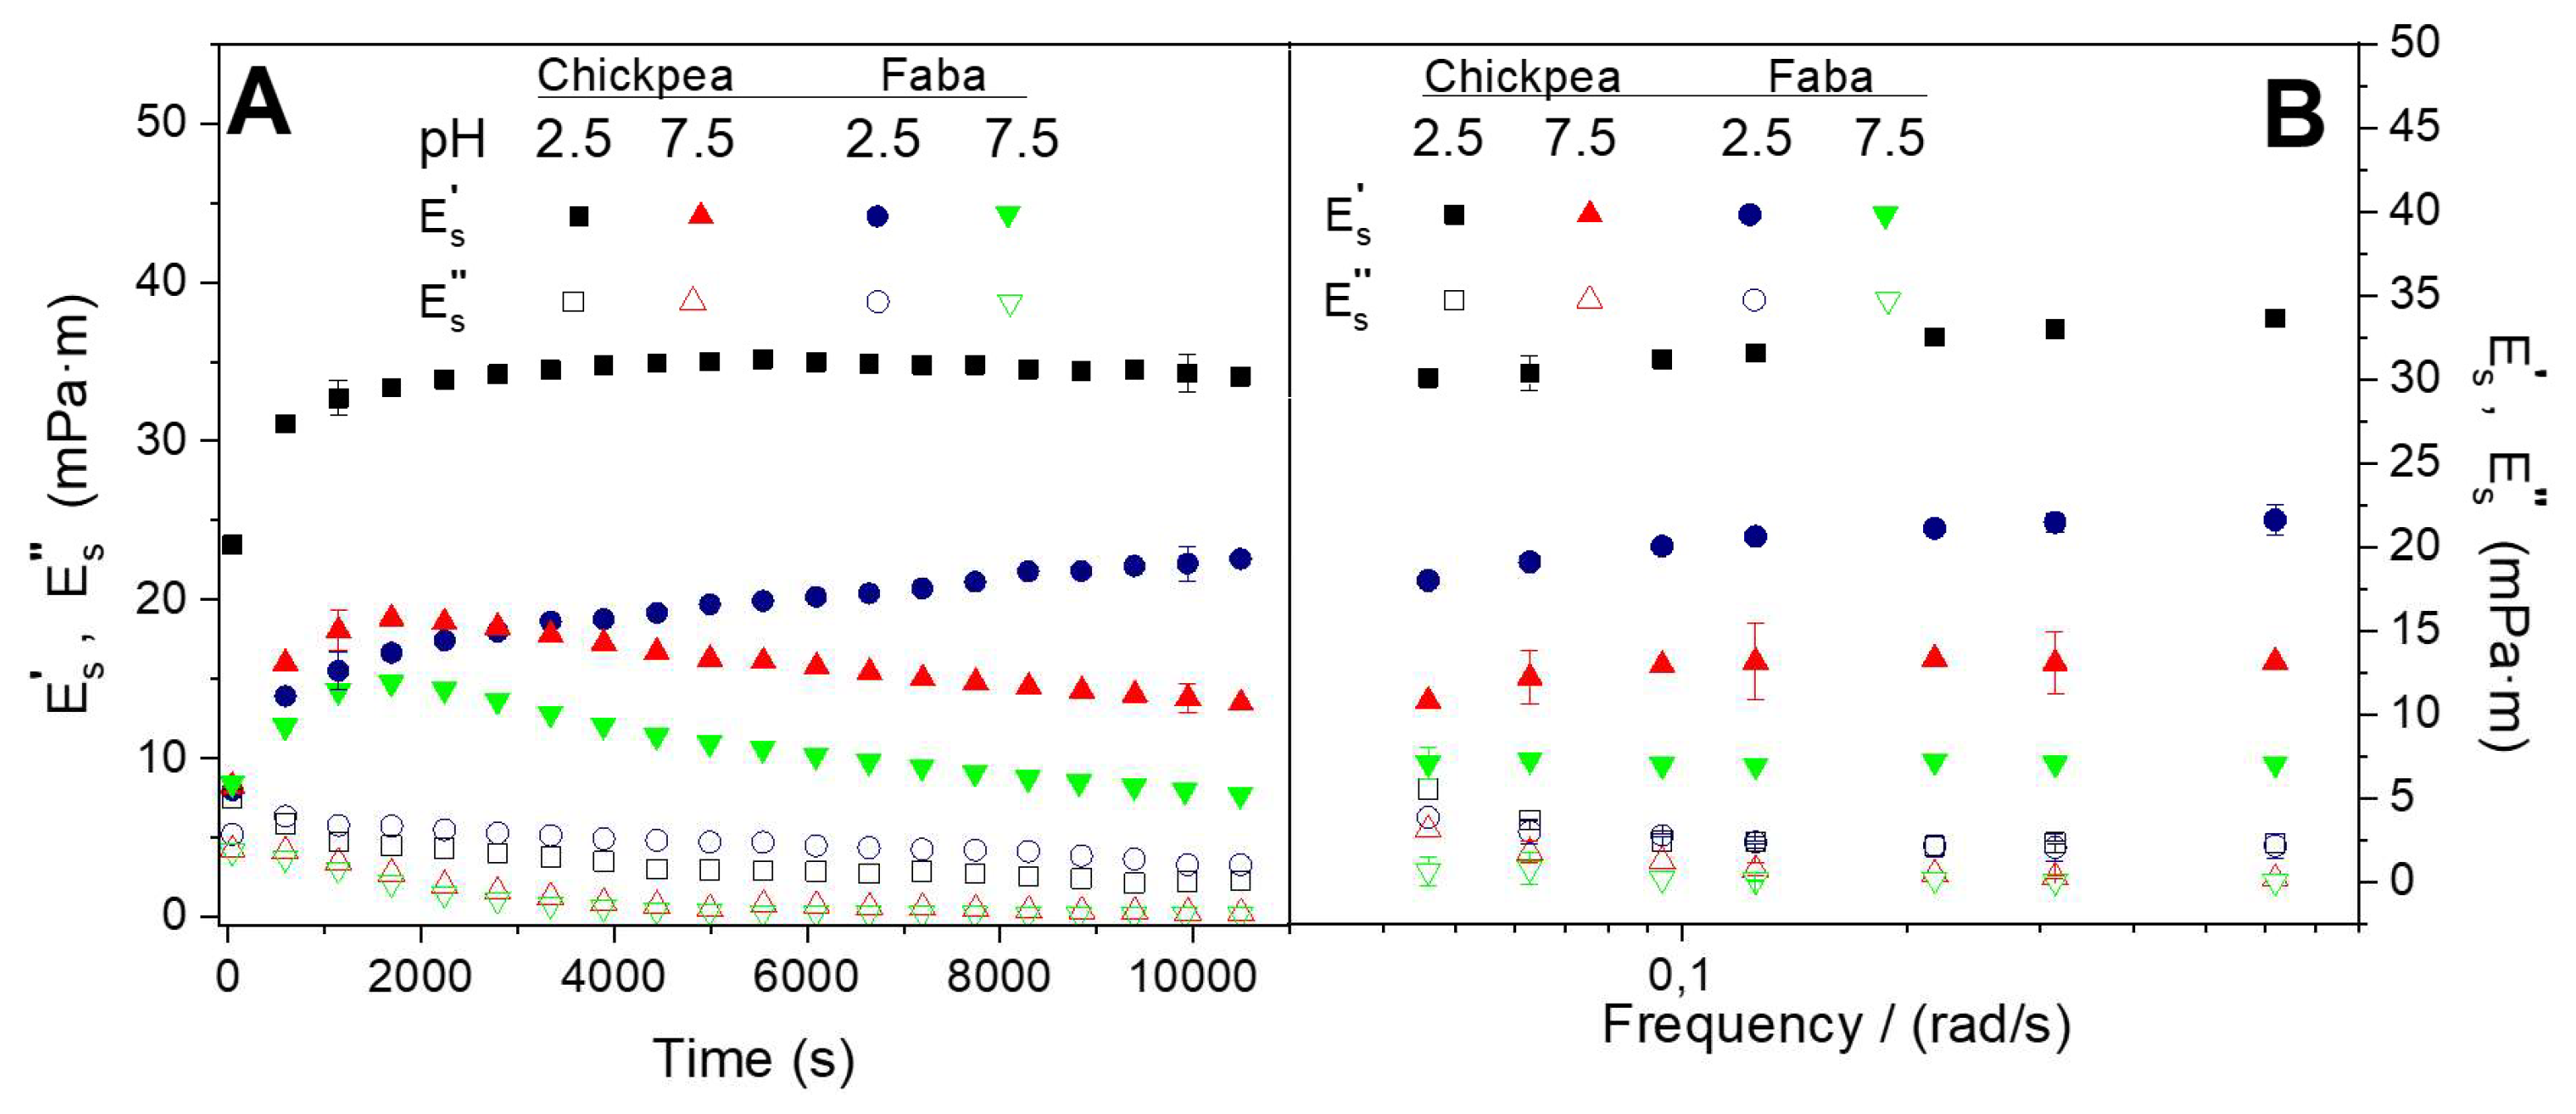
Figure 1A shows the rheokinetics of the protein adsorption at O/W interface at two different pH values (2.5 and 7.5) for the two protein systems studied (FB and CP). As can be observed, the initial adsorption of the protein at the interface involves an increase in the apparent elastic modulus (E’
s), as well as a decrease in the apparent viscous modulus (E’’
s) which corroborates that the interfacial film is progressively being formed in all cases [
7,
22,
23].
This initial behavior has been previously related with protein diffusion and penetration to the O/W interface. This first step is typically followed by protein opening and consequently unfolding, leading to a decrease in rate changes of the apparent viscoelastic moduli (E’
s and E’’
s), eventually showing a tendency to reach a constant value of E’’
s or E’
s. This is the behavior observed for both protein systems at pH 2.5, however at pH 7.5 the trend to a constant value is achieved after a shoulder in E’
s. This different behavior, regardless of the protein used, has been attributed to some protein rearrangements which might take place at this pH value [
24], as well as to the formation of a protein multilayer [
25]. In any case, previous studies indicated that the protein adsorption at low pH value (i.e., 2.5) took place faster since protein is denatured before reaching the O/W interface, leading to a faster protein unfolding at the interface.
This plot also reveals that the interfacial films developed are stronger for pH 2.5 than for pH 7.5, regardless of the protein system that studied FB or CP. Among them, CP interfacial films exhibit higher viscoelastic response. On the other hand,
Figure 1B exhibits apparent dilatational viscoelastic moduli after 10,800 s protein adsorption at two different pH values (2.5 and 7.5) as a function of frequency value (from 0.048 to 0.62 rad/s). As can be observed, E’
s is always above E”
s, corroborating that the formation of a gel-like interfacial film at the O/W interface takes place [
9]. These gel-like results (low frequency dependence and high apparent viscoelastic moduli) have been previously obtained for other protein adsorbed at O/W interface [
22,
26,
27]. Moreover, this plot also indicates that the pH value exerts a marked effect on both apparent viscoelastic moduli (E’
s and E’’
s). In this sense, the mechanical spectra obtained for the different systems studied also indicate that the best results (i.e., the strongest gel-like response) were obtained for CP-adsorbed films at pH 2.5. These results were related to unfolded proteins found at this pH value, allowing better interaction among different protein chains [
28] and leading to stronger interfacial films at low pH value due to higher protein-protein interactions (related to hydrophobic forces) [
29]. However, some precautions should be taken upon analysis of these results since it is recognized that the apparent dilatational moduli obtained in complex fluid-fluid interfaces may be affected by bending rigidity, as well as by the changes in the surface area which take place during dilation and contraction [
30].
3.1.2. Interfacial Shear Measurements
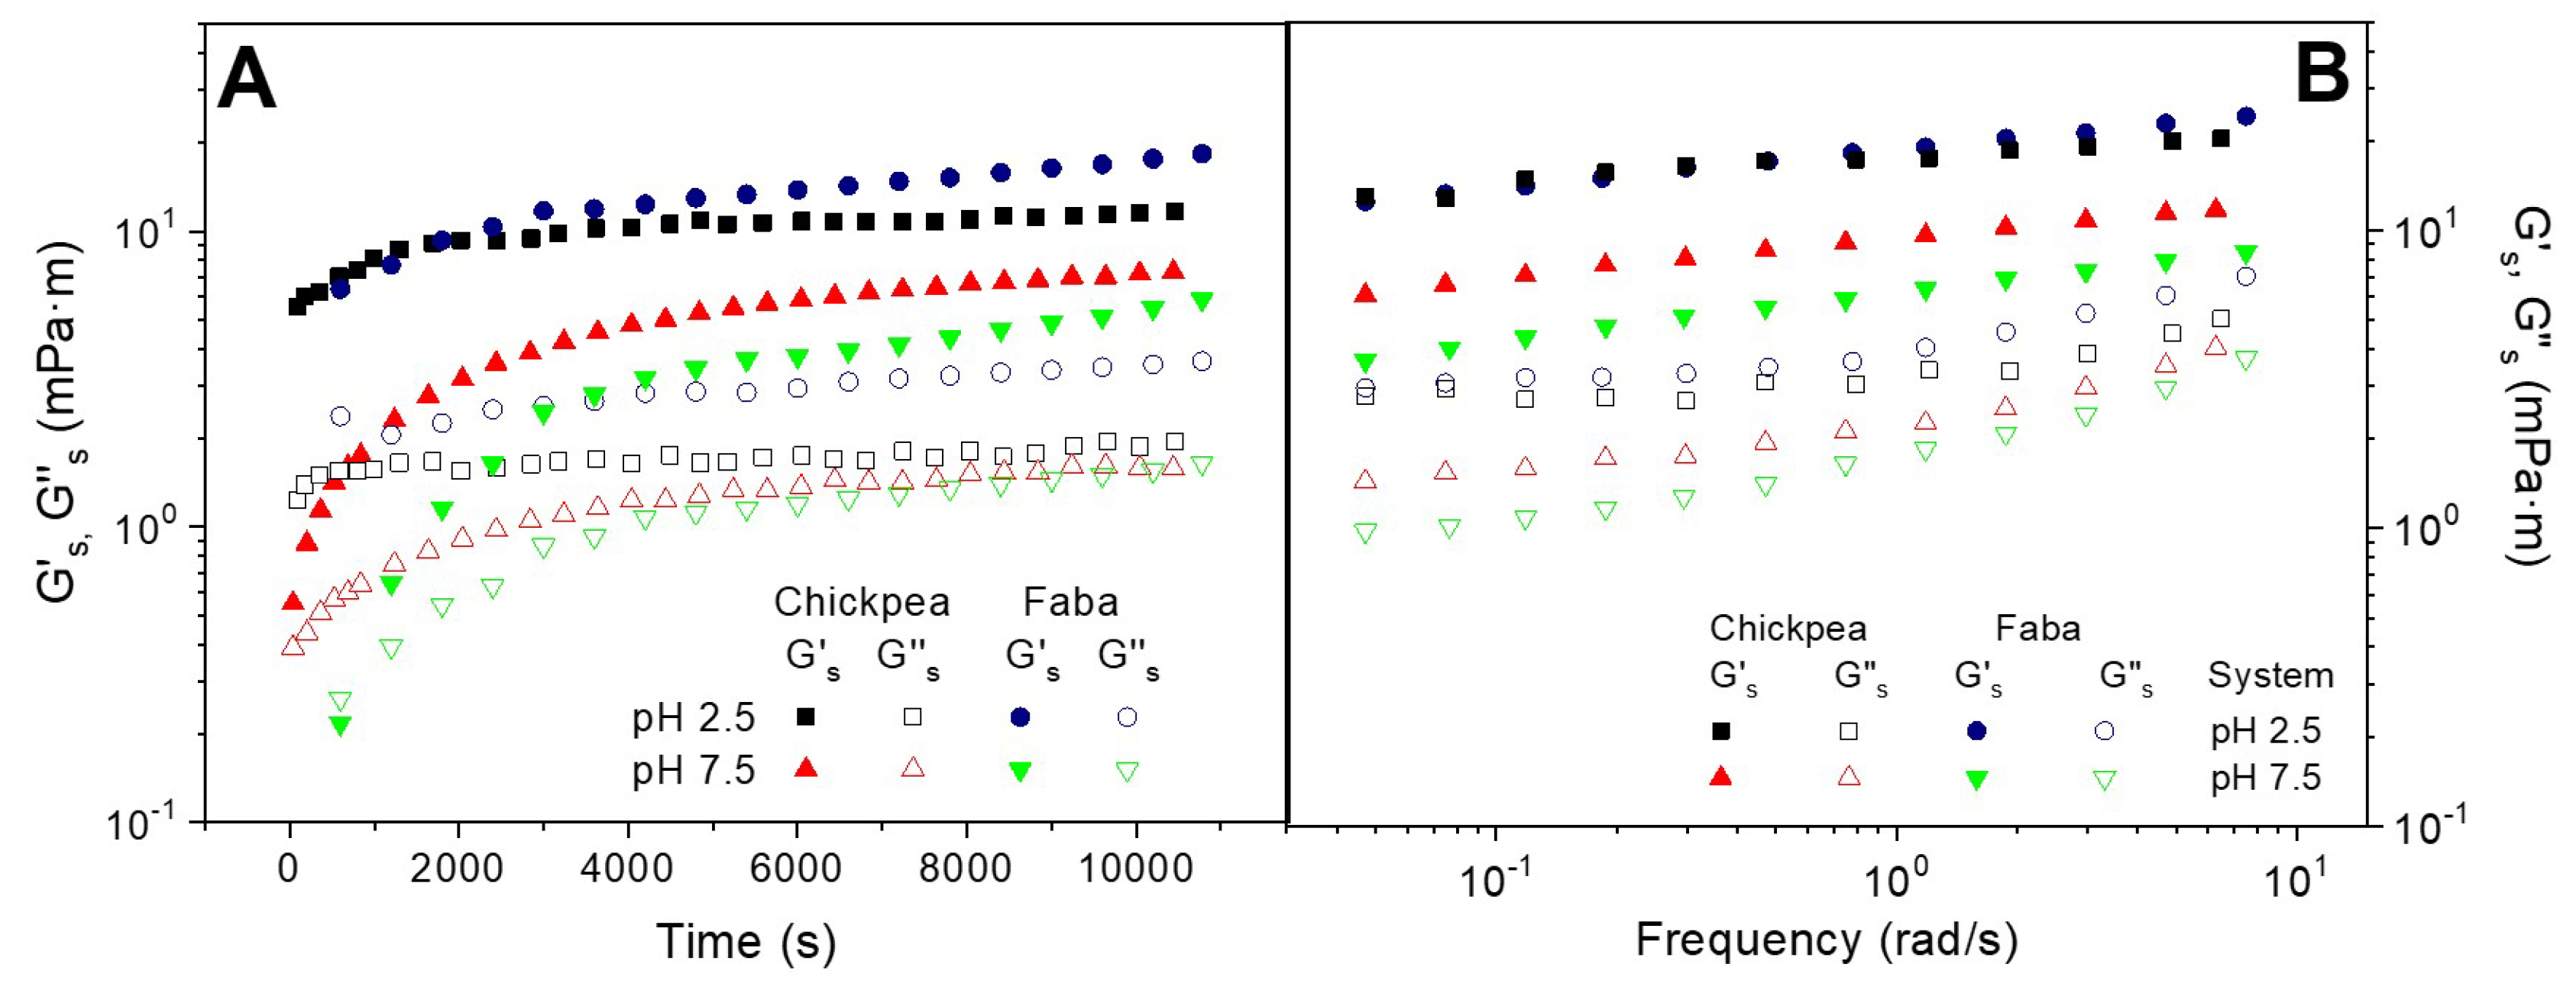
Figure 2A shows the protein adsorption rheokinetics of the O/W interface at two different pH values (2.5 and 7.5) for the two protein systems studied (FB and CP) obtained by means of interfacial shear measurement.
The comparison between interfacial dilatational and shear measurements have been proposed as a key tool to understand the rheological behavior of complex interfaces. Thus, whereas the former may be affected by bending rigidity and changes in surface area, the latter is not affected by these phenomena. According to this plot, the evolution of G’
s and G’’
s is similar to the behavior found from dilatational measurements (E’
s and E”
s), where G’
s experienced a fast initial increase followed by a tendency to reach a plateau zone. Interestingly, the interfacial shear measurements do not show the above-mentioned shoulder found at pH 7.5. Moreover, the G’’
s modulus decreases until reaching a constant value. This response reflects the protein adsorption at the O/W interface which leads to the development of an interfacial film [
31]. The interfacial films formed at low pH value exhibit higher elastic interfacial modulus than the interfaces stabilized at higher pH value, which is consistent with the results obtained from dilatational measurements.
In contrast, when comparing the two protein systems, the consistency between interfacial shear and dilatational measurements only remains at pH 7.5, at which CP displays higher values than FB. However, the strongest gel-like response found at pH 2.5 for CP over FB-adsorbed films, under dilatational measurement, is not observed by interfacial shear measurements.
On the other hand,
Figure 1B shows the experimental mechanical spectra of the O/W interfaces obtained for CP and FB protein systems adsorbed at the O/W interface after reaching the pseudo-equilibrium state at two different pH values (2.5 and 7.5). These mechanical spectra confirm the development of the protein network, which is reflected by a 2D gel-like behavior. However, the G’
s values obtained by interfacial shear measurements are more frequency-dependent, suggesting that the E’
s values may be affected by Gibbs elasticity caused by changes in surface area, which takes place in dilatational measurements [
7]. The above-mentioned inconsistency found between both techniques over protein adsorption at pH 2.5 remains for the mechanical spectra obtained after the pseudo-equilibrium. At pH 7.5, however, both techniques lead to highest mechanical spectra for CP-adsorbed films.
3.2. Emulsion Characterization
3.2.1. Droplet Size Distribution Measurements
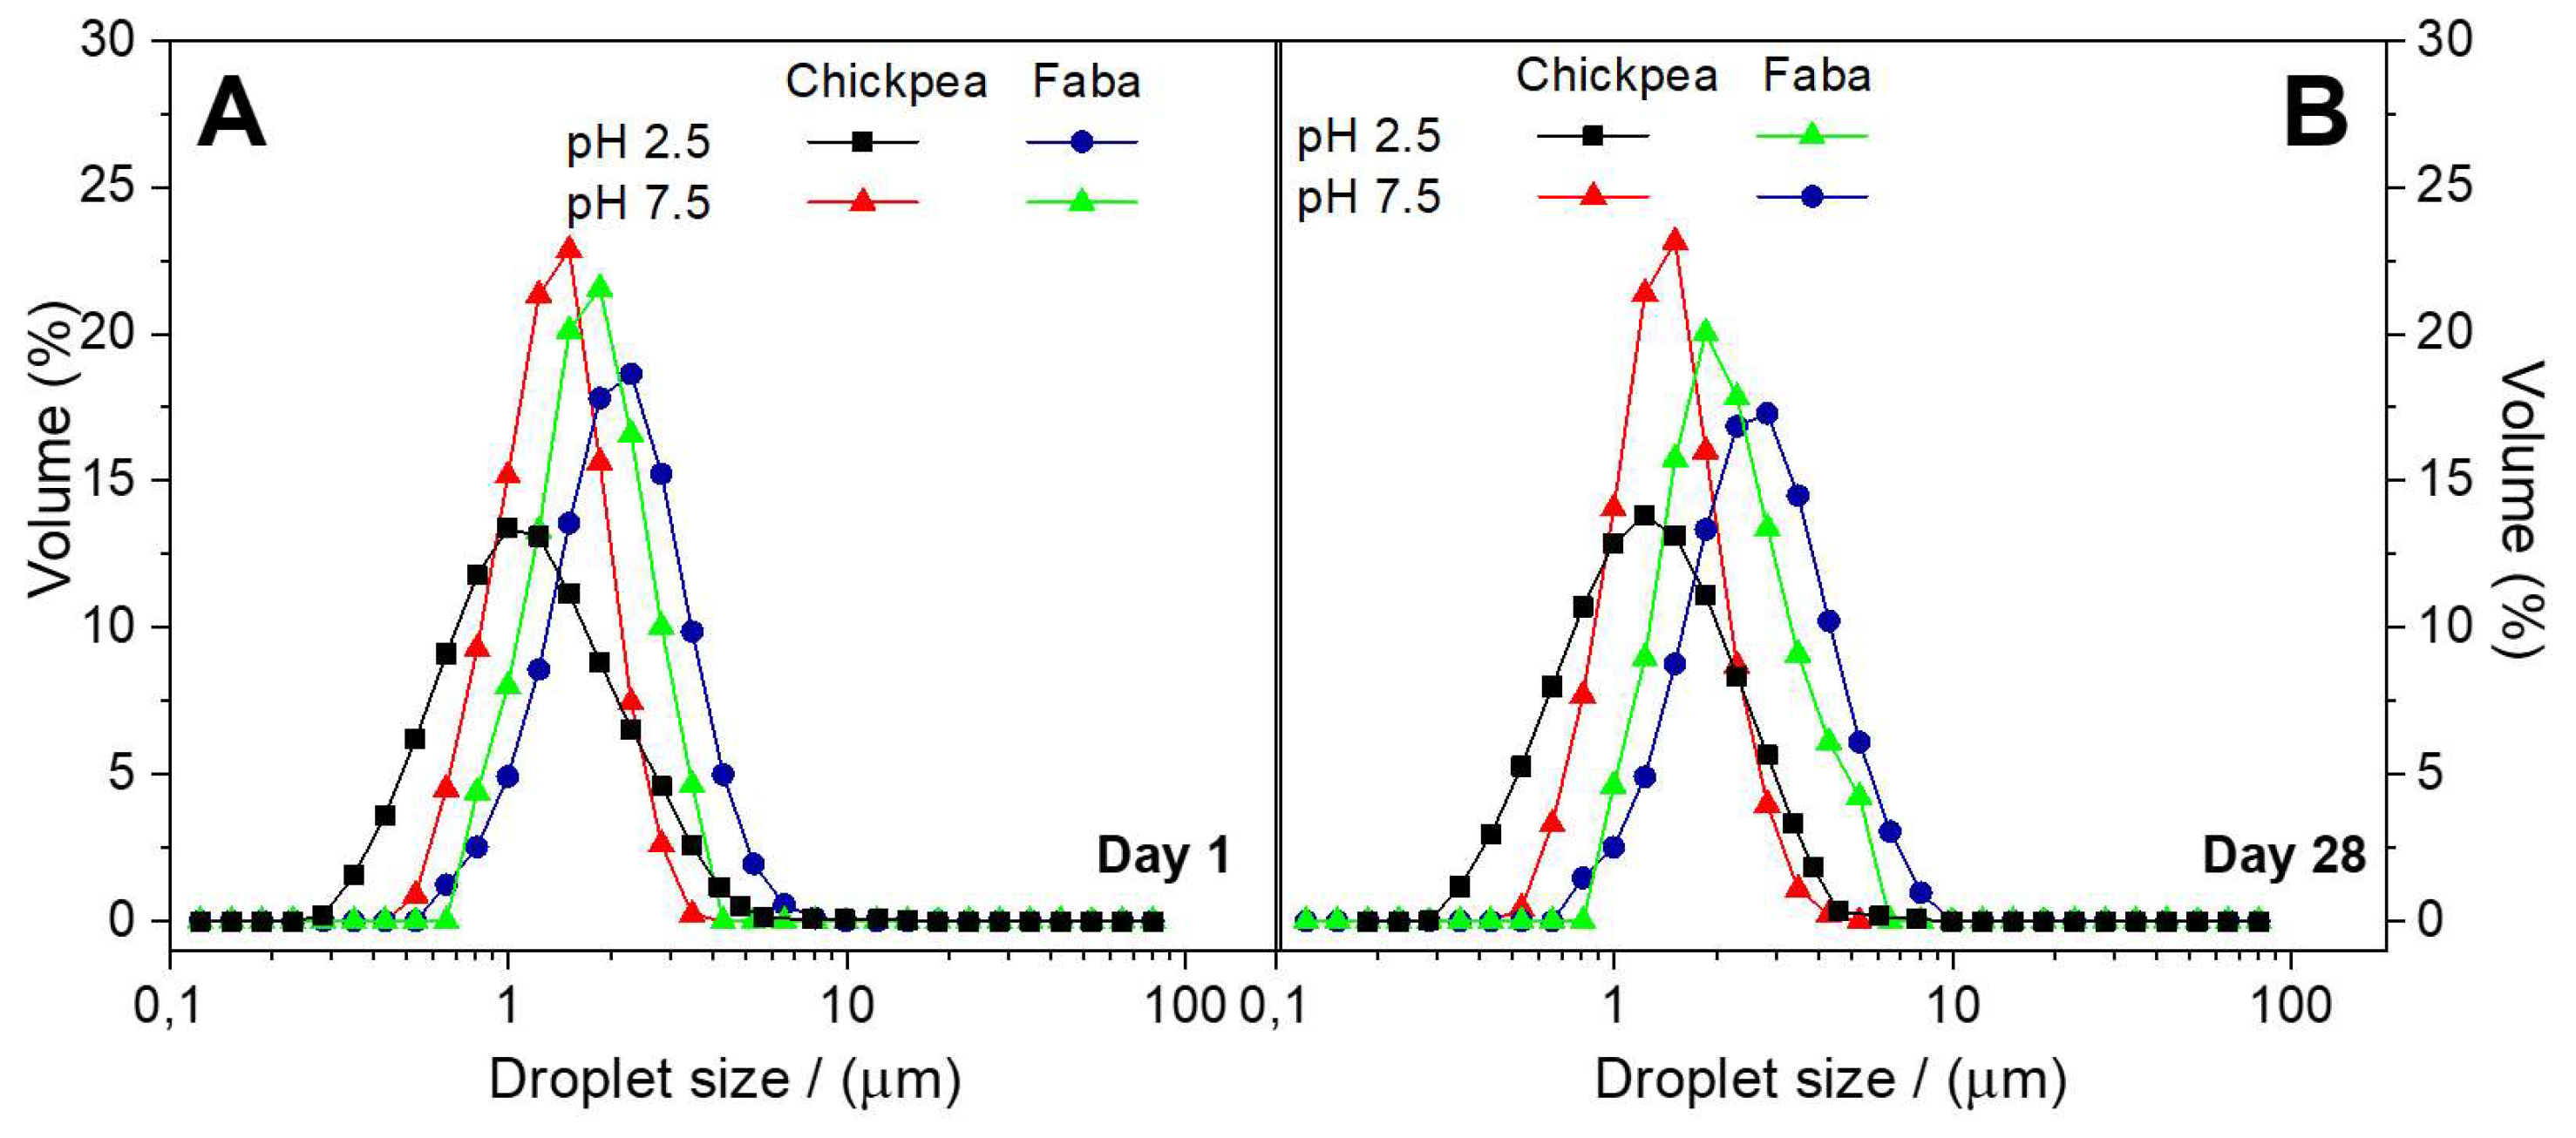
Figure 3 shows the DSD profiles obtained for CP or FB-stabilized emulsions the same day of emulsion preparation (
Figure 3A) and 28 days later (
Figure 3B) at two different pH values (2.5 and 7.5).
In order to explain the results from DSD measurements, the equilibrium interfacial tension values for CP or FB-adsorbed O/W interfaces were previously measured by tensiometry (using a Whilhelmy plate fitted to a KSV-Sigma 701 tensiometer (KSV Instruments Ltd, Helsinki, Finland)). The values obtained for CP films at pH 2.5 and 7.5 were 5.0 ± 0.3 and 2.5 ± 0.5 mN/m, respectively, whereas FB-adsorbed films at pH 2.5 and 7.5 showed interfacial tension values of 9.3 ± 0.4 and 3.5 ± 0.3 mN/m, respectively.
According to
Figure 3A the lower droplet sizes were obtained with CP protein at pH 2.5, despite the higher tension value shown at this pH as compared to pH 7.5. Similar results were found previously for other protein systems, being related with the ability of proteins to cover the overall surface droplet [
32]. In fact, the adsorption kinetics is faster at low pH, as was shown in
Figure 1A and
Figure 2A, leading to faster droplet breakage. In addition, the faster development of the 2D network found at this pH also seems to contribute to protect the interface against recoalescence, which is particular important at the beginning of the emulsification process. Thus, higher interfacial viscoelastic response was related to smaller droplet sizes and stronger interfacial films for the same protein system [
33]. In contrast, the high value obtained for the interfacial tension of FB at low pH seems to be dominant leading to a DSD profile with the highest droplet sizes. In any case, the lower interfacial tension values of CP-adsorbed films as well as its faster adsorption kinetics contribute to obtain lower droplet sizes for CP-stabilized emulsions. The lower values found for the loss tangent of CP-adsorbed layers (data not shown) also contributes to protect the O/W interface against coalescence.
Nevertheless, when comparing DSD profiles for emulsions measured at the same day of preparation (
Figure 3A) with those measured 28 days after emulsion preparation (
Figure 3B), it may be concluded that these emulsions are rather stable regardless of the pH or protein system used. The only exception is the FB-stabilized emulsion at low pH which shows a moderate evolution of the DSD profile towards higher sizes, which may be associated to some coalescence. According to previous studies on O/W emulsions stabilized by protein as the only emulsifier, an average size (D(3,2)) lower than 3 μm would lead to highly stable emulsions [
34]. All the emulsions studied show D(3,2) values well below this value, excepting for the FB-stabilized emulsion prepared at pH 2.5 whose D(3,2) is close to this limit.
These excellent results of emulsion stability, obtained in absence of any stabilizer, are closely related to the gel-like viscoelastic response found for these O/W complex interfaces, since the development of strong interfacial films avoid droplet coalescence which eventually would lead to emulsion destabilization by creaming.
3.2.2. Bulk Rheology
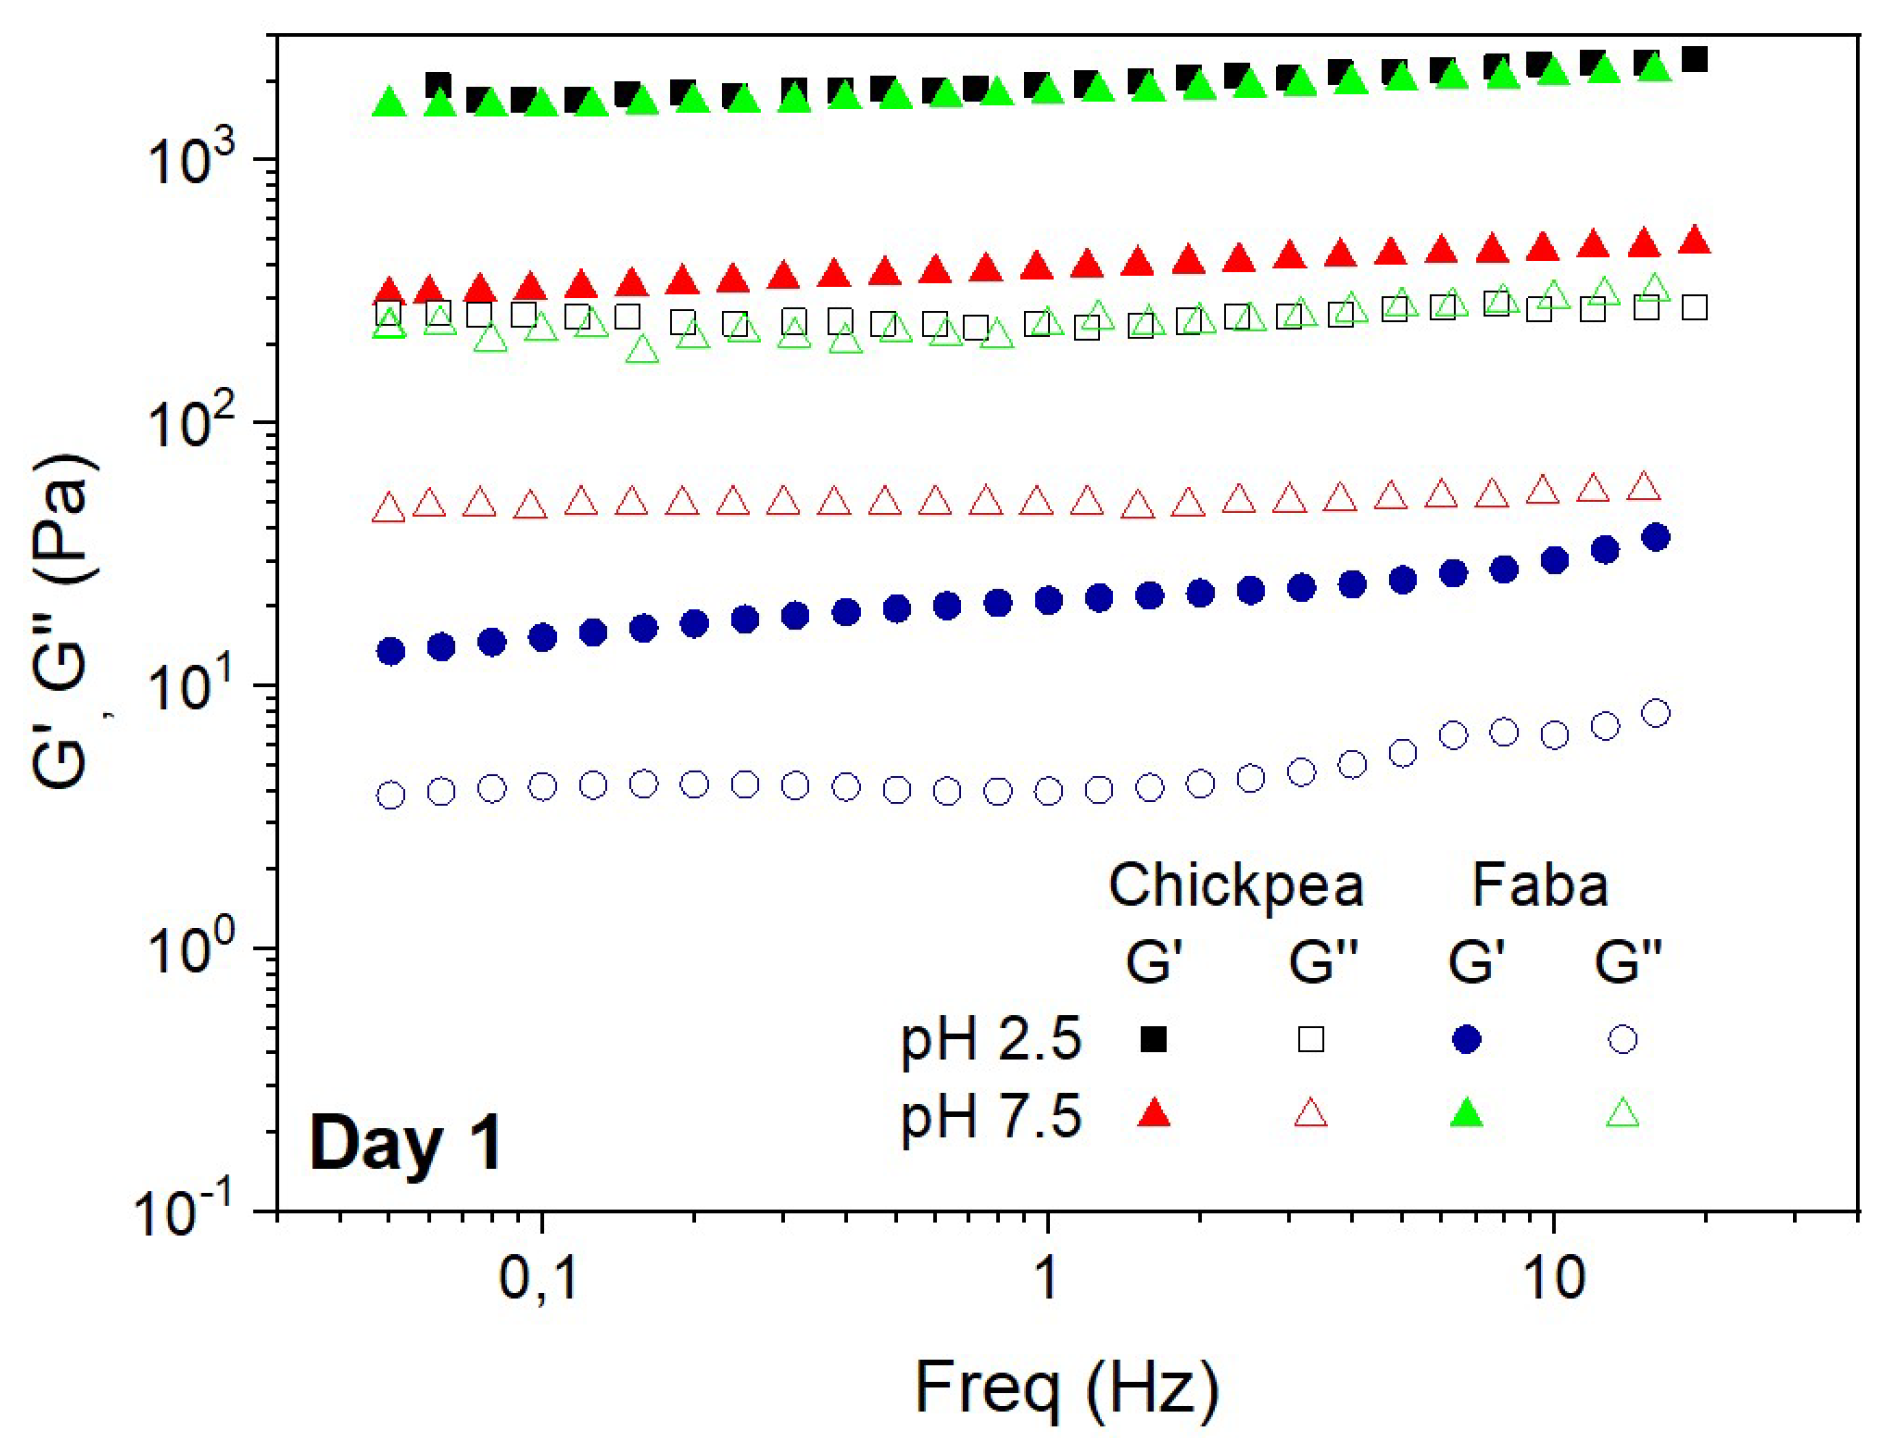
Figure 4 shows the mechanical spectra obtained by means of frequency sweep tests for CP and FB-stabilized emulsions, just the same day after emulsion preparation at two different pH values (2.5 and 7.5). The frequency sweep tests showed that the values of G’ were always above G’’ within the frequency interval studied, indicating that these emulsions have a gel-like behavior regardless of the protein and pH value studied. In agreement with the mechanical spectra obtained from interfacial films, the G’ and G’’ values obtained from emulsions showed a moderate frequency-dependence, which is particularly remarkable for CP-stabilized emulsions at pH 2.5. In fact, this is the emulsion showing higher values for the viscoelastic functions, whose response is typical of a well-developed elastic network. On the other side, the lowest G’ values were obtained for the system stabilized with FB at pH 7.5, which confirm the weakness of the network formed [
35,
36]. As may be observed, CP-stabilized emulsions show higher viscoelastic responses at both pH values. This viscoelastic behavior is similar to the viscoelastic response found for full-fat emulsions stabilized by whey proteins [
37]. This study indicated that the viscoelastic moduli of these emulsions exhibited a soft frequency dependence, whereas the elastic moduli reached a value of c.a. 2000 Pa.
SAOS results for emulsions are generally in agreement with DSD results shown in
Figure 3, where the smaller droplet sizes correspond to the higher elastic moduli, and consequently to the most stable emulsions. Previous studies also found the same relationship between droplet sizes and viscoelastic properties, where the more stable systems correspond to the lower droplet sizes and higher viscoelastic moduli [
38,
39]. However, the viscoelastic properties of the emulsions are also strongly dependent on pH that may have a relevant role on the electrostatic interactions among droplets, thus conditioning the formation of the 3D elastic network.
3.2.3. Back Scattering Measurements
Figure 5 shows Backscattering Δ
BS profiles and results for CP and FB-stabilized emulsions at two different pH values (2.5 and 7.5). Although one of the greatest advantages of these measurements is the prediction of emulsion destabilization in early stages, the profiles obtained for these emulsions are fairly constant after 28 days of ageing, especially for CP-based emulsions. Thus, Δ
BS profiles were calculated in order to elucidate any slight change. These results indicate that only the emulsion stabilized with FB at the lowest pH value shows an apparent change over storage time. This poorer stability has been also observed by analyzing the evolution of DSD profiles. The rest of the emulsions show only very slight increases of droplet sizes over storage time and small slopes for Δ
BS profiles (lower than 0.04), which reflect a good emulsion stability response against coalescence and creaming. This type of kinetic stabilization has been previously found for other emulsions systems, and it is able to provide them quite fairly long-term stability [
40].
4. Conclusions
The results from the interfacial dilatational and shear viscoelastic measurements indicate that proteins are able to form a film with a gel-like behavior at the O/W interface, whose strength depends on the pH value and the type of protein used. Comparing the two techniques it can be inferred that, i-SAOS measurements have shown to be more sensitive to pH modifications and more useful to follow the evolution of viscoelastic properties over protein adsorption.
As for the macroscopic results obtained for legume protein-stabilized emulsions it may be concluded that DSD profiles, which is also strongly affected by pH and the type of protein, depend on the interfacial tension value and on the adsorption kinetics and on the viscoelastic properties of the interfacial film. SAOS and DSD results for legume protein-stabilized emulsions are generally in agreement, where the smaller droplet sizes correspond to the higher elastic moduli, and consequently to the most stable emulsions. However, electrostatic interactions among droplets also promote an enhancement of the 3D elastic network.
A comparison between the bulk and interfacial mechanical spectra of these systems reveals that both the pH of the continuous phase and the type of protein yield analogous effects on their corresponding bulk and interfacial viscoelastic moduli. However, it is also apparent that the changes induced on the mechanical spectra of the bulk are much more remarkable. There is a direct relationship between interfacial and bulk properties, which is more evident for the CP protein concentrate, particularly at pH 2.5. In any case, emulsions stabilized with FB at pH 2.5, at which the highest interfacial tension value was obtained, show the poorest DSD results and emulsion stability.
Moreover, results obtained from emulsion stability seem to agree with the interfacial rheology response of legume protein systems. This is particularly clear for the results obtained from i-SAOS measurements, since dilatational measurements seems to overestimate the solid character of the interface. Therefore, it may be concluded that emulsion stability cannot be solely predicted by interfacial rheology since interactions among droplets may also show a significant contribution on the bulk rheological response.
Author Contributions
Conceptualization, A.G. and C.C.-S.; Methodology, A.R.; Software, M.F.; Validation, A.R. and C.C.-S.; Formal Analysis, C.C.-S.; Investigation, M.F.; Resources, A.G.; Data Curation, A.R.; Writing-Original Draft Preparation, M.F.; Writing-Review and Editing, A.R.; Visualization, A.R.; Supervision, C.C.-S.; Project Administration, A.G.; Funding Acquisition, A.G.
Funding
Please add: This research was funded by University of Seville by a post-doc grant to Manuel Felix (call II.5–VPPIUS)
Acknowledgments
The authors acknowledge the Functional Characterization Service (CITIUS-Universidad de Sevilla) for providing full access to DHR-3 Rheometer.
Conflicts of Interest
The authors declare no conflict of interest.
References
- Sagis, L.; Fischer, P. Nonlinear rheology of complex fluid–fluid interfaces. Curr. Opin. Colloid Interface Sci. 2014, 19, 520–529. [Google Scholar] [CrossRef]
- Fuller, G.G.; Vermant, J. Complex Fluid-Fluid Interfaces: Rheology and Structure. Annu. Rev. Chem. Biomol. Eng. Vol 3 2012, 3, 519–543. [Google Scholar] [CrossRef]
- Lucassen-Reynders, E.H.; Benjamins, J.; Fainerman, V.B. Dilational rheology of protein films adsorbed at fluid interfaces. Curr. Opin. Colloid Interface Sci. 2010, 15, 264–270. [Google Scholar] [CrossRef]
- Romero, A.; Verwijlen, T.; Guerrero, A.; Vermant, J. Interfacial behaviour of crayfish protein isolate. Food Hydrocoll. 2013, 30, 470–476. [Google Scholar] [CrossRef]
- Narsimhan, G. Characterization of interfacial rheology of protein-stabilized air-liquid interfaces. Food Eng. Rev. 2016, 8, 367–392. [Google Scholar] [CrossRef]
- Danov, K.D.; Kralchevsky, P.A.; Radulova, G.M.; Basheva, E.S.; Stoyanov, S.D.; Pelan, E.G. Shear rheology of mixed protein adsorption layers vs their structure studied by surface force measurements. Adv. Colloid Interface Sci. 2015, 222, 148–161. [Google Scholar] [CrossRef] [PubMed]
- Felix, M.; Romero, A.; Vermant, J.; Guerrero, A. Interfacial properties of highly soluble crayfish protein derivatives. Colloid. Surface. A 2016, 499, 10–17. [Google Scholar] [CrossRef]
- Vandebril, S.; Franck, A.; Fuller, G.G.; Moldenaers, P.; Vermant, J. A double wall-ring geometry for interfacial shear rheometry. Rheol. Acta 2010, 49, 131–144. [Google Scholar] [CrossRef]
- Perez, A.A.; Carrera, C.R.; Sanchez, C.C.; Santiago, L.G.; Patino, J.M.R. Interfacial dynamic properties of whey protein concentrate/polysaccharide mixtures at neutral pH. Food Hydrocoll. 2009, 23, 1253–1262. [Google Scholar] [CrossRef]
- Dickinson, E. Interfacial, Emulsifying and Foaming Properties of Milk Proteins. In Advanced Dairy Chemistry—1 Proteins: Part A/Part B; Fox, P.F., McSweeney, P.L.H., Eds.; Springer US: Boston, MA, USA, 2003; pp. 1229–1260. ISBN 978-1-4419-8602-3. [Google Scholar]
- Perez, A.A.; Sánchez, C.C.; Patino, J.M.R.; Rubiolo, A.C.; Santiago, L.G. Milk whey proteins and xanthan gum interactions in solution and at the air-water interface: A rheokinetic study. Colloid. Surface. B 2010, 81, 50–57. [Google Scholar] [CrossRef]
- Tharanathan, R.N.; Mahadevamma, S. Grain legumes—a boon to human nutrition. Trends Food Sci. Technol. 2003, 14, 507–518. [Google Scholar] [CrossRef]
- Du, S.; Jiang, H.; Yu, X.; Jane, J. Physicochemical and functional properties of whole legume flour. LWT-Food Sci. Technol. 2014, 55, 308–313. [Google Scholar] [CrossRef]
- Almeida, G.; Silva, K.; Pissini, S.; Oliveira, A. Chemical composition, dietary fibre and resistant starch contents of raw and cooked pea, common bean, chickpea and lentil legumes. Food Chem. 2006, 94, 327–330. [Google Scholar] [CrossRef]
- McClements, D.J. Food Emulsions: Principles, Practice and Techniques, 2nd ed.; CRC Press: Boca Raton, FL, USA, 2004. [Google Scholar]
- Tadros, T. Emulsion Formation and Stability; Wiley: Hoboken, NJ, USA, 2013; ISBN 9783527647965. [Google Scholar]
- Felix, M.; Lopez-Osorio, A.; Romero, A.; Guerrero, A. Faba bean protein flour obtained by densification: A sustainable method to develop protein concentrates with food applications. LWT-Food Sci. Technol. 2018, 93, 563–569. [Google Scholar] [CrossRef]
- Felix, M.; Isurralde, N.; Romero, A.; Guerrero, A. Influence of pH value on microstructure of oil-in-water emulsions stabilized by chickpea protein flour. Food Sci. Technol. Int. 2018, 27, 555–563. [Google Scholar] [CrossRef] [PubMed]
- Castellani, O.; Al-Assaf, S.; Axelos, M.; Phillips, G.O.; Anton, M. Hydrocolloids with emulsifying capacity. Part 2-Adsorption properties at the n-hexadecane-Water interface. Food Hydrocoll. 2010, 24, 121–130. [Google Scholar] [CrossRef]
- Erni, P.; Fischer, P.; Windhab, E.J.; Kusnezov, V.; Stettin, H.; Lauger, J. Stress- and strain-controlled measurements of interfacial shear viscosity and viscoelasticity at liquid/liquid and gas/liquid interfaces. Rev. Sci. Instrum. 2003, 74, 4916–4924. [Google Scholar] [CrossRef]
- Puppo, M.C.; Speroni, F.; Chapleau, N.; de Lamballerie, M.; Añón, M.C.; Anton, M. Effect of high-pressure treatment on emulsifying properties of soybean proteins. Food Hydrocoll. 2005, 19, 289–296. [Google Scholar] [CrossRef]
- Felix, M.; Romero, A.; Guerrero, A. Viscoelastic properties, microstructure and stability of high-oleic O/W emulsions stabilised by crayfish protein concentrate and xanthan gum. Food Hydrocoll. 2017, 64, 9–17. [Google Scholar] [CrossRef]
- Sánchez, C.C.; Patino, J.M.R. Interfacial, foaming and emulsifying characteristics of sodium caseinate as influenced by protein concentration in solution. Food Hydrocoll. 2005, 19, 407–416. [Google Scholar] [CrossRef]
- Miller, R.; Fainerman, V.B.; Makievski, A.V.; Krägel, J.; Grigoriev, D.O.; Kazakov, V.N.; Sinyachenko, O. V Dynamics of protein and mixed protein/surfactant adsorption layers at the water/fluid interface. Adv. Colloid Interface Sci. 2000, 86, 39–82. [Google Scholar] [CrossRef]
- Pérez, O.; Sánchez, C.; Pilosof, A.; Rodríguez, J.M. chang 2015. J. Colloid Interface Sci. 2009, 336, 485–496. [Google Scholar] [CrossRef]
- Baldursdottir, S.G.; Fullerton, M.S.; Nielsen, S.H.; Jorgensen, L. Adsorption of proteins at the oil/water interface—Observation of protein adsorption by interfacial shear stress measurements. Colloid. Surface. B 2010, 79, 41–46. [Google Scholar] [CrossRef]
- Schwenzfeier, A.; Lech, F.; Wierenga, P.A.; Eppink, M.H.M.; Gruppen, H. Foam properties of algae soluble protein isolate: Effect of pH and ionic strength. Food Hydrocoll. 2013, 33, 111–117. [Google Scholar] [CrossRef]
- Tang, C.-H.; Shen, L. Dynamic adsorption and dilatational properties of BSA at oil/water interface: Role of conformational flexibility. Food Hydrocoll. 2015, 43, 388–399. [Google Scholar] [CrossRef]
- Chang, C.; Tu, S.; Ghosh, S.; Nickerson, M.T. Effect of pH on the inter-relationships between the physicochemical, interfacial and emulsifying properties for pea, soy, lentil and canola protein isolates. Food Res. Int. 2015, 77(Part 3), 360–367. [Google Scholar] [CrossRef]
- Sagis, L.M.C. Dynamic surface tension of complex fluid-fluid interfaces: A useful concept, or not? Eur. Phys. Journal-Special Top. 2013, 222, 39–46. [Google Scholar] [CrossRef]
- Freer, E.M.; Yim, K.S.; Fuller, G.G.; Radke, C.J. Interfacial rheology of globular and flexible proteins at the hexadecane/water interface: Comparison of shear and dilatation deformation. J. Phys. Chem. B 2004, 108, 3835–3844. [Google Scholar] [CrossRef]
- McClements, D. Protein-stabilized emulsions. Curr. Opin. Colloid Interface Sci. 2004, 9, 305–313. [Google Scholar] [CrossRef]
- Dickinson, E. Caseins in emulsions: interfacial properties and interactions. Int. Dairy J. 1999, 9, 305–312. [Google Scholar] [CrossRef]
- Romero, A.; Cordobés, F.; Puppo, M.C.; Guerrero, A.; Bengoechea, C. Rheology and droplet size distribution of emulsions stabilized by crayfish flour. Food Hydrocoll. 2008, 22, 1033–1043. [Google Scholar] [CrossRef]
- Bengoechea, C.; Romero, A.; Cordobes, F.; Guerrero, A. Rheological and microstructural study of concentrated sunflower oil in water emulsions stabilized by food proteins. Grasas Y Aceites 2008, 59, 62–68. [Google Scholar] [CrossRef]
- Bengoechea, C.; Cordobes, F.; Guerrero, A. Rheology and microstructure of gluten and soya-based O/W emulsions. Rheol. Acta 2006, 46, 13–21. [Google Scholar] [CrossRef]
- Liu, H.; Xu, X.M.; Guo, S.D. Rheological, texture and sensory properties of low-fat mayonnaise with different fat mimetics. LWT Food Sci. Technol. 2007, 40, 946–954. [Google Scholar] [CrossRef]
- Pal, R. Effect of droplet size on the rheology of emulsions. AIChE J. 1996, 42, 3181–3190. [Google Scholar] [CrossRef]
- Huang, X.; Kakuda, Y.; Cui, W. Hydrocolloids in emulsions: Particle size distribution and interfacial activity. Food Hydrocoll. 2001, 15, 533–542. [Google Scholar] [CrossRef]
- Dickinson, E. Milk protein interfacial layers and the relationship to emulsion stability and rheology. Colloid. Surface. B 2001, 20, 197–210. [Google Scholar] [CrossRef]
© 2019 by the authors. Licensee MDPI, Basel, Switzerland. This article is an open access article distributed under the terms and conditions of the Creative Commons Attribution (CC BY) license (http://creativecommons.org/licenses/by/4.0/).


