1. Introduction
Construction of fish passes remains the element most often required by environmental decisions issued in Poland. It is one of the later stages in the development of a construction design, and therefore, it remains a stage that includes obtaining an administrative decision for development consent related to the development of hydraulic objects. Verification of fish passes’ efficiency should be an element of the decision; thus, the correct design and development of fish passes is an extremely important aspect of each water management investment.
For a fish pass to fully achieve good efficiency, it must allow for the migration of more than only diadromous fish. On the other hand, the physical parameters of the body and swimming abilities of potamodromous fish are often significantly lower than those of diadromous fish. In the case of weaker specimens (also related to young specimens of Salmonidae), relatively low spurt velocities and shorter times for maintaining their potential during this swimming phase requires the provision of fast passage through the fishway [
1,
2]. Fast and efficient fish migration is therefore possible if the facilities through which they pass are less demanding in terms of energy. The fact that TKE (turbulent kinetic energy) can remain an additional partition for fish has been known for several years [
3]. Liao et al. [
4] noted the reduction in the power used by fish in the presence of turbulence, and the analysis of turbulence remains a significantly important issue and challenge.
One of the most important turbulent flow features is TKE, and it has been discussed in many publications [
3,
5,
6,
7,
8,
9,
10,
11,
12,
13,
14,
15]. The majority of these research works have been related to the pool-type fishway and slot-type fishway. The TKE values themselves are often presented as modified, i.e., normalized, values. This hampers the comparison of characteristics of facilities that vary in type, size scale, or highly modified geometry.
Research on the flow in a pool-type fishway by Silva et al. [
5,
6] was developed using a model, where submerged orifices were applied only. The TKE distribution proved in the research showed that the production of turbulent kinetic energy takes place in the area of main flow only (for the addressed models without additional deflectors). The research results showed that if the orifices are placed on the same side of the partition in the fishway’s channel, the area of high TKE values is significantly higher than that of an alternate arrangement. The highest values, i.e., TKE peaks, were obtained with an alternate arrangement of orifices, but the area of their occurrence was highly reduced. The core of high TKE values occurred at the level of the submerged orifices in both arrangements. The longest TKE core was identified in the case in which orifices were placed on the same side of the partition, and it fully covered the route of the main stream’s flow. The highest TKE production occurred at the bottom. The higher the placement of the measurement spot, the lower the registered TKE values, with minimum values at the water table. In the recirculation area, where one huge whirl structure dominates, TKE production has not been recorded. As an update to Silva’s research, Alexandre et al. conducted a study using the same model [
7]. The obtained results proved the method of TKE production established by Silva et al. [
5,
6]. Nonetheless, the TKE values obtained by Alexandre et al. [
7] for the main stream’s flow were significantly higher than the ones presented by Silva.
The slot-type fishway was examined by Tarrade et al. [
8], Wang et al. [
9], Chorda et al. [
10], and Marriner et al. [
11], among other researchers. The analysis of the standard structure and/or its modification can be found in publications developed by Quaranta et al. [
12] and Pena et al. [
13], as well as others. A characteristic feature of that type of standard construction is the identification of two types of areas in the pool for the flow, i.e., the top flow zone and recirculation areas. The number of recirculation areas depends on the flow structure.
Tarrade et al. [
8], Wang et al. [
9], and Chorda et al. [
10] analyzed the behavior of flow structures after modifications of the fishway’s channel width, including changes to the long drop at the bottom. They proved that the quantity of recirculation zones that form in the flow depends on the inner flow structure. This is strongly affected by a proportion between the fishway’s pool geometry and the fixed width of the migration slot. It was established that if a pool has a huge width (B/b = 9), two recirculation zones are formed, and one main, big whirl structure is located in each of those zones. In the corners of the pool, one can note additional whirl zones; however, they are minor. As proved by analyses of TKE and velocity, additional production of TKE was not noted in those zones (or at the boundaries between them and the big whirl structure), proving that those structures are weak and unstable. For a pool with a huge width, the main flow’s area is slightly longer than the length of the pool itself. Along with the reduction in the pool width—keeping all proportions of the slot—a significant extension of the main flow’s route length is visible. This indicates that, in this scenario, the recirculation area is gradually decreasing, and the huge whirl structure is broken and reduced in terms of its size. In a very narrow channel (B/b = 6.67 and 5.67), the recirculation areas are highly reduced, and only one huge whirl structure can be seen within the entire pool. However, the number of areas containing small whirls increases at pool corners and at the deflector of the long partition’s wall. The researchers also proved that a long drop at the bottom significantly affects the flow conditions. However, it does not affect them as strongly as modifying the geometry affects turbulent flow structures. The increase in the bottom’s long drop strongly affects the increase in velocity values in the fishway’s channel and the increase in turbulence intensity, which leads to a huge increase in TKE production. At extremely high values of the bottom’s long drop (about 15%), the core of high TKE will not only be strengthened, but it will also significantly increase its reach, as the main stream itself becomes a less compact structure, and the size of its flow zone increases along with the increase in the drop’s value. For a huge bottom drop, the area in which extremely high TKE values occur covers almost the entire area of the main flow. It has been generally established that a characteristic feature of the slot-type fishway is the fact that high TKE values occur in the area of the main flow. Whirl areas are the areas in which TKE is not produced.
The aforementioned assumptions were essentially confirmed in the research presented by Marriner et al. [
11]. Their research showed that in a higher pool (No. 5), where lower filling was noted, lower maximum TKE values were recorded, and they were located just below the slot. However, in the case of the pool (No. 15) located in the bottom part of the fish pass, significantly higher filling values were recorded for the facility, and it was noted that maximum TKE values were higher and occurred within a bigger area than those identified for pool No. 5. The research done by Marriner et al. [
11] is valuable because of the scale of the object, which is much more accessible for the comparative study of flow features.
The next research was performed by Quaranta et al. [
12]. In the analyzed cases—namely, the standard construction of a slot-type fishway and a design containing an additional wall arranged perpendicularly to the main partition’s wall—high TKE values were recorded in the area of the main stream’s flow. It was identified that when “a vertical slot fishway” was used with the additional wall, TKE values were reduced in the pool downstream of the partition. Higher TKE values were recorded for the standard structure. For the standard slot construction, it has been found that the main stream’s flow route is shorter, and the area of regular whirls occurs within a greater area than that of a fish pass with modified geometry.
Pena et al. [
13] established that the area of the main stream’s flow in which high TKE values are generated is located over the elevation of the applied sills. Modification of the slot-type fishway’s partition in the form of an additional wall in the partition affects the reduction in both the TKE values and the area in which high TKE values occur (when analyzing the flows with sills).
This paper analyzes TKE distribution in an innovative type of fishway, the so-called bolt fishway (their construction is defined in
Section 2.1). This paper presents the horizontal distribution of TKE. The purpose of the research is to determine the reasons and mechanisms that explain the distribution of the characteristic features of the TKE parameter, which is significant for designing fish passes.
2. Materials and Methods
2.1. Description of the Model
The name of the structure (bolt fishway) is associated with the applied cross-barriers in the facility’s channel. These barriers are entirely different from the partitions of other technical fish passes. Cross-partitions are made of linearly placed cylindrical bolt elements of various heights, thus separating consecutive chambers (pools) of the fish pass. The cylinders are assembled on spindles and can be rotated. The cross-section of the bolt elements gets narrower with height and allows for the formation of diverse flow conditions in the fish pass.
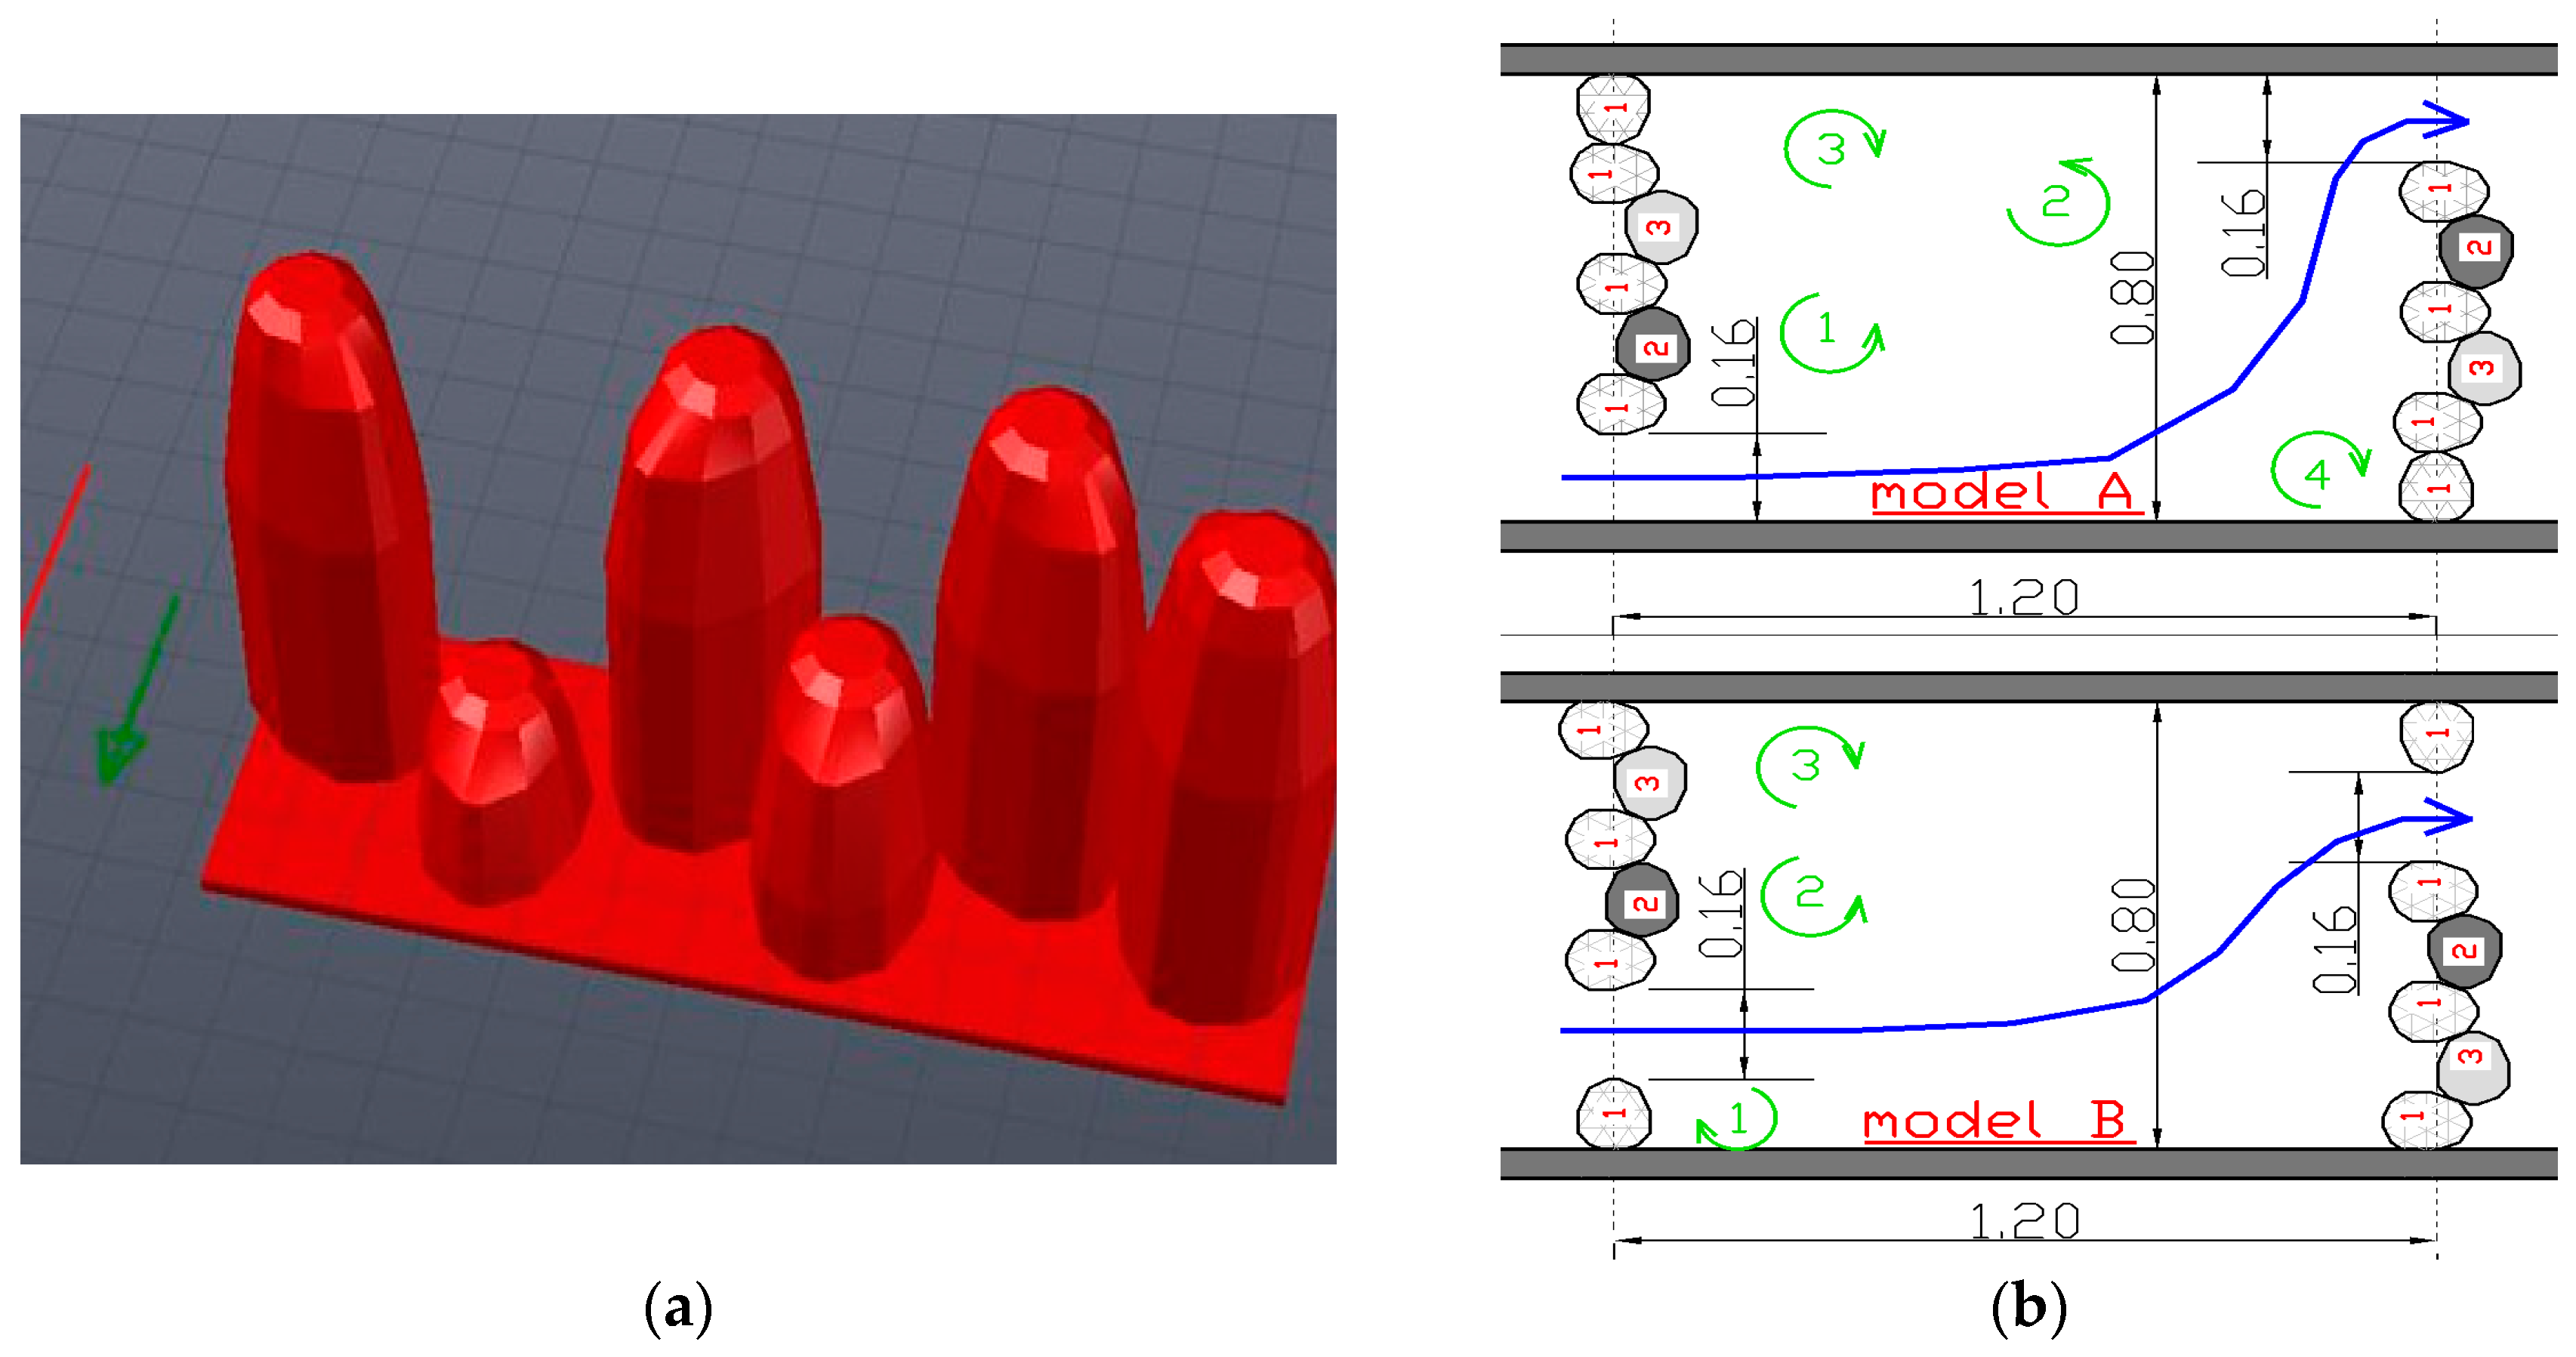
This research was carried out on the basis of two laboratory models—A and B (
Figure 1). A prototype of the solution is model A, which reflects basic assumptions for the construction. Model B is model A with modifications, including the movement of one bolt and, therefore, the movement of the axis of partition for the main slot and for two smaller spillway slots.
Basic assumptions of the bolt fish pass’s geometry (at the actual scale) are as follows: the channel width is 4 m, the length of a single chamber (pool) is 6 m, and the long drop at the bottom is 2%. The designed actual flow is 2.14 m3/s at maximum filling of the chambers to a height of 1.10 m. The width of the main migration slot is 0.8 m. The bolt elements have the following dimensions: No. 1 has a height of 1.3 m; No. 2 has a height of 0.6 m; No. 3 has a height of 0.8 m. The cross-section of all elements is elliptic and has the following diameters: 0.64 m (semi-major axis) and 0.52 m (semi-minor axis). Bolt elements are assembled on steel spindles, and this is why the bolt element can be rotated; therefore, the hydraulic conditions in the facility can be regulated according to the object’s use stage.
Models A and B (
Figure 1) were developed with a linear scale of 1:5, and the remaining parameters are as follows: the width is 0.8 m (inside), and the length of a single chamber is 1.20 m (from the axis of one partition to the axis of another).
The model was developed as a series of eight chambers (pools). The drop at the bottom is 2.0%. Maximum filling of the model’s chambers is 22 cm, and the minimum filling is 20 cm. Bolt elements have the following parameters: No. 1 has a height of 26 cm; No. 2 has a height of 12 cm; No. 3 has a height of 16 cm. The cross dimension is reduced to 12.8 cm for the longer diameter and to 10.4 cm for the shorter diameter. The measuring chamber is located in a central part of the model. The test flow corresponding to the flow probability criterion according to Froude is 38 L/s (the actual flow is 2.14 m3/s).
2.2. Measurements
For the purpose of testing, the three-dimensional acoustic Doppler velocimeter SonTek 16 MHz MicroADV (Xylem Inc., Rye Brook, NY, USA) was applied. The frequency of the measurements was 25 Hz. The length of the measurement at a single spot, measured using a probe, was established through preliminary tests for several spots located within the main flow and within the whirl area. From the collected data, it was established that the value of the second moment stabilizes quite early, and it usually is a series corresponding to a 90 s measurement. The exceptions are the spots located within the area of intensive whirls, where relative stabilization of the measurement was achieved after 300 s. The average value of the velocity for the bolt section in the area of the main flow was stabilized after a duration of 180 s at most. For the whirl area underneath the bolt, regardless of the level of the spot, the minimum required measurement time was 300 s. Therefore, 300 s was adopted as the minimum time for the performance of essential measurements.
WinADV 32 software (version 2.012) was used as a filtration tool, and two types of filters were used: the acceleration method by Goring and Nikora (phase-spatial method) and the minimum SNR (Signal-to-Noise Ratio) rate method (filter of minimum correlation rate). The minimum threshold value for the SNR rate should amount to 5. Both of the series produced a similar quantity of good data, which remained within 82–97%.
Because the distance between the measurement cell and the probe’s head is 5 cm, there were difficulties when measuring the final three spots, which were placed 0, 2, and 4 cm underneath the water’s surface. These additional spots were measured to meet the requirements of Matlab, which was used to develop the results. Spots on a level that was 4 cm underneath the surface of the water (16 cm from the bottom) were measured by placing the probe at an angle, which was enabled by using a rotary handle to fix the probe. Then, the flow was increased, and the measurement of the same spot was repeated but with the probe vertically aligned. After analyzing the results, it was established that the differences in the values of average directional velocities and in their standard deviations were not more than 3%. Therefore, it was assumed that the geometry of the bolt affects the flow parameters more than the distance between the measurement spot and the surface of the water. The spots placed at a depth of 0 and 2 cm below the water table at a filling height of up to 22 cm were additionally measured for the increased flow.
It is important that the increase in flow (up to a height of 25 cm) did not cause flooding of the bolt chamber (height of bolt elements is 26 cm). This is why the stream’s flow character in the model was retained. The active opening in the bolt’s section was not modified at the additional measurement spots, because those levels were placed above the highest parapet of additional spillway slots.
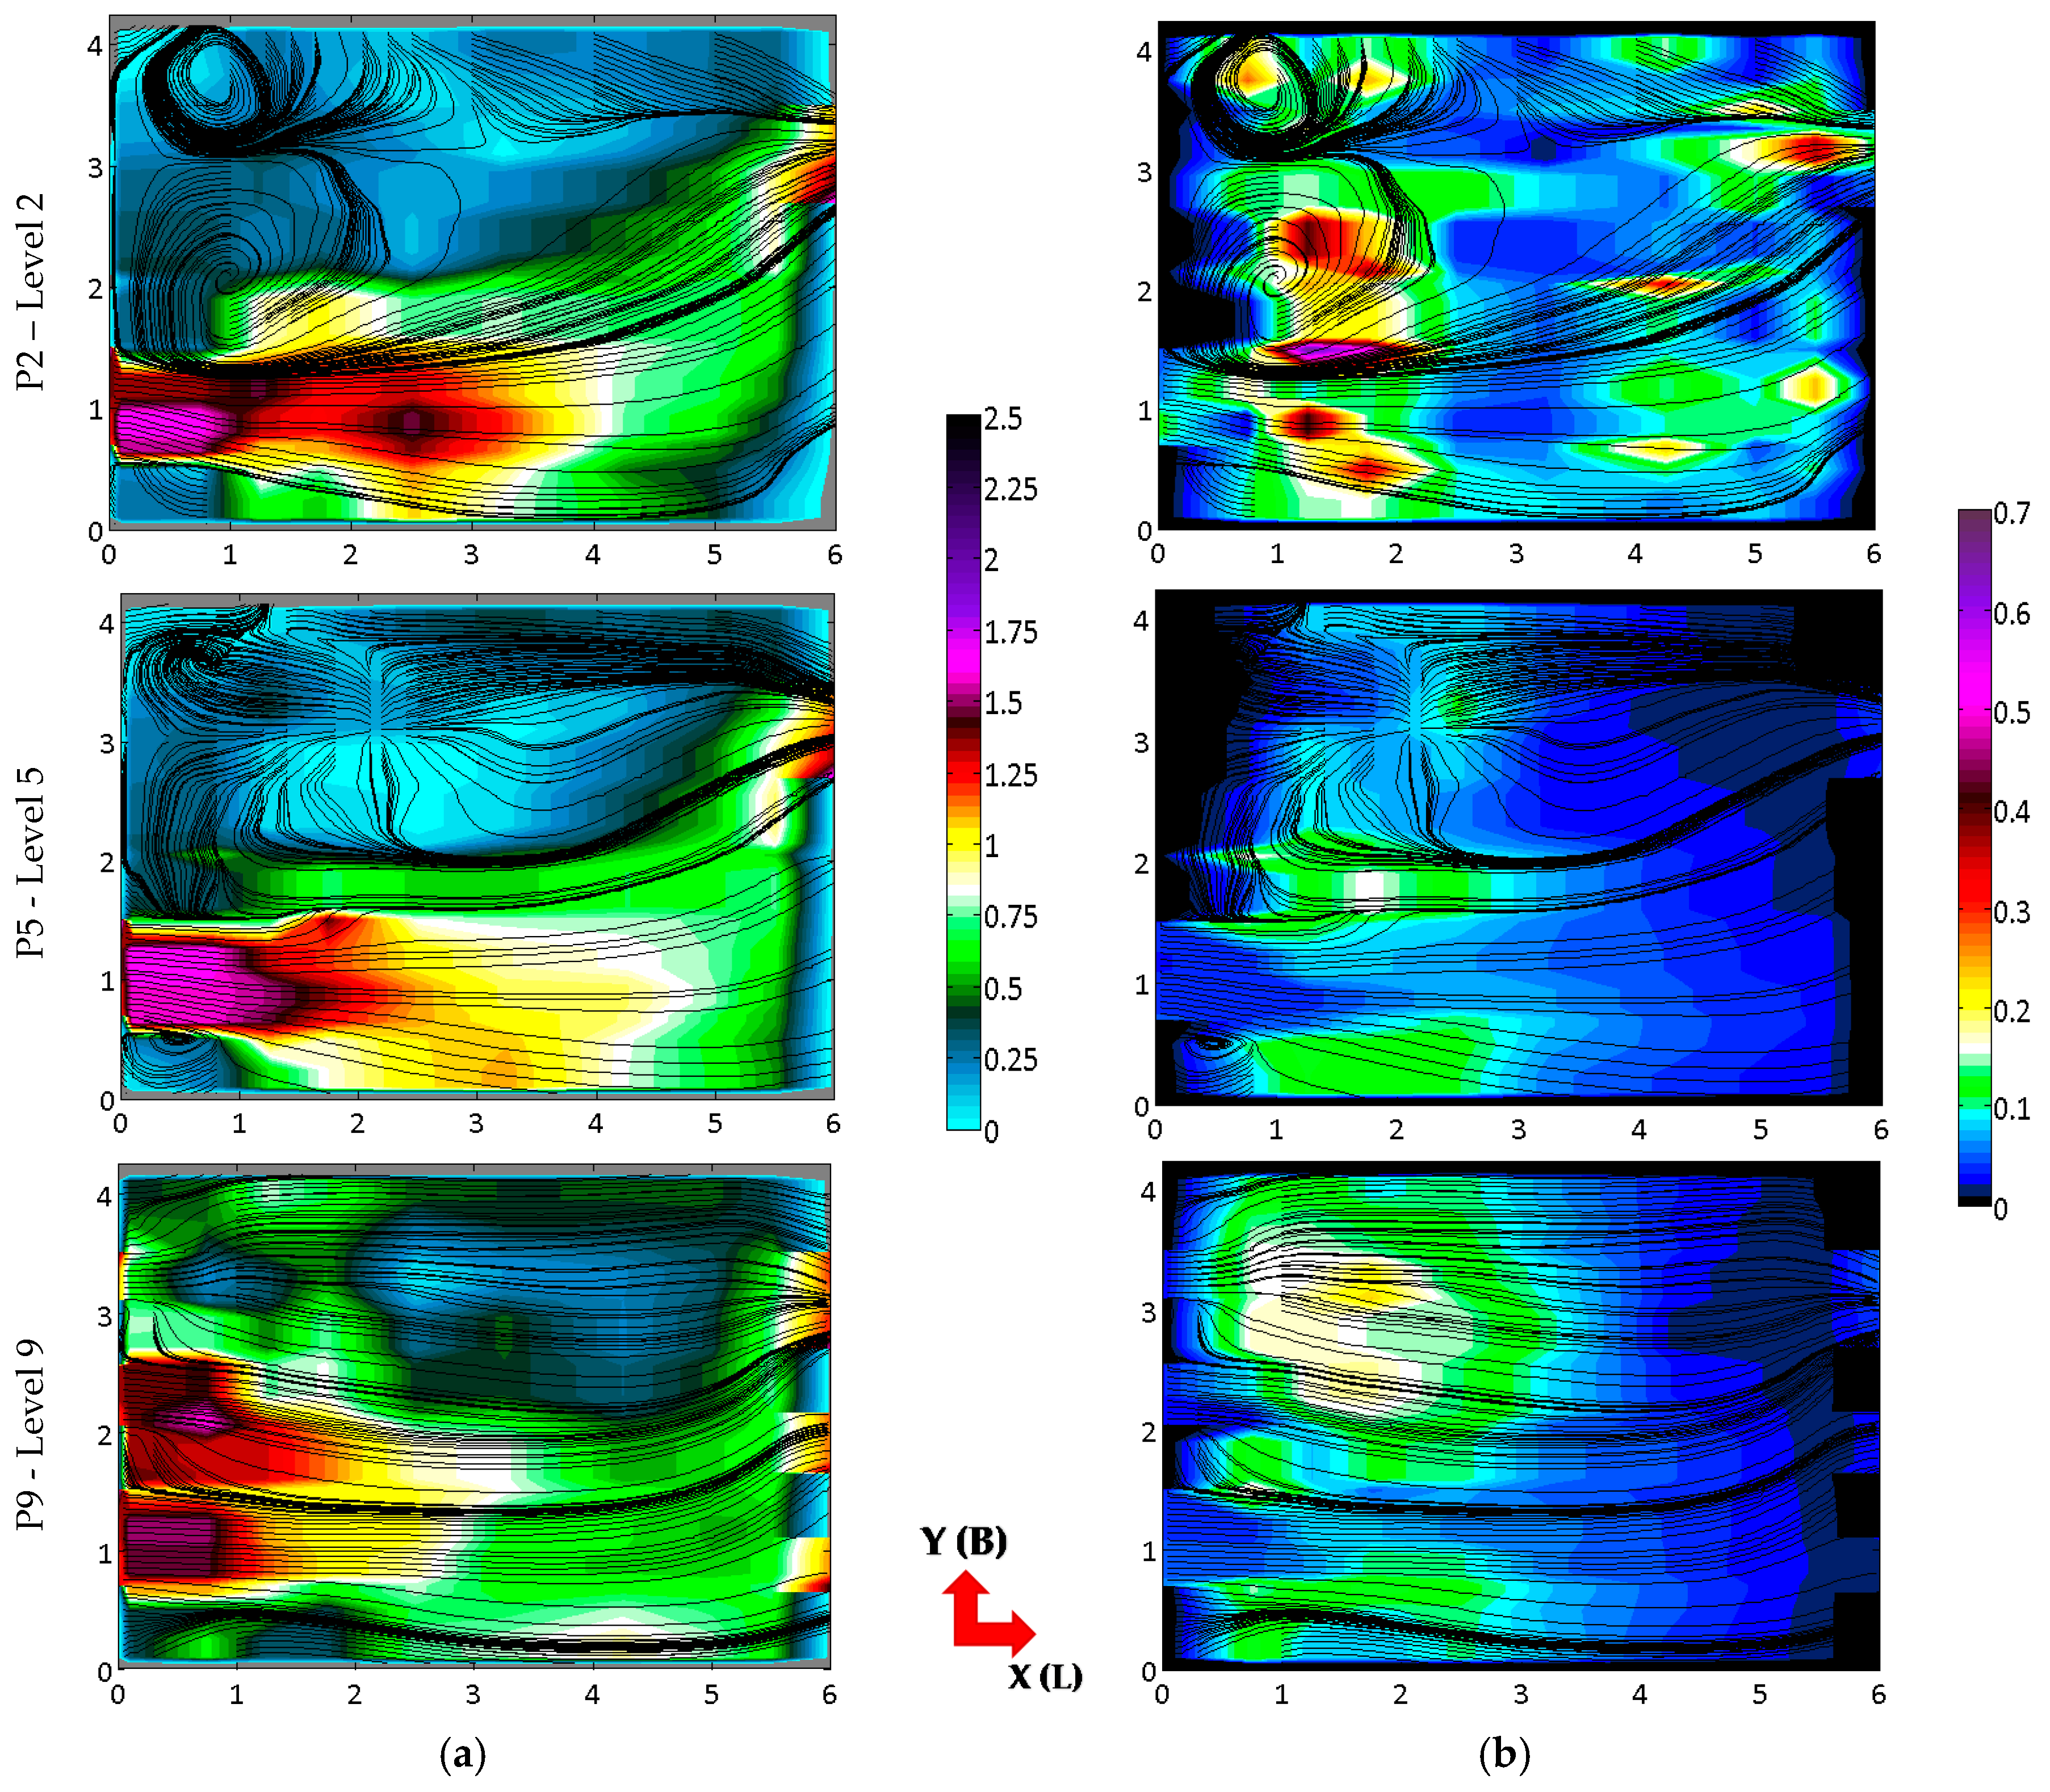
The research presented in this publication shows the horizontal (parallel to the bottom) projection of the flow parameters located at
Level 2, which is 3 cm from the model bottom (15 cm from the bottom at the actual scale);
Level 5, which is 10–11 cm from the model bottom (50–55 cm from the bottom at the actual scale);
Level 9, which is 18 cm from the model bottom (90 cm from the bottom at the actual scale).
Eleven sections were developed during the research, and each section had 18 measurement vertical lines. The research was done at sections with the following spacing (18 measurement vertical lines at each section): section r—0.00 m (bolt at the inlet to the measurement chamber); section a—0.15 m; section b—0.25 m; section bb—0.35 m; section c—0.55 m; section cc—0.70 m; section d—0.85 m; section dd—1.00 m; section ddd—1.05 m; section ee—1.10 m; section rr—1.20 m.
The presented research results for the bolt fishway were obtained from laboratory tests using a physical model developed in the Technical University of Wroclaw.
2.3. Methods of Analysis
For the hydraulic analysis of fish passes, it becomes important to refer to the features and characteristics of turbulent flow. Among the basic motion characteristics for liquid turbulent kinetic energy, TKE (sometimes marked as “k”) remains one of the most important. It is the kinetic energy of a liquid’s volume unit associated with pulsatory motion [
14]. Therefore, the mathematic formula for turbulent kinetic energy is as follows [
15]:
where u′, v′, w′ are longitudinal, transversal, and vertical velocity fluctuations, respectively.
The TKE grossing-up factor amounted to 5.08. In the case of this publication, the research results are reported at the actual scale.
In order to facilitate describing TKE production in the presented horizontal projections of velocity and TKE, we applied auxiliary current lines. As the flow is 3D, the lines, which were based on actual directional velocity values, were often broken. So, a system in which the velocity in the vertical direction assumes a value of 0 was applied. Therefore, the lines refer to a situation in which the research is done for only two flow directions.
A thorough analysis of the 3D structure proved that lines developed in this way are not compliant with the actual flow structure, and in some locations, they provide false projections of the flow structure. This issue is discussed as part of a detailed description of the TKE research results.
The results were developed using Matlab software.
3. Results
In order to facilitate the description of TKE, the diagrams present a view of the current line established for the actual velocity values in the long direction x and the cross direction y. For direction z, a value of 0 was adopted as the velocity. The analysis of distribution features proved that such an approach introduces many mistakes because the analyzed flow is three-dimensional. Thus, omitting velocity as direction z causes the projection of an incorrect flow structure for further levels in some areas. In light of this, the sections were verified on the basis of the three-dimensional flow’s analysis. However, one must consider that the structure presented in this way does not refer to the horizontal structure only where TKE is established. Water streams—both within the main flow, as well as in water-pit areas—often change levels. Therefore, the presented current lines for the 3D structure run for the entire filling level.
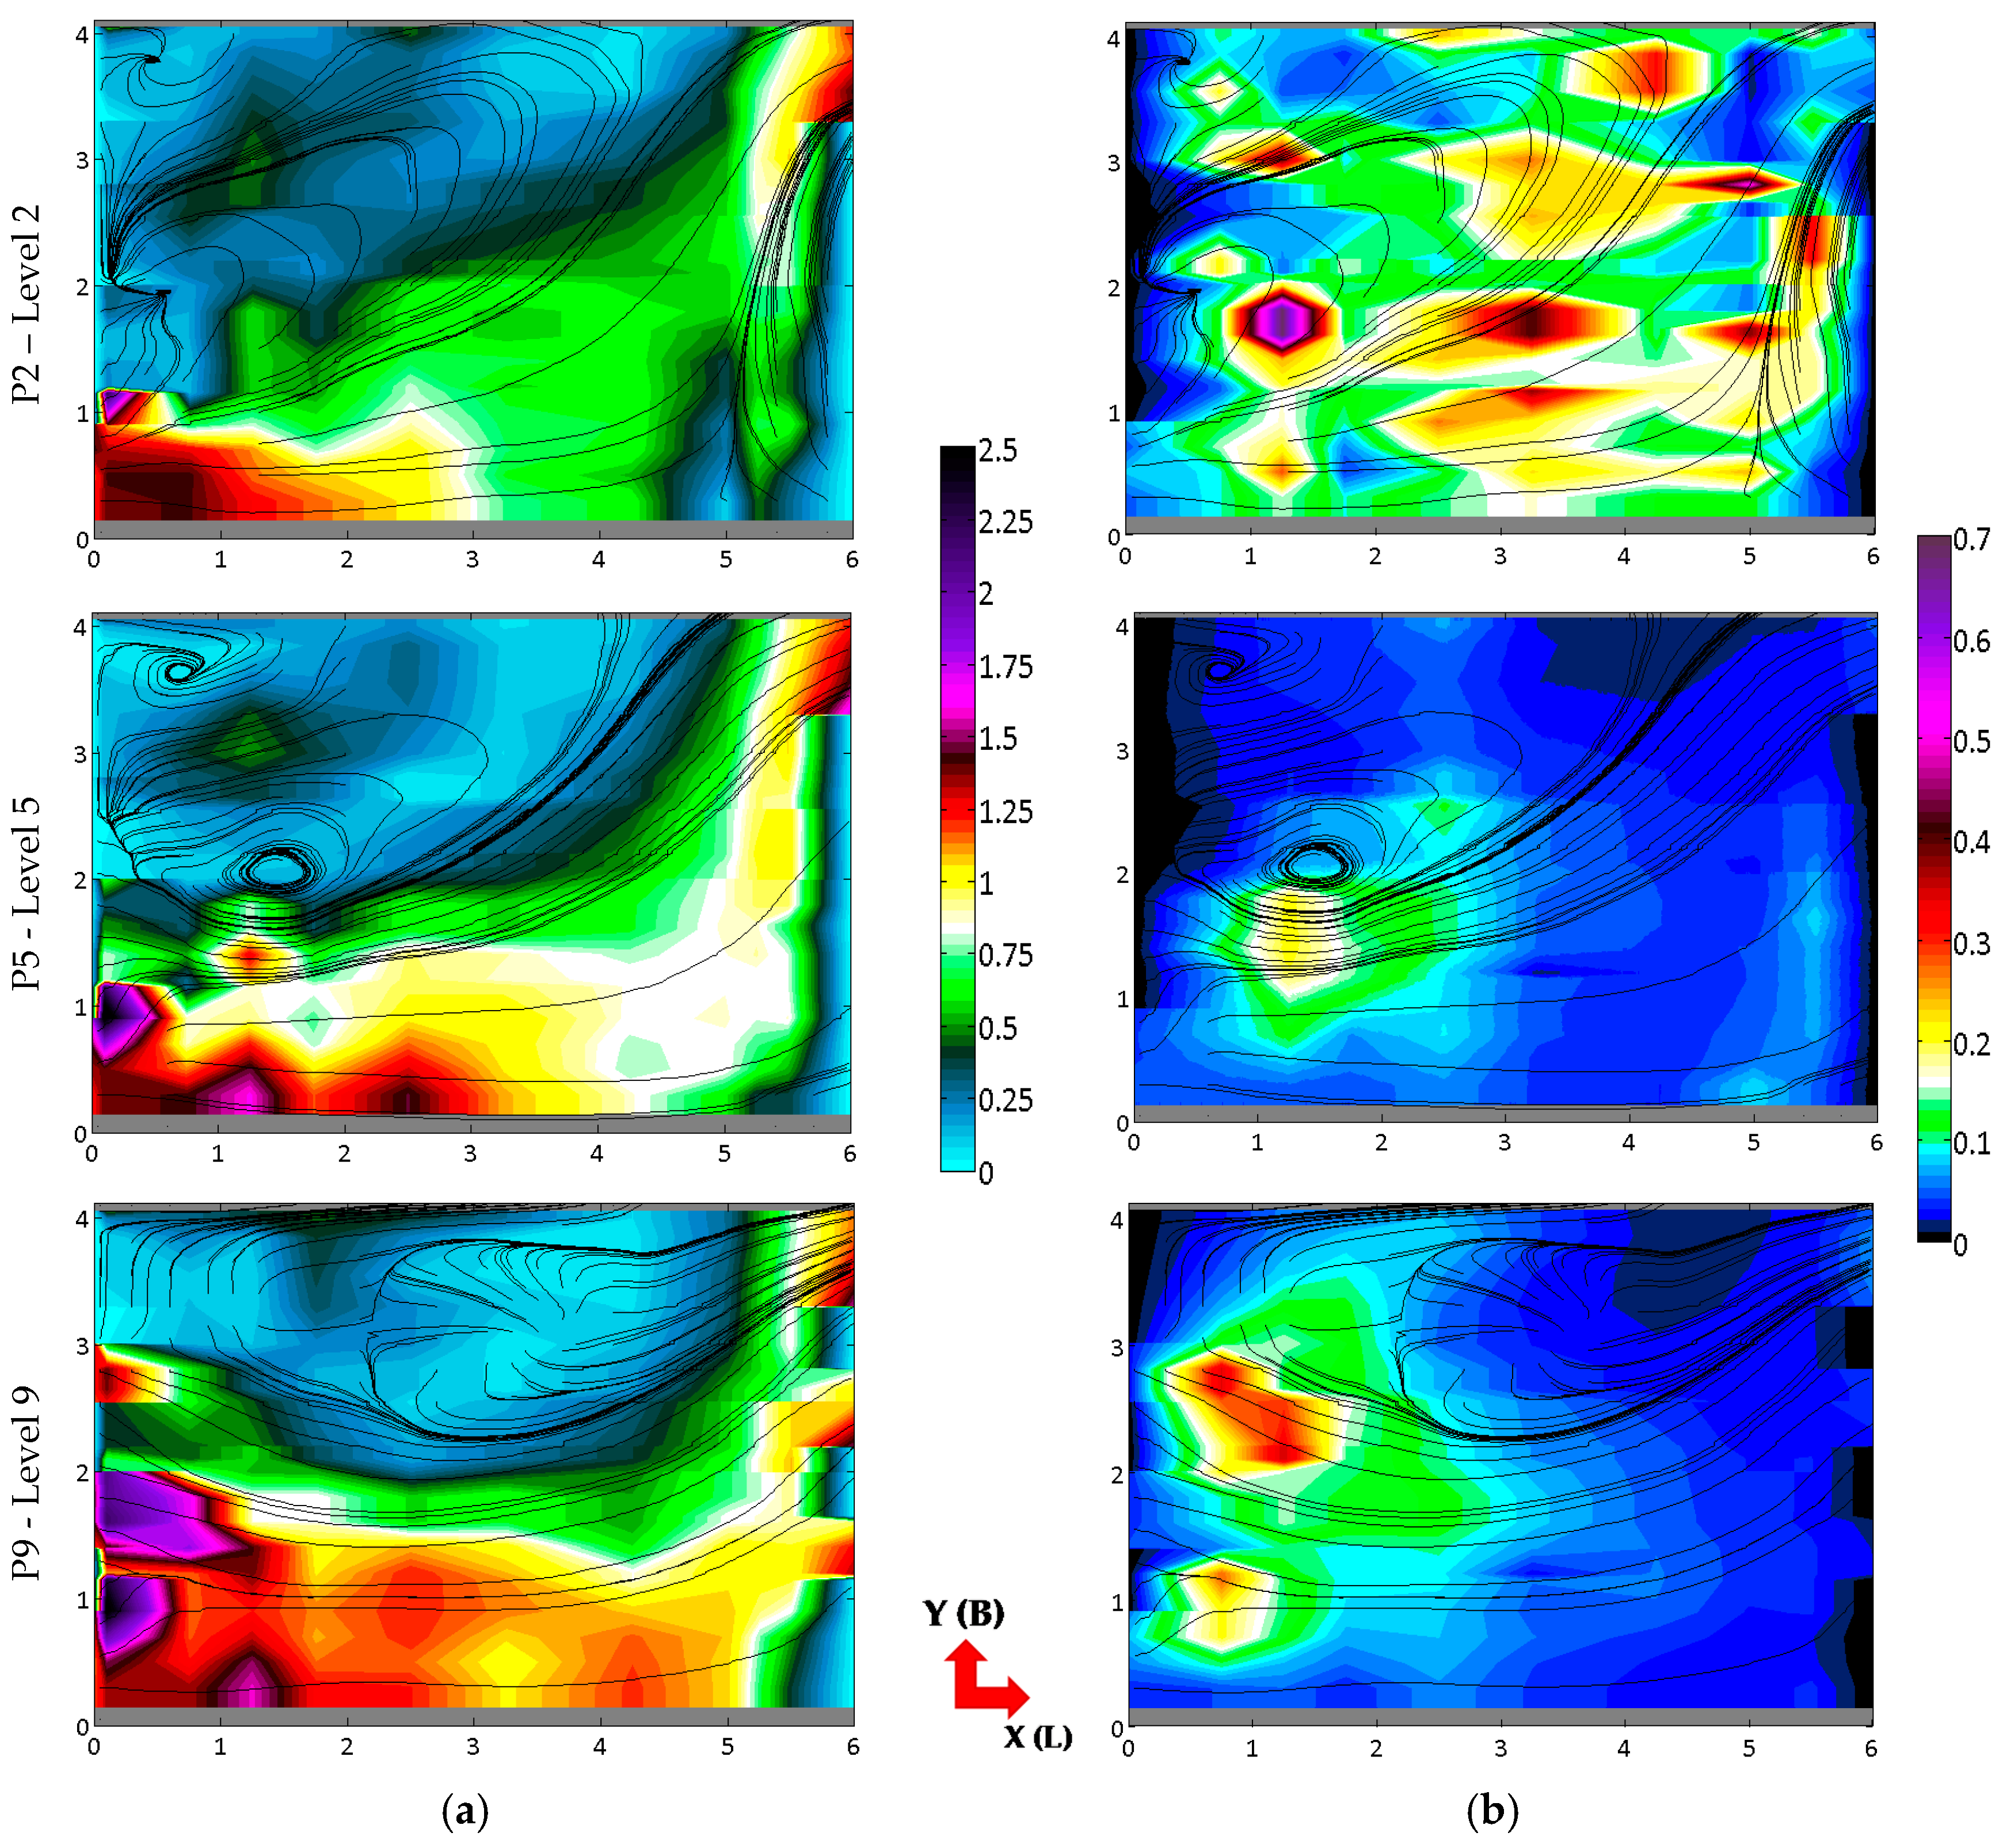
3.1. Model A, Level 2
The case of the Model A, level 2 is shown in
Figure 2.
Two types of water flow are discussed for the analyzed flow: the main flow area and whirl zones (huge one: structures No. 1, 2, and 3; small one: structure No. 4).
In the area of the main flow, at the slot and at its outlet, TKE has a small value of 0.05–0.1 m2/s2. An increase in TKE values was recorded just in the area of cross-section b, located over a length of 1.25 m. The occurrence of intense TKE production in that location is caused by the flow’s main stream hitting the fishway’s bottom in the area spanning a length of 0.5–1 m. This remains a consequence of a rapid decrease in the water table within a length of the slot (as in the case of the spillway), which finally contributes to the formation of a hydraulic jump. This jump is not fully developed; thus, it is manifested through the stream hitting the channel bottom and through the increase in TKE values in that area.
Further on, the main flow’s stream is slightly reduced, which is why the TKE production core (noticeable within a length of 1.25 m) starts to decrease and runs below the established TKE cross-section. As a consequence, TKE values corresponding to water streams located in the top layers of the flow are recorded for the section. It has been proved that such an intense production of turbulent kinetic energy does not occur within those streams, so it is likely related to their greater distance from the bottom.
Streams flowing in the bottom layer (levels 1 and 2) reach the minimum elevation of their location toward the bottom over a length of 2.5–4 m. It is interesting that the decrease in the stream’s elevation does not occur homogeneously within the entire main flow’s area. The minimum placement of streams located in the central part of the main flow’s area is achieved over a length of the chamber (pool) of 4.0 m. As it gets closer to the whirl area, the location of the maximum decrease in the stream’s elevation moves toward the inlet bolt. This is why the main flow area’s stream located at a width of 1.5–1.8 m achieves its minimum elevation value at a location just over a length of the chamber (pool) of 2.5 m.
The proximity of a rough bottom results in the stream gradually breaking down, which is accompanied by an intense production of TKE. It is interesting that the main flow’s stream is not homogeneous, i.e., it is being defragmented and separated. Lengths of 3–3.5 m with extreme TKE values are sections through which the cores of streams flow up, within which TKE is being produced. Zones of lower TKE values are streams with negative vertical velocity values, i.e., parts of streams flowing toward the bottom.
The extreme for the flow in the vicinity of the water-pit zone is higher, because the stream experiences a huge impact from the whirl surrounding the entire water-pit area. That whirl has the smallest diameter at the bottom. In higher layers of the flow, the external structure surrounding the whirl area extends its volume (diameter). Therefore, the area located at a width of 1.5–2 m is located underneath an inclined wall of the whirl structure surrounding the whirl zone. This structure causes additional pressure: i.e., it presses the stream flowing in the bottom zone and results in a greater breakdown of the stream; thus, it increases the production of TKE to 0.42 m2/s2.
Further locations of extreme TKE values are visible over a length of 5 and 5.5 m. However, at a length of 5 m, the increase in TKE is recorded within a huge area, over a width of 0.75–1.75 m. For a width of 5.5 m, the increase in TKE was recorded in the area of 1.75–2.6 m. The location of these extreme values is related to the geometry of a bolt partition. It was determined that a deflection of the stream in front of the window of the additional slot with a higher spillway parapet occurs slightly farther from the partition (over a length of 5.0 m) compared with the location of the slot with a lower spillway parapet.
Areas of high TKE are characterized by a positive value of velocity in the vertical line. However, areas of vertical negative water flow velocities occur just before them. The length of these areas is consistent with the length of areas of local extreme TKE values. This means that the top-flow stream just in front of the wall of the bottom bolt partition hits the mass of water collected underneath the partition. As a result of the clash, streams deflect from the bottom and rise. This is confirmed by an analysis of the 3D flow structure. The area located just below the bottom bolt partition does not actively participate in the main stream’s flow, and discharge of water from structure No. 4 is located there. This discharge is parallel to the wall toward the main migration slot. Therefore, the main flow’s streams flowing into that area undergo a hydraulic jump and are routed to the top layers of the flow area, i.e., to additional spillway slots or to the main migration slot.
The final extreme value for the main flow’s area is located over a length of 5.0 m and a width of 2.8 m. In that area, the stream flowing to the migration slot is affected by structures located underneath the partition. Because of the strong discharge of water from the structure located underneath the bolt and the additional discharge of water from the main stream deflected from that structure, there is a narrowing of the flow area for the water at the outermost bolt element of the partition, resulting in a rapid increase in velocities at that location. As a consequence, streams located over a length of 5.0 m at the width of the outermost bolt element are highly dammed and reach the main slot below the elevation of the bottom shelf of an additional slot.
For the whirl area, the TKE peak is located over a length of 1.0–1.5 m and a width of 1.5–2.0 m. It is a place where the whirl zone is fed by the main flow. The mass of water flowing down from additional slots forms a bend in the whirl area, i.e., a surrounding whirl. In the peak area, the surrounding structure rises rapidly. A stream feeding the whirl area flows through a window from the area of the main flow. A strong interaction between the streams provides not only a high peak of TKE values (the highest in the entire chamber) but also a specific distribution of Reynolds stress. It is interesting that in the area of the peak’s occurrence, an area of negative vertical velocities was identified. In most of the previously described TKE peak values, there were positive vertical values. It seems that this is related to the fact that the production of TKE is a consequence of friction between the streams and the rough bottom of the fishway’s channel. An exception is an extreme value located in the feeding zone in the area of the hydraulic jump. TKE production in those areas is likely not a consequence of the impact with the rough bottom but of the mutual impact and friction of consecutive stream structures between each other in the flow area.
Another huge area of TKE production takes place over a length of 2.25–4 m. It is the second feeding area for the whirl area. That location, where a part of the stream of the surrounding structure (on the left) is torn away, is routed against the essential direction of the stream’s flow in the fish pass. Therefore, the bottom secondary current is the feeding unit in that location. It is a place where the secondary current is rapidly lowered and hits the bottom. It is pressed to the bottom by the inclined structure of the higher layers of the water band. Deflection of the stream occurs at a width of 2.5–2.6 m. Further on, at a width of 2.6–3.25 m, the stream rises to the flow area again, but it hits the bottom and causes the partial breakdown of the stream and increases the production of TKE.
Higher layers of the surrounding structure’s water are located over a width of 3.4–4 m and over a length of 3.2–4.2 m, and they hit the channel wall. After impact, the stream is torn and kicked up locally to a level as high as 0.9 m from the bottom. A consequence of the stream branching is a local peak of TKE with a value of 0.3 m2/s2. A part of the stream is routed just below the wall to the whirl area, and another part is routed to the bottom migration slot.
While following the route of the back current feeding the whirl area, one can identify an area of intensified TKE over a width of 3.9–4.05 m and over a length of 2.1–3.3 m. In that area, the back current scours off of the external wall of the channel. Because of the impact with a rough surface, TKE is intensively produced in the stream area, but it is not at its peak. After streams of the secondary current deflect from the wall, production of TKE stops. However, after passing through the subsequent part of the flow’s route, the stream again faces the strong impact of hydraulic resistance. That resistance is caused by the clash of two flow structures over a length of 1–1.5 m and a width of 2.9–3.2 m. The clashing structures are the secondary current on the external side of the channel’s wall and the streams of the bottom secondary current, which directly feed the whirl area from the surrounding structure. The clashing structures are broken down again farther along the course, over a length of 0.75 m. However, part of the stream over a width of 3.3–3.8 m feeds whirl structure No. 2, whereas a part of the stream located over a width of 2.9–3.3 m (additionally) feeds whirl structure No. 1. The breakdown of the stream in that area provides a TKE peak located in a layer below the section shown. In the TKE section for level 2, only the top of the area of high TKE production is visible in the reach of the stream already routed to feed the structures (thus two smaller areas of higher TKE).
3.2. Model A, Level 5
The case of the Model A, level 5 is shown in
Figure 2.
Analysis of TKE distribution on the level of section No. 5 proves that there is no significant difference in the values or occurrence of areas of high TKE between the area of the main flow and the area of whirls. One can generally state that TKE values for the discussed level are relatively low in both types of flow areas, and they do not exceed 0.1 m2/s2.
The most important information is the fact that the main flow’s stream flowing from the migration slot in the partition on level 5 has low TKE values that range from 0.03 to 0.045 m2/s2.
On a horizontal section, there is only one area of intensified TKE production. The area is located over a length of 0.8–2.4 m and a width of 0.6–2 m. The center of the area, with the highest value of TKE = 0.21 m2/s2, is located in the area of section b (1.25 m). The section of level 5 is about half of the average filling height for the chamber, below the elevation of the lowest bolt’s shelf. Intensified TKE production occurs far from the bolt partition’s wall. Furthermore, that area has no additional deflectors, which would be able to break the water stream flowing through that area. Therefore, production of TKE is not caused directly by a counter-reaction between the flow area and construction elements of the fishway’s channel. For the indicated location, in the section on level 2, the occurrence of a feeding location for the whirl area was identified. On level 5, the feeding area of the whirl is not present. From a 3D analysis of the flow structure, it was identified that a huge concentration of water with different flow characteristics is located in that spot. The simultaneous impact of the stream from the side of the main flow’s area and the impact of the water from structure No. 1 is noticeable over the indicated length of increased TKE. It is important that those structures do not directly clash with each other. The structures are hit over the same length as the whirl surrounding the whirl area (fed mainly by waters coming from additional spillway slots).
The water from structure No. 1 powerfully striking the surrounding whirl is most likely caused by phenomena occurring in the layers of water located just above level 5. So, a strong stream flowing from the slot with a lower spillway parapet directly hits whirl structure No. 1., and this causes partial defragmentation of the stream. The essential part of the stream flows onto the crest of whirl No. 1 and thus breaks it down. As a result of hitting a side wall of whirl No. 1, the remaining part of the stream spilling from the slot is initially routed toward the bottom. Then, the stream deflects from the mass of water collected below. This is why in the area of an outlet from a huge additional slot, one can see a field of high negative values of vertical velocity over a length of 0–0.7 m.
After analyzing the 3D flow structure, it was established that the area at which TKE peaks occur is just at the foot of the spot with high negative values. This observation means that the spilling stream hits the flow structures located below, after which it deflects from the structures quite rapidly; afterward, the spilling stream softly flows toward the flow’s bottom. The hit may be identical to with not finally developed hydraulic jump. A bend in the curve of negative velocity values is accompanied by a rise in TKE.
This is why the highest production of TKE takes place within the whirl surrounding the whirl area.
Furthermore, a part of the stream flowing from the huge additional slot presses against the whirl and additionally pulls it down. This contributes to the increase in velocity values for lower layers of the whirl structure, and it also strengthens the power of a strike to the whirl and the surrounding whirl.
One could assume that high TKE production remains as a result of the mutual impact of the following three elements:
The stream hitting the surrounding whirl from the side of the main flow’s area;
The mass of water from structure No. 1 hitting the surrounding whirl, pressed by water breaking the crest of that whirl above (additional hydrodynamic pressure);
The hydraulic jump in the water of the surrounding whirl’s structure, within which the highest TKE production occurs.
Production of TKE exceeds the core of the surrounding structure and spreads on both sides of its occurrence.
3.3. Model A, Level 9
The case of the Model A, level 9 is shown in
Figure 2.
The indicated section is located above the highest parapet of the second additional slot. The impact of both of the slots on flow features has been discussed in a different publication.
For the purpose of establishing the reasons for the occurrence of fields of high TKE values, it is important that there are no regular whirl structures on this level, and the layer flowing on that level covers and hides the flow structures located on lower levels, bearing a series of consequences.
It can be generally stated that within almost the entire area of the main flow, the flow has low TKE values, which could also be related to the slot’s section. Low TKE values occur in the slot and just at the outlet from the slot in a range of 0.02–0.075 m2/s2. However, while analyzing the TKE distribution within the entire section of the slot, one can see that in the layer at the surface, the highest TKE values are recorded for hydraulic vertical lines.
The majority of the whirl area is also characterized by low TKE values (not exceeding 0.1 m2/s2). However, a diagram of TKE shows two quite large areas with high TKE values.
The first area is located in the boundary zone of the main flow and of the whirl area over a length of 0.3–1.6 m and a width of 0.5–1.3 m. Nonetheless, the center of the area is located in a spot defined with a length of 0.65–0.85 m and a width of 1.05–1.25 m. The location of the center is a spot at which two streams clash: one is from the area of the main flow, where the stream bypasses the outmost bolt element with huge speed; the other stream flows from the biggest additional slot. A strong counter-reaction, i.e., a clash of waters having different directions and flow intensities, results in the reduction in the potential of both structures through the production of TKE at the line of their contact. A field of high TKE values exceeds the area of the clash of the discussed flow structures. Production of TKE is moved toward the main flow’s area. In that space, one can see a field of high vertical velocity values; however, the vertical velocity reaches its highest values in the space between the section of the main migration slot and the zone located over a length of 0.6 m. At the spot to which high TKE production is moved, rapid braking of the main area’s streams was identified. The described situation can therefore be identified as the generation of a hydraulic jump that is not fully developed. It is interesting that for the lower levels—No. 2 and 5—the location of the jump is similar. However, both of the diagrams located below (levels 2 and 5,
Figure 2) are in a space below the spillway shelves. For level No. 9, which is placed over both of the shelves of the additional spillways, one can see that the jump moves noticeably toward the outlet from the slot, i.e., upstream of the stream.
Another huge area of peak TKE values is located within the whirl structure. The main reason for the generation of extreme fields of TKE values in section 9 is the impact of the stream flowing from the second additional spillway slot. The essential elevation of the inlet bolt’s parapet for that slot is 0.8 m from the bottom of the fishway’s chamber (level of placement in the model—0.9 m).
Therefore, over a length of about 0.6 m and a width of 2.6–3.0 m, the stream flowing from the slot hits the secondary current from the whirl area, flowing straight to the inlet bolt’s slot on a level higher than the shelf elevation. The secondary current is characterized by a huge growth in positive vertical velocities. It flows to the clash area from the external wall of the channel. The secondary flow is broken down as a result of this clash. Part of the water from the central part of the secondary stream is immediately turned back toward the top, where—after a vertical spin within the clash axis—it comes back at the surface zone toward the fishway’s outlet bolt (to the bottom of the chamber).
Part of the secondary stream—that part fed with water from the slot—hits structure No. 3 located underneath the external wall of the fish pass. As the dispersed secondary current hits the central part of whirl No. 3, the water collected in it is separated. So, streams of structure No. 3 flowing to the clash area at its elevation deflect and—after a vertical jump—turn back in a surface layer directly toward the outlet bolt. Streams of structure No. 3 flowing to the clash area at lower elevations (below the clash area) are accelerated and thrown against the wall of the inlet bolt. Then, they bypass the area of structure No. 3 just at the external walls of the bolt part and of the channel, and—along the external wall in the surface area—streams are routed to the outlet from the fishway’s chamber. The breakdown of structure No. 3 on the level of the discussed section is not accompanied by intensified production of TKE.
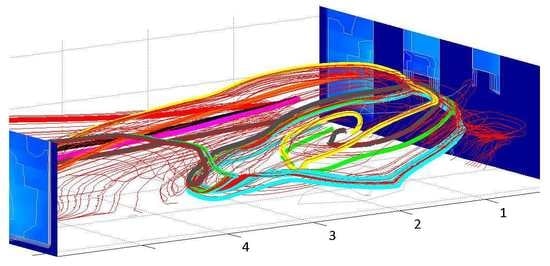
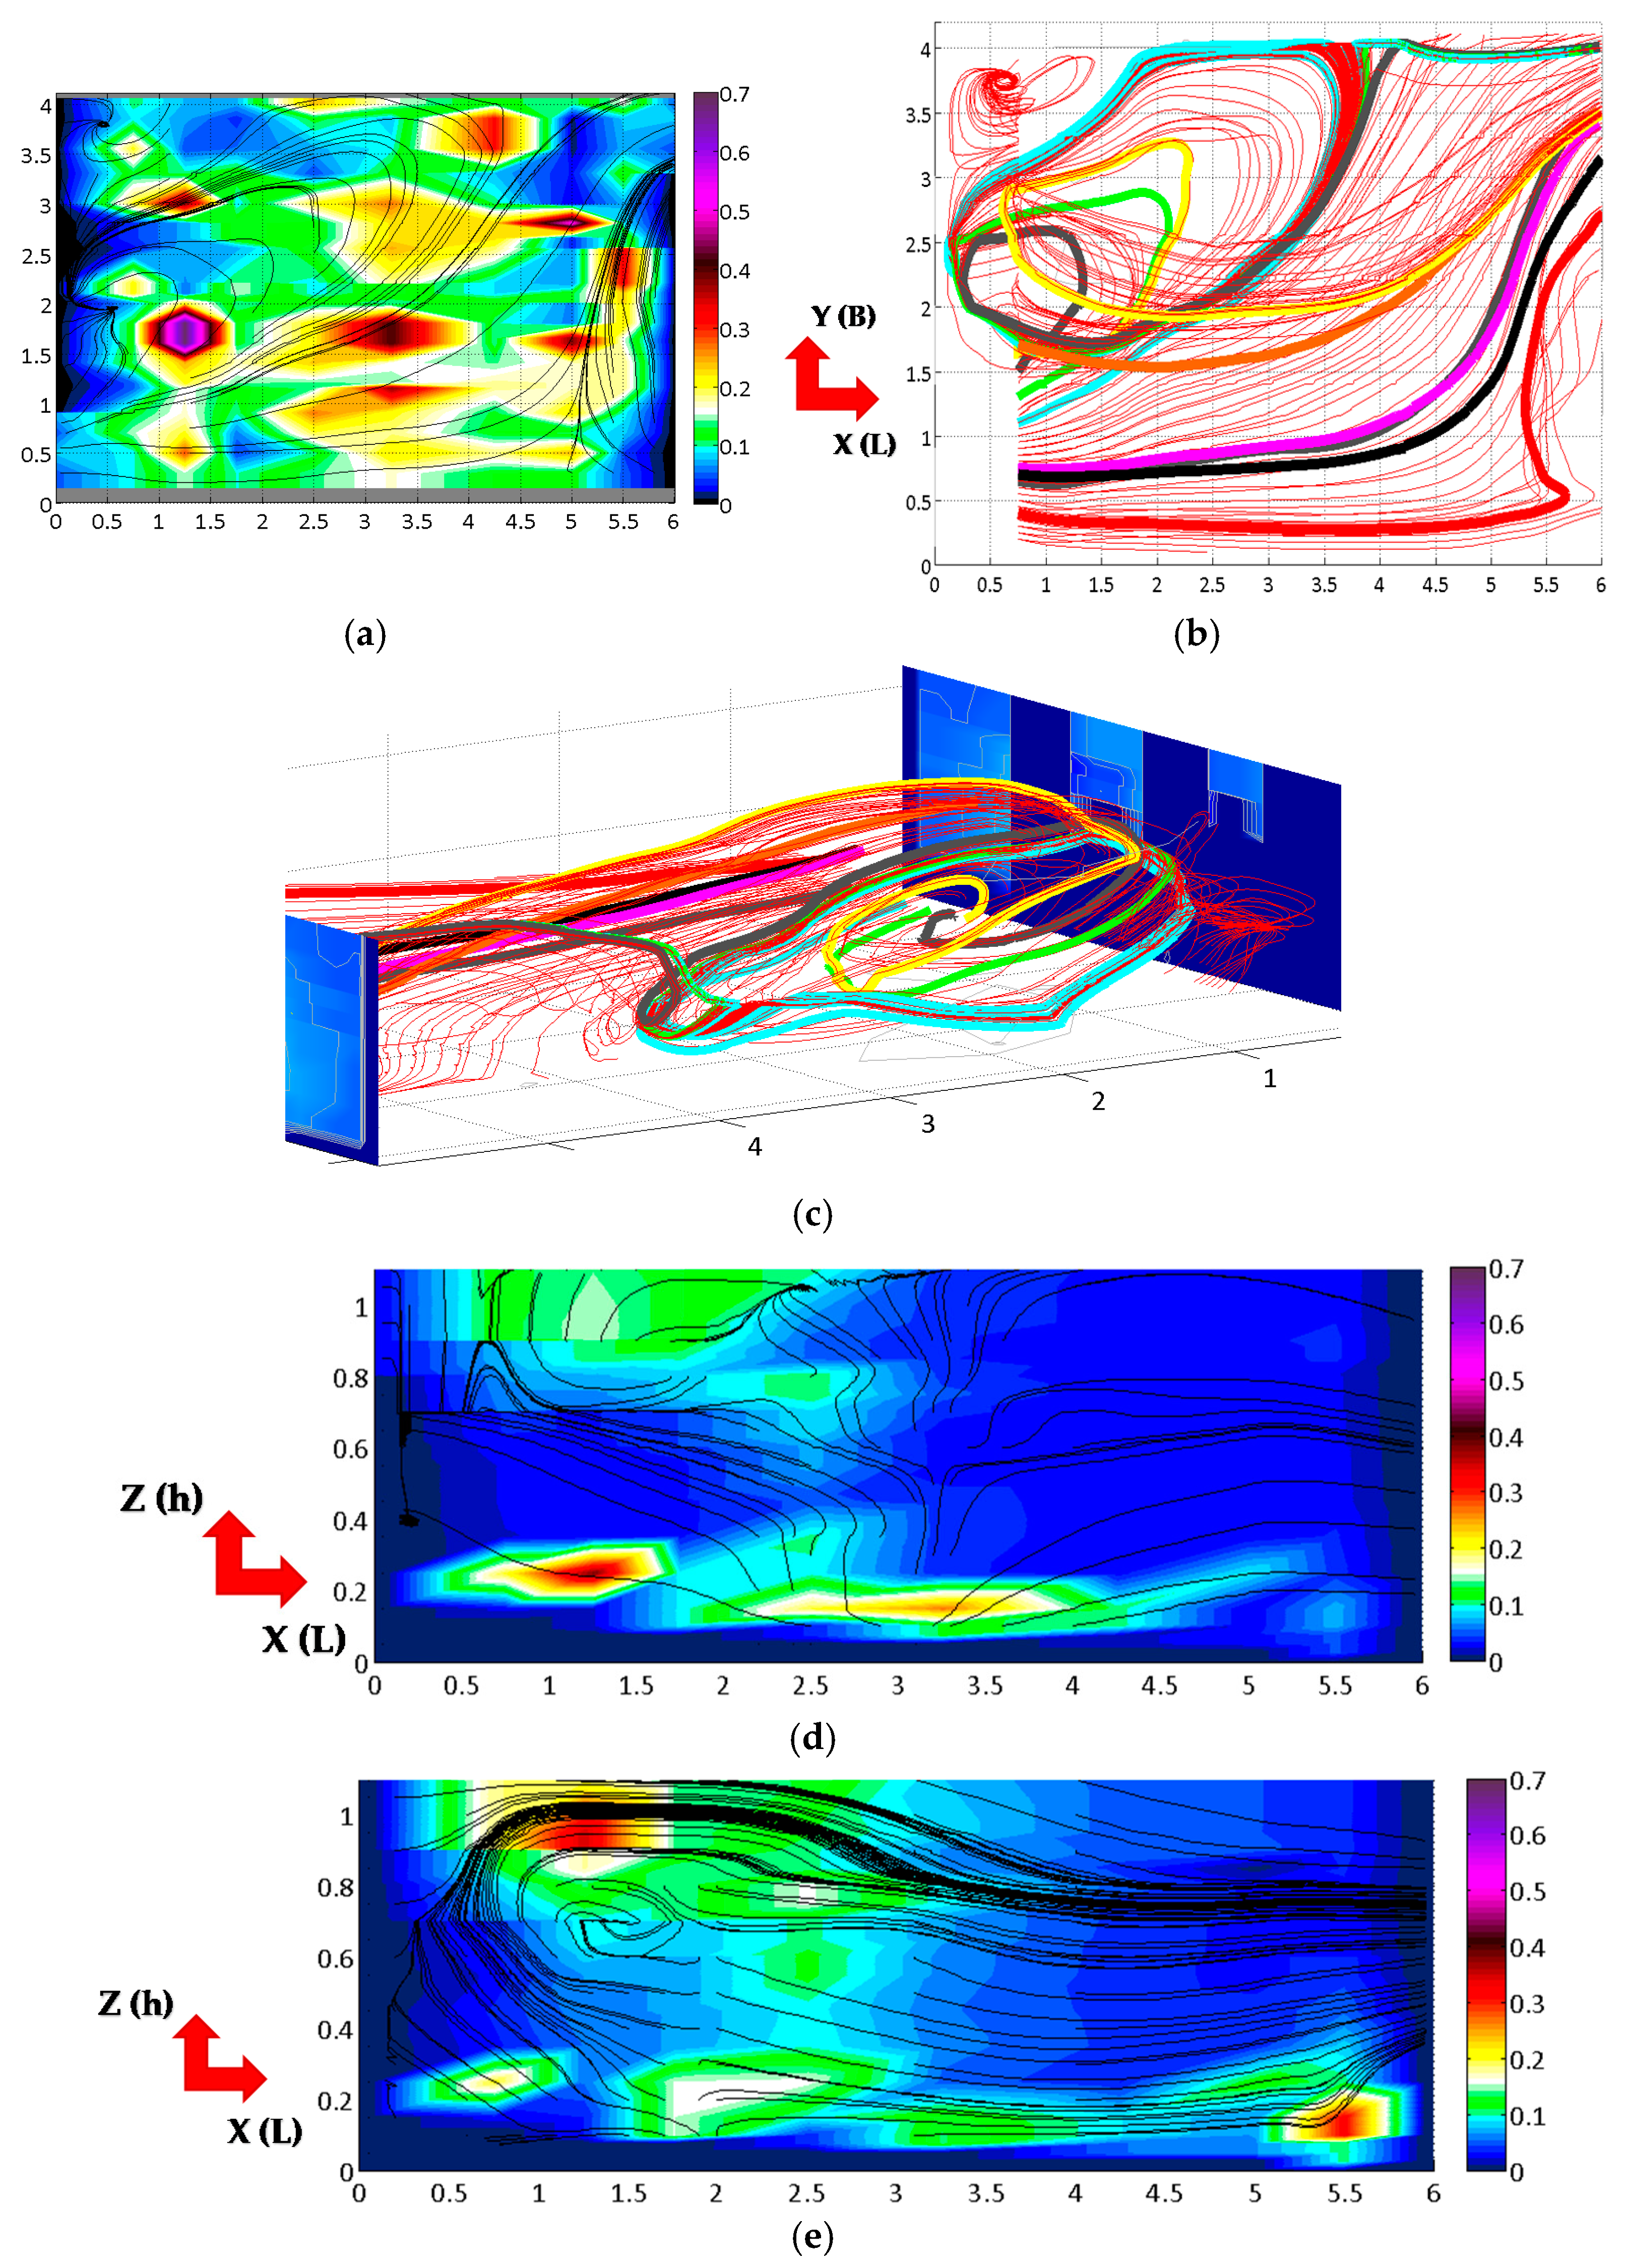
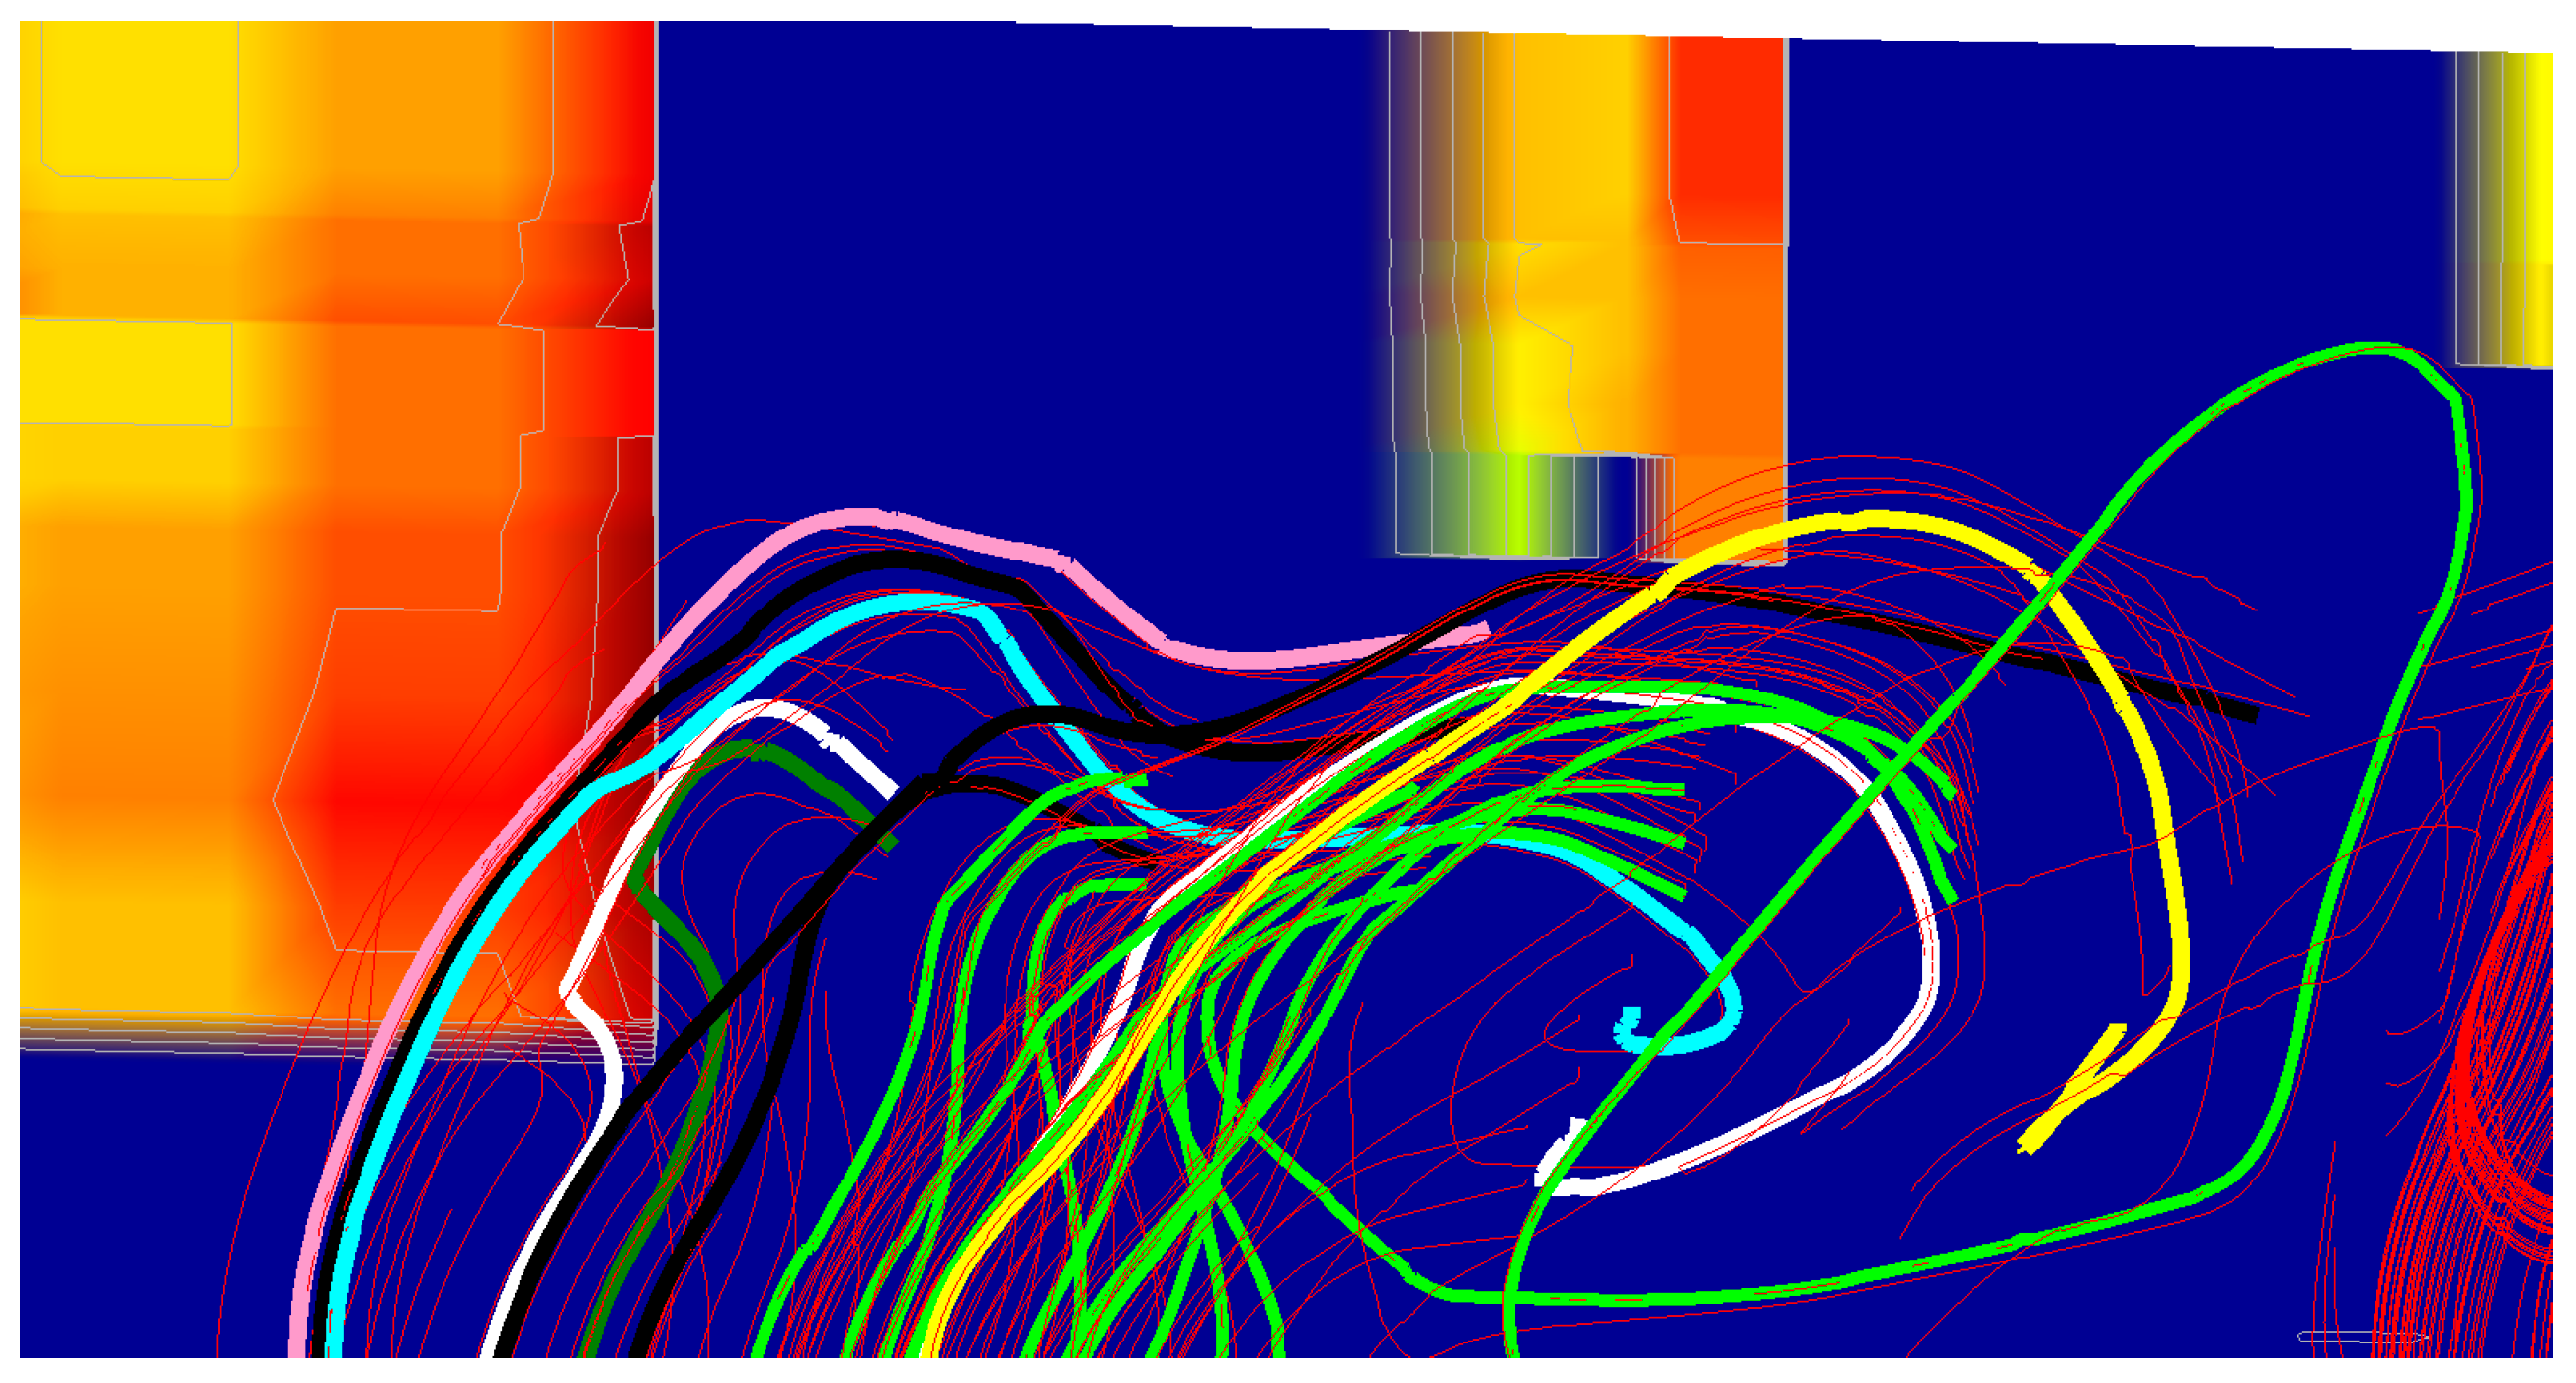
Further, part of the water from the secondary stream—the biggest of all—hits structure No. 1. Because of the clash, water coming from whirl No. 1 forms a specific dam of water on a crest of the stable part of the whirl (
Figure 3d,e). A stream made of the joined waters of the secondary current and water from the slot strongly affects the shaft’s structure. The stream clashes the head part of the shaft, and the impact, which is on a level above the elevation of the spillway slot’s parapet shelf, causes a high production of TKE. The route of flow for that stream runs in a direction that results from the flow directions of the constituent streams. It is identical to the area in which the highest TKE values = 0.3 m
2/s
2. Behind the area of maximum TKE, the streams are dispersed and the flow elevation is reduced, which—in conjunction with the gradual reduction in high energy production—causes a significant reduction in TKE in the section on level 9 (with a noticeable effect on the space of section c). Reduction in TKE remains within the range of 0.1–0.15 m
2/s
2 and occurs over a length of up to 2.9 m. Further on, production of TKE stops.
An interesting structure can be seen in the section of level 9 in the back part of the whirl area. There is no intensive TKE production within that structure. The shown structure is an effect of water from the surface layer bypassing whirl structure No. 3 (i.e., the whirl located in higher flow layers).
3.4. Model B, Level 2
The case of the Model B, level 2 is shown in
Figure 4.
As proved by the 3D flow structure, a small modification to the geometry results in huge changes to hydraulic flow conditions inside the fishway’s chamber (pool). It is interesting that in the case of model B, the differences in the projection of current lines between flat lines (for vz = 0) and the 3D model are not that big. It is therefore sufficient to apply the flat current lines marked on the TKE projections to the hydraulic analysis for model B.
A huge area of high TKE values can be seen in the area of top flow, below the outlet from the main migration slot. However, one can identify two separate streams in that area, and they have different TKE value distribution characteristics. The essential area of TKE production is located over a length of 0.9–1.7 m and a width of 0.7–1.1 m. A small field of negative vertical flow velocity values is present just before the peak on the slot’s side. Analysis of the 3D structure proves that the area of the TKE peak is located just behind the spot of the vertical jump from the bottom of the streams of the main flow. For model A, it is the spot at which the hydraulic jump occurs. Therefore, the area of high TKE values is located in the space of positive vertical velocity values, and there remains a trace of the dispersing stream. This stream has lost some of its potential because of the counter-reaction between the stream’s water and the rough bottom of the channel.
Another part of a huge field of high TKE values is located over a length of 1.1–2.3 m and a width of 0.25–0.8 m. Another peak occurs in the indicated area, and it is a section for the stream’s core. It is a trace of the stream flowing in a flow layer located below that is feeding the area of whirl structure No. 1. It flows just at the bottom, where it overcomes the resistance of the subbase, which results in a partial decay of the stream. Intensified production of TKE within that stream is visible from the edge of the slot, through section a (0.75 m), and up to the occurrence of the peak for the discussed area.
Two subsequent peaks are located (1) over a length of 3.8–4.5 m and a width of 0.6–0.75 m and (2) over a length of 5.25–5.7 m and a width of 1–1.4 m. The two areas have a similar topology for forming mechanisms. Both fields are placed in an area of positive flow velocities, and the reason for their generation is the damming of the stream from the bottom area (where streams rub the channel bottom) toward the slot with a higher spillway parapet.
Another extreme occurs over a length of 3.6–4.25 m and a width of 1.9–2.1 m. In that area, the 3D flow structure shows the area of water discharge from structure No. 2. Only negative values of vertical velocity are present within that area. However, a thorough analysis of the 3D flow structure proves that streams flowing from whirl structure No. 2 at a level of 0.3–0.35 m drop to the bottom in this area. Further on, they tightly adjoin to it and are routed to the outlet—the main migration slot. Therefore, the shown field is a section through the streams within which intensified TKE production occurs. The production of TKE in that location itself remains a consequence of the stream’s friction against the bottom, and it leads to a fall in potential while the stream is being partially dispersed. Two other huge peaks of TKE values are present in the area of the outlet from the fishway’s chamber (pool). The first peak is located over a length of 4.5–5.9 m and a width of 3–3.35 m. This extreme value occurs where the water is discharged from the main migration slot and partially from whirl structure No. 2. The second peak is placed over a length of 4.5–5.5 m and a width of 3.45–3.65 m. This is an area of water discharge from structure No. 3 (also partially fed by water from structure No. 2). Both peaks need to be considered together, because, within the space of the outlet from the fishway’s chamber (pool), the flow area rapidly narrows for both of the previously indicated streams. As a consequence of that narrowing, a very strong concentration between these flow structures can be seen in that area.
Within a width of the chamber equal to 3.4 m, those two streams strongly clash. As a result of this strong clash between streams, very strong grooving of the bottom was noticed. Therefore, the recorded peaks remain parts of the streams, which—after deflecting from the clashing plane of water—lose a part of their potential. High production of TKE is the effect.
From analyzing TKE in the whirl area, one can observe that a stream with a width of 1.3–1.5 m flowing from the whirl area has been thrown out from the whirls. The dense structure of whirl No. 2 is located over a width of 1.5–3.05 m. At a width of 3.05–4.2 m remains a location for whirl No. 3. The mentioned widths are appropriate for a section over a length of 1.0 m.
Thus, in the whirl area on the side of the inlet bolt of the chamber, a field of high TKE values was recorded for the entire chamber of model B. This field is located over a length of 0.8–2.4 m and a width of 1.35–1.6 m. The maximum TKE is 0.65. It is a place at which the bottom feeds structures No. 2 and 3 from the main flow’s area. The main stream flows from the bottom just below whirl No. 2. The stream is torn in that spot. Part of the water (over a length of 1.5–2.4 m) bypasses whirl No. 2 in the bottom zone and directly feeds whirl structure No. 3.
The remaining part of the feeding stream that continues flowing over a length of 1–2.15 m and a width of 1.6–2.7 m flows (while rubbing the bottom) directly to whirl No. 2. The area where TKE reaches 0.42 m2/s2 is a spot where the feeding stream jumps from the bottom zone to higher layers of whirl structure No. 2. Therefore, it provides a section through the stream’s core, which—as a result of the impact of the rough channel bottom—lost its stability, and its potential was reduced because of very high TKE production.
The final two peaks (length 0.4–1.1 m, width 3.6–4.15 m; and length 1.5–2.1 m, width 3.65–3.9 m) are present within whirl structure No. 3. The reason for their occurrence is also a counter-reaction between the flowing water and the adjacent rough bottom of the fishway’s channels.
3.5. Model B, Level 5
The case of the Model B, level 5 is shown in
Figure 4.
Analysis of the cross-section for level 5 proves that areas of the main flow and of the water-pit flow are significantly different in terms of distribution of TKE. The area of top flow is characterized by the absence of intensified energy production areas along the main stream. The stream has a high potential; thus, in the slot and after leaving it, the stream does not disperse. Therefore, such a model of flow is less demanding in terms of energy for migrating fish. The main flow’s stream flowing from the migration slot in the partition on level 5 has low TKE values in the range of 0.02–0.04 m2/s2, similar to model A. Production of TKE is also very low on the route of the main stream’s flow. In this case, TKE varies within the range of 0.01–0.08 m2/s2.
In
Section 5, however, there are several areas of higher TKE values. The first of such huge areas is located over a length of 0.45–2.7 m and a width of 1.4–2.25 m. The main reason for the formation of this area of huge TKE production is the deformation of whirl No. 2. The deformation remains a consequence of the stream—flowing from the longer additional slot—hitting whirl structure No. 2. The parapet of the slot is located at a level of 0.6 m from the bottom. The spilling stream drops onto the whirl over a length of 0.4–1 m and a width of 1.9–2.15 m. The 3D structure proves that a huge groove/gutter is formed in the whirl crest (on a level of 0.6 m from the bottom), and its depth is about 0.1 m (
Figure 5). Therefore, water whirling in the whirl, reaching a level of 0.6 m (over a width of about 3 m) will be routed to the main area (in accordance with the whirl’s rotation), where it is hit by the stream. As a result, they are knocked out from whirl structure No. 2 and thrown to the main flow’s area (in the lower parts of the flow) or over the top. The crest of whirl No. 2 is reduced, and on level 5, it is contained within the chamber’s width of 2.2–2.3 m up to 3 m. The crest slants (is reduced) toward the area of top flow. Production of TKE occurs within parts of the stream that are transferred from whirl No. 2 (mainly in the area of the formed gutter).
Furthermore, over a length of 1.6–1.9 m, the stream’s potential is additionally reduced. The reason for that phenomenon is the clash of water thrown from whirl No. 2 with a strong stream of the main flow. Where does it come from? Water thrown from the whirl area (over a length of 0.4–1.6 m and a width of 1.4–1.55 m) is routed to the zone of main flow while occupying some space at the boundary zone. In that area, the main stream is slightly moved to the central part of the main area, and it is subsequently deflected and—over a length of 1.6–1.9 m—it hits the structures of water flowing from the whirl area. Therefore, the visible (especially on higher levels) intensified TKE production remains a consequence of overlapping those two elements.
Another huge field of intensified production is located on the opposite side of the main stream. This is a location neighboring whirl No. 1. An analysis of the reasons that the field forms is impossible using only 2D current lines. However, an analysis of the 3D structure reveals interesting deformations in the structure, and they directly affect the obtained TKE values. So, at a level of 0.5–0.9 m from the bottom of the fishway’s chamber, just after whirl No. 1, a hydraulic jump is formed. The jump can be seen in the area of the stream that bypasses whirl No. 1 on the side of the main flow’s area. As proved by the 3D structure, the jump is additionally strengthened with water spilling over structure No. 1. The junction of those two streams causes a diagonal form of the jump. The impact of the jump against the structure located below occurs over a length of 0.8–0.9 m. Therefore, high TKE values remain a consequence of the stream’s loss of potential from bypassing whirl No. 1. The loss is caused by high hydraulic resistance within the route of the stream’s flow. Production of TKE is noticeable over a stream length that reaches about 2.7 m. In some areas, it exceeds the reach of the bypassing stream.
3.6. Model B, Level 9
The case of the Model B, level 9 is shown in
Figure 4.
The TKE values obtained in the main section are lower than those in the chamber. In the inlet slot’s bolt on section level 9, TKE was recorded in the range of 0.04–0.05 m2/s2. A minor increase in TKE to 0.09–0.1 m2/s2 in the area of the main stream takes place over a chamber length of 1.2–1.8 m. It is an effect of the increased production in the whirl areas.
On the other hand, huge fields of higher TKE values were recorded in whirl areas. On the right side of the main stream, in the area of whirl No. 1, TKE values increase to the maximum value of 0.15 m2/s2. It is associated with the impact of the stream bypassing whirl No. 1, as discussed during the analysis of level No. 5. Within the field of greater TKE values, a field with low TKE values was recorded: it is an area where (1) TKE is produced (as a result of hydraulic jump formed behind whirl No. 1) and (2) the stream goes down.
The greatest production on level No. 9 takes place in the whirl area on the left side of the main stream. One can locate two fields of intensified TKE values.
The first field is located in a boundary zone between the main flow’s area and the whirl area. Production of TKE occurs over a length of 0.4–1.2 m and a width of 1.4–1.95 m. A reason for the higher TKE values is a clash of two streams: one is from the main flow’s area, where the stream bypasses the outermost bolt element at very high speed; the other is a stream flowing from the biggest additional slot. Similarly, as in the case of model A, in that location, there is a clash between masses of water having different flow directions and intensities, and the collision results in a reduction in both structures’ potential at the contact line through the production of TKE. The field of high TKE values exceeds the area at which the discussed flow structures clashed. Here, the obtained TKE values are significantly lower than those in model A. Therefore, a smaller volume of water is collected below the partition line in the whirl area, and—as a consequence—the stream flowing from the whirl area is also smaller; thus, its impact on the main flow’s stream is smaller.
The other area of high TKE values is the biggest one in that section; it is located over a length of 0.4–3.3 m and a width of 1.4–4.15 m. The main reason for the occurrence of a field of extreme TKE values in section 9 of model B is the impact of both streams flowing from additional spillway slots. Water flowing from the slots hits the water collected in whirls No. 2 and 3. They are turned upward and—after a vertical spin within the clash axis—they return to the surface zone and to the fishway’s outlet bolt (down the chamber). However, production of TKE is significantly lower within water moved from whirl No. 3. This results from the fact that whirl No. 3 is not located within the opening of an additional slot; thus, the stream hitting that whirl is weaker. Three fields of various high TKE values were recorded in the area of whirl No. 2. This diversification results from the geometry of the bolt partition. The stream located over a width of 3–3.5 m flows from the slot placed above (parapet located 0.8 m from the bottom). Furthermore, this area overlaps the arrangement of the additional slot’s opening. Therefore, the streams are transferred to a higher elevation. The area of high TKE values = 0.23 m2/s2 is a crest of reversed water placed over a width of 2.5–3 m, behind the bolt element. This is why streams are transferred from whirl No. 2 to a slightly lower level. The third area of high TKE values = 0.2 m2/s2 is located opposite from the following additional spillway slot. However, the parapet of the slot is 0.6 m from the bottom. This is the reason for breaking the whirl structure in this area down at lower flow layers, where a higher increase in TKE is noted. Therefore, the recorded field of high TKE values retains just a trace of high TKE production in that area.
4. Discussion
The analysis of detailed TKE distribution features in both models of the bolt fishway proves that this type of fish pass is essentially different from slot fishways and from pool-type fishways. The main area’s flow within the bolt fishway has very low TKE production. Production of TKE in whirl areas is associated with the impact between various flow structures or with the counter-reaction between those structures and the bottom and chamber (pool) walls. In slot fishways or pool-type fishways, most TKE production is in the area of the migration stream’s flow. After analyzing available research, we started to examine the reason for such a huge difference in quality stream’s accommodation within fishway channels. We found a suggestion in a publication related to the hydraulic conditions of water outflow from discharge nozzles of various construction schemes (geometry) developed by Seo et al. [
16]; we did not find proposed mechanisms in articles related to fishways. The researchers proved that a proportion of the facility’s length to its diameter affects the turbulence intensity’s distribution conditions in the area of a nozzle’s outlet. The researchers established that the shorter the nozzle, the greater the variability in the cutting stress field in the discharge area. It is associated with the fact that a stream having smaller potential flows from a nozzle that is too short. Such a scenario results in an increased breakdown, and therefore, in an increased turbulence intensity. Therefore, if the stream has a very low potential (rotating, spinning stream), the turbulence intensity reaches the highest values within the stream’s core.
The quoted research works provide a new meaning for the term TKE distribution in various types of fish passes. Production of TKE remains a consequence of forming areas of high turbulence intensity. It means that the nozzle’s geometry and, in the case of fishways, the geometry of the slot (orifice) should exert a critical impact on the potential of the outflowing stream. This is reflected in a TKE production method in chambers (pools) of fish passes.
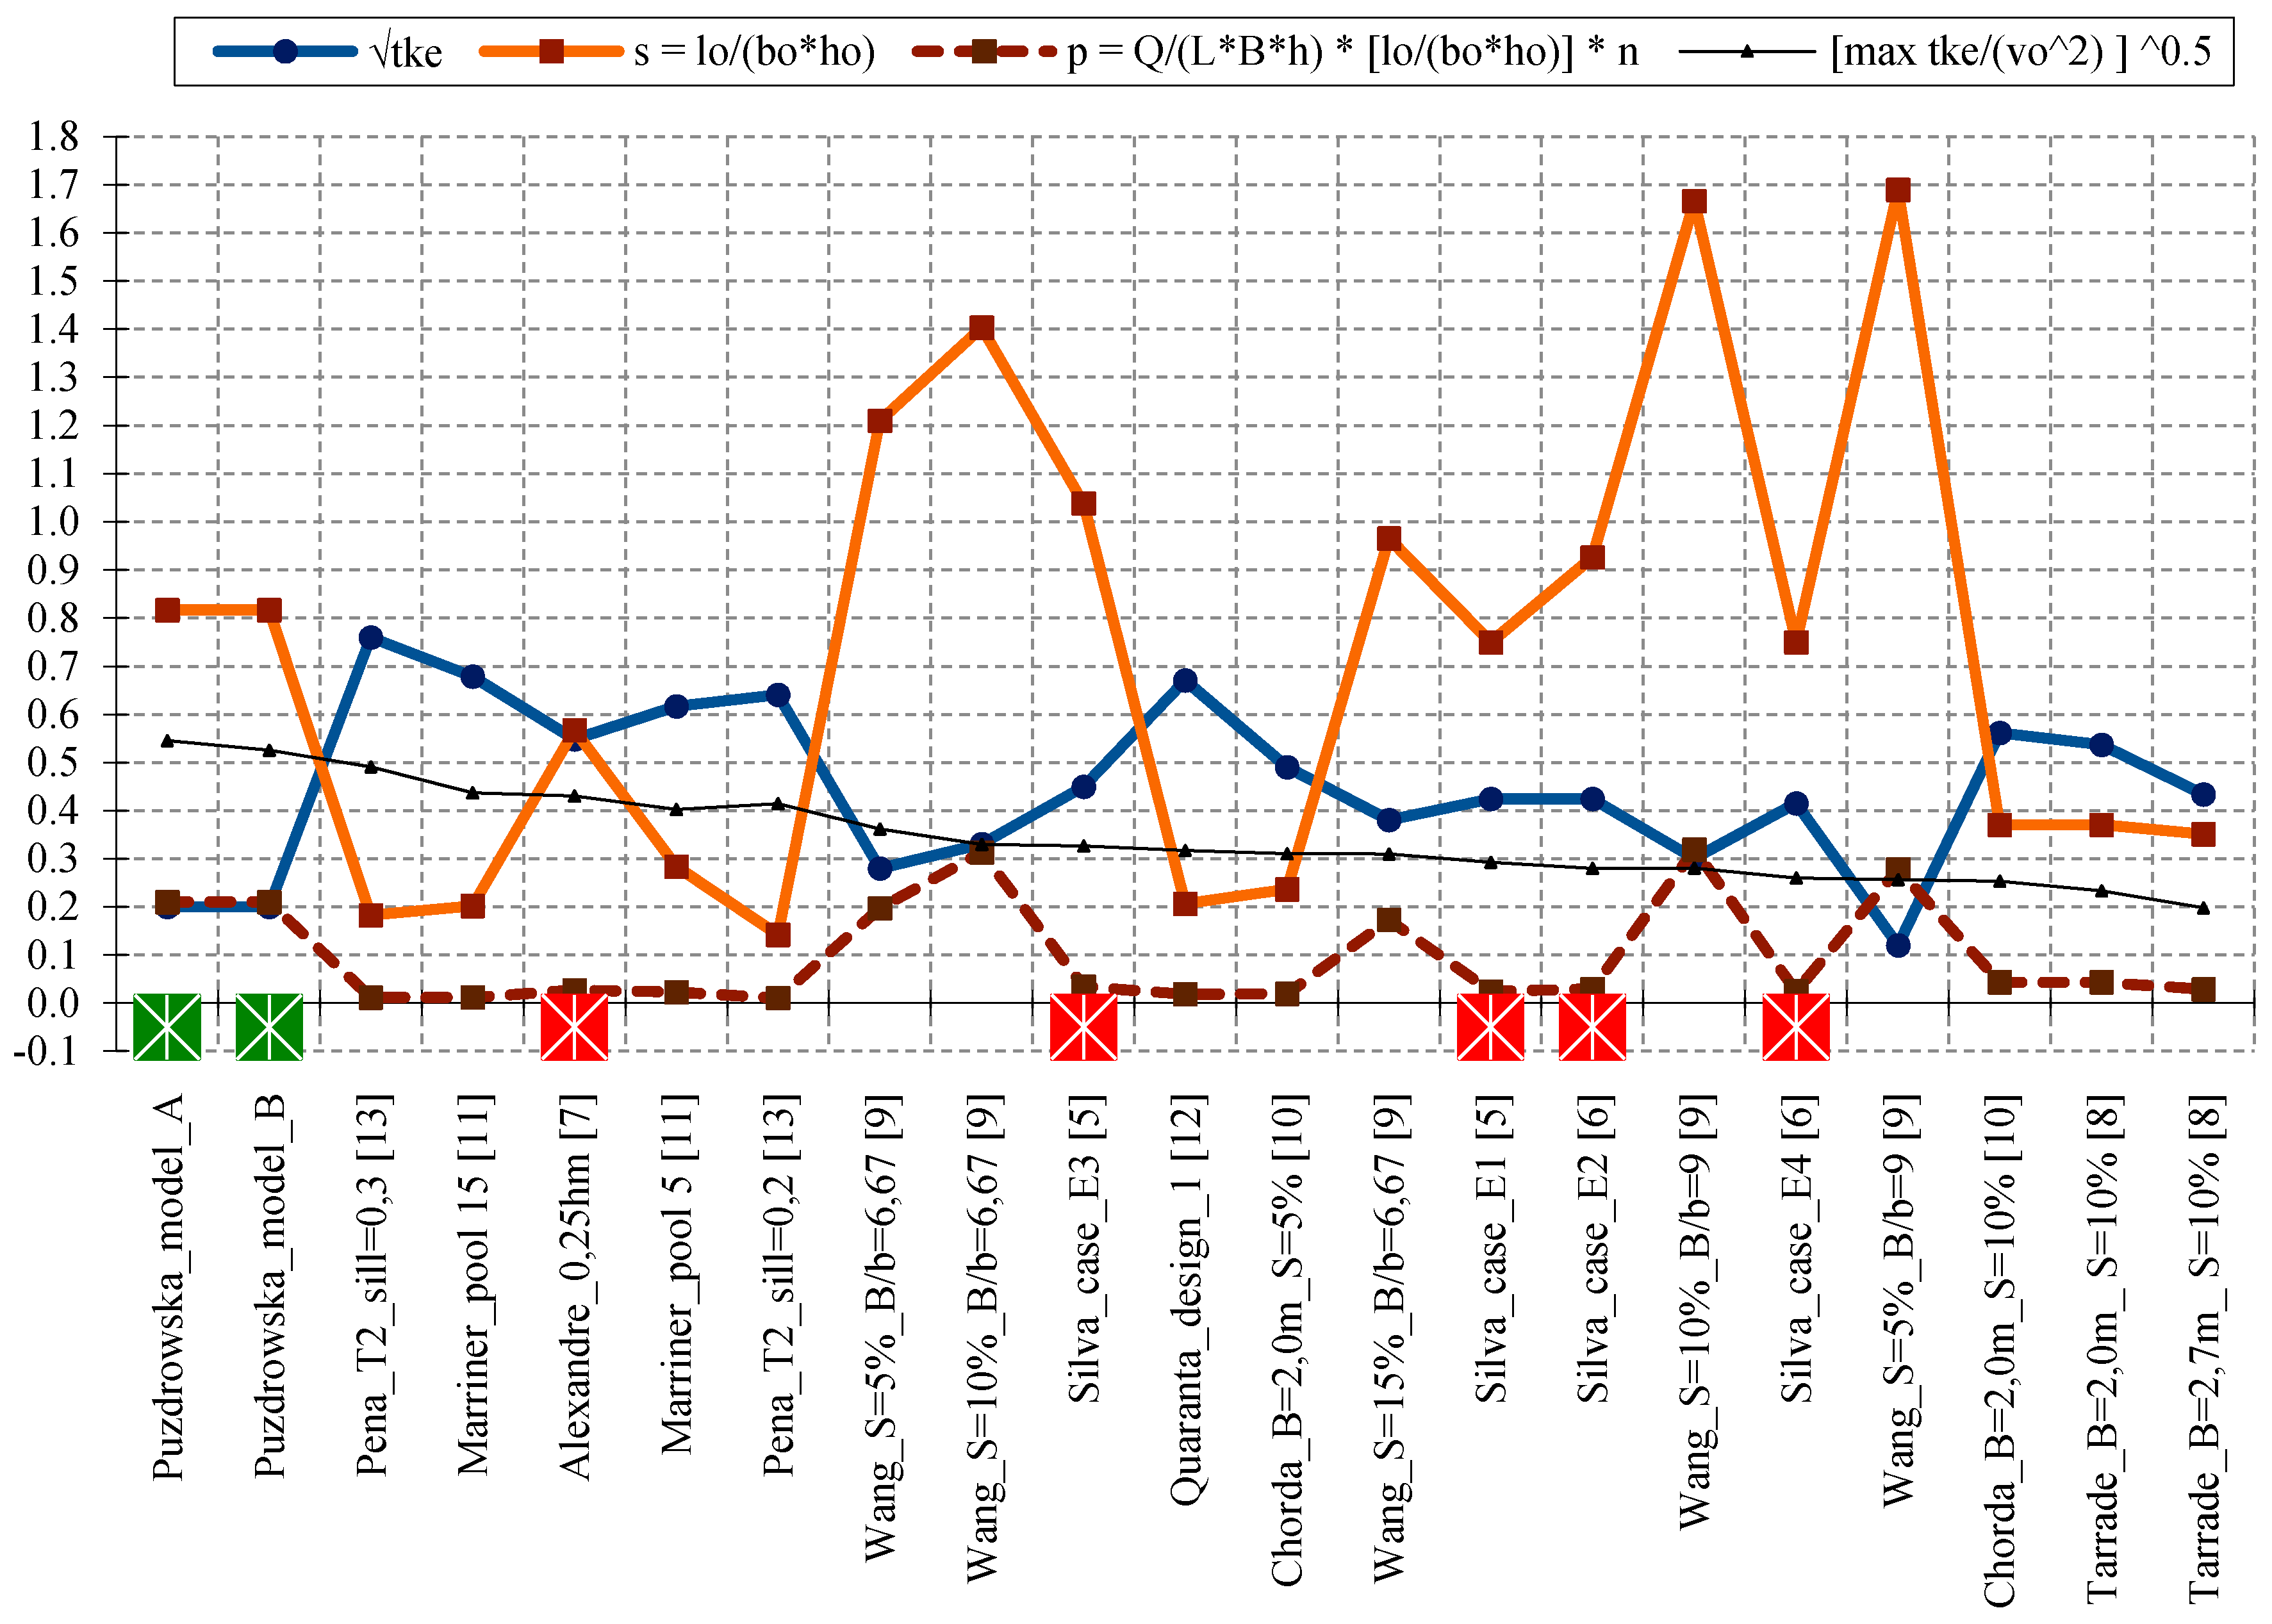
We performed some additional analyses to verify the above assumption. However, a comparison of fish passes of various types that were developed using different scales causes a lot of problems, and it is not directly feasible. For the purpose of verification of that thesis, we applied the following coefficients: s—slot’s geometry (potential) coefficient; and p—chamber’s geometry coefficient.
The coefficients were derived on the basis of the TKE value established for the central part of the flow field, i.e., just downstream of the stream’s outflow from the slot, in the middle of slot’s (orifice’s) filling level (
Figure 6). Formulas and obtained values are presented in the diagram.
The slot’s potential coefficient “s” refers to the longitudinal dimension of the slot’s orifice (lo), which most often is the wall’s thickness itself. For the coefficient, the wall’s thickness (lo) is relative to the slot’s width (bo) and its filling (ho).
The analyzed chamber’s geometry coefficient “p” refers to the chamber (pool) width (B), chamber length (L), average chamber filling (h), and water flow in the facility (Q). The coefficient is corrected with the number of slots in the partition (n).
The provided diagrams clearly show some tendencies and dependences. It is noticeable that along with the increase in the slot’s geometry coefficient “s”, TKE values are accordingly reduced and vice versa. An inversely proportional dependence is therefore proved. The same trend can be seen also for the chamber’s geometry coefficient “p” and TKE value. We thus form a simple conclusion: the distribution mechanism and obtained TKE values in the migration stream depend on the flow stream’s potential. This potential is inversely proportional to the value of the slot’s geometry coefficient “s”. So, a stream with high potential means would have a small TKE value. Therefore, the TKE values obtained in the area of the discharge stream from the slot are mainly affected by the geometry of the slot or orifice.


