Abstract
Nonlinear rheological properties of chiral crystal cholesteryl oleyl carbonate (COC) in blue phase III (BPIII) were investigated under different shear deformations: large amplitude oscillatory shear, step shear deformation, and continuous shear flow. Rheology of the liquid crystal is significantly affected by structural rearrangement of defects under shear flow. One of the examples on the defect-mediated rheology is the blue phase rheology. Blue phase is characterized by three dimensional network structure of the disclination lines. It has been numerically studied that the rheological behavior of the blue phase is dominated by destruction and creation of the disclination networks. In this study, we find that the nonlinear viscoelasticity of BPIII is characterized by the fracture of the disclination networks. Depending on the degree of the fracture, the nonlinear viscoelasticity is divided into two regimes; the weak nonlinear regime where the disclination network locally fractures but still shows elastic response, and the strong nonlinear regime where the shear deformation breaks up the networks, which results in a loss of the elasticity. Continuous shear deformation reveals that a series of the fracture process delays with shear rate. The shear rate dependence suggests that force balance between the elastic force acting on the disclination lines and the viscous force determines the fracture behavior.
1. Introduction
Defect-mediated phenomena are widely observed not only in the macroscopic properties such as phase behavior and rheology of the liquid crystalline systems but also in microscopic structure formation of colloids such as a nematic-driven particle self-assembly [1,2,3]. Many features of defects make the liquid crystals attractive for emerging applications such as the material design, optical sensors and manipulations [4]. Though it has been generally accepted that the defects play a decisive role on the material properties of the liquid crystals, systematic study on the liquid crystal rheology is still required [5,6].
Blue phases (BPs) are known as frustrated intermediate phases appearing between cholesteric phase and isotropic phase [1,7,8,9,10]. BPs can be formed in a narrow temperature range. In the presence of chiral constituents, the director rotates in two directions due to its strong molecular chiralities and forms a double twist cylinder (DTC) structure with a period of ∼100 nm. Such DTCs arranged in a cubic lattice consist the BPs. However, in the arrangement of the DTCs in the cubic lattice, configuration of the liquid crystal director is locally disturbed, which results in topological disclination lines [9]. The disclination lines yielded by such topological frustration form a disclination network. BPs are classified into three sub-phases, BPI, BPII, and BPIII, depending on their disclination network structures. BPI and BPII are characterized by the body-centered cubic and simple cubic lattices, respectively [9,11]. Under the polarized microscope, BPI and BPII generally show polycrystalline texture consisting of randomly oriented domains, which limit the possibility in applications. Nano-patterned substrate, however, made it possible to create a stable single-crystal blue phase, which provided a potential for the application in the electro-optical materials [12]. In addition to BPI and BPII, BPIII is also a promising material in developing electro-optical and optical devices.
Disclination networks in BPI and BPII consisting of an ordered array of the disclination lines are responsible for a rich variety of their rheological behaviors [13,14,15]. In numerical simulations of the blue phase rheology, shear deformation produces an oscillatory shear stress response because of periodic break and reconnection of the elastic disclination lines in the microscopic scale [16,17,18]. Furthermore, as a result of the recombination of the disclination networks, the ordered disclination arrangement of BPI and BPII transforms into an amorphous-like network structure. Experimentally, interesting findings are a soft solid-like response of BPI and BPII supported by their disclination networks and appearance of a shear-induced structure in BPI [14,15]. The shear-induced phase in the BPI shows a higher elasticity than that in the quiescent state [15].
On the contrary to BPI and BPII, BPIII does not have a long range ordering [19,20,21,22]. BPIII attracts interest from scientists because of its mysterious structure [23]. The symmetry of BPIII is the same as that of the isotropic phase, and its structure is characterized by amorphous-like random network of the disclination lines [24,25]. Simulations by Henrich et al. showed that the free energy of BPIII is lower than other ordered BPI and BPII [19]. The low energy of the amorphous structure raised a question whether BPIII is metastable or thermodynamically stable phase. If it is stable phase, BPIII may be an example of a thermodynamically stable glassy material. It is therefore interesting to study rheological behavior of BPIII from the view point of soft glassy rheology.
Kikuchi et al. presented that the polymer stabilization of the disclination lines make the temperature range of BPs wider [26]. Chien et al. and his colleague demonstrated that the same strategy as the polymer stabilized blue phase can be applied to visualize the morphology of BPIII artificially [21,24,25]. Actually their polymer scaffold technique revealed an amorphous network structure of the disclinations in BPIII for the first time. Despite the amorphous feature, BPIII undergoes the phase transition into ordered blue phase by applying electric field [27,28,29]. Similar phase transition phenomena may take place even under shear flow, which will cause rearrangement of the disordered disclination line networks. If the shear-enhanced elasticity can be related to the recombination of the disclination networks, it is interesting to elucidate what mechanism causes the shear-enhanced elasticity, and how different is the rheological properties between amorphous network structure (BPIII) and ordered network structure (BPI and BPII). To clarify the difference between amorphous and ordered phases, rheological characterization of BPIII is required.
In this study, we explored the nonlinear rheology of the BPIII from the view point of the rearrangement of the amorphous disclination networks. We used cholesteryl oleyl carbonate (COC), which forms BPIII within a narrow temperature range between chiral nematic and isotropic phases [30]. This paper is organized as follows. The following Section 2 provides experimental results on linear and nonlinear viscoelastic behavior. First, we prove that COC forms the BPIII in between isotropic and chiral nematic phases. Then, we show nonlinear viscoelastic behavior of the BPIII under three different shear deformations: oscillatory shear, step shear, and continuous shear deformations. Nonlinear shear modulus obtained under large amplitude oscillatory shear suggests that the nonlinear viscoelastic behavior can be classified into two regimes: a weak nonlinear regime where BPIII has a slight elastic resistance even under large oscillation, and a strong nonlinear regime where the BPIII loses the elasticity. Nonlinear relaxation modulus after the step shear strain clarifies that the distribution of the relaxation time broadens with the increase of the step strain amplitude. These findings are attributed to the fracture of the disclination networks responsible for the BPIII rheology. Stress growth behavior provides a series of transient process on the orientation and the fracture of the disclination networks. These experimental results on nonlinear viscoelasticity of the disclination networks are summarized in Section 3. Section 4 describes the materials and experimental methods used in this study.
2. Results and Discussion
2.1. Phase Behavior
Cholesteryl oleyl carbonate (COC) is known to have BPIII between chiral nematic and isotropic phase. Here, we confirm the existence of BPIII and identify the transition temperature in COC.
Figure 1 shows the temperature dependence of the viscosity at = 1 s. Shear viscosity obtained during cooling and heating process are shown. During cooling process, the viscosity increases at T = 35.9 C and shows a peak at 34.8 C. On the other hand, during heating process, the viscosity steeply increases at T = 34.8 C and shows the peak at 35.1 C. After the increase, the viscosity decreases and coincides with that during the cooling process. Similar viscosity curve for COC was presented by some researchers [30,31]. The steep increase in the viscosity during cooling and heating process is attributed to the formation of BPs [14,15]. As Henrich et al. presented in their numerical simulation, the viscous stress response of BPs is significantly affected by the deformation of the disclination lines in BPs [18]. The increase in the viscosity is therefore a characteristic feature of the formation of BPs with disclination networks. It is expected that not only BPIII but also BPI and BPII show the increase of the viscosity when they are formed from isotropic and chiral nematic phases [14,15].

Figure 1.
Temperature dependence of the viscosity at = 1 s. Different symbols correspond to the viscosity measured during cooling and heating process. Temperature was swept at = 0.1 C/min. Arrows indicate the phase transition temperatures. Polarized microscope images at different temperatures are also shown. Scale bar indicates 100 m.
Polarized microscope images at different temperatures show dark images at T = 35.9 C. As temperature decreases, the uniform dark texture becomes gradually brighter, as Taushanoff et al. also observed in their BPIII system [32]. When the temperature is lowered below T = 34.8 C, oily streaks which are a typical defect line for the cholesteric phase appears. In general, BPIII shows no platelet texture, which is often observed in many BPI and BPII systems with ordered alignment of DTCs, and it is considered BPIII shows a dark blue texture. However, absence of the platelet texture and dark blue texture do not always indicate the formation of BPIII, as Kim and Chien presented [22]. Chien et al. provided an accurate method to distinguish BPIII from other BPs by observing optical activity [21,24,25].
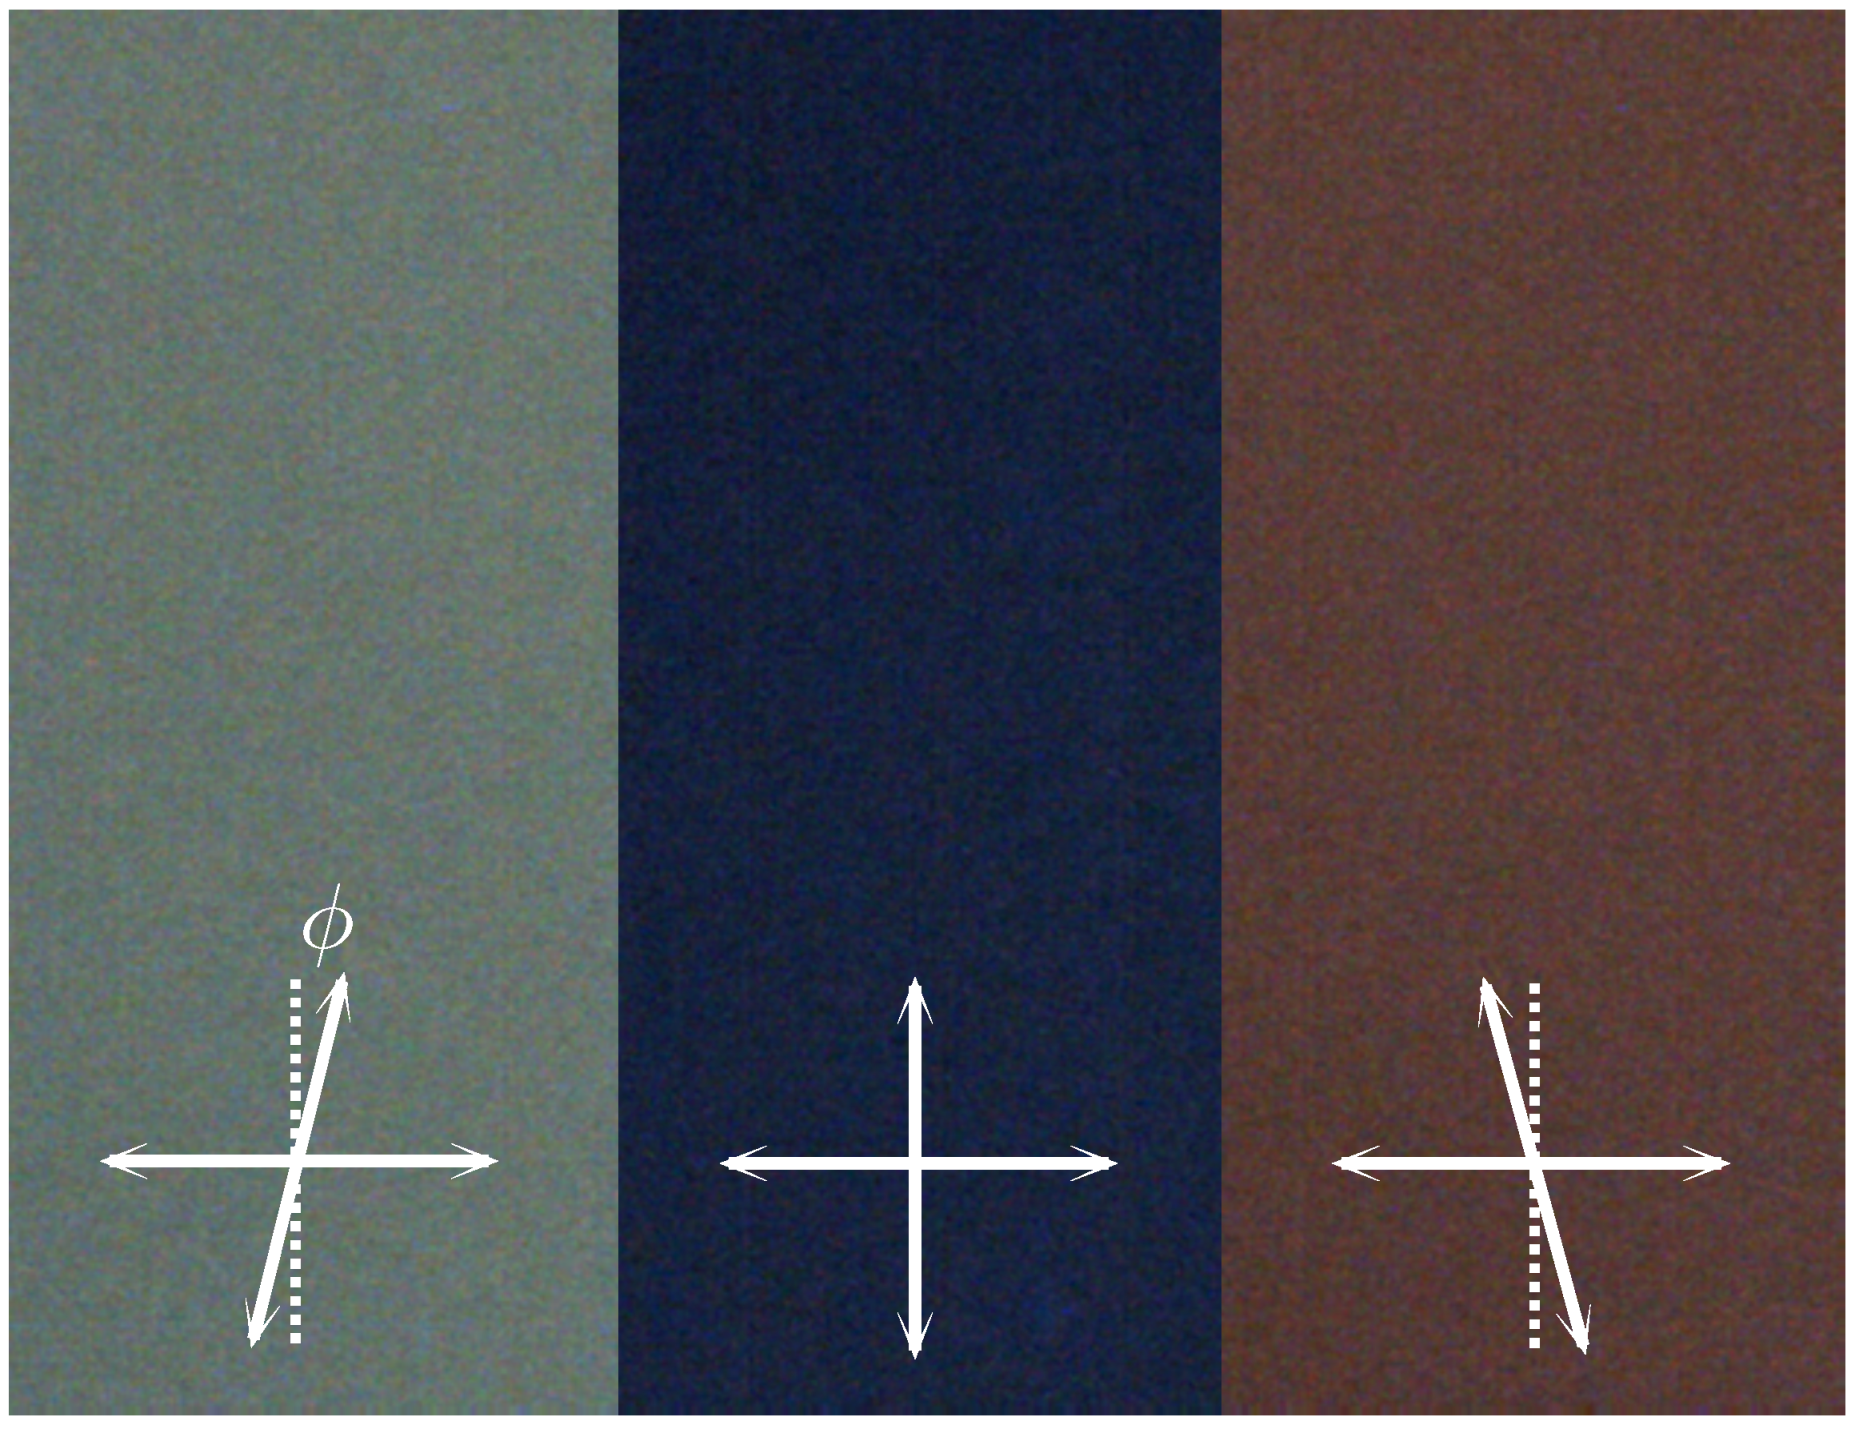
Figure 2 shows polarized microscope image at T = 35.1 C. Image in the center was taken under crossed polarizers, while images on left and right sides were taken at deviation angle between the analyzer and polarizer of = ±4 by following the method established by Chien’s group [21,24]. Under crossed polarizers, the dark blue image is observed as other BPIII system shows [33]. Deviation of the angle results in the observation of different color due to the optical activity of BP [21,22]. The color becomes greenish blue and brownish for positive and negative , which is similar to the observation of BPIII by Kim and Chien [22]. Appearance of the optical activity is a sign of the formation of BP. In Figure 1, the brightness of the polarized microscope image suddenly increases at T = 34.8 C, which might correspond to a transition into BPII or BPI. Actually, Kim et al. also observed BPI without the platelet texture. To identify the phase exactly, it is necessary to perform a measurement of the reflection spectra, as Kim et al. established [22]. It seems that the dark image with the optical activity shown in Figure 2 indicates the formation of BPIII in the temperature range of 35.0 C < T < 35.9 C. In the following, all experiments were carried out at T = 35.1 C.
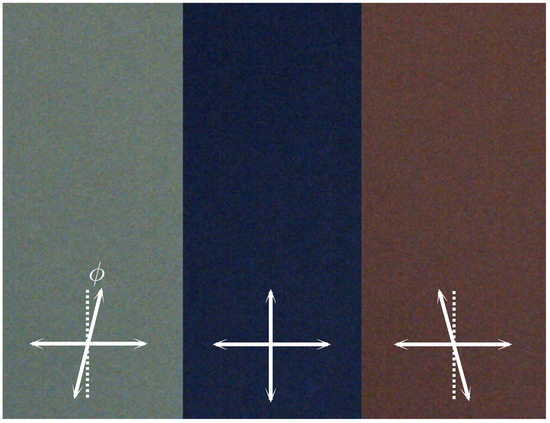
Figure 2.
Polarized microscope image at T = 35.1 C. White arrows correspond to the optic axes of polarizer and analyzer. Deviation angle of the analyzer is = ±4.
2.2. Linear Rheology
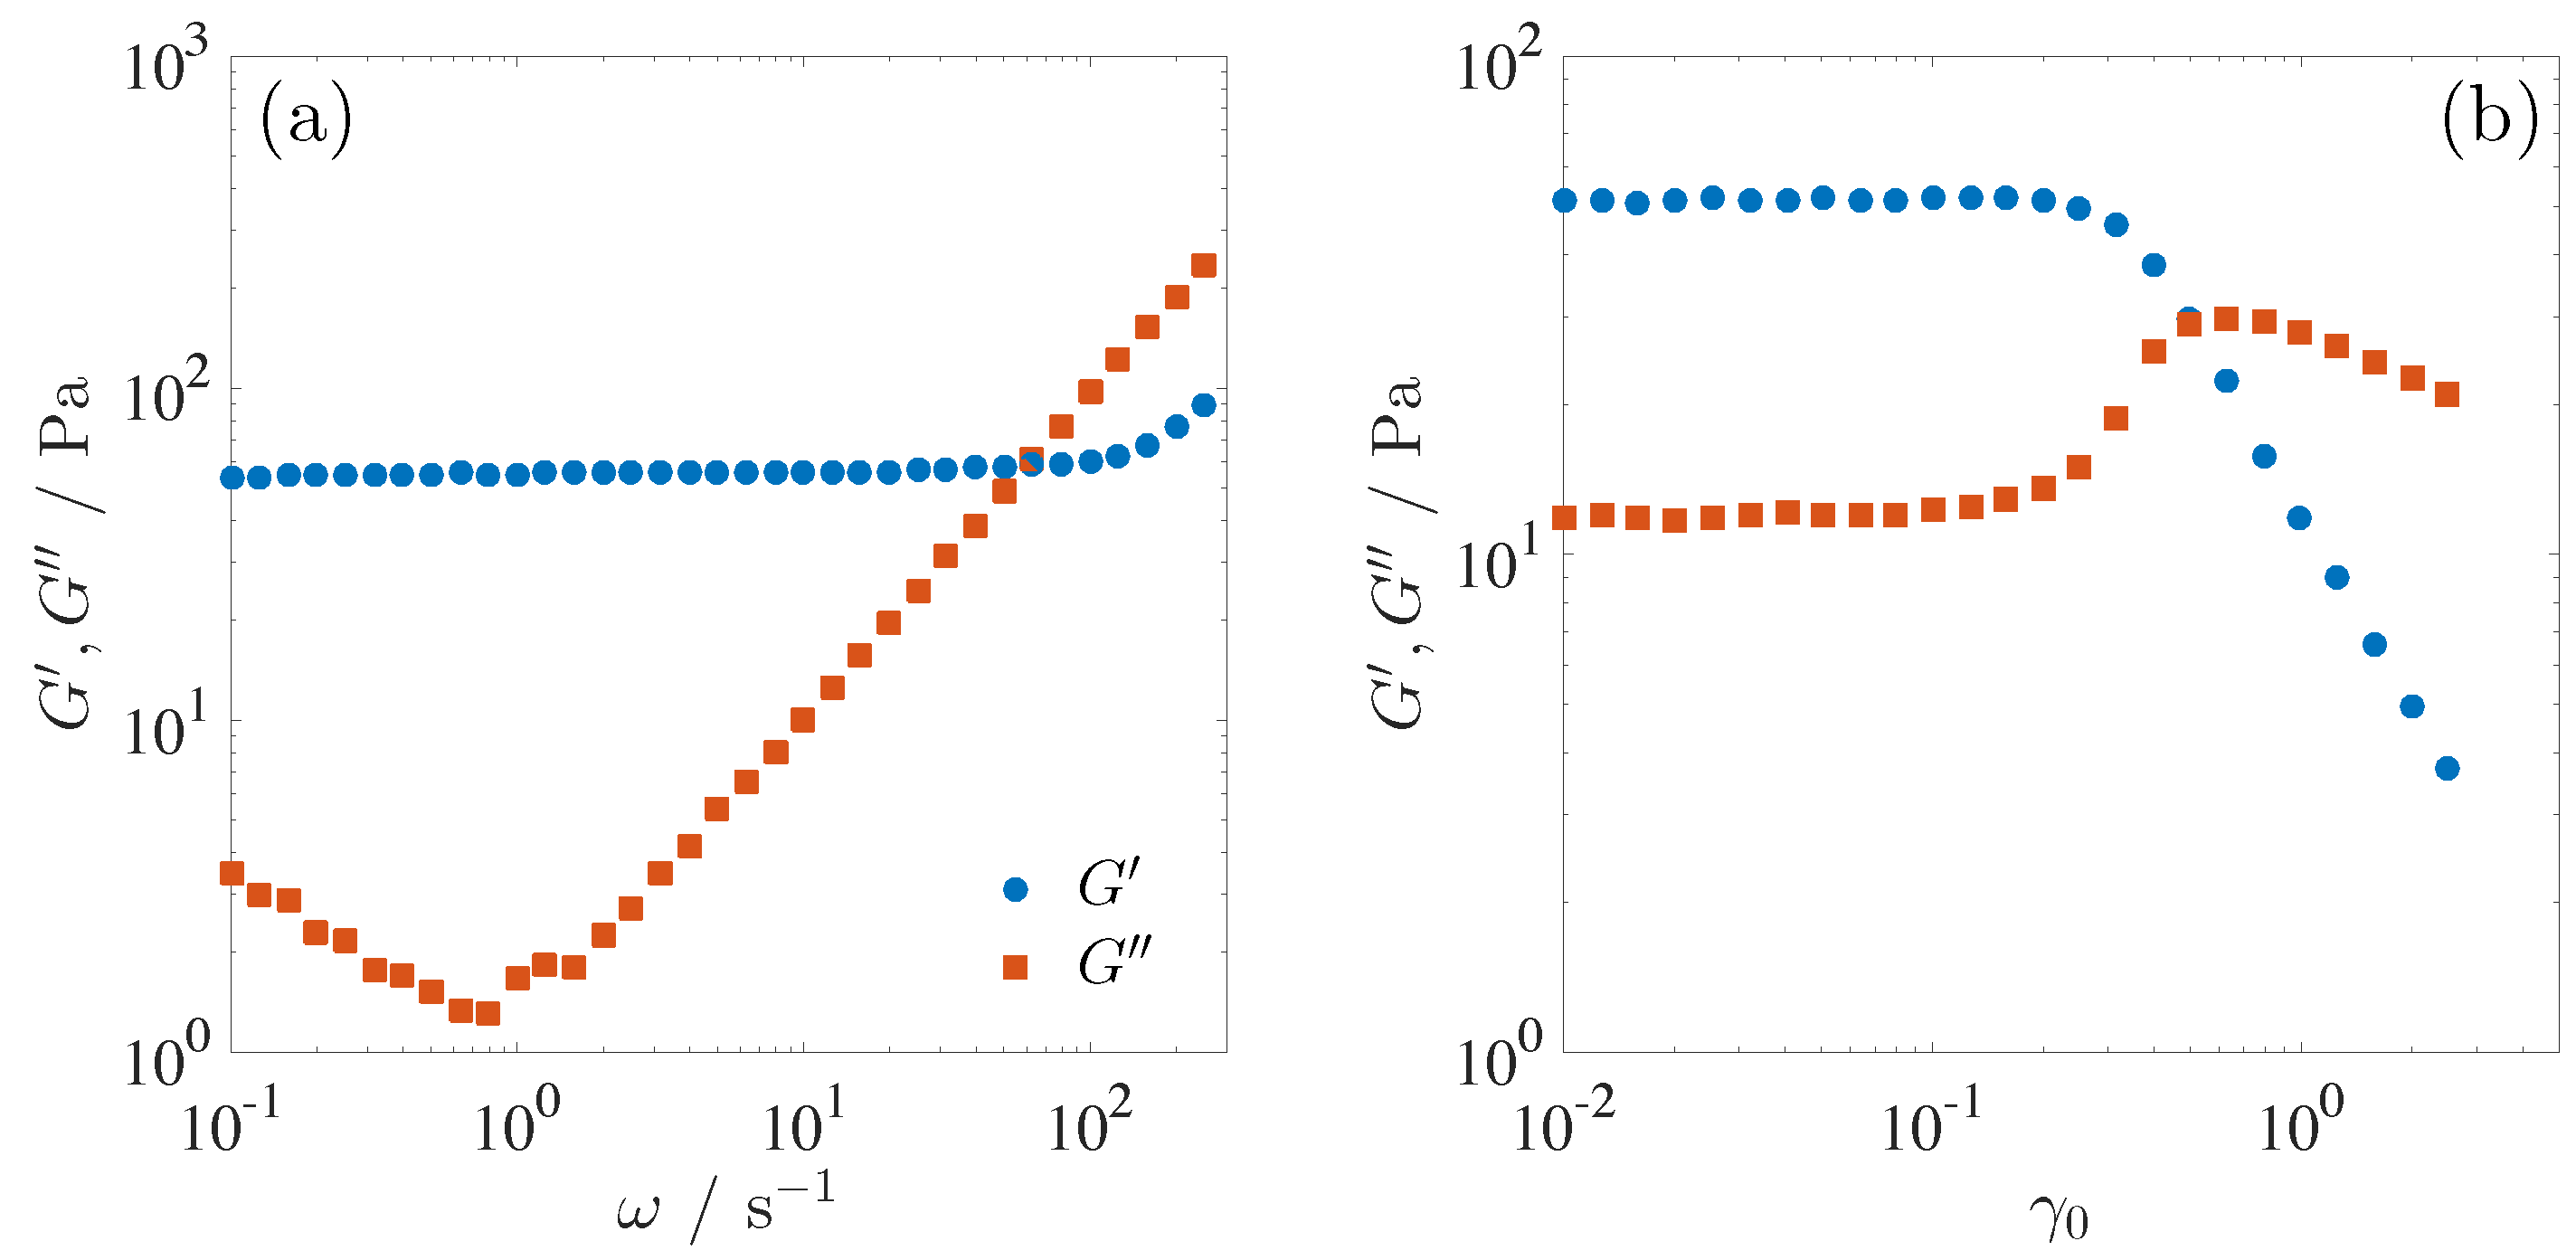
Here, we show that BPIII is an elastic phase and its viscoelasticity resembles soft solid-like materials. We first present the dynamic shear moduli measurement in the linear range ( = 0.03). In addition, we show the strain amplitude dependence of the dynamic moduli as a fundamental property of the nonlinear viscoelasticity.
Figure 3a shows the linear dynamic shear moduli as a function of the angular frequency measured under small amplitude oscillatory shear ( = 0.03) at T = 35.1 C. Strain amplitude dependence of the dynamic shear moduli at = 10 s is shown in Figure 3b. The storage shear modulus shows a plateau modulus = 54 Pa and is larger than the loss shear modulus in a wide range of . Another feature is an increase in at low , indicating the existence of a certain relaxation mode below = 0.1 s. However, we could not detect the terminal relaxation time within the experimental window of the frequency. Similar viscoelastic properties, the existence of the plateau modulus and slow relaxation have been reported for soft solid-like materials such as concentrated emulsion, silica suspensions and biopolymer network systems [34,35,36]. Soft solid-like behavior has been similarly reported for BPI [14,15].
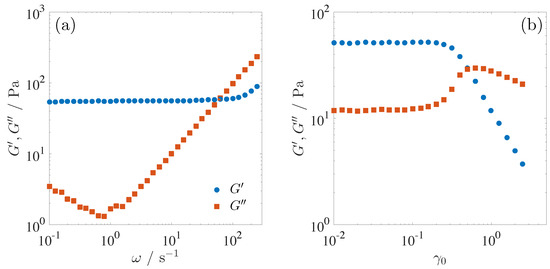
Figure 3.
(a) Dynamic shear moduli as a function of the angular frequency measured at T = 35.1 C. The strain amplitude of the oscillatory shear is = 0.03, which corresponds to the linear viscoelasticity region. (b) Dynamic shear moduli as a function of the strain amplitude . The angular frequency is = 10 s. Symbols are the same as those in (a).
Reminiscent behavior of the soft solid-like materials is also seen in the strain amplitude dependence of the shear moduli [34,35,36,37,38,39]. At low , the shear moduli are independent of , indicating the linear viscoelasticity. As the increases, however, the loss modulus shows a strain hardening above = 0.2 followed by a strain thinning, while the storage modulus shows a strain thinning behavior. Hyun et al. and Sim et al. qualitatively explained the strain amplitude dependence of the dynamic moduli using a network model composed of segments and junctions [40,41]. In the network model, a segment can be regarded as a macromolecular chain or a microstructure connecting junctions. Junctions are nodes where intermolecular interactions are localized such as a crosslinking point. The network model qualitatively predicts that the strain hardening of is derived from the dynamic balance between the destruction and creation of the network junctions. In the case of the BPIII, the disclination line and their connection at nodal points play a role of the segment and junction in the network model. Under the oscillatory shear deformation, disclination network of the BPIII will be repeatedly broken and created, depending on their destruction and creation rates as Henrich et al. numerically presented for BPI [18]. Although the structural cause of the strain hardening behavior of depends on the type of the soft matter and their microstructure, the strain amplitude dependence of the dynamic moduli is closely related to the structural rearrangement as qualitatively predicted by the network model. Raghavan et al. reported that the strain hardening behavior of the flocculated suspensions of a fumed silica occurs when a destruction of the network linkage and resultant change in the flock size appear [42]. Parthasarathy et al. also explained the strain hardening of an electrorheological fluid in terms of a flow-induced microstructural rearrangement [43]. They suggested that the hardening of is originated from a viscous dissipation due to slight rearrangement of unstable cluster. Increase in the strain amplitude causes large scale rearrangement which results in the visco-plastic behavior, i.e., decrease of .
In analogy with these qualitative explanations for the overshoot of , nonlinear viscoelasticity of the BPIII in Figure 3b also arises from the flow-induced structural rearrangement through the fracture of the disclination networks. The overshoot of in the BPIII is related to the increase of the viscous dissipation produced by the breakage of the disclination networks.
2.3. Nonlinear Dynamic Behavior
As the strain hardening behavior of suggests, nonlinear viscoelasticity of the BPIII is mediated by the rearrangement of the disclination networks. In this section, we present nonlinear viscoelastic behavior under large amplitude oscillatory shear (LAOS) and classify them into two regimes: weak and strong nonlinear regimes. Here, we evaluate the nonlinearity only with the complex shear modulus instead of and , because the phase lag cannot be defined in the nonlinear regime.
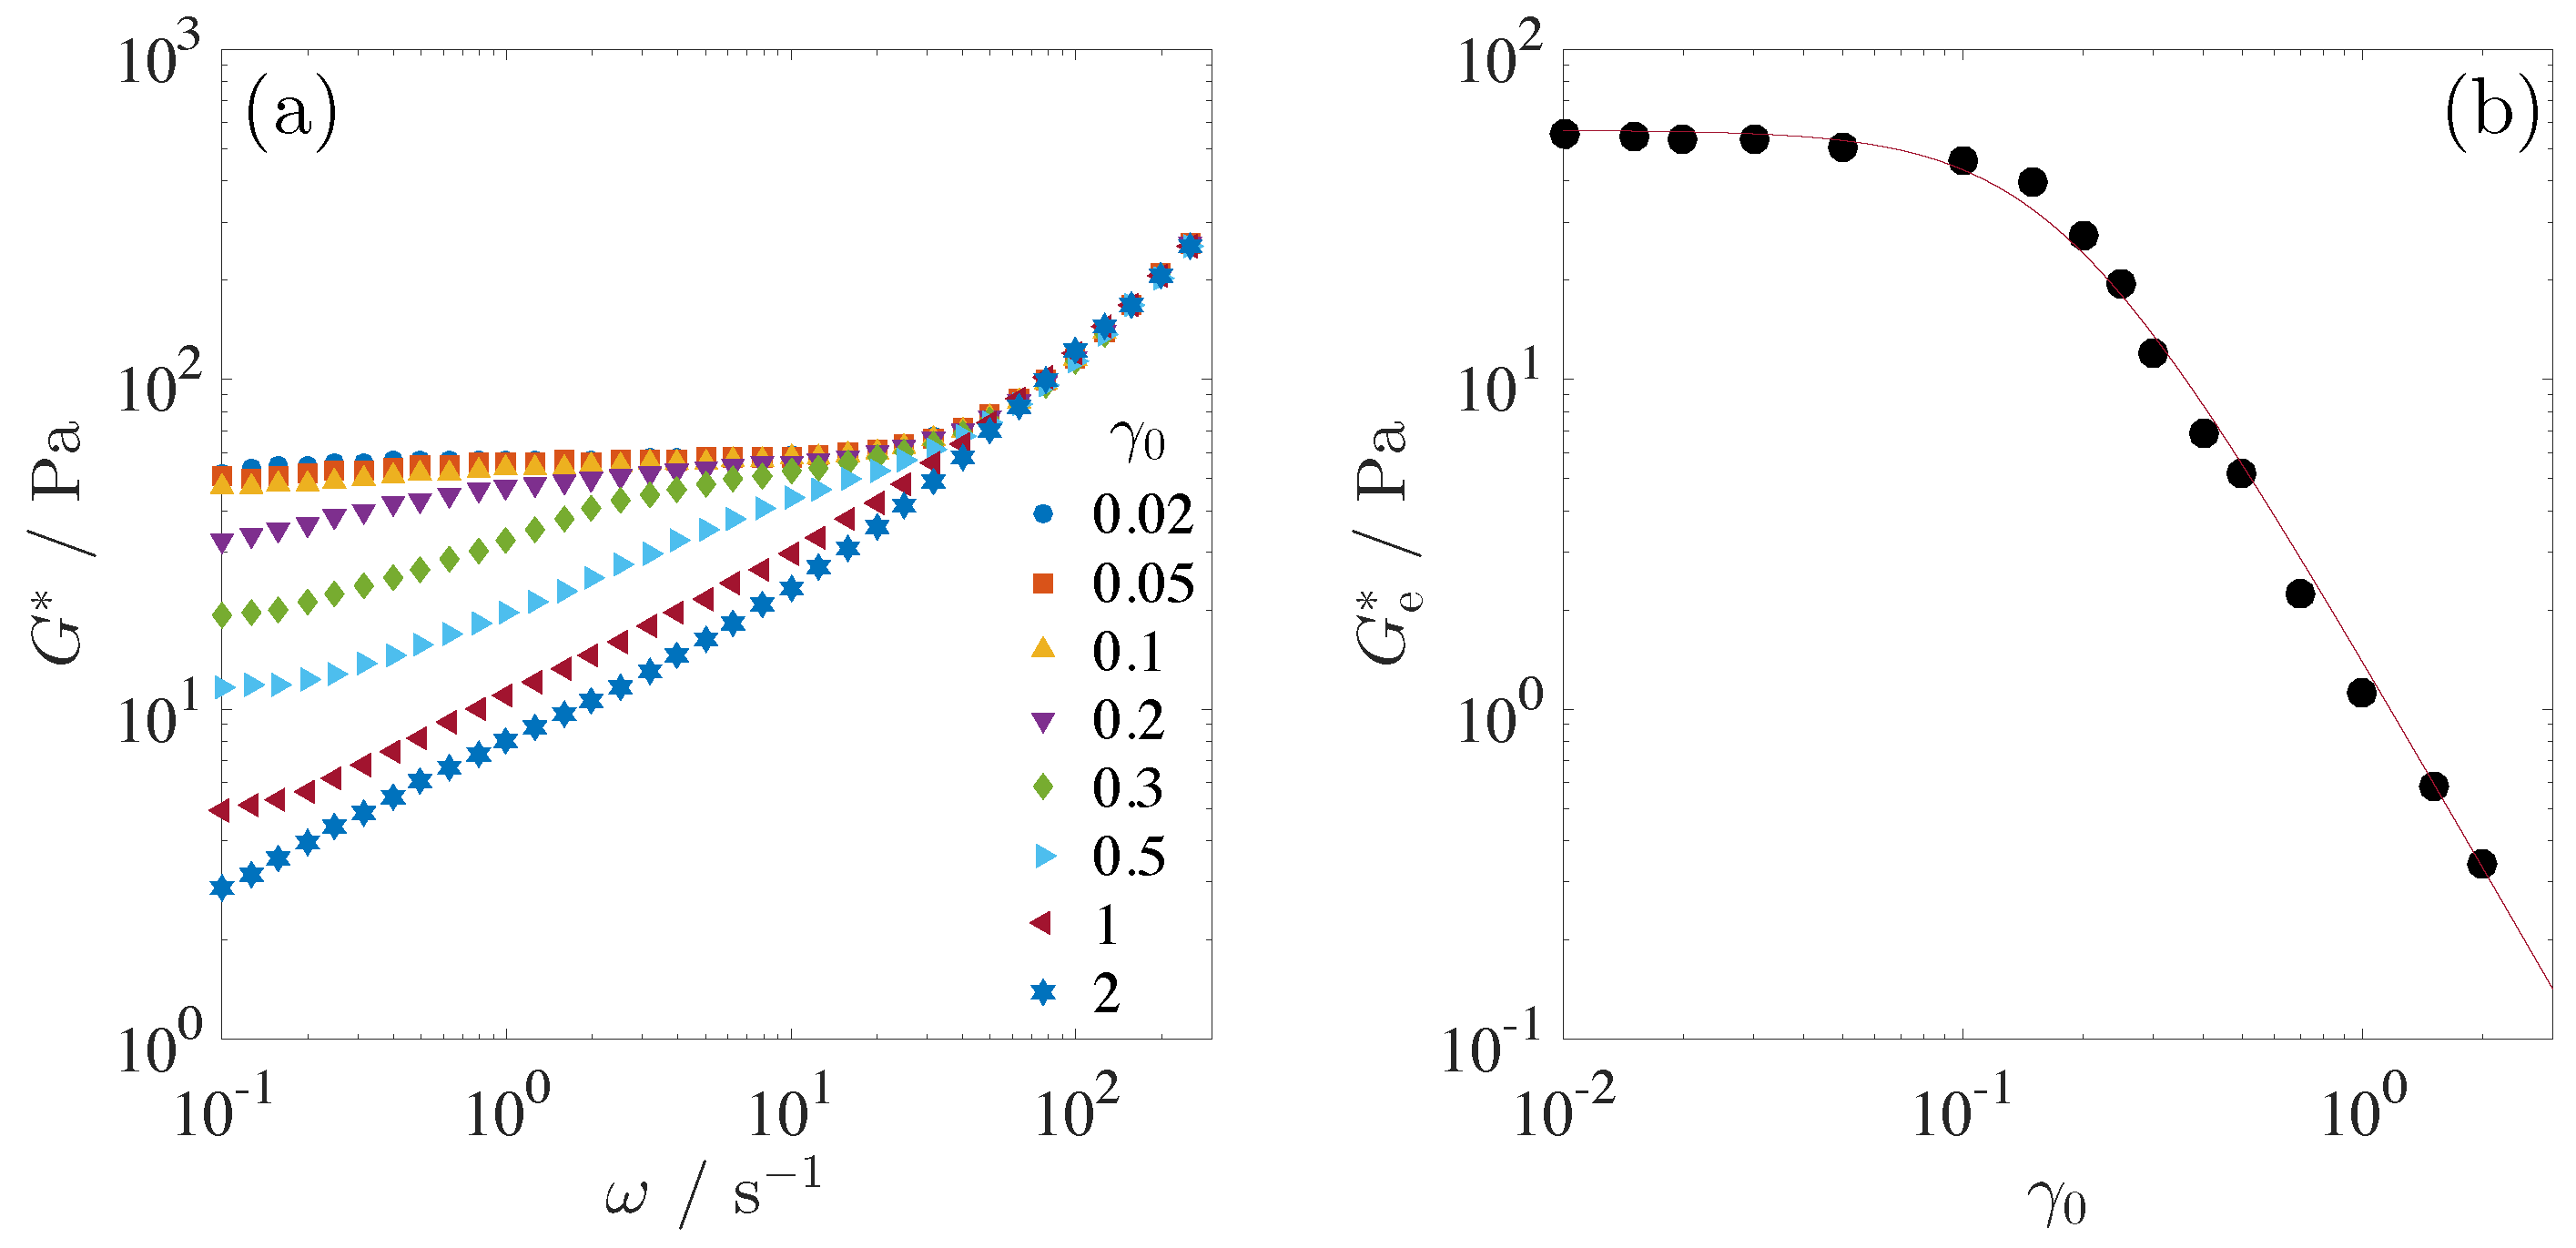
Figure 4a shows angular frequency dependence of the complex shear modulus measured under LAOS at T = 35.1 C. For small strain amplitudes, 0.1, is insensitive to the strain amplitude and approximately collapses onto the same curve. Viscoelasticity is therefore in the linear regime at low , as shown in Figure 3b. Beyond the strain amplitude = 0.2, in low region decreases with . Despite the occurrence of the nonlinearity, has a second plateau modulus at around 0.1 s, suggesting that some elastic feature remains even under LAOS. This second plateau modulus at low might be a reminiscent of the elastic structure of the BPIII in the quiescent state. Further increase in decreases the second plateau modulus, and eventually above = 2, the second plateau modulus disappears, indicating the loss of the elastic structure.
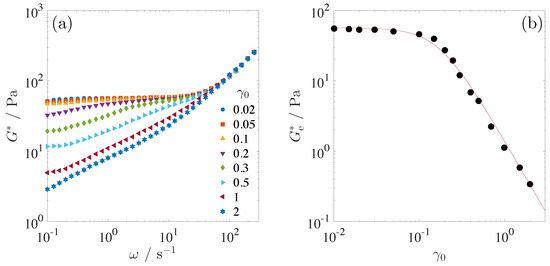
Figure 4.
(a) Complex shear modulus as a function of the angular frequency measured at T = 35.1 C. obtained at various strain amplitude in the range 0.02 2.0 are compared in the same panel. (b) Nonlinear shear modulus at = 0.1 s is plotted as a function of the strain amplitude . Solid curve is the best fit to the equation, with = 0.2.
at = 0.1 s is utilized as a nonlinear shear modulus under LAOS. In the dependence of (Figure 4b), remains independent of at 0.1 but decreases at 0.2. In the comparison with the shear moduli shown in Figure 3b, the nonlinear behavior appears at almost the same strain amplitude.
Based on above results, nonlinear viscoelasticity of the BPIII can thus be classified into two regimes: a weak nonlinear regime in the strain amplitude range of 0.2 1 where some elastic structure remains even under LAOS, and a strong nonlinear regime at 2 where the elastic structure is broken up. The threshold strain amplitude between the weak and strong nonlinear regions is 2.0, and the plateau modulus at the threshold strain amplitude is approximately 3 Pa. Following a simple argument for the isotropic materials such as entangled polymers [5], it can be shown that the shear modulus scales as , where l is a characteristic length scale of disclination networks. Using 3 Pa at 0.1 s, this leads to an estimate of 110 nm. Under the oscillatory shear, it is expected that the disclination network breaks up and reconnects between nearest neighbors. Therefore, this characteristic length 110 nm might be considered as an average mesh size of the disclination networks that can be reconnected under the oscillatory shear. In other words, the disclination networks destructed under the oscillatory shear can partly recombine in the weak nonlinear regime, while it is difficult to keep the network structure in the strong nonlinear regime. A softening of the BPIII under LAOS suggests that the fracture of the disclination network leads the nonlinearity.
2.4. Nonlinear Relaxation Modulus
In this section, we summarize experimental results on the step shear experiments, which provide insights into a stress relaxation mechanism of the BPIII. We show that the increase of the step strain amplitude changes the stress relaxation behavior. We consider the origin of the nonlinearity from the view point of the fracture of the disclination networks.
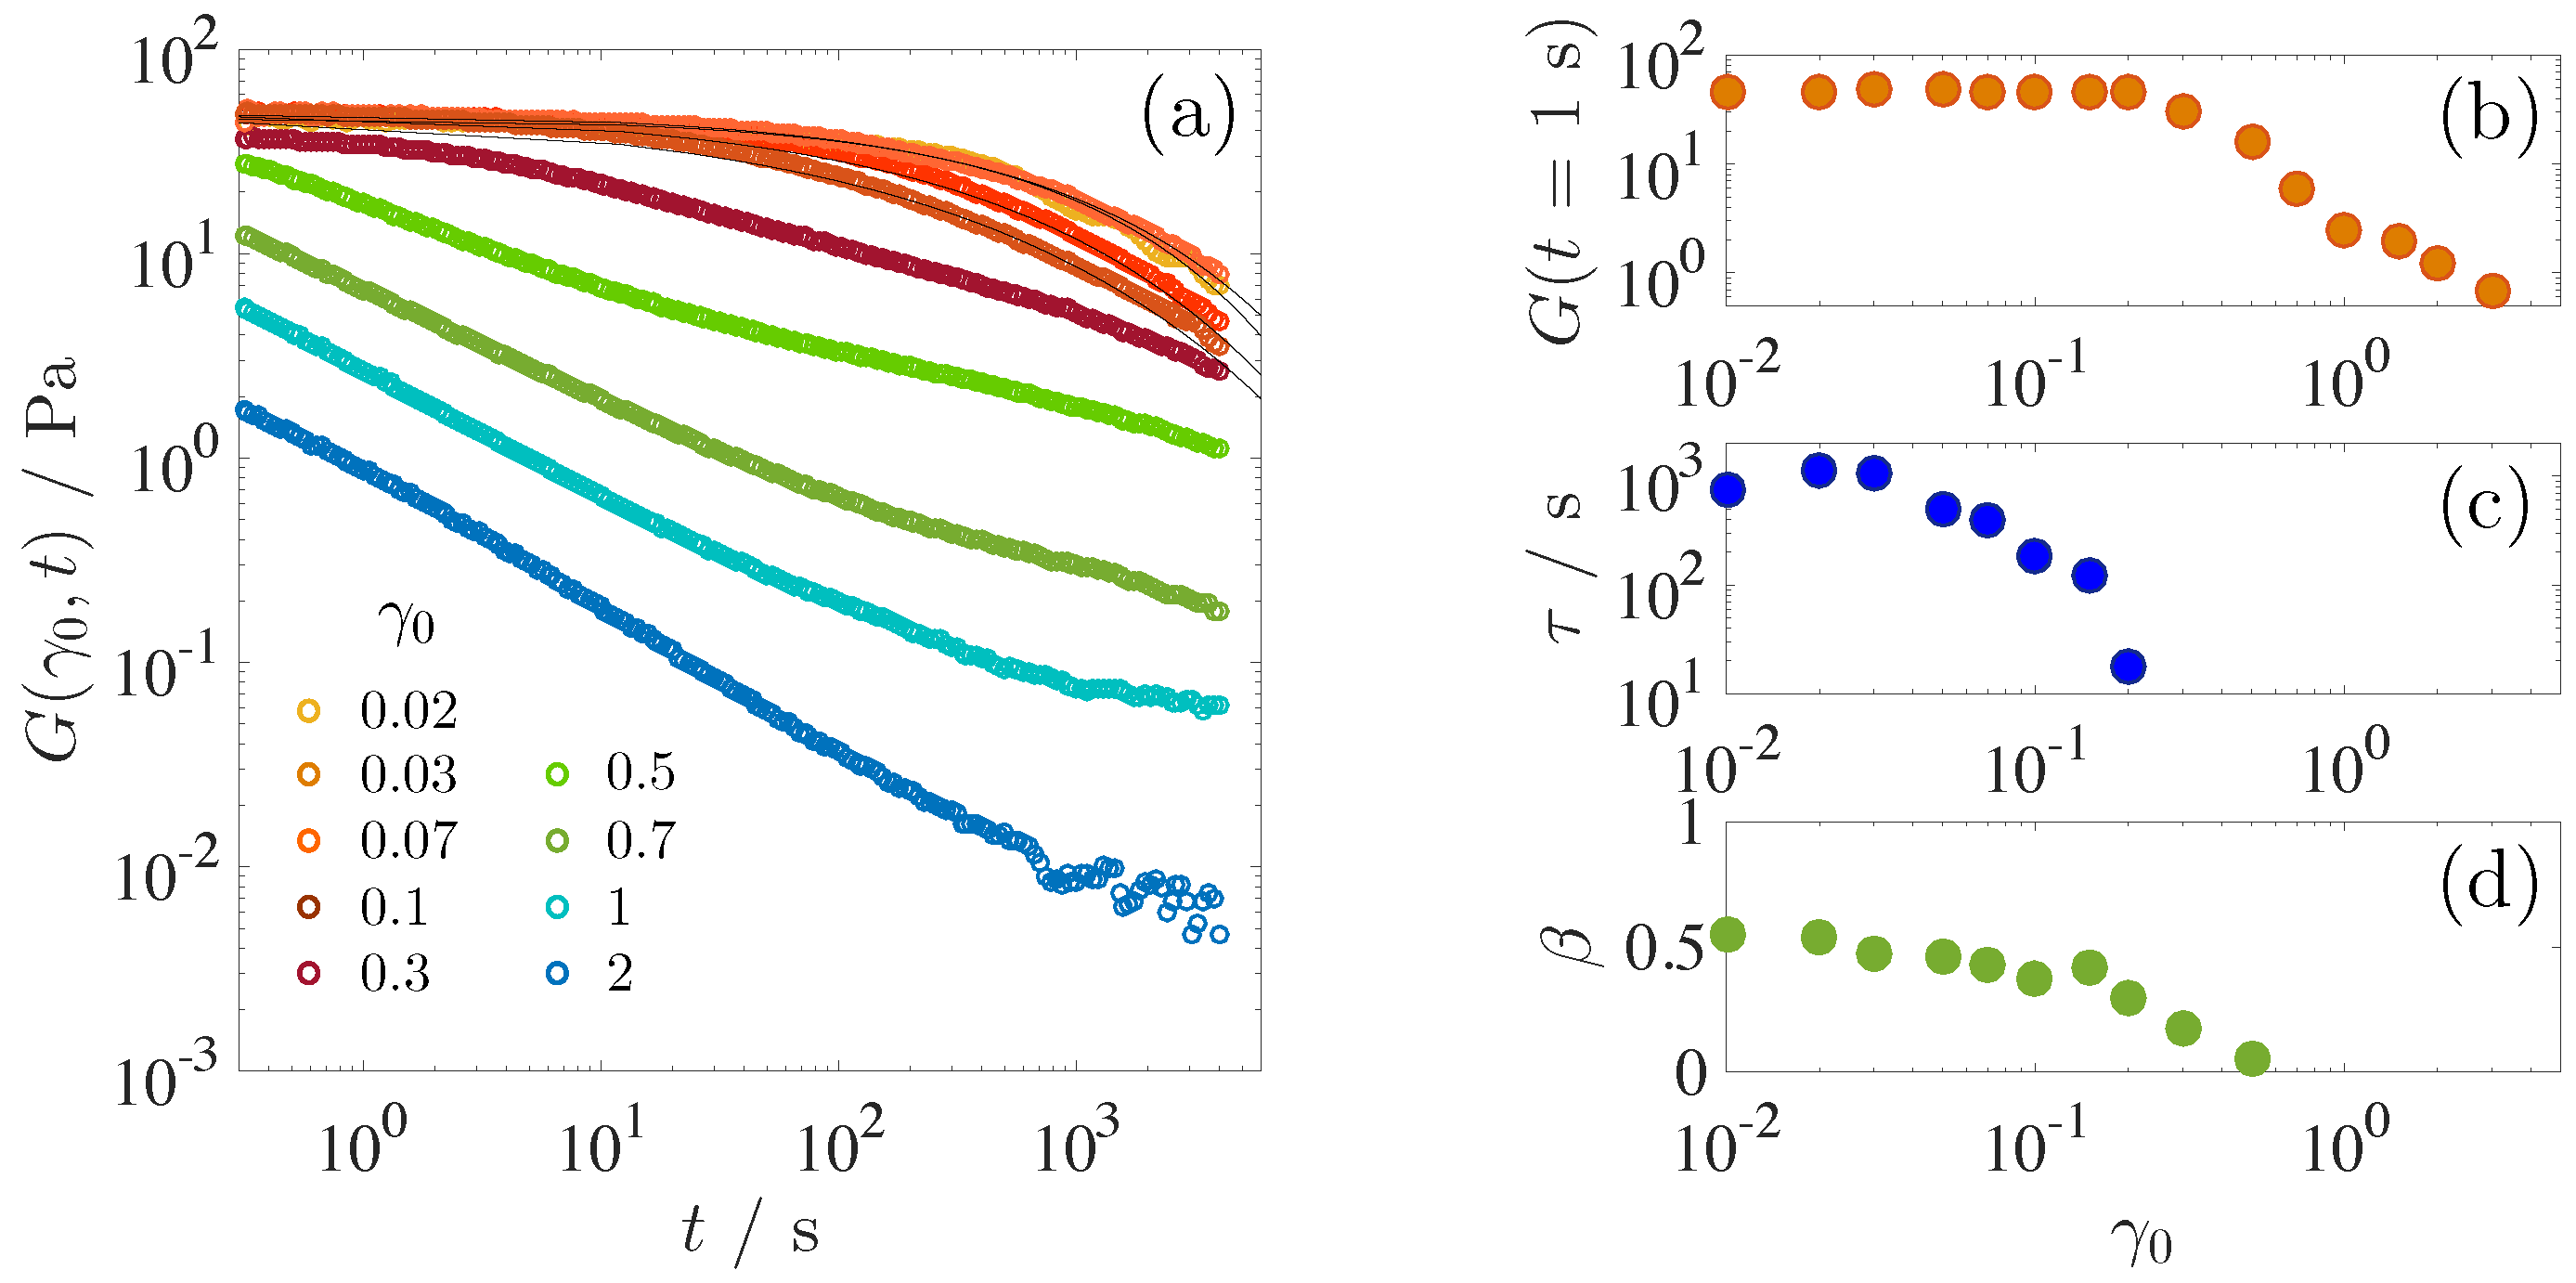
A series of the relaxation moduli measured under various step strains in the range 0.02 2.0 are shown in Figure 5a. Solid curves are the best fit to stretched exponential function;
with a pre-factor , relaxation time and exponent . Relaxation moduli at low strains 0.1 are well fitted with the stretched exponential function as shown in Figure 5a. However, the stretched exponential function is not applicable to the data at large strain > 0.1. As increases, the functional form of the relaxation modulus deviates from the exponential-like function and gradually changes to the power law-like decay in which a characteristic time is not defined. At = 2.0, the relaxation modulus exhibits the power law decay. The power law decay is generally indicative of the poly-dispersity of the relaxation time. It should be noticed that nonlinear shear modulus at = 2.0 has no plateau modulus in the whole frequency region (Figure 4a). Absence of the elastic components under LAOS at = 2.0 is attributed to the fractured disclination networks. Power law decay therefore indicates that the disclination networks are fractured into many domains with different sizes.
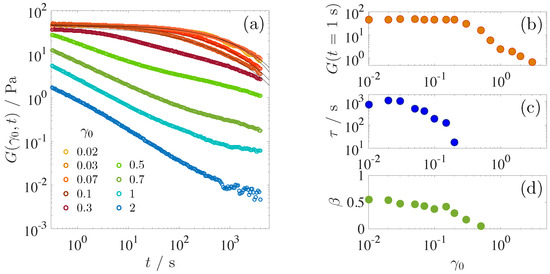
Figure 5.
(a) Nonlinear relaxation modulus at T = 35.1 C. Relaxation moduli obtained at various step strains in the range 0.01 2.0 are shown. Solid lines are the best fit to the stretched exponential function, exp(−(t/)). (b) Value of the relaxation modulus at t = 1 s is plotted as a function of . (c,d) Relaxation time and value of the stretched exponent obtained from the best fit to the stretched exponential function.
Figure 5b–d shows values of the relaxation modulus at t = 1 s, the fitted results for the relaxation time and the stretched exponent , respectively. Similar to the strain amplitude dependence of (Figure 4b), the relaxation modulus at t = 1 s is constant at low but decreases above = 0.2, which is the same as the threshold strain amplitude in LAOS. On the contrary, the relaxation time decreases with even in the linear viscoelastic regime before the nonlinearity appears above = 0.2. Stretched exponent , a measure of the relaxation time distribution, also decreases with , reflecting a broadening of the relaxation time. These results indicate that the step strain induces structural realignment even in the linear viscoelastic regime.
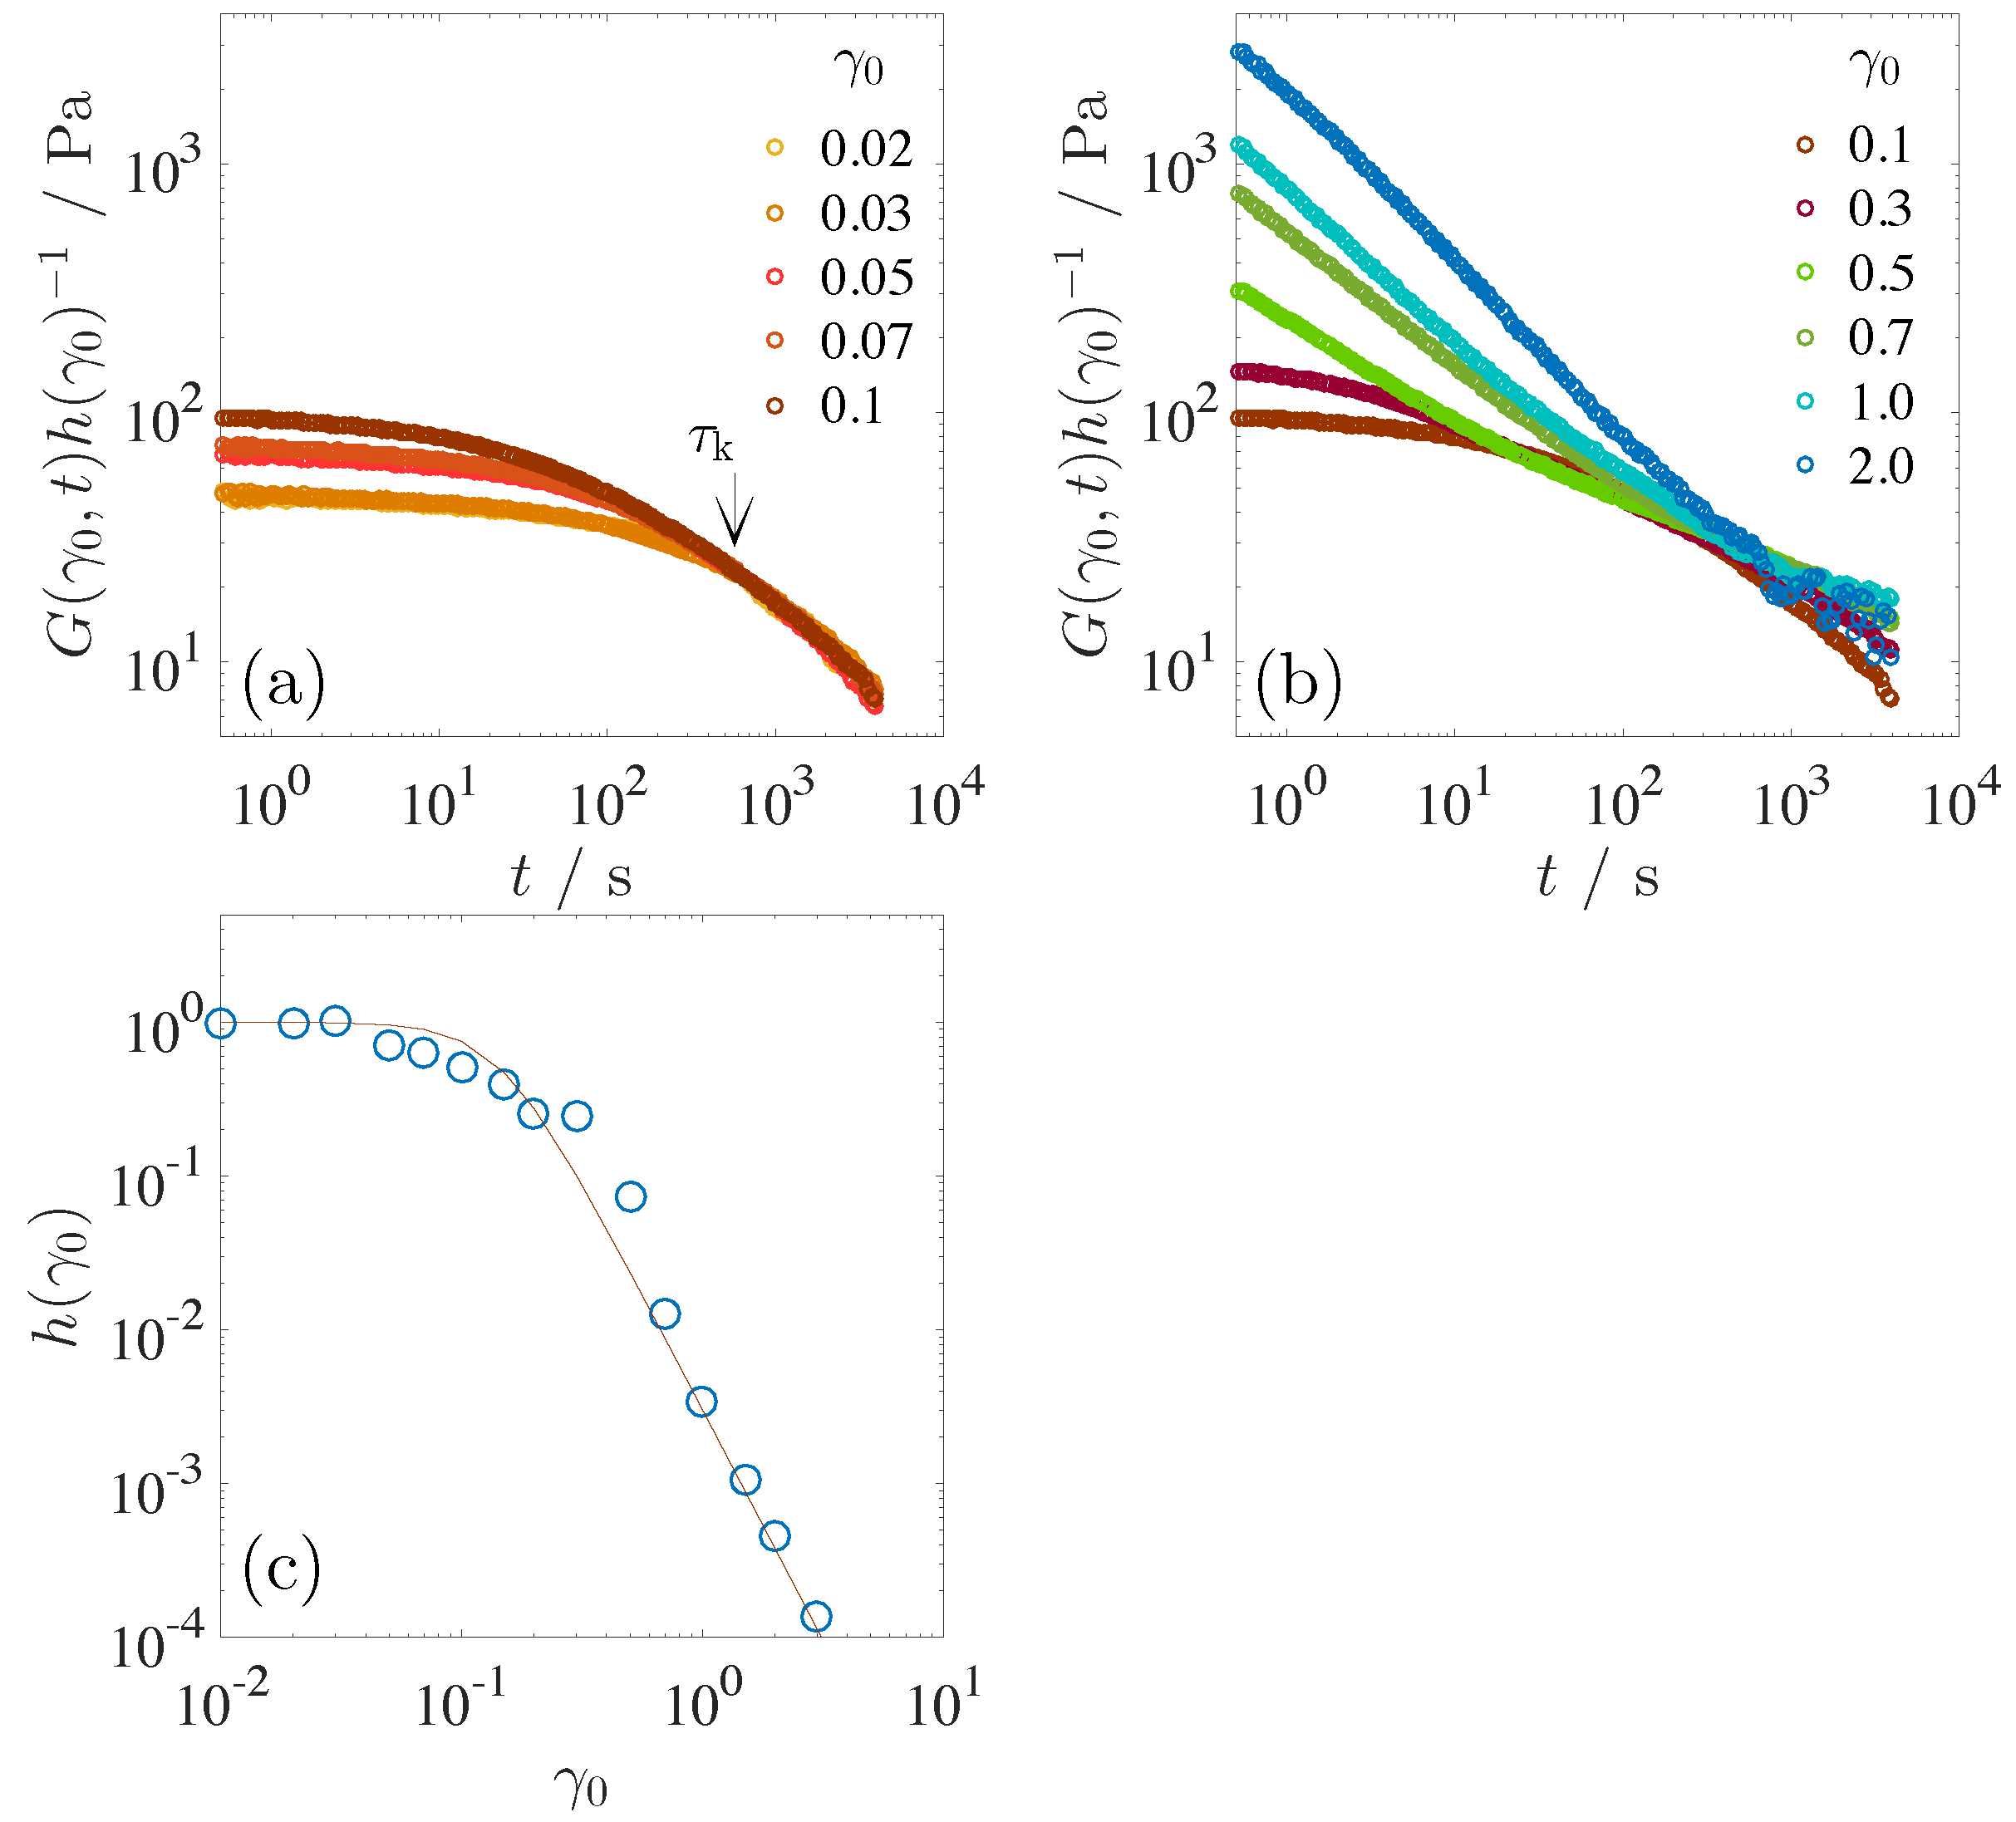
Figure 6a,b shows the relaxation modulus reduced by a damping function . The damping function is defined as = . Here, is a linear relaxation modulus. At lower step strains 0.1, the relaxation curves at long time region after time 630 s collapse to a single curve, independent of the applied step strain, as shown in Figure 6a. Superposition of the relaxation modulus curves by a vertical shift indicates that time–strain separability holds in a relaxation process after [5]. Before , on the other hand, the time–strain separability is not satisfied. According to the vertical shift of the relaxation modulus in the time domain of t > , the damping function is introduced as a shift factor. Contrary to the relaxation moduli at lower step strains, the relaxation moduli under large step strain are not collapsed to the single curve even after the reduction with (Figure 6b). As mentioned before, the functional form of the relaxation modulus changes from the stretched exponential to the power law decay with because of the fracture of the disclination networks. The variation of the functional form with violates the time–strain separability over a broad time range.
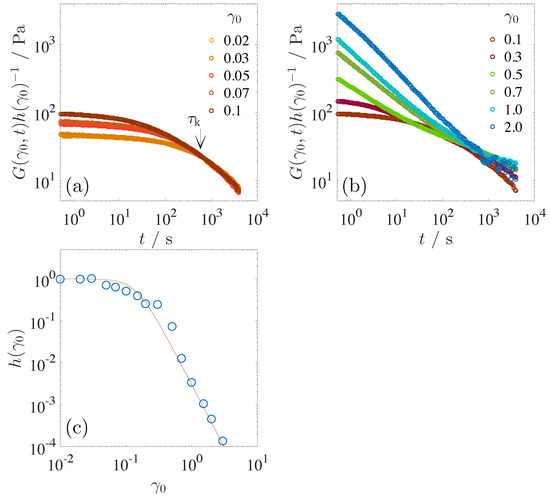
Figure 6.
(a) Relaxation modulus reduced by damping function obtained in the range of the step strain, 0.02 0.1. Arrow indicates a characteristic time beyond which nonlinear relaxation moduli is factorized into separate strain and time-dependent functions, i.e., the time–strain separability holds. (b) Nonlinear relaxation modulus reduced by damping function obtained in large step strain, 0.1 < 2. (c) Damping function . Solid line is the best fit to the equation, with = 330 and a = 3.
The corresponding damping function is shown in Figure 6c. BPIII shows a linear response up to = 0.03, since is constant. In the step strain range of 0.03 < < 0.3, decreases even though this step strain range belongs to the linear viscoelastic regime, as shown in Figure 5b. Formation of the master curve after indicates that the disclination networks are not yet fractured in this strain region but significantly deformed. We should mention that the damping function obtained in Figure 6c is imperfect because of the violation of the time–strain separability at large strain.
Step shear deformation orients the disclination networks, resulting in a finite stress from the resistance of line tension of the disclinations. At small enough strain amplitude where it is assumed that the disclination networks undergo an affine deformation and are not expected to breakup, it will retain a finite amount of stress. The stress relaxes when the disclination networks return to its equilibrium state on the relaxation time scale ∼. Thus, the macroscopic stress in the linear viscoelastic regime is originated from the orientation of the disclination networks. Decrease of and suggests that the deformation of the disclination networks is non-affine. In entangled polymer systems, is a measure of the local chain contraction. Time–strain separability, the formation of single master curve after , is confirmed to hold even for a high step strain above = 10 [44]. It should be noticed that the violation of the time–strain separability over the whole time range does not occur in the entangled polymer system. The violation is unique phenomenon in the BPIII. in the BPIII might also be considered as a characteristic time for the contraction of the oriented disclination networks. Steep decrease of above = 0.3 indicates the softening of the BPIII, which is the fracture. As presented in the previous section, the weak nonlinearity induced by local fracture of the disclination networks initiates at 0.2.
These experimental findings under large step strain; the broadening of the relaxation time produced by breaking up of the structure, the variation of the functional form of the relaxation modulus, and the violation of the time–strain separability, are plausibly accounted for by the fracture of the disclination networks.
2.5. Stress Growth Behavior
Transient response under step strain deformation shows linear and nonlinear response depending on the step strain amplitude. Not only the step shear deformation but also a continuous accumulation of the shear strain induces the structural deformation and break up. In particular, the orientation and fracture of the disclination networks continuously appears during the accumulation of the shear strain. In this section, we present the stress growth behavior under a constant shear rate and explore the fracture behavior.
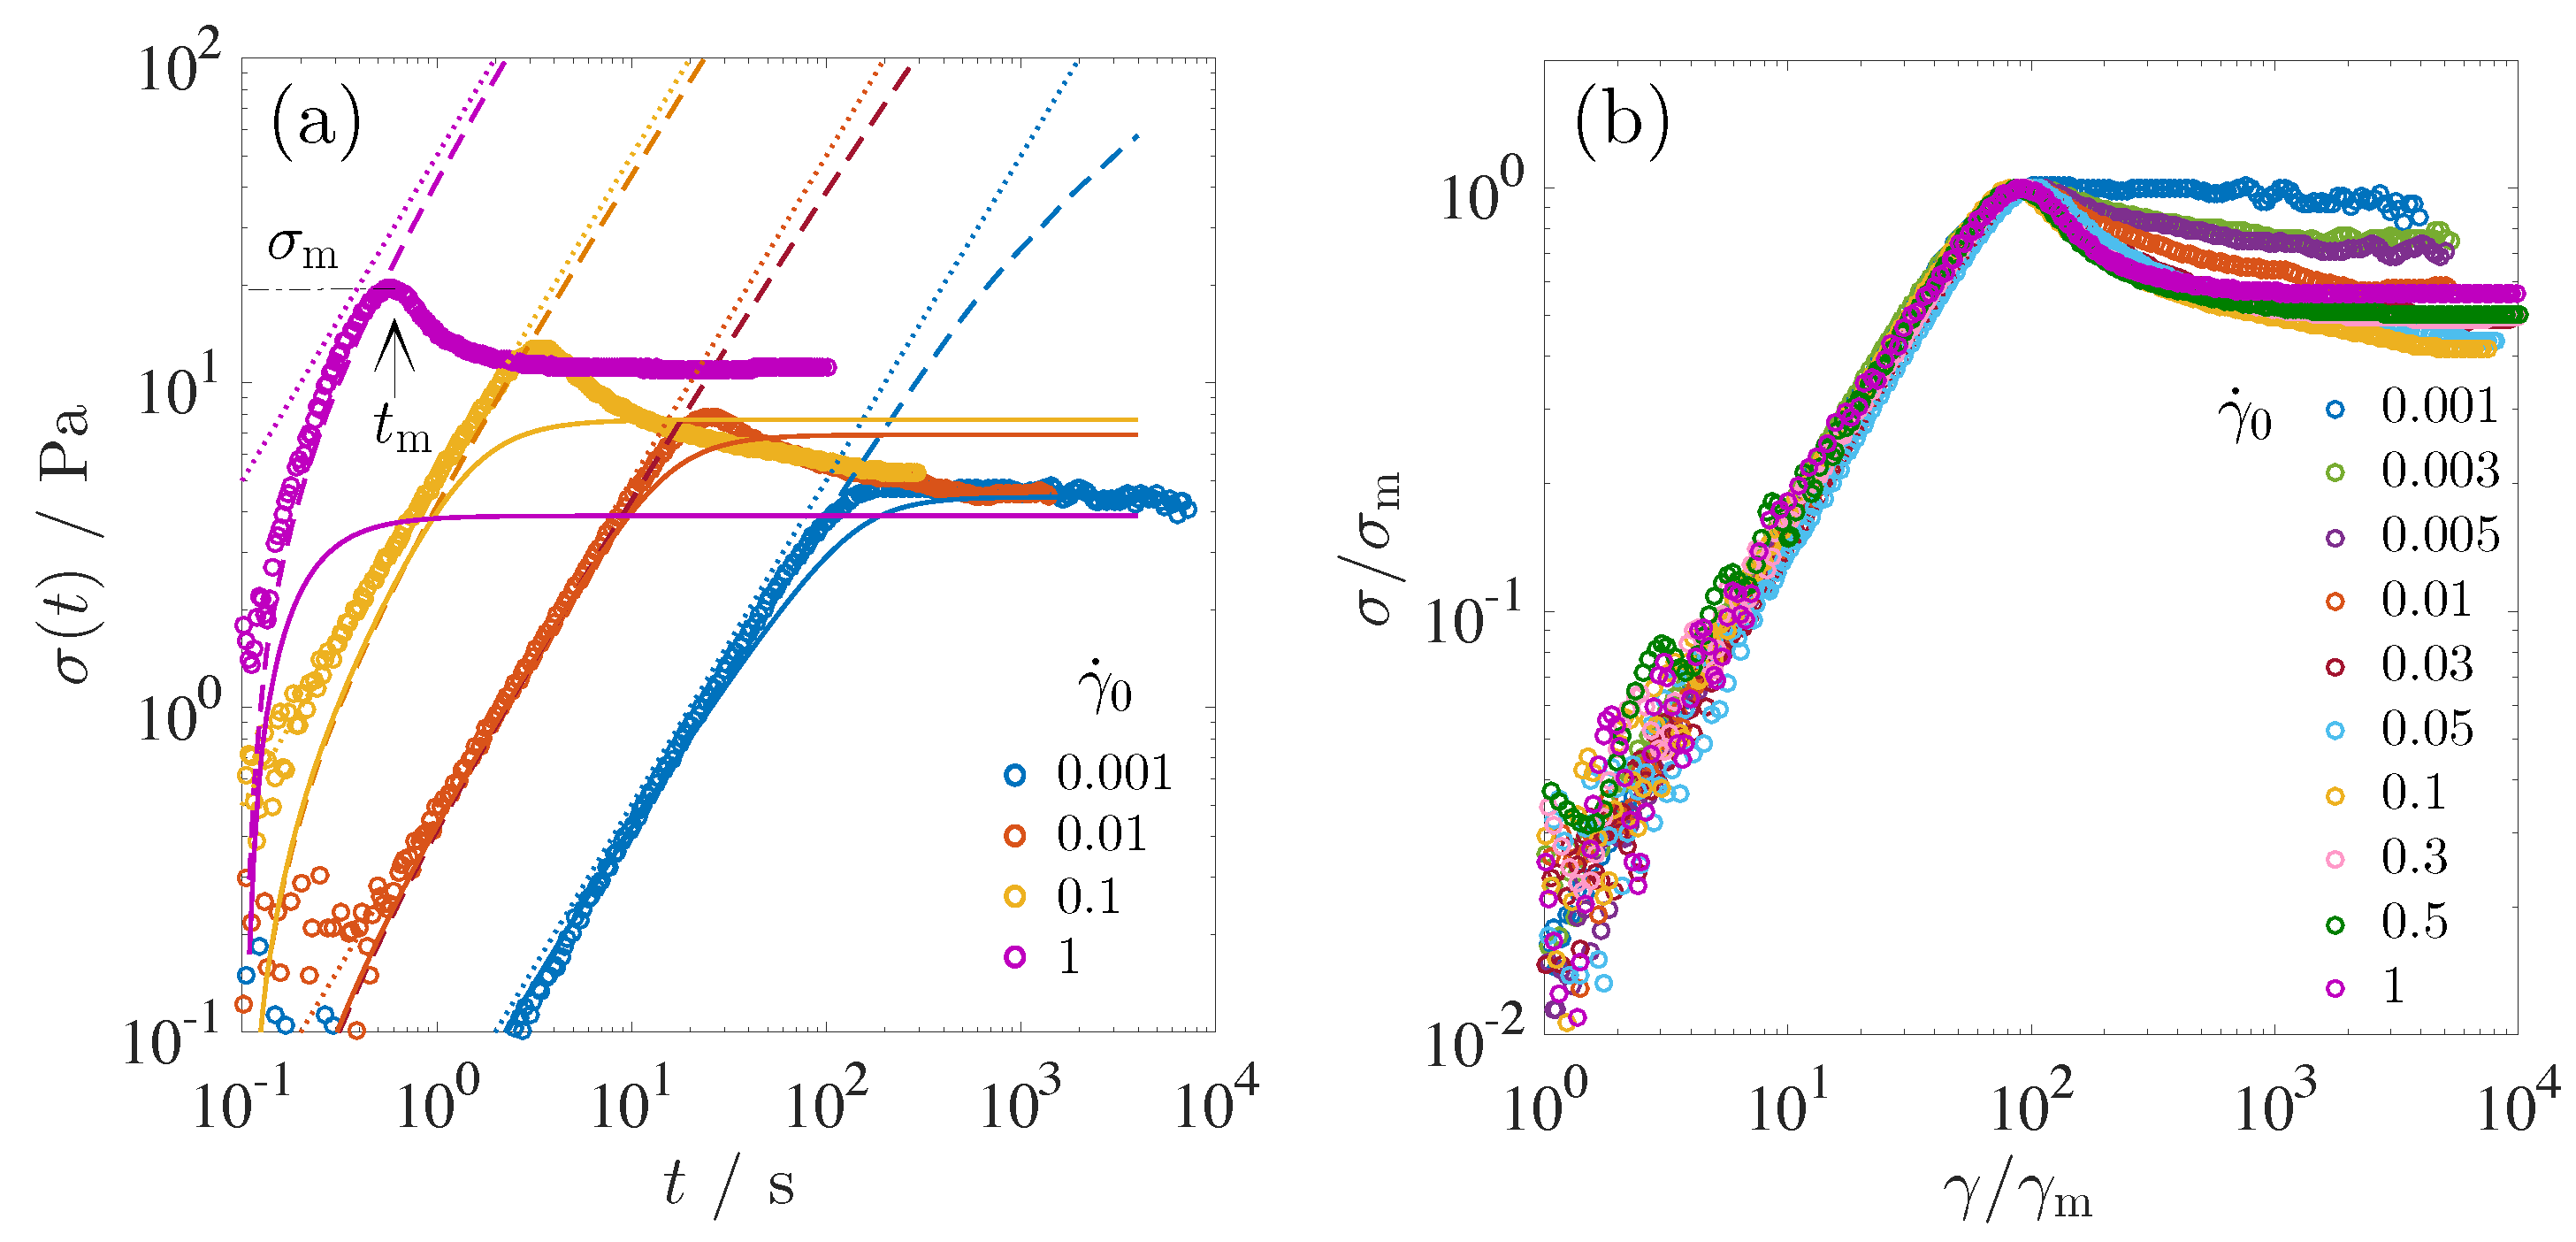
Stress growth experiments are performed by applying a constant shear rate at time t = 0. Figure 7a shows representative stress growth behavior at = 0.001, 0.01, 0.1 and 1 s. In the transient behavior at the lowest shear rate = 0.001 s, increases linearly with time toward a steady state. As the shear rate is increased, the stress growth behavior is characterized by a stress overshoot with a maximum value at t = . It is known that such stress overshoot often occurs when the imposed shear rate exceeds over a terminal relaxation time [5]. It should be noted that the stress overshoot is observed when the applied shear rate exceeds over the reciprocal of , ≃ 0.0016 s. As mentioned in the previous section, would correspond to the contraction time of the oriented disclination lines. If so, the separability time in the BPIII can be a criterion for the appearance of the stress overshoot. Beyond the shear rate faster than , the disclination networks in the BPIII will undergo excessive orientation before it adapts to the shear flow. The appearance of the stress overshoot at > supports that is a characteristic time for the orientation relaxation of the disclination networks.
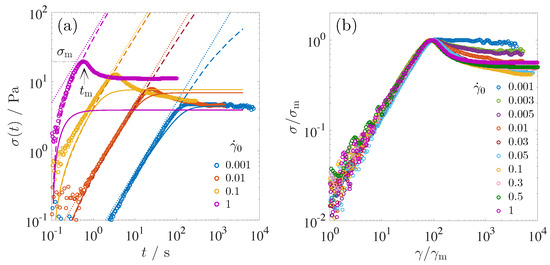
Figure 7.
(a) Stress growth behavior as a function of time for several shear rates applied at t = 0. Shear rates are = 1, 0.1, 0.01, and 0.001 s from left to right. The dotted lines corresponds to = , where the shear modulus is = 54 Pa. The dashed lines indicate the linear viscoelastic stress response predicted by BKZ equation (Equation (3)). The solid lines are K-BKZ equation (Equation (2)). Stress reaches its maximum at a time as shown by an arrow. (b) Normalized shear stress as a function of normalized strain .
As shown by dotted lines, the initial linear growth behavior at = 0.001, 0.01 and 0.1 s is given by , where is the plateau modulus (=54 Pa) shown in Figure 3. However, at = 1 s, the initial stress growth obviously deviates from the linear viscoelasticity behavior . We explain the viscoelastic stress response using a K-BKZ formulation [45,46]:
In the linear viscoleasticity regime where = 1, the stress can be found analytically as
where the relaxation modulus with the stretched exponential functional form (Equation (1)) is substituted into Equation (3). Equation (3) (dashed lines) well describes the experimental data at = 1 s without any fitting parameters. Therefore the BPIII initially undergoes a purely elastic deformation. We also try to describe the whole viscoelastic stress response including nonlinear behavior using K-BKZ equation (Equation (2)). Here, substituting the damping function fitted to the experimental data in Figure 6c into Equation (2) and integrating numerically, we obtain the solid lines in Figure 7a. Stress response at = 0.001 s is well described by K-BKZ equation, and the steady state value of the stress is also consistent with the experimental data. At = 0.01 s, K-BKZ equation coincides with the experimental data only in the elastic deformation region. K-BKZ equation deviates from before the stress overshoot. As the shear rate further increases, disagreement of K-BKZ equation with the stress growth curves becomes larger. Failure of the prediction is attributed to the variation of the functional form of the relaxation modulus, which drastically changes with the step strain (Figure 6a,b).
The corresponding normalized stress responses are shown as a function of the normalized strain in Figure 7b. collapse onto a single master curve only in the elastic deformation regime. As mentioned previously, BPIII undergoes purely elastic deformation in the initial linear growth. Deviation of each curve at is thus associated with the rearrangement and fracture of the disclination networks.
This stress overshoot phenomenon is resembles the yield behavior of soft glassy materials such as emulsions, microgels, and colloidal suspensions [34,37,39]. The soft glassy materials show the soft solid-like property at rest, and they turn liquid-like above the yield stress. In these materials, the stress overshoot is a sign of the yield stress. The soft glassy materials are characterized by jammed state of microstructures which are in structurally disordered arrangement. In the case of the BPIII, the disclination networks first show the elastic response in the initial linear growth of the stress. As the shear strain is accumulated, the disclination network undergoes the orientation. Eventually, the oriented network will break up at the stress maximum and reach to the steady state by flowing. It would be interesting to investigate if phase transition from BPII to more fluid liquid crystal occurs in the future.
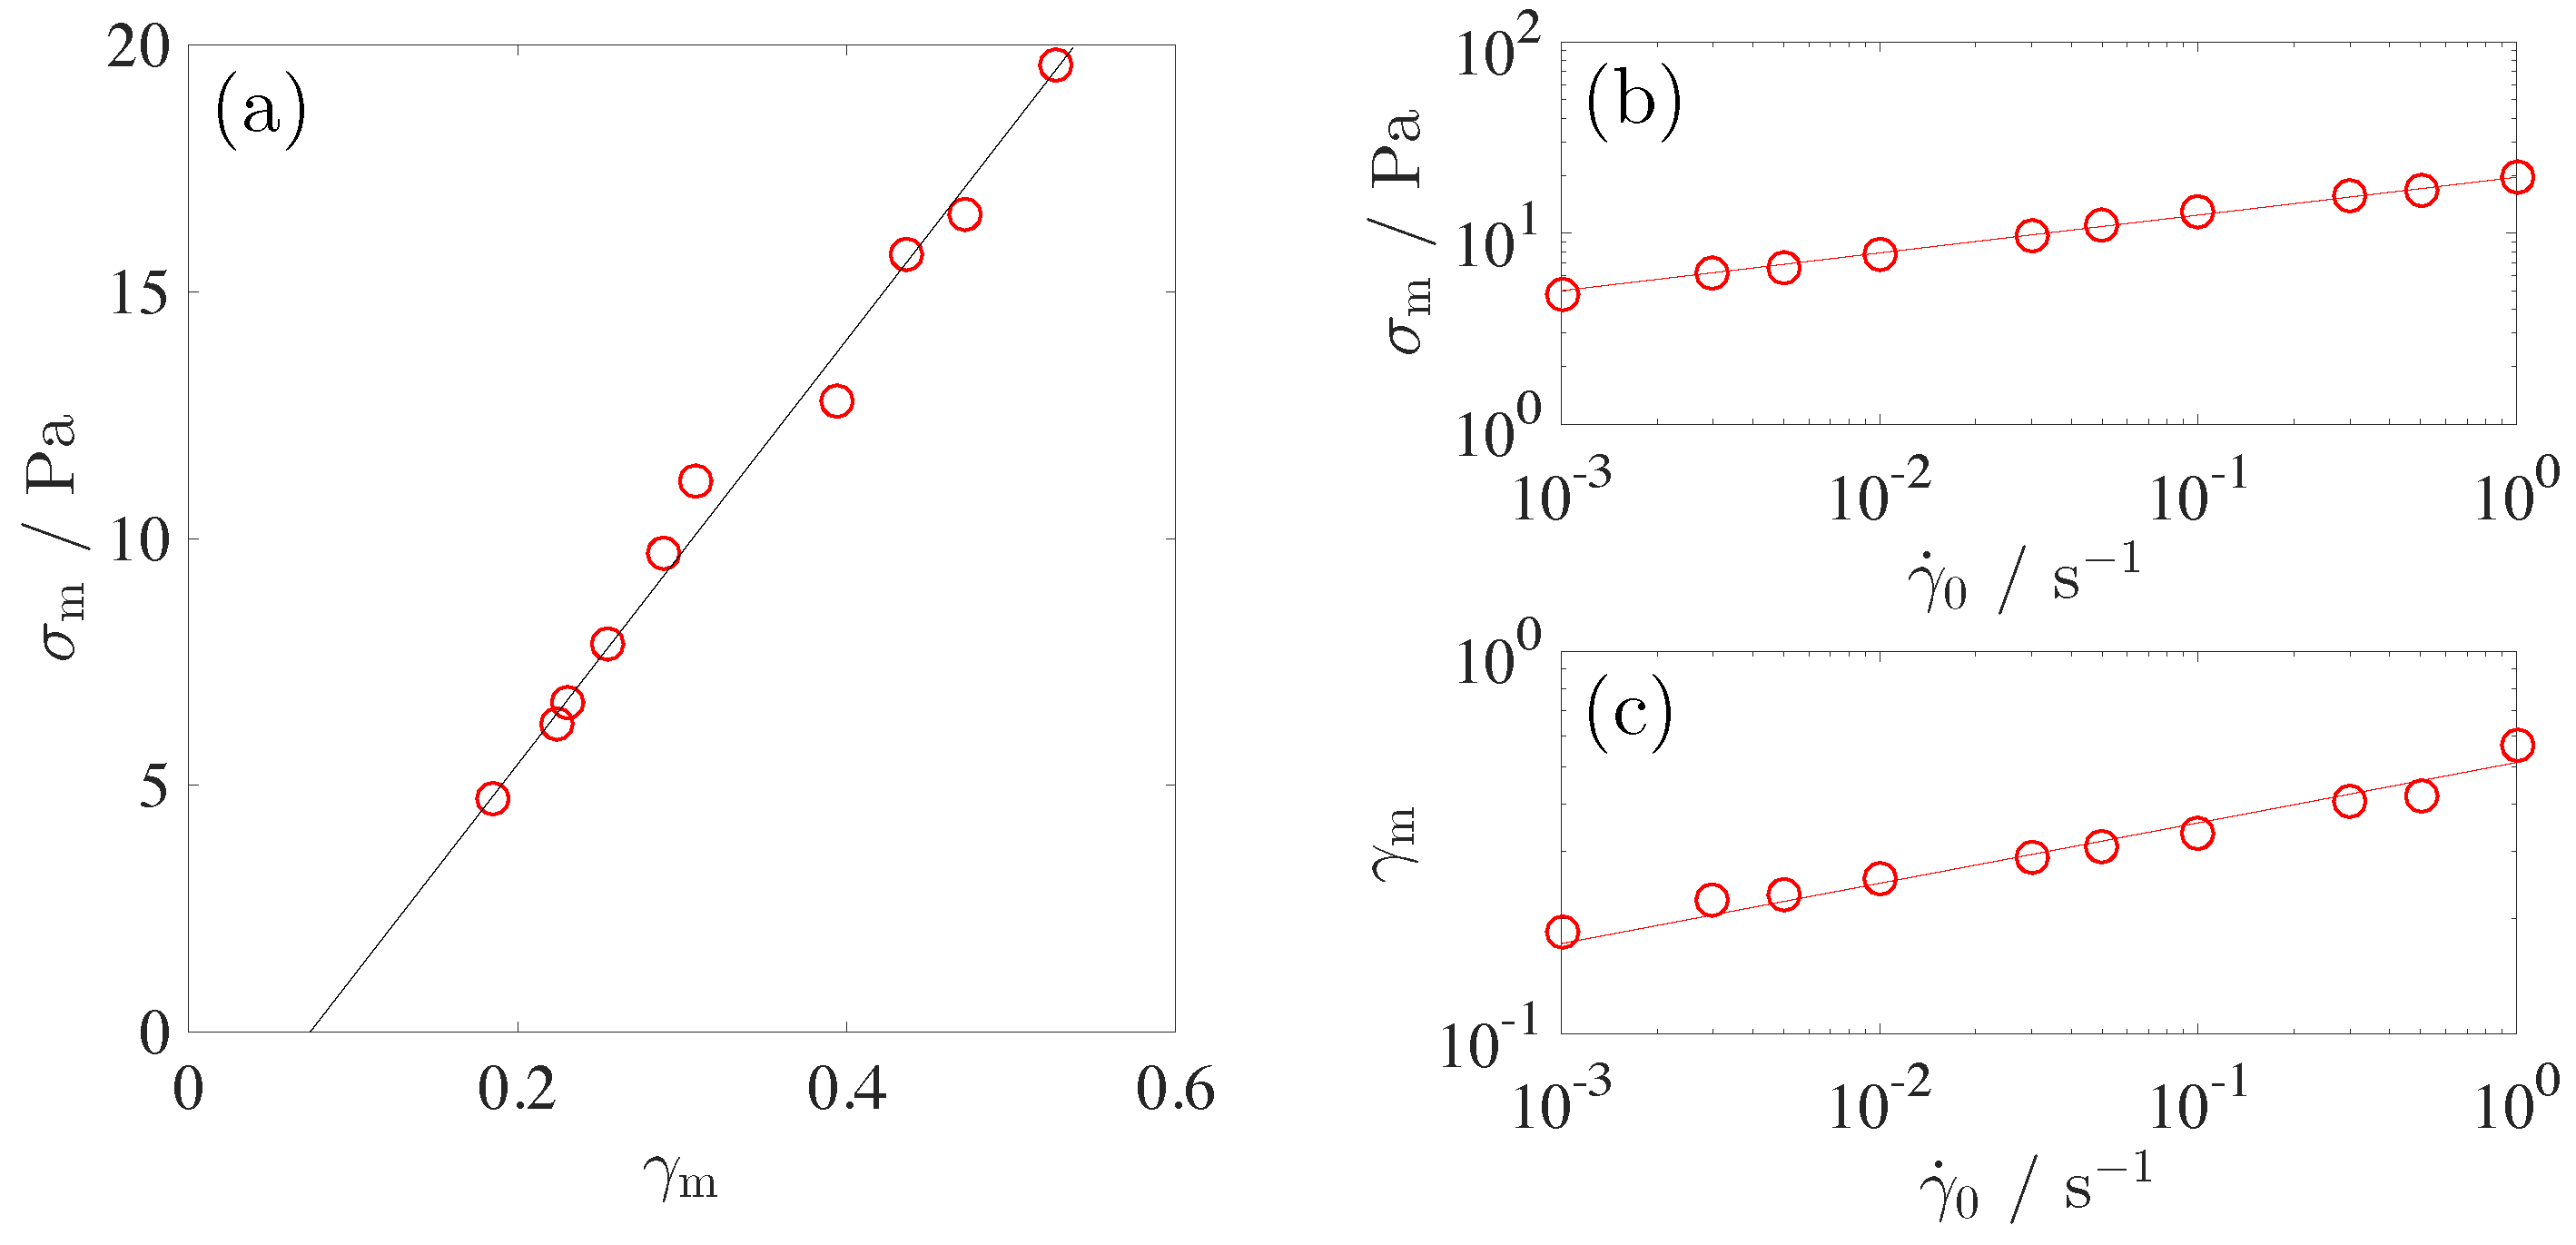
Figure 8 shows that is a linear function of the strain = at the maximum. The slope corresponding to the effective modulus, = , is estimated to be 42 Pa, which is softer than its initial state in the linear viscoelasticity regime, = 54 Pa. The elastic modulus at the yield point is regarded as a limit value beyond which the disclination networks bearing an external shear deformation begin to break. Figure 8b,c shows the failure criterion of and as a function of the applied shear rate. The stress at the yield point increases as a weak power law, = 19.6 . Strain also shows a power law increase as = 0.513 . Power law relation suggests that the fracture of the disclination networks delays with .
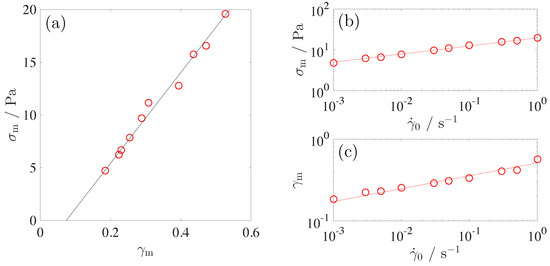
Figure 8.
(a) The peak shear stress as a function of the strain at the overshoot point. The slope corresponds to the modulus at the yield point, 42 Pa. (b) Critical stress as a function of applied shear rate. (c) Critical shear strain as a function of applied shear rate. Solid lines show the power law relations.
Similar scaling behavior of and with has been reported for some colloidal particle systems [34,37,38,47]. Observed power law exponent varies from system to system. One of the models describing the failure of brittle material such as elastomer and glasses is a fiber-bundle model (FBM) [48]. Physical origin of the fracture in this model is the accumulation of local failure events. Failure events proceeds with two steps; the first process is immediate breaking which occurs when the stress exceeds the mechanical strength of the fibers, and the second one is a delayed fracture dominated by the rate of damage accumulation. Scaling behavior of and with is presumably explained by assuming the power law dependence of the rate of damage accumulation on the stress.
Upon deformation, each disclination network first suffers an orientation. A strained disclination segment would resist the deformation with the form of a recovery force. The recovery force originates from the elastic resistance of the disclination lines against deformation and increases with accumulated strain. In this simple view of the disclination-mediated rheology, the elastic linear growth of the stress in Figure 7 reflects the resistance of all disclination segments arisen in response to the shear deformation. However, this simple picture does not explain the shear rate dependences of and because the viscoelastic effect is not considered. Deformation of the blue phases is achieved simultaneously by rearrangement of the disclination lines and by realigning the double twist cylinders, which are a viscoelastic matrix with organized structure. Under the continuous deformation, therefore, the viscous force exerted on the disclination lines is produced in the matrix. In other words, the orientation of the disclination lines is supported by the viscous force. In contrast to the recovery force which increases with the orientation of the disclinations, the viscous force decays down as the matrix realigns along the shear flow. A retardation due to the viscous relaxation would lead to the delay effect on the stress overshoot.
If the delayed fracture due to the viscous relaxation is the origin of the power law dependence, creep compliance measurements will provide more detailed fracture behavior. The creep compliance measurement is possible with the use of the stress-controlled rheometer. The delayed fracture behavior with the use of the creep compliance measurement will be the next topic to elucidate the nonlinear viscoelasticity of the BPIII.
3. Conclusions
We studied the nonlinear viscoelasticity of the blue phase III by applying different type of shear deformations; large amplitude oscillatory shear, step shear strain, and continuous shear deformation. Combining all the experimental results, we identify different viscoelastic regimes which are closely related to the rearrangement and fracture of the disclination networks. The experimental findings are summarized.
In the small strains, the shear modulus is independent of the strain amplitude (Figure 4), and the stress linearly increases with strain (Figure 7). These purely elastic behaviors prove the linear viscoelasticity of the BPIII. However, the strain dependence of the relaxation time and its distribution (Figure 5) suggest that the disclination networks undergoes non-affine deformation without breaking the disclination networks. The linear viscoelasticity of the BPIII is thus characterized by the elastic and non-affine deformation without breaking the disclination networks.
Following the linear response, the nonlinear regime initiates as shown in Figure 4. The frequency dependence of complex modulus measured under LAOS (Figure 4) clarifies that the nonlinear behavior is classified into two regimes: the weak regime in the range 0.2 1 and the strong nonlinear regime above 2. The weak nonlinear regime is characterized by the existence of the second plateau modulus at low . In this regime, the disclination networks are locally fractured but still keep the connectivity. Because of the local connectivity of the disclination networks, the elastic response is weakly observed as the second plateau modulus. Local fracture of the networks is also presumed by poly-dispersity of the relaxation time in the relaxation modulus (Figure 5). The weak nonlinear regime is therefore characterized by the fragmentation of the disclination networks. Further increase of the strain amplitude leads the strong nonlinear response, where the elastic response disappears. Contrary to the weak nonlinear regime, the shear modulus shows no second plateau. Under such a large amplitude oscillation, the disclination networks fractures into many fragments, which results in the loss of the elasticity of the BPIII.
Transient behavior under continuous shear deformation reveals that the yield point depends on the shear rate. Shear rate dependence of the disclination network would be a result of the delay effect due to the viscous force, which will be investigated in detail by performing the creep compliance measurement. Future work will deal with the creep compliance measurement by using the stress-controlled rheometer. Waveform analysis under LAOS provides the elastic stress and viscous stress separately. It would be interesting to investigate the nonlinear behavior of the elastic and viscous stresses separately and discuss their role on the nonlinearity. Measurement of differential modulus defined as = will make it possible. Finally, we still need investigations to distinguish the rheological behavior between ordered and amorphous disclination networks. In particular, rheological measurements in a microscopic scale will provide detailed information on the viscoelasticity of the disclination lines.
4. Materials and Methods
4.1. Material
Cholesteryl oleyl carbonate (COC) in solid form was obtained from Sigma-Aldrich. We used COC without further purification.
4.2. Methods
Viscoelastic measurements were performed using an ARES-G2 strain-controlled rheometer TA Instrument Co., Ltd. (New Castle, DE, USA) with a cone–plate geometry (diameter = 50 mm, cone angle = rad). Sample solution was always loaded on the plate at T = 37 C corresponding to the isotropic phase. After loading sample, temperature was set to the measurement condition by cooling the system. In viscosity measurements, shear rates ranging from = 1000 s were applied and the viscosity was measured. The subsequent shear rate sweep proceeded from high to low shear rate. Thus, the samples were always pre-sheared. Each shear rate was applied for 600 s, and the viscosity was averaged over 120 s at every fixed shear rate. Dynamic viscoelasticity was measured in the angular frequency regime ranging from = 500–0.1 rad·s.
Microscope observation at quiescent state was performed using cross-polarized mode with an Olympus BX51 microscope with a 10× objective. Temperature was controlled by using Linkam hot stage 10021. Microscopy images were obtained by CMOS camera, HAS-L1, Ditect Ltd Co., (Tokyo, Japan) Because of different light source in microscope observations, typical platelet texture of the blue phase shows different color depending on the light source.
In rheological and microscopic measurements, no surface treatment was performed.
Author Contributions
S.F. conceived and designed the experiments; S.F. performed the experiments; S.F. analyzed the data; Y.S. and H.O. contributed data analysis and discussion; and S.F. wrote the paper.
Conflicts of Interest
The authors declare no conflict of interest.
References
- De Gennes, P.G.; Prost, J. The Physics of Liquid Crystal.; Clarendon Press: Oxford, UK, 1995; ISBN 0198517858. [Google Scholar]
- Mus̆evic, I.; S̆karabot, M.; Tkalec, U.; Ravnik, M.; Z̆umer, S. Two-Dimentional Nematic Colloidal Crystals Slef-Assembled by Topological Defects. Science 2006, 313, 954–958. [Google Scholar] [CrossRef] [PubMed]
- Ramos, L.; Zapotocky, M.; Lubensky, T.C.; Weitz, D.A. Rheology of Defect Networks in Cholesteric Liquid Crystals. Phys. Rev. E 2002, 66, 031711. [Google Scholar] [CrossRef] [PubMed]
- Z̆umer, S.; Fukuda, J.; Ravnik, M. Confined Colloidal Blue Phases with Potential for Photonics. Mol. Cryst. Liq. Cryst. 2012, 561, 107–114. [Google Scholar] [CrossRef]
- Larson, R.G. The Structure and Rheology of Complex Fluids. In The Structure and Rheology of Complex Fluids; Oxford University Press: Oxford, UK, 1999; pp. 32–58. [Google Scholar]
- Oswald, P.; Pieranski, P. Nematic and Cholesteric Liquid Crystals: Concepts and Physical Properties Illustrated by Experiments; CRC Press: Oxford, UK, 2005; ISBN 9780415321402. [Google Scholar]
- Gray, G.W. The mesomorphic behaviour of the fatty esters of cholesterol. J. Chem. Soc. 1956, 3733–3739. [Google Scholar] [CrossRef]
- Saupe, A. On Molecular Structure and Physical Properties of Thermotropic Liquid Crystals. Mol. Cryst. Liq. Cryst. 1969, 7, 59–74. [Google Scholar] [CrossRef]
- Meiboom, S.; Sethna, J.P.; Anderson, P.W.; Brinkman, W.F. Theory of Blue Phase of Cholesteric Liquid Crystals. Phys. Rev. Lett. 1981, 46, 1216–1219. [Google Scholar] [CrossRef]
- Crooker, P.P. Plenary Lecture. The blue phases. A review of experiments. Liq. Cryst. 1989, 5, 751–775. [Google Scholar] [CrossRef]
- Tanaka, S.; Yoshida, H.; Kawata, Y.; Kuwahara, R.; Nishi, R.; Ozaki, R. Double-Twist Cylinders in Liquid Crystalline Cholesteric Blue Phases Observed by Transmission Electron Microscopy. Sci. Rep. 2015, 5, 16180. [Google Scholar] [CrossRef] [PubMed]
- Martínez-González, J.A.; Li, X.; Sadati, M.; Zhou, Y.; Zhang, R.; Nealey, P.F.; de Pablo, J.J. Directed self-assembly of liquid crystalline blue-phases into ideal single-crystals. Nat. Comm. 2018, 8, 15854. [Google Scholar] [CrossRef] [PubMed]
- Fukuda, J.; Z̆umer, S. Structural Forces in Liquid-Crystalline Blue Phases. Phys. Rev. E 2011, 104, 017801. [Google Scholar] [CrossRef] [PubMed]
- Sahoo, R.; Chojnowska, O.; Dabrowski, R.; Dhara, S. Experimental studies on the rheology of cubic blue phases. Soft Matter 2016, 12, 1324–1329. [Google Scholar] [CrossRef] [PubMed]
- Fujii, S.; Henrich, O. Shear-enhanced elasticity in the cubic blue phase I. 2008; to be submitted. [Google Scholar]
- Dupuis, A.; Marenduzzo, D.; Orlandini, E.; Yeomans, J.M. Rheology of Cholesteric Blue Phases. Phys. Rev. Lett. 2015, 95, 097801. [Google Scholar] [CrossRef] [PubMed]
- Henrich, O.; Stratford, K.; Marenduzzo, D.; Coveney, P.V.; Cates, M.E. Confined Cubic Blue Phases under Shear. J. Phys. Condens. Matter 2012, 24, 284127. [Google Scholar] [CrossRef] [PubMed]
- Henrich, O.; Stratford, K.; Coveney, P.V.; Cates, M.E.; Marenduzzo, D. Rheology of Cubic Blue Phases. Soft Matter 2013, 9, 10243–10256. [Google Scholar] [CrossRef]
- Henrich, O.; Stratford, K.; Cates, M.E.; Marenduzzo, D. Structure of Blue Phase III of Cholesteric Liquid Crystals. Phys. Rev. lett. 2011, 106, 107801. [Google Scholar] [CrossRef] [PubMed]
- Ocak, H.; Bilgin-Eran, B.; Prehm, M.; Schymura, S.; Lagerwall, J.P.F.; Tschierske, C. Effects of chain branching and chirality on liquid crystalline phases of bent-core molecules: Blue phases, de Vries transitions and switching of diastereomeric states. Soft Matter 2011, 7, 8266–8280. [Google Scholar] [CrossRef]
- Gandhi, S.S.; Kim, M.S.; Hwang, J.-Y.; Chien, L.-C. Electro-optical memory of a nanoengineered amorphous blue-phase-III polymer scaffold. Adv. Mater. 2016, 28, 8998–9005. [Google Scholar] [CrossRef] [PubMed]
- Kim, M.S.; Chien, L.-C. Topology-mediated electro-optical behaviour of a wide-temperature liquid crystalline amorphous blue phase. Soft Matter 2015, 11, 8013–8018. [Google Scholar] [CrossRef] [PubMed]
- Henrich, O.; Marenduzzo, D. The secret of the blue fog. Phys. World 2017, 30, 25. Available online: https://physicsworld.com/a/the-secrets-of-the-blue-fog/ (accessed on 6 April 2017). [CrossRef]
- Gandhi, S.S.; Chien, L.-C. Unraveling the mystery of the blue fog: Structure, properties, and applications of amorphous blue phase III. Adv. Mater. 2017, 29, 1704296. [Google Scholar] [CrossRef] [PubMed]
- Gandhi, S.S.; Li, Y.; Luo, D.; Chien, L.-C. Laser emission in a 3D nanoporous polymer replica of amorphous blue phase III. J. Polym. Sci. B Polym. Phys. 2018, 56, 551–557. [Google Scholar] [CrossRef]
- Kikuchi, H.; Yokota, M.; Hisakado, Y.; Yang, H.; Kajiyama, T. Polymer-stabilized liquid crystal blue phases. Nat. Mater. 2002, 1, 64. [Google Scholar] [CrossRef] [PubMed]
- Kitzerow, H.-S.; Crooker, P.P.; Heppke, G. Line shapes of field-induced blue-phase-III selective reflections. Phys. Rev. Lett. 1991, 67, 2151–2154. [Google Scholar] [CrossRef] [PubMed]
- Iwamochi, H.; Yoshizawa, H. Electro-optical switching in blue phases induced using a binary system of a T-shaped nematic liquid crystal and a chiral compound. Appl. Phys. Exp. 2008, 1, 111801. [Google Scholar] [CrossRef]
- Sato, M.; Yoshizawa, H. Electro-optical switching in a blue phase III exhibited by a chiral liquid crystal oligomer. Adv. Mater. 2007, 19, 4145–4148. [Google Scholar] [CrossRef]
- Kedziora, P.; Wojciechowski, K.W. Nonlinear dielectric relaxation in the isotropic phase and mesophases of cholesteryl oleyl carbonate. J. Phys. Chem. B 2009, 113, 9123–9128. [Google Scholar] [CrossRef] [PubMed]
- Yamada, T.; Fukuda, E. Non-newtonian viscosity of liquid crystals formed by cholesteryl oleyl carbonate. Jpn. J. Appl. Phys. 1973, 12, 68–72. [Google Scholar] [CrossRef]
- Taushanoff, S.; Le, V.K.; Williams, J.; Twieg, R.J.; Sadashiva, B.K.; Takezoe, H.; Jákli, A. Stable amorphous blue phase of bent-core nematic liquid crystals doped with a chiral material. J. Mater. Chem. 2010, 5893–5898. [Google Scholar] [CrossRef]
- Le, K.V.; Aya, S.; Sasaki, Y.; Choi, H.; Araoka, F.; Ema, K.; Mieczkowski, J.; Jákli, A.; Ishikawa, K.; Takezoe, H. Liquid crystalline amorphous blue phase and its large electrooptical Kerr effect. J. Mat. Chem. 2011, 21, 2855. [Google Scholar] [CrossRef]
- Divoux, T.; Barentin, C.; Manneville, S. Stress overshoot in a simple yield stress fluid: An extensive study combining rheology and velocimetry. Soft Matter 2011, 7, 9335–9349. [Google Scholar] [CrossRef]
- Lin, Y.-C.; Yao, N.Y.; Broedersz, C.P.; Herrmann, H.; MacKintosch, F.C.; Weitz, D.A. Origins of Elasticity in Intermediate Filament Networks. Phys. Rev. Lett. 2010, 104, 058101. [Google Scholar] [CrossRef] [PubMed]
- Carrier, V.; Petekidis, G. Nonlinear rheology of Colloidal Glasses of Soft Thermosensitive Microgel Particles. J. Rheol. 2009, 53, 245–273. [Google Scholar] [CrossRef]
- Koumakis, N.; Petekidis, G. Two step yielding in attractive colloids: Transition from gels to attractive glasses. Soft Matter 2011, 7, 2456–2470. [Google Scholar] [CrossRef]
- Derec, C.; Ducouret, G.; Ajdari, A.; Lequeux, F. Aging and nonlinear rheology in suspensions of polyethylene oxide-protected silica particles. Phys. Rev. E 2003, 67, 061403. [Google Scholar] [CrossRef] [PubMed]
- Ovarlez, G.; Rodts, S.; Ragouilliaux, A.; Coussot, P.; Goyon, J.; Colin, A. Wide-Gap Couette Flows of Dense Emulsions: Local Concentration Measurements, and Comparison Between Macroscopic and Local Constitutive Law Measurements Through Magnetic Resonance Imaging. Phys. Rev. E 2008, 78, 036307. [Google Scholar] [CrossRef] [PubMed]
- Hyun, K.; Wilhelm, M.; Klein, C.O.; Cho, K.S.; Nam, J.G.; Ahn, K.H.; Lee, S.J.; Ewoldt, R.H.; McKinley, G.H. A review of nonlinear oscillatory shear tests: Analysis and application of large amplitude oscillatory shear (LAOS). Prog. Polym. Sci. 2011, 36, 1697–1753. [Google Scholar] [CrossRef]
- Sim, H.G.; Ahn, K.H.; Lee, S.J. Large amplitude oscillatory shear behavior of complex fluids investigated by a network model: A guideline for classification. J. Non-Newton. Fluid Mech. 2003, 112, 237–250. [Google Scholar] [CrossRef]
- Raghavan, S.R.; Khan, S.A. Shear Induced Microstructural Changes in Flocculated Suspensions of Fumed Silica. J. Rheol. 1995, 39, 1311–1325. [Google Scholar] [CrossRef]
- Parthasarathy, M.; Klingenberg, D.J. Large Amplitude Oscillatory Shear of ER Suspensions. J. Non-Newton. Fluid Mech. 1999, 81, 83–104. [Google Scholar] [CrossRef]
- Islam, M.T.; Sanchez-Reyes, J.; Archer, L.A. Nonlinear Rheology of Highly Entangled Polymer Liquids: Step Shear Damping Function. J. Rheol. 2001, 45, 61–82. [Google Scholar] [CrossRef]
- Bernstein, B.; Kearsley, E.A.; Zapas, L.J. A Study of Stress Relaxation with Finite Strain. J. Rheol. 1963, 7, 391–410. [Google Scholar] [CrossRef]
- Kaye, A. Non-Newtonian Flow in Incompressible Fluids; CoA Note; College of Aeronautics: Cranfield, UK, 1962; Volume 134. [Google Scholar]
- Keshavarz, B.; Divoux, T.; Manneville, S.; McKinley, G. Nonlinear Viscoelasticity and Generalized Failure Criterion for Polymer Gels. ACS Macro Lett. 2017, 6, 663–667. [Google Scholar] [CrossRef]
- Halasz, Z.; Danku, Z.; Kun, F. Competition of Strength and Stress Disorder in Creep Rupture. Phys. Rev. E 2012, 85, 016116. [Google Scholar] [CrossRef] [PubMed]
© 2018 by the authors. Licensee MDPI, Basel, Switzerland. This article is an open access article distributed under the terms and conditions of the Creative Commons Attribution (CC BY) license (http://creativecommons.org/licenses/by/4.0/).


