Article

Aerodynamics of a Wing with a Wingtip Flapper †

1
Department of Aerospace and Mechanical Engineering, University of Arizona, 1130 N. Mountain Ave, Tucson, AZ 85721, USA
2
School of Automation Science and Electrical Engineering, Beihang University, Beijing 100191, China
3
Science and Technology on Aerospace Flight Dynamics Laboratory, Northwestern Polytechnical University, Xi’an 710072, China
*
Author to whom correspondence should be addressed.
This paper is a modified version of our paper “Aerodynamics of Wing with Oscillating Wingtip Flapper” published at the 34th AIAA Applied Aerodynamics Conference, AIAA AVIATION Forum, Washington, DC, USA, 13–17 June 2016.
Fluids 2018, 3(2), 29; https://doi.org/10.3390/fluids3020029
Submission received: 22 March 2018 / Revised: 9 April 2018 / Accepted: 17 April 2018 / Published: 23 April 2018
(This article belongs to the Special Issue Bio-inspired Flow)

Abstract

:
In the present study, an oscillating membrane flapper was pivotally attached to the tip of a conventional rigid wing. Stroke-averaged aerodynamic forces were measured for the range of the flapping frequency, showing significant increases in the lift coefficient and lift-to-drag ratio for the wing with a flapper. Major vortex patterns were deduced from observations of smoke-wire visualization and 2D phase-locked particle image velocimetry (PIV). The centerline of the primary vortex wanders in the counterclockwise direction. On the contrary, its core rotates in the same sense of rotation as a wingtip vortex in a conventional wing. The secondary weaker vortex of opposite rotation lasts for a half stroke. The vortex ring sheds from the flapper during the second half of the upstroke and pronation. The outer parts of the vortex system are much stronger than the inner ones. The circulation and size of vortices decrease significantly at the most distant station from the wing. Strong vertical jets were found in smoke-wire visualization and confirmed with velocity and vorticity fields obtained by PIV. These jets are formed between undulating vortices and inside of the vortex ring. The jet airflow moves away from the flapper and downward or upward depending on the flapping direction.
Keywords:
wing; flapping; lift; drag; wake; vortex

1. Introduction

The airflow around a conventional wing features wingtip vortices produced by spanwise flows and a pressure differential over the top and bottom surfaces of the wing. A proximity of a wingtip changes a pressure distribution over the wing surface resulting in the induced drag. Wingtip vortices roll up over the wing edge, shed, and dissipate downstream. They may persist along the flight path, creating a safety hazard to other aircraft.
Effects of wingtip configurations on wing aerodynamics have been investigated by many authors. Sohn and Chang [1] compared a simple wingtip fairing to Whitcomb’s winglet design [2]. Formation and structure of the flow near wingtips were observed in reference [1] using a smoke-wire technique. The visualization patterns showed that streak lines from the high-pressure side beneath the wingtip leaked around the tip and spiraled downstream. Streak lines from the low-pressure side of the wing bent toward the wing root. Particle image velocimetry (PIV) data presented in [1] confirmed the smoke-wire visualization results. The cross-flow and the streamwise vorticity behind Whitcomb’s winglet appeared to be significantly weaker, approximately by two times, due to vertical diffusion of the wingtip vortex. Flow observations and quantifications were confirmed by aerodynamic force measurements using a pyramidal balance. Both lift and the lift-to-drag ratio increased for the Whitcomb’s winglet configuration.
Crow [3] studied the long-wave instability of a pair of counter-rotating vortices behind a finite wing. These vortices are confined to a plane inclined at 48 degrees to the horizontal plane. In order to induce the Crow instability and to hasten vortex decay and demise, several methods have suggested control surface oscillations.
Crow and Bate [4] proposed to use a coordinated motion of conventional control surfaces (flaps and ailerons). However, their method requires significant amplitudes of deflection of control surfaces, resulting in excessive unsteady forces on the wing structure.
In reality, there is more than one pair of vortices in the near field behind an airplane. Interactions of multiple vortex pairs and their instability growth mechanisms, including both short- and long-wavelengths, were investigated by Crouch [5]. Based on these studies, active flow control using periodic movements of control surfaces was proposed by Crouch et al. [6]. Experimental and numerical results showed that the method [6], forcing perturbations and breaking up in multiple vortex pairs, is more effective than the method [4] employing a single pair of wingtip vortices.
Similar to the previous efforts [4,6], the wingtip flapper is used in the present study to excite vortex instabilities. However, the oscillating flapper in the present study generates perturbations of different form and amplitude from the previous works.
Birds and insects demonstrate remarkable flight performance at low Reynolds numbers by utilizing various unsteady mechanisms for airflow controls. The three-dimensional flow structure behind flapping wings has attracted much research attention. Studies of both natural fliers and mechanical wing models have been extensively published in recent years.
Many authors performed detailed visualizations of large-scale vortex structures behind flapping wings. Spedding et al. [7] used the PIV method to investigate the velocity field in the wake of a thrush nightingale over the range of speeds in forward flight. The measurements were conducted in the vertical plane placed along the free stream. Spanwise vorticity and velocity components were computed, revealing important features of the wake structure. A single vortex-ring wake model on the downstroke was reconstructed for the case of a low-speed flight of the bird. At the relatively high speed of flight, the wake is composed of two streamwise undulating vortex tubes behind each wingtip. They are periodically connected by comparatively weak cross-stream vortices.
Hovering and slow flights are energetically more demanding. They rely on unsteady aerodynamic mechanisms of lift. A study by Muijres et al. [8] showed that the wings of a bat in hover generate two vortex rings. Formation of near- and far-field wakes behind a pair of mechanical flapping wings in hover was investigated in reference [9] using a volumetric velocimetry system. Experiments were conducted in an oil tank seeded with air bubbles, which were illuminated by a laser sheet. This study showed that the flow in the near-field encompasses vortex rings periodically shed on successive half-strokes. In the far-field, vortex rings are transformed into two shear layers.
Johansson Hedenström [10] investigated the vortex wake behind blackcaps freely flying in a low-speed wind tunnel. High-speed PIV was used for measurements of streamwise vorticity and velocity components in the plane normal to the free stream. In addition to the wingtip vortices, the wing root vortices both opposite to and in the same direction of the wingtip vortices were found. The model of the wake behind flapping wings was proposed as a series of vortex rings generated during the downstroke followed by a weak wake on the upstroke.
The aerodynamics of membrane flapping wings are very similar to those used in the present study which were investigated in wind tunnel experiments [11]. The stroke-averaged lift and horizontal force were measured at an angle of attack that varied from a horizontal to a vertical position. It was found that for high angles of attack and at the vertical position flapping wings do not exhibit a typical abrupt stall seen with fixed wings. This feature in flapping wings aerodynamics is useful for a smooth transition from a level flight to a hovering, and back.
Kinematics of the flapping membrane wing were measured with the help of the high-speed videography in the study [12]. Obtained experimental data were applied in a computational fluid dynamics (CFD) analysis of airflow around flapping wings. The aerodynamic force decomposition into inertial, circulatory, and vortical components provided valuable insights into the underlying physics of the low-Reynolds-number unsteady airflow. Specifically, it was found that the inertial component of the aerodynamic force is dominant in the normal force coefficient, and hence, added mass is the main mechanism in aerodynamic force production for the studied wing kinematics.
The overall goal of the present research is twofold: (1) to evaluate the aerodynamic efficiency of the wing with the wingtip flapper by measuring lift and drag coefficients in the model and by comparing the results with the conventional wing configuration; (2) to investigate wingtip vortex structures excited by the flapper with the help of the smoke-wire visualization and PIV techniques.
The present study exploits the unsteady flow formed by flapping wings in order to enhance the aerodynamic performance of conventional fixed wings. The wing model was constructed combining a rigid wing and a relatively small flapper attached to the tip of the rigid wing. In order to investigate aerodynamic characteristics of this wing, wind tunnel experiments were conducted. The study included high-speed videography of flapping wing kinematics, aerodynamic force measurements, and characterization of airflow behind the wing using smoke-wire and PIV techniques. Major vortex patterns were inferred by combining information obtained at several stations behind the wing. Their topological aspects were described in detail.

2. Experimental Model and Methods

Figure 1 shows a wing model with a wingtip flapper in the test section of the University of Arizona Micro Air Vehicles Wind Tunnel. A closed-loop tunnel is capable of airspeeds up to 20 m/s. The open test section of the tunnel is contained within a small room at ambient pressure to minimize potential flow disturbances. The nozzle outlet is 0.35 m by 0.45 m and it is 1.24 m away from the diffuser’s inlet. The wind tunnel has a 0.9% turbulence in the axial direction for the free stream velocities used in the present study. The wing model was connected to the sting balance and was tested at the wind tunnel speed V = 5 m/s at the angle of attack of 8 degrees.
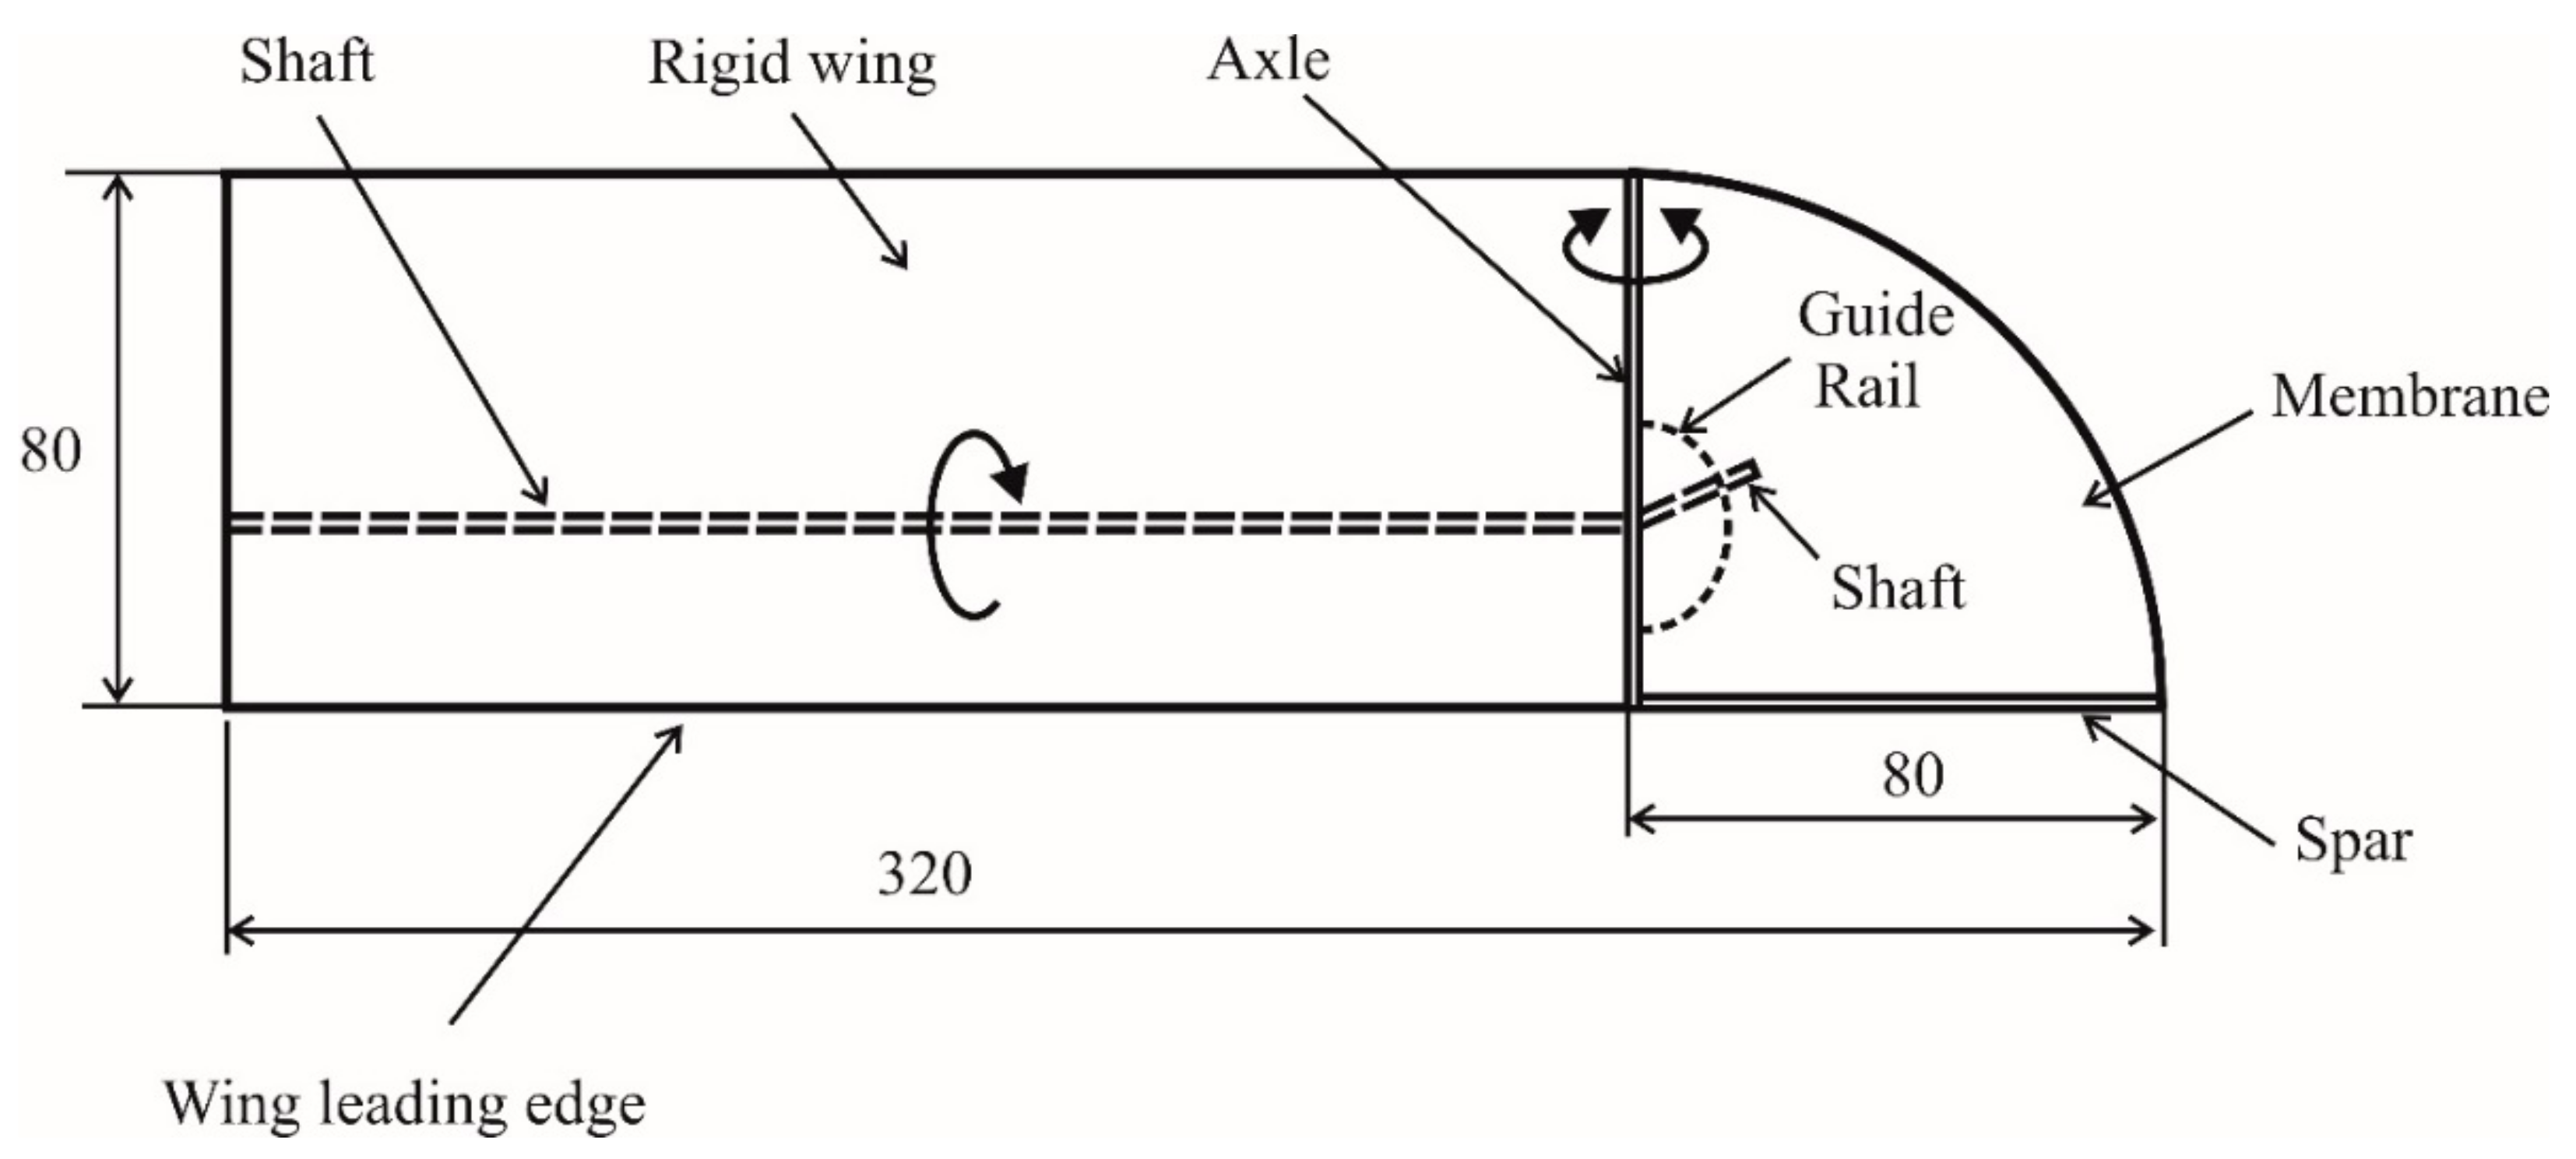
The model consists of a rigid wing, a small oscillating flapper connected to the rigid part, and a flapping transmission with a motor (Figure 1 and Figure 2). National Advisory Committee for Aeronautics (NACA) 0015 airfoil of the constant 80 mm chord was extruded in the spanwise direction to form a 3D rectangular wing of 240 mm span. This part of the wing was 3D-printed and then its surface was polished with a wet 1000 grit sandpaper.
The flapper part is a quarter circle of radius 80 mm. The flapper structure includes a front spar and a membrane attached to the spar and to the rigid rib. The front spar is a pultruded carbon rod T315-4 of diameter 0.8 mm and the membrane is made of low porosity nylon fabric (F111 Exacta Chute, 37.6 g/m2) bonded to the spar with a rubber cement. The total wing model span is 320 mm and the total area is S = 24,225 mm2. The flapper area is 1/5th of the total wing area.
The initial rotation of the shaft is generated by the electric motor via a custom-designed flapping transmission. A Maxon RE-12 (Maxon Motor, Sachseln, Switzerland) electric motor is connected to the transmission through a 4:1 gearbox. At the exit from the rigid part of the wing, the shaft is angled at 40 degrees, as illustrated in Figure 2. The shaft is placed through the hole in the axle and in the guide rail. The guide rail is a semicircle with a slot, formed by a bent metal wire. The shaft rotation is transmitted to periodic oscillations of the axle and to a flapping motion of the leading edge spar, which is soldered to the axle. The membrane is glued to the axle and spar, but not to the rail. Consequently, during the upstroke, the membrane deformations are constrained by the guide rail. However, there is no contact between the membrane and the rail during the downstroke.
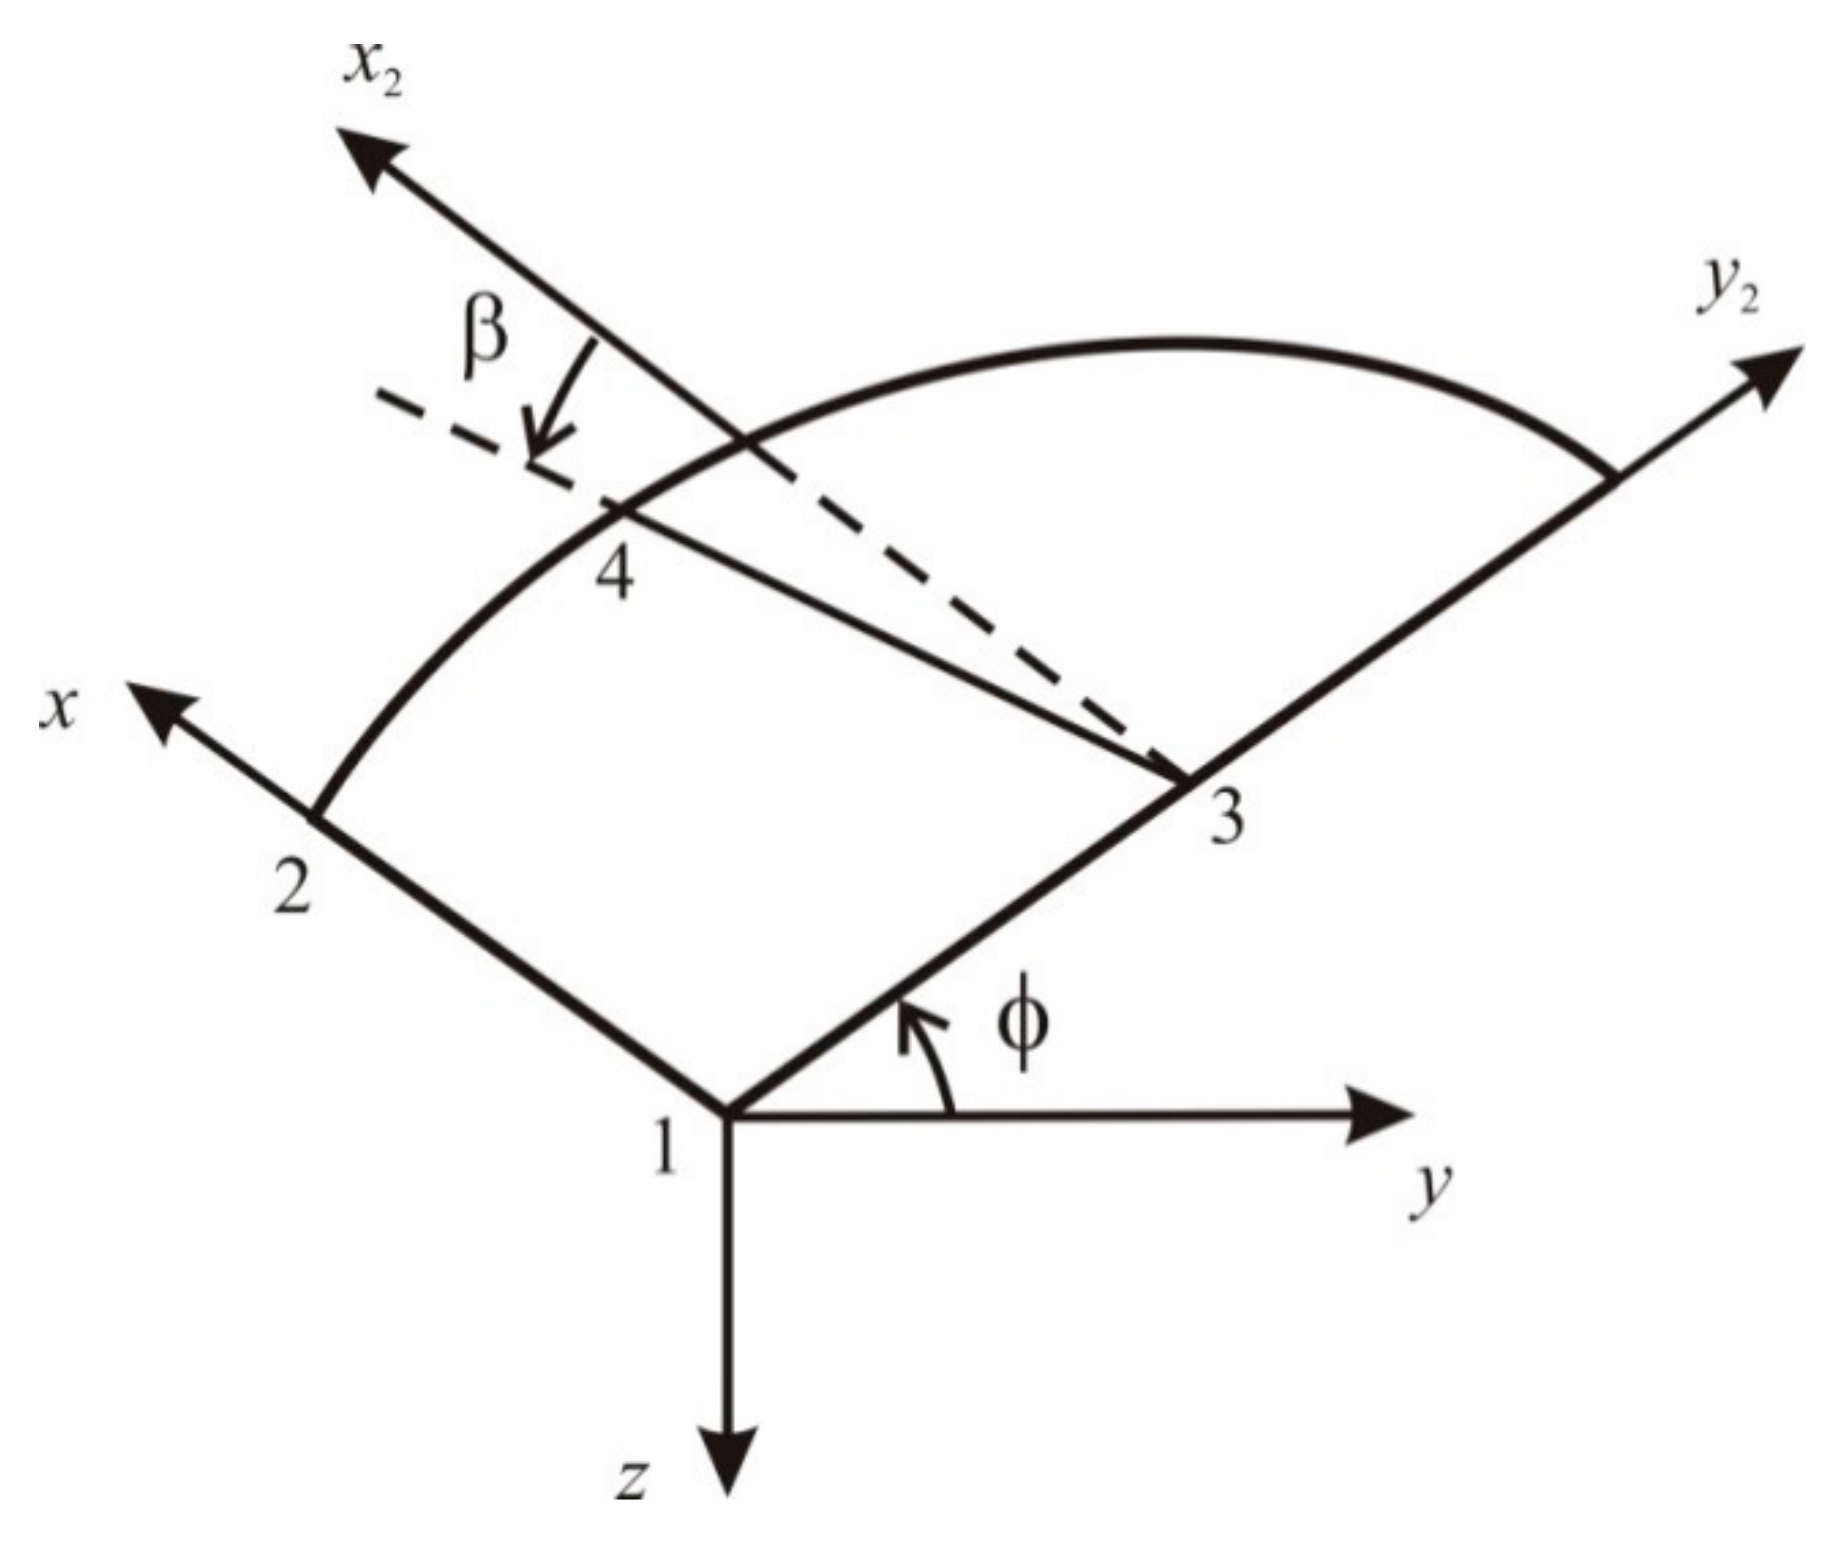
In the present study, a wing-fixed frame of reference was utilized with the origin at the pivot on the leading edge of the oscillating wingtip, as illustrated in Figure 3 and Figure 4. Coordinate axes x, y, z are placed streamwise, spanwise, and downward, respectively.
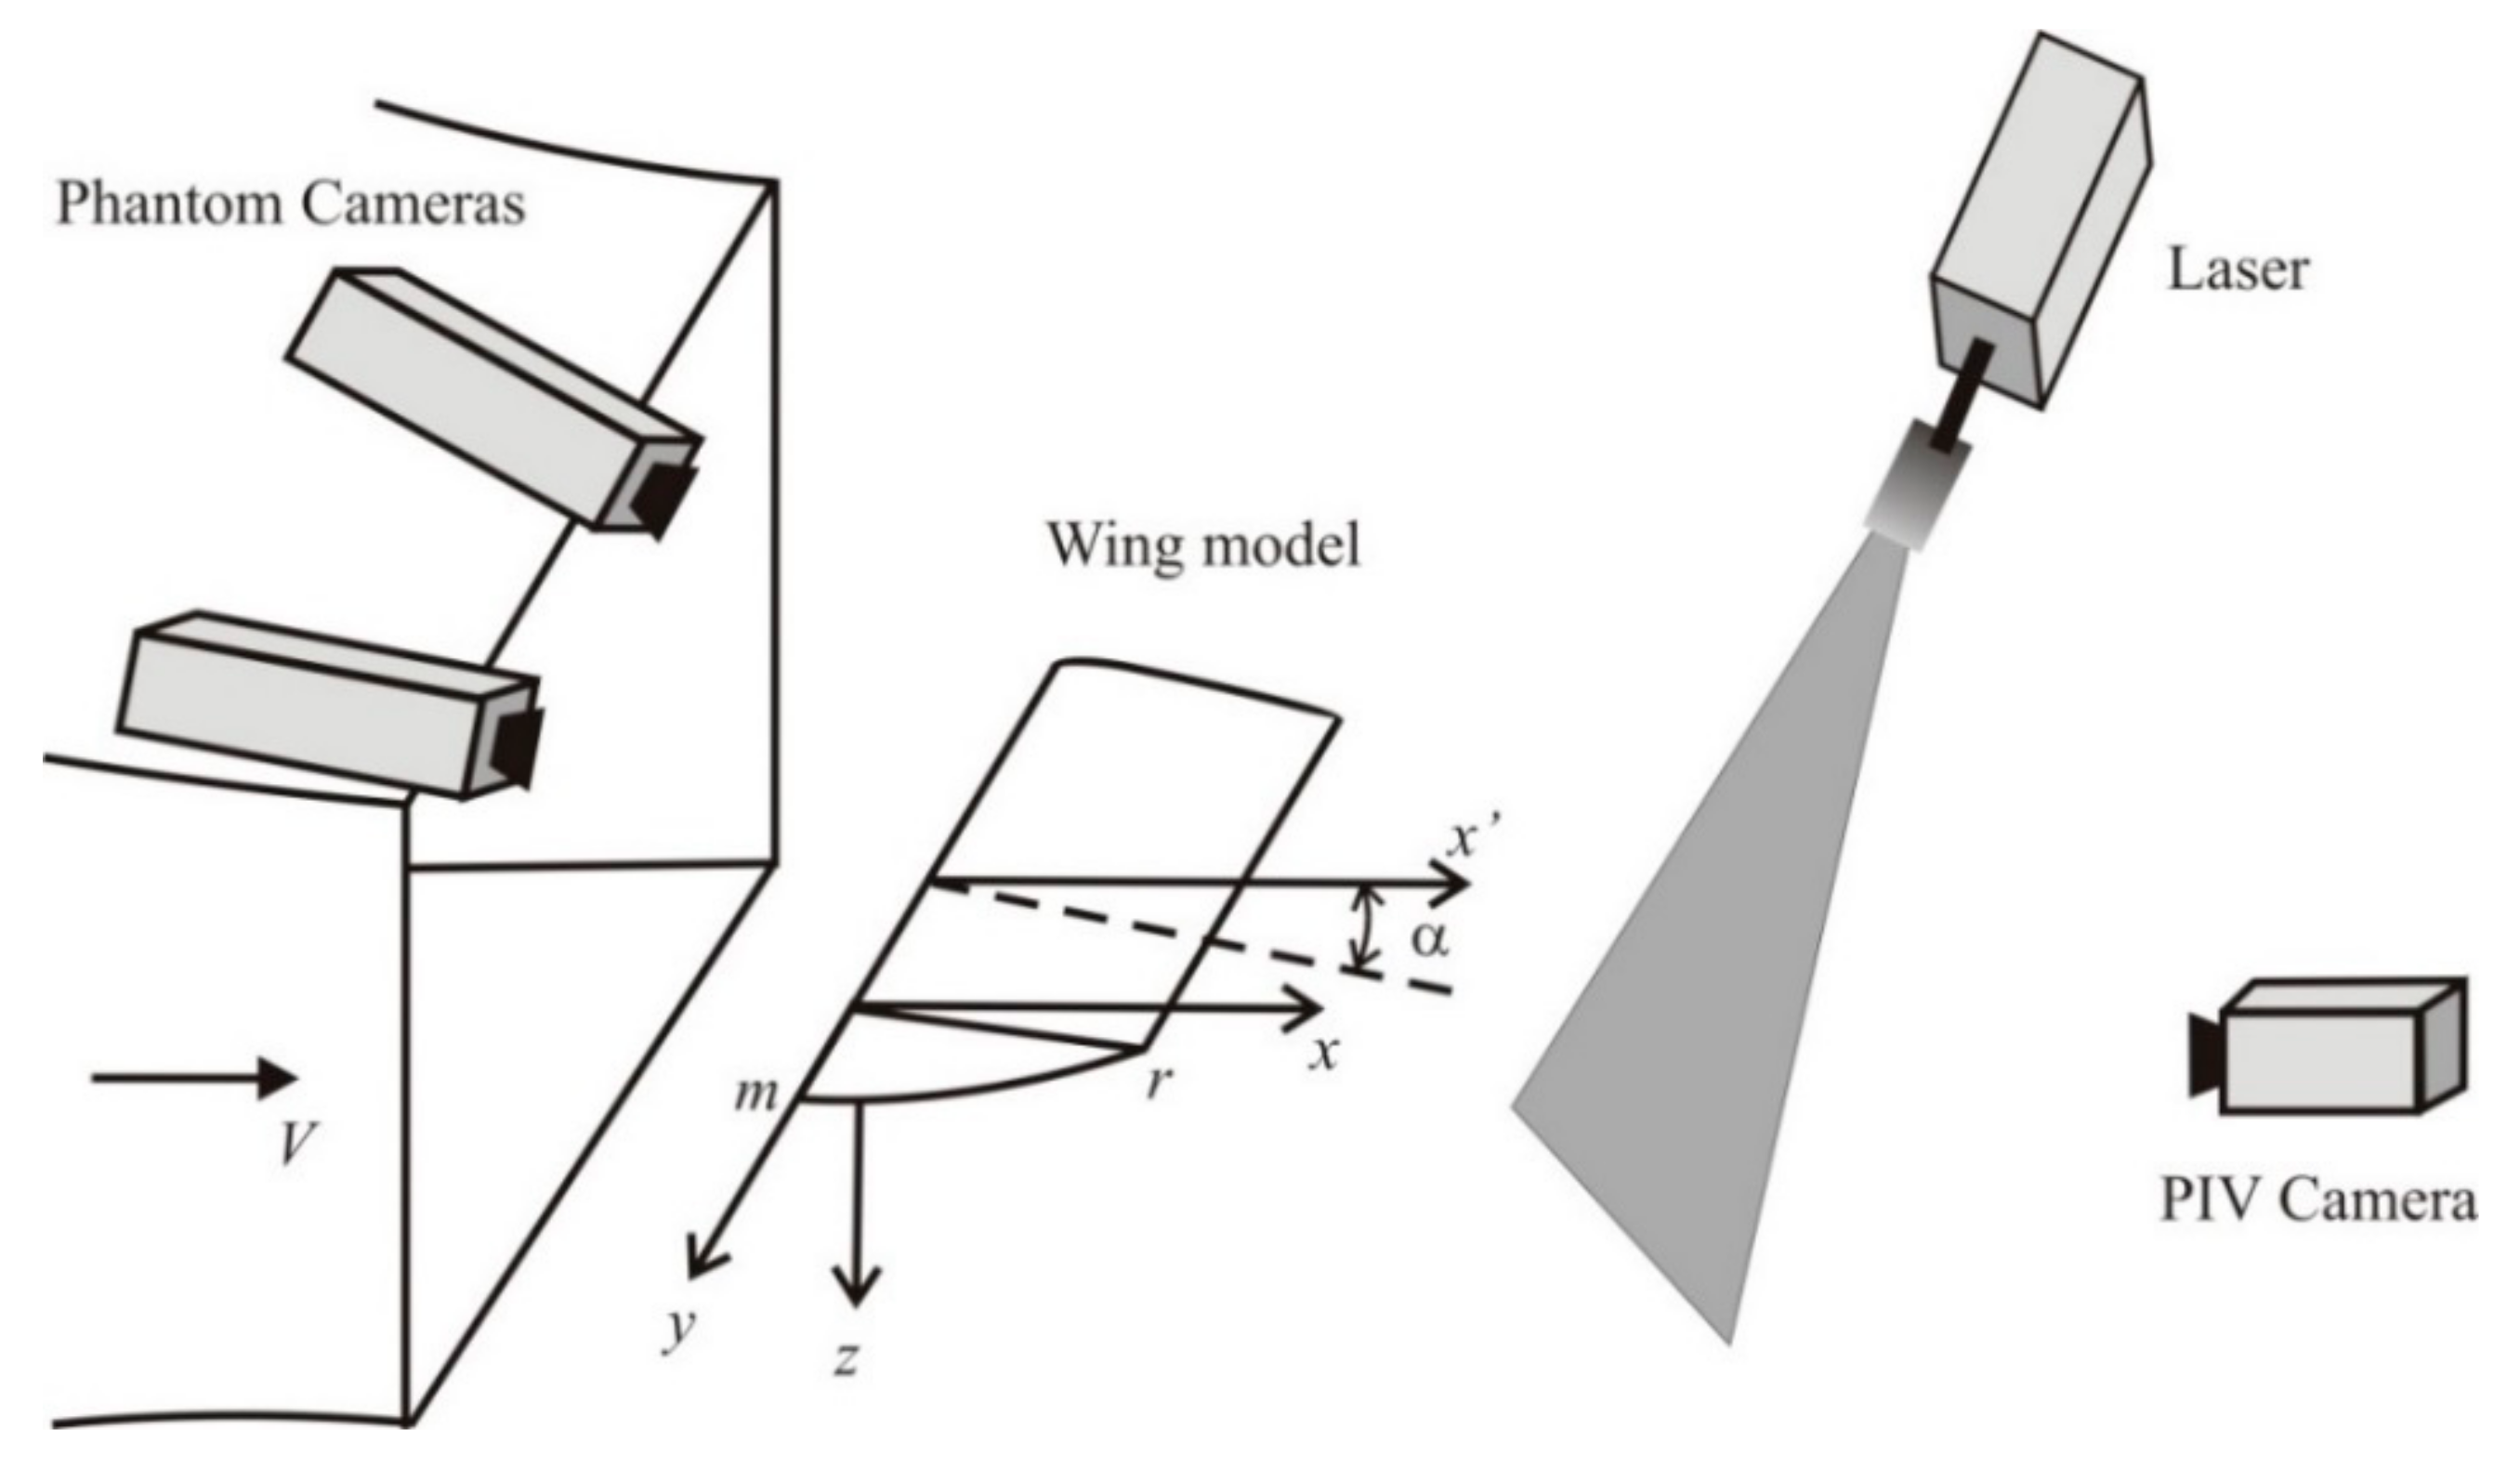
Figure 4 shows the experimental setup, including the test section, wing mode, and PIV hardware. In order to determine time variations of geometric parameters of the flapper through a flapping cycle, two Phantom 9.1v high-speed cameras (Vision Research, Wayne, NJ, USA) and videography methods were utilized in the present study. The cameras were mounted above the test section in front of the model and tilted at 35 degrees to the vertical. Black ink markers of 1.5 mm in diameter were placed on the flapper for video tracking. Marked points 1 and 2 in Figure 3 are the front and aft points of the axle, respectively. The x2-axis is parallel to the x-axis and passes through the point 3 in the middle of the leading edge spar. Point 4 belongs to the trailing edge. Video images were digitized by employing a direct linear transformation method and software [13]. This procedure provides all three coordinates of marked points of the flapper.
Using time-resolved coordinates of points 1–4, the time variations of flapping, φ, and pitching, β, angles can be calculated. The flapping angle, φ, is positive clockwise about the x-axis, and the pitching, β, angle is positive clockwise about y2-axis.
Camera calibration was performed with the help of a custom 99-point calibration plate [14]. For the determination of flapping and pitching angles, videos were acquired at a resolution of 960 × 720 pixel at a rate of 2600 fps. Spatial and temporal resolutions of the present videography hardware and methods were established in [14,15]. Uncertainties in maximal angle measurements were found to be ± 0.7 ° .
The three-component Aerolab sting balance [16] (see Figure 1) was used for the measurements of aerodynamic forces. A small streamlined pylon was glued to the wing at the center. The model was mounted on the balance in the cylindrical hole in the pylon. The maximum loads that can be exerted on the balance are 111.2 N and 44.5 N for the normal and axial direction, respectively. Data from transducer channels were recorded at the rate of 27.7 Hz and averaged over 500 data samples per test.
Wake behind the wing was investigated using the Particle Image Velocimetry and LaVision PIV system, Davis 8.3.0 (LaVision Inc., Ypsilanti, MI, USA). Phase-locked two-dimensional PIV technique was utilized in the present study. Tests were carried out for 27 flapping angles across the flapping cycle at each of 3 streamwise stations. The PIV hardware arrangement is shown in Figure 4. The double-pulsed Nd:Yag laser with 532 nm wavelength was positioned behind a Plexiglas wind tunnel wall, whereas the camera was mounted behind the model. The frame rate of the camera and laser was set at 10 Hz. LaVision Aerosol Generator seeded the test section within the closed-loop wind tunnel with liquid Di-Ethyl-Hexyl-Sebacat. The size of a particle on a raw image varies from 2 × 2 pixels up to 6 × 6 pixels. The smallest resolved flow structure (spatial resolution) for the present experimental facility was determined in our previous study to be 0.9 mm [17].

3. Results and Discussions

3.1. Kinematic Parameters and Aerodynamic Coefficients of Wing Model

The wing model was tested at 5 flapping frequencies ranging from 20 Hz to 30 Hz. Videos were recorded by the Phantom camera system. Flapping frequency was measured by tracing ink markers 1 and 3 in Figure 3. In such a way, the relationship between the input voltage of the motor and the flapping frequency has been established.
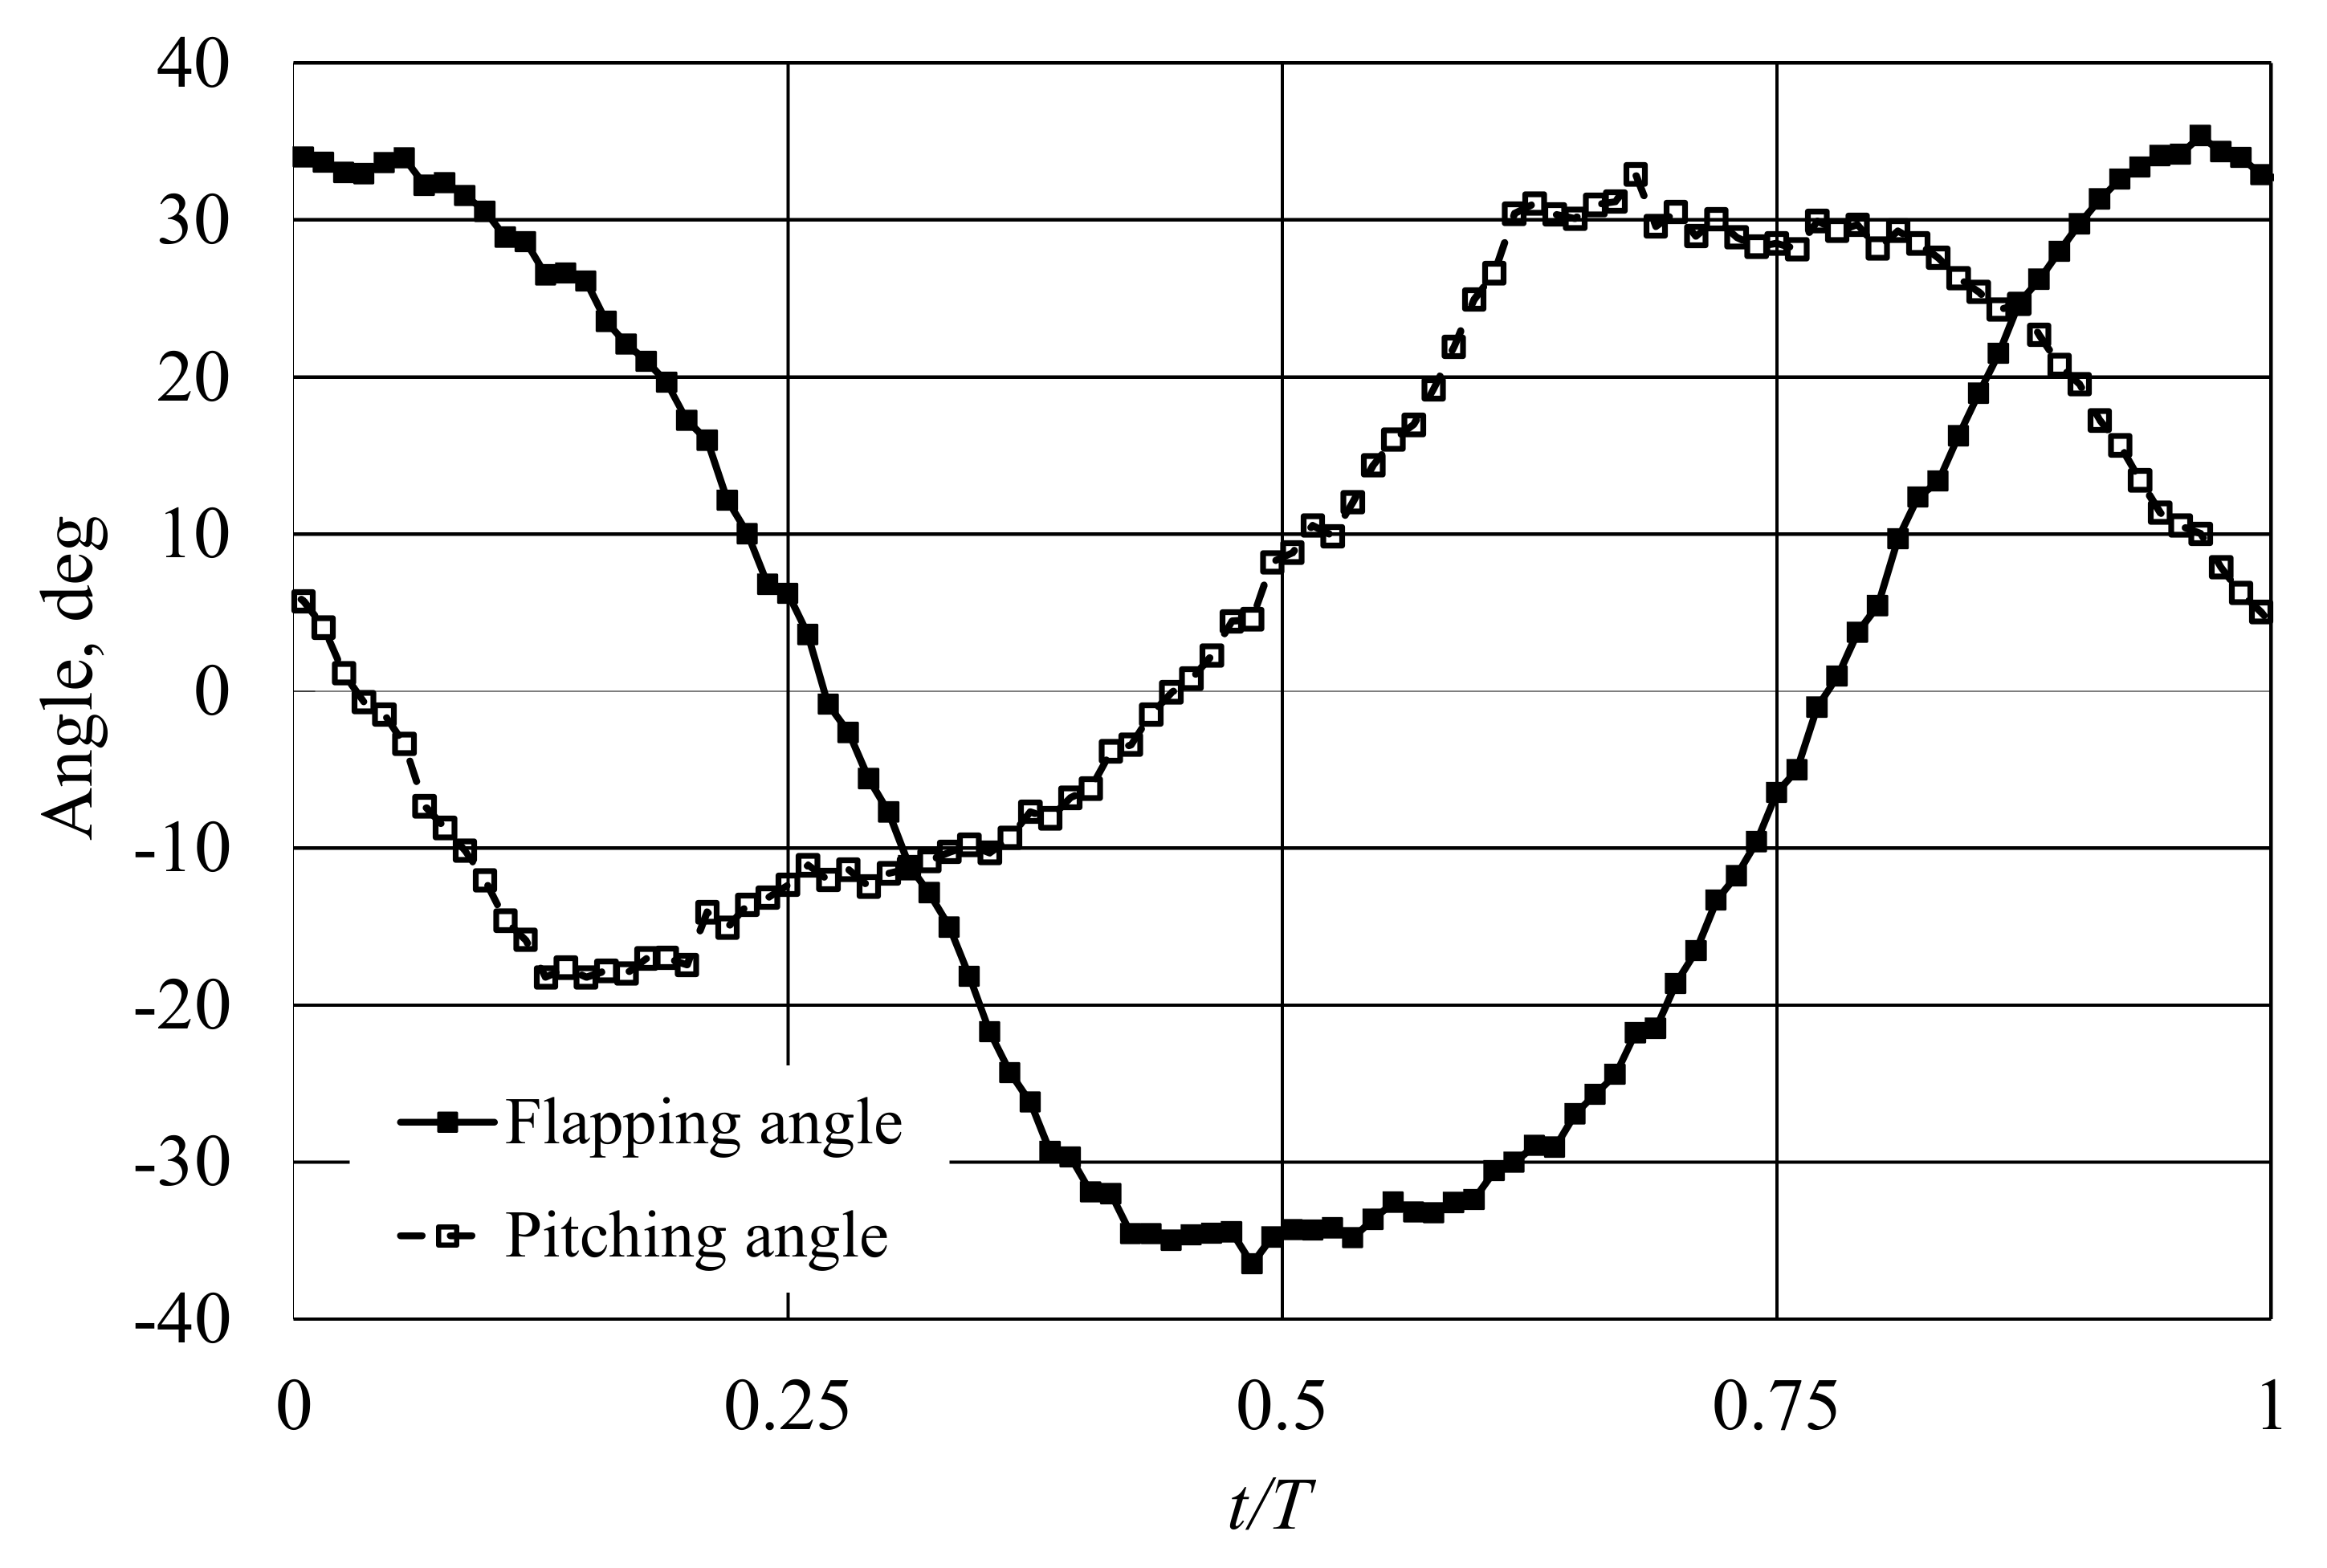
Next, the flapping and pitching angles in the flapper were examined at 20 Hz. Time variations of flapping and pitching angles in the middle section of the flapper are illustrated in Figure 5. The peak-to-peak flapping angle amplitude of 70 degrees is about the same as in static measurements. It can be seen from the figure that the pitching angle leads the flapping angle by approximately 0.35 T. The time variation of the pitching angle is non-symmetrical, with a maximum of 33 degrees and minimum of −18 degrees. This asymmetry can be explained by the non-symmetric supporting structure of the flapper. Specifically, the mechanism of the guide rail is positioned underneath the membrane, as illustrated in Figure 2. Therefore, the out-of-plane deformations of the membrane are constrained by the guide rail on the upstroke, but unconstrained on the downstroke.
Stroke-averaged lift and drag forces, along with the wind tunnel speed, were recorded in wind tunnel experiments at the flapping frequency f = 20–30 Hz and corresponding reduced frequency k = 0.85–1.28. In addition, the experiment with the flapper fixed horizontally was conducted representing a conventional fixed wing and providing a basis for evaluation of the aerodynamic efficiency of the new wing design. The Reynolds number based on the wind tunnel velocity and the rigid wing chord is 24,390. At the flapping frequency of 20 Hz, the corresponding reduced frequency is 1.
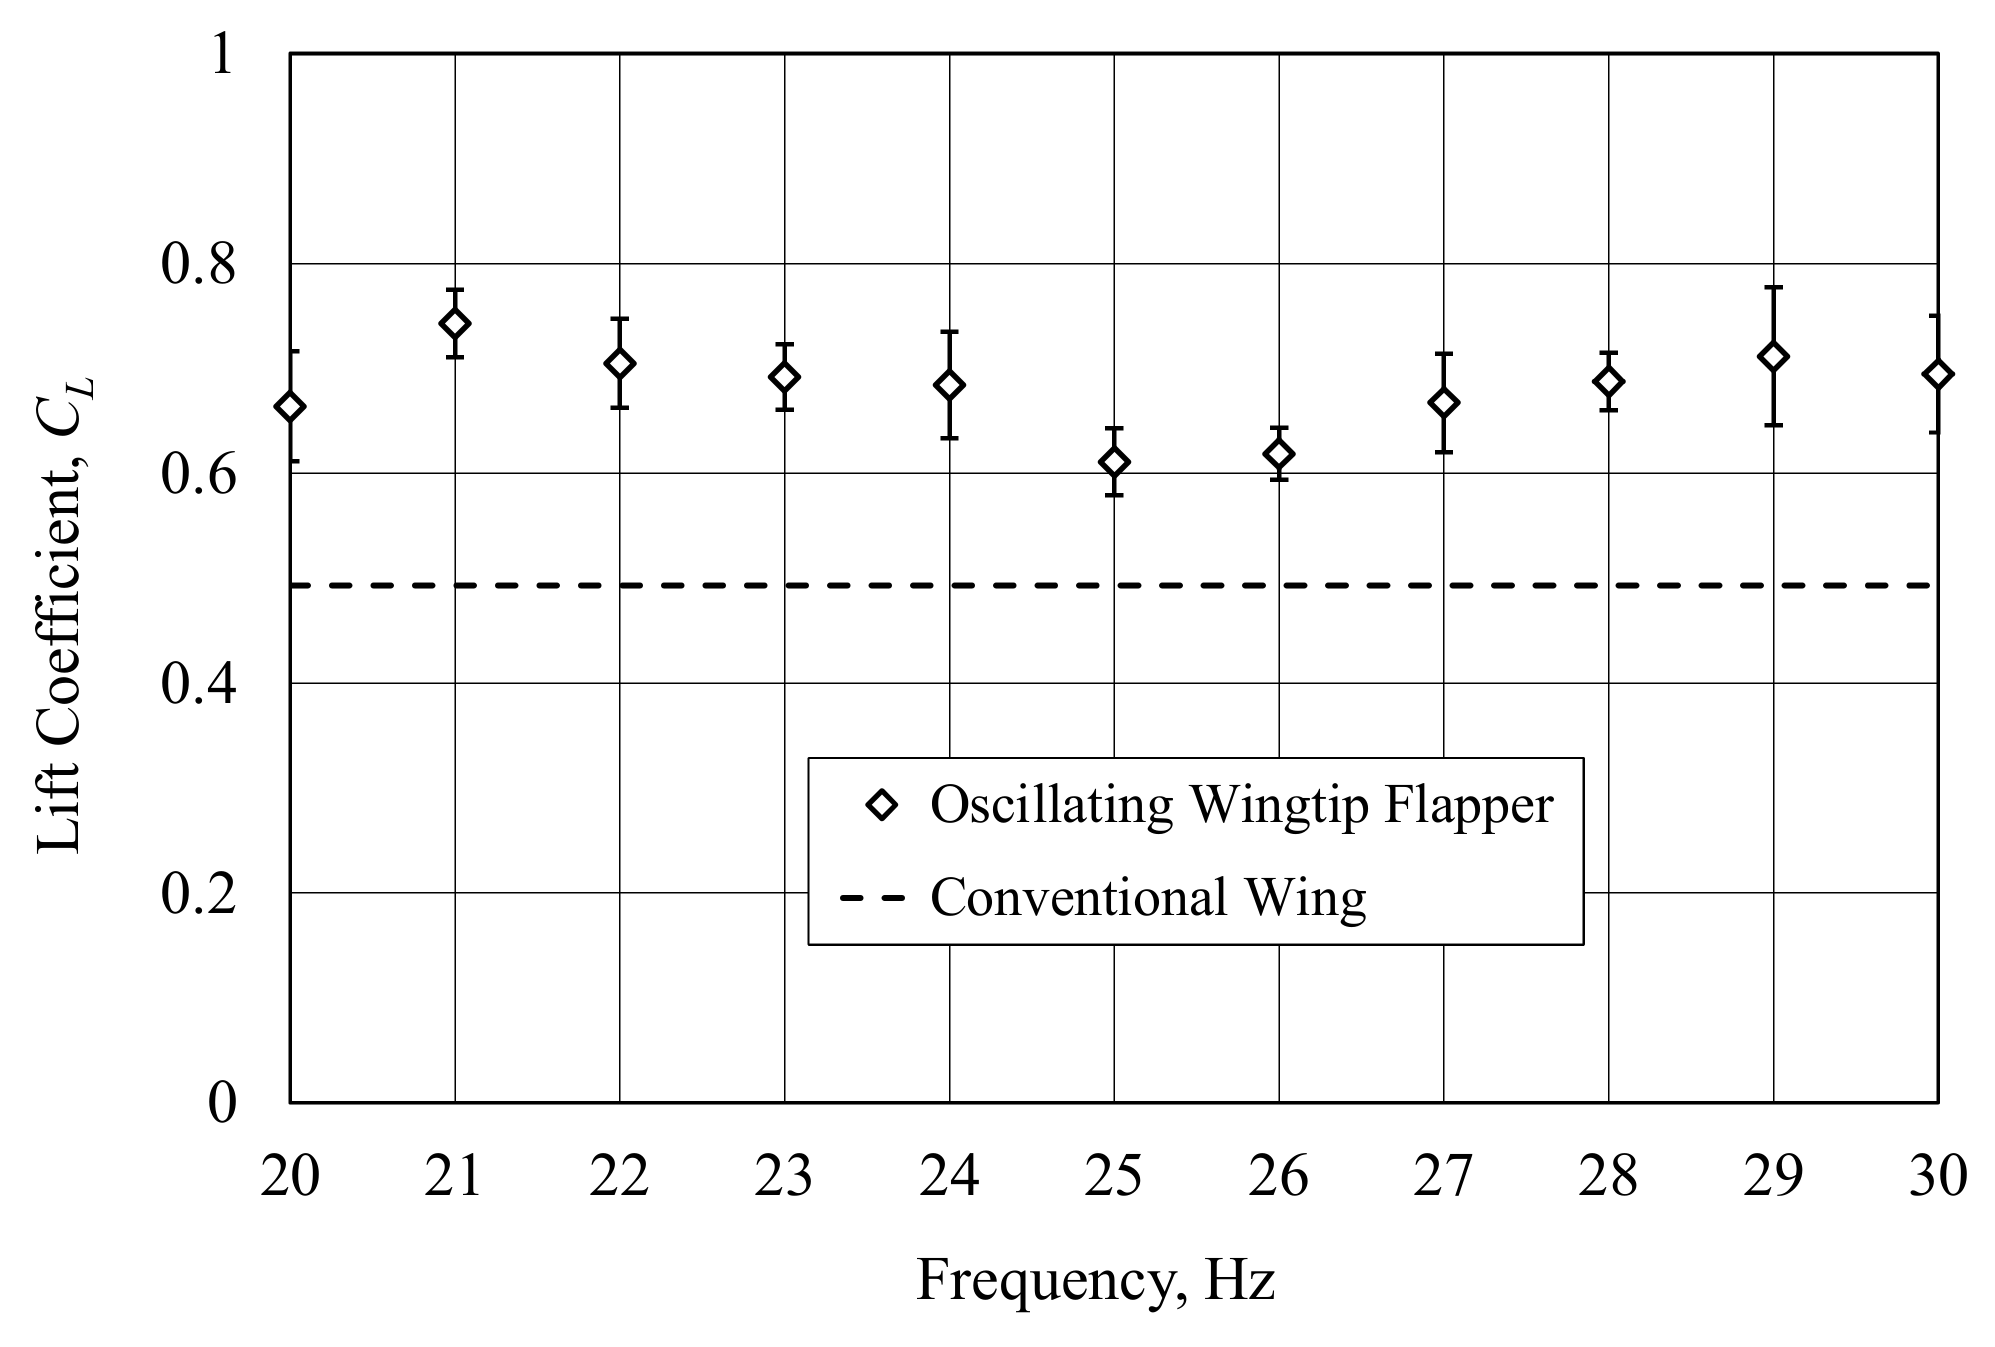
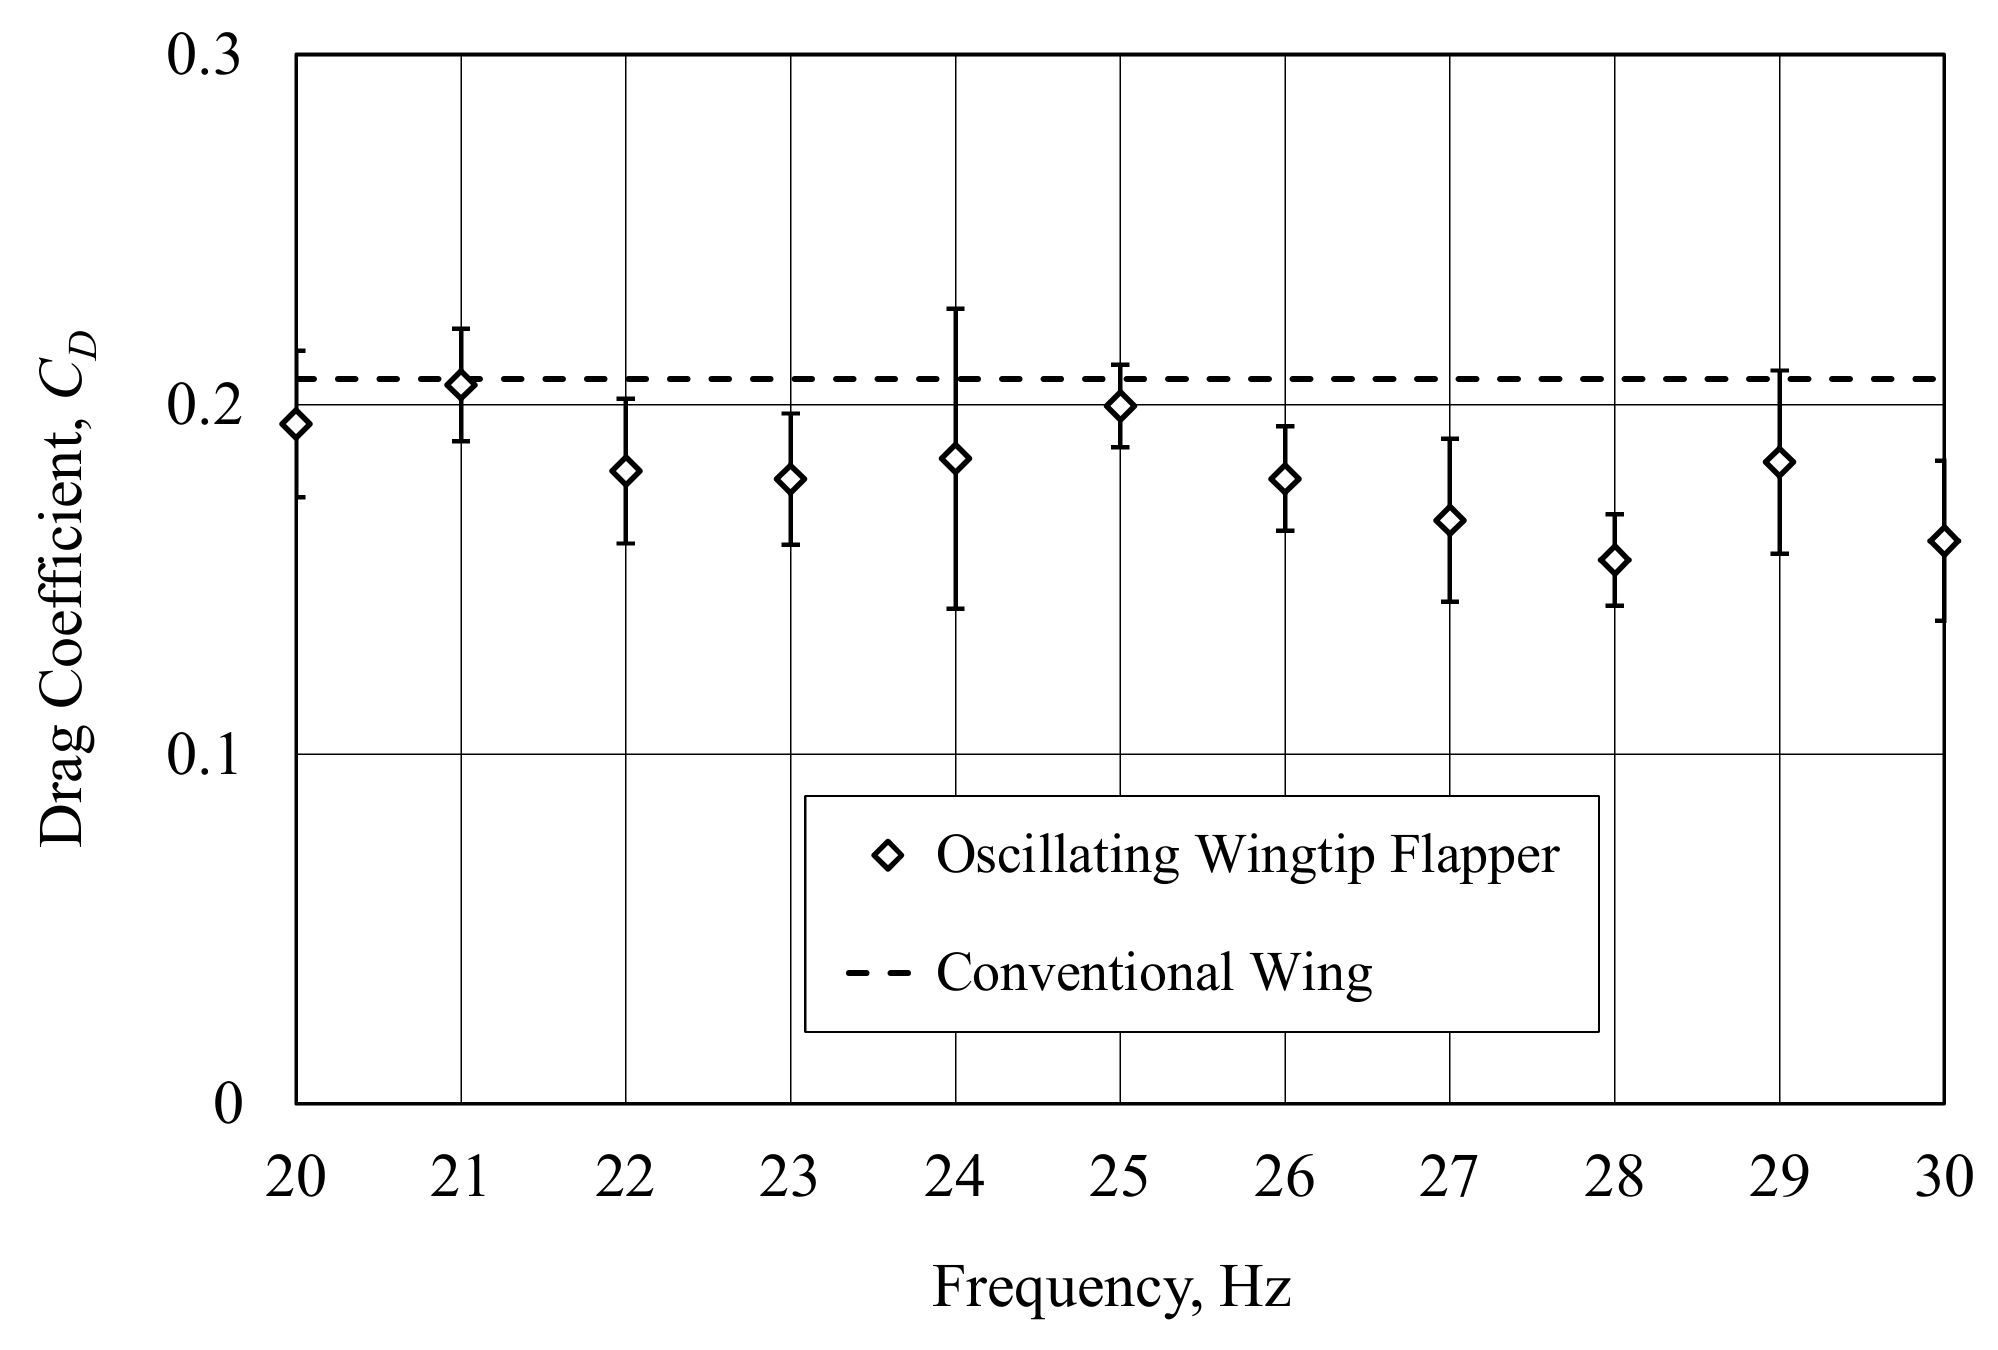
Lift and drag coefficients were determined for each test, using as a reference the total wing area, S, and the wind tunnel velocity, V = 5 m/s. At each frequency, 10 tests were performed, providing the average and standard deviation values of the aerodynamic coefficients. Plots of the aerodynamic coefficients CL and CD are shown in Figure 6 and Figure 7, respectively. In order to illustrate variations in the aerodynamic coefficients, error bars were plotted in the figures based on standard deviation at each flapping frequency.
As can be seen in Figure 6 and Figure 7, the lift coefficients are higher and drag coefficients are lower for the wing with the wingtip flapper as compared to the conventional non-flapping wing. There is a 40% increase of the average lift coefficient. While there is no clear trend in the lift coefficient, a slight decrease of the drag coefficient with the frequency increase is observed. Note that an increase of the lift and a decrease of the drag on one-half of the wing is necessary for performing banked turns. Thus, differential oscillations in left and right wingtips can provide roll and yaw controls. The role of the flapping wingtip flappers in pitch controls will be addressed in future studies.
The lift-to-drag ratio, CL/CD, is an important performance measure, specifically, of a flight range of an aircraft. The results given in Table 1 show that the lift-to-drag ratio increases with a flapping frequency increase. In the present work, a conventional wing case was obtained by fixing a flapper horizontally. The lift-to-drag ratio for the conventional wing is denoted in the table by the zero frequency case. The wing with the wingtip flapper surpasses the conventional wing on average by 60% or within a margin of 30–80% depending on frequency.

3.2. Smoke-Wire Flow Visualization

Experiments performed in the previous study [18] with vertically and horizontally placed smoke-wires are discussed herein. Tests were conducted at the flapping frequency of 20 Hz.
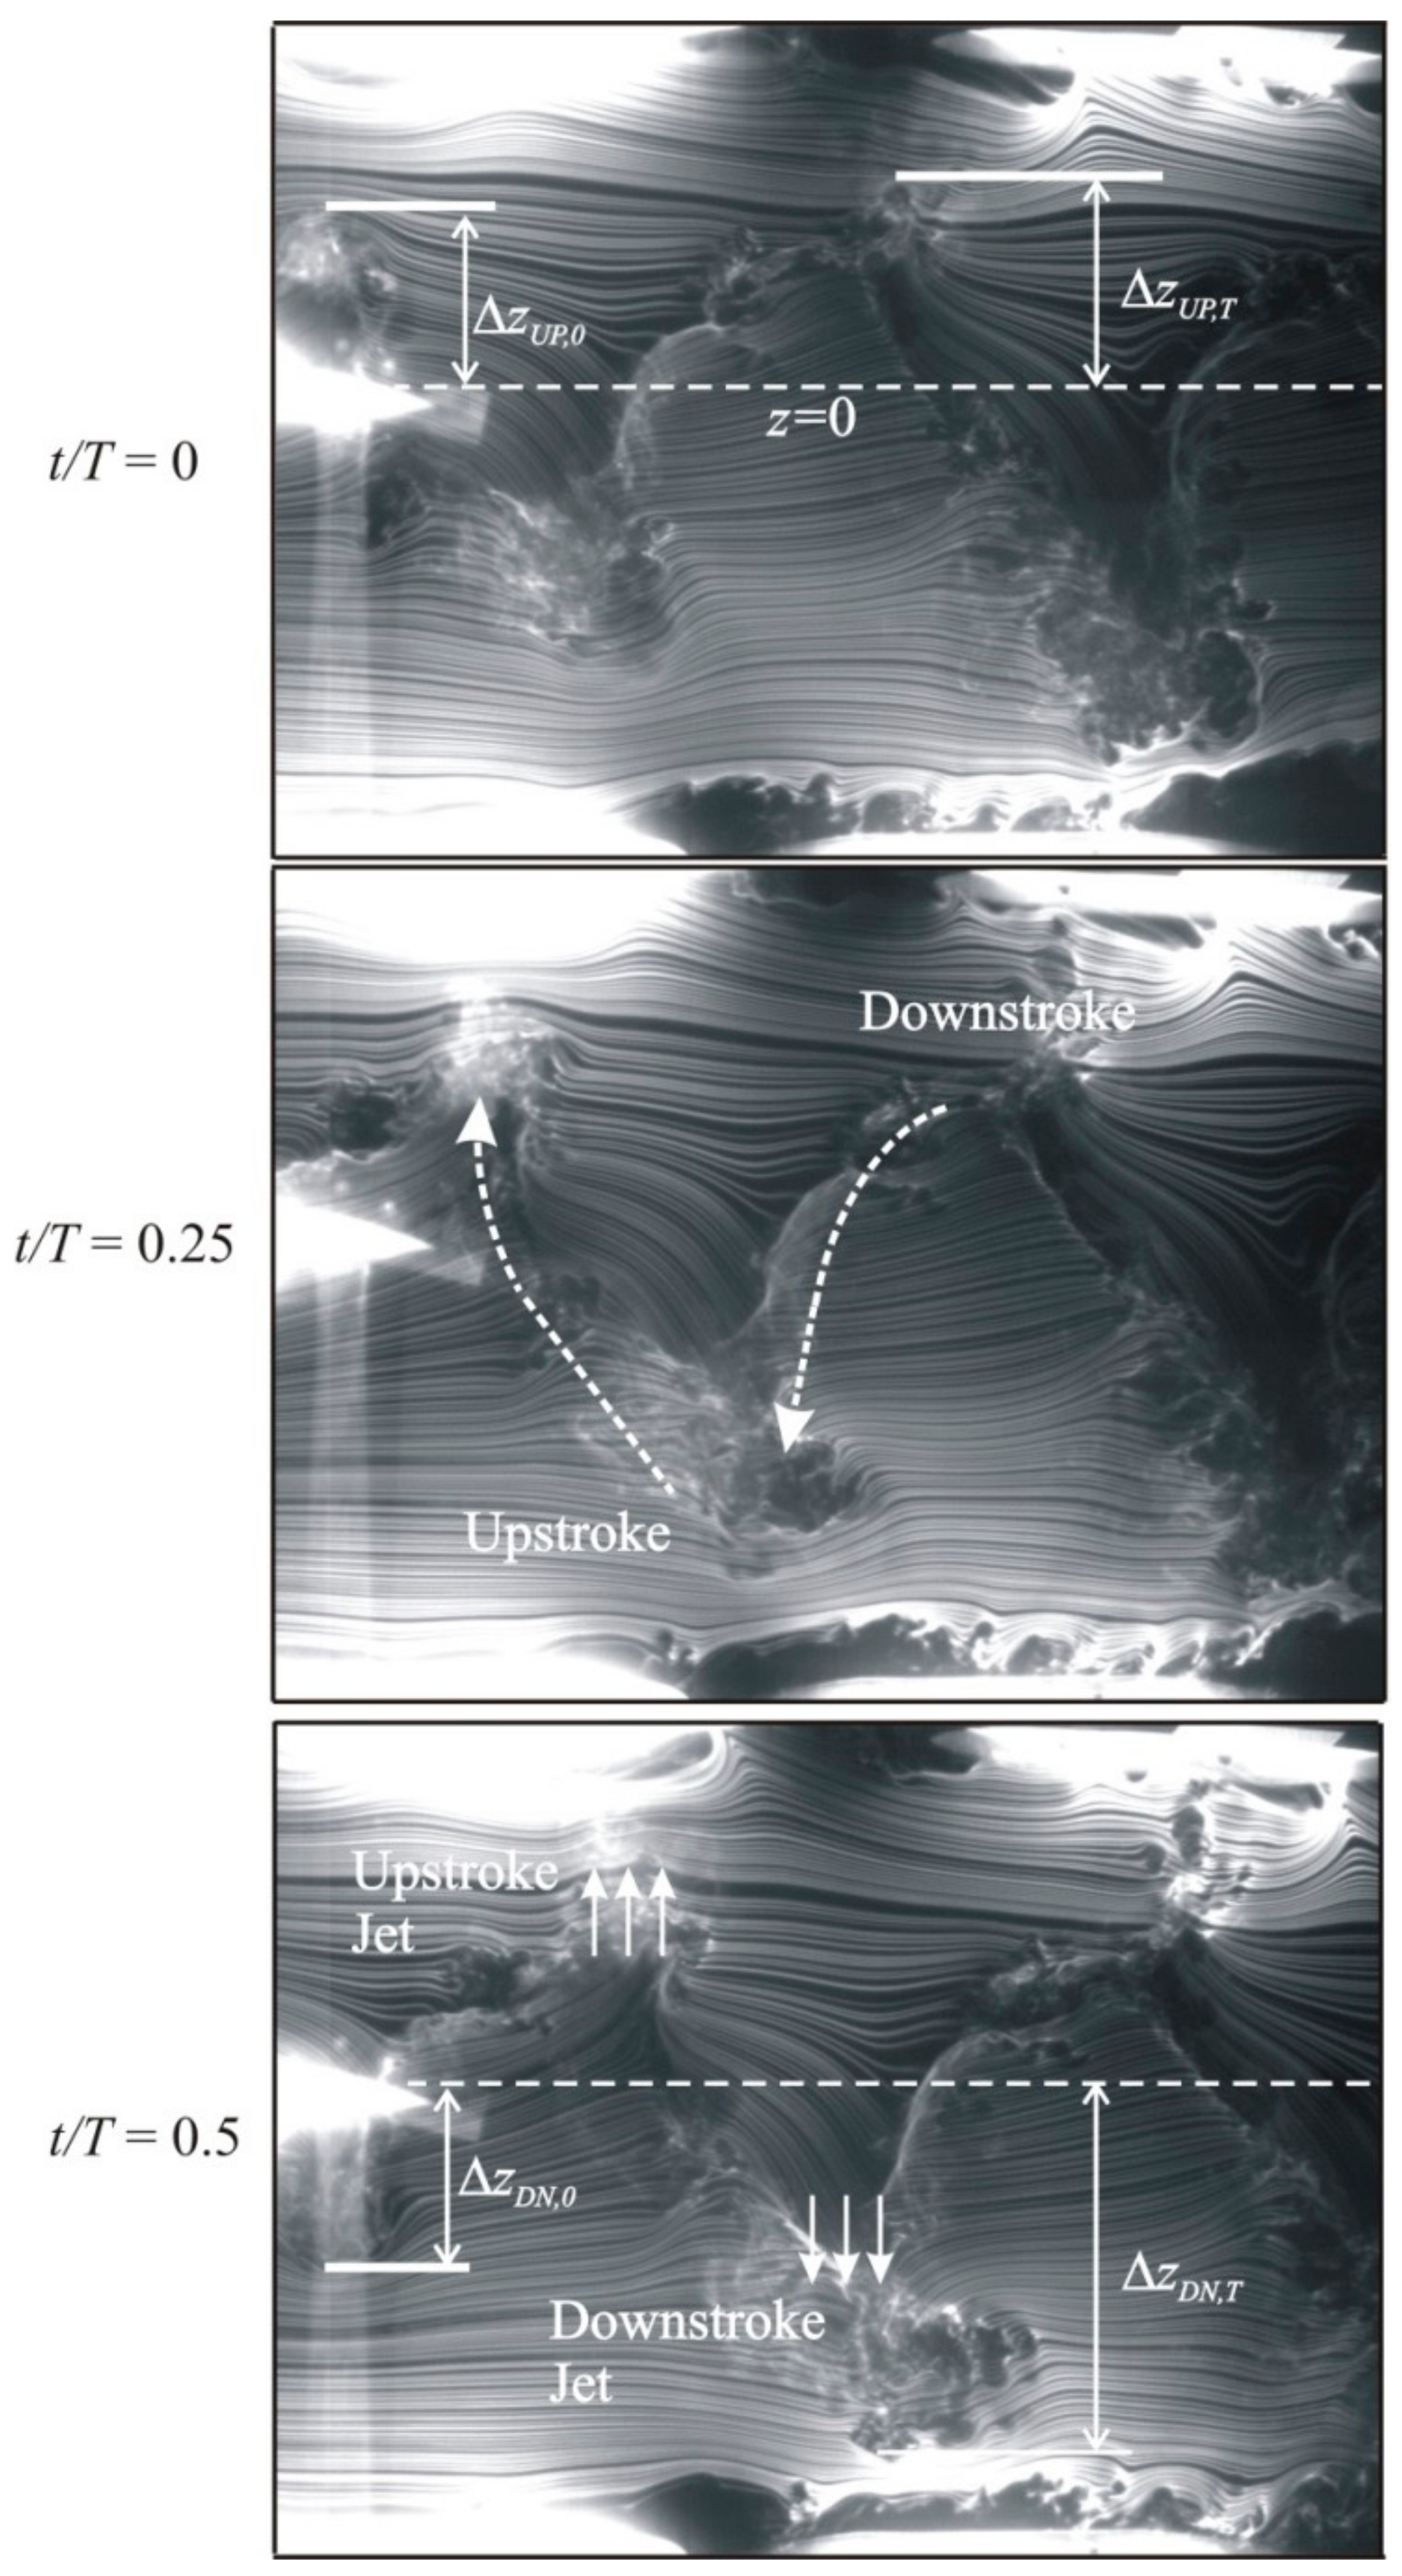
Flow streamlines on the vertical plane are shown in Figure 8 for three time instants. The free stream runs from the left to the right. The coordinates of the smoke-wire line, which was parallel to the z-axis, were x = −280 mm and y = 60 mm (see Figure 4). One concern in this test was the size of the oscillating wake relative to the area of the flow region in the test section. However, no substantial interfering of shear-layer vortices with the wake is observed within the first period of wake oscillations.
General observations were made about the wake dynamics shown in Figure 8. Traces of the flapper are seen in the photographs. The wake oscillations follow the flapping motion. Streamlines are deformed and inclined near the plane z = 0. The wake becomes turbulent at the top and bottom of the cycle.
The wavelength of the wake immediately behind the wing is 250 mm, which is approximately equal to the product of the flapping period and the wind speed. On the downstroke, the flow trailing the wing is rapidly deflected downward, forming a downward jet. On the upstroke, a smaller deflection of streamlines and a smaller upstroke jet are produced by the flapper (see Figure 8).
Up and down amplitudes of wake oscillations just behind the wing trailing edge are about the same, Δ z U P , 0 Δ z D N , 0 = 70 mm and they increase during the first period of the wake. Note that the maximal displacements of the flapper tip were found to be ±46 mm based on the flapping angle in Figure 5. The peak-to-peak amplitude of wake oscillation in the z-direction at the end of the period is 230 mm, which is much higher than the flapper wingtip amplitude of 92 mm. Also, a larger amount of air is pushed downward compared to the upward direction and Δ z D N , T / Δ z U P , T = 1.77 .
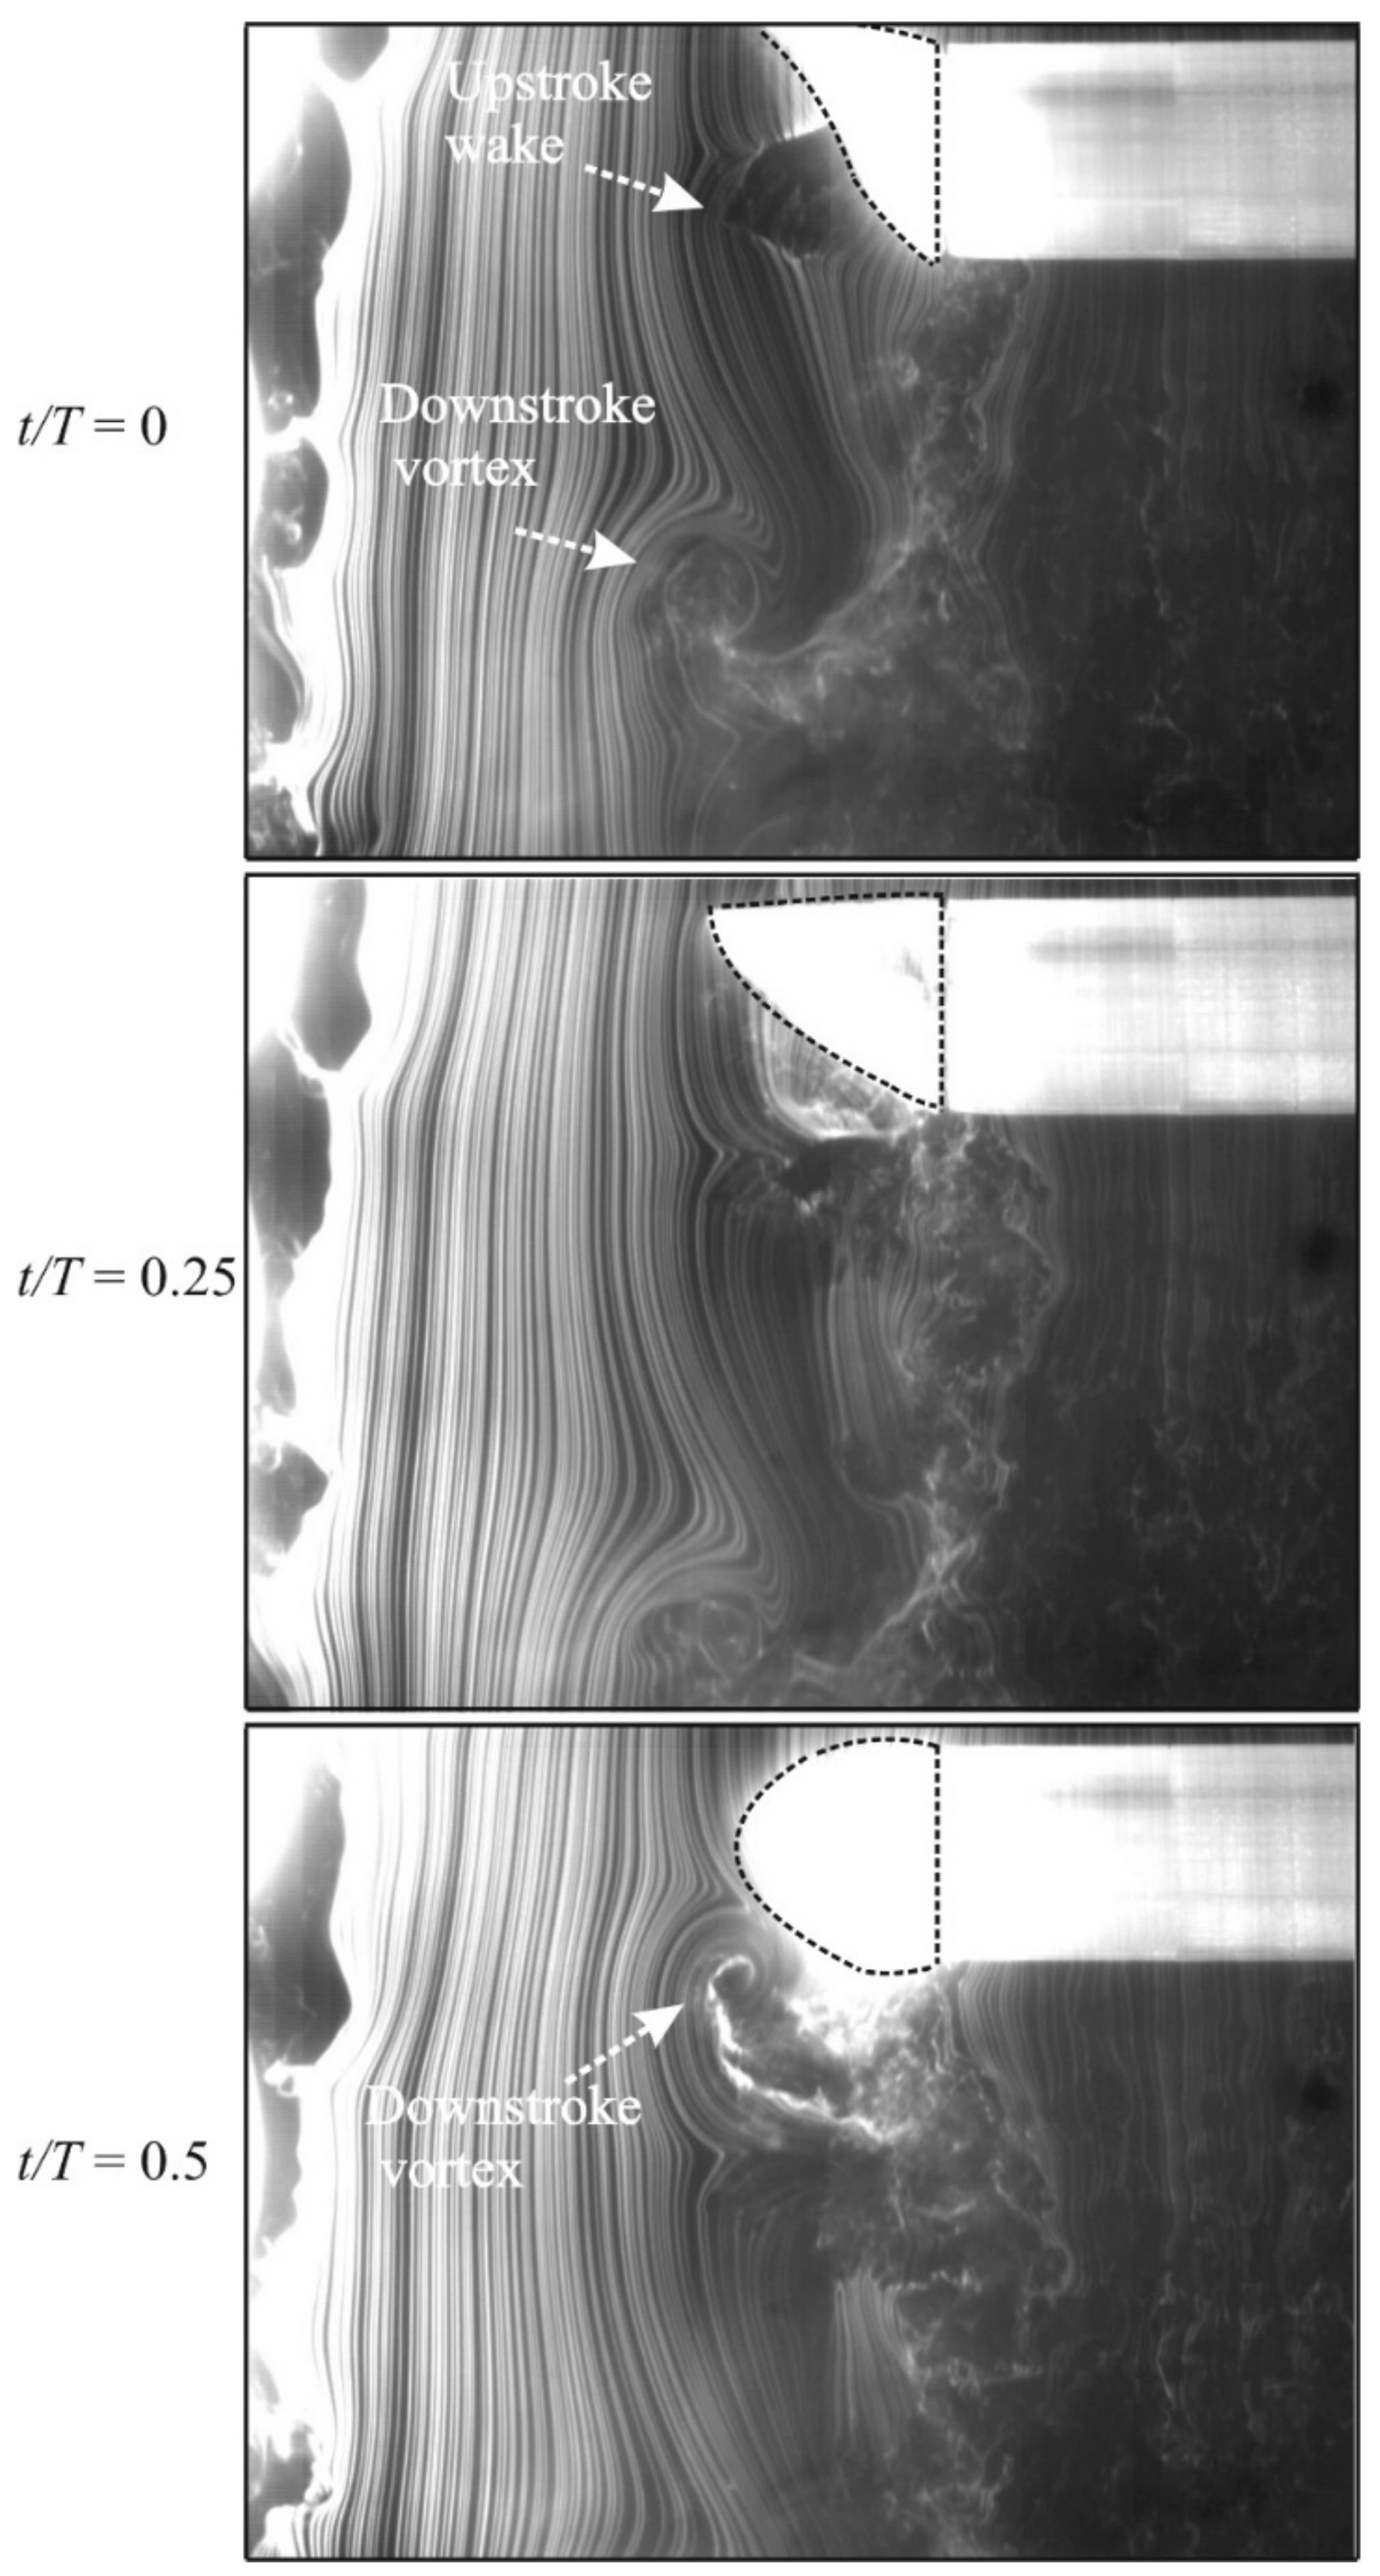
Flow streamlines on the horizontal plane z = 0 are presented in Figure 9 for three time instants. The free stream flows from the top down. Strong eddies are shed downstream from the corner point of the trailing edge, where a flapper is attached to the rigid wing. Eddies formed behind the rigid wing can also be seen in Figure 9. Imprints of the flapper on the horizontal smoke plane on the up- and downstrokes are significantly different as seen in Figure 9. There is a strong wingtip vortex generated on the downstroke.

3.3. Near-field PIV Measurements

Phase-locked PIV measurements were conducted for 27 flapping angles across a flapping cycle at each of 3 streamwise planes: x/c = 2, 3, and 5. The flapping frequency used in PIV measurements was set at 20 Hz. For a given flapping angle, 10 PIV picture pairs were recorded. A total of 810 image pairs were analyzed. The evolution of a system of vortices was investigated using vortex center and vortex core boundary identification methods described in [19,20].
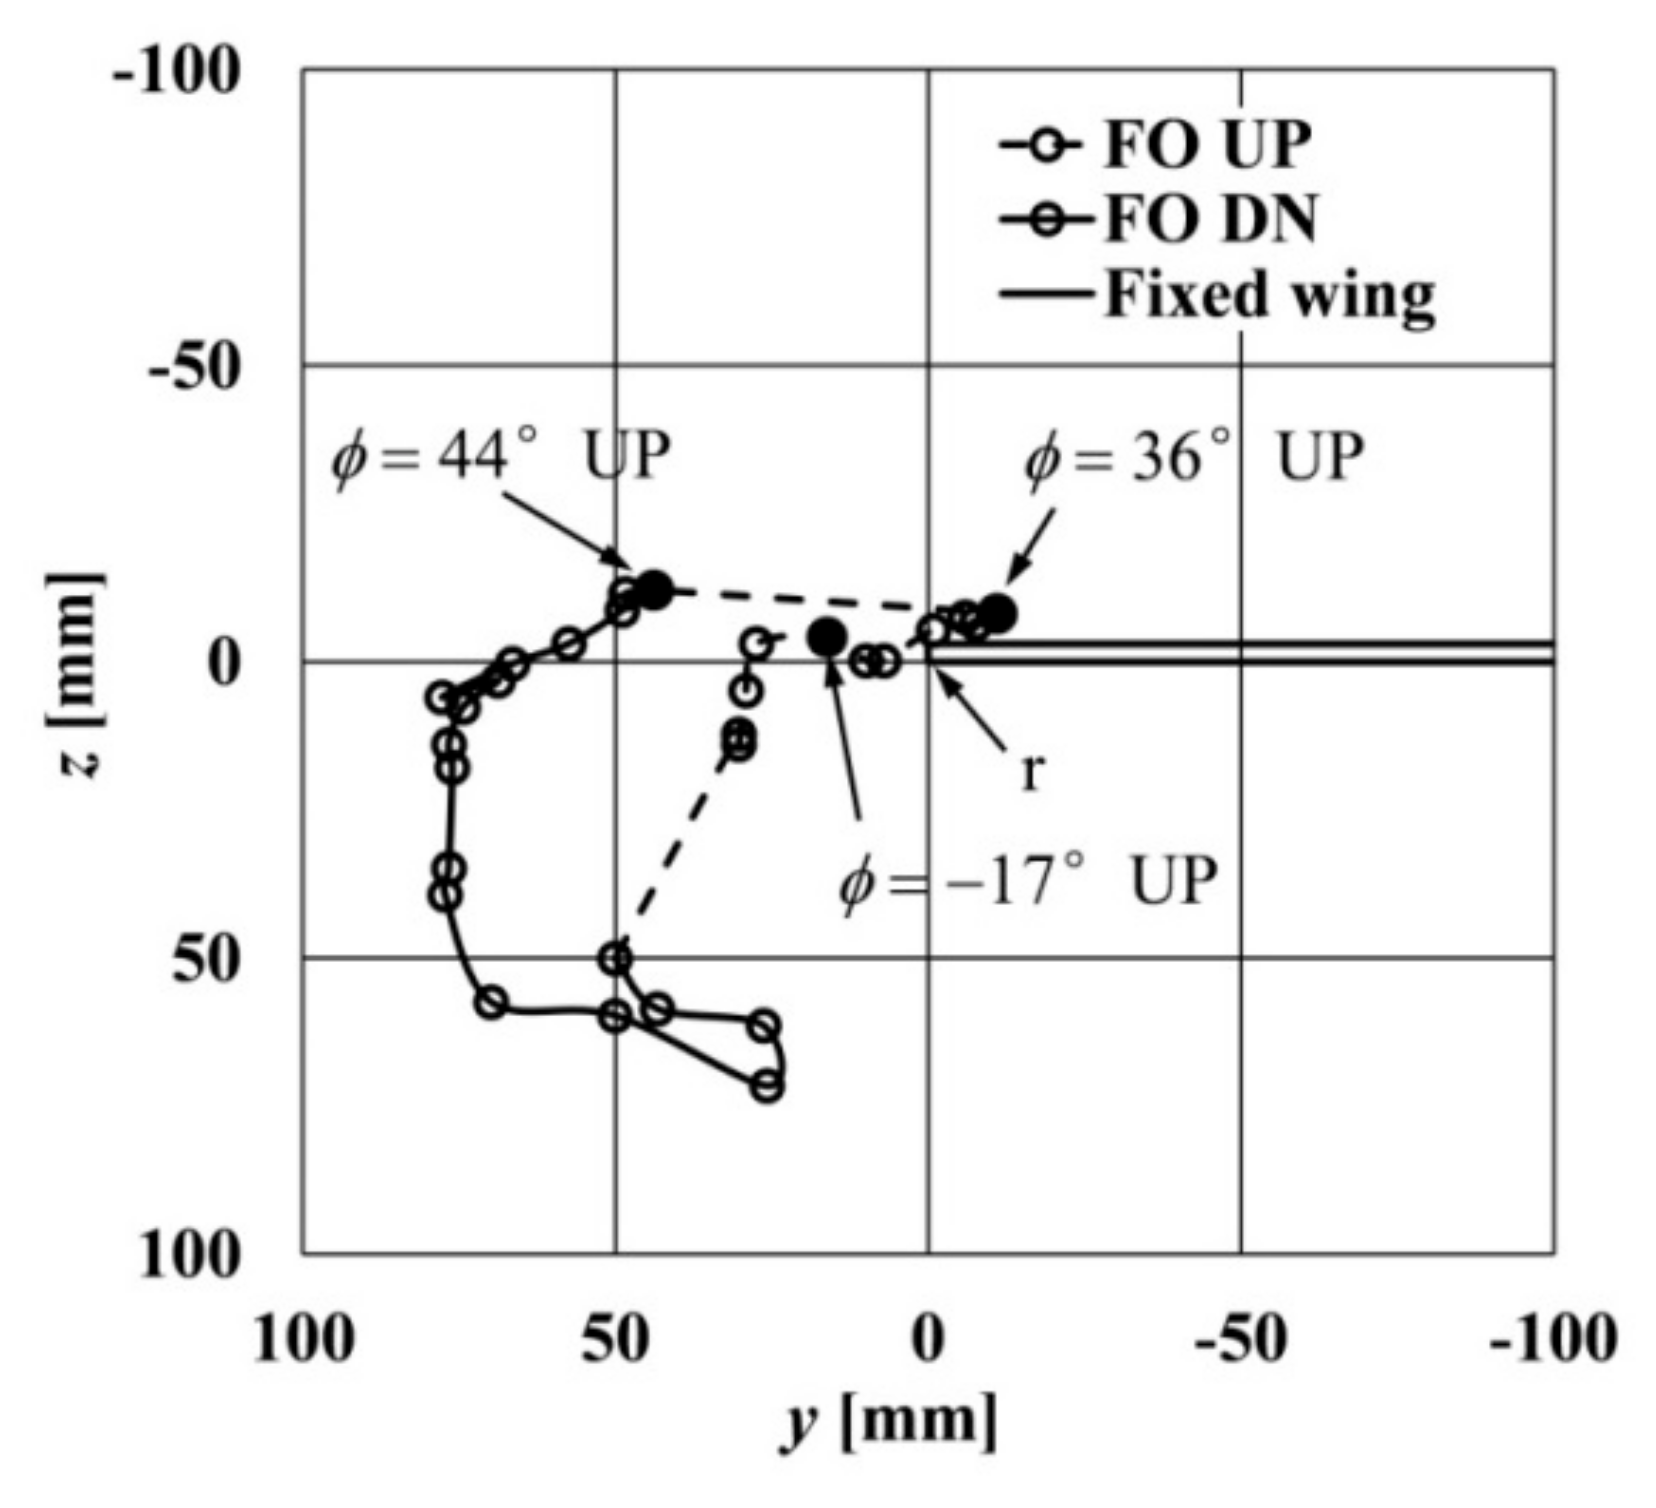
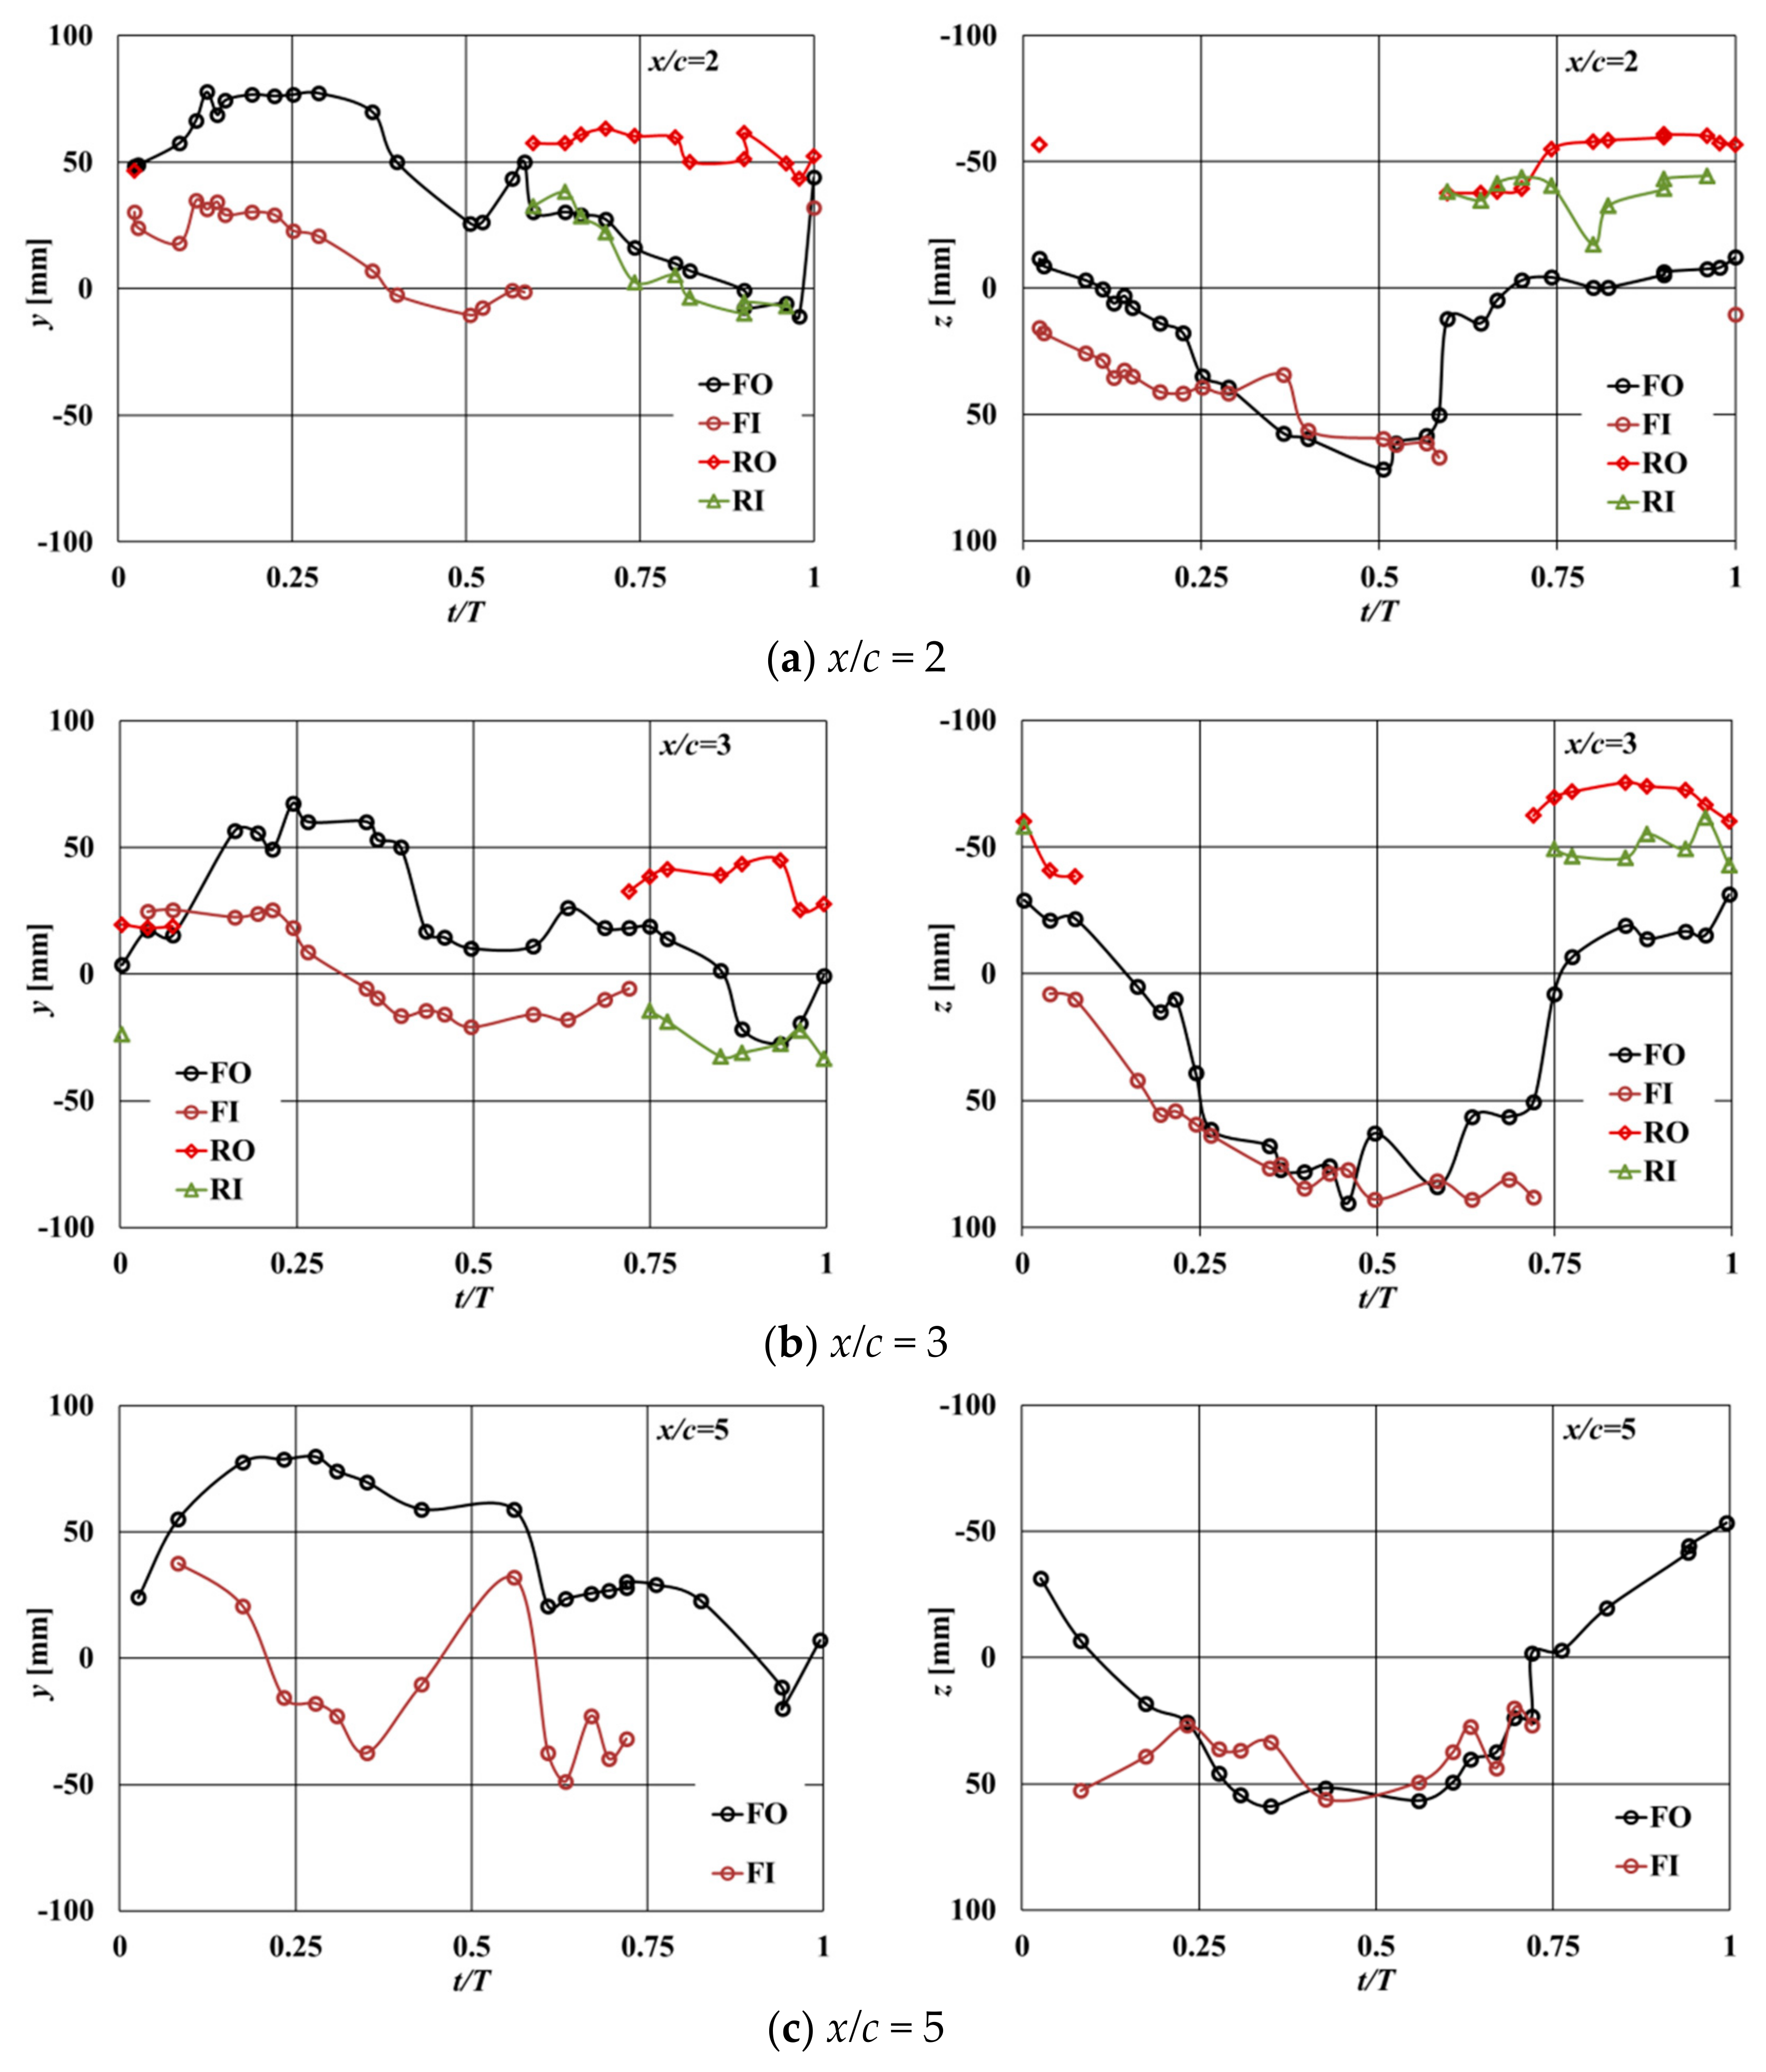
Major vortex patterns were deduced from the observations of experimental data. They include the primary undulating vortex (FO), the secondary undulating vortex (FI), and the vortex ring (RO and RI). Figure 10 shows the trajectory of the FO vortex center in the yz-planes. In this figure, the dashed line corresponds to the upstroke (UP), and the solid line is for the downstroke (DN). A position of the vortex center is related to the flapping angle of the leading edge spar, φ = φ (t0), at the time t0, when the vortex system left the flapper. Time histories of vortex center motion for all vortices are presented in Figure 11.
There is a time delay (a phase lag) between the moment, t0, when vortices shed from the flapper at x/c = 0 and the moment, t, when they reached the PIV measurements plane x/c. In the present study, the value Δt = tt0 is determined by using the PIV technique. Four small reflective markers were attached to the base and the tip of the flapper, and along the leading edge of the rigid part of the model. The markers located at x/c = 0 have been observed as bright spots on PIV images taken at a given station x/c. Tracking them and digitizing their positions allowed the determination of the time variation of the flapping angle of the leading edge spar, φ r (t). The obtained function is similar to the one presented in Figure 5. Simultaneously, the displacement of the center of the vortex FO in the vertical direction, z(t), was determined. For a given measurement plane, the time difference between time instants, corresponding to maxima of z(t) and of φ r (t), was calculated, which is approximately equal to the time delay Δt. Then, the flapping angle of the leading edge spar can be found as φ = φ (t0) = φ r (t − Δt).
Figure 10 shows the primary vortex wandering in a counterclockwise direction. Its oscillations in both vertical, z, and horizontal, y, directions through the flapping cycle are illustrated in Figure 11. On the contrary, the vortex core rotates in a clockwise direction (Figure 12), which is the same sense of rotation as a wingtip vortex in a conventional fixed wing.
At x/c = 2, starting at φ = −17° UP, the FO is shedding from the flapper near the tip of the rigid wing (point r in Figure 10). Between φ = 36° UP and φ = 44° UP, the FO vortex is rapidly shifting towards the flapper tip by about 55 mm. This change is also seen in Figure 11a at t/T ~ 1. Through the downstroke, the FO is moving downward following the flapper tip.
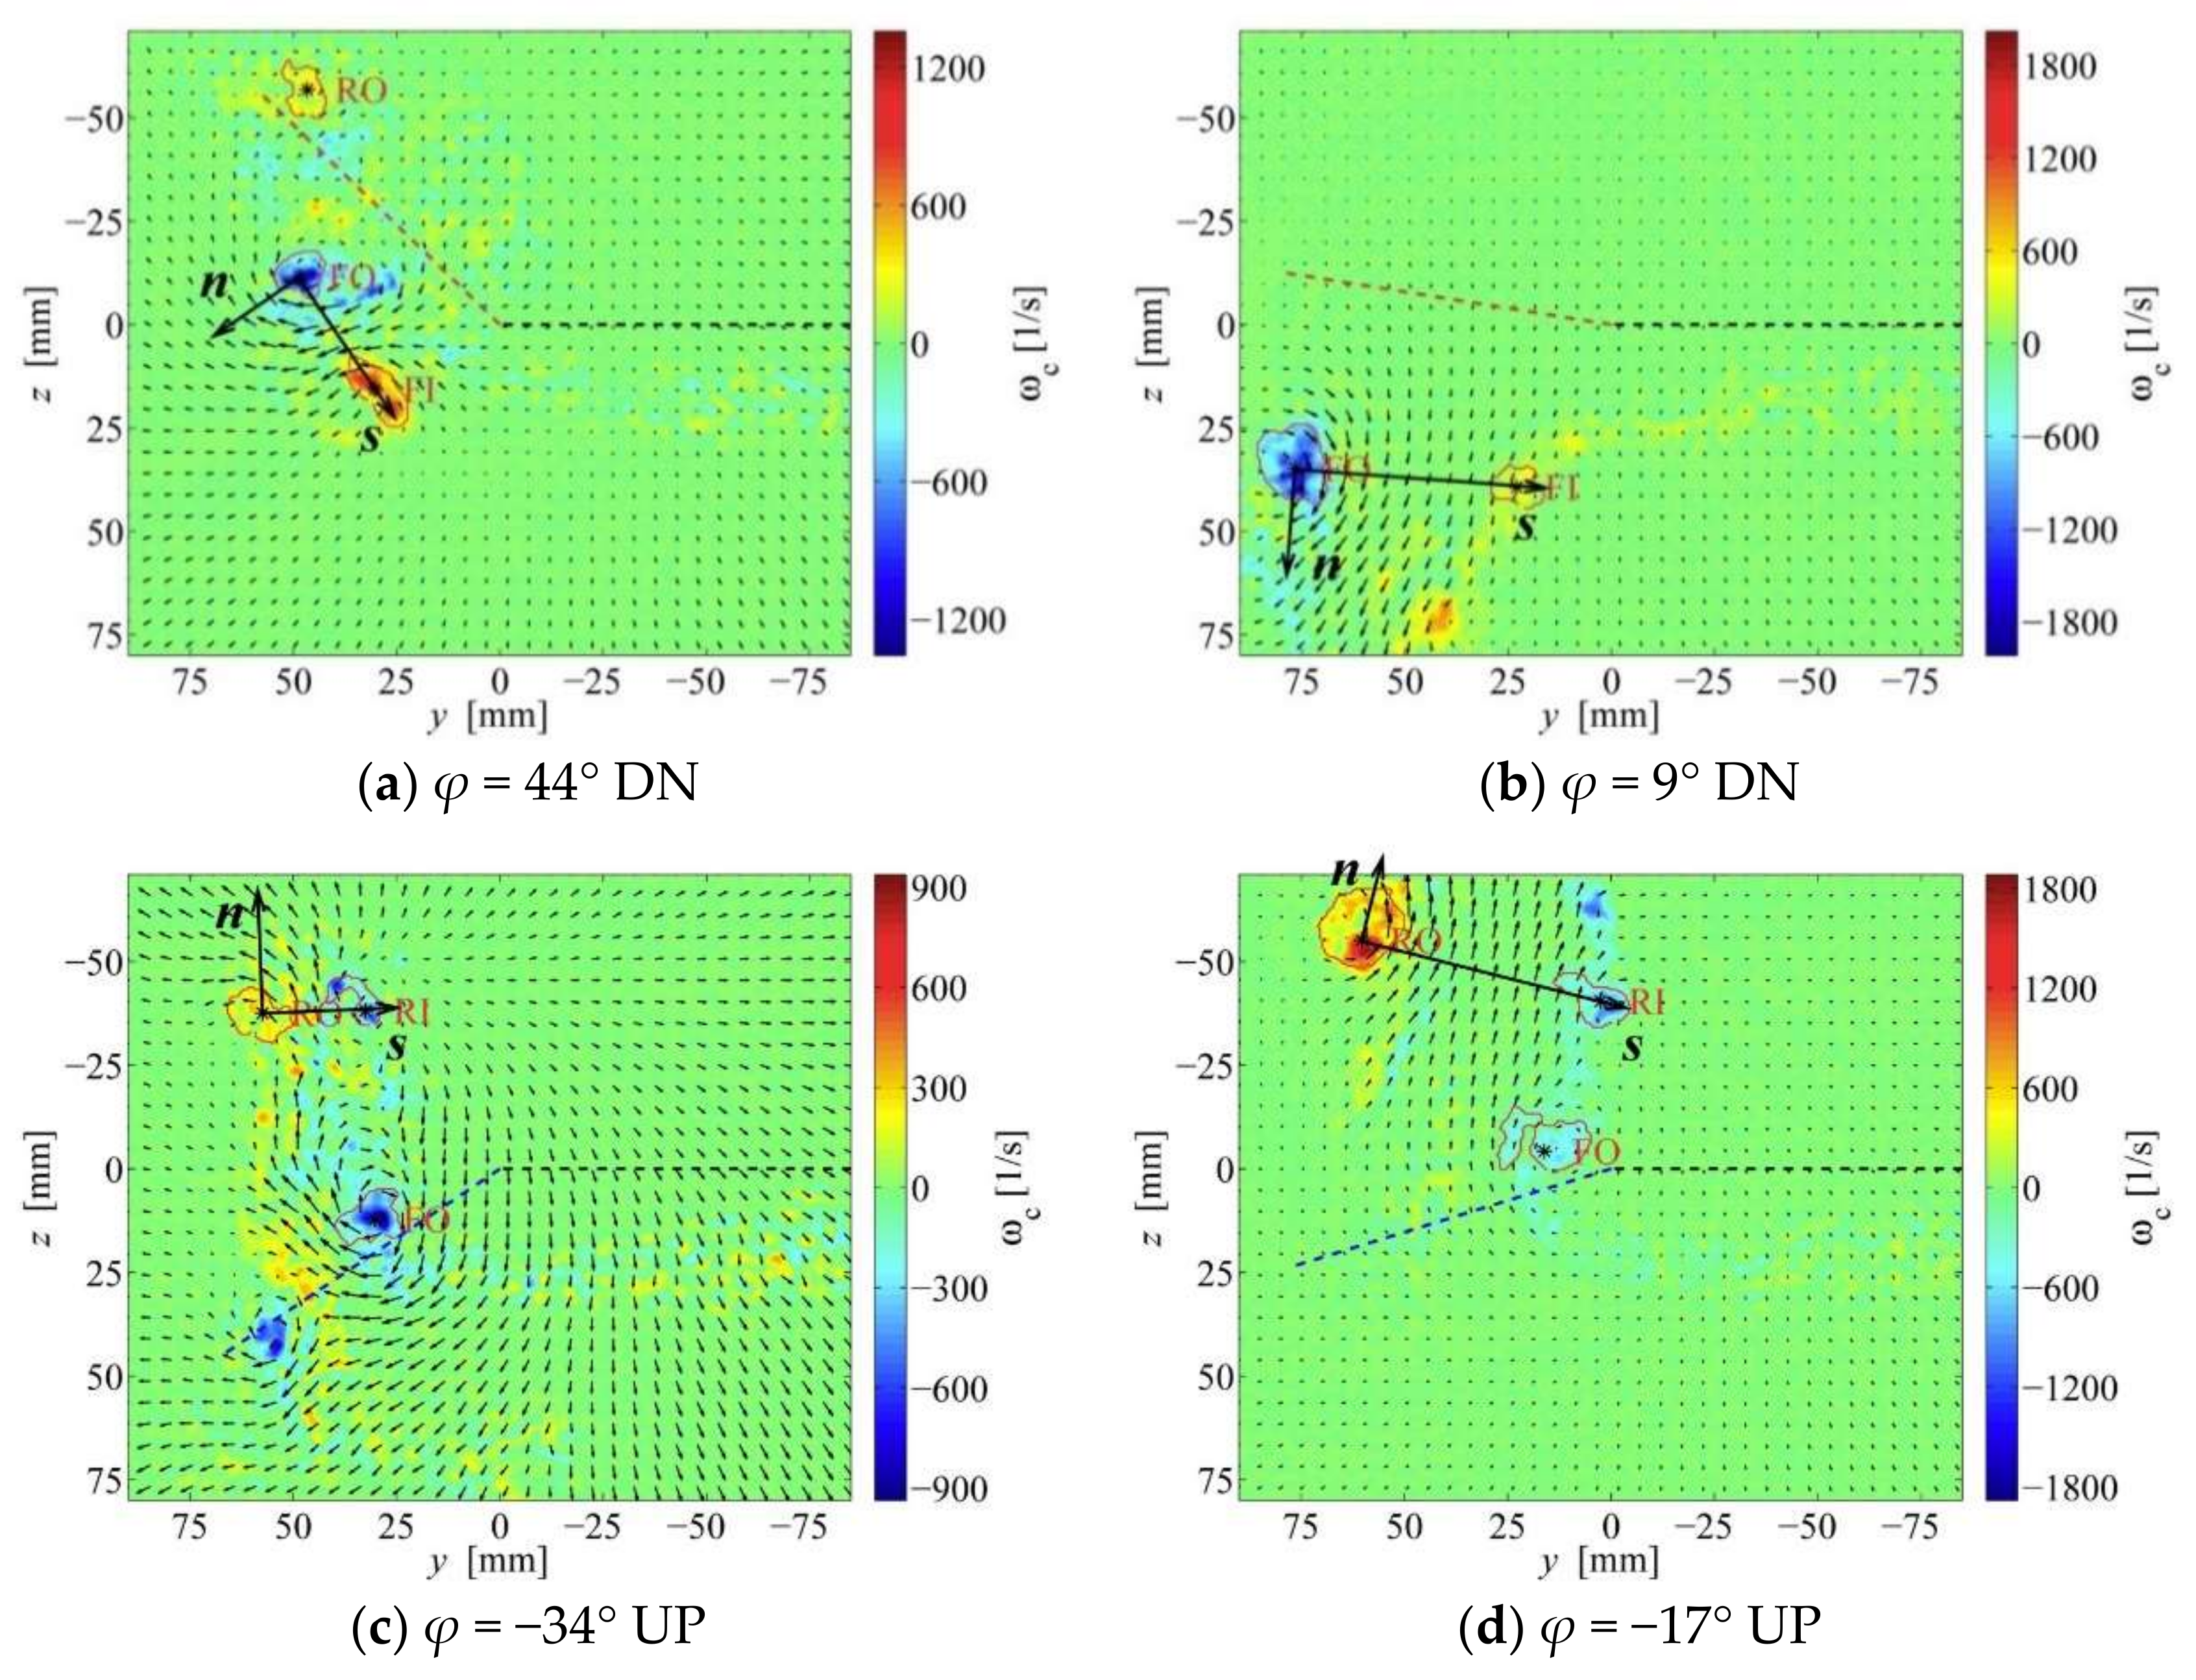
The FI vortex starts shedding at φ = 44° UP (t/T = 1) and continues shedding throughout the downstroke (t/T = 0–0.57). FO and FI have an opposite sense of rotation (Figure 12a,b) moving approximately side-by-side (Figure 11a–c). FI disappears on the yz-plane x/c = 2 at t/T = 0.58 (Figure 11a), φ = −17° UP (Figure 12d). Moreover, the distances between FO and FI in both z and y directions remain relatively small before this moment of time. These results are indicative of a cross-stream vortex closing FO and FI vortices.
Note from Figure 11 that the amplitude of oscillations of the center of the vortex FO at x/c = 5 in the z-direction is greater than that at x/c = 2 by approximately 40%. While the amplitude of the FI vortex center is decreased from x/c = 2 to 5 by almost two times.
The vortex ring includes the outer part, RO, and the inner part, RI (Figure 12c,d). They shed from the trailing edge of the membrane during the second part of the upstroke and pronation (from φ = −17° UP to φ = 42° DN). The vortex ring is moving upward (in the negative z-direction) from x/c = 2 to 3 and is out of the field of view at x/c = 5 (Figure 11c).
A circulation and a core size were determined across a flapping cycle with the help of the vortex identification methods [19,20]. The minimum, maximum, and stroke-averaged values were calculated using these data. The results for the circulation and the core radius are presented in Table 2 and Table 3, respectively. In these tables, max and min refer to the maximum and minimum of the circulation strength and the sign denotes the direction of rotation. The stroke-averaged values, ave, are also provided in tables.
Based on the circulation values, the FI vortex is much weaker than the FO. Similarly, the inner vortex RI is weaker than the outer vortex RO. For the FI, RO, and RI vortices, the maximum and average values decrease with the distance from the wing. For the FO vortex, however, a small increase of the circulation strengths of approximately 3% was found with the distance changing from x/c = 2 to 3. Circulation decreases significantly at the most distant station from the wing x/c = 5. For instance, the stroke-averaged circulation for the FO vortex decreases by almost 2 times.
As seen in Table 3, the core size slightly increases from the station x/c = 2 to 3, except for the RI vortex. For the FO and FI vortices, the core size decreases significantly at x/c = 5, while the RO and RI disappear.
Smoke-wire observations of strong vertical jets seen in the xz-plane in Figure 8 are corroborated by velocity and vorticity fields in Figure 12. The projections of these jets onto the yz-plane are seen in Figure 12 between vortex pairs FO–FI and RO–RI. Maps of the in-plane speed v 2 + w 2 averaged over the half-stroke are drawn in Figure 13 to further illustrate jet flows. A color step of 0.2 m/s was used for the illustrations. As can be seen in Figure 13, the airflow moves away from the flapper and downward or upward depending on the direction of flapping. The region of the maximum speed corresponds to approximately 2.5 m/s during both up- and downstroke.
Velocity variations in jets are plotted in Figure 14a–d for four values of the flapping angle presented in Figure 12a–d, respectively. The s-axis crosses the vortex centers of a given vortex pair, and the n-axis is normal to s-axis, as illustrated in Figure 12. The velocity components along n- and s-axis are vn and vs, respectively. On the first half of the downstroke from φ = 44° DN to 9° DN, the normal component, vn, increases up to 7.2 m/s (Figure 14a,b). The maximum of vn reaches 6.1 m/s during the first half of the upstroke from φ = −34° UP to −17° UP (Figure 14c,d). In plots in Figure 14b,d it is seen that vn maxima are closer to FO and RO, respectively, where higher velocity magnitudes and gradients are observed. For all the four phases, the magnitude of vs is much smaller than that of vn, indicating the jet-like airflow.

4. Conclusions

Force measurements, high-speed video recordings, PIV experiments, and smoke-wire visualizations were carried out on a wing with a wingtip flapper. The model was tested in a wind tunnel at the flow speed of 5 m/s and angle of attack of 8 degrees.
Stroke-averaged aerodynamic forces were measured in the wing with a wingtip flapper for the range of flapping frequency 20–30 Hz. In comparison to a conventional wing, the lift coefficient and lift-to-drag ratio increase by up to 40% and to 65%, respectively. These results demonstrated that the higher than in conventional wing aerodynamic efficiency can be achieved in the proposed design of the wing with a wingtip flapper.
Major vortex patterns were deduced from the observations of smoke-wire visualizations and PIV data: primary and secondary undulating vortices and a vortex ring. The centerline of the primary vortex wanders in the counterclockwise direction. On the contrary, the vortex core rotates in a clockwise direction, which is the same sense of rotation as a wingtip vortex in a conventional fixed wing. The secondary weaker vortex of opposite rotation lasts for a half stroke. Experimental data indicate that these two vortices are connected by a cross-stream vortex. The vortex ring sheds from the flapper during the second half of the upstroke and pronation.
A circulation and a core size were determined across a flapping cycle with the help of the vortex identification methods. Based on the obtained values, the secondary vortex is much weaker than the primary one. Similarly, the inner part of the ring vortex is weaker than the outer part. Furthermore, the circulation and the core size decrease significantly at the most distant station from the wing.
Strong vertical jets were found in the smoke-wire visualization images and confirmed with velocity and vorticity fields obtained by PIV. These jets are formed between undulating vortices and inside of the vortex ring. Jet speed averaged over the half-stroke shows that the airflow moved away from the flapper and downward or upward depending on the direction of flapping. Maximal instantaneous velocities of the jets occurred near the middle of the half-stroke.

Acknowledgments

The authors would like to acknowledge Dima Silin for constructing the wing model. We are grateful to Vitaly Krivetz for helping us with PIV measurements.

Author Contributions

S.S. conceived and designed the experiments and performed force measurements; E.S. performed the smoke-wire experiments; L.Z. performed PIV tests; S.S. and L.Z. analyzed the data and wrote the paper.

Conflicts of Interest

The authors declare no conflict of interest.

Nomenclature

CLlift coefficient [ C L = L / ( 0.5 ρ V 2 S ) ]
CDdrag coefficient [ C D = D / ( 0.5 ρ V 2 S ) ]
cchord
cmmean chord length
Ddrag force
FIsecondary undulating vortex
FOprimary undulating vortex
fflapping frequency, Hz
kreduced frequency, k = π f c m / V
Llift force
mtip of membrane flapper
Rcvortex core size, mm
rtip of rigid wing
RIinner part of vortex ring
ROouter part of vortex ring
Stotal wing area, including both fixed and flapping parts, mm2
ttime, s
Tstroke period [T = 1/f], s
UPupstroke
DNdownstroke
Vtunnel velocity, m/s
vvelocity component along y-axis, m/s
vnvelocity component of jet flow along n-axis, m/s
vsvelocity component of jet flow along s-axis, m/s
wvelocity component along z-axis, m/s
xyzmodel-fixed frame of reference
Gvortex circulation, m2/s
aangle of attack, deg
bpitching angle, deg
fflapping angle of the leading edge spar, deg
rair density, kg/m3

References

  1. Sohn, M.H.; Chang, J.W. Visualization and PIV study of wing-tip vortices for three different tip configurations. Aerosp. Sci. Technol. 2012, 16, 40–46. [Google Scholar] [CrossRef]
  2. Whitcomb, R.T. A Design Approach and Selected Wind-Tunnel Results at High Subsonic Speeds for Wing-Tip Mounted Winglets; NASA TN D-8260; NASA Langley Research Center: Hampton, VA, USA, 1976. [Google Scholar]
  3. Crow, S.C. Stability theory for a pair of trailing vortices. AIAA J. 1970, 8, 2172–2179. [Google Scholar] [CrossRef]
  4. Crow, S.C.; Bate, E.R. Lifespan of trailing vortices in a turbulent atmosphere. J. Aircraft 1976, 13, 476–482. [Google Scholar] [CrossRef]
  5. Crouch, J.D. Stability of Multiple Trailing-Vortex Pairs; CP-584; AGARD: Paris, France, 1996; pp. 17-1–17-8. [Google Scholar]
  6. Crouch, J.D.; Miller, G.D.; Spalart, P.R. Active-control system for breakup of airplane trailing vortices. AIAA J. 2001, 39, 2374–2381. [Google Scholar] [CrossRef]
  7. Spedding, G.R.; Rosén, M.; Hedenström, A. A family of vortex wakes generated by a thrush nightingale in free flight in a wind tunnel over its entire natural range of flight speeds. J. Exp. Biol. 2003, 206, 2313–2344. [Google Scholar] [CrossRef] [PubMed]
  8. Muijres, F.T.; Johansson, L.C.; Barfield, R.; Wolf, M.; Spedding, G.R.; Hedenström, A. leading-edge vortex improves lift in slow-flying bats. Science 2008, 319, 1250–1253. [Google Scholar] [CrossRef] [PubMed]
  9. Liu, Y.; Cheng, B.; Barbera, G.; Troolin, D.R.; Deng, X. Volumetric visualization of the near- and far-field wake in flapping wings. Bioinspir. Biomim. 2013, 8, 8. [Google Scholar] [CrossRef] [PubMed]
  10. Johansson, L.C.; Hedenström, A. The Vortex wake of blackcaps (Sylvia atricapilla L.) measured using high-speed digital particle image velocimetry (DPIV). J. Exp. Biol. 2009, 212, 3365–3376. [Google Scholar] [CrossRef] [PubMed]
  11. Shkarayev, S.; Silin, D. Measurements of aerodynamic coefficients for flapping wings at 0–90 angles of attack. AIAA J. 2012, 50, 2034–2042. [Google Scholar] [CrossRef]
  12. Shkarayev, S.; Maniar, G.; Shekhovtsov, A. Experimental and computational modeling of the kinematics and aerodynamics of flapping wings. J. Aircraft 2013, 50, 1734–1747. [Google Scholar] [CrossRef]
  13. Hedrick, T.L. Software techniques for two- and three-dimensional kinematic measurements of biological and biomimetic systems. Bioinspir. Biomim. 2008, 3, 034001. [Google Scholar] [CrossRef] [PubMed]
  14. Shkarayev, S.; Kumar, R. Kinematics and inertial effects in locust flapping wings. Exp. Mech. 2016, 56, 245–258. [Google Scholar] [CrossRef]
  15. Kumar, R.; Randall, R.; Silin, D.; Shkarayev, S. Insect-Inspired Micro Air Vehicles. In Handbook of Biomimetics and Bioinspiration; World Scientific Publishing Company: Singapore, 2014; Volume 3, Chapter 23; pp. 623–649. [Google Scholar]
  16. Educational Wind Tunnel (EWT) Operations Manual. Available online: http://org.coloradomesa.edu/~skessler/kessler_msc1/MISC_files/AeroLabWindTun_Operator.pdf (accessed on 1 February 2012).
  17. Kranepuhl, R.; Shkarayev, S.; Planchenault, P. Wingtip vortex modifications using alternating jets. In Proceedings of the 34th AIAA Applied Aerodynamics Conference (AIAA 2016-3118), Washington, DC, USA, 13–17 June 2016. [Google Scholar]
  18. Shkarayev, S.; Su, E.; Zhao, L. Aerodynamics of wing with oscillating wingtip flapper. In Proceedings of the 34th AIAA Applied Aerodynamics Conference (AIAA 2016-3119), Washington, DC, USA, 13–17 June 2016; p. 3119. [Google Scholar]
  19. Graftieaux, L.; Michard, M.; Grosjean, N. Combining PIV, POD and vortex identification algorithms for the study of unsteady turbulent swirling flows. Meas. Sci. Technol. 2001, 12, 1422–1429. [Google Scholar] [CrossRef]
  20. Kurnosov, V.; Shkarayev, S. Modifications of Vortex Identification Method. In Proceedings of the 33rd AIAA Aerodynamic Measurement Technology and Ground Testing Conference (AIAA 2017-3556), Denver, CO, USA, 5–9 June 2017; p. 3556. [Google Scholar]
Figure 1. Wing model inside the wind tunnel.
Fluids 03 00029 g001
Figure 2. Top view of wing schematics (all dimensions are in mm).
Fluids 03 00029 g002
Figure 3. Conventions for flapper angles.
Fluids 03 00029 g003
Figure 4. High-speed video and particle image velocimetry (PIV) setup with model, laser, and cameras.
Fluids 03 00029 g004
Figure 5. Time variations of flapping and pitching angles.
Fluids 03 00029 g005
Figure 6. Variation of lift coefficient with flapping frequency.
Fluids 03 00029 g006
Figure 7. Variation of drag coefficient with flapping frequency.
Fluids 03 00029 g007
Figure 8. Flow patterns on vertical plane at three time instants at flapping frequency of 20 Hz.
Fluids 03 00029 g008
Figure 9. Flow patterns in horizontal plane z = 0 for three time instants at flapping frequency of 20 Hz.
Fluids 03 00029 g009
Figure 10. Trajectory of the primary undulating (FO) vortex center at x/c = 2 plane.
Fluids 03 00029 g010
Figure 11. Time histories of vortex center location in 3 measurement planes.
Fluids 03 00029 g011
Figure 12. Vorticity and velocity fields at x/c = 2.
Fluids 03 00029 g012
Figure 13. Average velocity fields at x/c = 2 (rigid part of the wing and the area swept by the leading edge spar are shown by dashed lines).
Fluids 03 00029 g013
Figure 14. Jet speed variations between vortex pairs.
Fluids 03 00029 g014
Table 1. Lift-to-drag ratio.
Frequency02021222324252627282930
CL/CD2.3793.4143.6133.8963.8723.7083.0623.4613.9984.4213.8784.315
Table 2. Circulation, Γ, m2/s.
x/c235
minmaxaveminmaxaveminmaxave
FO0.0510.2100.1130.0390.2170.1160.0110.1420.066
FI−0.023−0.100−0.050−0.006−0.086−0.047−0.002−0.046−0.012
RO−0.020−0.176−0.068−0.006−0.163−0.063---
RI0.0160.0940.0490.0100.0530.028---
Table 3. Vortex core size, Rc, mm.
x/c235
minmaxaveminmaxaveminmaxave
FO3.8211.38.565.3913.09.364.2913.28.68
FI4.838.546.404.059.787.321.957.94.32
RO4.529.977.432.7711.97.53---
RI2.928.866.234.168.385.90---