Review

Surface Quasi-Geostrophy

by
Guillaume Lapeyre
Laboratoire de Meteorologie Dynamique/IPSL, CNRS/Ecole Normale Superieure, 24 rue Lhomond, 75005 Paris, France
Submission received: 29 November 2016 / Revised: 1 February 2017 / Accepted: 3 February 2017 / Published: 16 February 2017
(This article belongs to the Collection Geophysical Fluid Dynamics)

Abstract

:
Oceanic and atmospheric dynamics are often interpreted through potential vorticity, as this quantity is conserved along the geostrophic flow. However, in addition to potential vorticity, surface buoyancy is a conserved quantity, and this also affects the dynamics. Buoyancy at the ocean surface or at the atmospheric tropopause plays the same role of an active tracer as potential vorticity does since the velocity field can be deduced from these quantities. The surface quasi-geostrophic model has been proposed to explain the dynamics associated with surface buoyancy conservation and seems appealing for both the ocean and the atmosphere. In this review, we present its main characteristics in terms of coherent structures, instabilities and turbulent cascades. Furthermore, this model is mathematically studied for the possible formation of singularities, as it presents some analogies with three-dimensional Euler equations. Finally, we discuss its relevance for the ocean and the atmosphere.

1. Introduction

A large fraction of kinetic energy of oceanic flows is concentrated in quasi-horizontal motions of horizontal scales between 10 and 500 km and covering the upper 1500 m (the thermocline). The theory describing these motions mostly relies on the works of Charney [1] and is based on the conservation of quasi-geostrophic potential vorticity along the geostrophic flow. This theory applies to the ocean interior dynamics and has had numerous successes in understanding the energy exchanges between scales and the interaction between oceanic eddies (see, e.g., [2,3]). In the atmosphere, another picture emerges for which mid-latitude perturbations develop through the interactions of frontal structures at the tropopause and at the surface (the so-called Eady [4] model of baroclinic instability), which had some successes, for instance, in explaining the evolution of wave packets in storm tracks (e.g., [5]). Since the last 20 years, numerical simulations of the ocean at mid-latitudes unveiled the significant role of frontal structures at the ocean surface as was already remarked for the atmosphere. This was not foreseen because the scales of these oceanic fronts are of a few tens of kilometers (much below the Rossby radius of deformation) while they are of the order of 500 km in the atmosphere. Some studies [6,7] pointed out the possible use of the Surface Quasi-Geostrophy (SQG) model that was introduced by Blumen [8] to interpret ocean dynamics at these scales. This model has also attracted the community studying quasi-geostrophic turbulence, as it is a model that lays between purely two-dimensional (2D) barotropic and three-dimensional (3D) baroclinic dynamics (see Held et al. [9]). Its mathematical properties in terms of possible non-regularity of the solutions starting from smooth initial conditions were also put into evidence (see Constantin et al. [10]), in addition to its formal similarities with three-dimensional Euler equations.
In this review, we will discuss the characteristics of surface quasi-geostrophic flows. First, we will recall the general formulation of SQG, by introducing it in the quasi-geostrophic setting. This model is based on the conservation of an active scalar (surface buoyancy) along the horizontal geostrophic flow and on a particular relation between velocity and buoyancy. We will then discuss the existence of quasi-steady coherent structures and their related instabilities. Turbulent cascades in SQG will then be discussed, and the mathematical aspects of SQG will be covered in relation with the possible appearance of a singularity in finite time. The characteristics of passive tracers advected by SQG flows are finally discussed, as well as the connections between SQG and the ocean and atmosphere dynamics.

2. General Formulation of Surface Quasi-Geostrophy (SQG)

2.1. General Quasi-Geostrophic (QG) Theory

The SQG model stems from a special case of the Quasi-Geostrophic (QG) equations. Quasi-geostrophy is the approximation of the equations of motion for a stratified fluid in rotation, with a small Rossby number (rotation of the Earth much larger than the rotation of the motion) and a small Froude number (high stratification). General theories for the QG system can be found in Pedlosky [2] and Vallis [3]. We recall here the main points that are necessary for the presentation.
The salient feature of the QG system is the conservation of Potential Vorticity ( P V ) along the geostrophic flow trajectories. Potential vorticity is expressed as:
P V = f 0 + v x u y + z f 0 N 2 b ,
in a Cartesian coordinate system ( x ,   y ,   z ) which is centered at a latitude ϕ 0 . Here, f 0 = 2 Ω sin ϕ 0 is the Coriolis parameter at latitude ϕ 0 and Ω the rate of rotation of the Earth. The quantity v / x u / y is the vertical component of the relative vorticity of the horizontal flow u = ( u , v ) . In the ocean, buoyancy b is related to density ρ through:
b = g ρ ρ 0 ,
with g the gravity constant and ρ 0 a reference density. In the atmosphere, b is related to potential temperature θ through:
b = g θ θ 0 ,
with θ 0 a reference potential temperature. In both cases, N is the Brunt–Väisälä frequency ( N 2 = z b ¯ with b ¯ a mean vertical buoyancy profile).
In the absence of forcing and dissipation, P V is conserved along the geostrophic flow:
P V t + u · P V = 0 ,
with ∇ the horizontal gradient.
Since the geostrophic velocity is divergent free, a streamfunction ψ can be introduced, so that:
( u ,   v ) = ψ y ,   ψ x ,
b = f 0 ψ z ,
P V = f 0 + 2 ψ x 2 + 2 ψ y 2 + z f 0 2 N 2 ψ z .
Relation (6) derives from the hydrostatic and geostrophic approximations. Relation (7) involves three terms: planetary and relative vorticities and a vortex stretching term (compression of column of fluid). In the following, we will solely examine P V anomalies, which consist of omitting the planetary vorticity term f 0 in the P V equation.
In addition to P V conservation, conditions on the horizontal and vertical boundaries of the domain are to be defined. In particular, surface buoyancy is conserved along the surface flow:
b s t + u s · b s = 0 ,
b s = f 0 ψ z z = 0 ,
where b s = b ( x , y , z = 0 ) and u s = u ( x , y , z = 0 ) . Equation (8) is valid in the case of a rigid lid, that is to say, when vertical velocity w = 0 at z = 0 .

2.2. Inversion of Potential Vorticity ( P V ) Equation

From Equation (7), it appears possible to determine the streamfunction field and other quantities (e.g., velocity, buoyancy, pressure fields) knowing the three-dimensional distribution of P V (at a given time). This is called the principle of P V inversion [11]. Equation (7) is an elliptic equation if N 2 > 0 everywhere in the domain (condition of stable static stability). Therefore, solving this equation requires additional equations on the (lateral and vertical) boundaries of the domain. Setting aside lateral conditions (for instance, for a doubly-periodic domain) and imagining a semi-infinite domain in the vertical, the remaining condition is at the surface z = 0 , i.e., Equation (9). Therefore, both P V in the fluid interior and surface buoyancy are needed in determining the three-dimensional streamfunction field.
Due to the particular form of the surface condition and the elliptic operator, Bretherton [12] observed that, in the QG approximation, buoyancy at the surface plays the same role as potential vorticity in the interior of the fluid. This can be analytically established (see [7,12]), and the surface condition:
ψ z z = 0 = b s f 0
can be replaced by:
ψ z z = 0 = 0 ,
provided that Equation (7) becomes:
2 ψ x 2 + 2 ψ y 2 + z f 0 2 N 2 ψ z = P V b s f 0   δ ( z ) .
Hence, the surface buoyancy plays the role of a Dirac function for the P V field (i.e., it can be considered as a “ P V sheet”). Note that this idea has been extended in the context of the primitive equations by Schneider et al. [13]. The analogy between interior P V and surface buoyancy is also apparent when considering baroclinic instability criteria [14], as necessary conditions of instability involve the change in sign of either the interior potential vorticity gradient or the opposite signs between the interior P V gradient and the surface buoyancy gradient.
From Equation (12), the contributions of the surface buoyancy and the interior P V to the total flow can be separated leading to interior and a surface-induced dynamics [7,11]. An interior-induced dynamics corresponds to the situation of conservation of the interior P V along the geostrophic flow with uniform buoyancy at the surface:
P V = 2 ψ x 2 + 2 ψ y 2 + z f 0 2 N 2 ψ z ,
f 0 ψ z z = 0 = 0 ,
P V t + u · P V = 0 .
This is the classical model of the quasi-geostrophic theory [1], and its characteristics are relatively well known (see, e.g., [2,3,15,16]).
A surface-induced dynamics corresponds to the situation of conservation of the surface buoyancy along the surface geostrophic flow with uniform P V in the interior:
P V = 2 ψ x 2 + 2 ψ y 2 + z f 0 2 N 2 ψ z = 0 ,
b s = f 0 ψ z z = 0 ,
b s t + u s · b s = 0 .
This model has been considered, among others, by Blumen [8] and Held et al. [9], who first studied its characteristics. We will now present the different results that are known about this system.

2.3. Surface Quasi-Geostrophy (SQG) Formulation

The surface quasi-geostrophic equations in their non-dimensional form can be expressed as:
2 ψ x 2 + 2 ψ y 2 + 2 ψ z 2 = 0 ,
θ = ψ z z = 0 ,
lim z + ψ z = 0 ,
u s = ψ y z = 0 ,   ψ x z = 0 ,
θ t + u s · θ = 0 .
To obtain these non-dimensional equations, a constant Brunt–Väisälä frequency N 2 has been assumed, and the vertical coordinate has been transformed using z N / f 0 as a new vertical coordinate. The non-dimensional variable θ corresponds to the surface buoyancy b s . Here, we choose to place ourselves in the atmospheric case (considering a semi-infinite domain with z > 0 ).
From Equations (19)–(21), the following relation is obtained in the horizontal Fourier domain:
ψ ^ ( k , z ) = θ ^ ( k ) K exp ( K z ) ,
with K = | k | the wavenumber modulus. ψ ^ ( k , z ) is the two-dimensional Fourier transform of the streamfunction ψ at the altitude z, and θ ^ ( k ) is the Fourier transform of the surface buoyancy. Equation (24) shows that, for each Fourier component, the streamfunction decreases exponentially with z. Observe in particular that the decrease is even faster when small horizontal scales are considered (large K).

2.4. Invariants

There are two invariants in this system: the surface potential energy (often called generalized enstrophy by analogy to relative enstrophy for barotropic flow [17]),
P = 1 2 θ 2   d x d y ,
and the total vertically-integrated (kinetic and potential) energy (often called generalized energy [17]),
E = 1 2 ψ x 2 + ψ y 2 + ψ z 2   d x d y d z = 1 2 ψ s θ   d x d y ,
with ψ s = ψ ( x , y , z = 0 ) . The last equality in Equation (26) comes from the uniformity of P V , i.e., Equation (19). From Equation (24), we deduce that surface kinetic energy is proportional to surface potential energy:
E ( z = 0 ) = 1 2 ( u s 2 + v s 2 ) d x d y = 1 2 K 2 | ψ ^ s | 2 d k   d l = 1 2 | θ ^ | 2 d k   d l = 1 2 θ 2 d x d y = P ,
with k = ( k ,   l ) the horizontal wavenumber.

2.5. Relation between the Active Tracer and Streamfunction

The buoyancy θ is an active tracer since it is advected by the flow it creates. This is similar to the nature of relative vorticity of a two-dimensional barotropic flow. The expression relating buoyancy to the streamfunction is:
θ ^ = K ψ ^ s ,
while the relation relating relative vorticity ζ = v / x u / y = 2 ψ / x 2 + 2 ψ / y 2 to streamfunction is:
ζ ^ = K 2 ψ ^ .
Such analogies persist in the physical space, taking θ as a Dirac density function θ ( x ) = δ ( x x 0 ) :
ψ s ( x ) = 1 2 π | x x 0 | ,
while for ζ ( x ) = δ ( x x 0 ) ,
ψ ( x ) = 1 2 π log ( | x x 0 | ) .
In the SQG case, the velocity modulus decreases as 1 / | x x 0 | 2 , much sharper than 1 / | x x 0 | for the barotropic case [9]. This means that barotropic vortices have a farther range influence compared to their SQG counterparts.

3. Coherent Structure Dynamics

3.1. Exact Surface Quasi-Geostrophy (SQG) Solutions

Several exact solutions of the SQG equations that are steady in some Galilean reference frame have been found. A first class of solutions is shear lines, i.e., buoyancy being a function of a single dimension (e.g., θ = f ( y ) ). Rectilinear strips with varying or uniform buoyancy over a finite band in the transverse direction belong to this class [18].
Concerning mono-polar vortices, circular vortices are evidently steady solutions of the SQG equations. Dritschel [19] presented an SQG solution corresponding to a steadily rotating ellipse with nonuniform buoyancy in the interior of the ellipse. The possibility of the existence of a rotating ellipse with uniform buoyancy was treated by Castro et al. [20], who showed that such an ellipse would not persist in time while keeping its shape. Nonetheless, Castro et al. [21] proved the existence of convex global rotating vortices with C regularity for their boundary curves and with uniform buoyancy in their interior, but their proof does not allow for any explicit solutions.
The case of two vortices was treated by several authors. A first simple model consists of two point vortices of the same or different buoyancies. Lim and Majda [22] showed that, in this case, the distance between the two partners remains fixed in time, and they form curvilinear trajectories. In the case of the same buoyancy anomaly, they rotate around each other, while they steadily translate in a straight line when their buoyancy is opposite. For continuous buoyancy profiles, the analytical solution of such steadily-translating vortex dipoles was described by Muraki and Snyder [23]. Carton et al. [24] presented the solution of two co-rotating vortices with uniform buoyancy in the presence or absence of a large-scale strain field. This last study also examined analytically and numerically the merger of these vortices in the presence or absence of an external deformation field. It was found that the distance of vortex merging was generally smaller than the two-dimensional barotropic case [24]. This can be explained by the rapid decrease of the velocity as a function of distance (see Section 2.5), which prevents the vortices from exerting an influence on each other at a large distance.

3.2. Contour Dynamics

Vortices formed by piecewise-constant buoyancy within finite-area regions may be seen as building block models to study vortex dynamics since only the time evolution of vortex boundaries needs to be known. This is the essence of the approach of contour dynamics [25]. However, contrary to the barotropic case, the equation of evolution of the interface for SQG flows requires a careful treatment. Indeed, the tangential velocity along the contour is divergent, while the local contribution to the normal velocity (displacing the material curve) vanishes at leading order, allowing some regularity in the contour equations [9,18].
In this context, Cordoba et al. [26] determined the evolution equation for the interface of an “almost sharp front”, that is to say, a strip of finite width δ separating two regions of constant buoyancy, δ being a small parameter. They showed that the equation with δ tending to zero corresponds to a weak solution of the equation of motion, and Fefferman and Rodrigo [27] were able to construct analytic solutions for this problem. Rodrigo [28] examined the case of sharp fronts (discontinuities in buoyancy) and showed that, if θ ( x , y , t ) is a weak solution of the equations, then it is possible to obtain an equation for the interface. This result was extended by Gancedo [29], and local-in-time existence and uniqueness for smooth contours were obtained. Cordoba et al. [30] examined numerical simulations of contour dynamics and showed an example of the collapse of two iso-buoyancy contours at a single point. In the case of the instability of an ellipse with uniform buoyancy, Scott and Dritschel [31] also observed the collapse of a filament width in finite time. However, as shown by Gancedo and Strain [32], such a collapse can only occur if the curvature of the contour tends to infinity in finite time, which was the case in the studies of Cordoba et al. [30] and Scott and Dritschel [31]. These different examples do not contradict the mathematical results of Rodrigo [28] and Gancedo [29] because their theorems rely on the smoothness of the vortex boundary, which is not the case here.

3.3. Instabilities

The instability of strips of uniform buoyancy was studied by Juckes [18], who showed that the number of the most unstable waves, as well as their rate of growth are inversely proportional to the width of the strip. This is due to the conservation of buoyancy that implies that the relative vorticity ζ increases when the filament becomes thinner since, by Equation (28), the vorticity scales as θ / L , L being the width of the filament. This leads to the typical roll-up of the filament, as in the case of barotropic flows, but with a much smaller timescale [9]. The general mechanism to inhibit the instability of a filament is the presence of a background strain, for instance due to a distant eddy [33]. However, due to the fast decay of the velocity field from a point source, which follows from Equation (30), this mechanism will be less effective than in the barotropic case. Indeed, Harvey and Ambaum [34] showed that, contrary to the barotropic case, the large-scale deformation or adverse shear is not capable of stabilizing these filaments because the thinning of the filament due to these processes increases the growth rate of the instability.
The fact that the instability of a filament is more rapid as its width decreases with the subsequent formation of new vortices of smaller scales may lead to a cascade of instabilities, as these vortices will also stir new filaments at a thinner and thinner scale. This cascade of filament instabilities may lead to a finite time singularity as discussed by Scott [35] and Scott and Dritschel [31]. This is well illustrated in Figure 1, which represents the buoyancy contours at a time close to the formation of the singularity. The scenario of the instability can be described as follows: the first filament developed an instability with a time scale that is inversely proportional to its width. Vortices at the scale of the instability (i.e., the filament width) are then formed and stir a filament between them. As explained above, the shear induced by the vortices is not sufficient to inhibit the instability of the new filament. A new instability takes place, which is more rapid and at a smaller scale, since the filament is made thinner by the straining of the nearby vortices. This process continues more and more rapidly, leading to a self-similar cascade of instabilities. The final evolution consists of the collapse of the filament width to zero and to its infinite curvature.
Concerning coherent vortices, Carton [36] numerically examined the instability of circular vortices with different buoyancy profiles. For moderate buoyancy gradients at the edge of the vortex, the linear instability is similar to the classical barotropic instability, while it is more unstable for stronger gradients. In addition, the nonlinear equilibration proceeds as in the barotropic case with the formation of multipoles, such as tripoles [36]. Moreover, Harvey and Ambaum [37] examined the instability of a circular vortex with uniform buoyancy (a Rankine vortex) and showed that it was also similar to the instability of the barotropic circular vortex. Other classes of axisymmetric vortices were also studied, such as shielded vortices (vortices with zero net buoyancy) with a constant-buoyancy core surrounded by a constant-buoyancy annulus [38]. This last study confirmed the numerical results of Carton [36]. In addition to axisymmetric vortices, one can examine the instability of the steadily-rotating ellipse documented by Dritschel [19]. It was found to be stable to perturbations for a smaller range of aspect ratios compared to the two-dimensional barotropic case. The instability leads to the ejection of filaments as in the barotropic case, but these filaments develop shear line instabilities, rolling up into small vortices, which was not observed in the barotropic case. More general studies on the properties of instabilities of SQG flows have been done. Friedlander and Shvydkoy [39] examined the unstable spectrum of solutions (eigenvectors of the linear problem) for a particular spatially oscillating shear flow. In such a case, the general solutions (the unstable spectrum) were also found to share the same properties as the standard 2D barotropic case. These different examples illustrate that barotropic and SQG flows bear some common properties in terms of linear instability.
Nonlinear instability was treated by Friedlander et al. [40] for the SQG equations in the presence of a constant forcing in time and with a dissipation operator. It was found that, like barotropic flows, the linear instability of stationary solutions implies nonlinear instability (à la Lyapunov). A similar problem about the nonlinear growth of small perturbations in the context of atmospheric predictability was considered by Rotunno and Snyder [41]. It was found that the SQG model exhibits limited predictability, unlike the barotropic model, as the initial small-scale errors rapidly grow and saturate, and a slower growth is then observed when these perturbations reach larger scales. On the contrary, in the barotropic case, the errors at small scales cascade towards errors at larger scales, but still having small amplitudes, and then, saturate relatively slowly in time. A last result that can be discussed concerns the number of degrees of freedom as defined as the number of positive local Lyapunov exponents (corresponding to an orthogonal basis of perturbations with an instantaneous positive growth rate). Tran et al. [42] showed that this number grows at most in R e 3 / 2 with R e the Reynolds number, a result that is in agreement with the phenomenology of turbulent cascades.

4. Turbulent Cascades

Surface quasi-geostrophy possesses particular properties in term of turbulent cascades as it conjugates two-dimensionality through the advection of buoyancy and possible transfers between potential and kinetic energies.

4.1. Buoyancy Variance Spectra

Blumen [8] showed that, because of the existence of two invariants (total energy E and potential energy P ), two turbulent regimes can be identified: an inverse cascade of total energy associated with a spectrum of buoyancy variance in k 1 ; a direct cascade of potential energy with a spectrum of buoyancy variance in k 5 / 3 . This has to be contrasted with the barotropic QG system for which the direct cascade of enstrophy gives an enstrophy spectrum steeper than k 1 , and in the inverse kinetic energy, the enstrophy spectrum is in k 1 / 3 , corresponding to a kinetic energy spectrum in k 5 / 3 [43]. Using an Eddy-Damped Quasi-Normal Markovian (EDQNM) model, Hoyer and Sadourny [44] confirmed the scenario of the direct and inverse cascades and the corresponding spectra. (see also [45,46] for a discussion of the inverse cascade for a particular large-scale dissipation operator.)
Different numerical simulations were done, in the presence or absence of forcing or large-scale dissipation. Pierrehumbert et al. [47] and Celani et al. [48] examined the direct cascade of buoyancy variance and found that the spectral slope was slightly steeper than k 5 / 3 in the case of large-scale forcing. Sukhatme and Pierrehumbert [49] and Capet et al. [50] also found steeper slopes in freely-decaying simulations during the time when an inertial range can be observed. These studies indicate that a correction to the standard similarity argument is needed. Watanabe and Iwayama [51] reconsidered the standard similarity hypothesis of Kraichnan [43] and obtained a prediction for the buoyancy variance slope shallower than k 5 / 3 , which they observe in their simulation where they force and dissipate the energy at large scales. As discussed by Tran and Bowman [45], Tran [46] and Constantin [52], a particular form of the dissipation operator can lead to different upper bounds for the spectra. The discrepancy of [51] with other results may thus be due to the types of forcing and dissipation used in each numerical setting (see Burgess et al. [53] for a discussion of such an effect). It may also depend on the presence of vortices that generally steepen the spectra.
For the inverse cascade, Smith et al. [17] and Tobias and Cattaneo [54] observed a spectrum consistent with k 1 for the buoyancy variance in the presence of forcing and dissipation. Burgess et al. [53] observed a steeper spectrum when dissipation is absent, which they attribute to the formation of coherent vortices.

4.2. Physical Properties of the Cascade

As can be seen in Figure 2a, SQG turbulence is characterized by the presence of vortices at all scales because instabilities of fine-scale filaments are weakly inhibited by larger-scale vortices, leading to new instabilities [31]. This suggests a possible multifractal nature of the turbulent field, as noted by Sukhatme and Pierrehumbert [49]. For a simulation of decaying turbulence (hence, in the direct cascade of buoyancy variance), they observed that the buoyancy field becomes rough in a particular range of scales. Moreover, in the SQG inverse cascade, Bernard et al. [55] showed that the fractal dimension of the buoyancy field is d 1.5 , as for the relative vorticity field in the direct cascade of 2D barotropic turbulence, This study also showed that the zero-buoyancy isolines are conformally invariant as in the 2D inverse cascade of barotropic turbulence. This result indicates that buoyancy isolines are equivalent to curves that can be mapped into a one-dimensional Brownian walk.
Concerning now the properties of the buoyancy field at large time, Venaille et al. [56] showed that the formation of a sharp interface between two regions of homogenized buoyancy will occur as time tends to infinity due to a coarsening process. The statistical equilibrium generally corresponds to a one-dimensional flow field and not a large-scale dipole that would occur for the inverse cascade of barotropic turbulence. The evolution to statistical equilibria can also be examined in terms of spectral properties. In this context, Teitelbaum and Mininni [57] showed that generalized enstrophy thermalizes (the spectra of buoyancy variance behaving as k for large k), while generalized energy condenses (piling up at the largest scale).

4.3. Role of Meridional Gradients and Linear Damping

One can examine the more general problem of an SQG system with an additional meridional gradient of buoyancy and a linear damping term:
θ t + u s · θ + β ψ x = r θ .
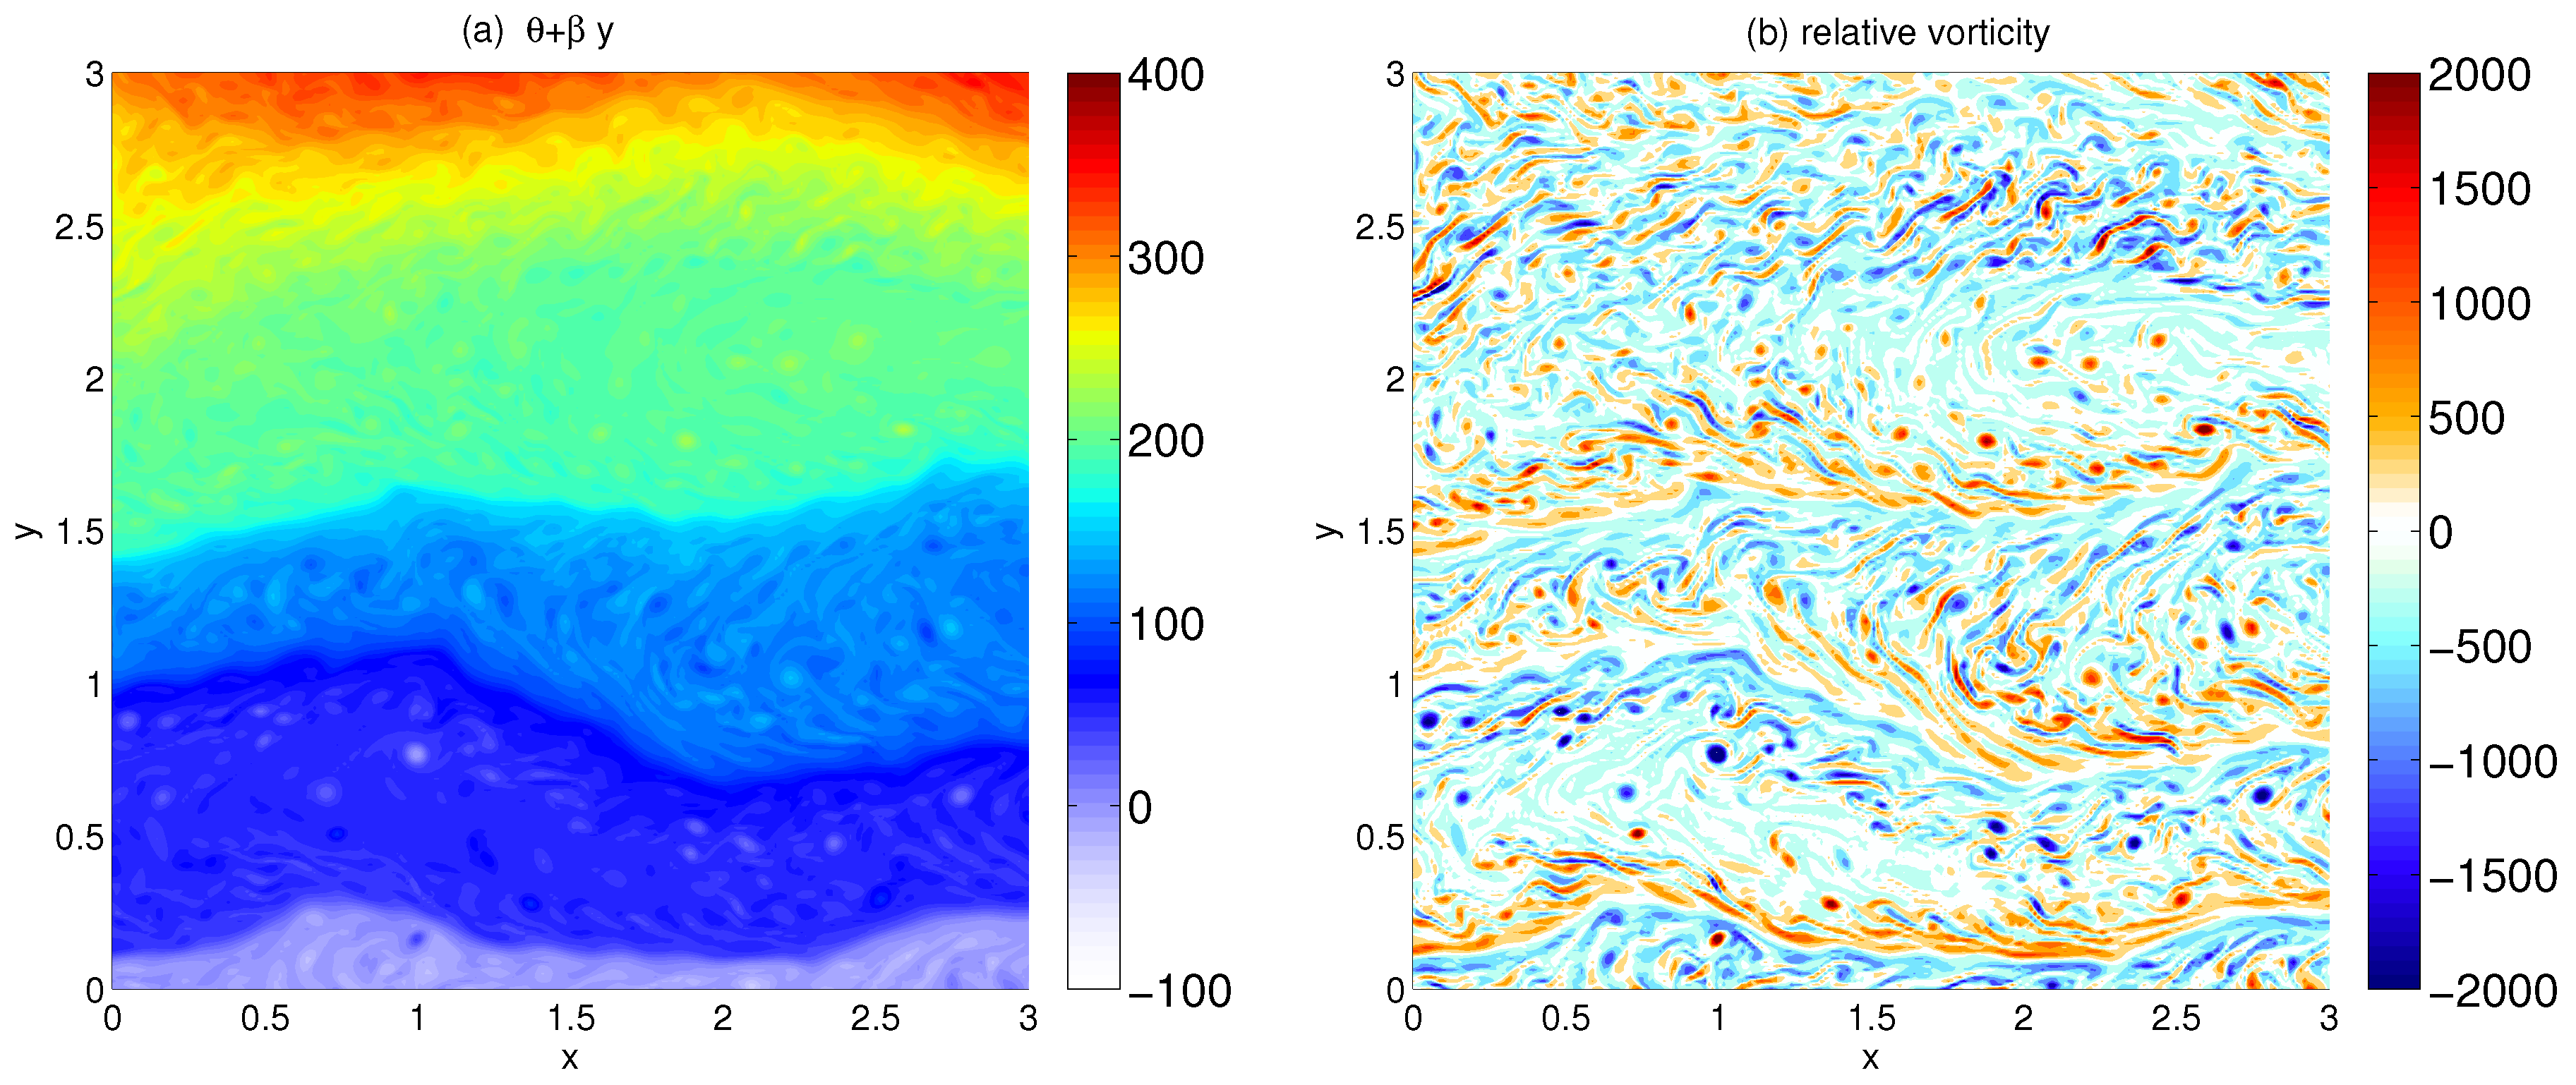
The last term on the left-hand side of Equation (32) is the meridional advection of a large-scale buoyancy θ ¯ = β y , while the term on the right-hand side exerts a “thermal” damping on buoyancy. When β is larger than the advective terms, the solutions of this equation are the equivalent to Rossby waves of barotropic turbulence. If we continue with the analogy with barotropic turbulence [58], when β is as large as the nonlinear advective terms, these waves will interact with the nonlinearities of the flow, and zonal jets will develop. This is illustrated by Figure 3a, which shows the total buoyancy field θ + β y in a numerical simulation resolving Equation (32). These jets lie between regions of homogenized buoyancy. In between, small-scale vortices interact between each other without cascading to larger scales (Figure 3b). In the inverse cascade regime, the kinetic energy spectrum should follow a k 3 dependency along the meridional direction [17]. For comparison, in the inverse energy cascade of barotropic turbulence, one would have instead an anisotropic spectrum in k 5 . Sukhatme and Smith [59] were not able to see the k 3 regime in their numerical simulation resolving the inverse SQG cascade. They instead noted shallower spectra for increasing β in the inertial range domain. In the direct cascade, the buoyancy variance spectra were observed to be mostly insensitive to the value of β.
The effect of the linear damping term in absence of β was examined by Smith et al. [17]. This study showed that the inverse cascade should be halted at a particular wavenumber k r r g 1 / 3 with g the energy injection rate to the system, and the generalized energy spectrum should behave as g 2 / 3 k 2 ( 1 k r / k ) 2 . Numerical simulations were not very conclusive about the shape of the energy spectrum, but the arrest scale was well predicted.

4.4. Energy Transfers

The prediction of the buoyancy variance spectrum in k 5 / 3 is obtained if one assumes that only local scales can affect the buoyancy variance spectral transfers between scales. In barotropic turbulence, this is not the case, and a steeper spectrum of enstrophy than predicted was observed by numerous studies (see, e.g., Vallis [3]). This can be measured through the study of the contributions of local and nonlocal scale interactions in the buoyancy variance flux at a given scale. Watanabe and Iwayama [60] showed that both local and nonlocal triad interactions contribute to the total transfer. This is contrary to the standard expectation based on a strain-rate variance σ 2 ( k ) = 0 k K 2 Q ( K ) d K scaling as k 4 / 3 for a buoyancy variance spectrum Q ( K ) in k 5 / 3 [47]. Such a scaling would indicate that local scales dominate the time scale of the spectral fluxes. Watanabe and Iwayama [51] presented a correction of the k 5 / 3 spectrum that was in fair agreement with the result of their numerical simulation. The issue of locality or nonlocality in the spectral transfers for the direct cascade is not yet totally solved, as the flatter buoyancy spectrum observed by Watanabe and Iwayama [51] is in disagreement with other studies, which show steeper spectra.
The SQG system possesses at the same time surface potential energy P = θ 2 / 2 and surface kinetic energy E = | u s | 2 / 2 , and one might expect some transfers between the two as is the case for three-dimensional QG turbulent flows. The conservation equation of buoyancy variance gives:
1 2 | θ ^ | 2 t = [ θ ^ ( u s · θ ^ ) ] ,
where ( ) stands for the complex conjugate and [ ] the real part. In the absence of dissipation, the interaction among triads transfers buoyancy variance to small scales [60]. By manipulating the momentum equations, the conservation of kinetic energy in spectral space can now be written as:
1 2 | u s ^ | 2 t = [ u ^ s · ( u s · u s ^ ) ] [ ψ s ^ w ^ z s ]
where w z s = w / z at z = 0 is the opposite of the surface divergence [50]. The first term on the right-hand side of this equation corresponds to the transfer of kinetic energy among wavenumbers. The second term corresponds to the effect of the ageostrophic pressure that allows the transfer of potential energy into kinetic energy within the fluid. Introducing the spectral transfer functions:
Π θ ( K ) = K [ θ ^ ( u s · θ ^ ) ] d K
Π u ( K ) = K [ u ^ s · ( u s · u s ^ ) ] d K
Π a ( K ) = K [ w z s ^ ψ ^ s ] d K ,
where   is an average over time and spectral shells between K and K + d K and using (28), which implies that the buoyancy variance is equal to the kinetic energy for each wavenumber, we obtain:
Π θ = Π u + Π a ,
in absence of source or dissipation. In the case of the direct cascade to small scales, there exists an inertial range over which Π θ is constant and positive. As shown by Capet et al. [50], in general, a transfer of potential to kinetic energy can be expected at all scales, so that Π a should be positive. This implies that Π u < 0 , which means that in the direct cascade of buoyancy variance, the nonlinear interactions promote an inverse cascade of surface kinetic energy. The different fluxes are shown in Figure 2b for a simulation in free-decay in a regime where the buoyancy variance flux Π θ shows the presence of an inertial range. The signs of Π a and Π u are in agreement with the argument explained above [50]. It is interesting to note that the inverse kinetic energy transfer was observed in the ocean using satellite observations [61], suggesting that the SQG turbulence could be a possible interpretation to it.

5. Surface Quasi-Geostrophy (SQG) from a Mathematical Point of View

The SQG system has attracted the mathematician community due to its formal proximity with the three-dimensional Euler equations. It thus appeared that if some results could be obtained about the existence of finite-time singularity from smoothed initial conditions in SQG, the methods employed might be a good start to tackle the 3D problem, as well [10,62].

5.1. Analogy with 3D Euler Equations

Constantin et al. [10] pointed out that SQG equations and the three-dimensional Euler equations share some common properties. Indeed, the time evolution of the horizontal buoyancy gradient in SQG is expressed as:
D θ D t = [ u s ] θ ,
with θ = ( θ / y ,   θ / x ) , D / D t the Lagrangian derivative and ∇ the horizontal gradient. Moreover, the velocity field can be expressed as:
u s ( x ) = 1 | y | θ ( x + y ) d y ,
using Equation (30). In this case, the velocity gradient tensor can be expressed as a function of buoyancy:
u s ^ ( k ) = i k | k | θ ^ ( k ) ,
in the horizontal Fourier space with k the two-dimensional horizontal wavenumber. The operator ⊗ is the matrix formed by the tensor product of two vectors [62].
On the other hand, for the 3D Euler equations, the time evolution equation for the vorticity vector ω is expressed as:
D ω D t = [ 3 v ] ω ,
with 3 the three-dimensional gradient. The 3D velocity v field takes the form:
v ( x ) = 3 1 | y | × ω ( x + y ) d y
and the velocity gradient tensor can be expressed as a function of the vorticity vector:
v ^ ( k ) = i ( k × ω ^ ( k ) ) k | k | 2 ,
in spectral three-dimensional space with k the three-dimensional wavenumber.
In both systems, the vectors representing the dynamics ( θ and ω ) are stretched by a velocity gradient that linearly depends on them. Hence, the time evolution induced by this nonlinearity may lead to a rapid increase of the 3D vorticity vector and the buoyancy gradient norms with the possible blow-up of the solutions [10,62].

5.2. Regularity of Surface Quasi-Geostrophy (SQG) Solutions

For two-dimensional Euler equations, no singularity can occur in finite time in the case of smooth initial conditions. Only the vorticity gradient can increase without bound as time goes to infinity (see, e.g., [63,64,65] for a demonstration and related review on earlier work). This result was then extended by Dutton [66], Bennett and Kloeden [67], Chae [68] for three-dimensional quasi-geostrophic flows, but restricted to the case with no surface buoyancy. The SQG case was not investigated until the work of Constantin et al. [10].
For the three-dimensional Euler equations, necessary conditions for finite-time singularity can be derived [69] and provide some help in understanding the regularity of SQG solutions. Consider an initial condition v 0 belonging to the Sobolev space H s ( R 3 ) whose distributional derivatives up to order s (with s 3 ) are in L , s 2 ( R 3 ) . A smooth solution of the 3D Euler equations v cannot be continued to t = T if and only if the vorticity vector satisfies:
0 T | ω ( t ) | L   d t =
where | f | L = M a x x R 3 | f ( x ) | . The regularity in the velocity field results in the finite growth of the vorticity vector. The analogy between the vorticity vector and the buoyancy gradient discussed in the previous section still goes on with a similar criterion for SQG [10]. In this case, the singularity can occur at t = T if and only if:
0 T | θ ( t ) | L   d t =
where | f | L = M a x x R 2 | f ( x ) | . The singularity is thus associated with an infinite buoyancy gradient in finite time. Constantin et al. [10] proposed an initial condition (a zonal shear oscillating in the x direction) that was a candidate to singularity development (see also [62]). However, studies using high-resolution numerical models [70] showed that this was not the case. Instead, the buoyancy gradient norm | θ | exhibits a growth rate in exp ( exp ( σ t ) ) . Such a double exponential can be understood when examining Equations (39) and (41) which indicate that the strain tensor that applies to the buoyancy gradient is proportional to this gradient in return. A mathematical result by Denisov [71] shows that such a double exponential law can also occur for the vorticity gradient in standard 2D Euler equations. The absence of the finite time singularity for the initial solution considered in Constantin et al. [10] was confirmed by Cordoba [72,73] and Constantin et al. [74], who derived necessary conditions based on the curvature of the saddle-point of the flow.
The question of the finite-time singularity raised by Constantin et al. [10] motivated different studies (e.g., [72,75,76], among others) who examined the regularity of solutions of the SQG system in the more general setting of forced-dissipative systems in a periodic domain:
θ t + u s · θ = f κ ( Δ ) γ / 2 θ ,
with f a stationary or time-varying forcing, Δ the 2D Laplacian operator and with a viscosity parameter κ > 0 . The exponent γ determines different kinds of dissipation, the most interesting one being γ = 1 , which is similar to an Ekman friction.
Constantin et al. [10] showed that, in absence of forcing and for κ = 0 , smooth solutions (starting from smooth initial conditions) exist over finite time, while Resnick [77] showed that weak solutions exist globally, but might not be unique. This was further studied by Constantin and Wu [78], who showed that, for 1 < γ 2 , smooth solutions exist for all time in the presence of a smooth and time-varying forcing. They also showed that weak solutions must coincide with strong solutions as long as these latter exist. For 0 < γ < 1 , the existence and uniqueness of weak solutions in the absence of forcing was obtained by Ju [76,79] and Wu [80], while Chae and Lee [81] and Cordoba and Cordoba [82] considered the case of smooth solutions. The case γ = 1 was first considered by Constantin et al. [83], who proved the global existence of solutions for small initial solutions. Later, Kiselev et al. [84], Caffarelli and Vasseur [85], Constantin et al. [86] extended this result, removing the condition of smallness and in the presence of a sufficiently smooth forcing.

6. Passive Tracers

The behavior of a tracer passively advected by the flow was examined by different authors. Consider a tracer C that obeys the conservation equation:
C t + u g · C = 0
where u g is the horizontal velocity field at some depth z that can be obtained through Equation (24).
At the surface z = 0 , the velocity field is related to a turbulent regime with a well-defined inertial range (either in the direct cascade of generalized enstrophy or the inverse cascade of generalized energy). Using the standard assumption of self-similar cascades, the spectrum of the tracer variance can be predicted to follow a law in k 2 in the inverse cascade and in k 5 / 3 in the direct cascade [17,87]. Smith et al. [17] confirmed in their numerical simulation the k 2 regime in the inverse cascade for the tracer variance. However, simulations in the direct cascade regime show that the tracer is shallower than k 5 / 3 [48,88]. A tentative explanation would rely on the steeper spectrum of kinetic energy (in k 2 ) compared to the theory (in k 5 / 3 ) so that both large-scale and small-scale components of the flow contribute to the stirring of the tracer. One can imagine that the large-scale component represents an important contribution to this stirring for a steeper spectral slope of kinetic energy, decoupling the stirring scale to the tracer scale. In that situation, the theory of Batchelor [89] would explain a spectrum in k 1 .
If, now, we consider an altitude z > 0 , from (24), we observe that the velocity field decays almost exponentially for sufficiently large wavenumbers. Introducing a transitional wavenumber k c 1 / 2 z , the kinetic energy spectrum decays as E ( k , z ) = E ( k , z = 0 ) exp ( k / k c ) with E ( k , z = 0 ) its surface value. Two limiting cases are obtained: for k k c , the kinetic energy spectrum will resemble E ( k , z = 0 ) , while for k k c , it decays exponentially with k. Using this argument, Scott [88] showed that, in the direct cascade, for k k c , the spectrum should follow a k 5 / 3 power law, while for k k c , the spectrum should be in k 1 . In this latter case, only the large-scale component of the strain field stirs the tracer following the argument of Batchelor [89]. Scott [88] observed a good agreement between these predictions and a numerical simulation of SQG turbulence in the direct cascade of surface buoyancy variance. This is also confirmed by the study of Wirth et al. [90], who examined the advection of a passive tracer at different altitudes z in the case of the merging of two surface vortices. They observed that the tracer in the interior of the fluid was stirred in numerous filaments as would occur for a scale separation between the stirring and the tracer fields [89].
A final remark concerns the passive tracer spectra at a particular altitude z in the inverse cascade. If we use the same argument as Scott [88], we obtain a tracer variance spectrum in k 2 for k k c and a dependence in k 1 for k k c . While the regime k k c corresponds to what would occur at the surface, the regime k k c still represents a scale separation between the stirring and the passive tracer fields. Such a result was not investigated to our knowledge.

7. Surface Quasi-Geostrophy (SQG) and the Ocean Dynamics

7.1. Horizontal Motions from Surface Quasi-Geostrophy (SQG) Equilibrium

The ocean surface is characterized by mesoscale structures (eddies and fronts of scales of 50–300 km, corresponding to the Rossby radius of deformation) and sub-mesoscale structures (fronts and filaments of 10 km in width and hundreds of kilometers in length). These filaments are associated with horizontal gradients of buoyancy, temperature, salinity and other tracers. Since the early 2000s, these sub-mesoscales were assumed to play a passive role in the ocean dynamics, as they were supposed as weakly energetic. More recently, numerical high-resolution simulations resolving these structures unveiled the importance of these small scales due to the high vertical velocities associated with them, their large values of relative vorticity and their strong contribution to the vertical heat flux [91,92]. This was further confirmed during the "Scalable Lateral Mixing and Coherent Turbulence” (LatMix) experiment that took place in the Sargasso Sea [93]. However, the standard QG theory of Charney [1] could not apply to understanding this dynamics due to different reasons: it does not take into account the surface buoyancy gradient; it considers a small Rossby number and fixed static stability. As remarked by Lapeyre and Klein [7], oceanic surface buoyancy plays an analogous role to the potential vorticity within the ocean (see Section 2.2). Because of this, the upper layers of the ocean (the first 500 m) have a very different dynamics than the interior layers. They are governed by the dynamics related to these small scales associated with strong buoyancy gradients, and the SQG model was revealed to be a good starting point to understand their properties. The potential of this model for the surface ocean dynamics has probably been first put forward by Lesieur and Sadourny [87], who proposed to explain the observed phytoplankton spectra by SQG theory. One can also mention the work of Johnson [94], who proposed SQG solutions for deep vortices trapped above topographic bumps. Furthermore, Held et al. [9], in their fairly detailed study of the SQG model, remarked at the end of their conclusion that this model could be useful for the ocean, but without specifying in what aspect. A clear link between SQG and the upper ocean dynamics was made by LaCasce and Mahadevan [6] and independently by Lapeyre and Klein [7].
Lapeyre and Klein [7] and Klein et al. [91] examined whether the relation between streamfunction and buoyancy Equation (24) was observed in a primitive equation simulation of an idealized baroclinically unstable front. More precisely, in dimensional units, the balance (24) is simply:
ψ ^ ( k , z ) = 1 N   | k | b ^ ( k , z = 0 )   exp | k | N z f 0 ,
with b buoyancy defined by Equation (2). Comparing relative vorticity ζ = v / x u / y with its prediction using ζ = 2 ψ and relation (49), they confirmed that the surface of the ocean was in an SQG balance. Other situations were examined, such as a realistic simulation of the North Atlantic [95] or the North Pacific [96]. In Isern-Fontanet et al. [95], it was shown that the buoyancy at the base of the oceanic mixed layer was a better proxy for b ( x , y , z = 0 ) . Moreover, using instead sea surface temperature showed good results in reconstructing relative vorticity from buoyancy. These different studies observed that the SQG relation (49) was satisfied down to typical depths of 500 m and horizontal scales between 300 and 50 km [95,97]. This situation occurs only if the contribution of the surface signal on the dynamics is dominant, which may not be the case in all regions of the ocean [98].
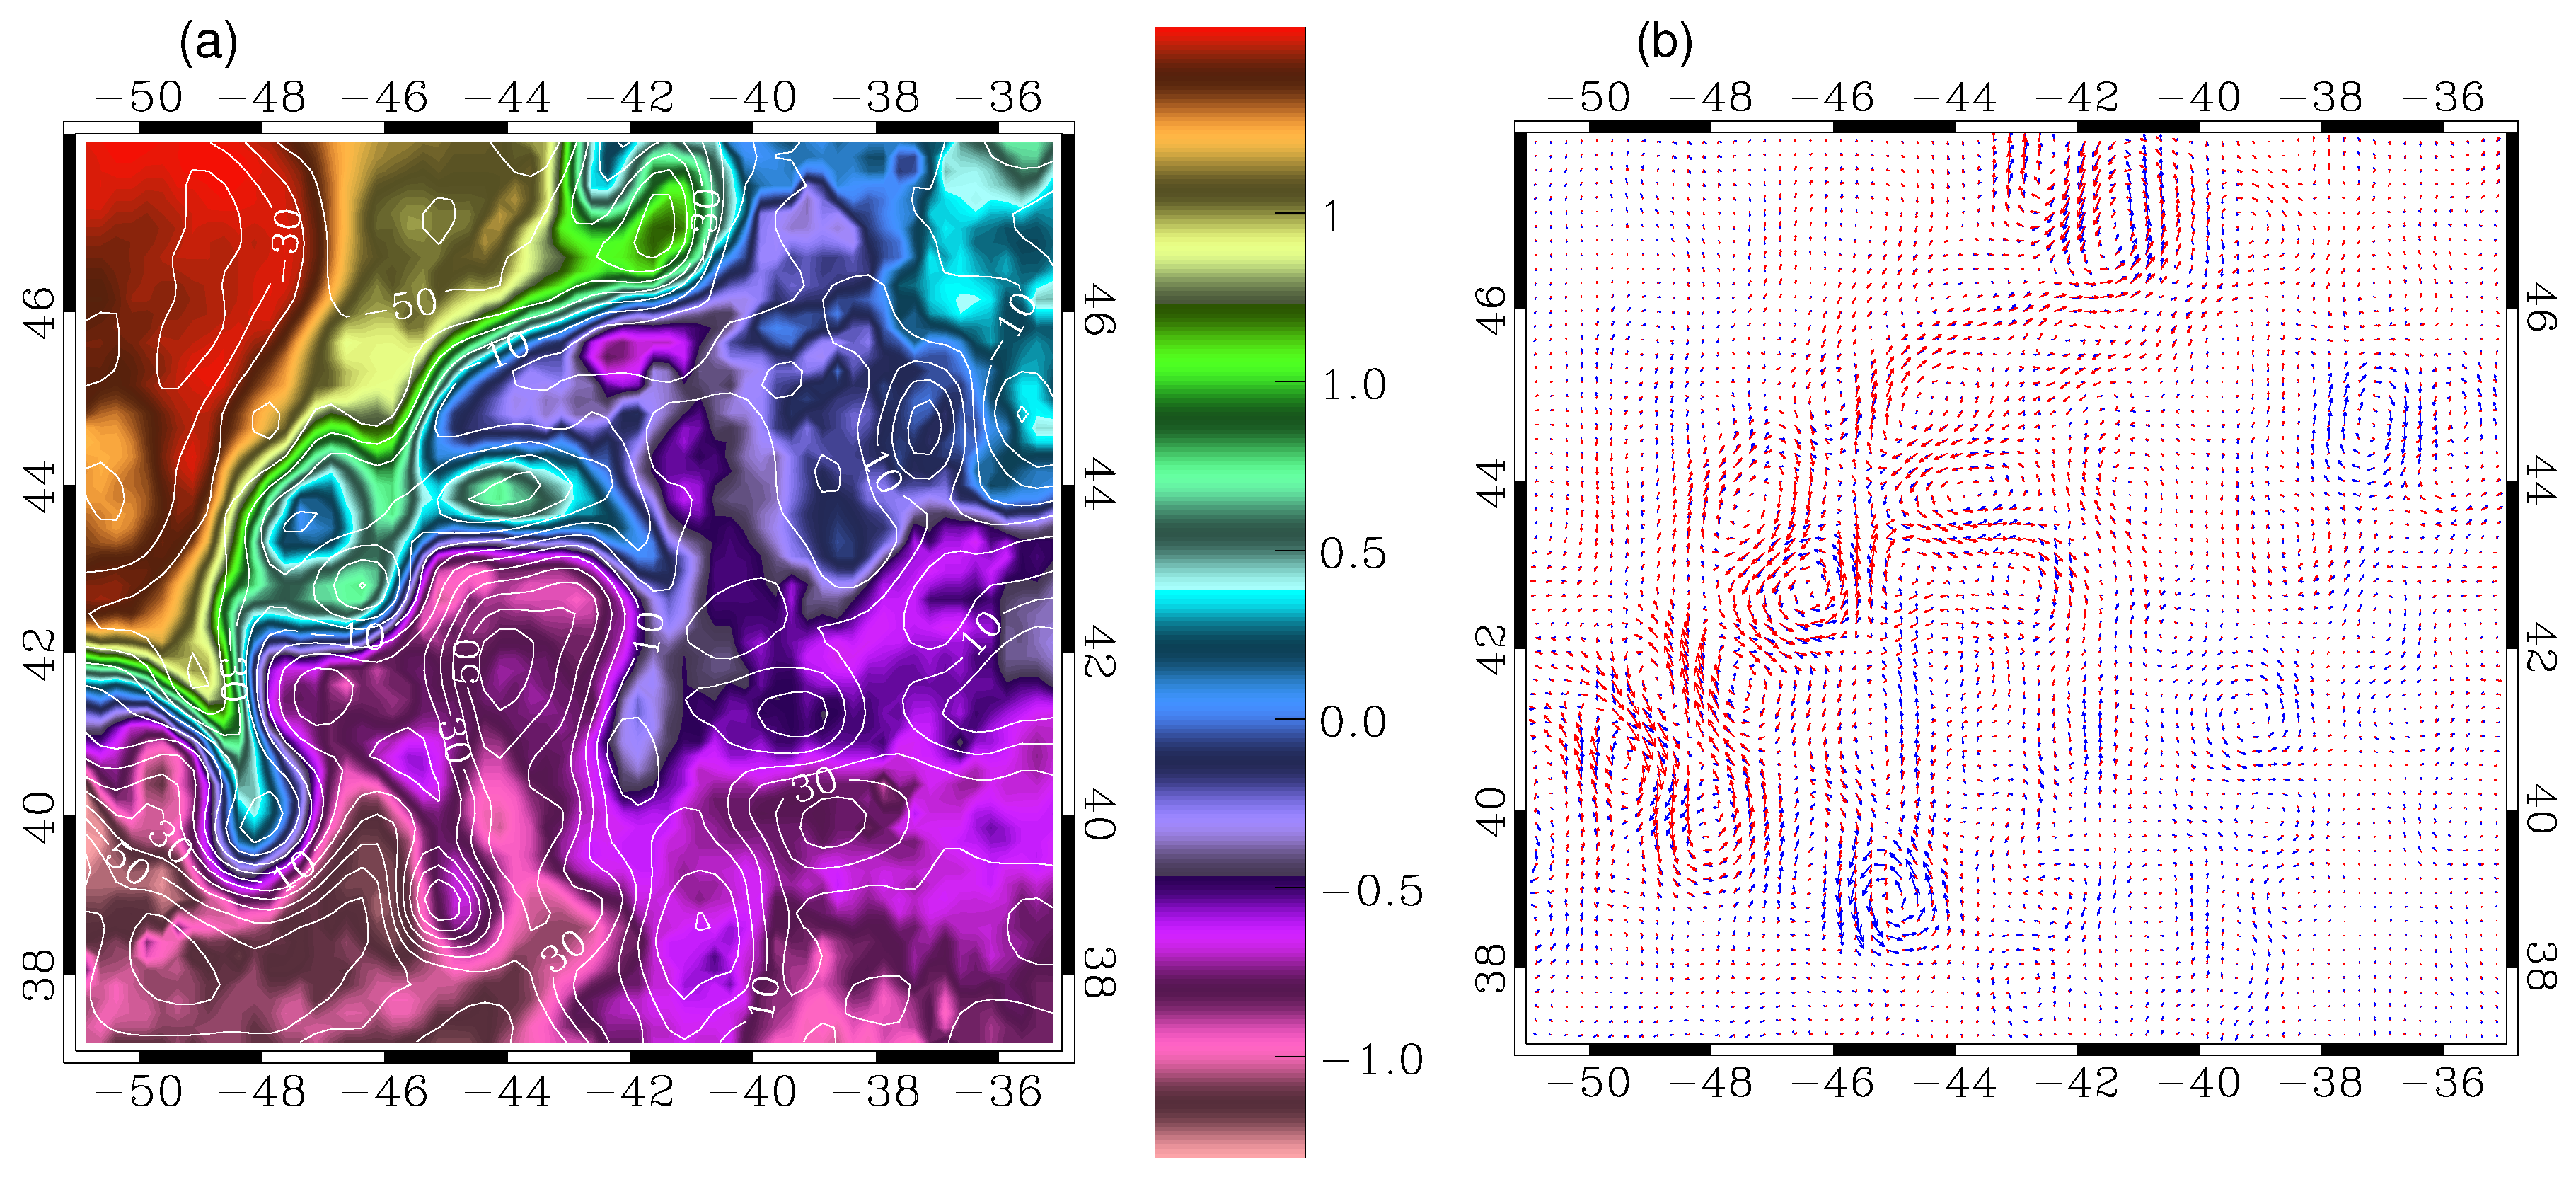
The use of the SQG equilibrium together with satellite datasets opens the possibility to access the sub-mesoscale features from sea surface temperature images or sea surface heights obtained by altimetry. Isern-Fontanet et al. [99] indeed confirmed that geostrophic velocities obtained through sea surface temperature using the SQG balance compare well with the geostrophic velocities from altimetry in the Gulf Stream region (see Figure 4). This was also confirmed on a more global scale by Gonzalez-Haro and Isern-Fontanet [100].

7.2. Relation between Surface and Interior Dynamics

Usually, the decomposition of oceanic motions involves barotropic and baroclinic modes [1,101]. These modes are orthogonal for the total (potential and kinetic) energy norm and are the solution of an eigenvalue problem involving the diagonalization of potential vorticity. However, Lapeyre [98] showed that this problem does not include the surface oceanic condition (surface buoyancy); hence, the decomposition in baroclinic modes is not complete, as a mode corresponding to uniform potential vorticity (satisfying the SQG equilibrium) is needed. As a result, the new basis is not orthogonal anymore, and the barotropic and the first baroclinic modes have a strong projection on the “SQG” mode. A consequence of this is that the sea surface height measured by altimetry is not the signal of the first baroclinic mode (as suggested by Wunsch [101], Stammer [102], among others), but an SQG mode trapped in the top 500 m of the ocean [98]. Another consequence is that the isotropization of energy as described by Charney [1] may not take place if surface buoyancy is non-uniform.
To circumvent the non-completeness of standard baroclinic modes, Smith and Vanneste [103] introduced a new “surface-aware” basis of eigenmodes taking into account the surface boundary condition. Their new modes are now dependent on the wavenumber, contrary to the standard baroclinic modes, which only depend on the stratification and the Coriolis parameter. A drawback of the new basis introduced by Smith and Vanneste [103] is that it necessitates the choice of a nondimensional parameter that seems to depend on the particular situation under study.
Roullet et al. [104] confirmed the paradigm of Lapeyre and Klein [7] as they put in evidence the separation between a surface dynamics controlled by surface buoyancy anomalies and an interior dynamics controlled by interior P V . A question then arises about a possible correlation between the contributions of the surface buoyancy and the interior potential vorticity to the dynamics. Lapeyre and Klein [7] and Klein et al. [97] showed that due to the meridional distribution of the density field, the large-scale potential vorticity gradients are often similar to the large-scale surface buoyancy gradients. As a result, it is possible to show that P V anomalies at mesoscales are proportional to surface buoyancy anomalies [7,105]. The contribution due to the interior potential vorticity to the dynamics is then highly correlated with the surface contribution, which may explain why the SQG equilibrium seems to be robust in the ocean.
New models including the interactions of a few baroclinic modes (representing P V anomalies) and the SQG modes were developed to better understand how interior and surface dynamics interact [106,107]. These ideas served in developing techniques to reconstruct the three-dimensional velocity field from the sea surface temperature and sea surface height [105,108,109]. One can also mention that SQG models served to develop idealized models for the oceanic mixed layer dynamics [110,111]. These last studies used a system of uniform potential vorticity within two layers of different depth. For a top layer with small depth, one recovers some basic properties of the mixed layer instabilities observed in more realistic flows by Boccaletti et al. [112].

7.3. Vertical Motions from Surface Quasi-Geostrophy (SQG) Equilibrium

From the general quasi-geostrophic equations, it is possible to compute vertical velocities by solving the so-called omega-equation:
2 w + f 0 2 N 2 2 w z 2 = 2 N 2 · u T b ,
where u is the horizontal velocity gradient tensor and [   ] T the matrix transpose operator [113]. To obtain w from this equation, an elliptic problem needs to be solved with w = 0 at the surface. For the SQG model, a simpler form exists in spectral space:
w ^ = 1 N 2 b ^ t + u · b ^ = 1 N 2 b ^ s t exp | k | N z f 0 + u · b ^ = 1 N 2 ( u s · b s ^ ) exp | k | N z f 0 + u · b ^ = 1 N 2 ( u s · b s ^ ) exp | k | N z f 0 u · b ^ ,
where the subscript s is for surface quantities. This last relation in addition to Equations (6) and (49) shows that vertical velocities are completely determined by surface quantities. Such an equation was used to diagnose vertical velocities from surface buoyancy in different numerical simulations with some success [7,96,114]. Ponte et al. [115] improved this estimation when taking into account wind-driven Ekman motions and a diabatic contribution due to surface mixing as parametrized by Garrett and Loder [116].

7.4. Frontogenesis

An important and relatively little considered feature of SQG (except [117] and the semi-geostrophic studies that considered cases of uniform P V ) is its direct link with frontogenesis, i.e., the production process of horizontal gradients of surface buoyancy by stretching, rotation and deformation [118,119]. As was shown by Sawyer [120], Eliassen [121] and Hoskins and Bretherton [122], this frontogenesis has significant impact on the three-dimensional dynamics, in particular vertical velocities as illustrated by Equation (50). The equation of horizontal buoyancy gradient at some depth z is:
D b D t = Q N 2 w
with:
Q = [ u ] T b .
The vector Q was introduced by Hoskins and Bretherton [122] and quantifies the effect of deformation and stretching of the buoyancy contours, which enhances buoyancy gradients [118,123]. The growth of buoyancy gradients by straining processes is then compensated by the setting up of an ageostrophic circulation and related vertical velocities through Equation (50). This mechanism does not only apply to SQG flows, but also to any class of quasi-geostrophic ones (even with no surface buoyancy anomalies). However, it is relatively efficient in the SQG case, since at the surface, there is no vertical velocity to oppose the formation of buoyancy gradients, so that there is a permanent frontogenesis that is able to occur. An important point is that there will be large values of vertical velocities within the smallest scales that are affected by this process since they concentrate the buoyancy gradients.
A final remark is that the frontogenesis process can be related to the transfer of potential energy to kinetic energy as discussed in Section 4.4. Using the omega equation and after some manipulation, one can obtain a relation between the spectral flux Π a and frontogenesis:
Π a = K R e 2 K 0 Q ^ · b ^ d z   d K ,
in non-dimensional form and using the integration in the Fourier space [50]. This equation shows that Π a is directly connected to the production of buoyancy gradients. Due to the cascade of surface buoyancy to small scales, this term will be positive and explains the transfer of potential energy to kinetic energy at these scales.

7.5. Impact on Tracers

As discussed in Section 6, tracer properties differ when comparing standard barotropic and SQG dynamics. At first approximation, phytoplankton can be considered as a passive tracer being stirred by the eddy field once it has sufficiently grown. Phytoplankton spectra at the ocean surface can be measured using satellite images of ocean color. In particular, Gower et al. [124] observed a typical spectrum in k 2 for this tracer and proposed to relate it to the theory of Charney [1]. However, such a theory would argue towards a much flatter spectrum in k 1 , and Lesieur and Sadourny [87] proposed an alternative interpretation based on the SQG model. Indeed, the spectrum of a tracer horizontally advected by an SQG flow would be in k 5 / 3 in the direct cascade of buoyancy variance [17]. Horizontal transport is not the sole process to explain phytoplankton variability. Phytoplankton concentrates in the surface oceanic layers, but needs the nutrient uptake from deeper layers to grow. The coupling between horizontal transport (responsible for stirring and for the formation of small horizontal scales) and vertical transport (responsible for the injection of nutrients at the surface) is thus critical in this process. To understand this coupling, one can examine the time evolution and spatial organization of a tracer C at the ocean surface following this equation:
C t + u · C + w C H = 0 ,
where we consider the tracer constant equal to one below the depth z = H . There are two concomitant effects: the effect of vertical transport (related to w) that injects the tracer in the surface layers and the effect of horizontal transport that horizontally redistributes the tracer concentration. Since the horizontal deformation leads to small-scale formation and is responsible for vertical velocities through Equation (50), vertical velocities will occur in filamentary regions between large-scale vortices. Once the tracer is advected from the deeper layers inside these filaments, it will be rapidly spread horizontally over a large distance. Simulations to study this process were examined by Lapeyre and Klein [125], who highlighted the role of eddy-eddy interactions in making this process more efficient. They also showed that half of the tracer can be trapped in these sub-mesoscale filaments. In order to see the role of vertical injection for the phytoplankton dynamics, a biological model was coupled with an SQG model [126]. More specifically, the competition between two species of phytoplankton was examined, and Perruche et al. [126] showed that different species of phytoplankton can dominate in different oceanic regions, i.e., either inside vortices or inside filaments, which create ecological niches for plankton growth. These studies are a first step to understand how sub-mesoscales can affect biological dynamics, but their potential role at a more global scale still needs to be quantified.

8. Surface Quasi-Geostrophy (SQG) and the Atmosphere Dynamics

Oceanic dynamics is quite different from atmosphere processes, in the sense that the ocean is generally thought to be driven both by interior P V dynamics for its interior part and surface buoyancy dynamics for its surface part. On the contrary, the atmosphere is in general interpreted through the interaction of potential anomalies at the tropopause and at the surface [4]. Juckes [127] considered the case of a fluid composed of a troposphere and a stratosphere with uniform potential vorticities. Using the SQG approximation, he showed that for an anomaly of potential temperature at the tropopause θ t p , there is a net vertical displacement of the tropopause δ z , such that:
δ z = g   θ t p θ 0 N t N s ,
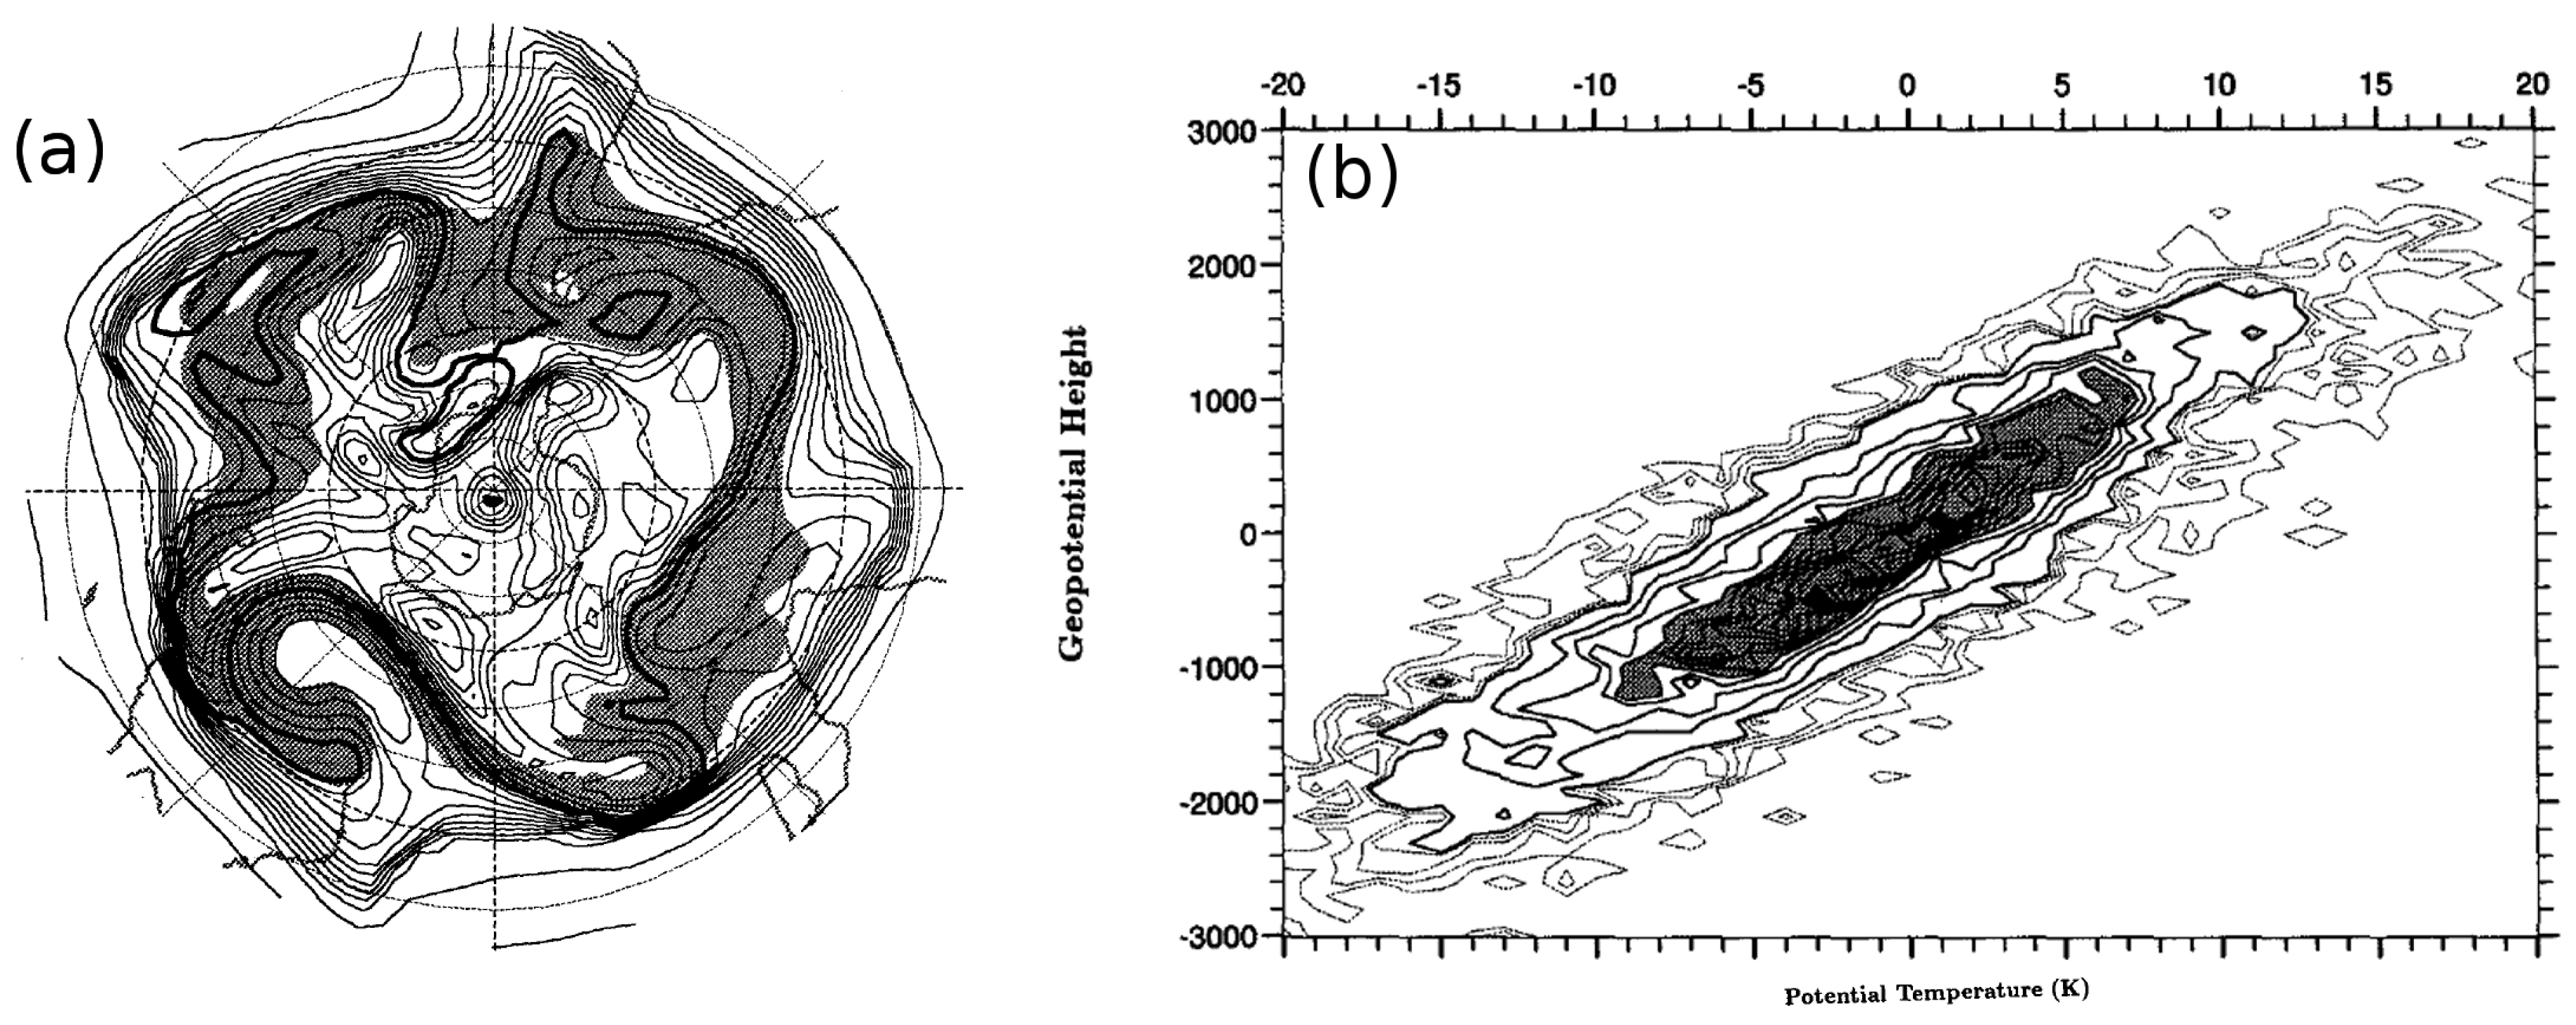
where N t and N s are respectively the tropospheric and stratospheric Brunt–Väisälä frequencies and θ 0 a reference potential temperature. As illustrated in Figure 5, this relation is revealed to be well satisfied in atmospheric general circulation models [127]. In addition, Juckes [127] showed that the streamfunction ψ at the tropopause can be related to θ t p in the Fourier space, such that:
ψ ^ = g ( N s N t ) | k |   θ 0   N s N t θ ^ t p .
More general solutions for a continuous profile of N across the tropopause were discussed by Smith and Bernard [128] and Plougonven and Vanneste [129]. Equation (57) shows that the tropopause acts as a material surface because of the discontinuity in stratification, and therefore, the tropopause temperature serves as an active tracer. Moreover, it has much similarity with the oceanic case for which:
ψ ^ = g | k |   ρ 0   N ρ ^ ,
with ρ the density anomaly. Indeed, the two results are the same if N t tends to infinity. Rivest et al. [130] obtained similar equations when examining the linear solutions of an instability of a shear flow. The applicability of such solutions was investigated by Tomikawa et al. [131], who confirmed its relevance for explaining the structure of tropopause perturbations close to the sub-polar jet in the Southern Hemisphere.
Different applications of SQG for the understanding of the atmospheric dynamics have been done. With a similar approach to Lapeyre and Klein [125], Wirth et al. [132] proposed an interpretation for the roll-up of stratospheric intrusion that is observed on satellite images of water vapor. The destabilization of a potential temperature strip gives rise to the formation of horizontal vortices and, at the same time, to vertical advection of water vapor, which is in agreement with observed water vapor images.
Another problem where SQG dynamics has been invoked concerns the horizontal kinetic energy and potential temperature variance spectra near the tropopause that were observed by Nastrom and Gage [133]. This study shows a transition from k 3 for large scales to k 5 / 3 for scales below 500 km. However, the classical quasi-geostrophic theory would indicate a spectrum in k 5 / 3 at scales larger than the deformation radius (3000 km in the atmosphere) and k 3 for smaller ones. Different theories [134,135] have been proposed to explain the discrepancy with the Charney [1] theory. In this context, Tulloch and Smith [136] offered an interpretation based on a depth-limited version of SQG. Instead of choosing a condition of the semi-infinite domain in z, one can use a domain with a fixed depth H with no buoyancy anomaly at the surface z = 0 and an SQG dynamics at the tropopause z = H . In this case, relation (24) becomes:
ψ ^ ( k , z ) = 1 N θ ^ ( k ) K cosh ( K   N   z / f 0 ) sinh ( K   N   H / f 0 )
in dimensional units and with K the wavenumber modulus. For small values of K, potential temperature is proportional to relative vorticity ( θ ^ K 2 ψ ^ ( k , H ) ), while for large values of K, we recover the standard SQG model ( θ ^ K ψ ^ ( k , H ) ). Tulloch and Smith [136] confirmed that this model could explain the Nastrom and Gage spectrum, and they later proposed a more elaborate version including the role of potential vorticity anomalies [107]. However, Asselin et al. [137] showed that it is not possible to rely only on SQG dynamics, as this model leads to further static instabilities near the tropopause if the horizontal speed at the tropopause is large enough. This prevents the application of the SQG theory to scales below 100 km.
The more general question of the vertical structure of the troposphere can be examined through an approach of coupling surface-induced and interior-induced dynamics. Morss et al. [138] studied the tropospheric dynamics forced by a baroclinic jet in a quasi-geostrophic model resolving both surface and interior dynamics. They observed the instability of filaments at the tropopause similar to the one for SQG flows [9]. They noted a transition between an interior and a surface dynamical regime, which suggests that both interior potential vorticity and tropopause potential temperature control the flow characteristics. Greenslade and Haynes [139] used a similar model to study the transport barrier across a baroclinic jet. Within the tropopause, the jet serves as a barrier to transport, while near the surface, the jet is responsible for strong horizontal mixing, which confirms a vertical transition between the two dynamics. For this situation, the surface buoyancy is the active tracer. This separation between two regimes depending on the flow depth is similar to the oceanic case discussed by Roullet et al. [104].

9. Conclusions

This review concerned surface quasi-geostrophic flows, a special class of quasi-geostrophic flows, which is based on the conservation of surface buoyancy with uniform potential vorticity within the fluid. The SQG dynamics allows a better understanding of the dynamics of the upper 500 m of the ocean between 10 and 300 km. For the atmosphere, several studies showed that surface quasi-geostrophy could provide some understanding of the tropopause dynamics, but work is still needed to further address its usefulness. Surface buoyancy serves as an active tracer, as is the case for relative vorticity for two-dimensional flows. However, it is associated with a more local dynamics, in the sense that the velocity field associated with a buoyancy anomaly decreases more rapidly as a function of distance compared to a vorticity anomaly for the 2D classical case. This allows small scales to be more energetic as they weakly perceive the effects of other dynamical structures. Concerning SQG turbulence, there exists a direct cascade of surface buoyancy variance toward small scales and an inverse cascade of total energy to large scales. In contrast, for barotropic flows, there is a direct cascade of enstrophy to small scales and an inverse cascade of kinetic energy to large scales. However, while in 2D flows, nonlocal interactions between scales are important in the direct cascade of enstrophy, the contribution of these nonlocal interactions in the direct cascade of buoyancy variance in SQG is not yet clear. An important aspect of SQG flows is that the large-scale component of the flow is relatively inefficient to inhibit filament instability. This may lead to the cascade of instabilities with explosive thinning and roll-up of filaments at smaller and smaller scales. The regularity of SQG solutions in that they do not develop infinite buoyancy gradients in finite time is still a subject of study, in particular because SQG buoyancy gradients bear some formal analogies with the vorticity vector in 3D flows. Still, some results were obtained about the regularity in several cases of dissipation or about the existence of weak solutions. Finally, the SQG equations were used in different (more exotic) contexts, such as the kinetic dynamo [54] or oceanic wind-driven gyres [140].
Several extensions to the SQG model exist. First, one can think of models with finite depth and uniform PV. In this case, two buoyancy equations (at the top and bottom of the fluid) drive the dynamics and the interactions are through the advection of the top (respectively bottom) buoyancy by the velocity induced by the bottom (respectively top) buoyancy, as given by relation (59). This is the essence of the Eady [4] model of baroclinic instability. Such a model was used by Tulloch and Smith [136] to interpret the energy spectra observed at the tropopause. Similar models (but using two layers with homogeneous P V in each one) were developed for understanding of oceanic mixed layer instabilities [110,111]. A more general class of QG models consists of coupling the surface buoyancy with interior potential vorticity dynamics [141]. The linear instability of a vertical shear flow in the presence of a large-scale potential vorticity gradient (such as the β effect) was addressed by different authors [141,142,143]. These studies pointed out that one can understand the instability of such a flow as the interaction of two Rossby waves, one at the surface and one at some critical level. A relevant parameter to determine the typical height of the critical level is the Charney scale:
h = f 0 2 z U N 2 y P V ,
where z U is the large-scale mean vertical shear and y P V is the large-scale mean meridional P V gradient [144]. The corresponding horizontal scale is λ = N h / f 0 . For z h , the dynamics will be surface buoyancy-driven, while for z h , it will be P V -driven. This is consistent with the results of Tulloch and Smith [107], who considered a coupled turbulent model and were able to find this transition in the energy spectra (see also [104,138,139]). Another consequence in the coupling of the surface and the interior dynamics is the barotropization of the flow [145]. However, energy transfers between SQG, barotropic and baroclinic modes and between scales are far from obvious. In particular, one could ask about the possibility of energy isotropization between horizontal and vertical wavenumbers as in the case of Charney [1]. Concerning coherent structures, Perrot et al. [146] and Reinaud et al. [147] examined the interactions between surface and interior vortices and filaments using contour dynamics, while Lim and Majda [22] examined the dynamics of point vortices. This latter study proved that clusters of point vortices coupling surface vortices and vortices as a particular depth can exist, such that the cluster cloud propagates as a long-lived and non-dispersive structure. This behavior also occurs for vortex clusters at two different depths [22]. In conclusion, these different studies point out that coupling the surface and the interior leads to potentially new phenomena that were not predicted from the classical theory of Charney [1].
As was shown by Williams [148], frontogenesis in a primitive equation gives rise to a rapid contraction of a baroclinic unstable front and to the formation of a discontinuity. This is not the case for the quasi-geostrophic frontogenesis, for which the discontinuity may appear in infinite time, as shown by Williams and Plotkin [119] and as was discussed in this review. Hoskins and Bretherton [122] indicate that, for a baroclinic unstable flow, the formation of the discontinuity occurs after a time τ = N / ( ζ   z U ) with ζ relative vorticity and z U vertical shear. Taking typical values for the ocean and the atmosphere leads to τ 50 days in the ocean and τ 12 h in the atmosphere. Therefore, the oceanic fronts are in general much weaker than their atmospheric counterparts, and the surface quasi-geostrophic approximation remains a good approximation for the ocean. To include the ageostrophic mechanisms related to atmospheric frontogenesis, the SQG model was extended for flows with finite Rossby numbers: these correspond to semi-geostrophic flows [149], which also assume uniform P V , but which also include ageostrophic effects in the advection of surface buoyancy. In this case, there is a possible formation of singularity in finite time [122]. Badin [150] examined the properties of the semi-geostrophy solution in an oceanic context, while Ragone and Badin [151] studied the turbulence in this system and the development of vortex asymmetries. Hakim et al. [117] also examined the same problem using an ageostrophic model different from semigeostrophy (the SQG + 1 model). These different studies put in evidence the asymmetry towards more intense cyclones and a restratification of the flow near the surface (an effect obtained in primitive equations models by [152]). Comparisons between SQG and primitive equation solutions were examined in different contexts. Juckes [153] compared both models for the evolution of a shear line with uniform buoyancy at the tropopause. He found that the SQG solution gives a good approximation for small displacements of the tropopause and within the limit of small Rossby numbers. Bembenek et al. [154] examined the time-evolution of an elliptical surface-intensified vortex in primitive equations compared to its SQG counterpart. They showed that both models agree for a small Rossby number, and ageostrophy leads to the inhibition of filament instabilities and the radiation of gravity waves, as well as gravitational and inertial instabilities. The time evolution of a vortex dipole in initial SQG equilibrium was considered by Snyder et al. [155], who showed the generation of inertia-gravity waves with an expansion of the anticyclone and a contraction of the cyclone. To conclude on finite Rossby numbers, even if SQG is appealing for understanding the basic aspects of frontogenesis, it lacks the formation of true discontinuity in the buoyancy field and other ageostrophic mechanisms that affect cyclone-anticyclone asymmetries, non-geostrophic instabilities or inertial gravity wave emission.
As a final comment, surface quasi-geostrophy has been the subject of numerous works in the last twenty years because of the simplicity of its equations bearing analogies with both 2D and 3D Euler equations. More importantly, it attracted the community of geophysical fluid dynamics, as it was found that surface buoyancy gradients are an important ingredient to understand both the upper oceanic layers and the tropopause dynamics. New directions go towards the interaction of interior potential vorticity and surface buoyancy dynamics and towards a better understanding of oceanic surface dynamics using more elaborate models or new observations.

Acknowledgments

This work is a contribution to the Surface Water Ocean Topography (SWOT) project and was supported by Centre National d’Etudes Spatiales (CNES) through the TOSCA program.

Conflicts of Interest

The author declares no conflict of interest.

References

  1. Charney, J.G. Geostrophic turbulence. J. Atmos. Sci. 1971, 28, 1087–1095. [Google Scholar] [CrossRef]
  2. Pedlosky, J. Geophysical Fluid Dynamics; Springer: Berlin, Germany, 1987. [Google Scholar]
  3. Vallis, G.K. Atmospheric and Oceanic Fluid Dynamics; Cambridge University Press: Cambridge, UK, 2006. [Google Scholar]
  4. Eady, E.T. Long waves and cyclone waves. Tellus 1949, 1, 33–52. [Google Scholar] [CrossRef]
  5. Hakim, G.J. Developing wave packets in the north Pacific storm track. Mon. Weather Rev. 2003, 131, 2837. [Google Scholar] [CrossRef]
  6. LaCasce, J.H.; Mahadevan, A. Estimating sub-surface horizontal and vertical velocities from sea surface temperature. J. Mar. Res. 2006, 64, 695–721. [Google Scholar] [CrossRef]
  7. Lapeyre, G.; Klein, P. Dynamics of the upper oceanic layers in terms of surface quasigeostrophy theory. J. Phys. Oceanogr. 2006, 36, 165–176. [Google Scholar] [CrossRef]
  8. Blumen, W. Uniform potential vorticity flow: Part I. Theory of wave interactions and two-dimensional turbulence. J. Atmos. Sci. 1978, 35, 774–783. [Google Scholar] [CrossRef]
  9. Held, I.M.; Pierrehumbert, R.T.; Garner, S.T.; Swanson, K.L. Surface quasi-geostrophic dynamics. J. Fluid Mech. 1995, 282, 1–20. [Google Scholar] [CrossRef]
  10. Constantin, P.; Majda, A.J.; Tabak, E. Formation of strong fronts in the 2-D quasigeostrophic thermal active scalar. Nonlinearity 1994, 7, 1495–1533. [Google Scholar] [CrossRef]
  11. Hoskins, B.J.; McIntyre, M.E.; Robertson, A.W. On the use and significance of isentropic potential vorticity maps. Q. J. R. Meteorol. Soc. 1985, 111, 877–946. [Google Scholar] [CrossRef]
  12. Bretherton, F.P. Critical layer instability in baroclinic flows. Q. J. R. Meteorol. Soc. 1966, 92, 325–334. [Google Scholar] [CrossRef]
  13. Schneider, T.; Held, I.M.; Garner, S.T. Boundary effects in potential vorticity dynamics. J. Atmos. Sci. 2003, 60, 1024–1040. [Google Scholar] [CrossRef]
  14. Charney, J.G.; Stern, M.E. On the stability of internal baroclinic jets in a rotating atmosphere. J. Atmos. Sci. 1962, 19, 159–172. [Google Scholar] [CrossRef]
  15. Hua, B.L.; Haidvogel, D.B. Numerical simulations of the vertical structure of quasi-geostrophic turbulence. J. Atmos. Sci. 1986, 43, 2923–2936. [Google Scholar] [CrossRef]
  16. Smith, K.S.; Vallis, G.K. The scales and equilibration of midocean eddies: Freely evolving flow. J. Phys. Oceanogr. 2001, 31, 554–571. [Google Scholar] [CrossRef]
  17. Smith, K.S.; Boccaletti, G.; Henning, C.C.; Marinov, I.N.; Tam, C.Y.; Held, I.M.; Vallis, G.K. Turbulent diffusion in the geostrophic inverse cascade. J. Fluid Mech. 2002, 469, 14–47. [Google Scholar] [CrossRef]
  18. Juckes, M. Instability of surface and upper-tropospheric shear lines. J. Atmos. Sci. 1995, 52, 3247–3262. [Google Scholar] [CrossRef]
  19. Dritschel, D.G. An exact steadily-rotating surface quasi-geostrophic elliptical vortex. Geophys. Astrophys. Fluid Dyn. 2011, 105, 368–376. [Google Scholar] [CrossRef]
  20. Castro, A.; Cordoba, D.; Gomez-Serrano, J.; Zamora, A.M. Remarks on geometric properties of SQG sharp fronts and alpha-patches. Discret. Contin. Dyn Syst. 2014, 34, 5045–5059. [Google Scholar] [CrossRef]
  21. Castro, A.; Córdoba, D.; Gómez-Serrano, J. Existence and regularity of rotating global solutions for the generalized surface quasi-geostrophic equations. Duke Math. J. 2016, 165, 935–984. [Google Scholar] [CrossRef]
  22. Lim, C.C.; Majda, A.J. Point vortex dynamics for coupled surface/interior QG and propagating heton clusters in models for ocean convection. Geophys. Astrophys. Fluid Dyn. 2001, 94, 177–220. [Google Scholar] [CrossRef]
  23. Muraki, D.J.; Snyder, C. Vortex dipoles for surface quasigeostrophic models. J. Atmos. Sci. 2004, 61, 2961–2967. [Google Scholar] [CrossRef]
  24. Carton, X.; Ciani, D.; Verron, J.; Reinaud, J.; Sokolovskyi, M. Vortex merger in surface quasi-geostrophy. Geophys. Astrophys. Fluid Dyn. 2015, 110, 1–22. [Google Scholar] [CrossRef]
  25. Zabusky, N.J.; Hugues, M.H.; Roberts, K.V. Contour dynamics for the Euler equations in two dimensions. J. Comput. Phys. 1979, 30, 96–106. [Google Scholar] [CrossRef]
  26. Cordoba, D.; Fefferman, C.; Rodrigo, J.L. Almost sharp fronts for the surface quasi-geostrophic equation. Proc. Natl. Acad. Sci. USA 2004, 101, 2687–2691. [Google Scholar] [CrossRef] [PubMed]
  27. Fefferman, C.L.; Rodrigo, J.L. Construction of almost-sharp fronts for the surface quasi-geostrophic equation. Arch. Rational Mech. Anal. 2015, 218, 123–162. [Google Scholar] [CrossRef]
  28. Rodrigo, J.L. The vortex patch problem for the surface quasi-geostrophic equation. Proc. Natl. Acad. Sci. USA 2004, 101, 2684–2686. [Google Scholar] [CrossRef] [PubMed]
  29. Gancedo, F. Existence for the α-patch model and the QG sharp front in Sobolev spaces. Adv. Math. 2008, 217, 2579–2598. [Google Scholar] [CrossRef]
  30. Cordoba, D.; Fontelos, M.A.; Mancho, A.M.; Rodrigo, J.L. Evidence of singularities for a family of contour dynamics equations. Proc. Natl. Acad. Sci. USA 2005, 102, 5249–5252. [Google Scholar] [CrossRef] [PubMed]
  31. Scott, R.K.; Dritschel, D.G. Numerical simulation of a self-similar cascade of filament instabilities in the Surface quasigeostrophic System. Phys. Rev. Lett. 2014, 112, 144505. [Google Scholar] [CrossRef] [PubMed]
  32. Gancedo, F.; Strain, R.M. Absence of splash singularities for surface quasi-geostrophic sharp fronts and the Muskat problem. Proc. Natl. Acad. Sci. USA 2014, 111, 635–639. [Google Scholar] [CrossRef]
  33. Dritschel, D.G.; Haynes, P.H.; Juckes, M.N.; Shepherd, T.G. The stability of a two-dimensional vorticity filament under uniform strain. J. Fluid Mech. 1991, 230, 647–665. [Google Scholar] [CrossRef]
  34. Harvey, B.J.; Ambaum, M.H.P. Instability of surface temperature filaments in strain and shear. Q. J. R. Meteorol. Soc. 2010, 136, 1506–1513. [Google Scholar] [CrossRef]
  35. Scott, R.K. A scenario for finite-time singularity in the quasigeostrophic model. J. Fluid Mech. 2011, 687, 492–502. [Google Scholar] [CrossRef]
  36. Carton, X. Instability of surface quasi-geostrophic vortices. J. Atmos. Sci. 2009, 66, 1051–1062. [Google Scholar] [CrossRef]
  37. Harvey, B.J.; Ambaum, M.H.P. Perturbed Rankine vortices in surface quasi-geostrophic dynamics. Geophys. Astrophys. Fluid Dyn. 2010, 105, 377–391. [Google Scholar] [CrossRef]
  38. Harvey, B.J.; Ambaum, M.H.P.; Carton, X. Instability of shielded surface temperature vortices. J. Atmos. Sci. 2011, 68, 964–971. [Google Scholar] [CrossRef]
  39. Friedlander, S.; Shvydkoy, R. The unstable spectrum of the surface quasi-geostrophic equation. J. Math. Fluid Mech. 2005, 7, S81–S93. [Google Scholar] [CrossRef]
  40. Friedlander, S.; Pavlovic, N.; Vicol, V. Nonlinear instability for the critically dissipative quasi-geostrophic equation. Commun. Math. Phys. 2009, 292, 797–810. [Google Scholar] [CrossRef]
  41. Rotunno, R.; Snyder, C. A generalization of Lorenz’s model for the predictability of flows with many scales of motion. J. Atmos. Sci. 2008, 65, 1063–1076. [Google Scholar] [CrossRef]
  42. Tran, C.V.; Blackbourn, L.A.K.; Scott, R.K. Number of degrees of freedom and energy spectrum of surface quasi-geostrophic turbulence. J. Fluid Mech. 2011, 684, 427–440. [Google Scholar] [CrossRef]
  43. Kraichnan, R.H. Inertial ranges in two-dimensional turbulence. Phys. Fluids 1967, 10, 1417–1423. [Google Scholar] [CrossRef]
  44. Hoyer, J.M.; Sadourny, R. Closure modeling of fully developed baroclinic turbulence. J. Atmos. Sci. 1982, 39, 707–721. [Google Scholar] [CrossRef]
  45. Tran, C.V.; Bowman, J.C. Large-scale energy spectra in surface quasi-geostrophic turbulence. J. Fluid Mech. 2005, 526, 349–359. [Google Scholar] [CrossRef]
  46. Tran, C.V. Diminishing inverse transfer and non-cascading dynamics in surface quasi-geostrophic turbulence. Physica D 2006, 213, 76–84. [Google Scholar] [CrossRef]
  47. Pierrehumbert, R.T.; Held, I.M.; Swanson, K.L. Spectra of local and nonlocal two-dimensional turbulence. Chaos Solitons Fractals 1994, 4, 1111–1116. [Google Scholar] [CrossRef]
  48. Celani, A.; Cencini, M.; Mazzino, A.; Vergassola, M. Active and passive fields face to face. New J. Phys. 2004, 6, 72. [Google Scholar] [CrossRef]
  49. Sukhatme, J.; Pierrehumbert, R.T. Surface Quasi-Geostrophic turbulence: The study of an active scalar. Chaos 2002, 12, 439–450. [Google Scholar] [CrossRef] [PubMed]
  50. Capet, X.; Klein, P.; Hua, B.L.; Lapeyre, G.; McWilliams, J.C. Surface kinetic and potential energy transfer in SQG dynamics. J. Fluid Mech. 2008, 604, 165–174. [Google Scholar] [CrossRef]
  51. Watanabe, T.; Iwayama, T. Unified scaling theory for local and non-local transfers in generalized two-dimensional turbulence. J. Phys. Soc. Jpn. 2004, 73, 3319–3330. [Google Scholar] [CrossRef]
  52. Constantin, P. Energy spectrum of quasigeostrophic turbulence. Phys. Rev. Lett. 2002, 89, 184501. [Google Scholar] [CrossRef] [PubMed]
  53. Burgess, B.H.; Scott, R.K.; Shepherd, T.G. Kraichnan-Leith-Batchelor similarity theory and two-dimensional inverse cascades. J. Fluid Mech. 2015, 767, 467–496. [Google Scholar] [CrossRef]
  54. Tobias, S.M.; Cattaneo, F. Dynamo action in complex flows: The quick and the fast. J. Fluid Mech. 2008, 601, 101–122. [Google Scholar] [CrossRef]
  55. Bernard, D.; Boffetta, G.; Celani, A.; Falkovich, G. Inverse turbulent cascades and conformally invariant curves. Phys. Rev. Lett. 2007, 98, 024501. [Google Scholar] [CrossRef] [PubMed]
  56. Venaille, A.; Dauxois, T.; Ruffo, S. Violent relaxation in two-dimensional flows with varying interaction range. Phys. Rev. E 2015, 92, 011001. [Google Scholar] [CrossRef] [PubMed]
  57. Teitelbaum, T.; Mininni, P.D. Thermalization and free decay in surface quasigeostrophic flows. Phys. Rev. E 2012, 86, 016323. [Google Scholar] [CrossRef] [PubMed]
  58. Rhines, P.B. Waves and turbulence on a β-plane. J. Fluid Mech. 1975, 69, 417–443. [Google Scholar] [CrossRef]
  59. Sukhatme, J.; Smith, L.M. Local and nonlocal dispersive turbulence. Phys. Fluids 2009, 21, 056603. [Google Scholar] [CrossRef]
  60. Watanabe, T.; Iwayama, T. Interacting scales and triad enstrophy transfers in generalized two-dimensional turbulence. Phys. Rev. E 2007, 76, 046303. [Google Scholar] [CrossRef] [PubMed]
  61. Scott, R.B.; Wang, F. Direct evidence of an oceanic inverse kinetic energy cascade from satellite altimetry. J. Phys. Oceanogr. 2005, 35, 1650–1666. [Google Scholar] [CrossRef]
  62. Constantin, P.; Majda, A.J.; Tabak, E. Singular front formation in a model for quasi-geostrophic flow. Phys. Fluids 1994, 9, 6–11. [Google Scholar]
  63. Yudovich, V.I. On the loss of smoothness of the solutions of the Euler equations. Dyn. Contin. Media 1974, 16, 71–78. (In Russian) [Google Scholar]
  64. Marchioro, C.; Pulvirenti, M. Mathematical theory of incompressible nonviscous fluids. In Applied Mathematical Sciences; Springer: New York, NY, USA, 1994; Volume 96. [Google Scholar]
  65. Yudovich, V.I. Loss of smoothness and inherent instability of 2D inviscid fluid flows. Commun. Partial Diff. Equal. 2000, 33, 943–968. [Google Scholar]
  66. Dutton, J.A. The nonlinear quasi-geostrophic equation: Existence and uniqueness of solutions on a bounded domain. J. Atmos. Sci. 1974, 31, 422–433. [Google Scholar] [CrossRef]
  67. Bennett, A.F.; Kloeden, P.E. The periodic quasigeostrophic equations: Existence and uniqueness of strong solutions. Proc. R. Soc. Edinb. 1982, 91A, 185–203. [Google Scholar] [CrossRef]
  68. Chae, D. The global regularity for the 3D continuously stratified inviscid quasi-geostrophic equations. J. Nonlinear Sci. 2015, 25, 959–966. [Google Scholar] [CrossRef]
  69. Beale, J.T.; Kato, T.; Majda, A. Remarks on the breakdown of smooth solutions for the 3-D Euler equations. Commun. Math. Phys. 1984, 94, 61–66. [Google Scholar] [CrossRef]
  70. Ohkitani, K.; Yamada, M. Invicid and invicid-limit behavior of a surface quasigeostrophic flow. Phys. Fluids 1997, 9, 876–882. [Google Scholar] [CrossRef]
  71. Denisov, S.A. Double exponential growth of the vorticity gradient for the two-dimensional Euler equation. Proc. Natl. Acad. Sci. USA 2015, 143, 1199–1210. [Google Scholar] [CrossRef]
  72. Cordoba, D. On the geometry of solutions of the quasi-geostrophic and Euler equations. Proc. Natl. Acad. Sci. USA 1997, 94, 12769–12770. [Google Scholar] [CrossRef] [PubMed]
  73. Cordoba, D. Nonexistence of simple hyperbolic blow-up for the quasi-geostrophic equation. Ann. Math. 1998, 148, 1135–1152. [Google Scholar] [CrossRef]
  74. Constantin, P.; Nie, Q.; Schörghofer, N. Front formation in an active scalar. Phys. Rev. E 1999, 60, 2858–2863. [Google Scholar] [CrossRef]
  75. Wu, J. Quasi-geostrophic-type equations with initial data in Morrey spaces quasi-geostrophic. Nonlinearity 1997, 10, 1409–1420. [Google Scholar] [CrossRef]
  76. Ju, N. Global solutions for the two dimensional quasi-geostrophic equation with critical or super-critical dissipation. Math. Ann. 2006, 334, 627–642. [Google Scholar] [CrossRef]
  77. Resnick, S.G. Dynamical Problems in Non-Linear Advective Partial Differential Equations. Ph.D. Thesis, University of Chicago, Chicago, IL, USA, January 1995. [Google Scholar]
  78. Constantin, P.; Wu, J. Behavior of solutions of 2D quasi-geostrophic equations. SIAM J. Math. Anal. 1999, 30, 937–948. [Google Scholar] [CrossRef]
  79. Ju, N. Dissipative 2D quasi-geostrophic equation: Local well-posedness, global regularity and similarity solutions. Indiana Univ. Math. J. 2007, 56, 187–206. [Google Scholar] [CrossRef]
  80. Wu, J. Existence and uniqueness results for the 2-D dissipative quasi-geostrophic equation. Nonlinear Anal. 2007, 67, 3013–3036. [Google Scholar] [CrossRef]
  81. Chae, D.; Lee, J. Global well-posedness in the super-critical dissipative quasi-geostrophic equations. Commun. Math. Phys. 2003, 233, 297–311. [Google Scholar] [CrossRef]
  82. Cordoba, A.; Cordoba, D. A maximum principle applied to quasi-geostrophic equations. Commun. Math. Phys. 2004, 249, 511–528. [Google Scholar] [CrossRef]
  83. Constantin, P.; Cordoba, D.; Wu, J. On the critical dissipative quasi-geostrophic equation. Indiana Univ. Math. J. 2001, 50, 97–107. [Google Scholar] [CrossRef]
  84. Kiselev, A.; Nazarov, F.; Volberg, A. Global well-posedness for the critical 2D dissipative quasi-geostrophic equation. Invent. Math. 2007, 167, 445–463. [Google Scholar] [CrossRef]
  85. Caffarelli, L.A.; Vasseur, A. Drift diffusion equations with fractional diffusion and the quasi-geostrophic equation. Ann. Math. 2010, 171, 1903–1930. [Google Scholar] [CrossRef]
  86. Constantin, P.; Tarfulea, A.; Vicol, V. Long time dynamics of forced critical SQG. Commun. Math. Phys. 2015, 335, 93–141. [Google Scholar] [CrossRef]
  87. Lesieur, M.; Sadourny, R. Satellite-sensed turbulent ocean structure. Nature 1981, 294, 673. [Google Scholar] [CrossRef]
  88. Scott, R.K. Local and nonlocal advection of a passive scalar. Phys. Fluids 2006, 56, 122–125. [Google Scholar] [CrossRef]
  89. Batchelor, G.K. The effect of homogeneous turbulence on material lines and surfaces. Proc. R. Soc. Lond. Ser. A 1952, 213, 349–366. [Google Scholar] [CrossRef]
  90. Wirth, V.; Borth, H.; López, J.F.; Panhans, W.G.; Riemer, M.; Szabo, T. Dynamics in the extratropical tropopause region: A case of transition between dynamically active and passive tracer advection? Q. J. R. Meteorol. Soc. 2005, 131, 247–257. [Google Scholar] [CrossRef]
  91. Klein, P.; Hua, B.L.; Lapeyre, G.; Capet, X.; Gentil, S.L.; Sasaki, H. Upper ocean turbulence from high 3-D resolution simulations. J. Phys. Oceanogr. 2008, 38, 1748–1763. [Google Scholar] [CrossRef]
  92. Capet, X.; McWilliams, J.C.; Molemaker, M.; Shchepetkin, A. Mesoscale to submesoscale transition in the California current system. Part III: Energy balance and flux. J. Phys. Oceanogr. 2008, 38, 2256–2269. [Google Scholar] [CrossRef]
  93. Shcherbina, B.A.Y.; Sundermeyer, M.A.; Kunze, E.; D’Asaro, E.; Badin, G. The LATMIX summer campaign. Bull. Am. Meteor. Soc. 2015, 96, 1257–1279. [Google Scholar] [CrossRef]
  94. Johnson, E.R. Topographically bound vortices. Geophys. Astrophys. Fluid Dyn. 1978, 11, 61–71. [Google Scholar] [CrossRef]
  95. Isern-Fontanet, J.; Lapeyre, G.; Klein, P.; Chapron, B.; Hecht, M.W. Three-dimensional reconstruction of oceanic mesoscale currents from surface information. J. Geophys. Res. 2008, 113. [Google Scholar] [CrossRef]
  96. Qiu, B.; Chen, S.; Klein, P.; Ubelmann, C.; Fu, L.L.; Sasaki, H. Reconstructability of three-dimensional upper-ocean circulation from SWOT sea surface height measurements. J. Phys. Oceanogr. 2016, 46, 947–963. [Google Scholar] [CrossRef]
  97. Klein, P.; Lapeyre, G.; Roullet, G.; Le Gentil, S.; Sasaki, H. Ocean turbulence at meso and submesoscales: Connection between surface and interior dynamics. Geophys. Astrophys. Fluid Dyn. 2011, 105, 421–437. [Google Scholar] [CrossRef]
  98. Lapeyre, G. What vertical mode does the altimeter reflect? On the decomposition in baroclinic modes and on a surface-trapped mode. J. Phys. Oceanogr. 2009, 39, 2857–2874. [Google Scholar] [CrossRef]
  99. Isern-Fontanet, J.; Chapron, B.; Lapeyre, G.; Klein, P. Potential use of microwave Sea surface temperatures for the estimation of ocean currents. Geophys. Res. Lett. 2006, 33. [Google Scholar] [CrossRef]
  100. Gonzalez-Haro, C.; Isern-Fontanet, J. Global ocean current reconstruction from altimetric and microwave SST measurements. J. Geophys. Res. 2014, 119, 3378–3391. [Google Scholar] [CrossRef]
  101. Wunsch, C. The vertical partition of oceanic horizontal kinetic energy. J. Phys. Oceanogr. 1997, 27, 1770–1794. [Google Scholar] [CrossRef]
  102. Stammer, D. Global characteristics of ocean variability estimated from regional TOPEX/POSEIDON altimeter measurements. J. Phys. Oceanogr. 1997, 27, 1743–1769. [Google Scholar] [CrossRef]
  103. Smith, K.S.; Vanneste, J. A surface-aware projection basis for quasigeostrophic flow. J. Phys. Oceanogr. 2013, 43, 548–562. [Google Scholar] [CrossRef]
  104. Roullet, G.; McWilliams, J.C.; Capet, X.; Molemaker, M.J. Properties of steady geostrophic turbulence with isopycnal outcropping. J. Phys. Oceanogr. 2012, 42, 18–38. [Google Scholar] [CrossRef]
  105. Ponte, A.; Klein, P. Reconstruction of the upper ocean 3D dynamics from high-resolution sea surface height. Ocean Dyn. 2013, 63, 777–791. [Google Scholar] [CrossRef]
  106. Tulloch, R.; Smith, K.S. A note on the numerical representation of surface dynamics in quasigeostrophic turbulence: Application to the nonlinear Eady model. J. Atmos. Sci. 2009, 66, 1063–1068. [Google Scholar] [CrossRef]
  107. Tulloch, R.; Smith, K.S. Quasigeostrophic turbulence with explicit surface dynamics: Application to the atmospheric energy spectrum. J. Atmos. Sci. 2009, 66, 450–467. [Google Scholar] [CrossRef]
  108. Wang, J.; Flierl, G.R.; LaCasce, J.H.; McClean, J.L.; Mahadevan, A. Reconstructing the ocean’s interior from surface data. J. Phys. Oceanogr. 2013, 43, 1611–1626. [Google Scholar] [CrossRef]
  109. Lacasce, J.H.; Wang, J. Estimating subsurface velocities from surface fields with idealized stratification. J. Phys. Oceanogr. 2015, 9, 2424–2435. [Google Scholar] [CrossRef]
  110. Chavanne, C.P.; Klein, P. Quasigeostrophic diagnosis of mixed layer dynamics embedded in a mesoscale turbulent field. J. Phys. Oceanogr. 2016, 46, 275–287. [Google Scholar] [CrossRef]
  111. Callies, J.; Flierl, G.; Ferrari, R.; Fox-Kemper, B. The role of mixed-layer instabilities in submesoscale turbulence. J. Fluid Mech. 2016, 788, 5–41. [Google Scholar] [CrossRef]
  112. Boccaletti, G.; Ferrari, R.; Fox-Kemper, B. Mixed layer instabilities and restratification. J. Phys. Oceanogr. 2007, 37, 2228–2250. [Google Scholar] [CrossRef]
  113. Hoskins, B.J.; Draghici, I.; Davies, H.C. A new look at the ω-equation. Q. J. R. Meteorol. Soc. 1978, 104, 31–38. [Google Scholar] [CrossRef]
  114. Klein, P.; Isern-Fontanet, J.; Lapeyre, G.; Roullet, G.; Danioux, E.; Chapron, B.; Le Gentil, S.; Sasaki, H. Diagnosis of vertical velocities in the upper ocean from high resolution Sea Surface Height. Geophys. Res. Lett. 2009, 36, L12603. [Google Scholar] [CrossRef]
  115. Ponte, A.; Klein, P.; Capet, X.; Le Traon, P.Y.; Chapron, B.; Lherminier, P. Diagnosing surface mixed layer dynamics from high-resolution satellite observations: Numerical insights. J. Phys. Oceanogr. 2013, 43, 1345–1355. [Google Scholar] [CrossRef]
  116. Garrett, C.; Loder, J. Dynamical aspects of shallow sea fronts. Philos. Trans. R. Soc. Lond. 1981, A94, 563–581. [Google Scholar] [CrossRef]
  117. Hakim, G.J.; Snyder, C.; Muraki, D.J. A new surface model for cyclone-anticyclone asymmetry. J. Atmos. Sci. 2002, 59, 2405–2420. [Google Scholar] [CrossRef]
  118. Petterssen, S. Contribution to the theory of frontogenesis. Geofys. Pub. 1936, 11, 5–27. [Google Scholar]
  119. Williams, R.T.; Plotkin, J. Quasi-geostrophic frontogenesis. J. Atmos. Sci. 1968, 25, 201–206. [Google Scholar] [CrossRef]
  120. Sawyer, J.S. The vertical circulation at meteorological fronts and its relation to frontogenesis. Proc. R. Soc. Lond. Ser. A 1956, A234, 346–362. [Google Scholar] [CrossRef]
  121. Eliassen, A. On the vertical circulation in frontal zones. Geofys. Publik. 1962, 24, 147–160. [Google Scholar]
  122. Hoskins, B.J.; Bretherton, F.P. Atmospheric frontogenesis models: Mathematical formulation and solution. J. Atmos. Sci. 1972, 29, 11–37. [Google Scholar] [CrossRef]
  123. Lapeyre, G.; Klein, P.; Hua, B.L. Does the tracer gradient vector align with the strain eigenvectors in 2-D turbulence? Phys. Fluids A. 1999, 11, 3729–3737. [Google Scholar] [CrossRef]
  124. Gower, J.F.R.; Denman, K.L.; Holyer, R.J. Phytoplankton patchiness indicates the fluctuation spectrum of mesoscale oceanic structure. Nature 1980, 288, 157–159. [Google Scholar] [CrossRef]
  125. Lapeyre, G.; Klein, P. Impact of the small-scale elongated filaments on the oceanic vertical pump. J. Mar. Res. 2006, 64, 935–951. [Google Scholar] [CrossRef]
  126. Perruche, C.; Rivière, P.; Lapeyre, G.; Carton, X.; Pondaven, P. Effects of Surface Quasi-Geostrophic turbulence on phytoplankton competition and coexistence. J. Mar. Res. 2011, 69, 105–135. [Google Scholar] [CrossRef]
  127. Juckes, M. Quasigeostrophic dynamics of the tropopause. J. Atmos. Sci. 1994, 51, 2756–2768. [Google Scholar] [CrossRef]
  128. Smith, K.S.; Bernard, E. Geostrophic turbulence near rapid changes in stratification. Phys. Fluids 2013, 25, 046601. [Google Scholar] [CrossRef]
  129. Plougonven, R.; Vanneste, J. Quasi-geostrophic dynamics of a finite-thickness tropopause. J. Atmos. Sci. 2010, 67, 3149–3163. [Google Scholar] [CrossRef]
  130. Rivest, C.; Davis, C.A.; Farrell, B.F. Upper-tropospheric synoptic-scale waves. Part I: Maintenance as Eady normal modes. J. Atmos. Sci. 1992, 49, 2108–2119. [Google Scholar] [CrossRef]
  131. Tomikawa, Y.; Sato, K.; Shepherd, T.G. A diagnostic study of waves on the tropopause. J. Atmos. Sci. 2006, 63, 3315–3332. [Google Scholar] [CrossRef]
  132. Wirth, V.; Appenzeller, C.; Juckes, M. Signatures of induced vertical air motion accompanying quasi-horizontal roll-up of stratospheric intrusions. Mon. Weather Rev. 1997, 125, 2504–2519. [Google Scholar] [CrossRef]
  133. Nastrom, G.D.; Gage, K.S. A climatology of atmospheric wavenumber spectra of wind and temperature observed by commercial aircraft. J. Atmos. Sci. 1985, 42, 950–960. [Google Scholar] [CrossRef]
  134. Lindborg, E. The effect of rotation on the mesoscale energy cascade in the free atmosphere. Geophys. Res. Lett. 2005, 32. [Google Scholar] [CrossRef]
  135. Hamilton, K.; Takahashi, Y.O.; Ohfuchi, W. Mesoscale spectrum of atmospheric motions investigated in a very fine resolution global general circulation model. J. Geophys. Res. 2008, 113. [Google Scholar] [CrossRef]
  136. Tulloch, R.; Smith, K.S. A new theory for the atmospheric energy spectrum: Depth-limited temperature anomalies at the tropopause. Proc. Natl. Acad. Sci. USA 2006, 103, 14690–14694. [Google Scholar] [CrossRef] [PubMed]
  137. Asselin, O.; Bartello, P.; Straub, D.N. On quasi-geostrophic dynamics near the tropopause. Phys. Fluids 2016, 28, 026601. [Google Scholar] [CrossRef]
  138. Morss, R.; Snyder, C.; Rotunno, R. Spectra, spatial scales, and predictability in a quasigeostrophic model. J. Atmos. Sci. 2009, 66, 3115–3130. [Google Scholar] [CrossRef]
  139. Greenslade, M.D.; Haynes, P.H. Vertical transition in transport and mixing in baroclinic flows. J. Atmos. Sci. 2008, 65, 1137–1157. [Google Scholar] [CrossRef]
  140. Bracco, A. Boundary layer separation in the surface quasigeostrophic equations. Il Nuovo Cimento 2000, 23, 487–505. [Google Scholar]
  141. Charney, J.G. The dynamics of long waves in a baroclinic westerly current. J. Meteor. 1947, 4, 135–162. [Google Scholar] [CrossRef]
  142. Green, J.S.A. A problem in baroclinic instability. Q. J. R. Meteorol. Soc. 1960, 86, 237–251. [Google Scholar] [CrossRef]
  143. Heifetz, E.; Methven, J.; Hoskins, B.J.; Bishop, C.H. The counter-propagating Rossby-wave perspective on baroclinic instability. II: Application to the Charney model. Q. J. R. Meteorol. Soc. 2004, 130, 233–258. [Google Scholar] [CrossRef]
  144. Held, I.M. The vertical scale of an unstable baroclinic wave and its importance for eddy heat flux parameterizations. J. Atmos. Sci. 1978, 35, 572–576. [Google Scholar] [CrossRef]
  145. Venaille, A.; Vallis, G.K.; Griffies, S.M. The catalytic role of the beta effect in barotropization processes. J. Fluid Mech. 2012, 709, 490–515. [Google Scholar] [CrossRef]
  146. Perrot, X.; Reinaud, J.N.; Carton, X.; Dritschel, D.G. Homostrophic vortex interaction under external strain, in a coupled QG-SQG model. Reg. Chaot. Dyn. 2010, 15, 66–83. [Google Scholar] [CrossRef]
  147. Reinaud, J.N.; Dritschel, D.G.; Carton, X. Interaction between a surface quasi-geostrophic buoyancy filament and an internal vortex. Geophys. Astrophys. Fluid Dyn. 2016, 110, 461–490. [Google Scholar] [CrossRef]
  148. Williams, R.T. Atmospheric frontogenesis: A numerical experiment. J. Atmos. Sci. 1967, 24, 627–641. [Google Scholar] [CrossRef]
  149. Hoskins, B.J. The geostrophic momentum approximation and the semi-geostrophic equations. J. Atmos. Sci. 1975, 32, 233–242. [Google Scholar] [CrossRef]
  150. Badin, G. Surface semi-geostrophic dynamics in the ocean. Geophys. Astrophys. Fluid Dyn. 2013, 107, 526–540. [Google Scholar] [CrossRef]
  151. Ragone, F.; Badin, G. A study of surface semi-geostrophic turbulence: Freely decaying dynamics. J. Fluid Mech. 2016, 792, 740–774. [Google Scholar] [CrossRef]
  152. Lapeyre, G.; Klein, P.; Hua, B.L. Oceanic restratification forced by surface frontogenesis. J. Phys. Oceanogr. 2006, 36, 1577–1590. [Google Scholar] [CrossRef]
  153. Juckes, M. The structure of idealized upper-tropospheric shear lines. J. Atmos. Sci. 1999, 56, 2830–2845. [Google Scholar] [CrossRef]
  154. Bembenek, E.; Poulin, F.J.; Waite, M.L. Realizing surface-driven flows in the primitive equations. J. Phys. Oceanogr. 2015, 45, 1376–1392. [Google Scholar] [CrossRef]
  155. Snyder, C.; Muraki, D.J.; Plougonven, R.; Zhang, F. Inertia-gravity waves generated within a dipole Vortex. J. Atmos. Sci. 2007, 64, 4417–4431. [Google Scholar] [CrossRef]
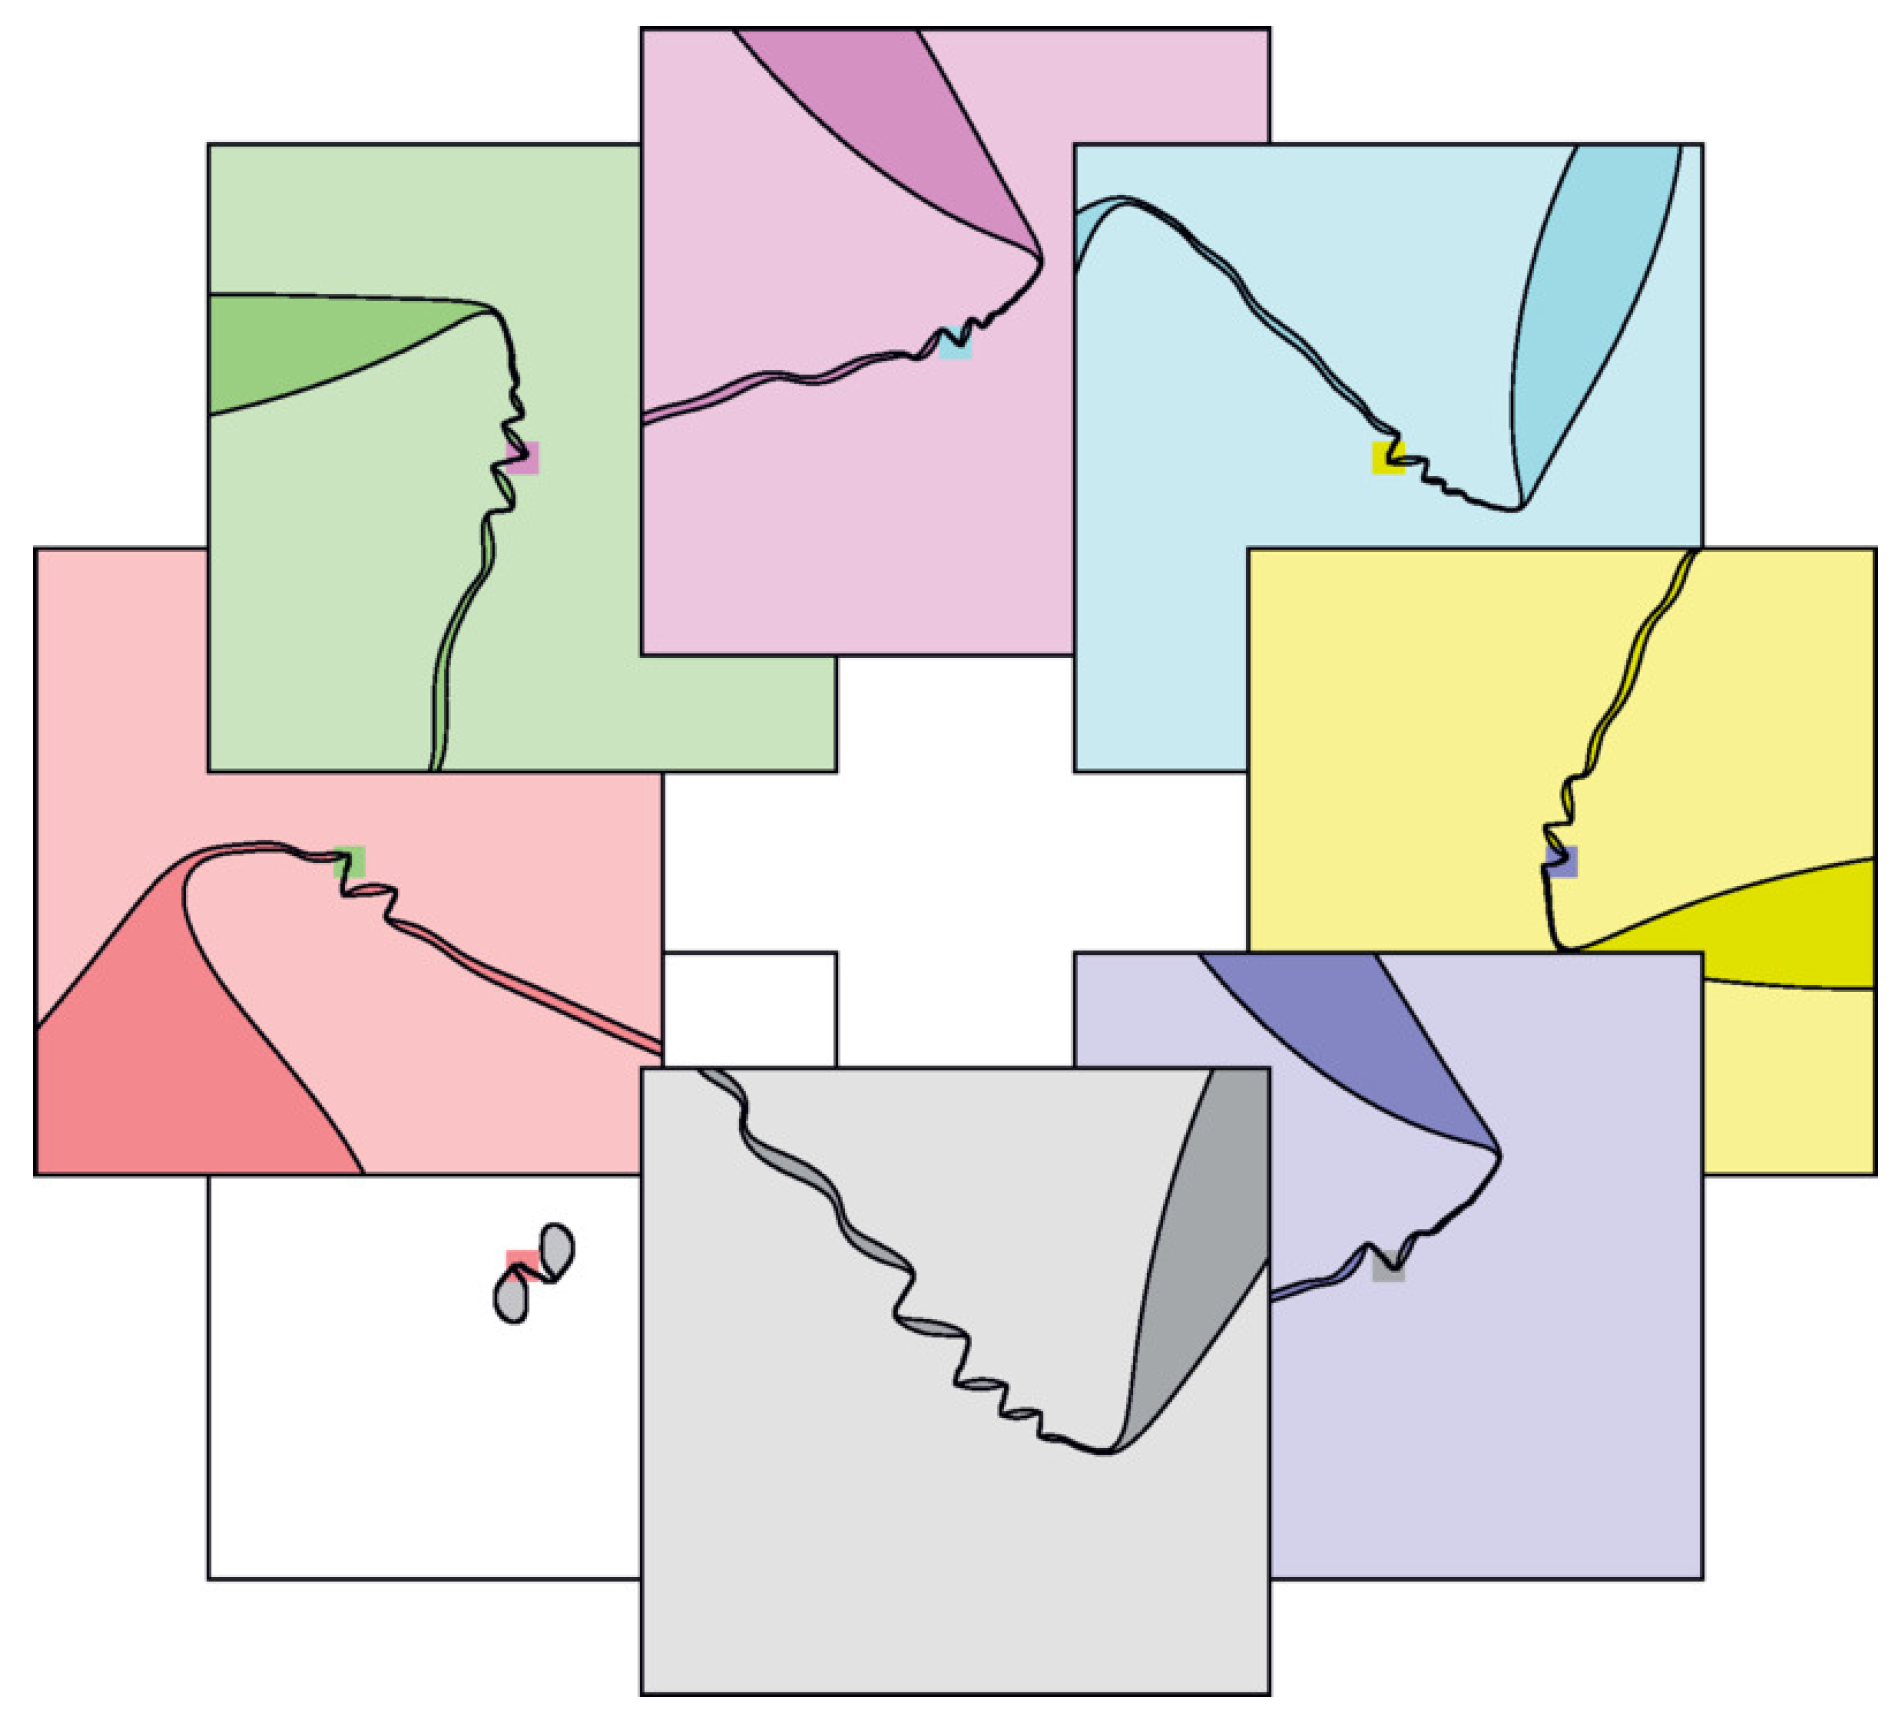
Figure 1. Cascade of filament instabilities near the time of singularity (infinite curvature). On the bottom left (box with white background), two elliptical vortices are elongating a thin filament. Each panel in clockwise order shows a close-up of the filament. Finer and finer scale structures can be observed with the rolling-up of the filament. Reprinted with permission from [31]. Copyright (2014) by the American Physical Society .
Fluids 02 00007 g001
Figure 2. (a) Surface buoyancy in a freely-decaying simulation at a resolution of 1024 × 1024 . Note that the vortices at all scales develop from filament instability. (b) Spectral fluxes Π θ (continuous curve), Π u (dashed curve) and Π a (dash and dotted curve). See the text for the definition. Panel (b) is from [50], with permission of Cambridge University Press.
Fluids 02 00007 g002
Figure 3. (a) Surface buoyancy θ + β y in a forced Surface Quasi-Geostrophy (SQG) simulation in the presence of a β effect; (b) corresponding relative vorticity. Only a subdomain is shown. The model is forced at wavenumber k f = 40 for a domain size of [ 0 ,   2 π ] × [ 0 ,   2 π ] and a resolution of 512 × 512 .
Fluids 02 00007 g003
Figure 4. Validation of the SQG balance in the Gulf Stream region. (a) Sea surface temperature (shadings) and sea surface height (white contours); (b) corresponding velocity field, deduced from altimetry (blue arrows) and from SQG balance (red arrows). Note the good agreement between the two velocity fields. From [99], with permission of John Wiley and Sons.
Fluids 02 00007 g004
Figure 5. Validation of the SQG balance at the tropopause. (a) Geopotential height contours of the Potential Vorticity ( P V ) = 2 surface (500-m intervals, heavy contour 10 km). The shading is the region where potential temperature lies between 310 and 330 K. Simulations taken from a General Circulation Model. (b) Contoured scatterplot of potential temperature anomalies (from zonal mean) versus geopotential height anomalies on the tropopause ( P V = 2 P V units). In panel (a), there is a clear correspondence between geopotential height contours and potential temperature shadings. In panel (b), we clearly see the linearity between geopotential height and potential temperature at the tropopause. From [127]. ©American Meteorological Society. Used with permission.
Fluids 02 00007 g005