
On the Three Dimensional Interaction between Flexible Fibers and Fluid Flow

Abstract
:1. Introduction
2. Three Dimensional Numerical Simulations
2.1. Governing Equations
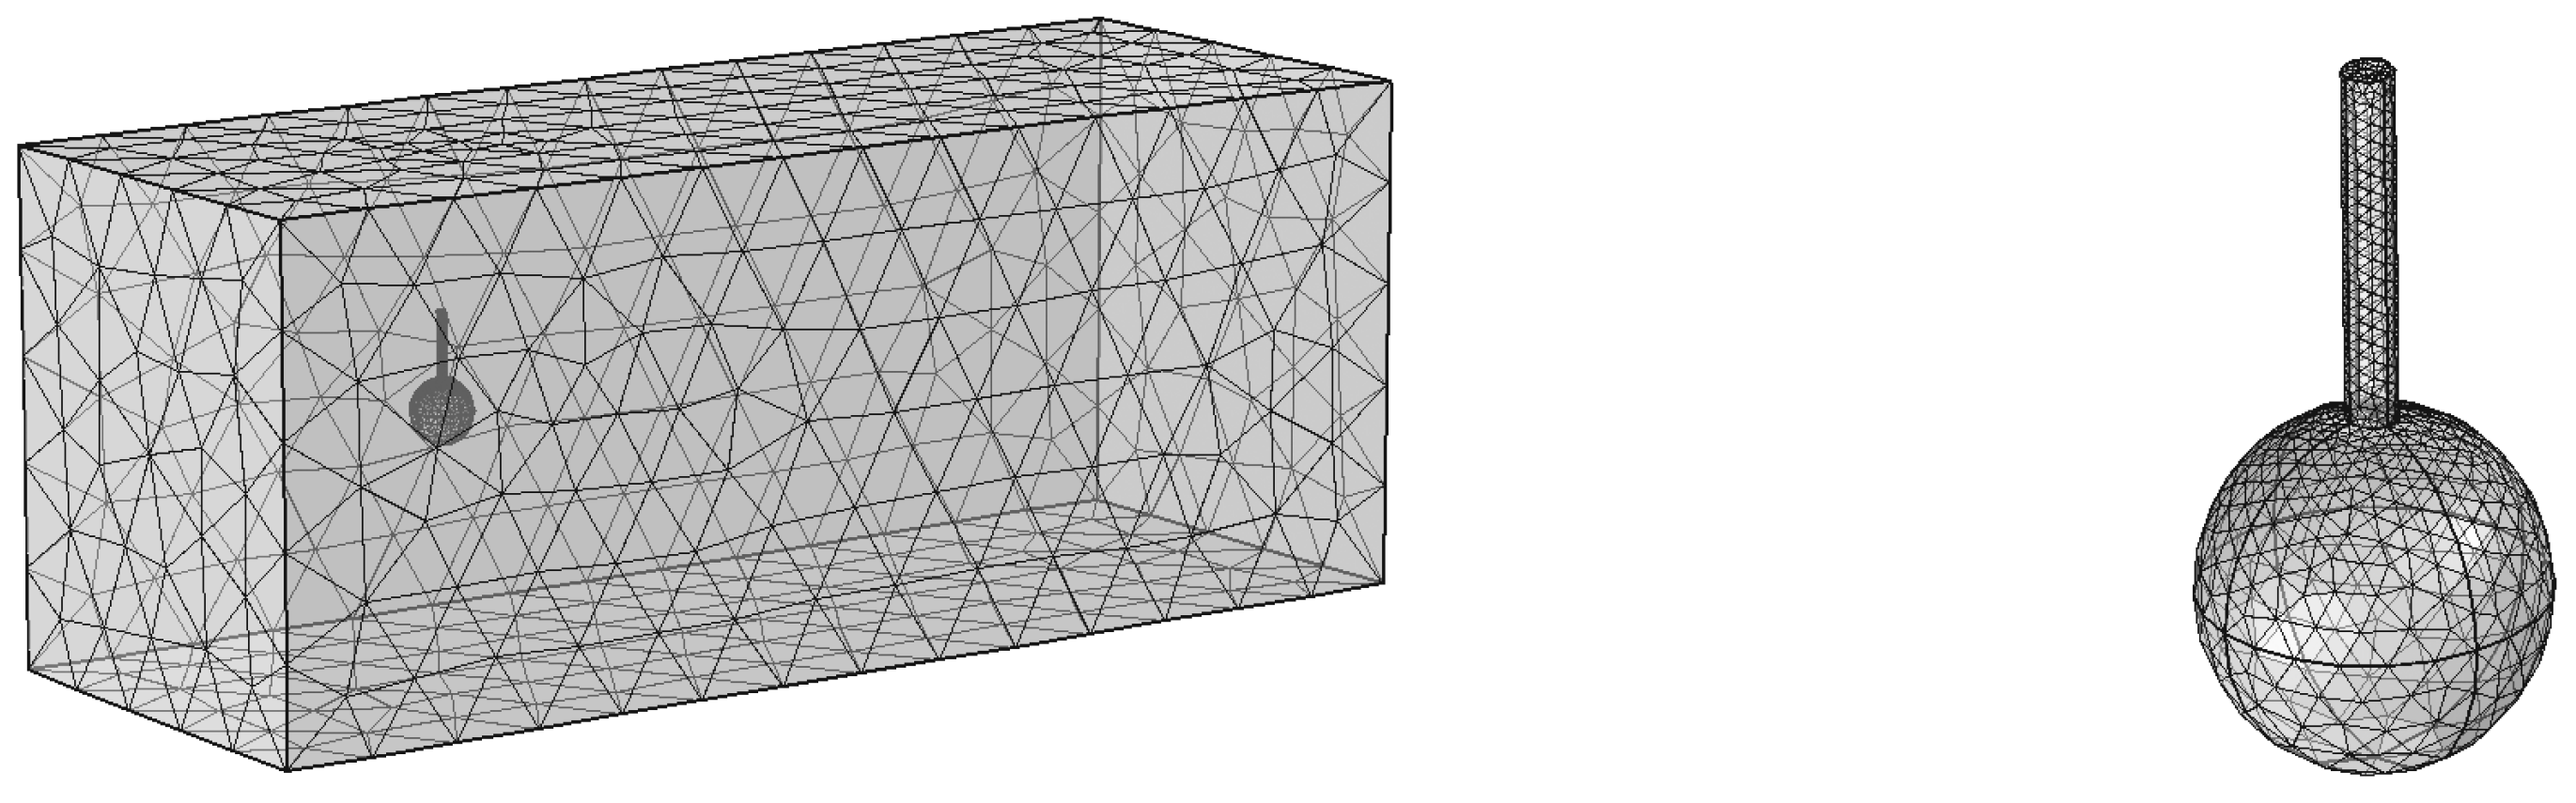
2.2. Numerical Setup
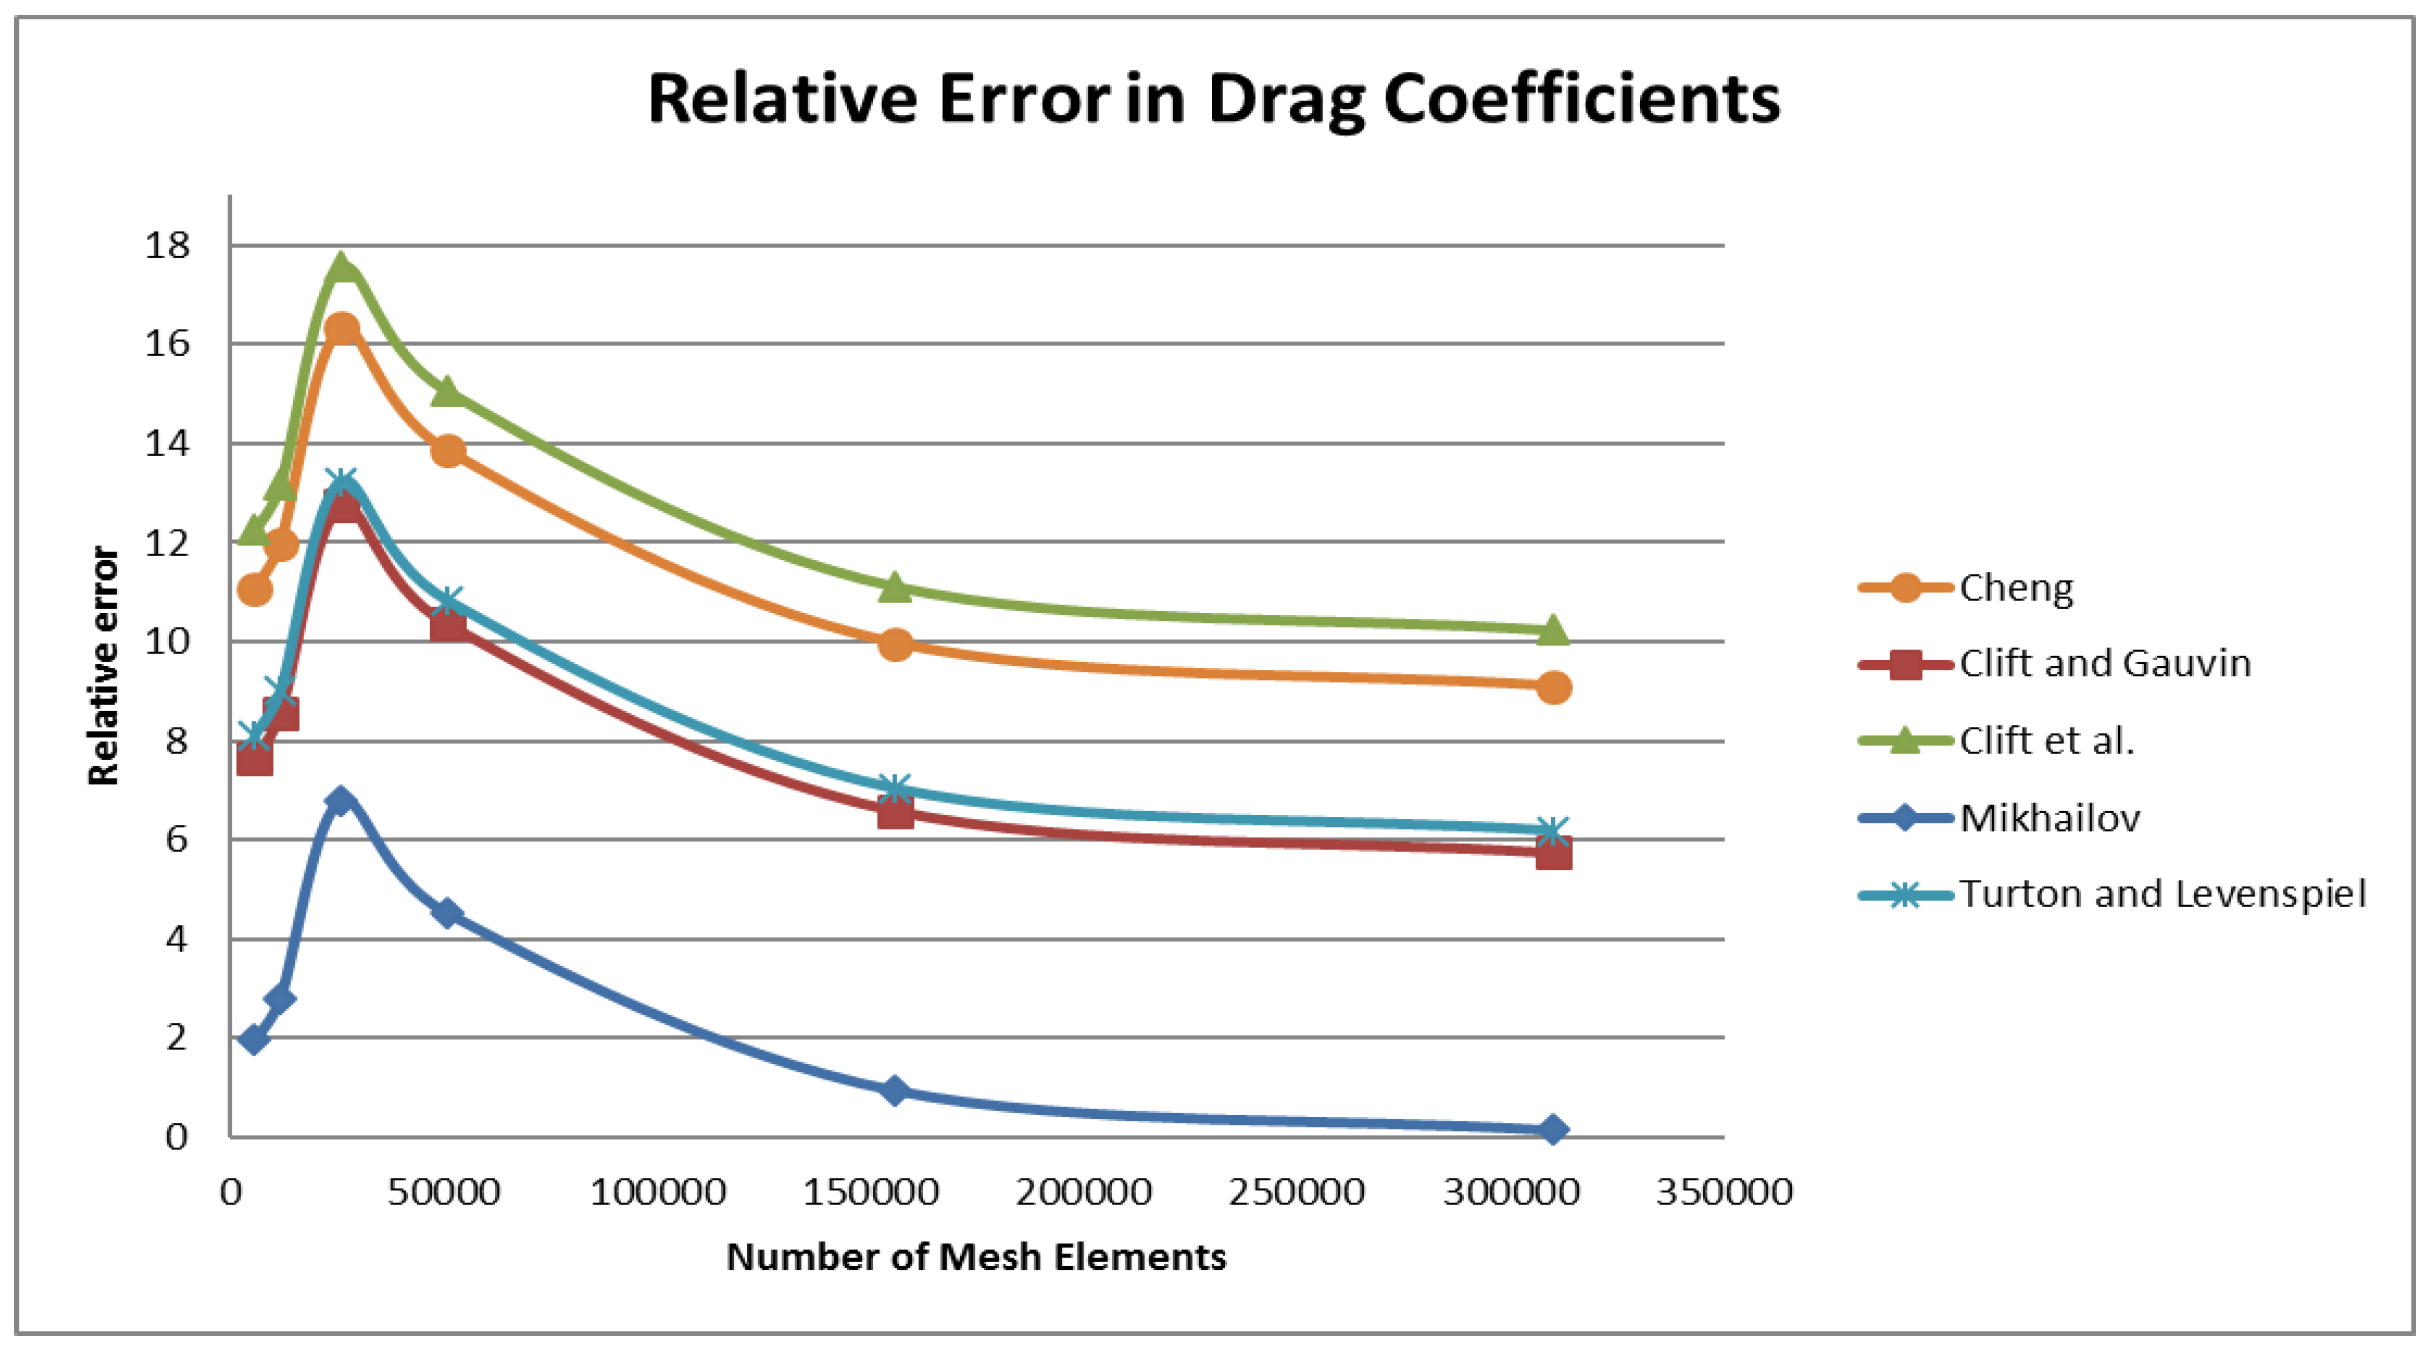
2.2.1. Flow Around a Sphere
2.2.2. Convergence Study for Ball and Fiber System
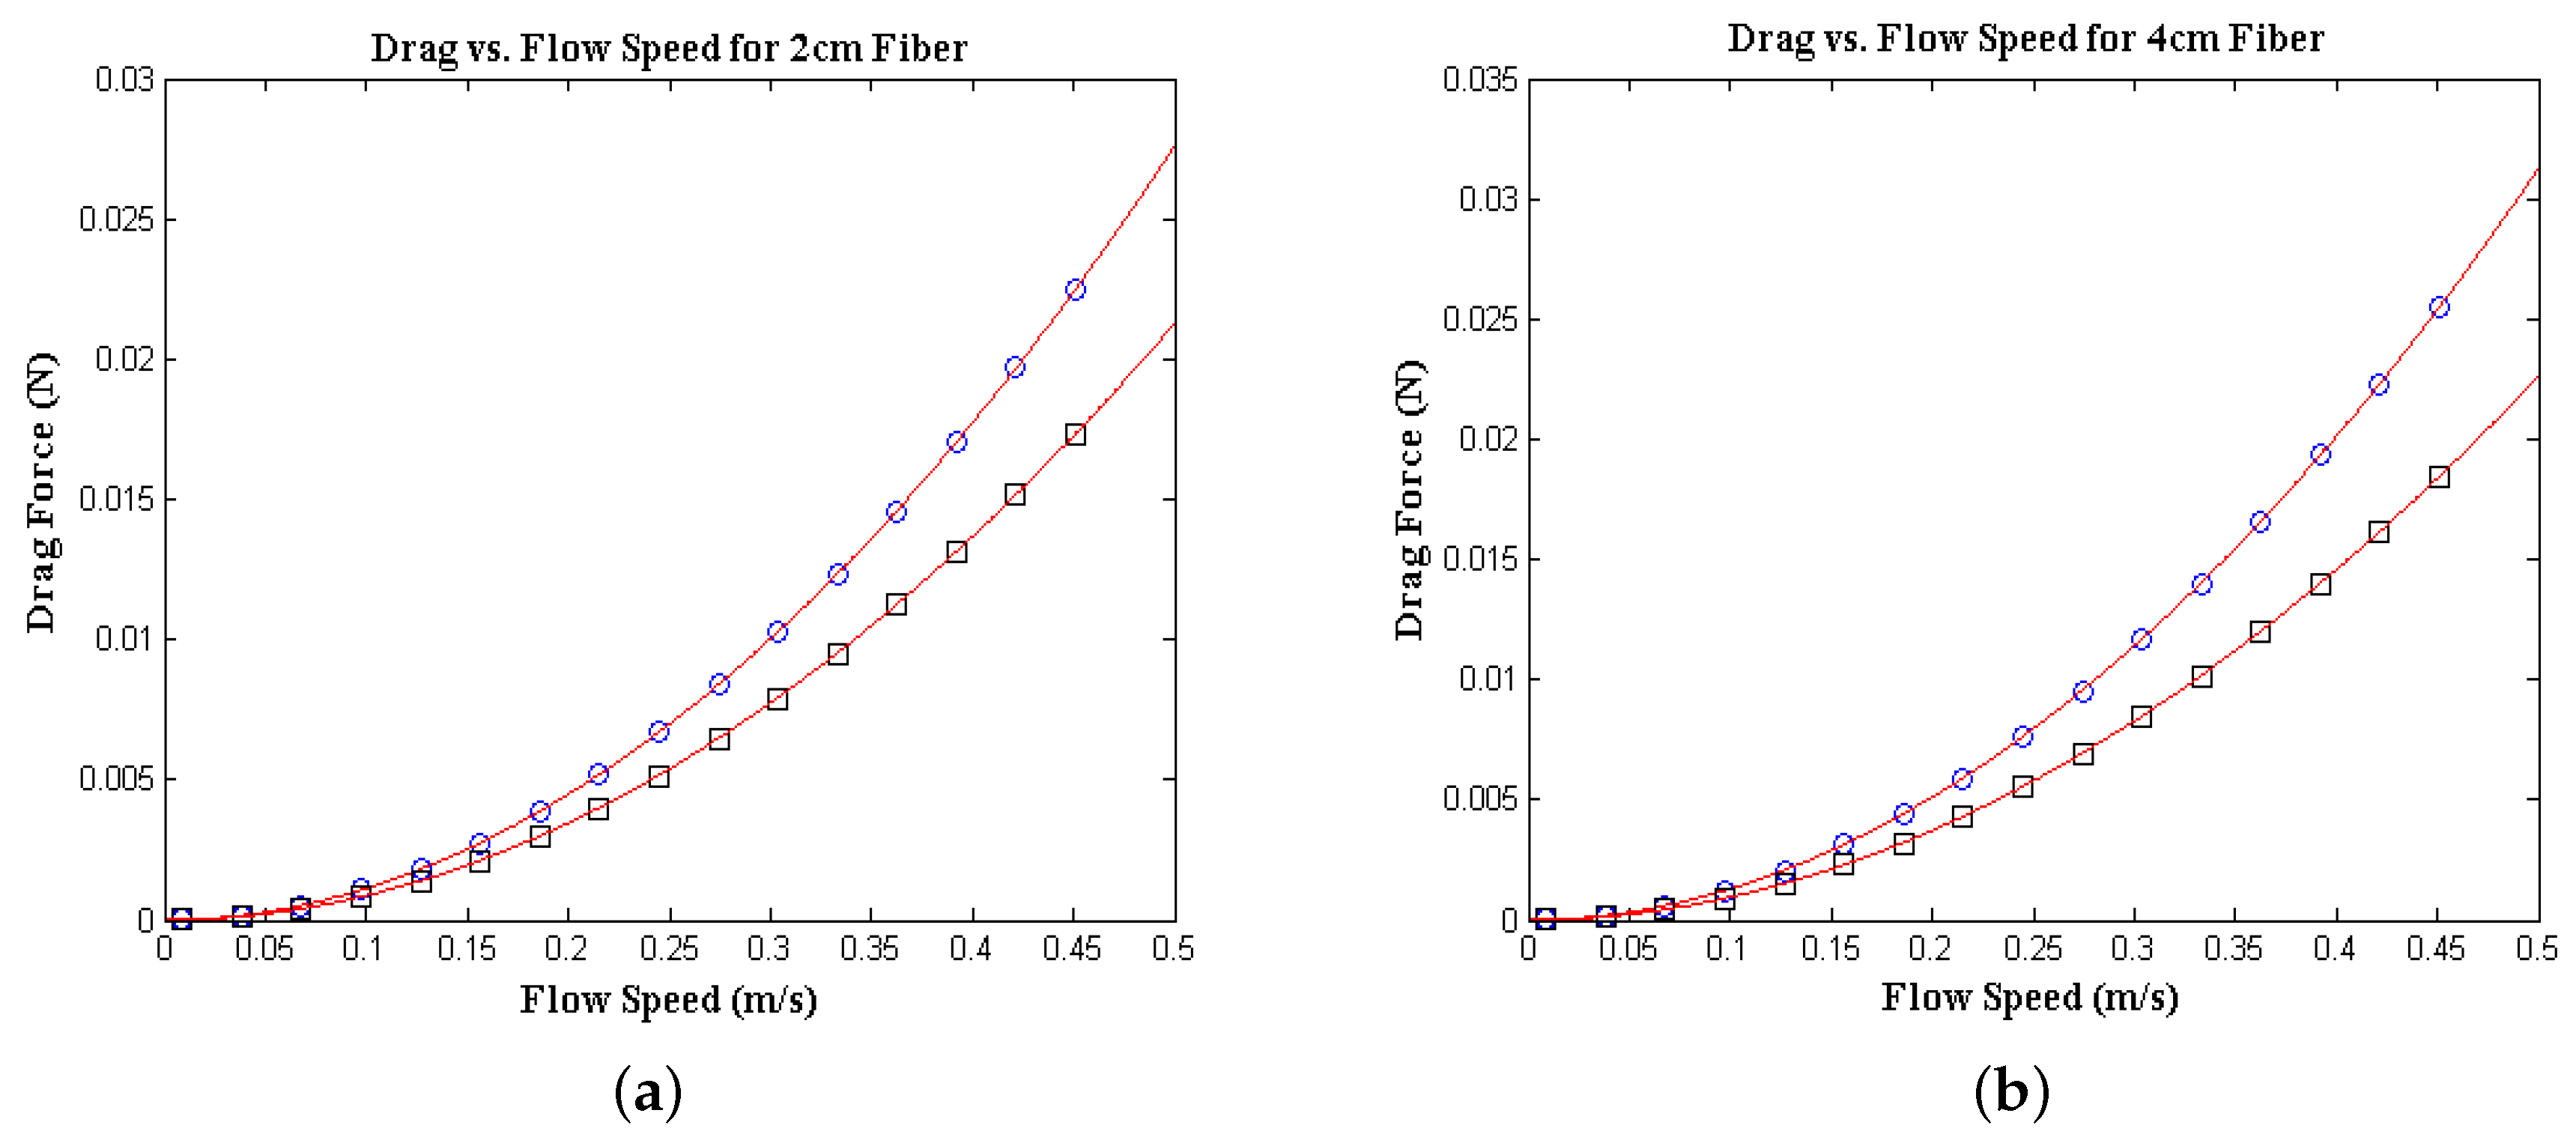
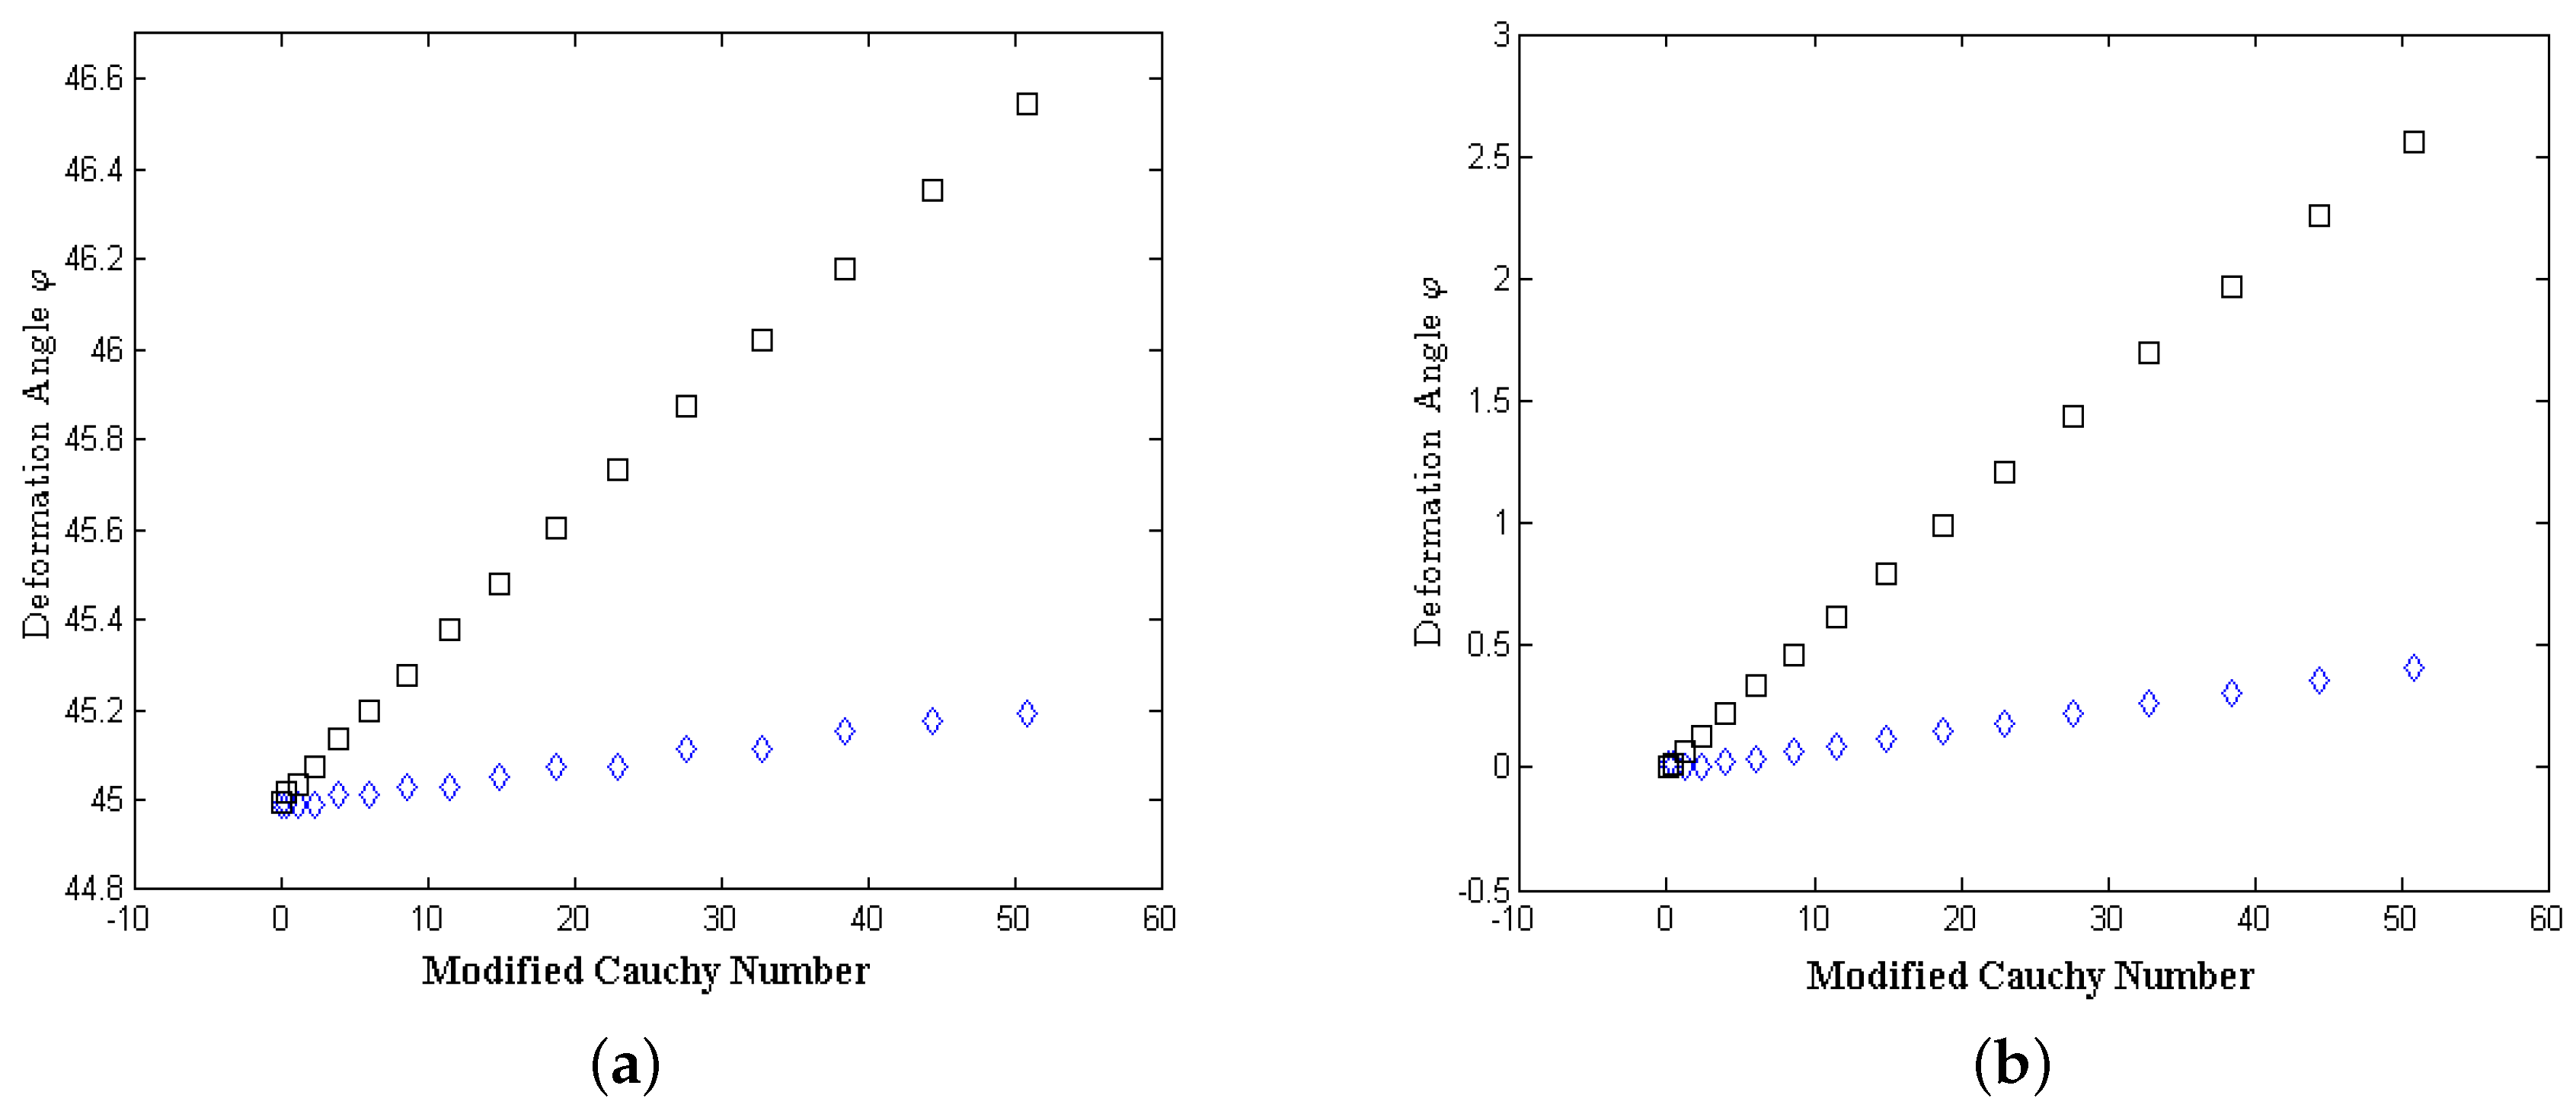
2.2.3. Parametric Study
3. Results
4. Conclusions
Author Contributions
Conflicts of Interest
References
- Allaire, R.; Guerron, P.; Nita, B.; Nolan, P.; Vaidya, A. On the equilibrium configurations of flexible fibers in a flow. Int. J. Nonlinear Mech. 2014, 69, 157–165. [Google Scholar] [CrossRef]
- Hasnedlová, J.; Feistauer, M.; Horáček, J.; Kosík, A.; Kučera, V. Numerical Simulation of Fluid-Structure Interaction of Compressible Flow and Elastic Structure. Computing 2013, 95, 343–361. [Google Scholar] [CrossRef]
- Huang, L.; Quinn, S.J.; Ellis, P.D.; Williams, J.E. Biomechanics of snoring. Endeavour 1995, 19, 96–100. [Google Scholar] [CrossRef]
- Camassa, R.; Chung, B.J.; Howard, P.; McLaughlin, R.M.; Vaidya, A. Vortex Induced Oscillations of Cylinders at Low and Intermediate Reynolds Numbers; Sequeira, A., Rannacher, R., Eds.; Springer: Berlin/Heidelberg, Germany, 2010; pp. 135–145. [Google Scholar]
- Fields, S.B.; Klaus, M.; Moore, M.G.; Nori, F. Chaotic dynamics of falling disks. Nature 1997, 388, 252–254. [Google Scholar] [CrossRef]
- Galdi, G.P.; Vaidya, A. Translational Steady fall of Symmetric Bodies in Navier-Stokes Liquid, with Application to Particle Sedimentation. J. Math. Fluid Mech. 2001, 3, 183–211. [Google Scholar] [CrossRef]
- Kirchoff, G. Uber die Bewegung enines Rotationskorpers in einer flussigkeit. J. Reine Angew. Math. Soc. 1869, 71, 237–281. [Google Scholar]
- Leal, L.G. Particle Motion in a Viscous Fluid. Annu. Rev. Fluid Mech. 1980, 12, 435–476. [Google Scholar] [CrossRef]
- Tanabe, Y.; Kaneko, K. Behavior of falling paper. Phys. Rev. Lett. 1994, 73, 1372–1376. [Google Scholar] [CrossRef] [PubMed]
- Willmarth, W.W.; Hawk, N.E.; Galloway, A.J.; Roos, F.W. Aerodynamics of oscillating disks and a right-circular cylinder. J. Fluid Mech. 1967, 27, 177–207. [Google Scholar] [CrossRef]
- Alben, S.; Shelley, M.; Zhang, J. Drag reduction through self-similar bending of a flexible body. Nature 2002, 420, 479–481. [Google Scholar] [CrossRef] [PubMed]
- Alben, S.; Shelley, M.; Zhang, J. How flexibility induces streamlining in a two-dimensional flow. Phys. Fluids 2004, 16, 1694–1713. [Google Scholar] [CrossRef]
- Gosselin, F.; de Langre, E.; Machado-Almeida, B.A. Drag reduction of flexible plates by reconfiguration. J. Fluid Mech. 2010, 650, 319–341. [Google Scholar] [CrossRef]
- Shelley, M.J.; Zhang, J. Flapping and bending bodies interacting with fluid flows. Annu. Rev. Fluid Mech. 2011, 43, 449–465. [Google Scholar] [CrossRef]
- Schouveiler, L.; Eloy, C.; Le Gal, P. Flow-induced vibrations of high mass ratio flexible filaments freely hanging in a flow. Phys. Fluids 2005, 17, 047104. [Google Scholar] [CrossRef]
- Zhu, L. Viscous flow past a flexible fibre tethered at its center pint: Vortex shedding. J. Fluid Mech. 2007, 587, 217–234. [Google Scholar] [CrossRef]
- Vogel, S. Drag and flexibility in sessile organisms. Am. Zool. 1984, 24, 37–44. [Google Scholar] [CrossRef]
- Vogel, S. Drag and reconfiguration of broad leaves in high winds. J. Exp. Bot. 1989, 40, 941–948. [Google Scholar] [CrossRef]
- Slaughter, W.S. The linearized Theory of Elasticity; Birkhauser: Basel, Switzerland, 2002. [Google Scholar]
- Simo, J.C.; Hughes, T.J.R. Computational Inelasticity; Springer: Berlin, Germany, 1998. [Google Scholar]
- Donea, J.; Huerta, A. Finite Element Methods for Flow Problems; Wiley: Hoboken, NJ, USA, 2003. [Google Scholar]
- Winslow, A. Numerical solution of the quasilinear Poisson equations in a nonuniform triangle mesh. J. Comp. Phys. 1967, 2, 149–172. [Google Scholar] [CrossRef]
- Batchelor, G.K. An Introduction to Fluid Dynamics; Cambridge University Press: Cambridge, UK, 2000. [Google Scholar]
- Cheng, N. Comparison of formulas for drag coefficient and settling velocity of spherical particles. Powder Technol. 2009, 189, 395–398. [Google Scholar] [CrossRef]
- Drag of a Sphere. Available online: https://www.grc.nasa.gov/www/k-12/airplane/dragsphere.html (accessed on 13 September 2015).
- Clift, R.; Grace, J.R.; Weber, M.E. Bubbles, Drops, and Particles; Academic Press: Cambridge, MA, USA, 1978. [Google Scholar]
- Mikhailov, M.D.; Freire, A.P. The drag coefficient of a sphere: An approximation using Shanks transform. Powder Technol. 2013, 237, 432–435. [Google Scholar] [CrossRef]
- Turton, R.; Levenspiel, O. A short note on the drag correlation for spheres. Powder Technol. 1986, 47, 83–86. [Google Scholar] [CrossRef]
- Griesmer, A. Size Parameters for Free Tetrahedral Meshing in COMSOL Multiphysics. Available online: https://www.comsol.com/blogs/size-parameters-free-tetrahedral-meshing-comsol-multiphysics/ (accessed on 30 January 2014).


| Mesh Number of Elements | Relative Error | |
|---|---|---|
| 5847 | 0.473984641 | 1.97127 |
| 11,771 | 0.477832654 | 2.79912 |
| 26,030 | 0.496393657 | 6.79226 |
| 50,843 | 0.48586821 | 4.52786 |
| 155,780 | 0.469231214 | 0.94864 |
| 309,889 | 0.465496378 | 0.14514 |
| Element Size Parameters | Value |
|---|---|
| Maximum element size | 0.00824 [m] |
| Minimum element size | 0.001 [m] |
| Maximum element growth rate | 1.13 |
| Resolution of curvature | 0.5 |
| Resolution of narrow regions | 0.8 |
| Mesh Elements | Relative Error | |
|---|---|---|
| 21,617 | 0.02097 | 0.0605 |
| 31,004 | 0.0221 | 0.0134 |
| 48,493 | 0.02251 | 0.0068 |
| 73,857 | 0.02282 | 0.00071022 |
| Fiber Length | 2 cm | 2 cm | 4 cm | 4 cm |
|---|---|---|---|---|
| Angle | 45 deg | 90 deg | 45 deg | 90 deg |
| 0.1092 | 0.0838 | 0.1231 | 0.08825 | |
| α | 1.984 | 1.98 | 1.977 | 1.966 |
| Angle | 2D % | 3D % |
|---|---|---|
| Angle | 2D % | 3D % |
|---|---|---|
© 2017 by the authors; licensee MDPI, Basel, Switzerland. This article is an open access article distributed under the terms and conditions of the Creative Commons Attribution (CC BY) license ( http://creativecommons.org/licenses/by/4.0/).
Share and Cite
Nita, B.G.; Allaire, R. On the Three Dimensional Interaction between Flexible Fibers and Fluid Flow. Fluids 2017, 2, 4. https://doi.org/10.3390/fluids2010004
Nita BG, Allaire R. On the Three Dimensional Interaction between Flexible Fibers and Fluid Flow. Fluids. 2017; 2(1):4. https://doi.org/10.3390/fluids2010004
Chicago/Turabian StyleNita, Bogdan G., and Ryan Allaire. 2017. "On the Three Dimensional Interaction between Flexible Fibers and Fluid Flow" Fluids 2, no. 1: 4. https://doi.org/10.3390/fluids2010004
APA StyleNita, B. G., & Allaire, R. (2017). On the Three Dimensional Interaction between Flexible Fibers and Fluid Flow. Fluids, 2(1), 4. https://doi.org/10.3390/fluids2010004