Article

Enhancement of Aerodynamic Performance of Two Adjacent H-Darrieus Turbines Using a Dual-Rotor Configuration

by
Douha Boulla
1,*,
Saïf ed-Dîn Fertahi
1,*,
Maryam Bernatchou
2,
Abderrahim Samaouali
1 and
Asmae Arbaoui
1
1
“Thermodynamics and Energy” Research Team, Energy Research Center, Physics Department, Faculty of Science, Mohammed V University in Rabat, 4 Avenue Ibn Batouta, BP 1014, Rabat 10000, Morocco
2
Physics Department, Team of Modeling and Simulation in Mechanics and Energetics (MSME), Faculty of Sciences, Mohammed V University in Rabat, 4 Avenue Ibn Batouta, BP 1014, Rabat 10000, Morocco
*
Authors to whom correspondence should be addressed.
Fluids 2025, 10(9), 239; https://doi.org/10.3390/fluids10090239
Submission received: 22 July 2025 / Revised: 25 August 2025 / Accepted: 5 September 2025 / Published: 8 September 2025
(This article belongs to the Topic Fluid Mechanics, 2nd Edition)

Abstract

Improvements in the aerodynamic performance of the H-Darrieus turbine are crucial to address future energy requirements. This work aims to optimize the behavior of two adjacent turbines through the addition of a dual H-Darrieus rotor. The first rotor is composed of three NACA 0021 blades, while the second comprises a single Eppler 420 blade. This study focuses on 2D CFD simulation based on the solution of the unsteady Reynolds-averaged Navier–Stokes (URANS) equations, using the sliding mesh method and k ω SST turbulence model. The simulation results indicate a 17% improvement in the efficiency of the two turbines integrating dual rotors, compared to the two isolated turbines, for α = 0°. Moreover, the power coefficient   ( C P ) reaches maximum values of 0.49, 0.42, and 0.40 for angles of attack of 30°, 25°, and 20°, respectively, at TSR = 2.51. Conversely, the selection of an optimal angle of attack allows the efficiency of the two H-Darrieus turbines to be increased. It is also shown by the results that the effect of stagnation is reduced and lift is maximized when the optimum distance between two adjacent turbines is chosen. Moreover, the overall aerodynamic performance of the system is enhanced by the potential of a dual-rotor configuration, and the wake between the two turbines is disrupted, which can result in a decrease in energy production within wind farms.

1. Introduction

To address the rising global demand for electricity, renewable energies are currently occupying an important place in energy politics, as they are environmentally friendly and help to reduce emissions of greenhouse gases. Among these energy sources, particular attention has been given to wind turbine technologies providing ecological and economic advantages due to their aerodynamic function, geometric design, and installation [1]. These wind turbines are classified into two main categories: horizontal-axis wind turbines (HAWT) and vertical-axis wind turbines (VAWT). There is currently growing interest in vertical-axis wind turbines for several reasons: they are better suited to turbulent winds, they require less infrastructure for orientation, they operate more silently, and their architecture makes them an attractive solution for energy production. These vertical-axis wind turbines (VAWTs) are mainly divided into two types: Darrieus and Savonius rotors. The Savonius rotor has a low power output, despite its simple design and high self-starting capability. On the other hand, the Darrieus rotor has high power and low self-starting capability [2].
Previous research has focused on improving the aerodynamic performance of the H-Darrieus rotor. Among these studies, we mention that of Eltayeb et al. [3], who improved the aerodynamic performance of urban wind systems integrated with solar shafts, using Plain Flaps (PFs) and Gurney Flaps (GFs) to modify NACA 0015 aerodynamic profiles through a CFD simulation and the URANS kω SST model. Their results show that the PF configuration of 0.6 c at 10° reduced negative torque, improved self-starting capability, and achieved the best power coefficient ( C P ) of 0.46 at TSR = 2.5, as well as a 9.8% increase over the NACA 0015 airfoil. Mohamed et al. carried out an analysis of vertical-axis turbines (VAWTs) using 2D CFD simulation, on 20 different airfoils, with the aim of maximizing torque and power coefficients [4]. Ferreira et al. [5] used the PIV method to visualize the flow on the upper surface of the airfoil for three TSR values. The analysis described separation vortices at the leading edge and released vorticity at the trailing edge. These results were used to assess the aerodynamic performance of the H-Darrieus rotor. Castelli et al. [6] presented a CFD analysis of a Darrieus vertical-axis micro-wind turbine. The validation was obtained in a wind tunnel through a systematic comparison between numerical simulations and experimental data. In Revanche, a statistical analysis of the y+ parameter was used to determine the optimal size of mesh elements next to the profiles and to optimize the accuracy of numerical performance prediction. Mohamed et al. [7] analyzed the performance of a three-bladed Darrieus turbine, adopting 20 profile types from various families and using CFD simulations based on the Reynolds-averaged Navier–Stokes equations. The results showed that the power coefficient of the turbine equipped with the LS (1)-0413 airfoil increased by 16% compared with the performance obtained with the NACA 0021 airfoil. El Baz et al. [8] investigated the effect of using a slotted profile versus the NACA 0018 profile on the performance and starting characteristics of the H-Darrieus rotor using CFD simulation. In this case, the analysis of the turbine’s aerodynamic behavior showed a 15% higher optimization compared with standard blades. Ma et al. [9] developed an automatic high-solidity airfoil optimization system to improve Darrieus turbine performance. Their results illustrate that this system provides a proven technique for generating optimal and suitable turbine airfoils to achieve robust energy efficiency. Ghaffari et al. [10] examined the impact of different cavity parameters (dimples) on the aerodynamic performance of the H-Darrieus rotor, employing computational fluid dynamics (CFD) and the k ω SST (shear stress transport) turbulence model. Their simulation results showed that wind turbine efficiency was improved by 18% and 25% when the cavity profile with an optimum TSR (TSR = 2.6) was used.
Regarding the use of dual rotors to improve VAWT aerodynamic performance, we cite Shen et al. [11], who used a model of a double Darrieus vertical-axis wind turbine (DD-VAWT) to increase the power coefficient while reducing the maximum instantaneous torque coefficient. The results of their CFD simulation reveal a significant improvement in the performance of the DD-VAWT at low TSR. Cheng et al. [12] proposed a two-Darrieus-turbine design (DDWTs) using a genetic expression programming (GEP) model. Their results indicate that this GEP model shows high accuracy, enabling an improvement in energy production of 7.5%. Ghafoorian et al. [13] examined the performance of the Darrieus vertical-axis wind turbine by integrating a Darrieus–Savonius hybrid rotor. Their simulation results show that the hybrid rotor performs better at a low TSR of 64% of the power coefficient, while the Darrieus rotor performs better at a high TSR. Abdel-razak et al. [14] studied the distance between turbine centers, configuration angles, rotation directions, and stall angle using the Taguchi optimization method in order to improve the performance of three Darrieus–Savonius hybrid turbines. The hybrid rotor can maintain performance equivalent to that of the isolated rotor up to a TSR of 4.1. To improve performance at low wind speeds, Kumar et al. [15] proposed a model of an adaptive hybrid Darrieus turbine (AHDT) based on the Reynolds-averaged Navier–Stokes (RANS) equations. Their objective was to analyze the impact of the Darrieus rotor diameter (DR) on the Savonius rotor (DT). The results of their CFD simulation indicate that an optimum DR/DT ratio of value 3 maximizes the power coefficient of the Darrieus rotor. Ghobadian et al. [16] proposed a new double-row wind turbine, combining J-shaped and conventional blades, using CFD simulation and Taguchi’s method to exploit both drag and lift forces. The turbine achieved a better maximum power coefficient value of 0.52 at low TSR. These results show that the adoption of a Darrieus-type double-row hybrid turbine optimizes the efficiency of vertical-axis wind turbines.
Several studies have addressed the optimization of Darrieus wind turbine efficiency. We cite Dessoky et al. [17], who analyzed the aerodynamic performance of two-blade Darrieus turbines with NACA 0021 airfoils, separated by a distance. Their results show that the second turbine achieves better performance if the first turbine operates at a high TSR. Omar Sherif et al. [18] showed that using several Darrieus turbines in near proximity to each other increases energy production and improves wake valorization. The results of their numerical CFD simulation, adopting the Actuator Line Method (ALM), showed that the ALM is a reliable, economical tool for accurately reproducing the flow field between vertical-axis wind turbines. On the other hand, Mao et al. [19] proposed two-turbine configurations with a spacing no lower than the turbine diameter. Their CFD results show an increase in the power coefficient with the number of turbines reaching 0.588 for a TSR of 3.0. Shaheen et al. [20] were interested in analyzing a Darrieus multi-turbine design with the aim of developing efficient vertical-axis wind farms. The CFD results of multi-turbine clusters enable the conception of an average power coefficient up to 30% higher than that of an isolated turbine. Li Zou et al. [21] presented two turbines aligned at variable distances. However, numerical simulations were conducted using the sliding mesh method coupled with Large Eddy Simulation (LES). The comparison with isolated turbines revealed a significant improvement in the power coefficient for both turbines. Mishra et al. [22] used CFD simulation and the Taguchi method, combined with analysis of variance (ANOVA), to identify the parameters influencing the starting performance of adjacent rotors. The data from their simulation indicate that downstream rotor 2 started faster than upstream rotor 1, showing an ability to self-start at an angular velocity of 57 rad/s and at a lower TSR.
The previously cited works have focused on improving the performance of the H-Darrieus wind turbine, either by using dual rotors or by combining several turbines. In our study, we evaluated the performance of an H-Darrieus wind turbine using both dual rotors and two turbines, which represents the originality of our work. Two-dimensional CFD simulations have been carried out on the two adjacent wind turbines, each comprising dual rotors with a different number and type of aerodynamic profiles. The first rotor, situated in the interior of the H-Darrieus wind turbine, is equipped with three blades of the NACA 0021 profile. The second, situated on the exterior, upstream of the first, is equipped with a single blade of the Eppler 420 profile, which was chosen to be added to the wind turbine due to its remarkable performance [23]. This second rotor acts as a curtain, minimizing the negative impact on the flow around the interior rotor, reducing mechanical complexity, and decreasing aerodynamic drag during rotation. The objective of this analysis is to increase the energy yield of two adjacent H-Darrieus wind turbines incorporating a double rotor system, with the aim of improving turbine efficiency and overall field production. These two turbines are separated by different distances, namely 1.6D, 2.4D, 3.2D, 4D, and 4.8D, in order to determine the optimal distance that minimizes performance losses due to interaction effects. The analysis also includes variations in certain geometric parameters such as chord, angle of attack, and azimuth angle. The CFD simulation model was validated by comparing it to the work of Castelli et al. [24] and Islam et al. [25], through a comparative analysis of power coefficients as a function of TSR. To this end, the results were visualized through the power coefficient, moment coefficient, drag, and lift, as well as the magnitude velocity distribution, pressure, and turbulent kinetic energy. In addition, these analyses confirm that a dual-rotor turbine optimizes system performance compared with an isolated configuration. This improvement also contributes to enhancing wind distribution and stability between two adjacent turbines.

2. Methodology

2.1. Geometrical Model

A three-bladed H-Darrieus VAWT device has been adopted in our study, based on the configuration proposed by Castelli et al. [24], with the aim of assessing the reliability of the results obtained by CFD simulation. The study domain proposes a model composed of two adjacent turbines to which we have added another rotor to improve their performance, as illustrated in Figure 1. Table 1 shows the geometric characteristics of the H-Darrieus dual rotors. Each turbine integrates dual rotors, the first of which is composed of three NACA0021-type airfoils with a blade chord length c = 0.0858 m, a diameter (L) of 1.030 m, a height (h) of 1.456 m, and a solidity ( σ ) of 0.5. In contrast, the second rotor is composed of a single Eppler 420-type airfoil, presenting a blade chord length c = 0.30 m and a diameter (D) of 1.25 m; the trailing edge of the blade has been modified as illustrated in Figure 2e by connecting the top and bottom surfaces of the three airfoils with by a straight line of 0.38 mm, to avoid the generation of mesh elements. The study considers blade azimuth angles θ   equal to 45°, 90°, 135°, 180°, and 225° for the first rotor and 60°, 120°, 180°, 240°, and 300° for the second rotor to enhance the performance of the two H-Darrieus vertical-axis aerodynamic turbines, accelerating airflow, increasing stability, reducing drag, improving wind interaction between the two turbines, and minimizing energy losses. The approach of using the Eppler 420 airfoil in the second rotor has been chosen because of its adequate advantages over H-Darrieus turbines, in particular, its low thickness and better efficiency at different velocities, enabling lift ( C l ) and drag ( C d ) coefficients to be maintained even when the angle of attack α is increased [26].

2.2. Computational Domain and Boundary Conditions

The present study used CFD simulation to evaluate the aerodynamic performance of the turbines while analyzing the air flow around the dual rotors. Here, 2D rather than 3D modeling was adopted because of its optimized computational cost, and this allows for obtaining sufficient results with an acceptable error, provided that the three-dimensional phenomena have little influence on the studied quantities. As the average velocity or the pressure varies little according to the ignored dimension of space, the 2D simulation becomes relevant and does not affect the accuracy of the solution [27]. The computational domain is shown in Figure 1 and is separated into two zones: a rotating zone in the form of a cylinder that includes the three blades of the first rotor and a single blade of the second rotor of the two turbines, and a stationary zone in the form of a rectangle delimited by interfaces and generated by ANSYS R1, 2022 software [28]. At the inlet, the length is 5 m from the center of the turbine, and at the outlet, it is 15 m. The width is fixed at 12 m. In addition, the boundary conditions are expressed as follows: free stream velocity flow U = 9 m/s at the inlet and atmospheric pressure at the outlet. Symmetry boundary conditions are applied to the upper and lower parts of the domain. The fluid employed in this work is air with a density (ρ) of 1.225 kg/m3, at a temperature of 300 K, a dynamic viscosity (μ) of 1.7894 × 10 5 kg/m.s, and a turbulence intensity of 5%. The sliding mesh (SM) technique was exploited to simulate the rotational motion of the H-Darrieus dual-rotor-equipped turbine in the unsteady regime [29,30]. Non-slip interaction conditions were used at the interfaces and blade surfaces of the dual rotors [31].

2.3. Mesh Generation and Grid Independence

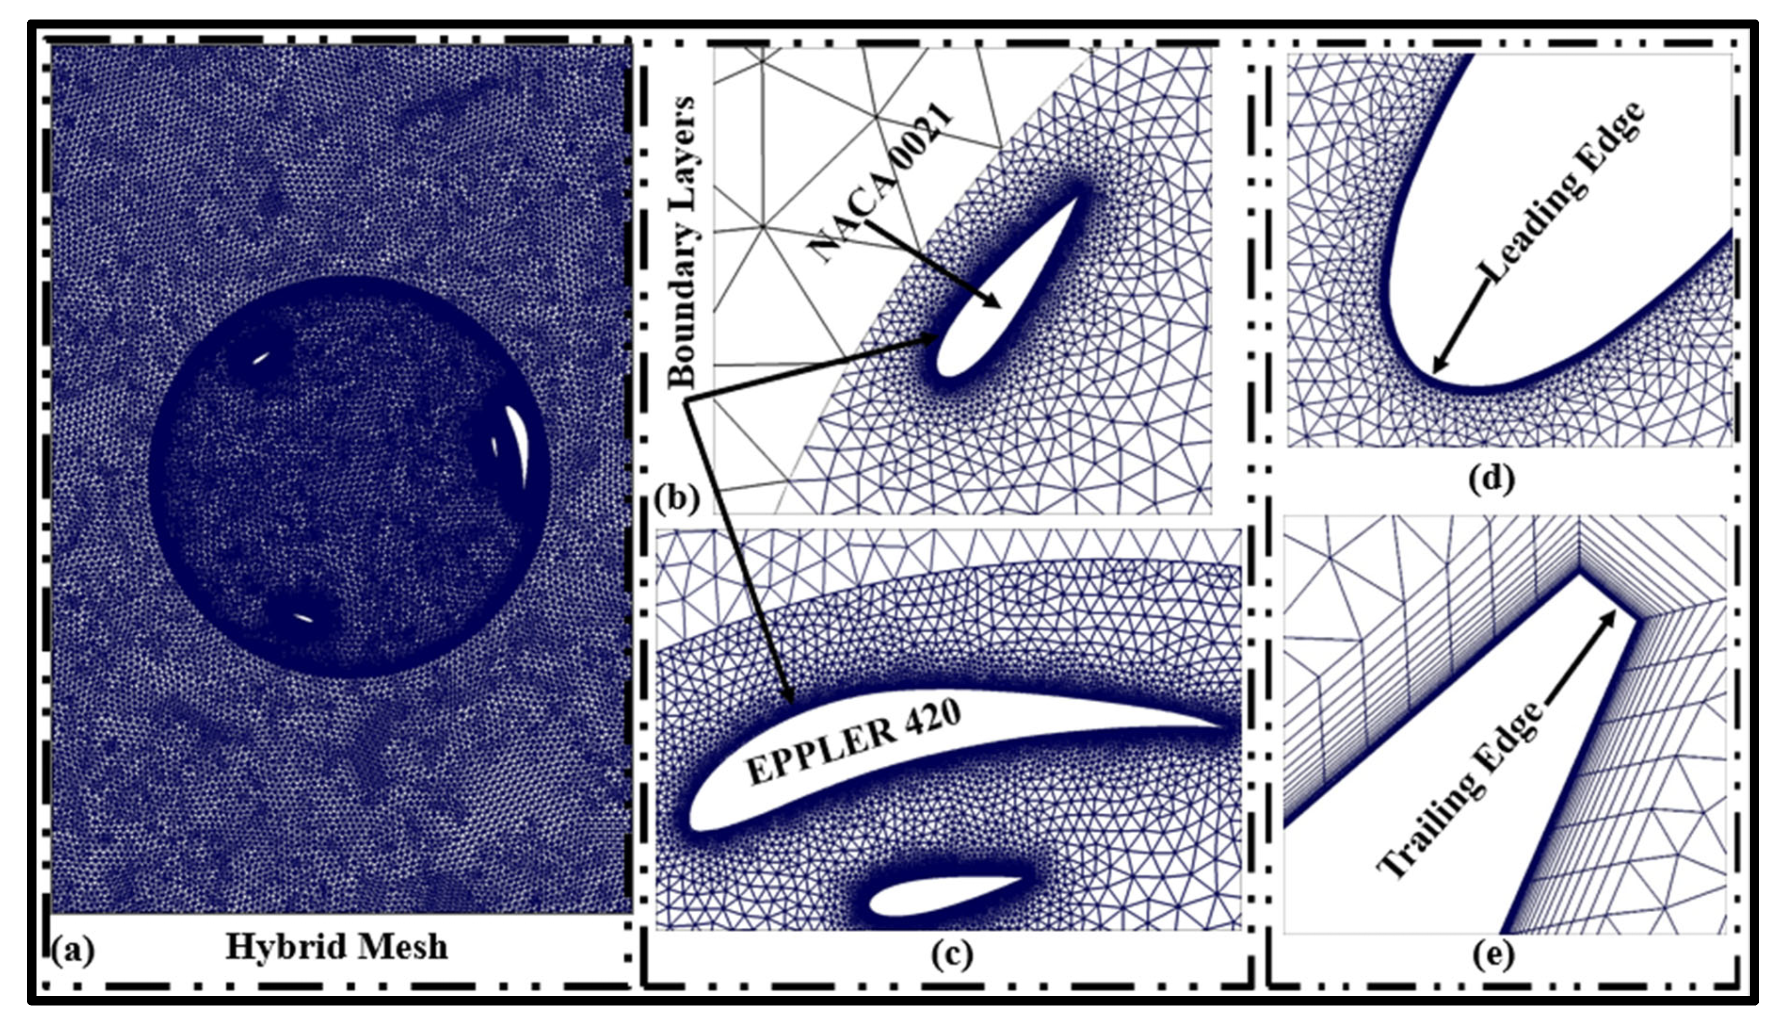
To achieve accurate results, it is necessary to focus on the spatial discretization of the computational domain. Figure 2 shows the mesh distribution around the dual rotors, including the two airfoils (NACA 0021 and Eppler 420). However, a hybrid mesh (quadrilateral and triangular) has been used throughout the entire surface of the dual rotors for the two H-Darrieus turbines, using ANSYS Workbench R1, 2022 software. Specifically, finely meshed quadrilateral structured elements are used carefully for boundary layer meshing, and in rotating and stationary regions, unstructured triangular grids are adopted for the system because of their capacity to stabilize flow abruptness and minimize the number of mesh elements. On the other hand, a well-refined and highly accurate mesh was selected for the domain to capture the complex behaviors of the aerodynamic flow around the Darrieus turbines and ensure a balance between mesh quality near the walls and solution reliability, while managing computational costs [32].
The k ω SST turbulence model was adopted, which suggests a y+ range between 1 and 5. In our study, we fixed y+ at 1 to obtain adequate accuracy and estimate the first near-wall layer [33]. In addition, the mesh boundary layer was induced with 25 cell layers and a cell growth ratio of 1.2 for both rotors. Reynolds numbers of around Re = 6.3 × 10 5 and Re = 7.7 × 10 5 were calculated for this work based on the diameters of the first and second H-Darrieus rotors, respectively. The mesh is particularly fine near the walls, as can be observed in Figure 2. Furthermore, the major difference between these mesh types lies in the size of the grid around the blades. The minimum grid thicknesses are 2.4 × 10 4 m, 1.1 × 10 4 m, and 3.7 × 10 5 m, equivalent to coarse, medium, and fine meshes, respectively, in order to ensure that flow phenomena are appropriately modeled.
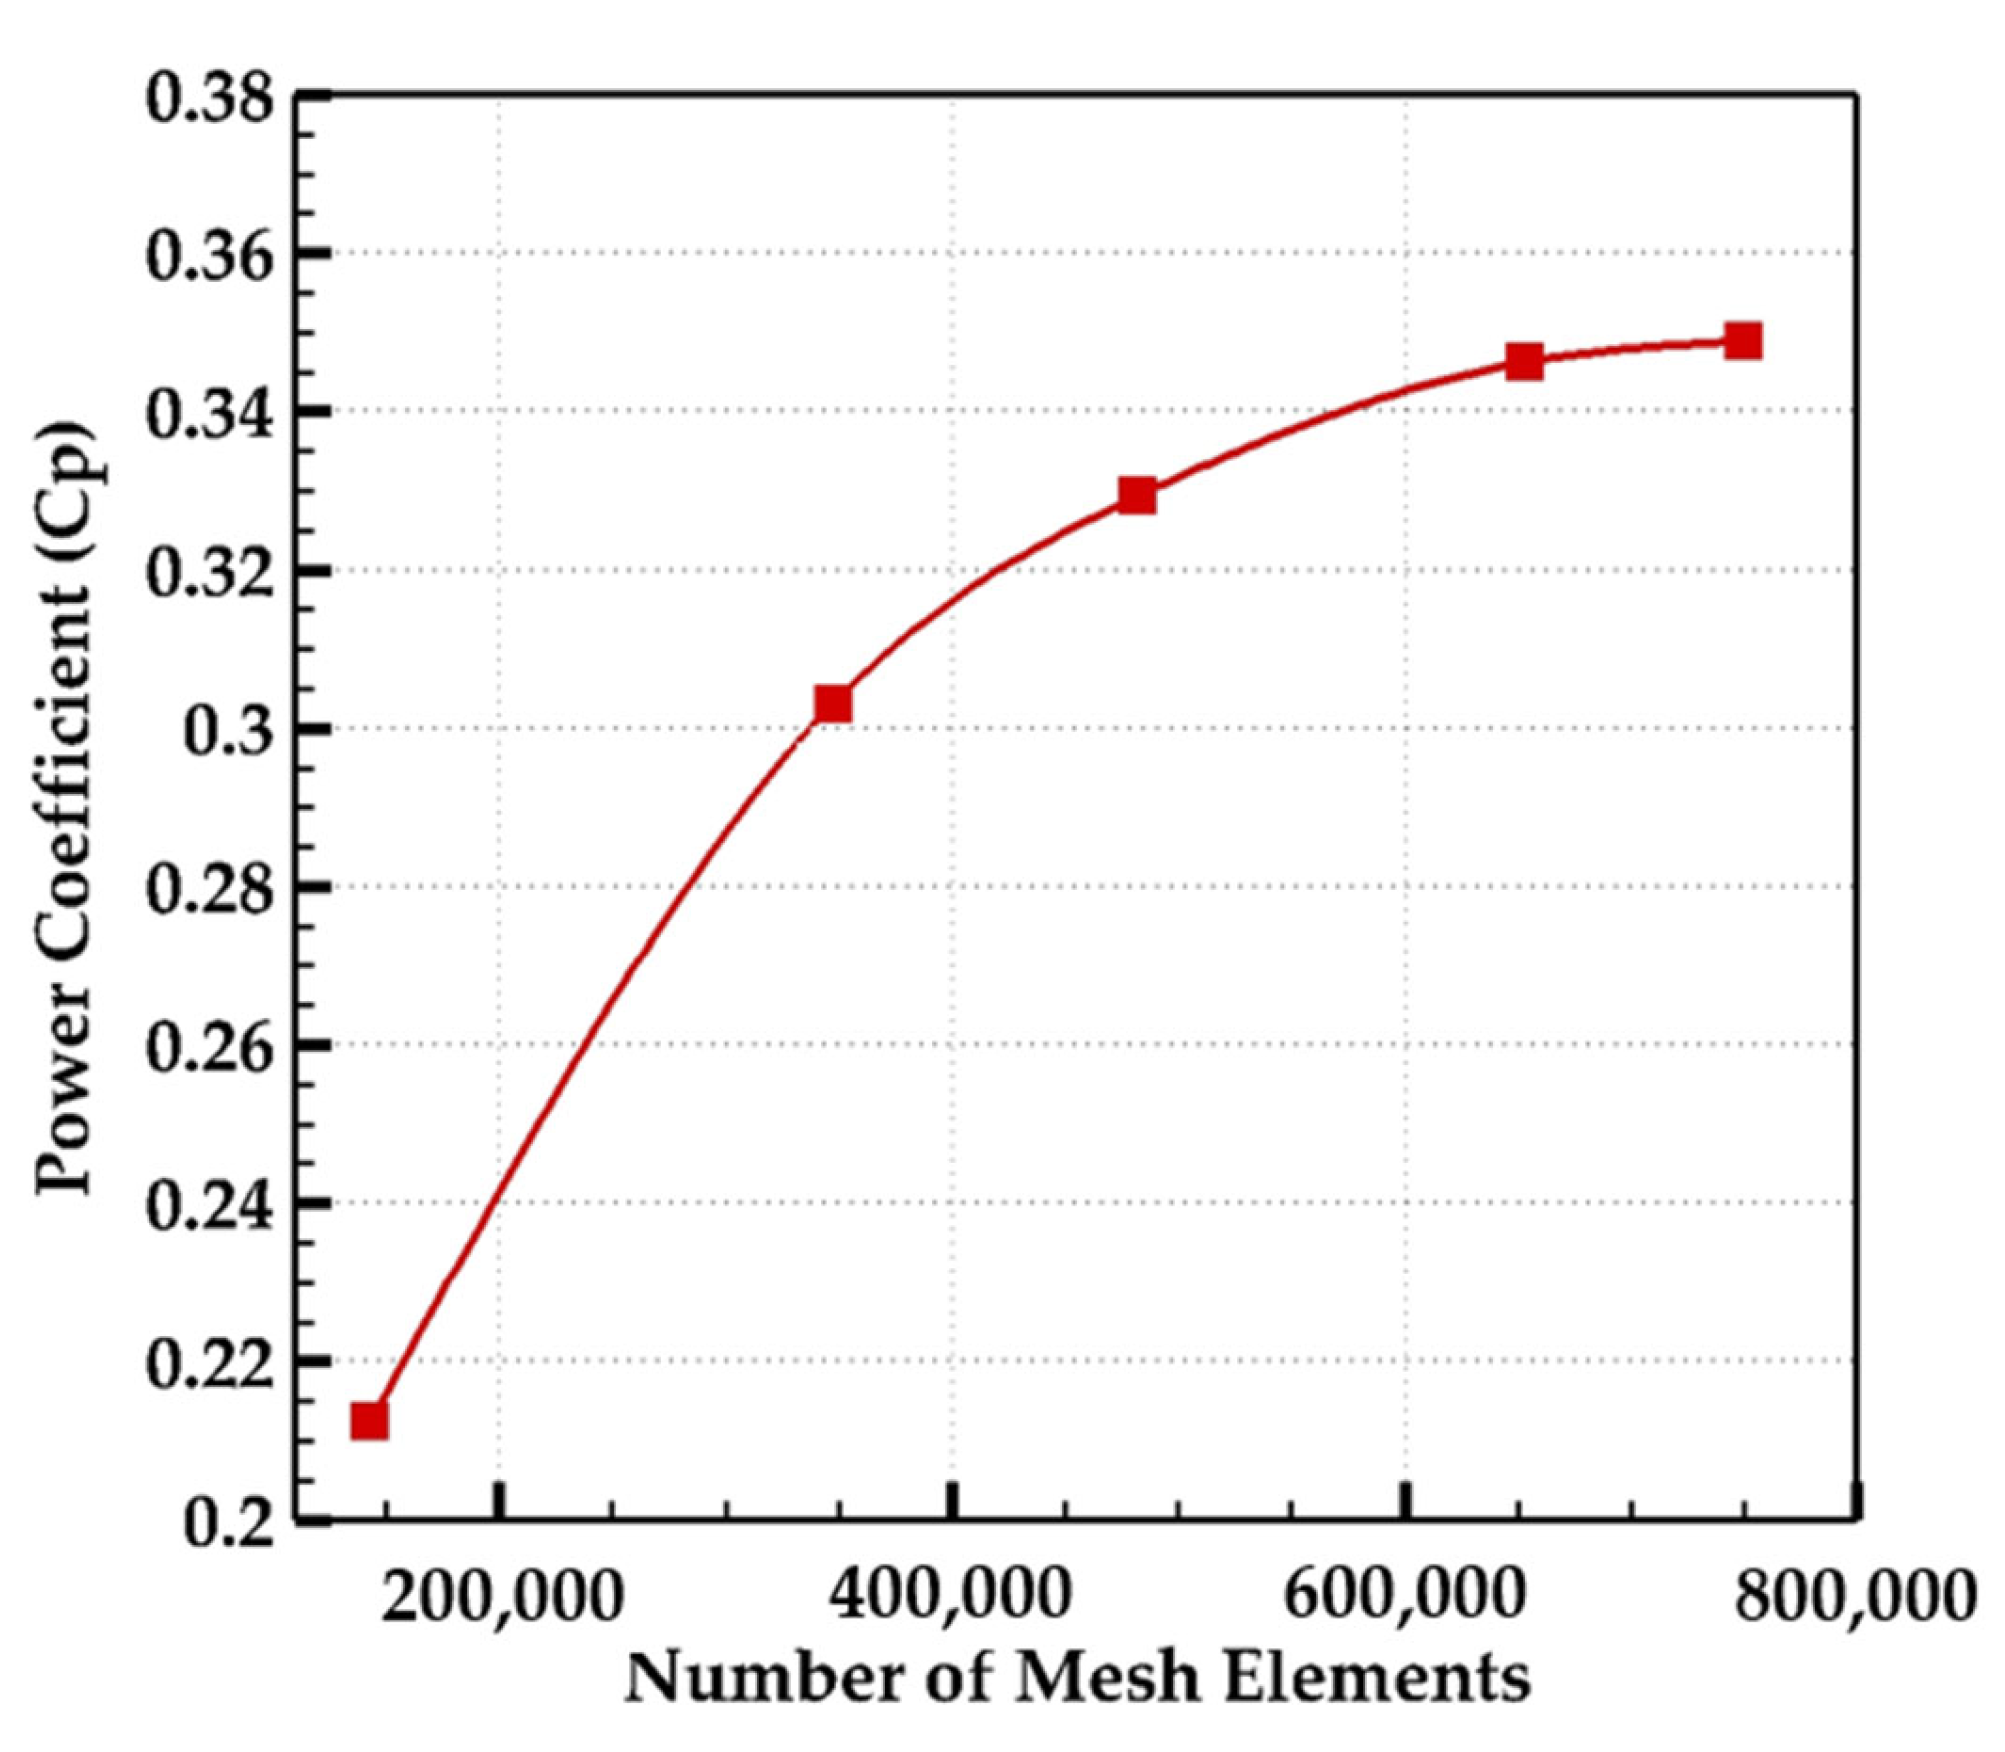
Figure 3 illustrates the variation in the power coefficient ( C P ) as a function of the number of elements for a tip speed ratio (TSR) of 2.51. In addition, when analyzing evolutions in   C P , a difference was found between a medium mesh and a fine mesh, with a maximum variation of 0.92%. A sensitivity evaluation was conducted to determine the independent grid for a 2D turbine, using the following five meshes: 123,000, 347,500, 482,123, 653,200, and 750,140 elements. It can be observed that the power coefficient increases with the number of mesh elements from 123,000 to 653,200 elements and then becomes almost constant above 653,200 elements. Consequently, at the value of 653,200 elements, the coefficient stabilizes, and the solution becomes grid-independent from this value onwards.

2.4. Solver Settings

The present work adopted CFD numerical simulation to study the aerodynamic flow around the dual-rotor-containing turbine, using the URANS approach for 2D incompressible flow with Ansys Fluent software. This approach offers higher efficiency and lower computational cost than other models. In addition, a k ω SST turbulence model was used to solve the Navier–Stokes equations; this model is better suited to analyzing air flow around dual H-Darrieus turbine rotors due to its performance in solving complex boundary layer problems. The sliding mesh technique was used to simulate the rotational domain of the H-Darrieus wind turbine, while ensuring better resolution of the dynamics and minimizing computation time [34]. The SIMPLE algorithm was applied to solve the velocity and pressure coupling, associated with a second-order upwind scheme for the spatial discretization of the URANS equations and the first-order scheme for the temporal discretization, in order to obtain a more reliable prediction and to achieve accurate CFD simulation of velocity, pressure, momentum, kinetic energy, and turbulence. In the CFD studies applied to the H-Darrieus turbine, the classical method used to define the time step was based on the fixed rotation velocity ( ω ) expressed in (rpm) and calculated a time step (Δt) that captured an elementary degree of rotation of the turbine blades. On the other hand, the following time steps corresponding to 1° of elementary blade rotation were used: 5.87, 4.87, 4.29, 3.96, 3.84, 3.22, and 3.03 × 10 4   s . This value of 1 degree was adopted on the basis of the simulations carried out [24,35]. An internal number of iterations (100) was used in order to maintain the residual convergence criterion for each physical time step was set to 10 4 . In addition, a Y + value of 1 was chosen to ensure optimal accuracy of the viscous boundary layer near the wall.

3. URANS Equations

3.1. Mass and Momentum Equations

The fluid around the airfoils is considered incompressible and unstable, and is described by the URANS equations, conservation of mass and momentum, utilizing the sliding mesh technique and k ω SST turbulence model. These equations are represented as follows [36,37]:
The URANS mass conservation equation:
u ¯ i x i = 0
The URANS momentum conservation equation:
( ρ u ¯ i ) t + ( ρ u ¯ i u ¯ j ) x j = p ¯ x i + x j μ e f f u ¯ i x j + u ¯ j x i
The effective viscosity:
μ e f f = μ + μ t
where ρ represents the fluid density, u ¯ i denotes the time-averaged velocity in the i th direction, x i is the coordinate in the i th direction, p ¯ indicates the time-averaged pressure, μ t is the turbulent viscosity, and μ is the molecular viscosity.

3.2. Sliding Mesh Technique

The sliding mesh technique was employed to accurately simulate the interaction between the stationary and rotating fluid zones of the H-Darrieus rotor. This method requires an unsteady (transient) computation, generating time-dependent results rather than time-averaged values. Despite this, a difference in meshing at the interface between the turbine and the tunnel was explained by the fact that each area is meshed independently according to its geometric and simulation constraints. To ensure the continuity of physical quantities, particularly velocity and pressure, between the two domains, the solver performs data interpolation at the interface, which can introduce a slight loss of accuracy. Despite this difference, good results were observed, provided that a fine, good-quality, and well-adapted mesh is selected. The integral form of the equation can be expressed as follows [38]:
d d t V ρ ϕ d V + V ρ Φ u u g d A = V Γ Φ d A + V S ϕ d V
where ρ is the air density, u   is the flow velocity, u g is the mesh moving velocity, Γ is the diffusion coefficient, and S ϕ is the source term of Φ .
The time derivative term in Equation (4) is formulated as shown in Equation (5) below:
d d t V ρ ϕ d V = [ ρ Φ V n + 1 ρ Φ V n ] Δ t
where n and (n + 1) denote the quantity at the current time level tn and the next time at tn + 1, respectively. The volume of the temporal level (n + 1), V n + 1 , is calculated from Equation (6) [39].
V n + 1 = V n + d V d t Δ t
where d V d T is the volume time derivative.
The temporal rate of change in cell volume is zero, and Equation (6) can be simplified to Equation (7) [39].
V n + 1 = V n
Equation (5) is therefore transformed into Equation (8) [40].
d d t V ρ ϕ d V = ρ Φ n + 1 ρ Φ n V n Δ t

3.3. SST K-Omega Turbulence Model

To calculate the flow in the near-wall region, the k ω shear stress transport (SST) turbulence model was used. This hybrid model combines two models: the turbulent kinetic energy k and the specific dissipation rate ω, which are obtained from the transport Equations (9) and (10), respectively, according to the proposals of [40,41]:
( ρ k ) t + ρ k u ¯ j x j = x j μ + σ K μ t k x j + P k β ρ ω k
( ρ ω ) t + ρ ω u ¯ j x j = x j μ + σ ω μ t ω x j + γ ρ μ t P k β ρ ω 2
The constants σ K , σ ω , β , γ , and β are model coefficients, and P k represents the turbulence production.
The turbulent viscosity is defined using Equation (11) detailed in [42].
μ t = ρ k ω 1 max 1 / α , S F 2 / a 1 ω
where S is the magnitude of the strain rate and α is defined in Equation (12).
α = α α 0 + R e t / R k 1 + R e t / R k
where Re t = ρ k μ ω ; R k = 6 ; α 0 * = β i 3 ; β i = 0.072 ; and when the Reynolds number of the k ω model is high, α = α * = 1 [43].
F 2 = t a n h 2 2
and
ϕ 2 = max 2 k 0.09 ω k , 500 μ ρ y 2 ω
where y is the distance to the next surface.

3.4. Performance Indicators

The tip speed ratio (TSR) presents the ratio between the product of the ω angular velocity and the R radius of the turbine and the free stream velocity flow designated by U , and it is represented by the following equation, Equation (15) [44,45]:
T S R = ω R U
The simulation is carried out for tip speed ratios (TSRs) between 1.7 and 3.3. This is achieved by fixing the incoming free stream velocity flow at (9 m/s) while varying the azimuth angle rotor ( θ °) and angle of attack ( α °) for the dual rotors, as shown in Equation (15).
Several papers focus on numerical and experimental analyses aimed at optimizing and approximating the power coefficient ( C P ) to the Betz limit of 60%. In addition, the torque coefficient ( C m ) is a coefficient of performance that measures the rotor’s ability to transform incoming wind energy into mechanical torque [46,47].
The performance indicator can be represented by the following equations, Equations (16) and (17) [48].
C m = M t 0,5 ρ U 2 A R
C P = P t 0,5 ρ U 3 A   = T S R × C m
A is the section covered by the wind, M t is the rotor torque indicator, and P t is power.

4. Results and Discussion

4.1. Validation

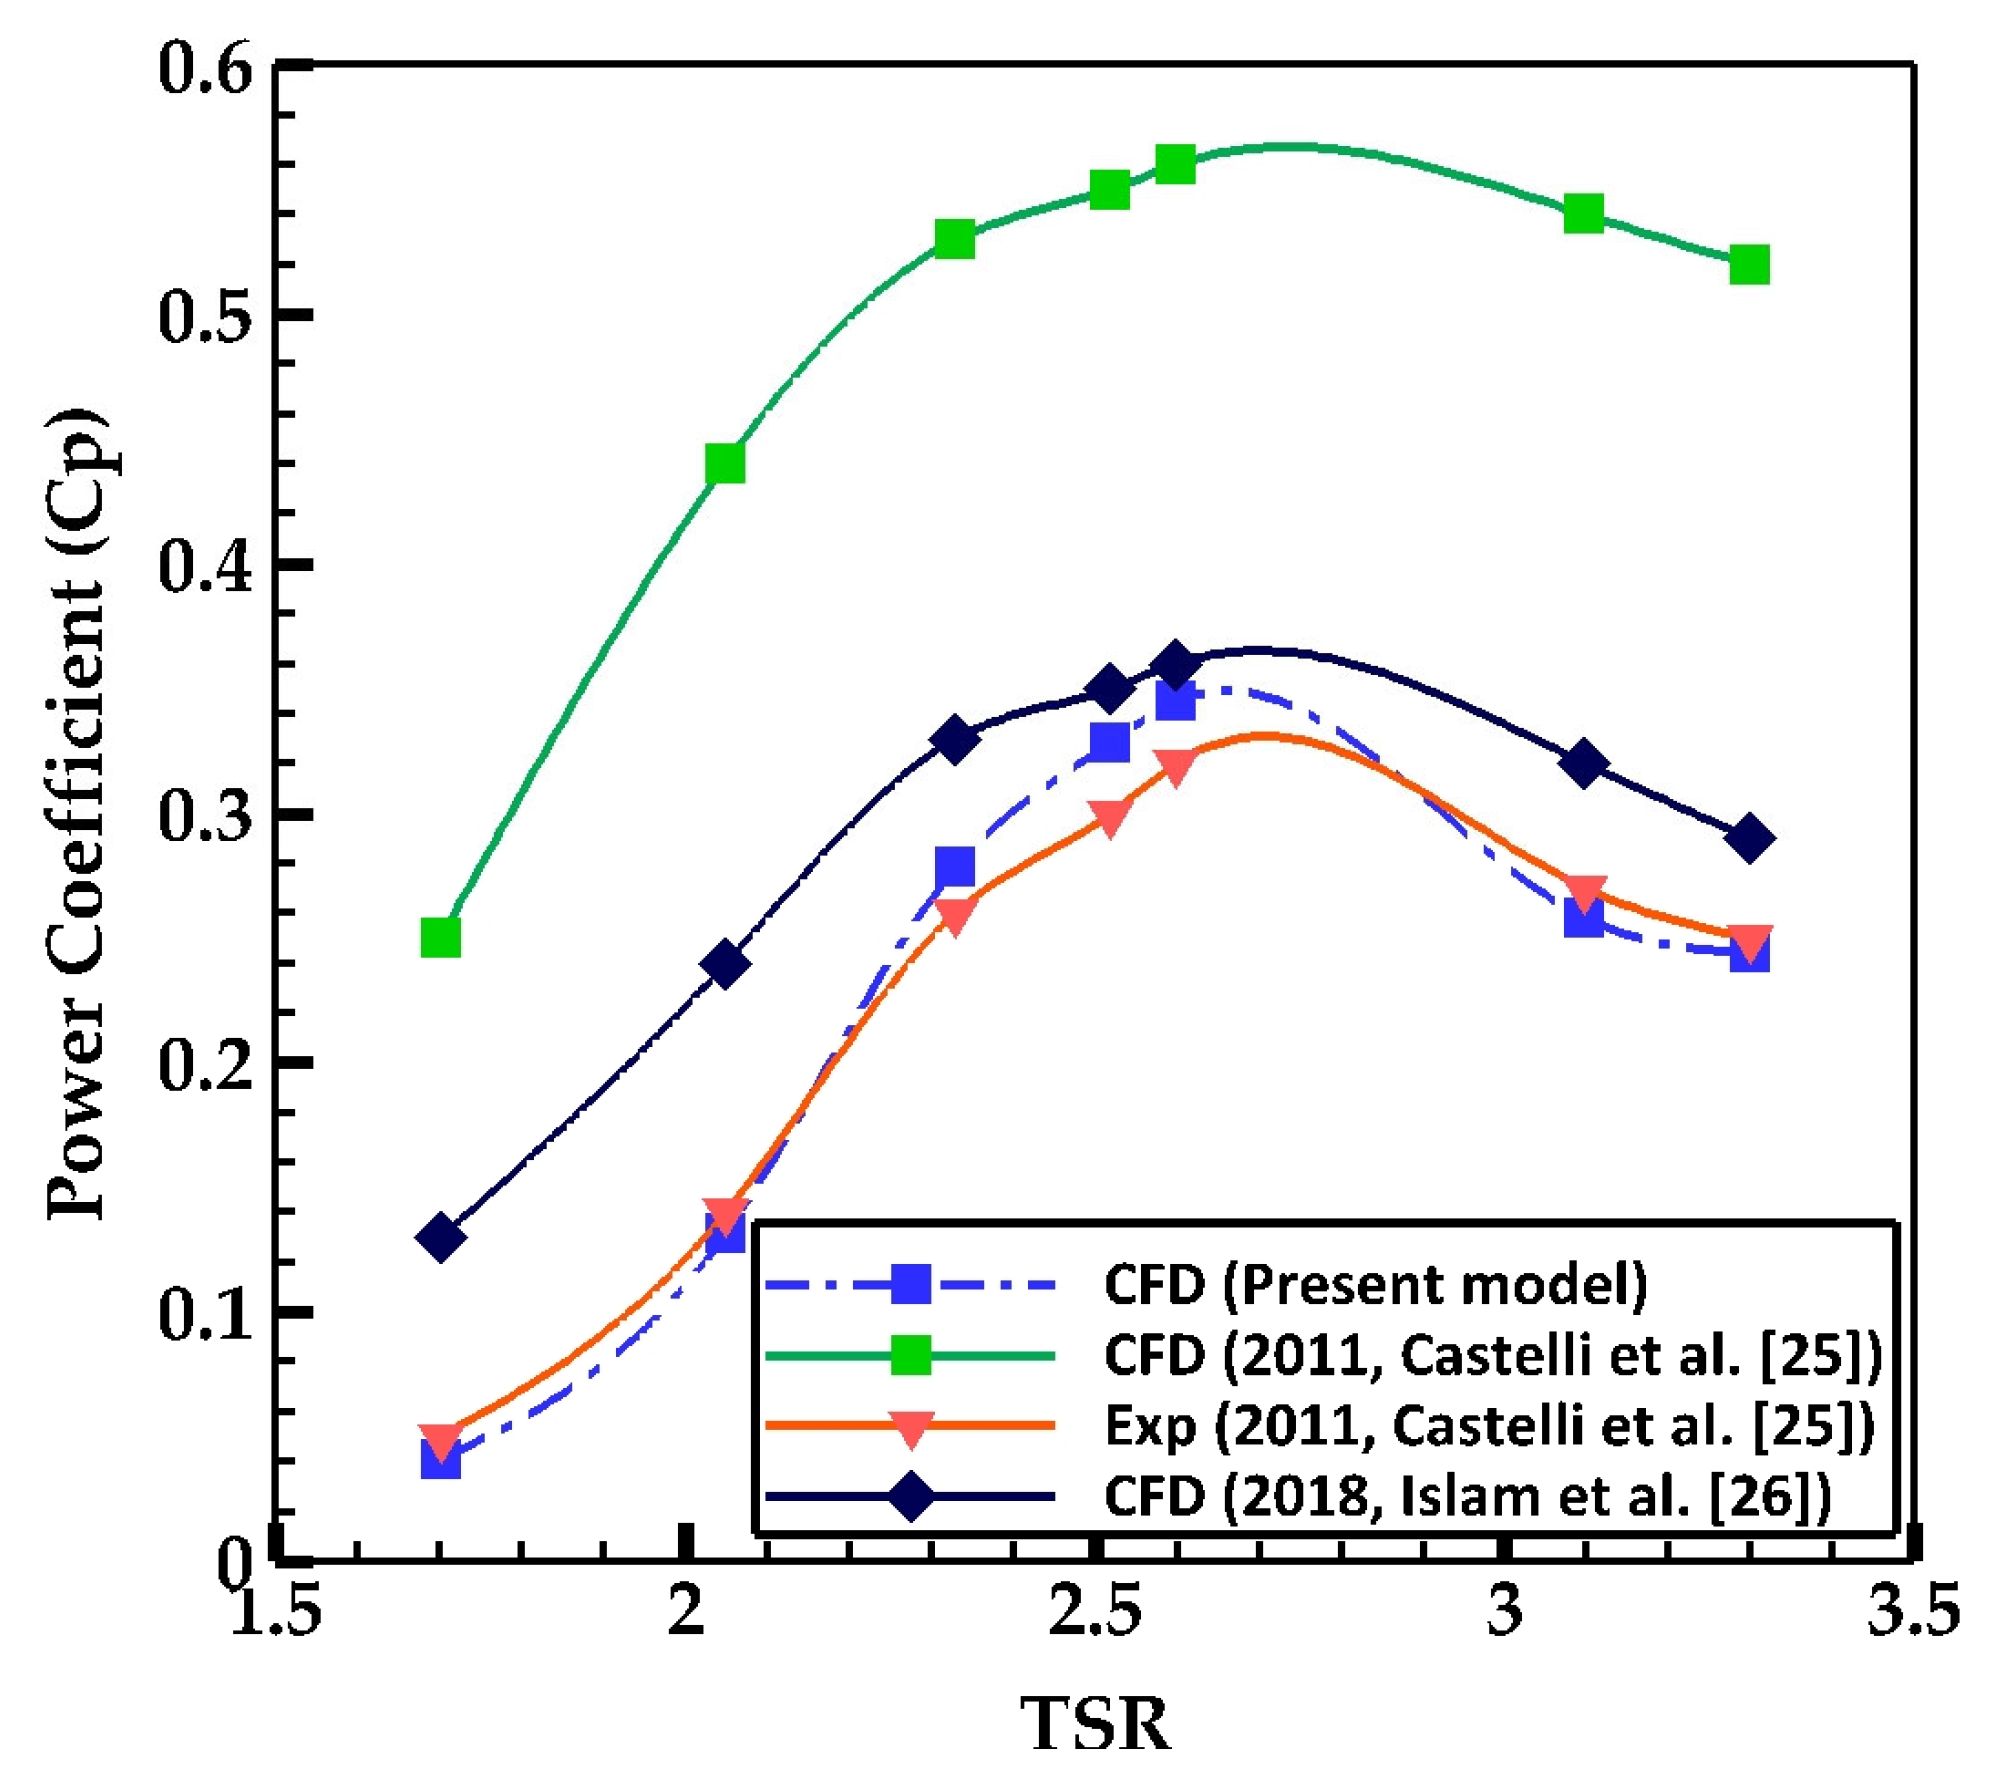
Validation of our 2D CFD simulation model is carried out by comparing the results obtained with those of the experimental study and CFD simulation carried out by Castelli et al. [24], and also with the CFD simulation results of Islam et al. [25]. The studies by Castelli and Islam are both based on a vertical-axis wind turbine (VAWT) with an H-Darrieus rotor.
The geometric conception is represented by a wind turbine equipped with three blades of aerodynamic profile NACA 0021 and having different characteristics, including a chord length of c = 0.0858 m, a diameter of 1.030 m, a height of 1.456 m, and a strength of σ = 0.5, with a free stream velocity flow of U = 9 m/s and a turbulence intensity of 5%. The study is carried out using the sliding mesh method and the k ω SST turbulence model, which is distinguished by a superior ability to characterize airflow separation.
Figure 4 reveals the variation in the power coefficient ( C P ) as a function of different TSR values, namely 1.70, 2.04, 2.32, 2.51, 2.6, 3.09, and 3.3, for our study and that of Castelli (experimental and CFD simulation) and Islam (CFD simulation). The results are compared using the relative error (RE) method, which consolidates the power coefficient ( C P e x p , i ) obtained experimentally from Castelli et al. [24] and the power coefficient ( C P s i m , i ) determined by numerical simulations. This is expressed by the following equation, Equation (18) [28]:
R E = 1 n i = 1 n C P e x p , i C P s i m , i C P e x p , i × 100
Furthermore, Castelli et al. [24] indicate a relative error of 20% for CFD simulation, while our CFD study presents a relative error of 7% for C P = 0.34 at TSR = 2.6, and Islam et al. [25] reveal a relative error of 16%. We can deduce that the C P values we obtained are closer to those obtained by Castelli using an experiment. We therefore concluded that our 2D CFD configuration is appropriate for realizing a parametric study with the aim of improving the aerodynamic performance of the two turbines integrating dual rotors.

4.2. Parametric Study Analysis

4.2.1. Analysis of Power and Torque Coefficients

This work highlights the potential of the two H-Darrieus turbines in dual rotors and in two different aerodynamic profiles, in order to reduce energy losses and maximize the aerodynamic performances of the two turbines.
Figure 5a illustrates the variation in the coefficient of performance as a function of TSR, comparing the dual H-Darrieus rotors of the turbine. From this figure, we can observe that the coefficient of performance ( C P ) takes on maximum values equal to 0.34 and 0.38 for a tip speed ratio (TSR) equal to 2.6 for the dual rotors. Then, we observe a decrease in power coefficients when TSR values are between 3.09 and 3.3 for α and θ equal to 0°. On the other hand, the second rotor of the Eppler 420 airfoil has maximum C P , reflecting that it offers around 12% improvement over the NACA 0021 airfoil in turbine performance. Other studies also confirm the use of a dual-rotor wind turbine to optimize energy efficiency at a low tip speed ratio (TSR). In addition, this configuration offers a better capacity to predict an optimal power coefficient, which is a significant advantage for aerodynamic conception and performance maximization [11,12].
A comparative analysis of the moment coefficient ( C m ) as a function of angle of attack is shown in Figure 5b for the dual rotors including the NACA 0021 and Eppler 420 airfoils. For each of these profiles, moment coefficient values are presented for four angles of attack, namely   α = 0°, α = 14°,   α = 28°, α = 42°, and   α = 56°, and at an optimum TSR equal to 2.51. For the NACA 0021 profile, the moment coefficient ( C m ) increases with increasing angle of attack throughout the interval, taking a maximum value equal to 0.19 for α = 42° and a minimum value of 0.11 when α = 56°. On the other hand, for the Eppler 420 profile, the C m values reveal a different variation from that observed for the NACA 0021 profile. The maximum moment coefficient of C m = 0.17 is observed at α   = 42°, while its minimum value reaches 0.13 and is found at α = 56°. In this case, the values of the moment coefficient C m initially increase with the angle of attack until   α = 14° is reached and then decrease slightly at α = 28°, after which they increase to attain their maximum at   α = 42° and then begin to decrease until α = 56° is reached.
For the same values of α and for a TSR equal to 2.51 for the two profiles, we emphasize a difference in rotor performance for a certain value of angle of attack. As an example, the Eppler 420 profile shows an initial increase in C m , followed by a decrease at α = 28° before a further increase to reach maximum performance and then a decrease for high angles of attack due to flow separation, which causes a rapid decrease in the moment coefficient and results in a loss of stability around the profile. This requires specific angles of attack to optimize energy recovery. For the NACA 0021 profile, C m generally increases for all α values, reaching its maximum optimization, and then decreases more steeply than the Eppler 420 profile for angles of attack that are excessively high. This difference highlights the influence of angle of attack on rotor performance. In any case, the two profiles reach the same maximum value of   C m .
The impact of choosing a second rotor with a single Eppler 420 profile blade lies mainly in reducing mechanical complexity, manufacturing costs, and aerodynamic drag during rotation, which can improve efficiency, especially at low velocities. This rotor has been moved upstream of the first rotor, which is located inside the turbine, to ensure optimal balance and easy start-up. However, we can conclude that the second rotor gave rise to the first rotor, with the aim of achieving a more efficient H-Darrieus configuration in order to maintain sustainable energy productivity. This configuration far surpasses conventional Savonius–Darrieus hybrid designs, as well as the single-rotor H-Darrieus design [49,50].

4.2.2. Effect of Dual-Rotor Integration on the Performance of Two Turbines

The parametric study focuses on optimizing the aerodynamic performance of the two H-Darrieus turbines, and this is achieved by focusing on the effect of the dual rotors with different types and numbers of airfoils on the efficiency of the H-Darrieus turbines, operating at a free stream velocity flow U = 9 m/s, and applying the sliding mesh method.
A dual-rotor configuration was considered in order to reduce the effects of aerodynamic interaction between two adjacent synchronized turbines, which mainly influence each other through the wind turbulence generated between them. These interactions, particularly through the wake effect, can significantly reduce the performance of turbines located close to each other. The first rotor, located inside the turbine, has three blades. The second, located outside, has a single blade. The second rotor not only optimizes energy recovery, but also generates a less concentrated and therefore less perturbing wake around the first rotor downstream.
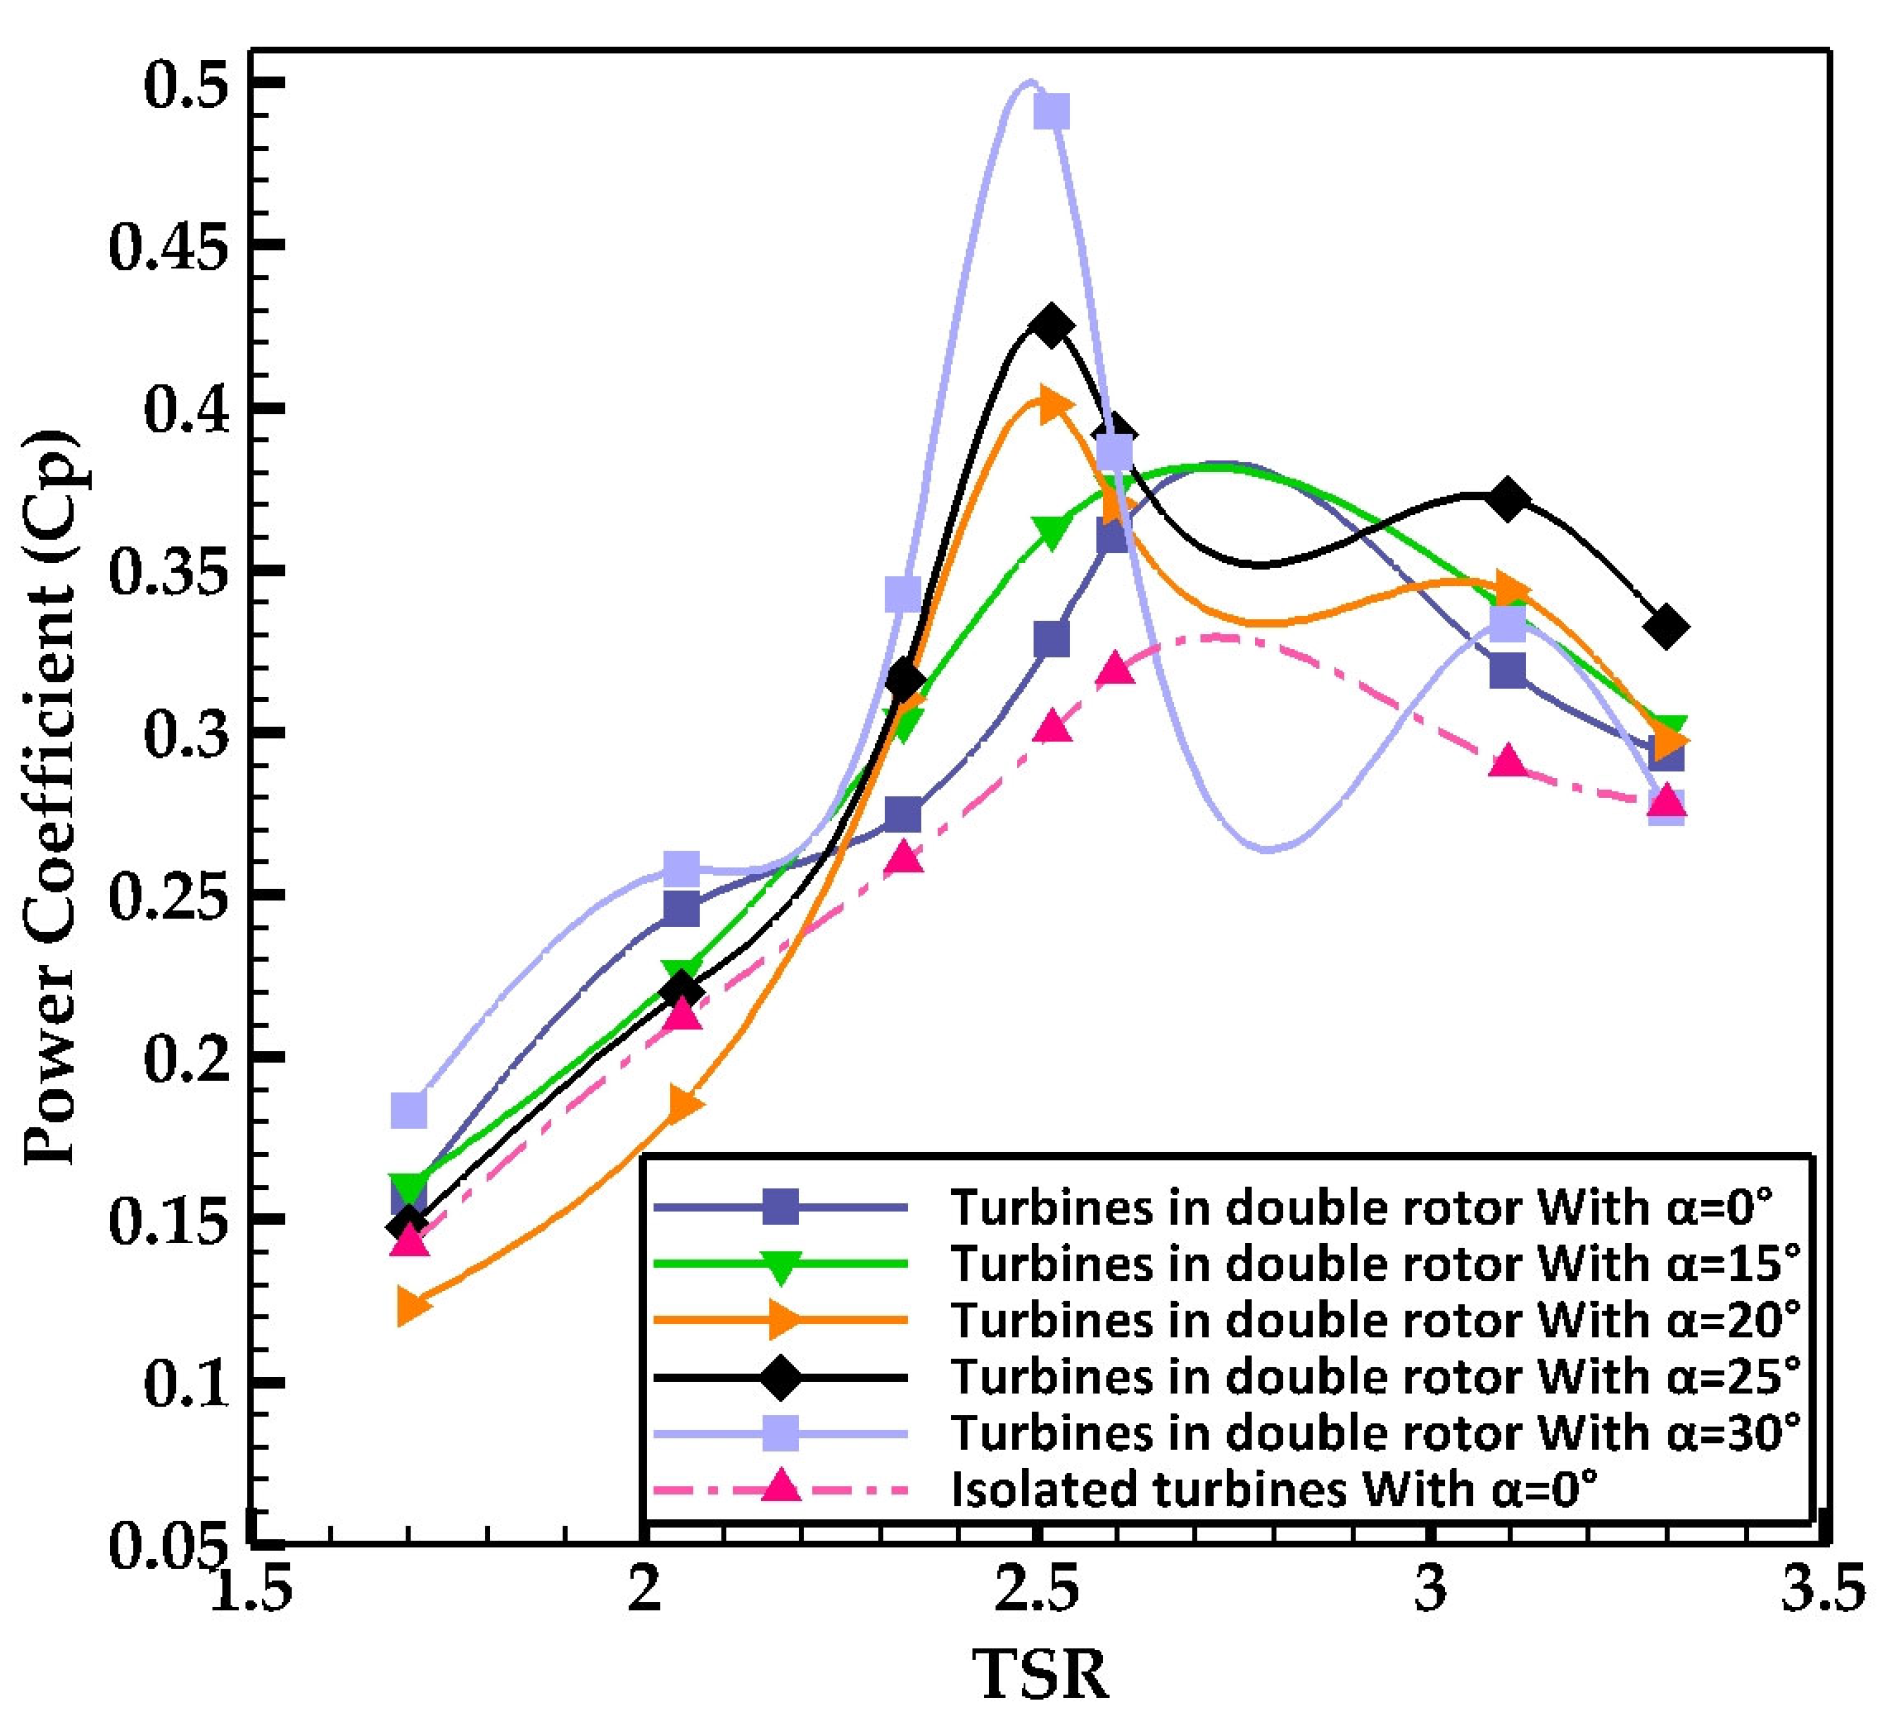
Figure 6 shows the variation in the power coefficient as a function of the tip speed ratio (TSR) achieved for two turbines with dual rotors; one has three NACA 0021 airfoil blades with a chord length equal to 0.0858 m, while the other has a single Eppler 420 airfoil blade with a chord length of 0.30 m at θ = 0°, with two isolated turbines comprising only the first rotor with a fixed angle of attack of 0°. The dual-rotor turbines have a variable angle of attack with values of 0°, 15°, 20°, 25°, and 30° associated with the dual rotors. This figure shows that C P   takes on the maximum values for tip speed ratios (TSRs) equal to 2.51 and 2.6, for all angles of attack. Beyond this, for TSR values between 3.09 and 3.3, power coefficients tend to decrease. Analytically, the minimum power coefficient value of 0.31 is observed at TSR = 2.6 and   α = 0° for both isolated turbines. In contrast, for the dual-rotor turbines, the maximum power coefficient value of 0.49 is observed for α = 30°. Thereafter, C P decreases slightly, reaching 0.42 for α = 25° and then C P   = 0.40 for α = 20° at TSR = 2.51. Finally, when the angle of attack equals 15° and 0°, the power coefficient reaches its maximum value of 0.37 and 0.36, respectively, at TSR = 2.6.
Previous studies based on 2D URANS simulations have confirmed that interactions between several H-Darrieus turbines can generate an optimization of the global performance compared with an isolated turbine. These improvements depend in particular on optimal management of the angle of attack and the number and spacing of turbines [19]. On the other hand, these results show that dual-rotor turbines achieve higher efficiency even when operating at a fixed angle of attack of 0°. This visual illustration of the results highlights a physically consistent relationship between rotor number and turbine performance, which is associated with the ability to extract maximum power [51]. Furthermore, the global efficiency of the two turbines incorporating dual rotors was improved by 17%, compared with the two isolated turbines for α = 0°. In addition, a suitable arrangement of the airfoils and an optimum overlap of the angle of attack between the dual rotors are capable of improving the energy efficiency and enhancing the performance of the H-Darrieus turbine.
We conclude that the choice of a dual-rotor configuration including an external rotor incorporating a single high-performance Eppler 420 blade enables it to act as a curtain, creating a less dense wake and thus limiting its negative impact on the flow around the internal rotor. This configuration helps reduce parasitic effects, particularly performance losses and turbulence between the rotors, while modifying the flow between them, optimizing and improving the overall performance coefficient of the turbine.
Although the rotors rotate independently from a single generator, technical solutions such as a flywheel, clutch system, or converter allow the movements of the dual rotors to be combined, ensuring continuous generator operation. This optimized coupling promotes more stable electricity production.

4.2.3. Effect of Distance Between Two Adjacent Turbines on Wind Turbine Performance

Figure 7 illustrates the evolution of lift ( C l ) and drag ( C d ) coefficients as a function of different distances between two adjacent turbines integrating dual rotors, at an optimum TSR equal to 2.51 and for an angle of attack α = 42°. This figure indicates that a low distance between turbines can result in a reduction in lift. In contrast, C l values increase with distance, reaching maximum values of 1.34 when the distance (Φ) is 4D. Then, when the distance (Φ) is 4.8D, we observe an increase in drag coefficient ( C d ) of 0.64, while lift decreases by 0.94. This observation may highlight the fact that this distance is less efficient, as it generates more drag, which adversely affects the performance and stability of the two airfoils. Furthermore, the lift coefficient ( C l ) generates a higher aerodynamic efficiency than the drag capacity ( C d ), and therefore, an optimal distance of 4D might be more suitable when the two turbines are applied in the wind direction, while ensuring optimal lift for each airfoil and avoiding vortices, to maintain robust energy efficiency within a wind farm. On the other hand, an insufficient distance between two turbines allows the airflow to be directed towards the second turbine, disturbing the wake produced by the first, which can have a negative influence on the turbine’s efficiency and lift. However, to minimize performance losses, it is preferable to maintain an optimal distance between turbines so that the wind has time to regenerate between them, contributing to greater efficiency. Furthermore, too great or too small a distance can adversely affect the energy density of wind turbines. It is therefore necessary to find a balance between aerodynamic performance and optimal position management.
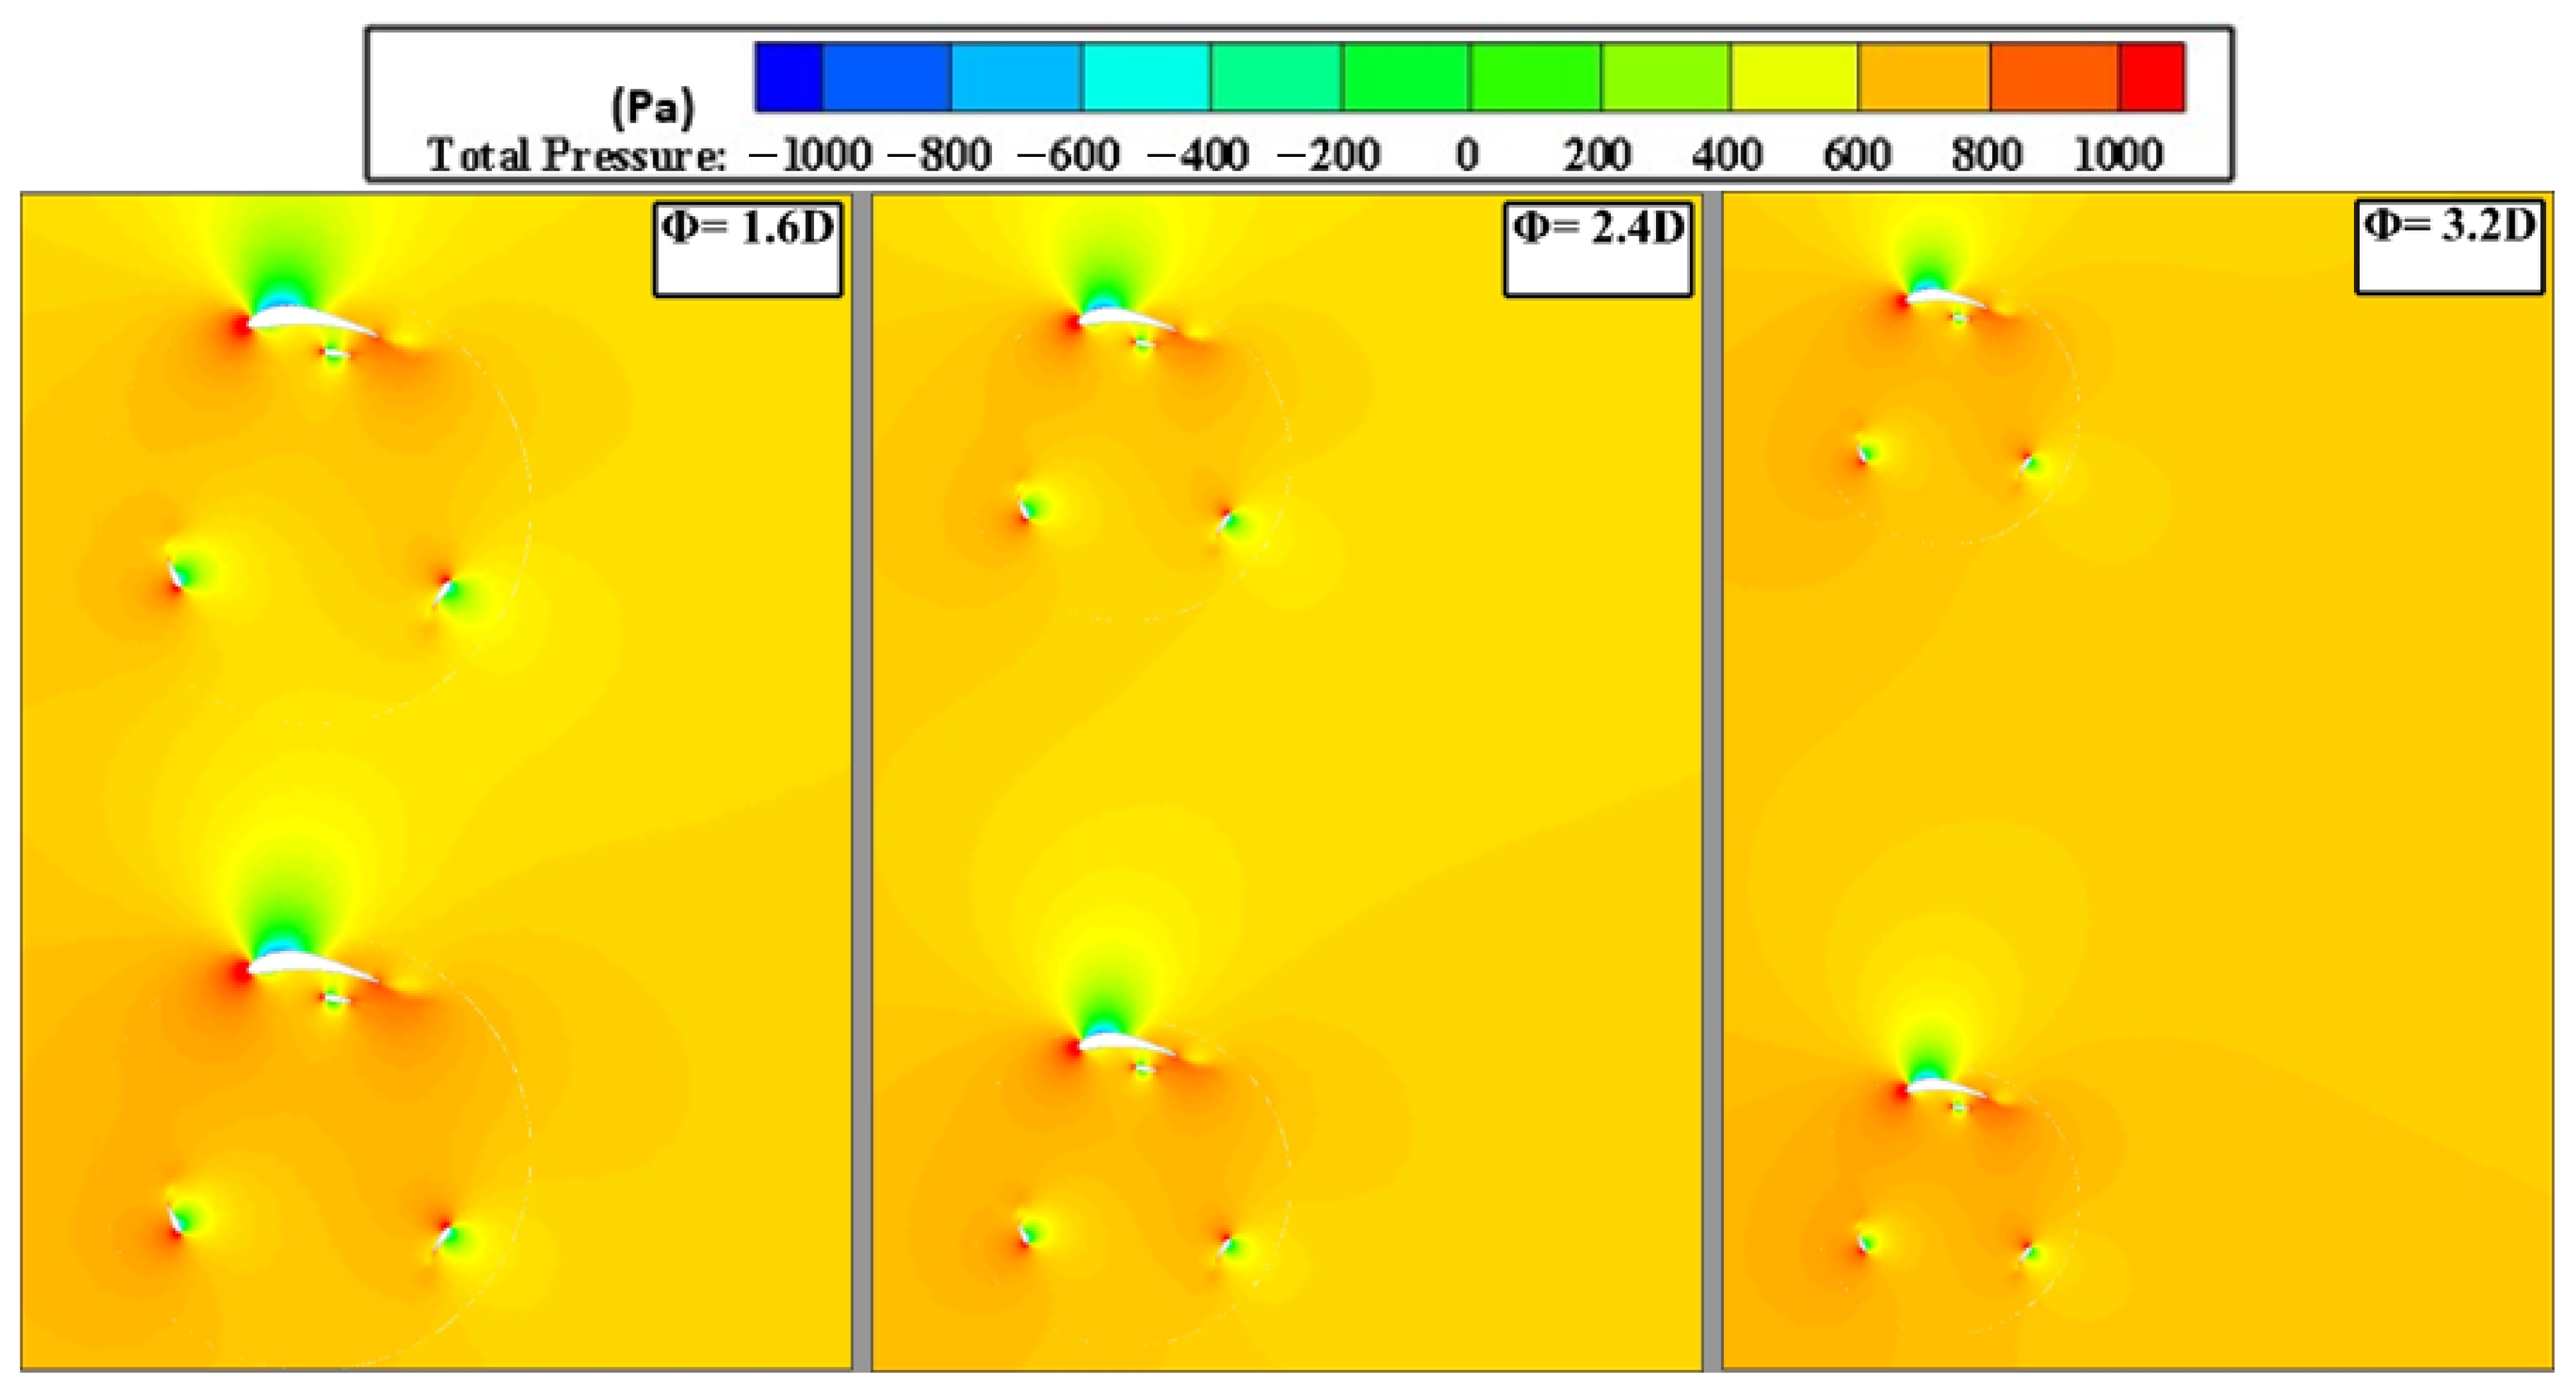
Figure 8 compares the total pressure distribution for different adjacent distances between the two H-Darrieus turbines, which include two separate rotors: the first with profile NACA 0021 having a chord length of 0.0858 m, and the second rotor with profile Eppler 420 having a chord length of 0.30 m, at TSR = 2.51 and θ = 0°. The values of these distances, according to Figure 7, are 1.6 D, 2.4 D, and 3.2 D, representing low, medium, and high efficiency, respectively. This distance selection enables us to observe the distances’ effect on adjacent turbines. CFD simulation results emphasize the presence of a system with two adjacent turbines in the same direction as the wind. For a mean-to-optimum-value distance of 3.2D, this system generates a high and favorable total pressure distribution in the wake zone. On the other hand, in the case of a dual-rotor system with a reduced distance of 1.6 D, the pressure generated by the airflow decreases slightly. This provokes flow field blockage, resulting in the formation of larger vortices in the wake zone and adversely affecting turbine performance. In conclusion, the dual-rotor configuration improves the aerodynamic performance of the turbines thanks to an arrangement based on optimum spacing between the turbines. Nevertheless, turbines located in the center of the configuration (Φ = 1.6D) suffer a reduction in efficiency due to the formation of a low-pressure zone above the blades that reduces their ability to produce more energy. In addition, the contours reveal that high pressure upstream of the airfoils generates vortices on the upper surface, helping to generate power and minimize energy losses. However, the second rotor of the Eppler 420 profile has a positive effect, improving overall performance and enhancing the lift (Figure 7) of the first rotor. Consequently, pressure field analysis is essential to assess the impact of the distance between the two turbines and optimize the efficiency of the first rotor, in particular by integrating a second rotor. Evaluating the aerodynamic performance of the H-Darrieus wind turbine is crucially dependent on the choice of a configuration with an optimum distance adapted to the velocity gradient distributions around the dual-rotor turbine.

4.2.4. Effect of the Rotor Chord Length on Turbine Performance

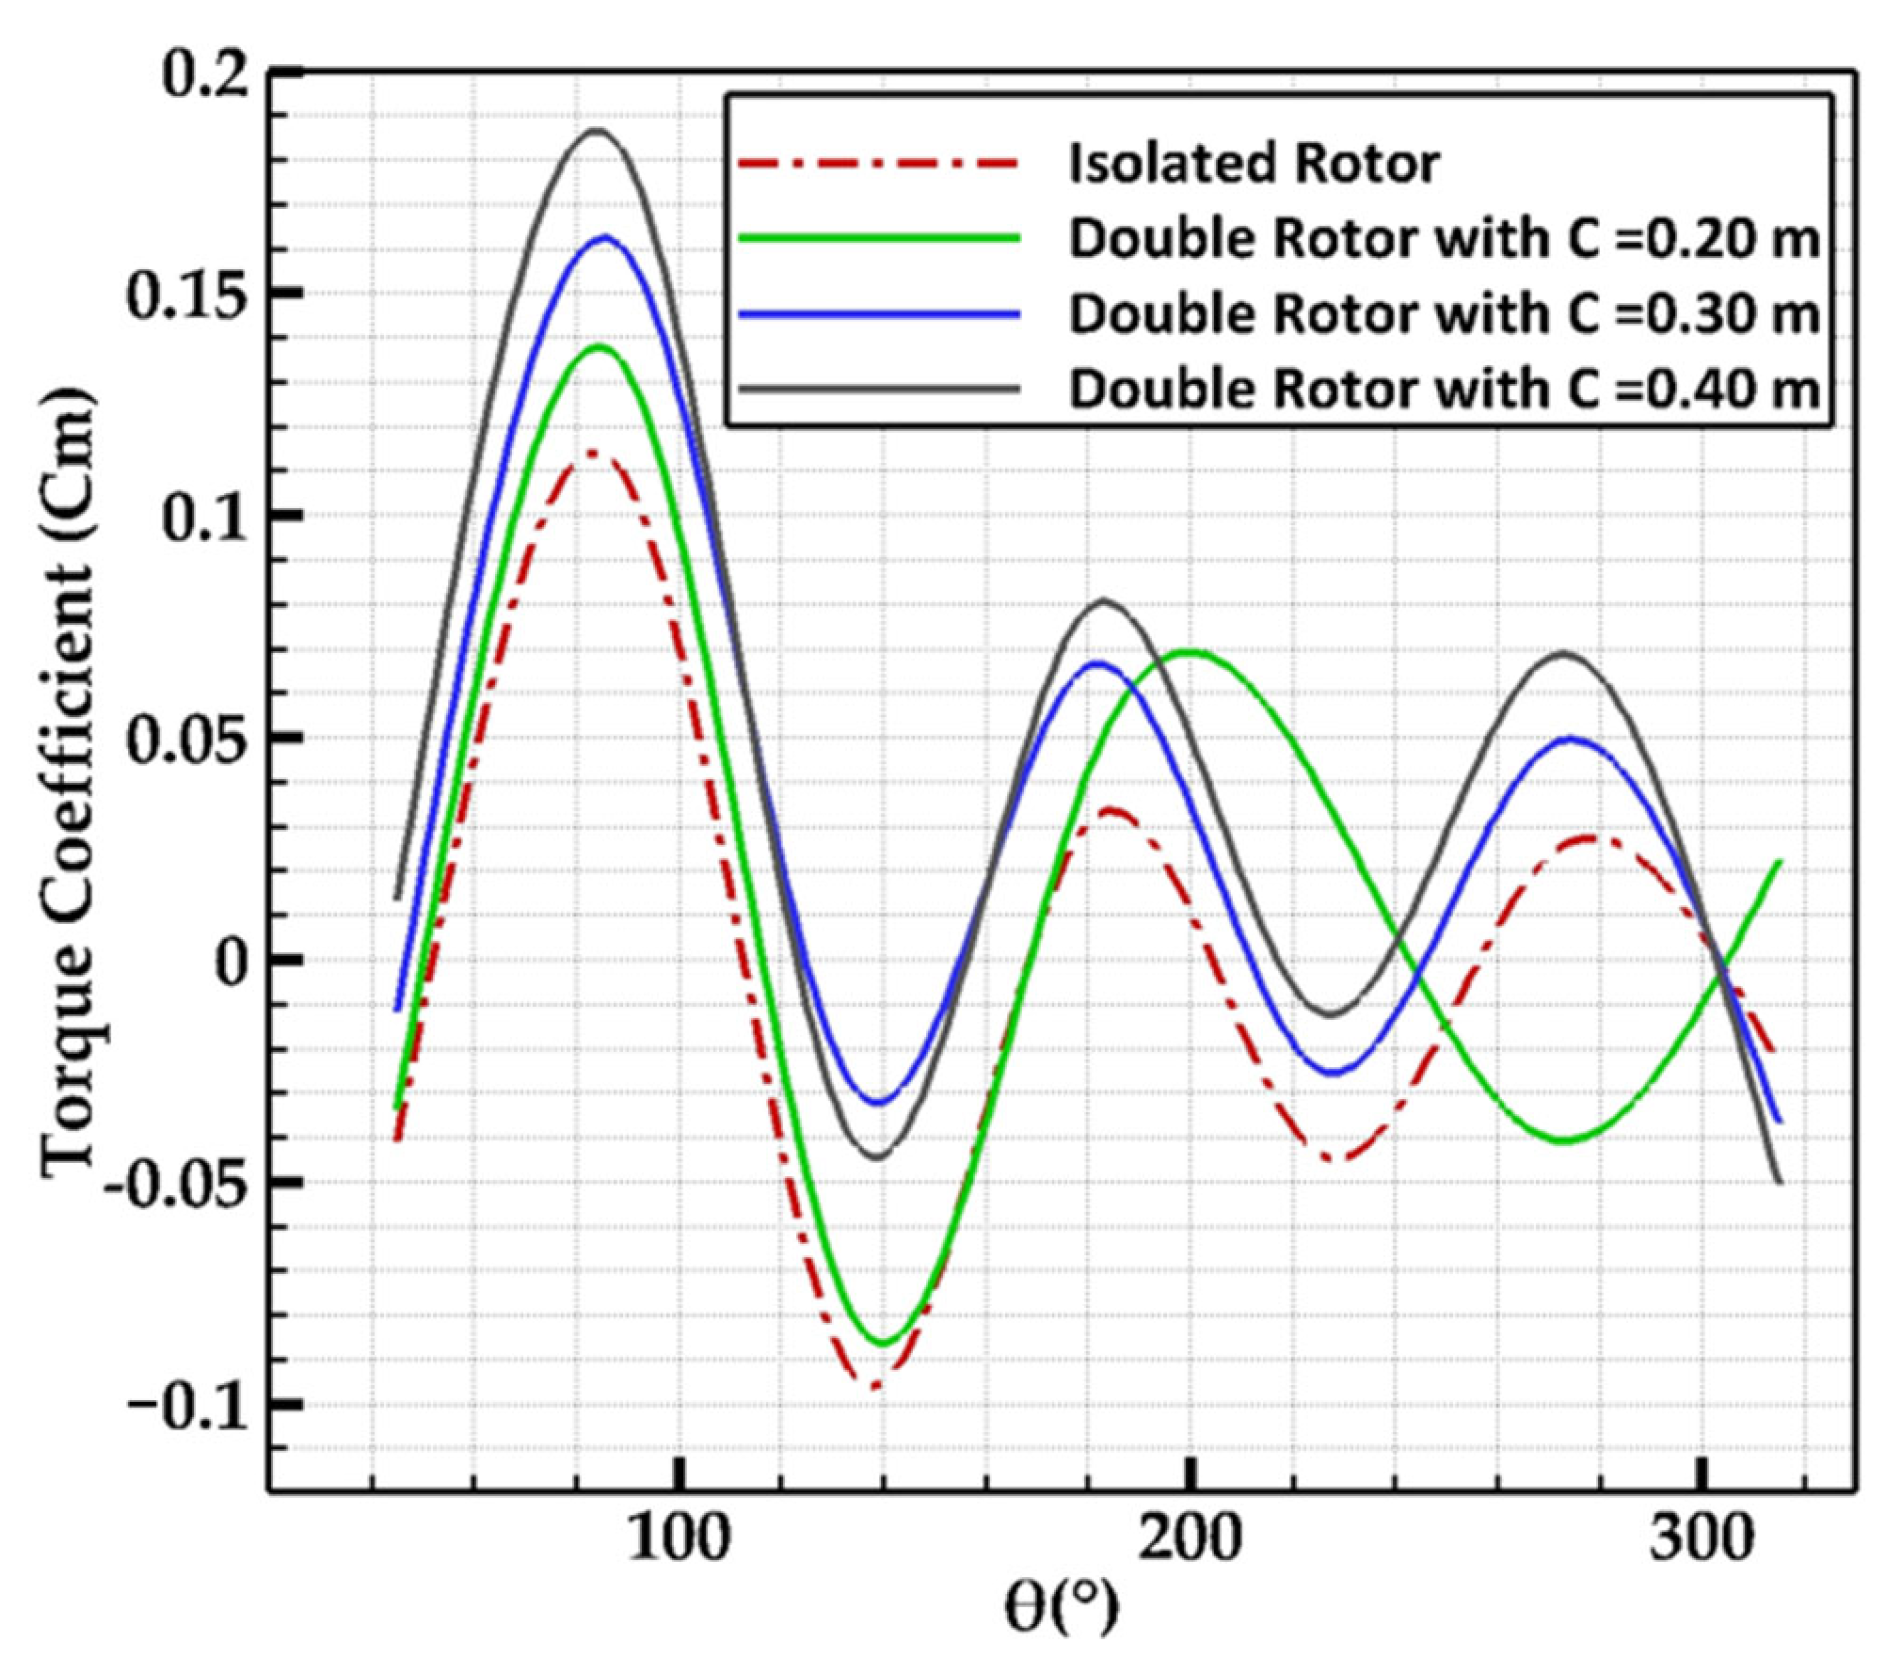
Figure 9 illustrates the variation in the moment coefficient as a function of azimuth angle for two configurations: an isolated single-rotor turbine with three NACA 0021 airfoils, and a dual-rotor turbine, the first integrating the three NACA 0021 airfoils with a fixed chord length equal to 0.0858 m and the second containing a single Eppler 420 airfoil with different chord length values of 0.20, 0.30, and 0.40 m at TSR = 2.51. The aim is to find the ideal H-Darrieus configuration offering stable performance. The results in this figure show that for the isolated turbine with a single rotor, the moment coefficient reaches maximum values of 0.11, 0.03, and 0.02 at azimuth angles of 90°, 180°, and 270°, respectively, while minimum values are found at θ of 45°, 135°, 225°, and 315°. Furthermore, for a dual-rotor configuration with C = 0.20 m, the maximum moment coefficient is observed at 0.13 and 0.04 for θ equal to 90° and 180°, before decreasing at angles of 45°, 135°, 225°, and 270°. Furthermore, for the C = 0.30 m dual-rotor turbine, the moment coefficient peaks at values of 0.16, 0.06, and 0.05 at azimuth angles equal to 90°, 180°, and 270°, respectively. The coefficient then decreases progressively at angles of 45°, 135°, 225°, and 315°. On the other hand, the dual-rotor configuration at C = 0.40 m has the highest C m values of 0.18, 0.08, and 0.07 for azimuth angles equal to 90°, 180°, and 270°, respectively. We additionally observe that C m takes on negative values for azimuth angles equal to 45°, 135°, 225°, and 315° due to flow separation and vortex formation. We can consider that the moment coefficient increases with increasing chord length in the case of the second rotor. This indicates that the dual-rotor turbine, with a higher chord length value, is capable of generating greater efficiency and demonstrating maximum performance compared to a single H-Darrieus turbine. Furthermore, it can be summarized that the dual-rotor configuration tends to offer better stability and more precise control, even if it requires more complex management compared to a single rotor, which can present limited power and torque as well as certain disadvantages depending on the application.
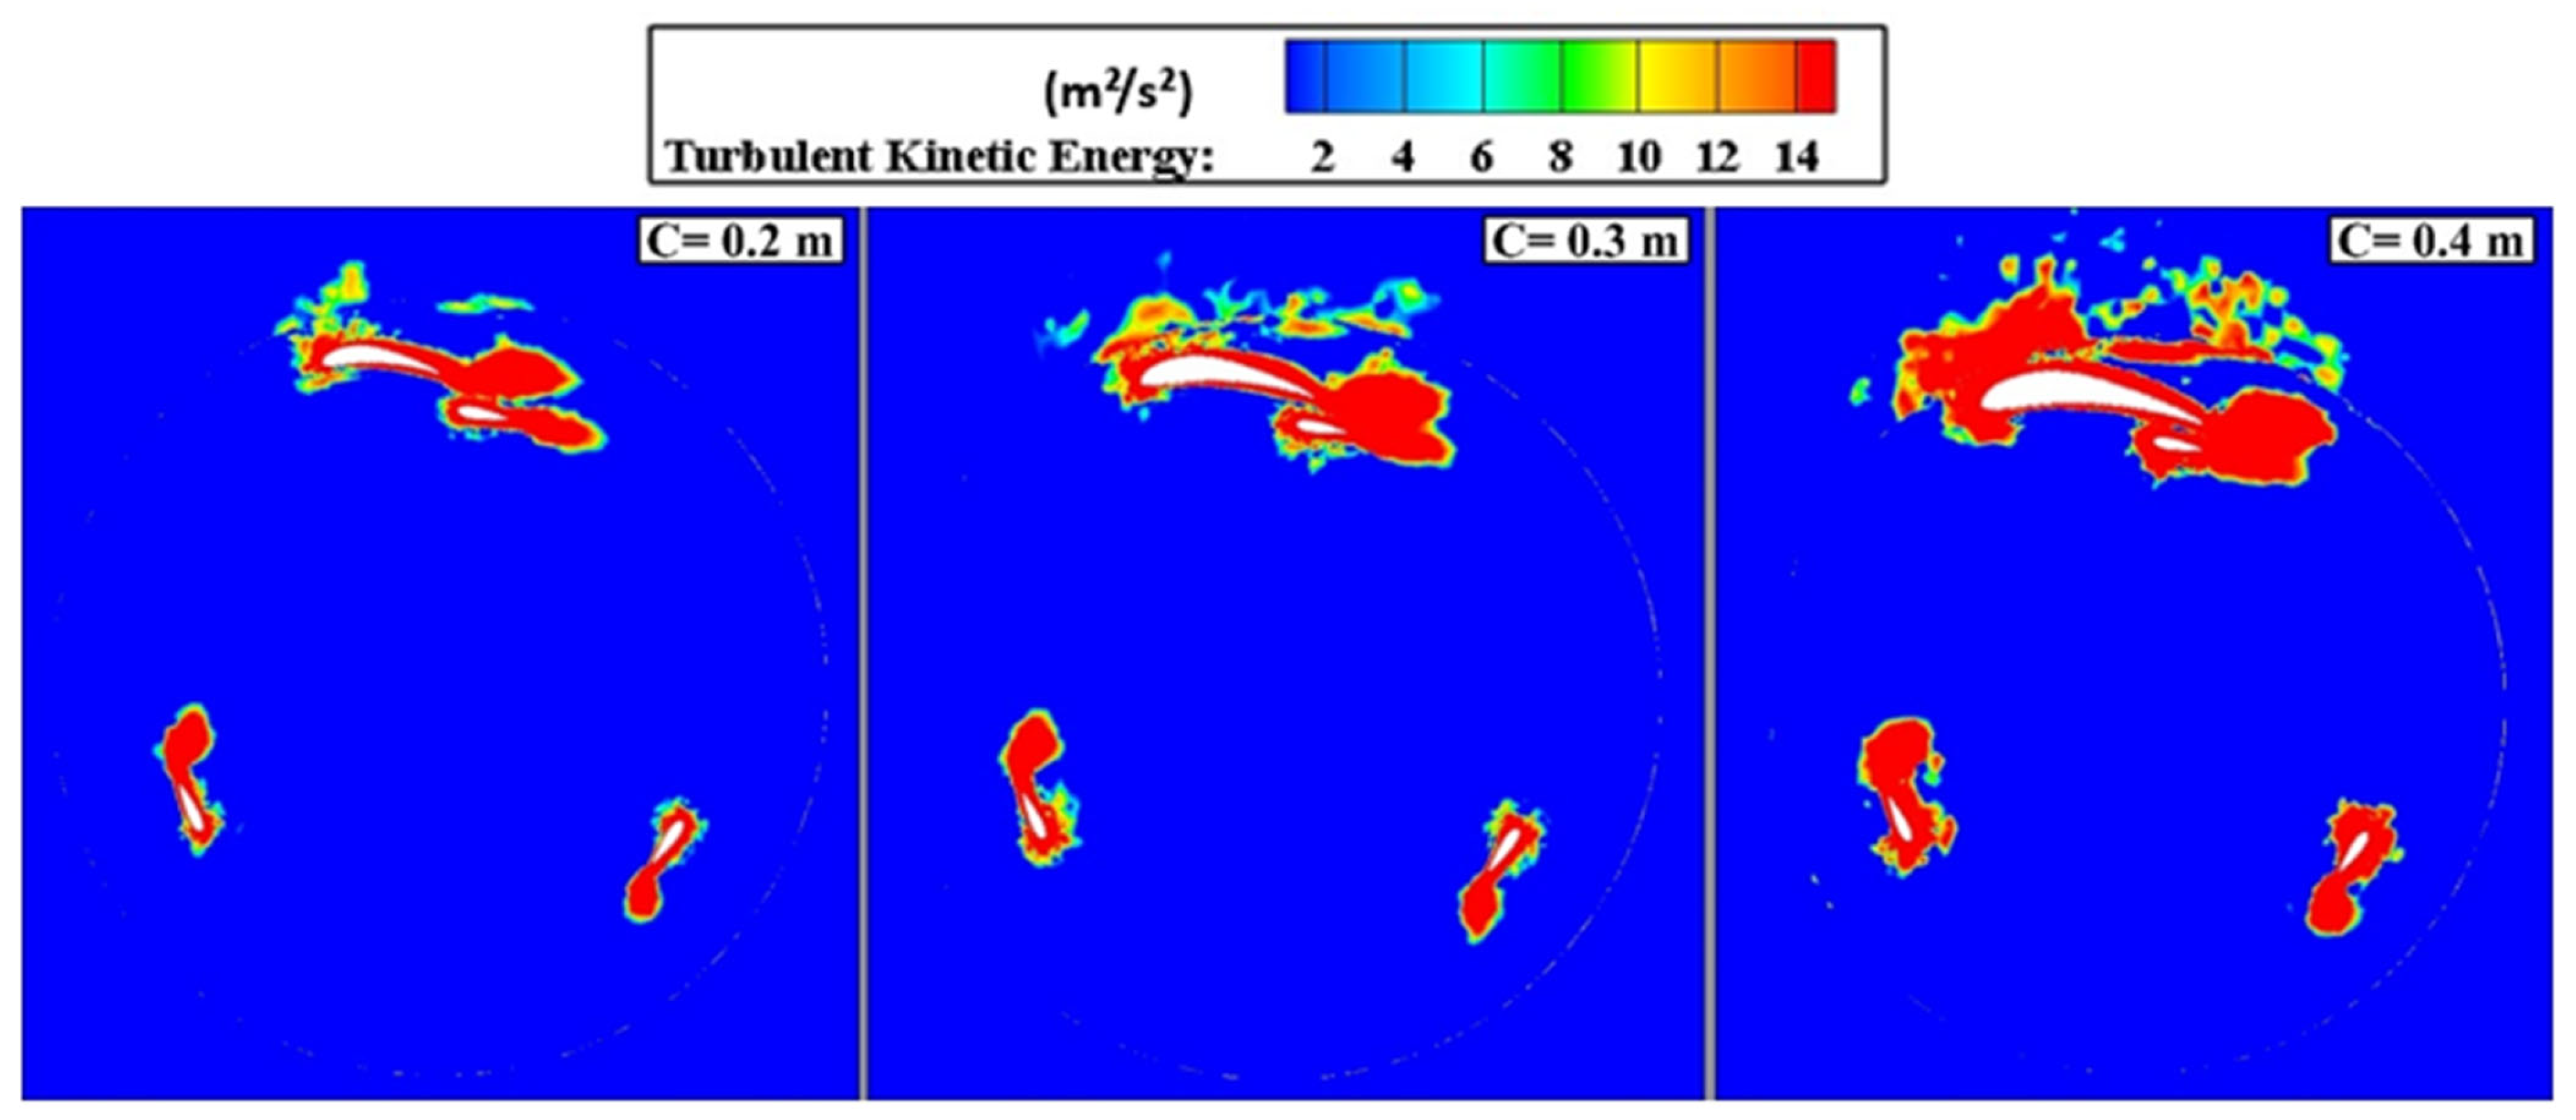
The distribution of turbulent kinetic energy contours around a dual-rotor turbine is illustrated in Figure 10 to study the effect of different chord lengths of 0.2 m, 0.3 m, and 0.4 m of the second rotor (Eppler 420) on the first rotor, and more precisely on the aerodynamic performance of the H-Darrieus turbine at TSR = 2.51 for α = 15°. Analysis of these contours shows a vortex flow structure around the blades that increases with increasing chord length. The observation also indicates a high turbulent intensity enveloping the Eppler 420 blade for C = 0.4 m, which affects the performance of all three NACA 0021 blades, and this configuration valorizes a maximization of the kinetic energy transferred to the last ones [14]. For C = 0.3 m, a moderate intensity was visualized, signifying a high availability of the flow energy quantity by improving the aerodynamic performance of the H-Darrieus turbine. In conclusion, the turbulent kinetic energy contours serve to show the optimum configuration based on the chord length values most useful for the conceptualization of dual-rotor wind turbines, that is, where the flow carries the most turbulent energy. In summary, choosing a minimum chord value for an Eppler profile can generate a low improvement compared to a configuration with an optimum chord length of C = 0.3 m to C = 0.4 m, while still enhancing the torque and power applied to the blades (Figure 9). In addition, it is essential to note that once the chord length surpasses these optimum values, the flow around the blades becomes excessively dense, which can cause mechanical stresses to develop on the first rotor, increasing turbine instabilities, leading to configuration disruptions and inducing efficiency losses.

4.2.5. Velocity Contour Analysis

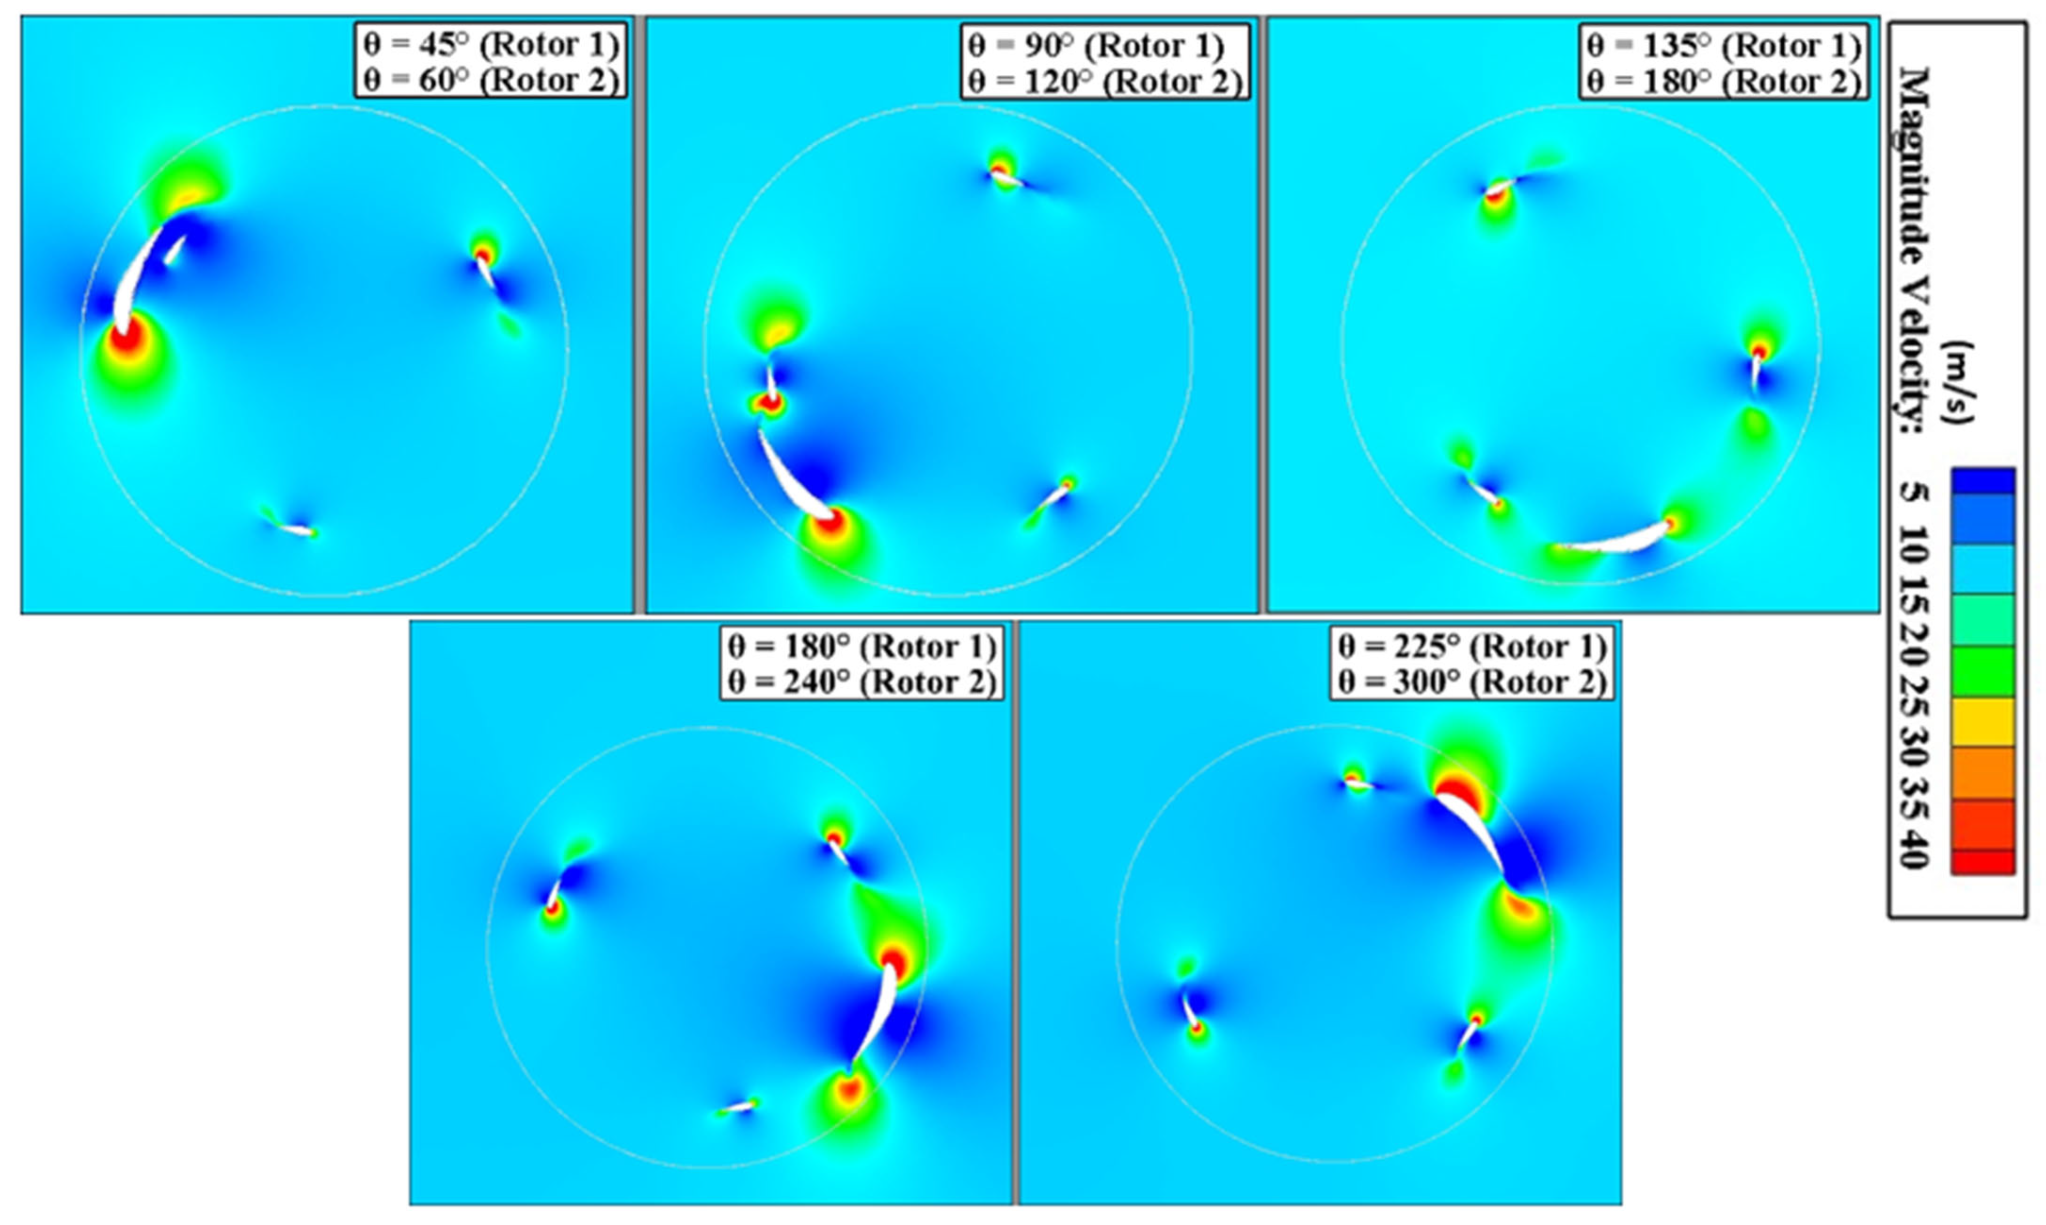
The variance in velocity magnitude is illustrated in the contours of Figure 11 for several azimuth angles θ , namely 45°, 90°, 135°, 180°, and 225° for the first rotor and 60°, 120°, 180°, 240°, and 300° for the second rotor at the optimum TSR of 2.51 and α = 0°. The velocity field is divided into two regions: one where the wind is in front (upstream) of the turbine and the other where the wind is behind (downstream) the blades. The results show that the velocity increases upstream and downstream of the airfoils, while it decreases in the area of the upper and lower surfaces, particularly for θ   equal to 45°, 60°, 90°, 120°, 180°, 240°, 225°, and 300°. However, the rotation of the second Eppler 420 profile as it enters the downstream zone generates an accumulation of vortices, resulting in a reduction in power output. Furthermore, for angles θ equal to 135° and 180°, the velocity decreases slightly at the leading and trailing edges of the Eppler 420 profile, while increasing at the edges of the three NACA 0021 profiles. This shows that the second rotor makes a positive contribution to flow stability around the first rotor when the two blades of each rotor are very close to each other. In this case, the vortices generated around the Eppler 420 profile can interact with the other profiles, maximizing turbine torque and power. This interaction produces an acceleration of the flow, promoting a prompt start-up and enhancing the turbine’s durability. In this respect, the velocity field can evolve towards an optimal limit thanks to the interaction between several rotors. These interactions can generate regions of overpressure or underpressure, thus modifying the stagnation zone and improving the energy output of the H-Darrieus turbine.

5. Conclusions

The aim of this article is to improve the aerodynamic performance of two adjacent H-Darrieus turbines by adding another rotor to the turbines. Our innovative configuration consists of two turbines separated by a distance and includes dual rotors with Eppler 420 and NACA 0021 airfoils. A 2D CFD simulation is performed using calculations based on the solution of the unsteady Reynolds-averaged Navier–Stokes equations (URANS), adopting the sliding mesh method and the k ω SST turbulence model. Validation of this simulation model was carried out for the isolated H-Darrieus turbine, based on the evolution of the power coefficient ( C P ) as a function of TSR. This validation analysis showed a good correlation between our results and those obtained by Castelli et al. [24].
The results of our study have shown that a dual-rotor turbine incorporating high-performance airfoils outperforms the two isolated single-rotor turbines. This is obtained through higher power output and better energy capture. The main CFD results obtained are presented below:
  • A 12% increase in the coefficient of performance C P at TSR = 2.6 was observed when a second Eppler 420 airfoil rotor was added to the first three-bladed NACA 0021 airfoil rotor.
  • The efficiency of the two turbines incorporating dual rotors was improved by 17% compared with the two isolated turbines for α = 0°. In addition, the choice of an optimum angle of attack for the dual-rotor airfoils improves energy efficiency and maximizes the performance of the two H-Darrieus turbines by attenuating wake disturbance.
  • Using an optimum distance (Φ) of 4D between two adjacent turbines ensures efficient lift for each turbine, maintains robust energy efficiency, and demonstrates maximum performance within a wind farm.
  • Increasing the chord length of the second rotor Eppler 420 blade by C = 0.4 m results in a higher moment coefficient, which translates into higher efficiency generation for H-Darrieus turbines.
  • Analysis of the flow field reveals stable flow around the dual rotors of the H-Darrieus turbine as a function of the optimum parameter of the two airfoils. In addition, the second rotor contributes positively to improving the flow around the first rotor, thereby enhancing turbine efficiency and reducing wake size, enabling higher flow quality to be achieved. This configuration could be considered for future applications. On the other hand, choosing the optimum distance between two turbines incorporating dual rotors enhances their aerodynamic performance.
This study highlights the potential of dual-rotor H-Darrieus wind turbines equipped with high-performance airfoils to improve performance and increase the lift of the two adjacent turbines, offering high prospects for energy production, flow stabilization, and reduced head losses.
Future work will include the integration of artificial intelligence into the H-Darrieus turbine to improve efficiency and reliability, considering the installation of vertical-axis turbines (VAWTs) in hydrodynamic environments, and the study of the influence of a new 3D design on the self-starting capacity, with the aim of enhancing the system’s sustainability and improving the performance of VAWTs.

Author Contributions

D.B.: Conceptualization, Methodology, Validation, Investigation, Resources, Writing—Original Draft, Software, Visualization, Formal Analysis, and Writing—Review and Editing. S.e.-D.F.: Methodology, Software, Validation, Investigation, Resources, Writing, Funding Acquisition, Supervision, and Visualization. M.B.: Methodology, Validation, Investigation, Resources, Writing, Supervision, and Visualization. A.S.: Methodology, Validation, Investigation, Resources, and Visualization. A.A.: Investigation, Validation, and Visualization. All authors have read and agreed to the published version of the manuscript.

Funding

This research received no external funding.

Data Availability Statement

In this study, no new data were produced. The analysis was carried out using existing publicly accessible data and previously published literature. Researchers seeking to obtain the data utilized in this study can consult the sources and references cited in the manuscript.

Acknowledgments

The corresponding author, Boulla Douha, wishes to take this opportunity to extend heartfelt thanks to the editor and reviewers for their invaluable feedback, which has significantly enhanced the quality of this scientific contribution.

Conflicts of Interest

The authors declare no conflicts of interest.

Abbreviations

2DTwo-Dimensional
CFDComputational Fluid Dynamics
NACANational Advisory Committee for Aeronautics
SSTShear Stress Transport
TSRTip Speed Ratio
TSSTTurbulent Scale Simulation Transport Model
VAWTVertical-Axis Wind Turbine
SMSliding Mesh
RANSSteady Reynolds-Averaged Navier–Stokes
HAWTHorizontal-Axis Wind Turbine
µDynamic Viscosity (kg/(m.s.))
ω Darrieus Angular Velocity (rad/s)
ρ Fluid Density (kg/m3)
α Angle of Attack (degrees)
k ω SST Shear Stress Transport Turbulence Model
k ε Turbulence Model
AArea Swept by Darrieus (m2)
RDarrieus Radius (m)
ReReynolds Number
C d Drag Coefficient
C l Lift Coefficient
C m Torque Coefficient
C P Power Coefficient
gAcceleration Due to Gravity Vector (m/s2)
PPressure (Pa)
U Free Stream Velocity (m/s)
y+Dimensionless Wall Distance
θ Azimuth Angle (degrees)
ΦDistance between Adjacent Turbines (m)
Δ tTime Step (s)

References

  1. Tasneem, Z.; Al Noman, A.; Das, S.K.; Saha, D.K.; Islam, M.R.; Ali, M.F.; R Badal, M.F.; Ahamed, M.H.; Moyeen, S.I.; Alam, F. An analytical review on the evaluation of wind resource and wind turbine for urban application: Prospect and challenges. Dev. Built Environ. 2020, 4, 100033. [Google Scholar] [CrossRef]
  2. Hau, E. Wind Turbines: Fundamentals, Technologies, Application, Economics; Springer: Berlin/Heidelberg, Germany, 2006. [Google Scholar]
  3. Wallaaldin, A.E.; Jarupula, S. Performance enhancement of Darrieus wind turbines using Plain Flap and Gurney Flap configurations: A CFD analysis. Results Eng. 2024, 24, 103400. [Google Scholar] [CrossRef]
  4. Mohamed, M.H. Performance investigation of H-rotor Darrieus turbine with new airfoil shapes. Energy 2012, 47, 522–530. [Google Scholar] [CrossRef]
  5. Carlos, S.F.; Gijs, V.K.; Gerard, V.B.; Fulvio, S. Visualization by PIV of dynamic stall on a vertical axis wind turbine. Exp. Fluids 2009, 46, 97–108. [Google Scholar]
  6. Raciti, C.M.; Pavesi, G.; Battisti, L.; Benini, E.; Ardizzon, G. Modeling strategy and numerical validation for a Darrieus vertical axis micro-wind turbine. In Proceedings of the ASME 2010 International Mechanical Engineering Congress and Exposition, Vancouver, BC, Canada, 12–18 November 2010; p. IMECE2010-39548. [Google Scholar]
  7. Mohamed, M.H.; Dessoky, A.; Faris, A. Blade shape effect on the behavior of the H-rotor Darrieus wind turbine: Performance investigation and force analysis. Energy 2019, 179, 1217–1234. [Google Scholar] [CrossRef]
  8. Mohamed, O.S.; Ibrahim, A.; Etman, A.K.; Abdelfatah, A.A.; Elbaz, A.M.R. Numerical investigation of Darrieus wind turbine with slotted airfoil blades. Energy Convers. Manag. X 2020, 5, 100026. [Google Scholar] [CrossRef]
  9. Ma, N.; Lei, H.; Han, Z.; Zhou, D.; Bao, Y.; Zhang, K. Airfoil optimization to improve power performance of a high-solidity vertical axis wind turbine at a moderate tip speed ratio. Energy 2018, 150, 236–252. [Google Scholar] [CrossRef]
  10. Sobhani, E.; Ghaffari, M.; Maghrebi, M.J. Numerical investigation of dimple effects on Darrieus vertical axis wind turbine. Energy 2017, 133, 231–241. [Google Scholar] [CrossRef]
  11. Shen, Z.; Gong, S.; Zu, H.; Guo, W. Multi-objective optimization study on the performance of double Darrieus hybrid vertical axis wind turbine based on DOE-RSM and MOPSO-MODM. Energy 2024, 299, 131406. [Google Scholar] [CrossRef]
  12. Cheng, B.; Du, J.; Yao, Y. Power prediction formula for blade design and optimization of Dual Darrieus Wind Turbines based on Taguchi Method and Genetic Expression Programming model. Renew. Energy 2022, 192, 583–605. [Google Scholar] [CrossRef]
  13. Farzad, G.; Seyed, R.M.; Mohammad, E.; Mehdi, M. A systematic investigation on the hybrid Darrieus-Savonius vertical axis wind turbine aerodynamic performance and self-starting capability improvement by installing a curtain. Next Energy 2025, 6, 100203. [Google Scholar]
  14. Mahmoud, H.; Abdel, R.; Mohamed, E.; Shinichi, O.; Hamdy, H. Optimization of the power performance for three hybrid Darrieus-Savonius rotors based on the Taguchi method. Conf. Ser. 2024, 2857, 012011. [Google Scholar]
  15. Mohan Kumar, P.; Surya, M.R.; Sivalingam, K.; Lim, T.-C.; Ramakrishna, S.; Wei, H. Computational Optimization of Adaptive Hybrid Darrieus Turbine: Part 1. Fluids 2019, 4, 90. [Google Scholar] [CrossRef]
  16. Mirzaeian, H.; Ghobadian, B.; Mirhosseini, M. Performance Analysis and Optimization of Dual-Row Vertical Axis Wind Turbines with Innovative Hybrid Blades. Energy Sci. Eng. 2025, 13, 3171–3184. [Google Scholar] [CrossRef]
  17. Amgad, D.; Pradip, Z.; Thorsten, L.; Ewald, K. Numerical Investigations of Two Darrieus Turbine Rotors Placed One Behind the Other with Respect to Wind Direction. In Proceedings of the Thirteenth International Conference of Fluid Dynamics, Cairo, Egypt, 21–22 December 2018. [Google Scholar]
  18. Omar, S.M.; Pier, F.M.; Francesco, P.; Francesco, B.; Alessandro, B. Is the Actuator line method able to reproduce the interaction between closely-spaced Darrieus rotors a critical assessment on wind and hydrokinetic turbines. Energy Convers. Manag. 2023, 293, 117473. [Google Scholar] [CrossRef]
  19. Tian, W.; Ni, X.; Li, B.; Yang, G.; Mao, Z. Improving the efficiency of Darrieus turbines through a gear-like turbine layout. Energy 2023, 267, 126580. [Google Scholar] [CrossRef]
  20. Mohammed, S.; Shaaban, A. Efficient clusters and patterned farms for Darrieus wind turbine. Sustain. Energy Technol. Assess. 2017, 19, 125–135. [Google Scholar]
  21. Jin, G.; Zong, Z.; Jiang, Y.; Zou, L. Aerodynamic analysis of side-by-side placed twin vertical-axis wind turbines. Ocean Eng. 2020, 209, 107296. [Google Scholar] [CrossRef]
  22. Esmaeel, F.; Rakesh, M.; Frankie, F.J.; Hossein, F. Optimization and analysis of self-starting capabilities of vertical axis wind turbine pairs: A CFD-Taguchi approach. Ocean Eng. 2024, 302, 117614. [Google Scholar]
  23. Fertahi, S.e.-D.; Belhadad, T.; Kanna, A.; Samaouali, A.; Kadiri, I. Assessment of fairing geometry effects on H-Darrieus hydroturbine performance using 2D URANS CFD simulations. Energy Convers. Manag. 2023, 293, 117434. [Google Scholar] [CrossRef]
  24. Castelli, M.R.; Englaro, A.; Benini, E. The Darrieus wind turbine: Proposal for a new performance 8prediction model based on CFD. Energy 2011, 36, 4919–4934. [Google Scholar] [CrossRef]
  25. Islam, H.; Mohamed, M. Aerodynamic performance enhancements of H-rotor darrieus wind turbine. Energy 2018, 142, 531–545. [Google Scholar] [CrossRef]
  26. Chandra, S.; Tyagi, R. Study of Eppler 423 Airfoil with Gurney Flap and Vortex Generators. Adv. Aerosp. Sci. Technol. 2020, 5, 51001. [Google Scholar] [CrossRef]
  27. Didane, D.H.; Rosly, N.; Zulkafli, M.F.; Shamsudin, S.S. Numerical investigation of a novel contra-rotating vertical axis wind turbine. Sustain. Energy Technol. Assess. 2019, 31, 43–53. [Google Scholar] [CrossRef]
  28. Fluent, A. Ansys Fluent Theory Guide; ANSYS Inc.: Canonsburg, PA, USA, 2020; pp. 0001–1026. [Google Scholar]
  29. Mahdi, Z.; Mohammad, J.M.; Seyed, R.V. Starting torque improvement using J-shaped straight-bladed Darrieus vertical axis wind turbine by means of numerical simulation. Renew. Energy 2016, 95, 109–126. [Google Scholar]
  30. Wilberforce, T.; Alaswad, A. Performance analysis of a vertical axis wind tur bine using computational fluid dynamics. Energy 2023, 263, 125892. [Google Scholar] [CrossRef]
  31. Asr, M.T.; Nezhad, E.Z.; Mustapha, F.; Wiriadidjaja, S. Study on start-up characteristics of H-Darrieus vertical axis wind turbines comprising NACA 4-digit series blade airfoils. Energy 2016, 112, 528–537. [Google Scholar] [CrossRef]
  32. Balduzzi, F.; Bianchini, A.; Ferrara, G.; Ferrari, L. Dimensionless numbers for the assessment of mesh and timestep requirements in CFD simulations of Darrieus wind turbines. Energy 2016, 97, 246–261. [Google Scholar] [CrossRef]
  33. Marsh, P.; Ranmuthugala, D.; Penesis, I.; Thomas, G. The influence of turbulence model and two and three-dimensional domain selection on the simulated performance characteristics of vertical axis tidal turbines. Renew. Energy 2017, 105, 106–116. [Google Scholar] [CrossRef]
  34. Tescione, G.; Ragni, D.; He, C.; Simão, F.C.J.; Van Bussel, G.J.W. Near wake flow analysis of a vertical axis wind turbine by stereoscopic particle image velocimetry. Renew. Energy 2014, 70, 47–61. [Google Scholar] [CrossRef]
  35. Boulla, D.; Fertahi, S.e.-D.; Bernatchou, M.; Samaouali, A. CFD Numerical Simulation Study of Aerodynamic Performance of H Darrieus Rotor. CFD Lett. 2025, 17, 117. [Google Scholar] [CrossRef]
  36. Menter, F.R. Two-equation eddy-viscosity turbulence models for engineering applications. AIAA J. 1994, 32, 1598–1605. [Google Scholar] [CrossRef]
  37. Marini, M.; Aristide, M.; Antonio, S. Performance of vertical axis wind turbines with different shapes. J. Wind Eng. Ind. Aerodyn. 1992, 39, 83–93. [Google Scholar] [CrossRef]
  38. Boulla, D.; Fertahi, S.e.-D.; Bernatchou, M.; Samaouali, A.; Ajani, M.; Boussaq, C. Enhancement of aerodynamic performance of H-Darrieus rotor using wraparound fairing system: A 2D CFD study. Int. J. Renew. Energy Dev. 2025, 14, 1058–1071. [Google Scholar] [CrossRef]
  39. Versteeg, H.K.; Malalasekera, W. An Introduction to Computational Fluid Dynamics: The Finite Volume Method; Pearson Education: London, UK, 2007. [Google Scholar]
  40. Hoseinzadeh, S.; Amin, B.; Seyed, M.M.; Ali, S.; Stephan, H. A detailed experimental airfoil performance investigation using an equipped wind tunnel. Flow Meas. Instrum. 2020, 72, 101717. [Google Scholar] [CrossRef]
  41. Vennell, R. Exceeding the betz limit with tidal turbines. Renew. Energy 2013, 55, 277–285. [Google Scholar] [CrossRef]
  42. Wang, S.; Ingham, D.B.; Ma, L.; Pourkashanian, M.; Tao, Z. Numerical Investigation on dynamic stall of low Reynolds number flow around oscillating airfoils. Comput. Fluids 2010, 39, 1529–1541. [Google Scholar] [CrossRef]
  43. Hao, W.; Ding, Q.; Li, C. Optimal performance of adaptive flap on flow separation control. Comput. Fluids 2019, 179, 437–448. [Google Scholar] [CrossRef]
  44. Willmott, C.J.; Ackleson, S.G.; Davis, R.E.; Feddema, J.J.; Klink, K.M.; Legates, D.R.; O’donnell, J.; Rowe, C.M. Statistics for the evaluation and comparison of models. Oceans 1985, 90, 8995–9005. [Google Scholar] [CrossRef]
  45. Baizhuma, Z.; Kim, T.; Son, C. Numerical method to predict ice accretion shapes and performance penalties for rotating vertical axis wind turbines under icing conditions. J. Wind Eng. Ind. Aerodyn. 2021, 216, 104708. [Google Scholar] [CrossRef]
  46. Ahmad, M.; Shahzad, A.; Akram, F.; Ahmad, F.; Shah, S.I.A. Design optimization of Double Darrieus hybrid vertical axis wind turbine. Ocean Eng. 2022, 254, 111171. [Google Scholar] [CrossRef]
  47. Paulo, A.S.F.; Silva, P.; Tsoutsanis, A.; Antoniadis, F. Simple multiple reference frame for high order solution of hovering rotors with and without ground effect. Aerosp. Sci. Technol. 2021, 111, 10651. [Google Scholar] [CrossRef]
  48. Fertahi, S.e.-D.; Samaouali, A.; Kadiri, I. CFD comparison of 2D and 3D aerodynamics in H-Darrieus prototype wake. E-Prime-Adv. Electr. Eng. Electron. Energy 2023, 4, 100178. [Google Scholar] [CrossRef]
  49. Zhang, W.; Cao, Y.; Qian, Z.; Wang, J.; Zhu, Y.; Yang, Y.; Wang, Y.; Wu, G. Research on Aerodynamic Performance of Asynchronous-Hybrid Dual-Rotor Vertical Axis Wind Turbines. Energies 2024, 17, 4424. [Google Scholar] [CrossRef]
  50. Huang, H.; Li, J.; Li, G. Improving the self-starting and operating characteristics of vertical axis wind turbine by changing center distance in part of blades. J. Build. Eng. 2023, 68, 105974. [Google Scholar] [CrossRef]
  51. Yang, Y.; Cao, Y.; Qian, Z.; Wang, J.; Zhu, Y.; Chen, X.; Zhang, W.; Wang, Y.; Wu, G.; Chen, S. A Study on the Effect of Turbulence Intensity on Dual Vertical-Axis Wind Turbine Aerodynamic Performance. Energies 2024, 17, 4124. [Google Scholar] [CrossRef]
Figure 1. Configuration model of turbines with H-Darrieus dual rotors and the characteristics of the domain.
Fluids 10 00239 g001
Figure 2. (a) Hybrid mesh using quadrilateral and triangular elements. (b) Region near the NACA. 0021 blade. (c) Region near the EPPLER 420 blade. (d) Leading edge of a NACA 0021 airfoil. (e) Trailing edge of a NACA 0021 airfoil.
Fluids 10 00239 g002
Figure 3. Variation in C P with number of mesh elements.
Fluids 10 00239 g003
Figure 4. Validation model: CFD results vs. experimental data.
Fluids 10 00239 g004
Figure 5. Comparative analysis of a dual-rotor turbine: (a) power coefficient as a function of TSR, (b) torque coefficient as a function of angle of attack.
Fluids 10 00239 g005
Figure 6. Comparative study of the power coefficient versus TSR for different angles of attack.
Fluids 10 00239 g006
Figure 7. Variation in drag and lift coefficients as a function of different distances (Φ) between adjacent turbines.
Fluids 10 00239 g007
Figure 8. Total pressure contours for different distances between adjacent turbines.
Fluids 10 00239 g008
Figure 9. Evolution of the torque coefficient as a function of azimuth angle, for an insulated rotor configuration and a dual-rotor configuration with various chord lengths of the Eppler 420 profile.
Fluids 10 00239 g009
Figure 10. Turbulent kinetic energy contours for a dual-rotor system at different chord lengths of the Eppler 420 profile.
Fluids 10 00239 g010
Figure 11. Magnitude velocity contours for dual-rotor turbine at different azimuth angles.
Fluids 10 00239 g011
Table 1. Main geometric characteristics of the H-Darrieus dual rotors.
CharacteristicsRotor 1Rotor 2
Number of blades
Blade airfoil
3
NACA 0021
1
Eppler 420
Diameter (m)1.0301.25
Chord (m)
Solidity
0.0858
0.5
0.30
0.5
Height (m)11
Disclaimer/Publisher’s Note: The statements, opinions and data contained in all publications are solely those of the individual author(s) and contributor(s) and not of MDPI and/or the editor(s). MDPI and/or the editor(s) disclaim responsibility for any injury to people or property resulting from any ideas, methods, instructions or products referred to in the content.